spectral and electrochemical studies of phenazopyridine
TRANSCRIPT

ISSN: 0973-4945; CODEN ECJHAO
E-Journal of Chemistry
http://www.e-journals.net 2009, 6(4), 1181-1187
Spectral and Electrochemical
Studies of Phenazopyridine
P. VIJAYBHASKAR and A. RAMACHANDRAIAH*
Department of Chemistry,
National Institute of Technology Warangal,
Warangal-506004, Andhra Pradesh, India.
Received 3 March 2009; Accepted 4 April 2009
Abstract: The spectral and voltammetric behavior of phenazopyridine (1) in
aqueous buffers of varied pH is presented. Spectrophotometry, cyclic
voltammetry, differential pulse polarography and coulometry were utilized to
study its proton and electron transfer characteristics. Relevant thermodynamic
and electrochemical data such as pKa, charge transfer co-efficient (αna), forward
rate constant (k0f,h), etc., have been evaluated. An excellent electroanalytical
method of assaying of 1 has been developed in differential pulse polarography at
pH = 8. Molecular modeling on various acid-base conjugates of 1 and their
several conformers has been carried out to arrive at the thermodynamic and
conformational issues to correlate the spectral and electrochemical observations.
Keywords: Phenazopyridine, Acid-base equilibria, Cyclic voltammetry, Molecular modeling,
Isosbestic points, Conformers
Introduction
Aromatic azo compounds constitute a very important class of organic compounds because of
their optical, electrochemical and medicinal relevance1-3
. Their optical properties are
exploited in dye industry and as indicators of acid-base titrations. The facile and intense
voltammetric response due to the reduction of -N=N- into -NH-NH- and -NH2, has been
providing a great deal of information about their optical, structural, electrochemical and
thermodynamic properties4-12
.
Phenazopyridine (1), which is 2,6-diamino-3-(phenylazo)pyridine, is a urinary tract
analgesic, commercially available as Pyridium
tablets. We present here the first
electrochemical investigations of this drug in aqueous buffers of varied pH besides some
spectral and molecular modeling studies.

Ab
sorb
ance
(a)
(b)
(c)
(a)
(b)
(c)
1182 A. RAMACHANDRAIAH et al.
Experimental
Several phenazopyridine tablets were crushed and leached into warm water and then the
drug was regenerated by slowly adding NaHCO3 solution. It was recrystallied from
methanol. A millimolar stock solution of 1 was prepared in methanol. Before the spectral
or electrochemical run, 1 mL of the stock solution was placed in a 25 mL standard flask
and was made up by the Britton-Robinson13
buffer of the desired pH (ionic strength = 0.02
M). The corresponding blank solution was similarly made by just making up 1 mL of
methanol. An ATI Orion Model 902 Ion Meter was used for the pH-metry whereas an
AnalyticJena Specord 205 Ratio Recording Spectrophotometer for UV-Vis spectra and a
Metrohm 663 VA Stand for voltammetric (on mostly an SMDE) and a BAS CV-27
Voltammograph for coulometric studies. Molecular modeling was carried out on a
ChemOffice Ultra Pro 10.0 platform.
Results and Discussion
Spectral studies and acid-base equilibria
The electronic spectra of 1 at three different pH are shown in Figure 1. A slight
hypsochromic shift is observed, with the presence of isosbestic points at 325, 395 and 470 nm,
as pH increases. The aqueous spectrum of 1 at high pH (>6) is near-similar to whereas that
at low pH (<5) is slightly different from the isotonic methanolic solution spectrum of 1. This
fact suggests that 1 exhibits a protonation-deprotonation equilibrium in aqueous buffers. A
plausible tautomeric (vertical arrows) and acid-base (horizontal arrows) speciation
equilibrium for 1, is shown in Scheme 1.
Figure 1. UV-Vis spactra of 1 at pH (a) 2.56, (b) 4.02 and (c) 5.93.
The electronic spectral band that shifts from 430 nm to 390 nm with increased pH, is
expected to be due to n→π* transition of the azopyridine moiety. There has been a debate
on the site of protonation in azobenzenes. Earlier proposals assume that the proton binds
symmetrically to both the nitrogen atoms14,15
. Molecular modeling was performed on
various tautomers and conformers possible for 1H2+
, 1H+ and 1. Finally, for each of 1H
2+,
1H+ and 1 a set of three most stable isomeric forms (on the basis of their least heats of
formation arrived at by energy minimization in MM2 force field) has been selected and the
same only are presented in Scheme 1. All other tautomers and conformers are discarded for
brevity. Each of this most stable sets consists of a π-delocalized benzenoid form (form a),
ortho-quinonoid form (form b) and para-quinonoid form (form c) at the azopyridine moiety
as shown in Scheme 1.
Wavelength, nm
Spectral and Electrochemical Studies of Phenazopyridine 1183
N
NH
N
NN
H
H
H
H
H
N
NH
N
NN
H
H
H
H
N
N
N
NN
H
H
H
H
HH
N
N
N
NN
H
H
H
HH
N
N
N
NN
H
H
H
H
H
N
NN
NN
H
H
H
HH
H
NN
N
H H
H
NNH
N
N
H
N
N
N
NN
H
H
H
H
NN
N
N
H H
H
A
B C
N
H
N
H H
N
HH
C
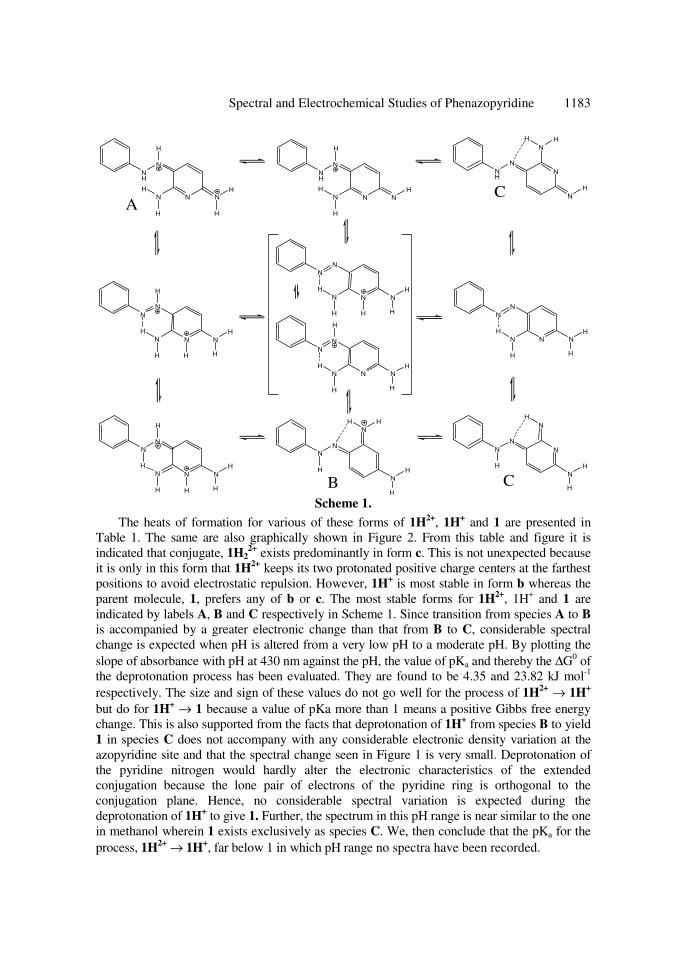
Scheme 1.
The heats of formation for various of these forms of 1H2+
, 1H+ and 1 are presented in
Table 1. The same are also graphically shown in Figure 2. From this table and figure it is
indicated that conjugate, 1H22+
exists predominantly in form c. This is not unexpected because
it is only in this form that 1H2+
keeps its two protonated positive charge centers at the farthest
positions to avoid electrostatic repulsion. However, 1H+ is most stable in form b whereas the
parent molecule, 1, prefers any of b or c. The most stable forms for 1H2+
, 1H+ and 1 are
indicated by labels A, B and C respectively in Scheme 1. Since transition from species A to B
is accompanied by a greater electronic change than that from B to C, considerable spectral
change is expected when pH is altered from a very low pH to a moderate pH. By plotting the
slope of absorbance with pH at 430 nm against the pH, the value of pKa and thereby the ∆G0 of
the deprotonation process has been evaluated. They are found to be 4.35 and 23.82 kJ mol-1
respectively. The size and sign of these values do not go well for the process of 1H2+
→ 1H+
but do for 1H+ → 1 because a value of pKa more than 1 means a positive Gibbs free energy
change. This is also supported from the facts that deprotonation of 1H+ from species B to yield
1 in species C does not accompany with any considerable electronic density variation at the
azopyridine site and that the spectral change seen in Figure 1 is very small. Deprotonation of
the pyridine nitrogen would hardly alter the electronic characteristics of the extended
conjugation because the lone pair of electrons of the pyridine ring is orthogonal to the
conjugation plane. Hence, no considerable spectral variation is expected during the
deprotonation of 1H+ to give 1. Further, the spectrum in this pH range is near similar to the one
in methanol wherein 1 exists exclusively as species C. We, then conclude that the pKa for the
process, 1H2+
→ 1H+, far below 1 in which pH range no spectra have been recorded.

1184 A. RAMACHANDRAIAH et al.
Table 1. Heats of formation, in (kJ mol-1
) of various conjugates of 1.
a
a
a
b
b
b
c
c
c
-5
-3
-1
1
3
5
1 1H 1H2
Figure 2. Heats of formation (kJ mol-1
) of the 3 most stable acid-conjugates of 1 (Energy of
1H22+
is reduced ten times for comparison).
Electrochemical studies
Azocompounds are known for their facile reduction of the azo moiety in aqueous media
either consecutively as
R-N=N-R' 2H+, 2eR-NH-NH-R'
2H+, 2eRNH2 + R'NH2 (1)
or directly as
R-N=N-R' 4H+, 4eRNH2 + R'NH2 (2)
depending on the pH. Azo compounds are also known for their adsorptive and non-
diffusion-controlled electrochemistry on mercury electrode16
. Compound, 1, exhibits an
interesting electron transfer behavior that changes its profile with pH. The cyclic
voltammetric response of 1 in some representative buffers on a stationary mercury drop
electrode (SMDE) is shown in Figure 3. One observes two irreversible peaks, a broad
one at a less cathodic potential and another sharp one at a higher cathodic potential with
their potential gap widening with increased pH. As the pH increases, the sharp and more
cathodic peak alone shifts cathodically. Coulometric studies gave the value of n
involved in the adsorptive electrochemical reduction as 4. For a typical electrochemical
reduction through,
Ox + ne + mH+ → Red
the cyclic voltametric peak potential, Ep, varies with pH as
pHn
mEE pp
05916.00−= (3)
where Eo
p is the peak potential at a reference pH (truly, at activity of H+=1 or pH= 0).
From the linear plot of Ep vs. pH, the number of H+ ions (m) involved in the
electrochemical reduction is also found as 4. Compound, 1, offers linear ip vs. ν plots
for the sharp peak at the higher cathodic potential suggesting that 1 has an adsorptive
electrochemistry. The lower cathodic broad peak, however is diffusion controlled as
evident from its linear ip vs. ν1/2
plots.
Species
Conjugate form a form b form c
1H22+ 46.0504 48.3221 37.6557
1H+ 0.9428 -4.1645 1.6626
1 4.1145 -0.4906 -0.5533
1 1H 1H2

Spectral and Electrochemical Studies of Phenazopyridine 1185
Figure 3. Cyclic voltammograms of 1 (3.5x10⁻⁴
M) in buffers (ionic strength = 0.05 M) of
pH (a) 2.56, (b) 4.02, (c) 5.93, (d) 7.40, (e) 8.78, (f) 9.62 and (g) 10.48
Che Man Chang has reviewed extensively the electrochemistry of aromatic azo-hydrazo
redox system in aqueous media17
. In general, the azo compounds undergo a two-electron and
two-proton reduction at their -N=N- to end up in –NH-NH-. However, some exceptions are
there. If electrochemically inactive but strong electron donating groups, such as, -OH, -NH2
etc., interact (by resonance or hydrogen bond or tautomerically) with the azo group, the
reduction may proceed directly via a four-electron step to yield the amines by reductive
cleavage of -N=N- link at low pH buffers as in eqn (2) above18
. It is also suggested that the
electrochemical reduction of aryl amino azo compounds takes place via the quinonamine
form19
. In strongly acidic media, the protonated hydrazone form is predominant and is
reported to undergo an electrochemical reduction without the involvement of
hydrazonium/hydrazenium intermediates. We have observed from the spectral studies that
an increase in pH results in a hypsoochromic shift of the n→π* transition Figure 1. It only
means that the double bond character at the azo site as -N=N- is less at low pH than at high
pH. Scheme 1 suggests how at a pH < pKa of 1H+, the analyte exists predominantly as
species B wherein the protonated ortho hydrazone (hydrazonium cationic) form is very
abundant. As pH increases its population decreases in favour of the para hydrazone (neutral)
form, C which is more adsorptive on the electrode. In Figure 3 it can also be seen that there
is a change of sorts at a pH near the pKa below and above which the trends of Ep with pH are
different. This suggests that the nature of electroactive species at pH below and that above
the pKa are slightly different. This is in line with Scheme 1. The diffusion controlled and
pH-independent peak at ~ -0.2000 V is assigned to the reduction of the diffusion-controlled
other forms which are present at reasonable population over the whole pH range. The
plausible electrochemical reduction mechanism of compound 1 is presented in Scheme 2 for
the adsorbed species. Relevant electrochemical data are collected in Table 2 for this process.
Assaying of 1
Based on the electrochemical response of 1, an excellent electrochemical assaying of 1, in
differential pulse polarography (DPP), is developed. The DPP curves of 1 at pH=8.00 along
with the calibration curve (inset) are shown in Figure 4 (for SMDE of medium size, scan
rate of 5 mVs-1
and pulse height of 100 mV).
Potential (V) vs. Ag/AgCl
Cu
rren
t

1186 A. RAMACHANDRAIAH et al.
NN
NH2
H
NH H
NNH
N
NH
NHH
HN
NH2
NH H
NHN
NH
NHH
+ ANILINE + ANILINE
H2N
NH H
+ ANILINE
NH3
H2N
NH H
+ ANILINE
NH2
2H+, 2e
2H+, 2e f ast
Scheme 2.
Table 2. Voltammetric data of 1.
pH -Ep (V) vs
Ag|AgCl
ip, µA αna Do x 106,
cm2 s
-1
ko
f,,h x109,
cm2 s
-1
2.56 0.202 0.331 0.73 0.98 2.69
4.02 0.303 0.274 0.73 0.67 2.23
5.93 0.369 0.163 0.48 1.48 1.69
7.40 0.399 0.140 0.49 1.06 1.77
8.78 0.591 0.182 0.72 1.08 0.94
9.62 0.617 0.177 0.48 1.70 0.35
10.48 0.657 0.123 0.45 1.03 0.15
Figure 4. Differential pulse polarograms of 1 from (1 to 8) x10-5
M.
Aniline
Aniline
Aniline
Aniline
Potential (V) vs. Ag/AgCl

Spectral and Electrochemical Studies of Phenazopyridine 1187
References
1. Kolthoff and I M and Lingane J J, Polarography, 2nd
Ed, Wiley-Intersciences: New
York, 1952.
2. Delahay P, New Instrumental Methods in Electrochemistry; Wiley-Interscience: New
York, 1954.
3. Lingane J J, Electroanalytical Chemistry, 2nd
Ed., Wiley-Interscience: New York, 1958.
4. Meites L, Polarographic Techniques, 2nd
Ed., Wiley-Interscience: New York, 1958.
5. Heyrovsky J and Kuta J, Principles of Polarography, Academic Press: New York, 1966.
6. Bard A J and Faulkner L R, Electrochemical Methods, John Wiley & Sons: New
York, 1980.
7. Breslow R and Balasubramanian K, J Am Chem Soc., 1969, 91, 5182.
8. Breslow R and Chu W, J Am Chem Soc., 1970, 92, 2165.
9. Breslow R and Grant J, J Am Chem Soc., 1977, 99, 7745.
10. Bordwell F G, Zhang X and Cheng J P, J Org Chem Soc., 1991, 56, 3216.
11. Wayner D D and Parker V D, Acc Chem Res., 1993, 26, 287.
12. Janata J, Josowicz M and DeVaney D M, Annal Chem., 1994, 66, 207R.
13. Haselback E and Helbronner E, Helv Chim Acta, 1968, 51, 16.
14. Whitakar A, J Soc Dyers Colour, 1978, 431.
15. Hazard R and Tallec A, Bull Soc Chim France., 1971, 29, 11.
16 Saul Patai, The Chemistry of the Hydrazo, Azo and Azoxy Groups, Part-1, John
Wiley & Sons, New York, 1975, 443.
17. Jain R and Malik W U, Indian J Chem., 1983, 22A, 331.
18. Zuman P, Substituent Effects in Organic Polarography, Plenum Press, New York, 1967.
19. Laviron E, Electroanal Chem Interfacial Electrochem., 1974, 52, 335.

Submit your manuscripts athttp://www.hindawi.com
Chromatography Research International
Hindawi Publishing Corporationhttp://www.hindawi.com Volume 2013
Hindawi Publishing Corporationhttp://www.hindawi.com Volume 2013
Carbohydrate Chemistry
International Journal of
Hindawi Publishing Corporationhttp://www.hindawi.com
International Journal of
Analytical ChemistryVolume 2013
ISRN Chromatography
Hindawi Publishing Corporationhttp://www.hindawi.com Volume 2013
Hindawi Publishing Corporation http://www.hindawi.com Volume 2013Hindawi Publishing Corporation http://www.hindawi.com Volume 2013
The Scientific World Journal
Bioinorganic Chemistry and ApplicationsHindawi Publishing Corporationhttp://www.hindawi.com Volume 2013
Hindawi Publishing Corporationhttp://www.hindawi.com Volume 2013
CatalystsJournal of
ISRN Analytical Chemistry
Hindawi Publishing Corporationhttp://www.hindawi.com Volume 2013
ElectrochemistryInternational Journal of
Hindawi Publishing Corporation http://www.hindawi.com Volume 2013
Hindawi Publishing Corporationhttp://www.hindawi.com Volume 2013
Advances in
Physical Chemistry
ISRN Physical Chemistry
Hindawi Publishing Corporationhttp://www.hindawi.com Volume 2013
SpectroscopyInternational Journal of
Hindawi Publishing Corporationhttp://www.hindawi.com Volume 2013
ISRN Inorganic Chemistry
Hindawi Publishing Corporationhttp://www.hindawi.com Volume 2013
Hindawi Publishing Corporationhttp://www.hindawi.com Volume 2013
Journal of
Chemistry
Hindawi Publishing Corporationhttp://www.hindawi.com Volume 2013
Inorganic ChemistryInternational Journal of
Hindawi Publishing Corporation http://www.hindawi.com Volume 2013
International Journal ofPhotoenergy
Hindawi Publishing Corporationhttp://www.hindawi.com
Analytical Methods in Chemistry
Journal of
Volume 2013
ISRN Organic Chemistry
Hindawi Publishing Corporationhttp://www.hindawi.com Volume 2013
Hindawi Publishing Corporationhttp://www.hindawi.com Volume 2013
Journal of
Spectroscopy