specifification of properties 30.09...specifification of properties 30.09.2018 stockholm region 2...
TRANSCRIPT

SPECIFIFICATION OF PROPERTIES 30.09.2018
STOCKHOLM REGION 2
EAST REGION 7
CENTRAL REGION 14
SOUTH REGION 17
INTERNATIONAL 25
The property Livia 16, Västerås.

Stockholm North
STOCKHOLM REGION
2 SPECIFICATION OF PROPERTIESStockholm Region

STOCKHOLM NORTH
No Property Address
Site lease-hold
Buildingyear/valueyear
Type of property
Area, s.qm.
Rental value SEKmOffice
Warehouse/logistics
(WL) Retail Other* Area, s.qm.
1 Timmerhuggaren 2 Vendev. 90, Danderyd 1969/1969 Offices 6,142 1,947 1,117 1,400 10,606 16.4
2 Ekplantan 1 Djupdalsv. 17, 19, Sollentuna 1988/1988 Offices 2,600 2,600 1.6
3 Malten 1 Vetenskapsv. 10, 12, 14, Sollentuna 2005/2005 Offices 12,393 527 660 253 13,833 27.2
4 Aprikosen 2 Hemvärnsg. 5, 7, 9, Solna 1975/1992 Offices 26,358 3,553 1,875 3,372 35,158 80.4
5–7 Hilton 3 Gustav III:s Boulevard 40–46, Solna 2003/2003 Offices 19,037 682 326 6 20,051 56.9
8 Startboxen 3 Vallg. 5–9 Solna 1985/1985 Offices 10,777 762 7,706 19,245 39.7
9 Domnarvet 11 Domnarvsg. 35, Stockholm T 1978/1978 Offices 1,895 1,778 3,673 4.3
10 Johannelund 7 Krossg. 10, 12, 14, 16, 18, Sorterarg. 23, Stockholm
T 1969/1969 Offices 16,388 4,438 505 803 22,134 23.8
11 Mandelblomman 1 Kronofogdev. 54, Stockholm 1983/1983 WL 762 3,493 969 1,681 6,905 6.4
12 Singeln 13 Krossg. 26–28 T 1966/1966 WL 1,807 2,293 4,100 4.1
13 Stenen 1 Krossg. 15, 17, Sorterarg. 31, 33, 35, Stockholm
T 1970/1970 Offices 9,132 2,221 11,353 9.3
14 Stenmjölet 1 Siktg. 1, 3, Stockholm T 1960/1960 Other* 967 326 1,776 2,110 5,179 5.7
15 Stenmjölet 2 Siktg. 3A–3B, Stockholm T 1960/1960 WL 2,730 2,094 4,824 5.3
16 Orgelpipan 4 Klarabergsg. 33, 35, Stockholm T 1957/1957 Offices 3,490 343 525 159 4,517 19.4
17 Alptanäs 2 Torshamnsg. 7, 7A, 9, Haukadalsg. 1, Kista
T 1981/1981 Offices 2,783 247 3,030 3.7
18 Alptanäs 3 Torshamnsg. 1, 3, 5, Kista T Tomt Other* 1.5
19 Borg 1 Torshamnsg. 16, Kista T 1977/1977 Offices 1,411 1,411 1.9
20 Borg 2 Strömög. 3, Kista T 1981/1981 WL 4,655 4,655 5.4
21 Borg 3 Strömög. 5, Kista T 1978/1978 WL 1,837 1,837 2.2
22 Borg 4 Vågög. 6 T 1979/1979 Offices 1,931 1,931 3.1
23 Borg 6 Strömög. 7, Vågög. 8, Kista T 1980/1980 WL 1,487 4,930 6,417 6.9
24 Borgarfjord 4 Kistagången 12, Torshamnsg. 31–33, Kista
T 1983/1983 Offices 12,633 213 654 13,506 29.9
25 Geysir 1 Österög. 4, Kista T 1979/1979 WL 5,110 5,110 5.8
26 Geysir 2 Österög. 2, Kista T 1980/1980 WL 1,862 5,097 165 7,124 8.7
27 Gullfoss 3 Österög. 1, 3, Kista T 1979/1983 Offices 4,846 1,107 1,565 7,517 10.8
28 Gullfoss 5 Viderög. 6, Kista T 1979/1983 Offices 3,508 3,508 5.3
29 Helgafjäll 1 Torshamnsg. 22, 24 A–D, 26 A–B, Kista
T 1979/1979 Offices 10,673 1,592 12,265 28.7
30–31 Helgafjäll 2 Torshamnsg. 28 A–B, 30 A–E, 32 A–D, 34 A–B, Kista
T 1981/1981 Offices 18,327 1,060 7,560 26,947 50.6
32 Helgafjäll 3 Torshamnsg. 36, 38, 40, Kista T 1980/1990 WL 3,965 10,502 14,467 17.2
33–34 Helgafjäll 4 Torshamnsg. 42, 44, 46, Kista T 1998/1998 Offices 13,698 225 13,923 22.3
35 Helgafjäll 5 Kistagången 2, 4, Torshamnsg. 20, Kista
T 1978/1988 Offices 13,727 522 1,567 269 16,085 27.8
36 Helgafjäll 7 Torshamnsg. 48, 50, 52, 54, Kista 2001/2002 Offices 21,590 30 246 21,866 40.4
37 Isafjord 1 Skaftåg. 2A–B, Kista Tomt Other* 2.7
38 Isafjord 4 Torshamnsg. 21, 23, Torshamnsgränd 2, 4, 6, Grönlandsg. 10, Kista
1976/2008 Offices 62,231 8,847 71,078 151.2
39 Isafjord 5 Grönlandsg. 8, Kista Tomt Other* 0.0
40 Isafjord 6 Grönlandsg. 6, Torshamnsgränd 9, Kista 1976/2008 Other* 3,222 3,222 3.5
41 Isafjord 7 Hans Werthéns Gata 19, Kista
Tomt Other* 0.9
42 Isafjord 8 Torshamnsg. 17, Hans Werthéns Gata 19, Torshamnsgränd 3, Skaftåg. 14, 16 , Kista
2016/2016 Offices 23,698 240 1,230 25,168 65.9
43 Knarrarnäs 3 Färög. 5,7 Kista T 1985/1985 Offices 5,504 234 1,417 7,155 15.6
44 Knarrarnäs 4 Färög. 3, Isafjordsg. 19, 21, Kista T 1985/1985 Offices 3 8,082 8,085 0.7
45 Knarrarnäs 6 Isafjordsg. 3, 5 T 1987/1987 Offices 4,419 293 4,712 8.6
46 Knarrarnäs 9 Knarrarnäsg. 15, Kista T 1984/1986 Offices 4,748 172 3 4,923 11.1
47 Lidarände 1 Torshamnsg. 18, Kista 1979/2008 Other* 3,007 126 533 16,280 19,946 33.8
48 Röros 1 Norgeg. 1, Kista T 1985/1985 Offices 3,312 7 1 3,320 4.8
49 Skaftå 1 Torshamnsg. 19, Kista Tomt Other* 2.5
50 Kannringen 1 Enhagsslingan 2, 4, Täby 1988/1988 Offices 4,101 4,101 5.8
51 Kannringen 2 Enhagsslingan 6, 8, Täby 1991/1991 Offices 1,990 16 2,006 2.9
3SPECIFICATION OF PROPERTIESStockholm Region

No Property Address
Site lease-hold
Buildingyear/valueyear
Type of property
Area, s.qm.
Rental value SEKmOffice
Warehouse/logistics
(WL) Retail Other* Area, s.qm.
52 Kardborren 13 Kanalv. 15, 17, Täby 1981/1981 Offices 12,541 319 1,374 14,234 19.8
53 Linjalen 60 Måttbandsv. 12, Täby 1991/1991 Offices 3,057 766 3,823 4.7
54 Linjalen 61 Tillverkarv. 9, Täby 1990/1990 WL 778 778 0.8
55 Linjalen 65 Måttbandsv. 8, 10, Täby 1989/1989 Retail 600 750 1,350 1.2
56 Linjalen 66 Linjalv. 9, 11, Täby 1990/1990 WL 3,815 108 3,923 4.4
57 Linjalen 7 Måttbandsv. 4, Täby 1989/1989 WL 800 800 0.7
58 Linjalen 8 Måttbandsv. 6, Täby 1989/1989 WL 600 600 0.7
59 Lodet 2 Tumstocksv. 9, 11, Täby 1990/1990 Offices 5,012 3,391 70 6 8,479 9.2
60 Mätstången 2 Linjalv. 6 A–B, Kundv. 5, Täby 1991/1991 Offices 3,844 3,844 4.0
61 Roslags-Näsby
24:44
Stockholmsv. 100, 102, Täby 1965/1965 Retail 0.0
62 Roslags-Näsby
24:45
Stockholmsv. 100, 102, Täby 1965/1965 Retail 0.0
63 Roslags-Näsby
25:7
Stockholmsv. 100, 102, Täby 1965/1965 Retail 530 2,181 2,711 3.2
64 Roslags-Näsby
25:8
Stockholmsv. 100, 102, Täby 1965/1965 Retail 0.0
65 Smygvinkeln 10 Ritarslingan 20, Täby 1991/1991 WL 197 430 200 827 0.5
66 Smygvinkeln 11 Ritarslingan 18, Täby 1991/1991 WL 1,634 258 500 2,392 3.4
67 Smygvinkeln 12 Ritarslingan 16, Täby 1992/1992 Offices 850 714 1,564 1.6
68 Smygvinkeln 9 Ritarslingan 22, Täby 1991/1991 WL 960 960 0.4
69 Svänghjulet 1 Enhagsslingan 23, 25, Täby 1990/1990 Other* 591 424 445 2,731 4,191 4.8
70 Svänghjulet 2 Enhagsslingan 5, 7, 9, 11, 13, Täby 1989/1989 Offices 1,660 12 1,323 2,995 4.0
71 Svänghjulet 3 Enhagsslingan 15, 17, 19, 21, Täby 1991/1991 Offices 4,329 579 4,908 5.6
72–73 Tryckaren 3 Reprov. 6, Viggbyholmsv. 81, Täby 1945/1992 WL 1,367 2,131 3,498 3.7
74 Ventilen 1 Enhagsslingan 1A–B, Täby 1987/1987 Offices 1,984 675 296 2,955 3.3
75 Växellådan 1 Enhagsv. 7, Täby 1978/1983 Offices 2,407 390 2,797 3.7
76 Växellådan 3 Enhagsv. 9, Täby 1978/1978 Offices 1,210 353 337 1,900 2.0
77 Åkerby 10 Kemistv. 6, Täby 1975/1989 Offices 1,195 12 1,207 1.3
TOTAL STOCKHOLM NORTH 377,442 83,223 18,441 71,122 550,228 965.7
* Consists of education, health, gym, housing, land aswell as other surfaces like laboratory, fair, mail and technical spaces. Acquisitions during 2018 A property can consist of a number of jointly administered properties or several large buildings.
STOCKHOLM NORTH CONT.
4 SPECIFICATION OF PROPERTIESStockholm Region

Stockholm South
STOCKHOLM SOUTH
No Property Address
Site lease-hold
Buildingyear/valueyear
Type of property
Area, s.qm.
Rental value SEKmOffice
Warehouse/logistics
(WL) Retail Other* Area, s.qm.
1 Jordbromalm 6:20 Armaturv. 4, Haninge 1979/1984 WL 0.0
2 Jordbromalm 6:3 Armaturv. 4, Haninge 1979/1984 WL 26,617 1,008 27,625 19.7
3 Jordbromalm 6:76 Armaturv. 4, Haninge 1979/1984 WL 0.0
4 Ellipsen 5 Ellipsv., Huddinge 1997/1997 Offices 2,800 2,800 2.7
5 Förstugan 1 Fullersta Torg 18, 20, Huddinge 1989/1989 Offices 1,600 1,600 3.2
6 Rektangeln 3 Pyramidb. 2, 4, Huddinge 1986/1986 Other* 477 2,654 3,131 7.5
7 Valen 2 Kommunalv. 1, 3, 5, Huddinge 1987/1987 Offices 4,248 232 4,480 8.0
8–11 Arenan 2 Arenaslingan 1–3, Arenav. 49, 55–63,
Johanneshov
1989/1989 Offices 32,535 3,399 18,386 298 54,618 159.7
12–13 Arenan 3 Arenav. 39–47, Johanneshov 1989/1989 Offices 13,780 1,002 1,799 16,581 49.8
14–17 Arenan 6 Arenav. 17, 21–35, Johanneshov 1991/1993 Offices 16,393 2,617 3,852 7,297 30,159 88.2
18 Arenan 8 Arenav. 7–13, Johanneshov 2001/2001 Offices 14,150 14,150 38.0
TOTAL STOCKHOLM SOUTH 85,506 34,344 22,238 13,056 155,144 376.7
* Consists of education, health, gym, housing, land aswell as other surfaces like laboratory, fair, mail and technical spaces. Acquisitions during 2018 A property can consist of a number of jointly administered properties or several large buildings.
5SPECIFICATION OF PROPERTIESStockholm Region

UPPSALA
No Property Address
Site lease-hold
Buildingyear/valueyear
Type of property
Area, s.qm.
Rental value SEKmOffice
Warehouse/logistics
(WL) Retail Other* Area, s.qm.
1–4 Boländerna 33:2 Kungsängsv. 15 mfl, Uppsala 1991/1991 Offices 17,684 373 486 461 19,004 27.2
5–11 Fyrislund 6:6 Rapsg. 7, Uppsala 1921/2003 Other* 22,316 9,502 1,873 35,920 69,611 125.5
12 Kungsängen 10:1 Bävernsgränd 17, 19, 21, Kungsg. 48, 50, Uppsala
1966/1989 Other* 9,047 137 10,132 19,316 47.4
13 Kungsängen 10:2 Suttungs gränd 4, 6, Uppsala 2017/2017 Other* 0.0
14 Kungsängen 24:3 Kungsängsg. 70–74, Uppsala 1998/1998 Retail 696 5,665 6,361 9.9
15 Kungsängen 29:1 Kungsg. 70A–E, Uppsala 1985/1985 Offices 2,428 342 1,707 4,477 5.8
16 Kungsängen 37:13 Kungs. 107–115, Stallängsg. 19–25 1989/1989 Offices 7,959 552 6,725 15,236 24.4
TOTAL UPPSALA 60,130 10,906 16,456 46,513 134,005 240.2
* Consists of education, health, gym, housing, land aswell as other surfaces like laboratory, fair, mail and technical spaces. Acquisitions during 2018 A property can consist of a number of jointly administered properties or several large buildings.
Uppsala
Area, s.qm.
Rental value SEKmOffice
Warehouse/logistics
(WL) Retail Other* Area, s.qm.
TOTAL STOCKHOLM REGION 523,078 128,472 57,135 130,691 839,376 1 582.6
TOTAL KLÖVERN 1,353,677 792,852 260,700 371,389 2,778,620 3,672
6 SPECIFICATION OF PROPERTIESStockholm Region

Kalmar
EAST REGION
KALMAR
No Property Address
Site lease-hold
Buildingyear/valueyear
Type of property
Area, s.qm.
Rental value SEKmOffice
Warehouse/logistics
(WL) Retail Other* Area, s.qm.
1 Apotekaren 20 Storg. 28, 30, V. Sjög. 13, Kalmar 1965/1965 Retail 771 101 817 182 1,871 3.1
2 Borret 10 Dösebackev. 5, Kalmar 1976/1976 WL 1,035 9,863 10,898 6.5
3 Elefanten 3 Torsåsg. 9, Kalmar 1970/1971 Offices 3,923 2,000 2,500 8,423 6.9
4 Fredriksdal 1 Lorensbergsleden 1, 3, Kalmar 1975/1975 Other* 750 913 1,835 3,498 2.6
5 Guldfisken 2 Postg. 2, Kalmar 1947/1947 Other* 396 404 2,229 3,029 2.0
6–10 Gumsen 31 Verkstadsg. 3, Kalmar 1950/1960 WL 6,451 9,845 1,153 7,440 24,889 17.3
11 Gumsen 41 Torsåsg. 16, Kalmar 1975/1975 Offices 2,042 2,042 1.8
12 Koljan 24 N. V. 18, S. Malmg. 7, Kalmar 1967/1967 Other* 1,614 528 615 3,171 5,927 6.7
13 Korpen 18 Fabriksg. 31, Kalmar 1976/1976 Offices 3,117 694 3,811 4.8
14 Korpen 20 Fabriksg. 29, Nyg. 30, Kalmar 1979/1979 Other* 2,600 133 3,557 6,290 7.8
15 Lärlingen 5 Kaggensg 40, 42, 44, Strömg. 7, Kalmar 1960/1960 Offices 2,125 245 375 1,829 4,574 5.3
16 Matrosen 1 Tjärhovsg. 1, 3, 5, 7, Kalmar T 1995/1995 Other* 971 1,288 2,259 3.5
17 Mästaren 28 Kaggensg. 30, Fiskareg. 20, Kalmar 1962/1962 Retail 568 57 712 1,337 2.2
18 Rybsen 1 Dagöv. 1B, Kalmar 2000/2000 Offices 1,112 1,112 1.3
19 Tenngjutaren 1 Strömg. 2, Larmg. 40, Kalmar 1974/1979 Offices 1,199 92 297 1,588 2.1
20 Timotejen 1 Öselv. 1, Kalmar 1991/1991 Offices 902 650 1,552 1.5
– Fläkten 11 Kvarnv. 2, Växjö 1982/1982 Offices 8,200 8,200 8.6
– Fläkten 14 Kvarnv. 26, 28, Växjö 1982/1982 WL 5,300 5,300 3.4
TOTAL KALMAR 37,775 30,174 6,822 21,828 96,599 87.4
* Consists of education, health, gym, housing, land aswell as other surfaces like laboratory, fair, mail and technical spaces. Acquisitions during 2018 A property can consist of a number of jointly administered properties or several large buildings.
7SPECIFICATION OF PROPERTIESEast Region

Linköping
8 SPECIFICATION OF PROPERTIESEast Region
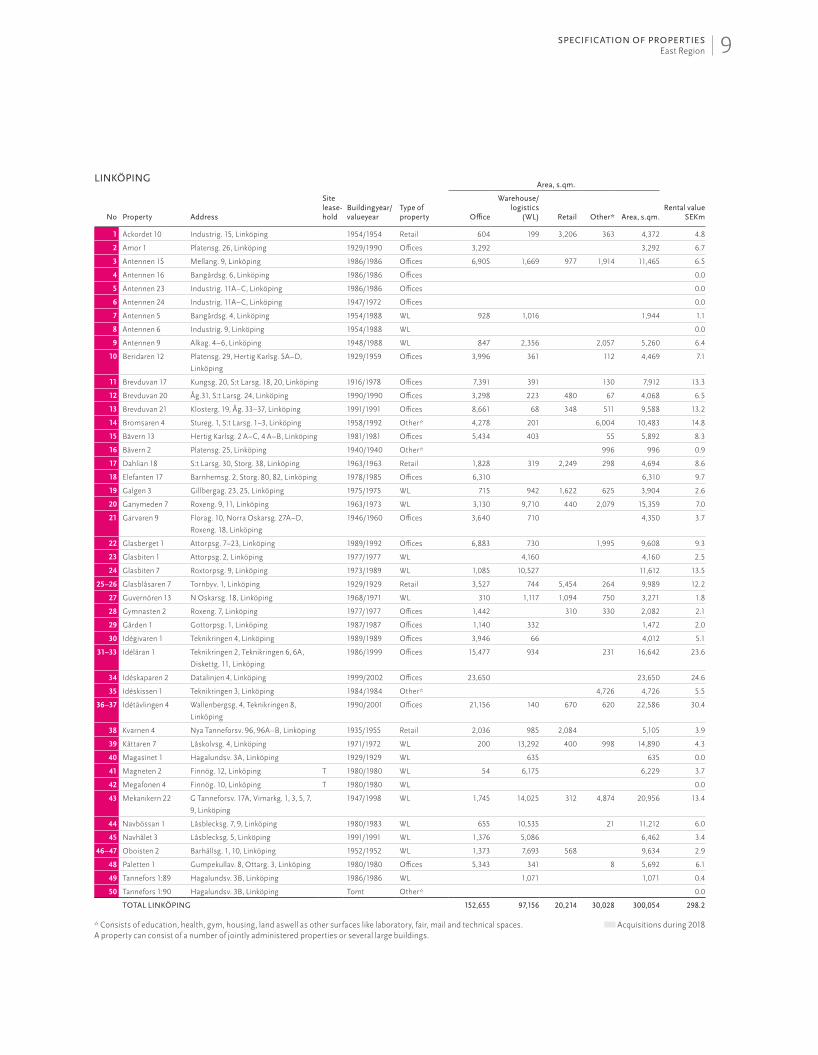
LINKÖPING
No Property Address
Site lease-hold
Buildingyear/valueyear
Type of property
Area, s.qm.
Rental value SEKmOffice
Warehouse/logistics
(WL) Retail Other* Area, s.qm.
1 Ackordet 10 Industrig. 15, Linköping 1954/1954 Retail 604 199 3,206 363 4,372 4.8
2 Amor 1 Platensg. 26, Linköping 1929/1990 Offices 3,292 3,292 6.7
3 Antennen 15 Mellang. 9, Linköping 1986/1986 Offices 6,905 1,669 977 1,914 11,465 6.5
4 Antennen 16 Bangårdsg. 6, Linköping 1986/1986 Offices 0.0
5 Antennen 23 Industrig. 11A–C, Linköping 1986/1986 Offices 0.0
6 Antennen 24 Industrig. 11A–C, Linköping 1947/1972 Offices 0.0
7 Antennen 5 Bangårdsg. 4, Linköping 1954/1988 WL 928 1,016 1,944 1.1
8 Antennen 6 Industrig. 9, Linköping 1954/1988 WL 0.0
9 Antennen 9 Alkag. 4–6, Linköping 1948/1988 WL 847 2,356 2,057 5,260 6.4
10 Beridaren 12 Platensg. 29, Hertig Karlsg. 5A–D,
Linköping
1929/1959 Offices 3,996 361 112 4,469 7.1
11 Brevduvan 17 Kungsg. 20, S:t Larsg. 18, 20, Linköping 1916/1978 Offices 7,391 391 130 7,912 13.3
12 Brevduvan 20 Åg.31, S:t Larsg. 24, Linköping 1990/1990 Offices 3,298 223 480 67 4,068 6.5
13 Brevduvan 21 Klosterg. 19, Åg. 33–37, Linköping 1991/1991 Offices 8,661 68 348 511 9,588 13.2
14 Bromsaren 4 Stureg. 1, S:t Larsg. 1–3, Linköping 1958/1992 Other* 4,278 201 6,004 10,483 14.8
15 Bävern 13 Hertig Karlsg. 2 A–C, 4 A–B, Linköping 1981/1981 Offices 5,434 403 55 5,892 8.3
16 Bävern 2 Platensg. 25, Linköping 1940/1940 Other* 996 996 0.9
17 Dahlian 18 S:t Larsg. 30, Storg. 38, Linköping 1963/1963 Retail 1,828 319 2,249 298 4,694 8.6
18 Elefanten 17 Barnhemsg. 2, Storg. 80, 82, Linköping 1978/1985 Offices 6,310 6,310 9.7
19 Galgen 3 Gillbergag. 23, 25, Linköping 1975/1975 WL 715 942 1,622 625 3,904 2.6
20 Ganymeden 7 Roxeng. 9, 11, Linköping 1963/1973 WL 3,130 9,710 440 2,079 15,359 7.0
21 Garvaren 9 Florag. 10, Norra Oskarsg. 27A–D,
Roxeng. 18, Linköping
1946/1960 Offices 3,640 710 4,350 3.7
22 Glasberget 1 Attorpsg. 7–23, Linköping 1989/1992 Offices 6,883 730 1,995 9,608 9.3
23 Glasbiten 1 Attorpsg. 2, Linköping 1977/1977 WL 4,160 4,160 2.5
24 Glasbiten 7 Roxtorpsg. 9, Linköping 1973/1989 WL 1,085 10,527 11,612 13.5
25–26 Glasblåsaren 7 Tornbyv. 1, Linköping 1929/1929 Retail 3,527 744 5,454 264 9,989 12.2
27 Guvernören 13 N Oskarsg. 18, Linköping 1968/1971 WL 310 1,117 1,094 750 3,271 1.8
28 Gymnasten 2 Roxeng. 7, Linköping 1977/1977 Offices 1,442 310 330 2,082 2.1
29 Gården 1 Gottorpsg. 1, Linköping 1987/1987 Offices 1,140 332 1,472 2.0
30 Idégivaren 1 Teknikringen 4, Linköping 1989/1989 Offices 3,946 66 4,012 5.1
31–33 Idéläran 1 Teknikringen 2, Teknikringen 6, 6A,
Diskettg. 11, Linköping
1986/1999 Offices 15,477 934 231 16,642 23.6
34 Idéskaparen 2 Datalinjen 4, Linköping 1999/2002 Offices 23,650 23,650 24.6
35 Idéskissen 1 Teknikringen 3, Linköping 1984/1984 Other* 4,726 4,726 5.5
36–37 Idétävlingen 4 Wallenbergsg. 4, Teknikringen 8,
Linköping
1990/2001 Offices 21,156 140 670 620 22,586 30.4
38 Kvarnen 4 Nya Tanneforsv. 96, 96A–B, Linköping 1935/1955 Retail 2,036 985 2,084 5,105 3.9
39 Kättaren 7 Låskolvsg. 4, Linköping 1971/1972 WL 200 13,292 400 998 14,890 4.3
40 Magasinet 1 Hagalundsv. 3A, Linköping 1929/1929 WL 635 635 0.0
41 Magneten 2 Finnög. 12, Linköping T 1980/1980 WL 54 6,175 6,229 3.7
42 Megafonen 4 Finnög. 10, Linköping T 1980/1980 WL 0.0
43 Mekanikern 22 G Tanneforsv. 17A, Vimarkg. 1, 3, 5, 7,
9, Linköping
1947/1998 WL 1,745 14,025 312 4,874 20,956 13.4
44 Navbössan 1 Låsblecksg. 7, 9, Linköping 1980/1983 WL 655 10,535 21 11,212 6.0
45 Navhålet 3 Låsblecksg. 5, Linköping 1991/1991 WL 1,376 5,086 6,462 3.4
46–47 Oboisten 2 Barhällsg. 1, 10, Linköping 1952/1952 WL 1,373 7,693 568 9,634 2.9
48 Paletten 1 Gumpekullav. 8, Ottarg. 3, Linköping 1980/1980 Offices 5,343 341 8 5,692 6.1
49 Tannefors 1:89 Hagalundsv. 3B, Linköping 1986/1986 WL 1,071 1,071 0.4
50 Tannefors 1:90 Hagalundsv. 3B, Linköping Tomt Other* 0.0
TOTAL LINKÖPING 152,655 97,156 20,214 30,028 300,054 298.2
* Consists of education, health, gym, housing, land aswell as other surfaces like laboratory, fair, mail and technical spaces. Acquisitions during 2018 A property can consist of a number of jointly administered properties or several large buildings.
9SPECIFICATION OF PROPERTIESEast Region

Norrköping
10 SPECIFICATION OF PROPERTIESEast Region

NORRKÖPING
No Property Address
Site lease-hold
Buildingyear/valueyear
Type of property
Area, s.qm.
Rental value SEKmOffice
Warehouse/logistics
(WL) Retail Other* Area, s.qm.
1 Basfiolen 9 Moa Martinsons g. 10b, Norrköping
T 1983/1983 Offices 1,146 58 1,204 1.2
2 Bronsen 2 Tenng. 4, Norrköping 1971/1971 WL 3,996 4,259 1,803 273 10,331 7.3
3 Diket 10 Drottningg. 66, Nyg. 93, Norrköping
1968/1968 Offices 2,369 164 1,364 1,016 4,913 7.6
4 Järnet 5 Malmg. 39, 41, Blyg. 4 1976/1976 Retail 14,510 465 14,975 18.5
5 Kabeln 1 Bangårdsg. 5, Lindöv. 25, 27, Växthusg. 2, 4, Norrköping
1940/1993 WL 2,621 2,226 40 4,887 4.7
6 Kondensatorn 1 Ståthögav. 48, Norrköping 1960/1993 WL 5,539 21,919 1,621 2,901 31,980 19.7
7–10 Koppar hammaren 2
N Grytsg. 8, 10, 14, Norrköping 1929/1999 Offices 27,687 1,104 10,144 38,935 52.7
11 Koppar hammaren 7
Kungsg. 56, N Grytsg. 2,4,6, Norr-köping
1929/1929 Offices 3,375 113 990 4,478 9.3
12 Kopparn 10 Kopparg. 11, Norrköping 1980/1989 Offices 4,203 2,987 7,190 6.3
13 Kvarnholmen 4 Dalsg. 7, Norrköping 1993/1993 Offices 8,149 1,616 9,765 15.9
14 Malmen 5 Kopparg. 18, Norrköping 1969/1982 WL 755 2,623 610 3,988 2.9
15 Malmen 8 Kopparg. 10, Norrköping Tomt Other* 0.9
16–18 Omformaren 7 Hagag. 10, Norrköping 1951/1968 WL 4,960 4,178 3,065 12,203 8.0
19 Platinan 1 Platinag. 1, Norrköping 1988/1988 Retail 4,375 4,375 3.0
20 Regulatorn 3 Kabelv. 15, Norrköping 1996/1996 WL 1,365 2,287 580 473 4,705 2.9
21 Ritsaren 10 Industrig. 7–9, Masking. 23, Norrköping 1964/1986 Retail 151 4,851 696 5,698 5.3
22 Rotfjärilen 1 Svärmareg. 1, 3, Norrköping 1992/1993 Offices 5,731 1,688 7,419 8.2
23 Silvret 2 Kopparg. 28, Norrköping 1988/1988 WL 6,866 6,866 2.8
24 Slakthuset 14 Lindöv. 70, Norrköping 1985/1985 WL 2,805 2,805 1.2
25 Statorn 10 Malmg. 4, Norrköping 1938/1978 WL 1,747 1,758 1,085 61 4,651 4.1
26 Stjärnan 15 Slottsg. 114, 116, Norrköping 1958/1958 Offices 8,584 245 2,878 810 12,517 17.1
27 Stjärnan 16 Slottsg. 114, 116, Norrköping 1958/1958 Offices 0.0
28 Stålet 3 Malmg. 18, Norrköping 1976/1976 WL 1,085 9,232 93 10,410 6.2
29 Svärdet 8 Hospitalsg. 17 mfl, Norrköping 1967/1976 Offices 7,638 15 365 8,018 12.1
TOTAL NORRKÖPING 85,990 65,460 38,220 22,643 212,313 217.7
* Consists of education, health, gym, housing, land aswell as other surfaces like laboratory, fair, mail and technical spaces. Acquisitions during 2018 A property can consist of a number of jointly administered properties or several large buildings.
11SPECIFICATION OF PROPERTIESEast Region
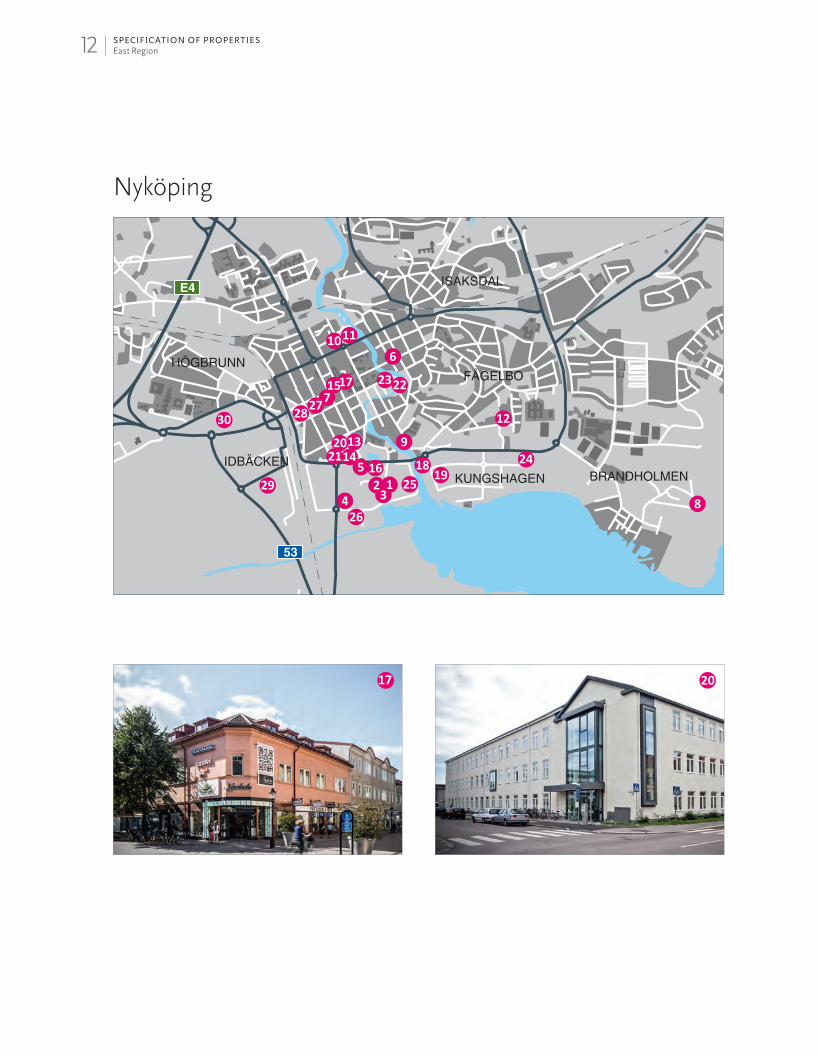
Nyköping
12 SPECIFICATION OF PROPERTIESEast Region
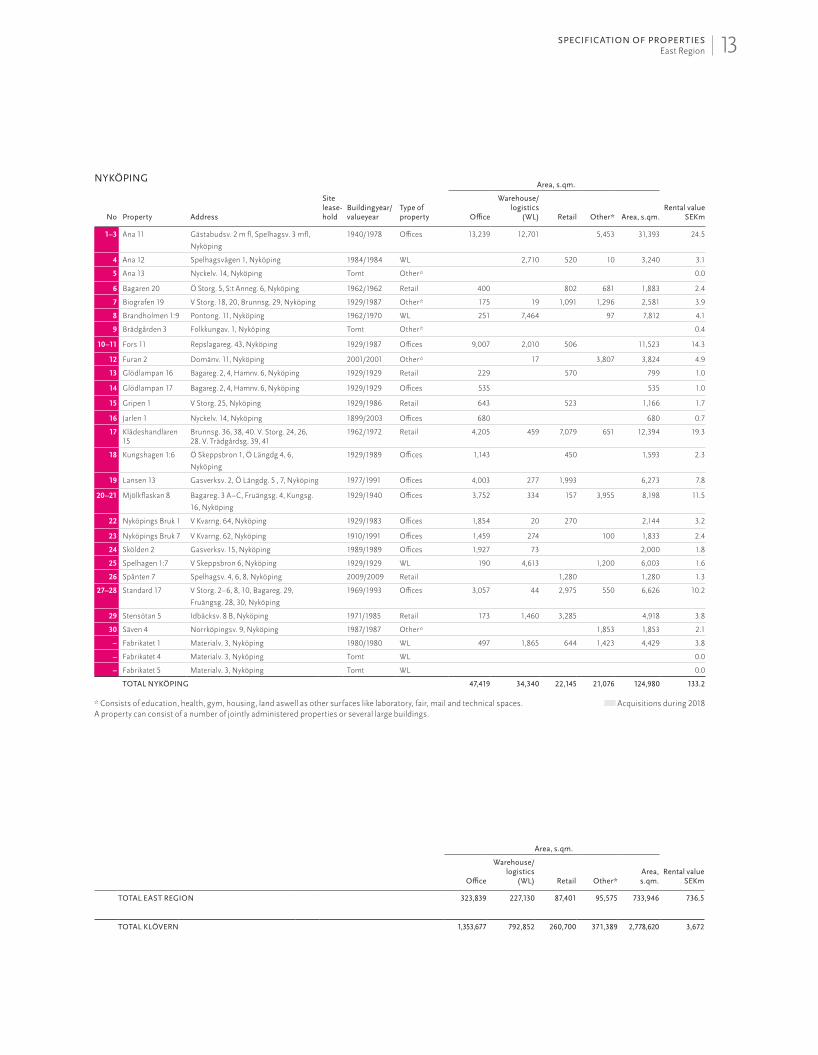
NYKÖPING
No Property Address
Site lease-hold
Buildingyear/valueyear
Type of property
Area, s.qm.
Rental value SEKmOffice
Warehouse/logistics
(WL) Retail Other* Area, s.qm.
1–3 Ana 11 Gästabudsv. 2 m fl, Spelhagsv. 3 mfl,
Nyköping
1940/1978 Offices 13,239 12,701 5,453 31,393 24.5
4 Ana 12 Spelhagsvägen 1, Nyköping 1984/1984 WL 2,710 520 10 3,240 3.1
5 Ana 13 Nyckelv. 14, Nyköping Tomt Other* 0.0
6 Bagaren 20 Ö Storg. 5, S:t Anneg. 6, Nyköping 1962/1962 Retail 400 802 681 1,883 2.4
7 Biografen 19 V Storg. 18, 20, Brunnsg. 29, Nyköping 1929/1987 Other* 175 19 1,091 1,296 2,581 3.9
8 Brandholmen 1:9 Pontong. 11, Nyköping 1962/1970 WL 251 7,464 97 7,812 4.1
9 Brädgården 3 Folkkungav. 1, Nyköping Tomt Other* 0.4
10–11 Fors 11 Repslagareg. 43, Nyköping 1929/1987 Offices 9,007 2,010 506 11,523 14.3
12 Furan 2 Domänv. 11, Nyköping 2001/2001 Other* 17 3,807 3,824 4.9
13 Glödlampan 16 Bagareg. 2, 4, Hamnv. 6, Nyköping 1929/1929 Retail 229 570 799 1.0
14 Glödlampan 17 Bagareg. 2, 4, Hamnv. 6, Nyköping 1929/1929 Offices 535 535 1.0
15 Gripen 1 V Storg. 25, Nyköping 1929/1986 Retail 643 523 1,166 1.7
16 Jarlen 1 Nyckelv. 14, Nyköping 1899/2003 Offices 680 680 0.7
17 Klädes handlaren 15
Brunnsg. 36, 38, 40. V. Storg. 24, 26, 28. V. Trädgårdsg. 39, 41
1962/1972 Retail 4,205 459 7,079 651 12,394 19.3
18 Kungshagen 1:6 Ö Skeppsbron 1, Ö Längdg 4, 6,
Nyköping
1929/1989 Offices 1,143 450 1,593 2.3
19 Lansen 13 Gasverksv. 2, Ö Längdg. 5 , 7, Nyköping 1977/1991 Offices 4,003 277 1,993 6,273 7.8
20–21 Mjölkflaskan 8 Bagareg. 3 A–C, Fruängsg. 4, Kungsg.
16, Nyköping
1929/1940 Offices 3,752 334 157 3,955 8,198 11.5
22 Nyköpings Bruk 1 V Kvarng. 64, Nyköping 1929/1983 Offices 1,854 20 270 2,144 3.2
23 Nyköpings Bruk 7 V Kvarng. 62, Nyköping 1910/1991 Offices 1,459 274 100 1,833 2.4
24 Skölden 2 Gasverksv. 15, Nyköping 1989/1989 Offices 1,927 73 2,000 1.8
25 Spelhagen 1:7 V Skeppsbron 6, Nyköping 1929/1929 WL 190 4,613 1,200 6,003 1.6
26 Spånten 7 Spelhagsv. 4, 6, 8, Nyköping 2009/2009 Retail 1,280 1,280 1.3
27–28 Standard 17 V Storg. 2–6, 8, 10, Bagareg. 29,
Fruängsg. 28, 30, Nyköping
1969/1993 Offices 3,057 44 2,975 550 6,626 10.2
29 Stensötan 5 Idbäcksv. 8 B, Nyköping 1971/1985 Retail 173 1,460 3,285 4,918 3.8
30 Säven 4 Norrköpingsv. 9, Nyköping 1987/1987 Other* 1,853 1,853 2.1
– Fabrikatet 1 Materialv. 3, Nyköping 1980/1980 WL 497 1,865 644 1,423 4,429 3.8
– Fabrikatet 4 Materialv. 3, Nyköping Tomt WL 0.0
– Fabrikatet 5 Materialv. 3, Nyköping Tomt WL 0.0
TOTAL NYKÖPING 47,419 34,340 22,145 21,076 124,980 133.2
* Consists of education, health, gym, housing, land aswell as other surfaces like laboratory, fair, mail and technical spaces. Acquisitions during 2018 A property can consist of a number of jointly administered properties or several large buildings.
Area, s.qm.
Rental value SEKmOffice
Warehouse/logistics
(WL) Retail Other*Area, s.qm.
TOTAL EAST REGION 323,839 227,130 87,401 95,575 733,946 736.5
TOTAL KLÖVERN 1,353,677 792,852 260,700 371,389 2,778,620 3,672
13SPECIFICATION OF PROPERTIESEast Region
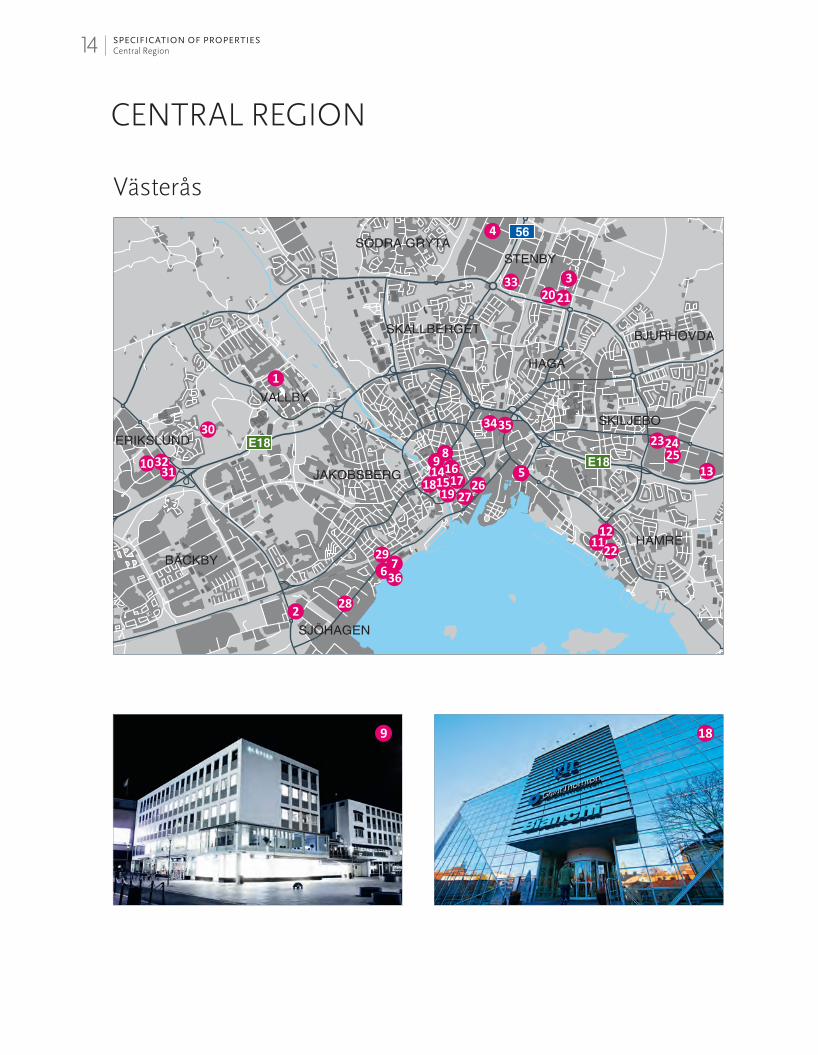
Västerås
CENTRAL REGION
14 SPECIFICATION OF PROPERTIESCentral Region

VÄSTERÅS
No Property Address
Site lease-hold
Buildingyear/valueyear
Type of property
Area, s.qm.
Rental value SEKmOffice
Warehouse/logistics
(WL) Retail Other* Area, s.qm.
1 Allmogekulturen 5 Svalgången, Västerås 1966/1991 Other* 5,338 636 8,958 14,932 11.2
2 Bogserbåten 1 Saltängsv. 22, Västerås Tomt Other* 0.0
3 Finnslätten 2 Hydrov. 1, 3, 5, 7, 9, Turbov. 2, 4, 6, Västerås
1966/1990 Offices 3,399 929 1,617 5,945 5.8
4 Friledningen 18 Elledningsg. 5B, Västerås 1988/1988 WL 940 940 0.4
5 Gastuben 5 Björnöv. 8, Västerås 1943/1943 Retail 2,442 2,442 2.1
6 Gustavsvik 13 Sjöhagsv. 3, 5, 7, Stensborgsg. 2, Västerås
1957/1962 Offices 12,871 11,482 450 5,053 29,856 18.4
7 Icander 1 Stensborgsg. 1, Västerås 1987/1987 Other* 3,000 3,000 5.1
8 Inge 10 Smedjeg. 8, Västerås 1939/1960 Other* 636 263 2,347 2,629 5,875 7.1
9 Klas 8 Smedjeg. 13, Västerås 1956/1956 Retail 1,309 196 2,196 1,774 5,475 8.8
10 Kranlinan 1 Traversg. 13, Västerås 2009/2009 WL 2,582 2,423 5,005 5.2
11–12 Kryssen 3 Regattag. 7–31, 33–53, Västerås 1940/1980 WL 4,798 10,253 220 4,193 19,464 12.7
13 Köpmannen 5 Hällag. 10, Stockholmsv. 136, Västerås 1984/1984 Retail 14,442 2,300 16,742 19.3
14–17 Leif 19 Hantverkarg. 2, Västerås 1929/1964 Retail 5,328 979 7,924 6,869 21,100 36.1
18 Livia 16 Skomakarg. 2, Västerås 1992/1992 Offices 4,960 378 595 5,933 13.1
19 Manfred 6 Erik Hahrs gata 2, Västerås 1929/1987 Other* 2,016 183 2,076 4,275 5.6
20–21 Omformaren 6 Betongg. 1, Wijkmansg. 7, Västerås 1962/1985 Offices 5,914 3,847 9,761 6.1
22 Regattan 46 Regattag. 8–28 etc, Västerås 1940/1970 WL 3,087 8,418 111 11,616 7.1
23 Ringborren 13 Tallmätarg. 7, Västerås T 1930/1962 Offices 1,627 1,627 1.2
24–25 Ringborren 15 Tallmätarg. 8, Ringborreg. 1, Västerås 1960/1990 WL 8,302 9,860 1,069 378 19,609 16.2
26 Sigurd 3 Sigurdsg. 27, 29, 31, 33, 35, 37, Västerås 1932/1989 Retail 2,322 3,358 2,699 1,743 10,122 10.0
27 Sigurd 7 Sigurdsg. 23, Västerås 1929/1929 Other* 2,475 456 4,280 7,211 15.1
28 Sjöhagen 12 Sjöhagsv. 14, Västerås 1952/1980 WL 329 6,729 7,058 4.9
29 Stensborg 2 Sjöhagsv. 2, Västerås 1957/1977 Offices 756 134 890 1.0
30 Stensborg 4 Sjöhagsv. 4, Västerås 1989/1989 Other* 2,143 2,143 6.5
31 Traversföraren 1 Traversg. 2, Västerås 1988/1996 Retail 2,500 2,500 2.6
32 Traversföraren 3 Traversg. 4, Västerås 1990/1990 Retail 2,572 2,572 3.4
33 Turbinen 1 Stenbyg. 2–4, Västerås 1968/1986 WL 17,757 17,757 5.8
34–35 Verkstaden 11 Metallverksg. 19, 21, Pressverksg. 4, Västerås
1929/1956 WL 2,184 13,377 2,660 2,322 20,543 16.3
36 Västerås 2:5 Stensborgsg. 4, Västerås 1982/1989 Offices 1,450 1,450 1.5
– Högbo 1:22 Högbo 5, 6, 11, 13, 15, Falun 1929/1929 Other* 202 5,497 5,699 5.7
TOTAL VÄSTERÅS 69,101 92,959 44,650 54,832 261,542 254.6
* Consists of education, health, gym, housing, land aswell as other surfaces like laboratory, fair, mail and technical spaces. Acquisitions during 2018 A property can consist of a number of jointly administered properties or several large buildings.
15SPECIFICATION OF PROPERTIESCentral Region

Örebro
ÖREBRO
No Property Address
Site lease-hold
Buildingyear/valueyear
Type of property
Area, s.qm.
Rental value SEKmOffice
Warehouse/logistics
(WL) Retail Other* Area, s.qm.
1 Barkenlund 11 Vasastrand 11, Örebro 1934/1989 Offices 2,517 302 2,819 4.4
2 Bleckslagaren 3 Retailsg. 5, Örebro 1969/2007 WL 18,842 18,842 9.8
3 Forskarbyn 2 Forskarv. 1, 3, Örebro 1998/1998 Offices 5,202 47 136 5,385 7.8
4 Fåraherden 1 Riag. 1,3, Örebro 1992/1992 Offices 2,191 5 752 2,948 3.8
5 Importören 2 Skvadronv. 5, Örebro 1970/1970 WL 1,055 1,510 2,565 0.9
6 Karossen 19 Bettorpsg. 10, Örebro 1975/2006 WL 3,855 4,342 1,037 3,485 12,719 12.0
7 Karossen 32 Bettorpsg. 10, Örebro Tomt Other* 2,818 2,818 2.7
8 Karossen 5 Bettorpsg. 12 B–C, Örebro 2004/2009 Offices 2,768 206 2,153 5,127 7.1
9 Lantmannen 2 Radiatorv. 7, Skvadronv. 2, Örebro 1972/1974 WL 1,222 4,898 3,036 1,324 10,480 6.8
10 Olaus Petri 3:234 Ö Bang. 7, Örebro 1979/1979 Other* 2,034 2,437 9 4,421 8,901 6.7
11 Oxbacken 7 Krontorpsg. 1, Örebro 1981/1988 Offices 2,942 2,942 4.6
12 Pigan 1 Riag. 53, Örebro 1992/1992 Offices 931 931 0.9
13 Vindrutan 1 Västhagag. 3, Örebro 1975/1992 Retail 85 1,230 1,315 2.3
14 Vindtunneln 1 Skäpplandsg. 1A–C, Örebro 1989/1989 Offices 3,318 51 3,369 3.9
TOTAL ÖREBRO 28,035 32,725 5,448 14,953 81,161 73.8
* Consists of education, health, gym, housing, land aswell as other surfaces like laboratory, fair, mail and technical spaces. Acquisitions during 2018 A property can consist of a number of jointly administered properties or several large buildings.
Area, s.qm.
Rental value SEKmOffice
Warehouse/logistics
(WL) Retail Other* Area, s.qm.
TOTAL CENTRAL REGION 97,136 125,684 50,098 69,785 342,703 328.4
TOTAL KLÖVERN 1,353,677 792,852 260,700 371,389 2,778,620 3,672
16 SPECIFICATION OF PROPERTIESCentral Region

HALMSTAD
No Property Address
Site lease-hold
Buildingyear/valueyear
Type of property
Area, s.qm.
Rental value SEKmOffice
Warehouse/logistics
(WL) Retail Other* Area, s.qm.
1 Eketånga 24:37 Kristinebergsv. 18–20, Halmstad 1989/1990 WL 611 1,107 1,718 1.0
2 Eketånga 24:49 Kristinebergsv. 22, Halmstad 1989/1989 WL 1,808 3,449 5,257 2.5
3 Eketånga 5:417 Industriv. 1, Halmstad 1962/1962 WL 267 3,285 3,552 1.6
4 Fläkten 1 Svetsareg. 16, Halmstad T 1974/1974 WL 12,200 12,200 4.5
5 Fotbollen 17 Bolmeng 11, Halmstad 1929/1929 Offices 480 480 0.4
6 Fregatten 7 Svetsareg. 8, Halmstad 1978/1978 Offices 1,517 1,517 1.1
7 Halmstad 2:25 Stationsg. 37, Halmstad Tomt Other* 0.0
8–10 Halmstad 2:28 Stationsg. 37, Halmstad 1920/1929 WL 2,345 10,320 1,915 200 14,780 17.3
11 Halmstad 2:49 Strandg 1, 3, Halmstad 1911/1953 Offices 3,025 3,025 6.1
12 Järnvägen 3 Gamletullsg. 12,14 2017/2017 Offices 4,431 1,053 5,484 11.4
13 Orkanen 1 Stationsg. 52, Halmstad 1930/1930 WL 183 967 256 1,406 0.5
14 Orkanen 2 Stationsg. 50, Halmstad 1948/1948 WL 1,300 1,300 0.4
15 Ostkupan 3 Stålverksg. 1, Halmstad 1950/1950 Offices 6,884 5,756 12,640 5.6
16 Slåttern 2 Kundv. 15, Halmstad 2008/2008 Retail 3,616 3,616 3.5
TOTAL HALMSTAD 21,551 38,384 5,531 1,509 66,975 56.0
* Consists of education, health, gym, housing, land aswell as other surfaces like laboratory, fair, mail and technical spaces. Acquisitions during 2018 A property can consist of a number of jointly administered properties or several large buildings.
Halmstad
SOUTH REGION
17SPECIFICATION OF PROPERTIESSouth Region
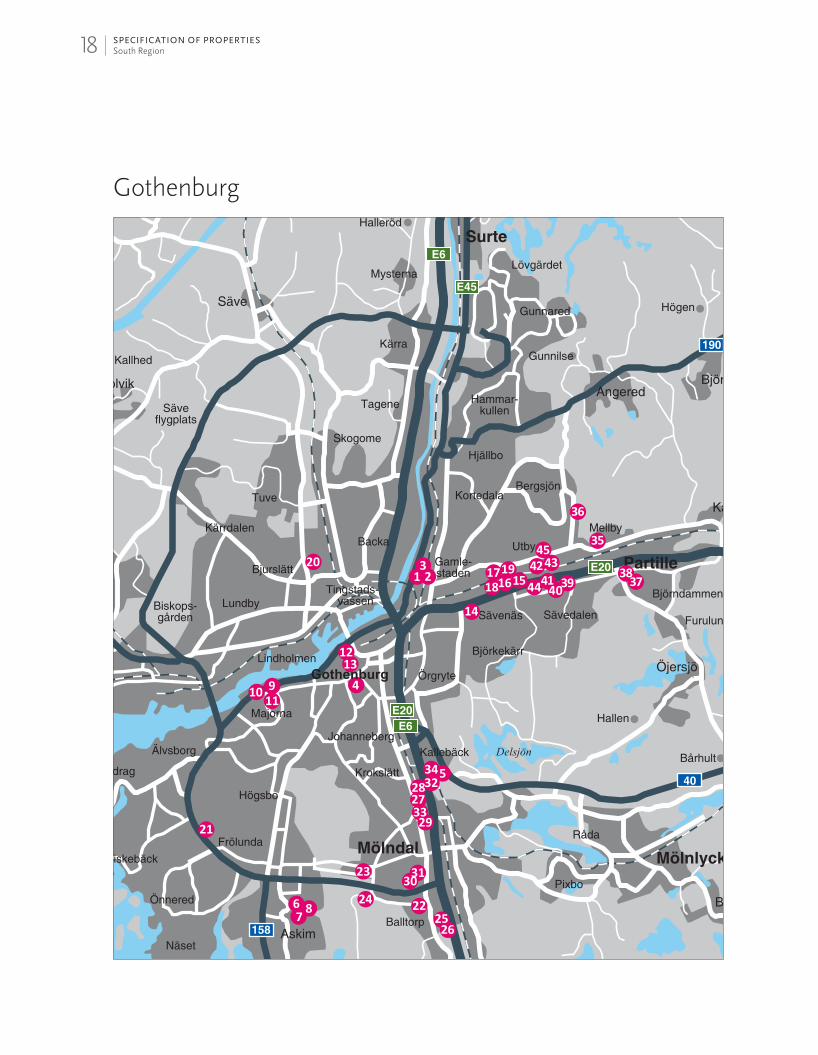
Gothenburg
18 SPECIFICATION OF PROPERTIESSouth Region

GOTHENBURG
No Property Address
Site lease-hold
Buildingyear/valueyear
Type of property
Area, s.qm.
Rental value SEKmOffice
Warehouse/logistics
(WL) Retail Other* Area, s.qm.
1–2 Gamlestaden 39:13 Slakthusg. 8, Gothenburg 1963/1963 Offices 6,593 6,491 445 13,529 18.6
3 Gamlestaden 39:14 Slakthusg. 6, Gothenburg 1905/1952 WL 1,000 1,000 1.9
4 Inom Vallgraven 15:2
Drottningg. 28, Södra Hamng. 27, Gothenburg
2003/2003 Offices 4,123 217 4,340 13.4
5 Kallebäck 17:1 Solhusg. 11, Gothenburg 1992/2000 Offices 20,170 200 20,370 22.2
6–8 Kobbegården 6:141 Datav. 6, 8, 10, Gothenburg 1983/1983 Offices 10,499 1,982 1,195 13,676 14.8
9 Majorna 219:7 Fiskhamnsg. 6A–C, Skärgårdsg. 1, Gothenburg
T 2002/2002 Offices 11,679 1,933 1,897 201 15,710 27.2
10 Majorna 220:4 Fiskhamnsg. 2, Gothenburg 1986/1986 Offices 5,745 5,745 8.9
11 Majorna 220:5 Skärgårdsg. 4, Gothenburg 1990/1990 Other* 579 16 3,815 4,410 7.8
12 Nordstaden 18:3 Kronhusg. 7, Torgg. 17, Gothenburg 1985/1985 Offices 1,911 6 354 2,271 5.0
13 Nordstaden 18:4 Torgg. 19 , Gothenburg 1985/1985 Offices 0.0
14 Sävenäs 67:4 Torpavallsg. 11, 13 , Gothenburg 1982/1991 Offices 2,336 2,336 2.8
15 Sävenäs 169:1 von Utfallsg. 21, Gothenburg 1975/1975 WL 169 7,409 7,578 5.6
16 Sävenäs 170:12 von Utfallsg. 18, 20, Gothenburg 1990/1990 WL 884 3,178 4,062 3.3
17 Sävenäs 170:13 von Utfallsg. 16, 16A, Gothenburg 1979/1979 Offices 1,624 465 2,089 1.9
18 Sävenäs 170:14 von utfallsg. 16B–C, Gothenburg 1991/1991 Offices 4,700 509 250 5,459 5.7
19 Sävenäs 170:17 von Utfallsg. 18, 20, Gothenburg 1990/1990 WL 0.0
20 Tuve 86:2 Hildedalsg. 1, Gothenburg T 2007/2007 WL 5,301 5,301 4.8
21 Tynnered 1:15 Femvägsskälet 4, Gothenburg T 1979/1979 WL 2,600 2,600 2.5
22 Gastuben 3 Argong. 2D, Mölndal 1991/1994 Offices 5,990 5,990 8.7
23 Hårddisken 3 Alfag. 8, Mölndal 2012/2012 Offices 3,274 3,274 5.1
24 Mejramen 1 Lunnagårdsg. 4, Mölndal 1999/1999 Offices 8,123 2,617 312 117 11,169 14.1
25 Pottegården 2 Taljegårdsg. 1, Mölndal 1965/1965 WL 429 1,371 1,800 1.4
26 Pottegården 4 Kråketorpsg. 20, Mölndal 1991/1991 Offices 3,059 1,871 4,930 4.9
27 Spinnaren 5 Gothenburgsv. 44, Mölndal 1973/1973 WL 0.4
28 Stockrosen 2 Norra Åg. 40, Mölndal 1988/1988 Retail 1,102 1,937 3,039 4.3
29 Stockrosen 7 Norra Åg. 32, Mölndal 1947/1997 Offices 3,322 988 433 4,743 6.1
30 Travbanan 2 Åbyvägen, Mölndal Tomt 0.0
31 Travbanan 3 Åbyvägen, Mölndal Tomt 0.0
32 Törnrosen 4 Flöjelbergsg. 14C, Mölndal 1989/1989 Offices 2,683 777 0 3,460 4.3
33 Violen 1 Gothenburgsv. 40, Mölndal 1958/1980 Retail 718 238 956 1.3
34 Ängsviolen 1 Flöjelbergsg. 18, Mölndal 1960/1960 WL 2,578 2,797 180 0 5,555 4.7
35 Mellby 3:198 Mellbyv. 21, 23, Partille 1967/1983 Other* 2,576 2,576 3.1
36 Mellby 5:120 Ögärdesv. 19, Partille 1990/1990 Offices 3,862 1,230 5,092 5.9
37 Partille 4:2 Kung Göstas v. 4, Partille Tomt Other* 0.0
38 Partille 4:25 Gamla Kronv. 22, Partille 1981/2008 Retail 2,500 2,500 4.2
39 Ugglum 1:76 Gothenburgsv.88, Tillfällav. 27–29, Partille
1988/1988 Retail 1,179 270 2,566 421 4,436 5.8
40 Ugglum 8:37 Tillfällav. 23–25, Partille 1937/1975 Offices 1,951 114 1,324 278 3,667 4.9
41 Ugglum 8:92 Tillfällav. 17–21, Partille 1992/1992 Offices 4,681 319 720 26 5,746 7.9
42 Ugglum 9:242 Industriv. 2, 4, 6, 51, 53, 55, 57, Partille 1989/1989 Offices 9,832 4,505 365 1,270 15,972 16.3
43 Ugglum 9:243 Industriv., Partille Tomt Other* 0.0
44 Ugglum 126:4 Gibsons v. 3, Partillee 1989/1989 Offices 468 468 0.5
45 Ugglum 7:117 Industriv. 39 1969/1999 WL 801 2,176 343 3,320 3.4
– Berg 1:82 Täljstensv. 1, Lerum 1999/1999 Other* 501 60 895 1,456 0.8
– Tollestorp 7:6 Tollestorpsv. 2A–F, Lerum 1990/1990 WL 3,197 3,197 1.8
– Ölslanda 1:255 Gråbov. 13, Lerum 1974/2011 Other* 121 3,358 3,479 3.3
– Ölslanda 10:81 Hantverksv. 21, Lerum 1990/1990 WL 1,716 1,716 0.9
TOTAL GOTHENBURG 124,847 54,898 15,089 14,183 209,017 260.4
* Consists of education, health, gym, housing, land aswell as other surfaces like laboratory, fair, mail and technical spaces. Acquisitions during 2018 A property can consist of a number of jointly administered properties or several large buildings.
19SPECIFICATION OF PROPERTIESSouth Region

Karlstad
20 SPECIFICATION OF PROPERTIESSouth Region

KARLSTAD
No Property Address
Site lease-hold
Buildingyear/valueyear
Type of property
Area, s.qm.
Rental value SEKmOffice
Warehouse/logistics
(WL) Retail Other* Area, s.qm.
1–2 Barkassen 7 Lagergrens g. 2, 4, Karlstad 1990/1990 Offices 11,675 98 569 12,342 19.3
3 Barkassen 9 Lagergrens g. 8, Karlstad 1991/1991 Offices 6,876 169 7,045 11.0
4 Björnen 13 Fredsg. 10, Karlstad 1906/1962 Offices 3,741 3,672 40 7,453 7.6
5 Björnen 7 Järnvägsg. 7, Karlstad 1965/1965 Offices 1,380 216 398 1,330 3,324 5.5
6 Blåsten 3 Stormg. 6, Karlstad 1975/1975 WL 473 1,615 2,088 1.3
7 Blåsten 4 Stormg. 8, Karlstad 1975/1979 Offices 1,988 428 2,416 1.2
8 Brisen 4 Sunnanvindsg. 8, Karlstad 1973/1978 Offices 1,045 1,045 1.1
9 Bromsen 1 Blockg. 6, Karlstad 1967/1967 Retail 359 861 1,220 0.9
10 Bromsen 6 Ramg. 7, Karlstad 1967/1977 WL 1,660 1,742 204 3,606 3.3
11 Bälgen 9 Sågverksg. 33, Karlstad 1959/1988 Offices 2,822 2,822 2.3
12 Bälgen 10 Sågverksg. 35, Karlstad 1959/1988 Offices 0.0
13 Bälgen 11 Elverumsg. 7, Karlstad 1959/1991 Offices 0.0
14 Druvan 13 Tingvallag. 17, Karlstad 1947/1947 Retail 1,993 245 1,666 348 4,252 6.7
15 Ekorren 11 Malmtorgsg. 6, Karlstad 1929/1992 Offices 4,330 222 2,068 6,620 9.6
16 Fjädern 14 Kolvg. 1, Karlstad 1966/1971 Retail 977 544 2,380 3,901 3.8
17 Fjädern 16 Bromsg. 4, Karlstad 1991/1991 Offices 2,679 1,653 4,332 4.0
18 Freja 13 Drottningg. 6, Karlstad 1965/1976 Offices 3,317 437 2,114 958 6,826 9.3
19 Grästegen 2 Stråg. 3, Karlstad 1990/1990 Offices 2,515 24 2,539 2.5
20 Gångjärnet 2 Blockg. 29, Karlstad T 1964/1974 WL 255 2,459 355 3,069 2.2
21 Hammaren 21 Gjuterig. 27, 29, Karlstad 1990/1990 WL 774 1,172 1,946 1.5
22 Herrhagen 1:10 Hamnpirsg. 4, Karlstad T 1986/1987 Other* 475 1,040 1,515 2.0
23 Hybelejen 17 Verkstadsg. 20, Karlstad 1929/1985 Offices 2,823 98 2,921 3.3
24 Kanoten 10 Lagergrens g. 7, Karlstad 1989/1989 Offices 8,719 765 477 111 10,072 11.1
25 Vänersnipan 1 Kanikenäsbanken 12, Karlstad 1990/1990 Offices 8,894 8,894 5.4
26 Kulingen 4 Östanvindsg. 17, Karlstad 1976/1976 WL 7,715 450 8,165 4.7
27–28 Mercurius 3 V Torgg. 10–12, Karlstad 1929/1939 Retail 711 102 1,792 2,605 4.9
29 Monitorn 9 Ö Torgg. 2A, Karlstad 1993/1993 Offices 3,013 107 344 3,464 6.0
30 Passadvinden 3 Regnvindsg. 17, Karlstad 1990/1990 WL 309 3,375 3,684 2.8
31 Pinassen 2 Tullhusg. , Karlstad 2017/2017 Offices 11,917 15 1,344 996 14,272 31.5
32 Regnvinden 1 Dagvindsg. 7, Karlstad 1981/2005 WL 3,966 6,017 9,983 7.0
33 Skepparen 15 Orrholmsg. 4, 6, Tullhusg. 6, Sjömansg. 1, Karlstad
1954/1954 Other* 2,969 430 570 18,080 22,049 20.1
34 Släggan 13 Sågverksg. 20, Karlstad 1981/1981 WL 302 882 566 1,750 1.0
35 Spärren 7 Rattg. 6, Karlstad 1968/1968 Offices 834 598 476 1,908 1.5
36 Stolpen 1 Ventilg. 5, Karlstad 1964/1964 Offices 3,779 343 4,122 4.1
37 Stolpen 6 Ventilg. 1, Karlstad 1991/1991 Offices 598 598 0.8
38 Styrmannen 5 Hamntorget 1–3, Karlstad 1991/1991 Offices 6,266 1,099 23 7,388 10.1
39 Sågen 1 Faktorig. 13, Industrig. 1, Karlstad T 1986/1986 Offices 3,213 3,213 3.1
40 Sågen 2 Faktorig. 15, Karlstad 1988/1988 Offices 1,611 1,611 1.5
41 Sågen 9 Lantvärnsg. 8, Karlstad 1972/1972 Offices 1,214 1,087 2,301 2.2
42 Tornadon 2 Blekeg. 9, Karlstad 1975/1975 WL 303 12,854 13,157 7.3
43 Tången 15 Gjuterig. 28, Karlstad 1991/1991 Offices 984 490 500 1,974 1.4
44 Ugnen 1 Sågverksg. 32, Karlstad 1989/1989 Offices 880 807 1,687 1.3
TOTAL KARLSTAD 112,164 50,302 16,719 24,994 204,179 226.1
* Consists of education, health, gym, housing, land aswell as other surfaces like laboratory, fair, mail and technical spaces. Acquisitions during 2018 A property can consist of a number of jointly administered properties or several large buildings.
21SPECIFICATION OF PROPERTIESSouth Region
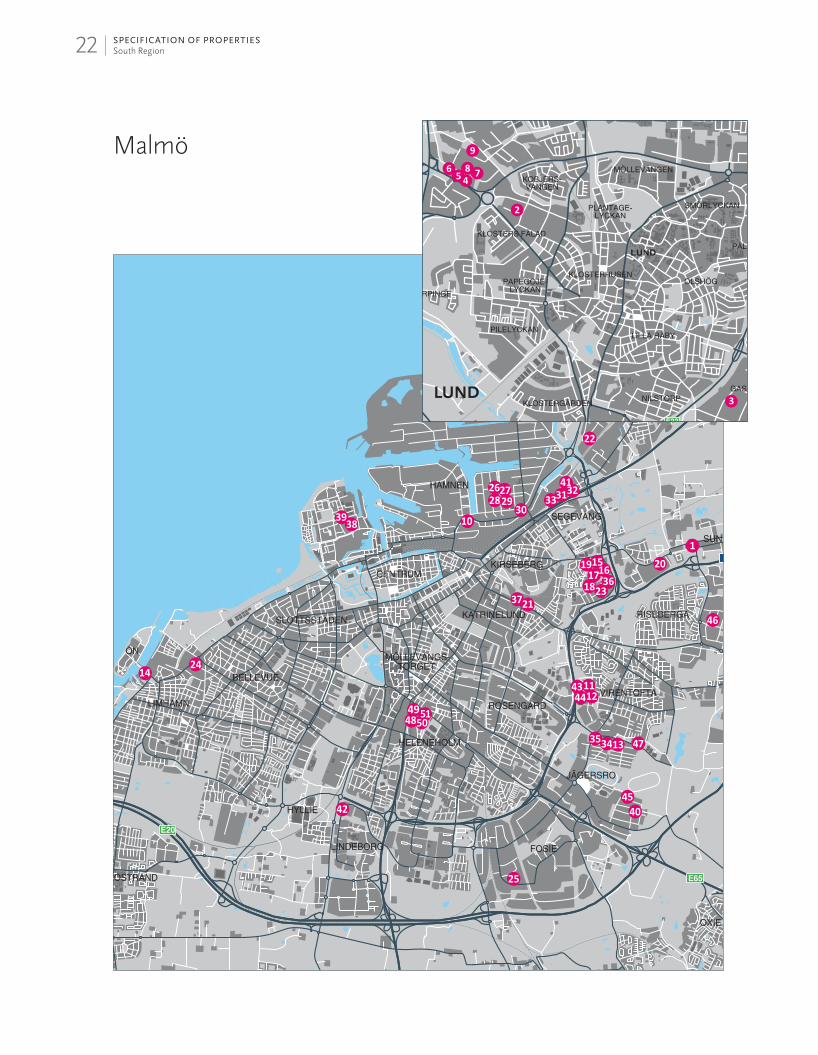
Malmö
LUND
22 SPECIFICATION OF PROPERTIESSouth Region

MALMÖ
No Property Address
Site lease-hold
Buildingyear/valueyear
Type of property
Area, s.qm.
Rental value SEKmOffice
Warehouse/logistics
(WL) Retail Other* Area, s.qm.
1 Sunnanå 12:26 G:a Staffanstopsv., Burlöv Tomt Other* 0.0
2 Annedal 9 Annedalsv. 2B, Lund 1990/1990 WL 1,296 1,296 1.5
3 Kvartsen 6 Skifferv. 25, Lund 1992/1992 WL 5,010 5,010 4.7
4–5 Traktorn 4 Traktorv. 13, Lund 1983/1983 Offices 6,974 1,346 5,650 13,970 17.4
6 Trumlan 1 Traktorv. 19, Lund 1991–1994/ 1991–1994
WL 350 1,263 904 2,517 2.9
7 Välten 4 Traktorv. 8, Lund 2004/2004 WL 3,100 3,100 3.4
8 Välten 5 Traktorv. 10, Lund 1974/1987 WL 3,645 3,645 3.4
9 Årdret 12 Höstbruksv. 14, Lund 1991/1991 WL 281 1,768 2,049 2.3
10 Betongen 11 Krang. 4, Malmö T 1992/1992 Offices 4,872 37 4,909 7.9
11 Brandnävan 1 Stenbärsg. 3, Malmö T Tomt Other* 0.0
12 Brandnävan 2 Stenbärsg. 1, Malmö T 1989/1989 Offices 2,550 272 2,822 2.8
13 Brudbuketten 11 Derbyv. 24, Russg. 8, Malmö 1988/1988 Offices 1,346 1,346 1.7
14 Dragör 1 Öv. 6, Malmö 2014/2014 Offices 1,708 130 536 2,374 6.4
15–16 Flygfyren 1 Höjdroderg. 29, Flygfältsv. 1, Malmö 1955–2004/ 1955–2004
WL 360 8,463 3,325 12,148 11.6
17 Flygfyren 3 Höjdroderg. 25, Malmö 1990/1990 Offices 3,301 1,328 595 5,224 5.7
18 Flygledaren 3 Höjdroderg. 18, Malmö T 1990–2000/ 1990–2000
WL 745 852 1,597 2.0
19 Flygvärdinnan 4 Vattenverksv. 47, Höjdroderg. 30–34, Malmö
T 1940–2001/ 1978–2001
Offices 6,309 2,739 210 9,258 14.6
20 Fältsippan 8 Regnvatteng. 2, Rimfrostg. 1, Malmö 1990/1990 WL 3,975 3,975 3.6
21 Getingen 5 Sallerupsv. 90, Singelg. 1, 3, 5, Malmö T 1962/1962 WL 5,455 2,890 8,345 4.3
22 Haken 3 Vinkelg. 5, Malmö T 1972/1972 WL 100 3,341 3,441 1.8
23 Höjdrodret 3 Kabing. 11, Malmö 1990/1990 Offices 1,182 162 1,344 1.7
24 Kajan 33 Limhamnsv. 104, Malmö Tomt Other* 0.0
25 Krukskärvan 9 Stenyxeg. 32, Malmö T 1981/1981 WL 2,680 2,680 2.2
26–29 Kullen 1 Hanög. 9, 11, Kosterög. 11, 13, 15, Malmö
1961/1961 WL 4,833 79,382 1,285 85,500 31.0
30 Lillgrund 5 Borrg. 31, Malmö 1952/1989 WL 4,430 4,430 3.7
31 Murman 7 Murmansg. 124 A–C, Kruseg. 25, Malmö
T 1959/1959 WL 2,186 4,324 6,510 5.0
32 Murman 8 Murmansg. 126, Kruseg. 27, Malmö 1960/1968 Offices 4,627 2,571 7,198 7.9
33 Murman 11 Murmansg. 118–120, Kruseg. 21, Malmö
T 1960/1960 WL 2,851 4,751 835 8,437 6.2
34 Nejlikebuketten 4 Derbyv. 6, Malmö 1991/1991 Offices 5,926 617 6,543 9.8
35 Nejlikebuketten 6 Derbyv. 4, Malmö 1987/1987 Offices 1,765 1,765 2.1
36 Skevrodret 1 Kabing. 9, Malmö 1978/1978 Offices 2,158 2,158 2.7
23SPECIFICATION OF PROPERTIESSouth Region

No Property Address
Site lease-hold
Buildingyear/valueyear
Type of property
Area, s.qm.
Rental value SEKmOffice
Warehouse/logistics
(WL) Retail Other* Area, s.qm.
37 Spindeln 2 Singelg. 2A–D, Stålkuleg. 2, Malmö T 1968/2001 WL 2,334 3,304 1,594 7,232 5.7
38 Stapelbädden 2 Östra Varvsg. 2, Malmö 2005/2005 Offices 4,492 4,492 11.0
39 Stapelbädden 4 Östra Varvsg. 4, Malmö 2008/2008 Offices 7,699 27 197 112 8,035 18.4
40 Stiglädret 10 Sadelg. 16, Betselg. 6A–B, Malmö T 1978/1978 WL 387 2,598 2,985 3.0
41 Stillman 40 Kruseg.34, Malmö 1961/1975 WL 479 1,308 1,787 1.8
42 Sufflören 4 Axel Danielssonsv. 261, Malmö 1988/1988 Offices 4,270 843 5,113 6.9
43 Svedjenävan 3 Stenbärsg. 4–6, Malmö 1991/1991 Offices 4,291 614 4,905 7.8
44 Svedjenävan 4 Stenbärsg. 2, Malmö T Tomt Other* 0.0
45 Tränsbettet 2 Travbaneg. 4, Malmö 1989/1989 WL 265 3,791 4,056 2.2
46 Ventilen 4 Kamaxelg. 7, 9, 11, Ventilg. 8, Malmö T 2003/2003 WL 621 1,771 2,392 2.3
47 Vårbuketten 3 Husiev. 21, Malmö 1992/1997 Other* 1,595 1,722 3,317 3.8
48–49 Västerbotten 11 Estlandsg. 2, 4, 6, Fosiev. 4, 6, 8, Malmö
1971/1971 Other* 2,159 5,112 892 6,571 14,734 15.0
50–51 Västerbotten 9 Ystadsv. 15, 17, 19, Fosiev. 2, Malmö 1929/1929 Retail 3,876 2,235 10,249 4,137 20,497 23.7
TOTAL MALMÖ 86,892 164,188 27,137 14,919 293,136 271.9
* Consists of education, health, gym, housing, land aswell as other surfaces like laboratory, fair, mail and technical spaces. Acquisitions during 2018 A property can consist of a number of jointly administered properties or several large buildings.
MALMÖ CONT.
Area, s.qm.
Rental value SEKmOffice
Warehouse/logistics
(WL) Retail Other* Area, s.qm.
TOTAL SOUTH REGION 345,454 307,772 64,476 55,605 773,307 814.4
TOTAL KLÖVERN 1,353,677 792,852 260,700 371,389 2,778,620 3,672
24 SPECIFICATION OF PROPERTIESSouth Region

COPENHAGEN
No Property Address
Site lease-hold
Buildingyear/valueyear
Type of property
Area, s.qm.
Rental value SEKmOffice
Warehouse/logistics
(WL) Retail Other* Area, s.qm.
1 24a Frederiksberg (1, 2)
Gammel Kongevej 60, Frederiksberg 1967/2004 Offices 29,086 1,590 433 31,109 92.7
2 26er, 26fg, 26fi Frederiksberg
Porcelænshaven 16A, 18A och 26, Frederiksberg
1922/2005 Other* 19,300 19,300 41.6
3 383 Eksercer-pladsen
Arne Jacobsens Allé 7, Copenhagen 2012/2012 Offices 14,730 932 15,662 37.2
4 3269b Vanløse Indertoften 10, Copenhagen 1964/1964 Offices 6,675 271 6,946 12.7
5 1kh Rudegård Ny Holte
Kongevejen 495B, Rudersdal 1994/1994 Offices 3,860 1,481 5,341 10.0
6 12p Vridslöse-lille By
Roskildevej 157, Albertslund 1982/2000 Offices 7,519 1,111 8,630 15.9
TOTAL COPENHAGEN 61,870 3,795 1,590 19,733 86,988 210
* Consists of education, health, gym, housing, land aswell as other surfaces like laboratory, fair, mail and technical spaces. Acquisitions during 2018 A property can consist of a number of jointly administered properties or several large buildings.
Copenhagen
Copenhagen
INTERNATIONAL
25SPECIFICATION OF PROPERTIESInternational

NEW YORK
No Property Address
Site lease-hold
Buildingyear/valueyear
Type of property
Area, s.qm.
Rental value SEKmOffice
Warehouse/logistics
(WL) Retail Other* Area, s.qm.
1 1241–1251 Broadway
1241–1251 Broadway, Manhattan – Mark –
2 322–326th Ave 322–326th Ave, Manhattan 1940 Offices 2,300 2,300 Evakuering pågår
TOTAL NEW YORK 2,300 2,300
* Consists of education, health, gym, housing, land aswell as other surfaces like laboratory, fair, mail and technical spaces. Acquisitions during 2018 A property can consist of a number of jointly administered properties or several large buildings.
New York
Area, s.qm.
Rental value SEKmOffice
Warehouse/logistics
(WL) Retail Other* Area, s.qm.
TOTAL INTERNATIONAL 64,170 3,795 1,590 19,733 89,288 210.1
TOTAL KLÖVERN 1,353,677 792,852 260,700 371,389 2,778,620 3,672
26 SPECIFICATION OF PROPERTIESInternational