specification and design of fiber reinforced bridge deck ...€¦ · specification and design of...
TRANSCRIPT
Specification and Design of Fiber
Reinforced BridgeDeck Forms for Use
on Wide FlangeT-Girders
m
a r g o r P h c r a e s e R
y a
w
h g i H
n i s n o c s i
W
WHRP 07-10
Lawrence C. Bank, Ajaya P. Malla, Michael G. Oliva,Jeffrey S. Russell, Arnon Bentur, Aviad Shapira
Department of Civil and Environmental EngineeringUniversity of Wisconsin-Madison
October 2007
SPR # 0092-06-07

i
Disclaimer This research was funded through the Wisconsin Highway Research Program by the Wisconsin Department of Transportation and the Federal Highway Administration under Project # 0092-06-07. The contents of this report reflect the views of the authors who are responsible for the facts and accuracy of the data presented herein. The contents do not necessarily reflect the official views of the Wisconsin Department of Transportation or the Federal Highway Administration at the time of publication. This document is disseminated under the sponsorship of the Department of Transportation in the interest of information exchange. The United States Government assumes no liability for its contents or use thereof. This report does not constitute a standard, specification or regulation. The United States Government does not endorse products or manufacturers. Trade and manufacturers’ names appear in this report only because they are considered essential to the object of the document.
ii
Technical Report Documentation Page Report No.WHRP 07-10 Government Accession No Recipient’s Catalog No
4. Title and Subtitle Specification and Design of Fiber Reinforced Bridge Deck Forms for Use on Wide Flange T-Girders
5. Report Date October 2007 6. Performing Organization Code Univ. of Wisconsin – Madison
7. Authors Lawrence C. Bank, Ajaya P. Malla, Michael G. Oliva, Jeffrey S. Russell, Arnon Bentur, Aviad Shapira
8. Performing Organization Report No.
9. Performing Organization Name and Address Department of Civil and Environmental Engineering University of Wisconsin-Madison
10. Work Unit No. (TRAIS) Contract or Grant No. WisDOT SPR# 0092-06-07
12. Sponsoring Agency Name and Address Wisconsin Department of Transportation Division of Business Services Research Coordination Section 4802 Sheboygan Ave. Rm 104 Madison, WI 53707
13. Type of Report and Period Covered
Final Report, 2005-2007 14. Sponsoring Agency Code
15. Supplementary Notes
16. Abstract Wide-flanged concrete girders are increasingly being used for highway bridges in Wisconsin. These girders are closely spaced and have very small clear gaps between the girder flanges making conventional plywood formwork difficult to install and uneconomical. Non-structural, non-metallic, stay-in-place (SIP) formwork may be more economical than conventional formwork in these situations; however a specification for their design and use in Wisconsin does not exist at this time. The objective of this research was to understand the state of the art of non-metallic SIP forms and to develop design guidelines and performance specifications that can be used locally for the construction of highway bridge decks. Four major types of SIP forms using fiber reinforced concrete (FRC) or fiber reinforced polymer (FRP) materials were investigated – fiber reinforcements, grid reinforcements, bar reinforcements and pultruded profiles. The results from static flexure tests and full-sized impact tests provided information on the strength, serviceability, ductility, toughness, and behavior under accidental impact loads of these SIP forms. The results were used to develop a model design and construction specification for non-structural, non-metallic, SIP forms in highway bridge decks. 17. Key Words Stay-in-place forms, bridge decks, wide flange girders, specifications, fiber reinforced concrete, fiber reinforced polymer.
18. Distribution Statement
No restriction. This document is available to the public through the National Technical Information Service 5285 Port Royal Road Springfield VA 22161
19. Security Classif.(of this report) Unclassified
19. Security Classif. (of this page) Unclassified
20. No. of Pages
21. Price
Form DOT F 1700.7 (8-72) Reproduction of completed page authorized

iii
Executive Summary PROJECT SUMMARY In this research study non-structural, non-metallic, stay-in-place (SIP) forms for use in construction of concrete highway bridge decks in Wisconsin were studied. Viable systems were identified, tested and classified for use in the State. A model specification for incorporation into contract documents or in the Wisconsin Specifications was developed. Wide-flanged concrete girders are increasingly being used for highway bridges in Wisconsin. These girders are closely spaced and have very small clear gaps between the girder flanges making conventional plywood formwork difficult to install and uneconomical. Non-structural, non-metallic, stay-in-place (SIP) formwork may be more economical than conventional formwork in these situations; however, a specification for their design and use in Wisconsin does not exist at this time. Four major types of SIP forms using fiber reinforced concrete (FRC) or fiber reinforced polymer (FRP) materials were investigated – fiber reinforcements, grid reinforcements, bar reinforcements and pultruded profiles. The results from static flexure tests and full-sized impact tests provided information on the strength, serviceability, ductility, toughness, and behavior under accidental impact loads of these SIP forms. The results were used to develop a design procedure and a model specification for non-structural, non-metallic, SIP forms in highway bridge decks. The ultimate purpose of this research was to develop a design procedure and specification for the use of non-structural, non-metallic, stay-in-place forms for construction of highway bridge decks on bulb-T prestressed concrete girders. BACKGROUND Wide-flange prestressed concrete girders (known as W54 and W72 girders) are being used in Wisconsin for highway bridge construction. These wide-flange “bulb-T” girders are torsionally more stable than conventional I-girders and also have larger moment capacities due to the larger compression flange that allows higher levels of prestress. This has led to longer girders with lengths of more than 150 ft. As the lengths get longer, the spacing between the girders gets narrower to accommodate larger dead and live load moments. For example, the De Neveu Creek bridge located near Fond du Lac, Wisconsin on U.S. Highway 151 constructed in 2004 utilized 130 ft long simply-supported W54 girders with clear spans between the flanges of adjacent girders of only 2 ft 5 in. Longer girder spans will further decrease the gap between the girders the flange edges (to as little as a few inches.) For the relatively small spans between the girders, conventional plywood forming used to cast the concrete bridge deck, may be both uneconomical and difficult to install. The conventional plywood forming system requires an elaborate and time consuming installation of a supporting hanger and joist system. Upon completion of deck casting, additional resources and time are required to strip the formwork from the underside of the bridge. The use of non-structural, non-metallic, fiber-reinforced, stay-in-place (SIP) formwork systems as replacements for the conventional systems were studied in this research.

iv
Local bridge contractors have recognized the benefit of being able to use thin stay-in-place formwork. In recent years a number of bridges have been built in the state that have used polypropylene fiber reinforced concrete (FRC) panels on a trial basis. These SIP formwork systems have been approved on a case-by-case basis by the WisDOT. No standard design procedure nor testing protocol has been followed for the trial applications The Wisconsin Department of Transport (WisDOT) recognized a need for a better understanding of the FRC panels that are currently being used by local bridge contractors. In addition, there was a need to investigate other possible SIP formwork systems rather than just FRC forms that were being proposed by the contractors. An investigation into the use of alternative thin stay-in-place (SIP) formwork with fibers or fiber reinforced polymer (FRP) composites as a non-corrosive reinforcing system was therefore conducted. While prior research projects have been undertaken to investigate highway bridge decks that have used FRP panels or prestressed concrete panels as a stay-in-place forms, this project was different because the formwork panels considered were not intended to be structural and carry the primary live loads of the bridge. They are referred to as non-structural or non-participating formwork systems. The research was primarily motivated by the desire of the WisDOT to develop a standard specification for use of fiber reinforced SIP forms in bridge deck construction in a safe and efficient manner. The research was conducted at the University of Wisconsin-Madison. It was funded by the Structures Technical Oversight Committee (TOC) of the WHRP and performed in cooperation with Bureau of Structures personnel (in particular Mr. Finn Hubbard and Mr. Scot Becker). Local bridge contractors (Lunda Construction and Zenith Tech) and a number of suppliers of fiber and fiber reinforced polymer producers (Strongwell, USG, Nippon Electric Glass, Propex, Grace, Techfab, Hughes Brothers, Saint Gobain) were active participants in the project. In addition to the UW researchers (A. Malla, L. Bank, M. Oliva, J. Russell) two expert consultants from the Technion in Israel were retained; Prof. A. Bentur an expert in fiber reinforced concrete and Prof. A. Shapira an expert in formwork systems. PROCESS The first phase of the research process consisted of gathering relevant background information. This included assembling a team of experts, reviewing the current state-of-the-art related to non-structural SIP formwork, visiting local bridge sites where FRC panels had been previously used, obtaining input from local bridge contractors and WisDOT experts, and obtaining input from technical experts on materials selection and loading requirements. The second phase consisted of the selecting candidate systems and conducting laboratory tests. This included obtaining materials, fabricating specimens, testing specimens under static and impact loads, analyzing the test data, conducting a cost analysis of the different systems, and developing theoretical models to predict the behavior of the test specimens. The third phase consisted of developing the model specification. This included classifying different types of SIP forms, proposing design procedures, identifying constructability concerns, drafting a preliminary specification, obtaining feedback from industry and the WisDOT, and finalizing a model specification for use by the WisDOT.
v
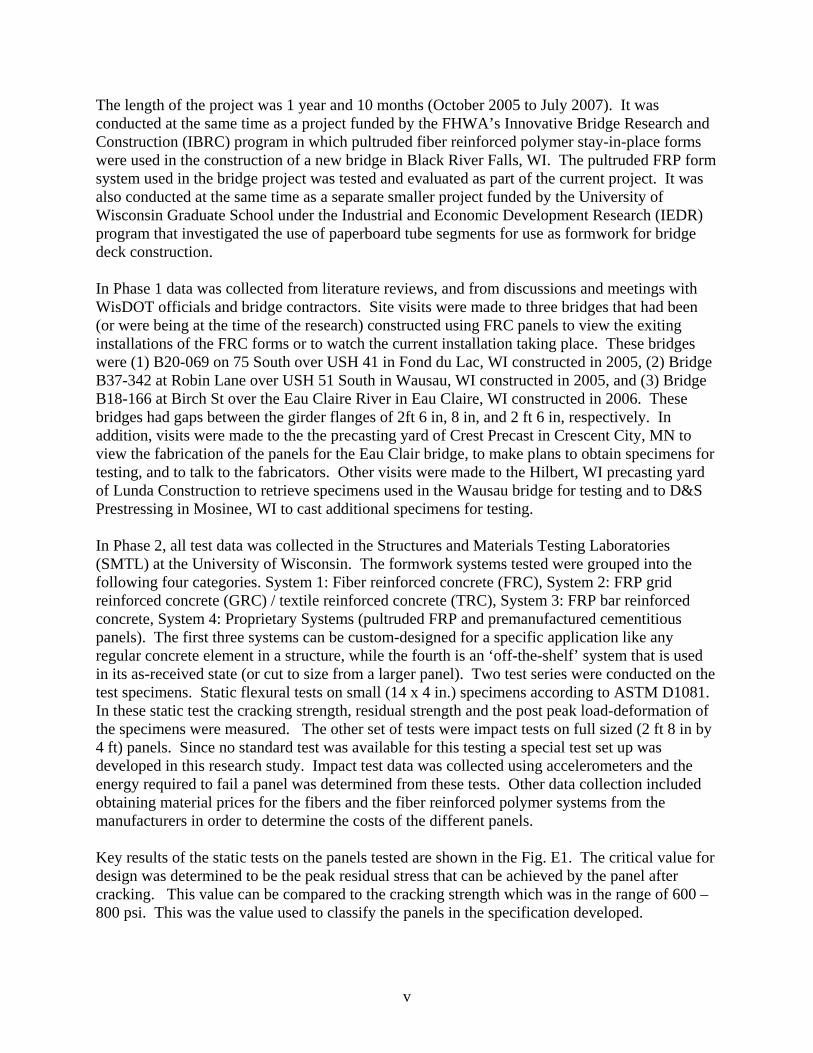
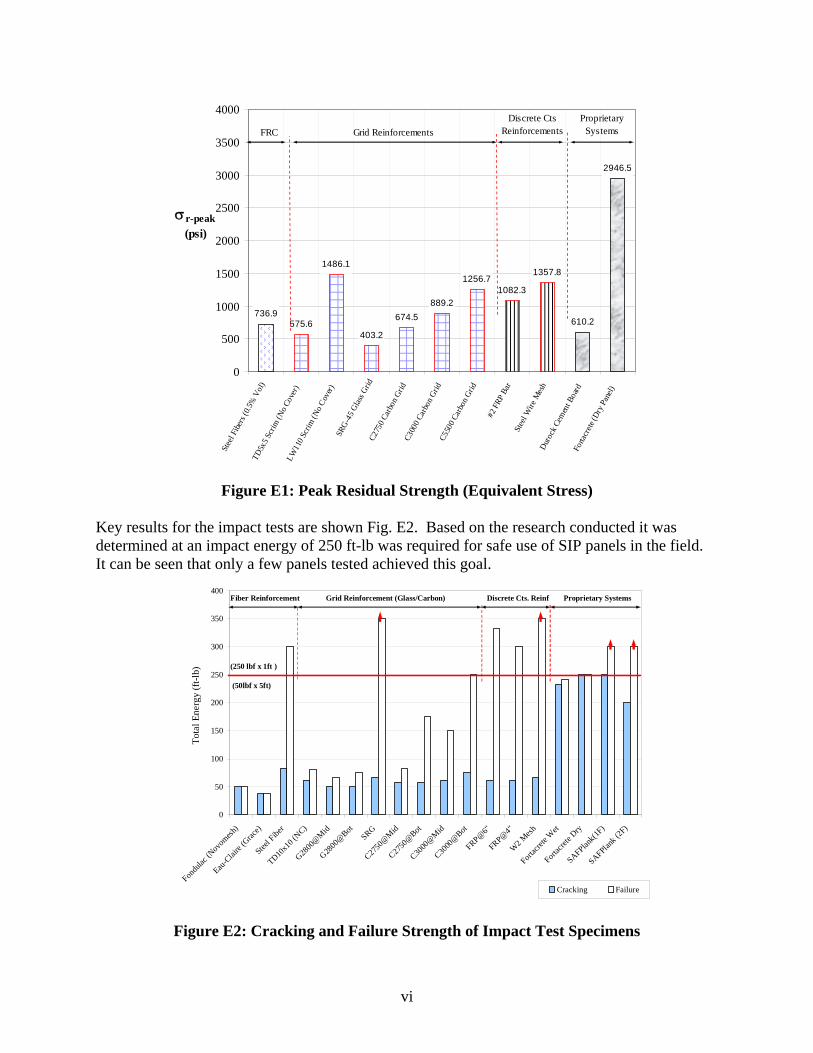
The length of the project was 1 year and 10 months (October 2005 to July 2007). It was conducted at the same time as a project funded by the FHWA’s Innovative Bridge Research and Construction (IBRC) program in which pultruded fiber reinforced polymer stay-in-place forms were used in the construction of a new bridge in Black River Falls, WI. The pultruded FRP form system used in the bridge project was tested and evaluated as part of the current project. It was also conducted at the same time as a separate smaller project funded by the University of Wisconsin Graduate School under the Industrial and Economic Development Research (IEDR) program that investigated the use of paperboard tube segments for use as formwork for bridge deck construction. In Phase 1 data was collected from literature reviews, and from discussions and meetings with WisDOT officials and bridge contractors. Site visits were made to three bridges that had been (or were being at the time of the research) constructed using FRC panels to view the exiting installations of the FRC forms or to watch the current installation taking place. These bridges were (1) B20-069 on 75 South over USH 41 in Fond du Lac, WI constructed in 2005, (2) Bridge B37-342 at Robin Lane over USH 51 South in Wausau, WI constructed in 2005, and (3) Bridge B18-166 at Birch St over the Eau Claire River in Eau Claire, WI constructed in 2006. These bridges had gaps between the girder flanges of 2ft 6 in, 8 in, and 2 ft 6 in, respectively. In addition, visits were made to the the precasting yard of Crest Precast in Crescent City, MN to view the fabrication of the panels for the Eau Clair bridge, to make plans to obtain specimens for testing, and to talk to the fabricators. Other visits were made to the Hilbert, WI precasting yard of Lunda Construction to retrieve specimens used in the Wausau bridge for testing and to D&S Prestressing in Mosinee, WI to cast additional specimens for testing. In Phase 2, all test data was collected in the Structures and Materials Testing Laboratories (SMTL) at the University of Wisconsin. The formwork systems tested were grouped into the following four categories. System 1: Fiber reinforced concrete (FRC), System 2: FRP grid reinforced concrete (GRC) / textile reinforced concrete (TRC), System 3: FRP bar reinforced concrete, System 4: Proprietary Systems (pultruded FRP and premanufactured cementitious panels). The first three systems can be custom-designed for a specific application like any regular concrete element in a structure, while the fourth is an ‘off-the-shelf’ system that is used in its as-received state (or cut to size from a larger panel). Two test series were conducted on the test specimens. Static flexural tests on small (14 x 4 in.) specimens according to ASTM D1081. In these static test the cracking strength, residual strength and the post peak load-deformation of the specimens were measured. The other set of tests were impact tests on full sized (2 ft 8 in by 4 ft) panels. Since no standard test was available for this testing a special test set up was developed in this research study. Impact test data was collected using accelerometers and the energy required to fail a panel was determined from these tests. Other data collection included obtaining material prices for the fibers and the fiber reinforced polymer systems from the manufacturers in order to determine the costs of the different panels. Key results of the static tests on the panels tested are shown in the Fig. E1. The critical value for design was determined to be the peak residual stress that can be achieved by the panel after cracking. This value can be compared to the cracking strength which was in the range of 600 – 800 psi. This was the value used to classify the panels in the specification developed.
vi
Figure E1: Peak Residual Strength (Equivalent Stress) Key results for the impact tests are shown Fig. E2. Based on the research conducted it was determined at an impact energy of 250 ft-lb was required for safe use of SIP panels in the field. It can be seen that only a few panels tested achieved this goal.
Figure E2: Cracking and Failure Strength of Impact Test Specimens
736.9575.6
1486.1
403.2
674.5889.2
1256.71082.3
1357.8
610.2
2946.5
0
500
1000
1500
2000
2500
3000
3500
4000
Stee
l Fibe
rs (0
.5% V
ol)
TD5x
5 Scr
im (N
o Cov
er)
LW11
0 Scr
im (N
o Cov
er)SR
G-45
Glas
s Grid
C275
0 Car
bon G
ridC3
000 C
arbo
n Grid
C550
0 Car
bon G
rid
#2 F
RP B
arSt
eel W
ire M
esh
Duro
ck C
emen
t Boa
rdFo
rtacr
ete (D
ry P
anel)
σr-peak(psi)
Discrete CtsReinforcementsGrid Reinforcements
Proprietary SystemsFRC
0
50
100
150
200
250
300
350
400
Fondu
lac (N
ovom
esh)
Eau-C
laire
(Grac
e)
Steel F
iber
TD10x1
0 (NC)
G2800
@Mid
G2800
@Bot
SRG
C2750
@Mid
C2750
@Bot
C3000
@Mid
C3000
@Bot
FRP@6"
FRP@4"
W2 M
esh
Fortacr
ete W
et
Fortacr
ete D
ry
SAFPlank(1
F)
SAFPlank (
2F)
Tota
l Ene
rgy
(ft-l
b)
Cracking Failure
Fiber Reinforcement Grid Reinforcement (Glass/Carbon) Discrete Cts. Reinf Proprietary Systems
(250 lbf x 1ft )
(50lbf x 5ft)
vii
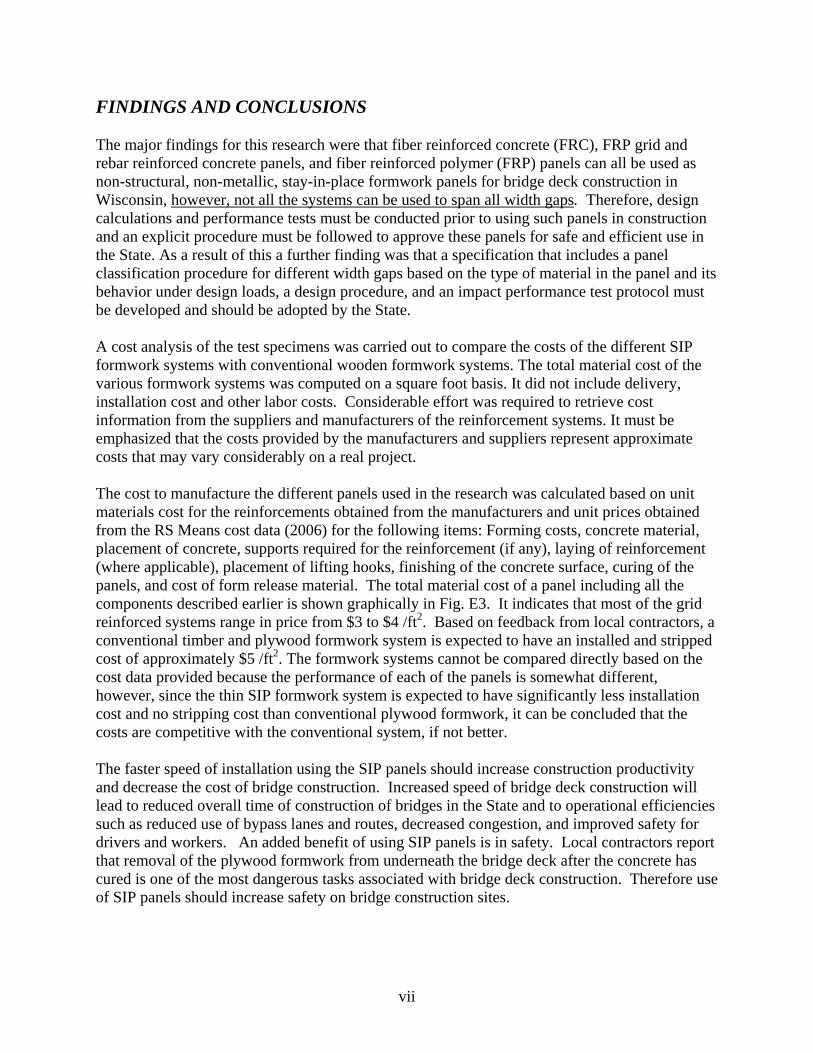
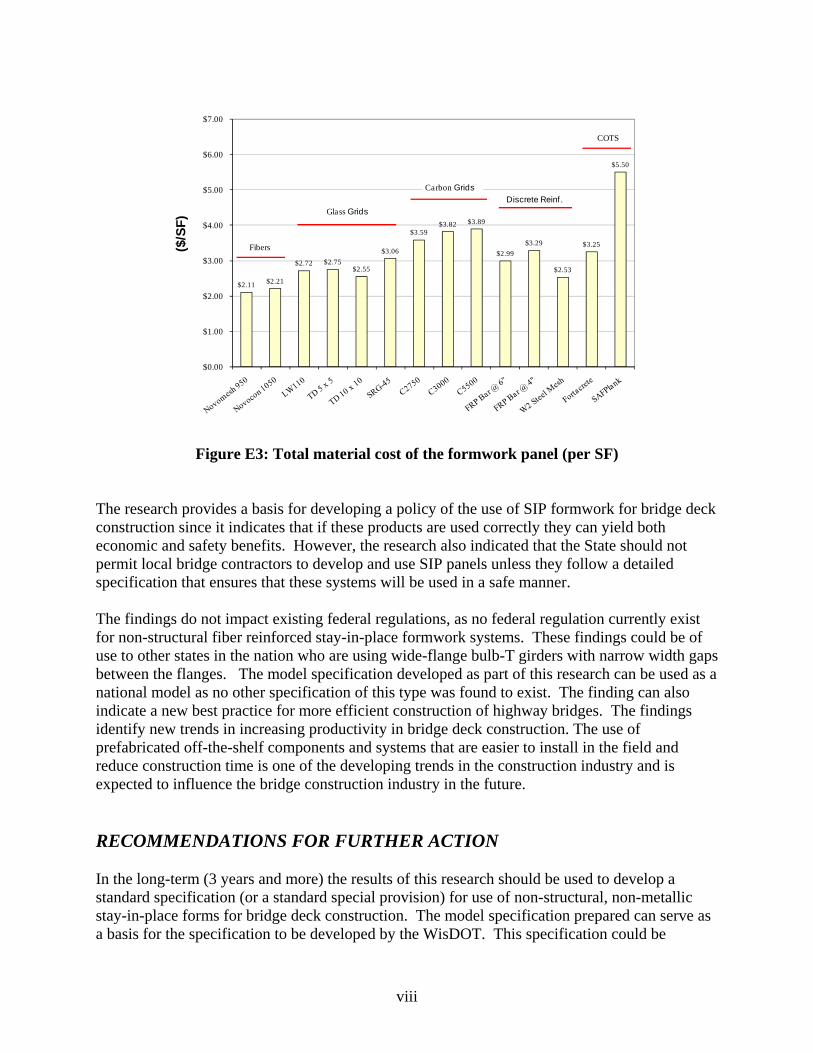
FINDINGS AND CONCLUSIONS The major findings for this research were that fiber reinforced concrete (FRC), FRP grid and rebar reinforced concrete panels, and fiber reinforced polymer (FRP) panels can all be used as non-structural, non-metallic, stay-in-place formwork panels for bridge deck construction in Wisconsin, however, not all the systems can be used to span all width gaps. Therefore, design calculations and performance tests must be conducted prior to using such panels in construction and an explicit procedure must be followed to approve these panels for safe and efficient use in the State. As a result of this a further finding was that a specification that includes a panel classification procedure for different width gaps based on the type of material in the panel and its behavior under design loads, a design procedure, and an impact performance test protocol must be developed and should be adopted by the State. A cost analysis of the test specimens was carried out to compare the costs of the different SIP formwork systems with conventional wooden formwork systems. The total material cost of the various formwork systems was computed on a square foot basis. It did not include delivery, installation cost and other labor costs. Considerable effort was required to retrieve cost information from the suppliers and manufacturers of the reinforcement systems. It must be emphasized that the costs provided by the manufacturers and suppliers represent approximate costs that may vary considerably on a real project. The cost to manufacture the different panels used in the research was calculated based on unit materials cost for the reinforcements obtained from the manufacturers and unit prices obtained from the RS Means cost data (2006) for the following items: Forming costs, concrete material, placement of concrete, supports required for the reinforcement (if any), laying of reinforcement (where applicable), placement of lifting hooks, finishing of the concrete surface, curing of the panels, and cost of form release material. The total material cost of a panel including all the components described earlier is shown graphically in Fig. E3. It indicates that most of the grid reinforced systems range in price from $3 to $4 /ft2. Based on feedback from local contractors, a conventional timber and plywood formwork system is expected to have an installed and stripped cost of approximately $5 /ft2. The formwork systems cannot be compared directly based on the cost data provided because the performance of each of the panels is somewhat different, however, since the thin SIP formwork system is expected to have significantly less installation cost and no stripping cost than conventional plywood formwork, it can be concluded that the costs are competitive with the conventional system, if not better. The faster speed of installation using the SIP panels should increase construction productivity and decrease the cost of bridge construction. Increased speed of bridge deck construction will lead to reduced overall time of construction of bridges in the State and to operational efficiencies such as reduced use of bypass lanes and routes, decreased congestion, and improved safety for drivers and workers. An added benefit of using SIP panels is in safety. Local contractors report that removal of the plywood formwork from underneath the bridge deck after the concrete has cured is one of the most dangerous tasks associated with bridge deck construction. Therefore use of SIP panels should increase safety on bridge construction sites.
viii
$2.11 $2.21
$2.72 $2.75 $2.55
$3.06
$3.59 $3.82 $3.89
$2.99 $3.29
$2.53
$3.25
$5.50
$0.00
$1.00
$2.00
$3.00
$4.00
$5.00
$6.00
$7.00
($/S
F)
Glass Grids
Carbon GridsDiscrete Reinf.
COTS
Fibers
Figure E3: Total material cost of the formwork panel (per SF) The research provides a basis for developing a policy of the use of SIP formwork for bridge deck construction since it indicates that if these products are used correctly they can yield both economic and safety benefits. However, the research also indicated that the State should not permit local bridge contractors to develop and use SIP panels unless they follow a detailed specification that ensures that these systems will be used in a safe manner. The findings do not impact existing federal regulations, as no federal regulation currently exist for non-structural fiber reinforced stay-in-place formwork systems. These findings could be of use to other states in the nation who are using wide-flange bulb-T girders with narrow width gaps between the flanges. The model specification developed as part of this research can be used as a national model as no other specification of this type was found to exist. The finding can also indicate a new best practice for more efficient construction of highway bridges. The findings identify new trends in increasing productivity in bridge deck construction. The use of prefabricated off-the-shelf components and systems that are easier to install in the field and reduce construction time is one of the developing trends in the construction industry and is expected to influence the bridge construction industry in the future. RECOMMENDATIONS FOR FURTHER ACTION In the long-term (3 years and more) the results of this research should be used to develop a standard specification (or a standard special provision) for use of non-structural, non-metallic stay-in-place forms for bridge deck construction. The model specification prepared can serve as a basis for the specification to be developed by the WisDOT. This specification could be

ix
included in the Bridge Manual or in the Wisconsin Specifications. This will permit alternative methods for bridge deck construction in the State. Based on this research these formwork systems are expected to be more economical than current systems used for forming narrow gaps between wide-flange girders. These new systems should also increase construction safety, reduce construction time and decrease traffic disruptions. In the short-term it is recommended that the model specification developed in this research be used on bridge construction projects in the state on a trial basis to determine its ease of use and relevance to the construction industry. It is also recommended that a follow on project be initiated to develop more specific data for the promising systems identified in the research. Given that this research study was the first of its kind many different systems were tested. However, based on the knowledge gained from the research it would be advisable to conduct additional testing and design studies to obtain data for specific panels that would be used in the future. This would allow systems (or manufacturers of premanufactured systems) to be pre-qualified for use in the State and reduce the amount of testing needed for every specific project. A demonstration project in which the promising systems are used in a new construction project is highly recommended in order to obtain constructability information on the use of the different types of systems. The WisDOT in partnership with the bridge contractors in the State are responsible for implementation of the results of this work. The implementation will depend on the WisDOT requiring the contractors to use the model specification developed and encouraging the use of SIP forms in construction of new bridges. This will not require any legislative or congressional action and should not require any federal regulatory changes. The WisDOT contact for more information is: Mr. Scot Becker Wisconsin Department of Transportation 4802 Sheboygan Avenue Madison, WI 53707-7965 Email: [email protected] The results of this research will be communicated by disseminating this report to district and local bridge offices. It is highly recommended at the workshop be held for bridge designers and bridge contractors to inform them of the potential to use SIP forms in bridge deck construction. It is anticipated that this project will be reviewed in a forthcoming WisDOT newsletter.

x
Table of Contents Page
Cover Page Disclaimer ..............................................................................................................................i Technical Report Documentation Page .................................................................................ii Executive Summary ..............................................................................................................iii Project Summary..............................................................................................................iii Background......................................................................................................................iii Process .............................................................................................................................iv Findings and Conclusions ................................................................................................vii Recommendations for Further Action .............................................................................viii Table of Contents...................................................................................................................x List of Tables .........................................................................................................................xii List of Figures ........................................................................................................................xiii 1. Introduction......................................................................................................................1 1.1 Statement of Problem..........................................................................................1 1.2 Research Objectives............................................................................................2 1.3 Scope of Work ....................................................................................................3 2. Background Information..................................................................................................4 2.1 Current Formwork Systems ................................................................................4 2.2 Design Responsibilities & Safety .......................................................................5 2.3 Stay-in-Place Formwork Systems.......................................................................6
2.3.1 Fiber Reinforced Concrete (FRC)..............................................................7 2.3.2 Textile Reinforced Concrete (TRC)............................................................10 2.3.3 FRP Thin Grid Reinforced Concrete (TGRC) ...........................................12 2.3.4 FRP Bar Reinforced Concrete ...................................................................13 2.3.5 FRP Pultruded Profiles ..............................................................................13 2.3.6 Proprietary cementitious systems ..............................................................15
2.4 Local Practices ....................................................................................................15 2.5 Existing Deficiencies ..........................................................................................23 3. Selection of SIP Formwork Systems ...............................................................................26 4. Design Considerations and Laboratory Testing...............................................................31
4.1 Design Considerations ........................................................................................31 4.2 Laboratory Testing .............................................................................................35
5. Static Flexure Tests..........................................................................................................62 5.1 Introduction.........................................................................................................62 5.2 Test Results .........................................................................................................64 6. Full Scale Impact Tests....................................................................................................73 6.1 Introduction..........................................................................................................73 6.2 Test Results..........................................................................................................73 7. Specification Development..............................................................................................79 8. Summary and Recommendations ....................................................................................97 8.1 Summary ..............................................................................................................97 8.2 Recommendations for Further Research.............................................................101 References..............................................................................................................................104

xi
Appendix A............................................................................................................................110 Draft Specification for the Design and Performance of Non-participating Fiber Reinforced Stay-in-place Formwork for Deck Slabs in Highway Bridges

xii
List of Tables Page Table 1: Mechanical properties of various fibers...............................................................8 Table 2: Local Bridges Studied..........................................................................................16 Table 3: Summary of Proposed Fiber Reinforcements for Testing ...................................27 Table 4: Summary of Grid Reinforcements .......................................................................27 Table 5: Proprietary Systems Evaluated ............................................................................30 Table 6: National Design Standards Reviewed..................................................................31 Table 7: Summary of construction live loads for formwork systems ................................32 Table 8: Final established static design construction live loads ........................................33 Table 9: Estimates of Impact Loads in Bridge Deck Construction....................................35 Table 10: Deflection Limits .................................................................................................35 Table 11: Accelerometers used for the Impact Test.............................................................43 Table 12: Summary of flexure tests carried out in the laboratory........................................45 Table 13: Summary of full scale impact tests carried out in the Laboratory .......................46 Table 14: Distribution of static flexure and impact load tests for the bridge SIP forms......47 Table 15: Specimen Identification and Test Type (Bridge SIP Form Panels).....................47 Table 16: Concrete mix Design and Cylinder Test Results for the bridge at Eau Claire (Courtesy - CREST Precast Inc) ..........................................................................48 Table 17: Concrete Mix Design and Compressive Strength................................................50 Table 18: Test Specimen Identification Information ...........................................................50 Table 19: Full Impact Test Specimen Identification with specimen details ........................54 Table 20: Concrete Mix Proportion (WSMTL Casting) ......................................................55 Table 21: Specimen Identification (WSMTL-1)..................................................................56 Table 22: Specimen Identification (SMTL-2)......................................................................58 Table 23: Specimen Identification marking (WSMTL-3) ...................................................60 Table 24: Summary of Proprietary Systems Tested.............................................................61 Table 25: Parameters evaluated from the static flexure tests...............................................62 Table 26: Evaluating the abscissa and ordinate values from the test results .......................70 Table 27: Comparison of experimental and theoretically computed critical stress .............72 Table 28: Total Energy to crack or fail the specimen ..........................................................75 Table 29: Categorization of formwork system into three distinct bands .............................77 Table 30: Constraints placed on the thin SIP formwork panels...........................................79 Table 31: Examples of possible dimensions of panels with the constraints ........................81 Table 32: SIP formwork classification.................................................................................84 Table 33: Critical span where uniformly distributed load governs......................................86 Table 34: SIP formwork groups based on ductility ratio limits ...........................................91 Table 35: Flexure and shear strength design........................................................................92
xiii
List of Figures Page Figure E1: Peak Residual Strength (Equivalent Stress).......................................................vi Figure E2: Cracking and Failure Strength of Impact Test Specimens.................................vi Figure E3: Total material cost of the formwork panel (per SF) ..........................................vii Figure 1: Conventional Plywood Formwork used for De Nevue Creek Bridge ...............1 Figure 2: Thin concrete SIP formwork being used in a bridge over Eau Claire River (B18-166) ...............................................................................2 Figure 3: FRP Deck Panels used as a structurally participating formwork in Waupun, WI over UH 51 (Berg, 2004) .............................................................................5 Figure 4: Stay-in-place Metal Deck Formwork (United Steel Deck Inc, 2007) ...............6 Figure 5: GRC Corrugated panels supporting 500mm of concrete (Source - BCMGRC
Brochure) ...........................................................................................................10 Figure 6: GRC panels Span Chart (BCMGRC Brochure 2007)........................................10 Figure 7: Cem Mesh and SRG-45 mesh from Saint Gobain .............................................11 Figure 8: TRC Formwork Panel (Brameshuber, 2002) .....................................................11 Figure 9: Integrated TRC formwork (Brameshuber, 2003)...............................................12 Figure 10: SIP Form system approved in Germany (Reinhardt, 2000)...............................12 Figure 11: C-Grid and MecGrid from TechFab ..................................................................13 Figure 12: C-Grid used in the slab of the double tee (From Altus Group Brochure)..........13 Figure 13: SafPlank manufactured by Strongwell (Photos from McNichols) ....................14 Figure 14: Use of SafPlank as formwork on a steel-free deck (B27-150 on U.S.H. 12 over Coffee Creek at Black River Falls .............................................................14 Figure 15: View of bridge from USH 41 from the East side (West bound traffic).............16 Figure 16: Bridge deck cross-section ..................................................................................17 Figure 17: View of one of the cracked panel from below (South Abutment).....................17 Figure 18: Crack in panel observed from the south abutment.............................................18 Figure 19: Completed Bridge at Wausau (Robin Lane over USH 51 South) .....................18 Figure 20: SIP Formwork Specification in the Contract (From bidding plan set) ..............19 Figure 21: Contractors SIP Formwork Proposal (Courtesy – Lunda Construction) ...........19 Figure 22: Field Installation of SIP Panels (Courtesy – Finn Hubbard, WisDOT).............20 Figure 23: View of the concrete SIP formwork from the underside of the Bridge .............20 Figure 24: Bridge cross-section from the contract drawing ................................................21 Figure 25: SIP Panel dimensions (left) with subsequent field installation (right) ..............21 Figure 26: Precast panels vibrated on metal forms with lifting hooks being placed...........22 Figure 27: Finished precast panels at Crest Precast Inc ......................................................22 Figure 28: Broken Panel with Simple Field Impact Load...................................................23 Figure 29: Panels that were broken during transportation (Eau Claire Bridge Site)...........23 Figure 30: Polystyrene foams used to haunch the slab (Eau Claire Bridge) .......................25 Figure 31: Fiber Reinforcements (Left – Novomesh 950 Synthetic Fiber, Propex Concrete Systems, Center – AR Glass Chopped Fibers, Nippon Glass; Right – Novocon 1050 Steel Fibers, Propex concrete systems .........................26 Figure 32: Proposed Grid Reinforcements: Row-1: D10x10 Scrim, C2750 Grid: Row–2: C3000 Grid, G2800 Grid: Row–3: C5500 Grid, SRG-45 Net .............28 Figure 33: Aslan 100 GFRP Bar (Left), D2.1 Steel Mesh (Gerdau Ameristeel) ................29 Figure 34: Proposed Proprietary SIP formwork systems for testing...................................29
xiv
Figure 35: Plan view sketch of formwork width with respect to girder orientation............33 Figure 36: Example of Parameter Calculation (Source - ASTM C 1609 -06) ....................37 Figure 37: Typical Load-Deflection Curve with pre-cracking (ASTM C1399-07) ............37 Figure 38: SINTECH machine with third-point loading.....................................................38 Figure 39: Sketch of the test set-up showing the key dimensions.......................................39 Figure 40: Specimen mounted on supports with LVDT attached during a test ..................39 Figure 41: INSTRON (30kip) Control Panel and X-Y Plotter (bottom) and load head (top)....................................................................................................................40 Figure 42: INSTRON Testing Frame with adjustable supports ..........................................41 Figure 43: Arrangement for Drop Test (Source – ACR [M]-001, 2000) ............................42 Figure 44: Test Fixture for Full -Sized Impact Tests ..........................................................43 Figure 45: Specimen Dimension and Impact Area for Full -Sized Impact Tests................44 Figure 46: Actual test specimen ready to receive impact load............................................44 Figure 47: SIP formwork panels from the Eau Claire Bridge and cut diagram for the static flexure test specimens...............................................................................48 Figure 48: Wausau Bridge SIP panels that were sourced from the Hilbert Plant (Lunda Construction) .........................................................................................49 Figure 49: Eau Claire Bridge SIP Panels obtained from the precaster (CREST Precast Inc, La Crescent, MN) ............................................................49 Figure 50: Formwork and materials for the test specimens (1 June 2006) .........................51 Figure 51: Portable Concrete Mixer (LHS) and air content being measured by Maxim Technologies representatives ................................................................52 Figure 52: Pre-stressing bed at Mosinee ready for the concrete pour (Panel position in the bed – Left Hand Side) .................................................................................52 Figure 53: FRP Reinforcement being pressed-down ½ in. from the surface using a metal frame ........................................................................................................53 Figure 54: Pouring concrete over the G2800 grid (0.5 in. cover) frame with welded #4 bars ...................................................................................................53 Figure 55: Finished Concrete Specimens ready for curing .................................................53 Figure 56: Casting specimens in laboratory .......................................................................56 Figure 57: Sectional view of the reinforcement in the full sized impact test specimen......57 Figure 58: Impact test panel with the sagging of the mesh (top-right) ...............................58 Figure 59: Half completed impact test panel with D2.1 wire mesh ....................................58 Figure 60: Two of the completed impact test panels (SMTL-2) .........................................59 Figure 61: Sketch of a load-deflection plot indicating the key data points for a specimen with a peak residual strength .............................................................63 Figure 62: Sketch of a load-deflection plot indicating the key data points for a specimen without a peak residual strength ........................................................64 Figure 63: Comparison of Tensile Rupture Stress Ratio.....................................................65 Figure 64: Ductility ratio comparison chart ........................................................................66 Figure 65: Peak residual strength deflection comparison....................................................67 Figure 66: Peak Residual Strength (Equivalent Stress).......................................................68 Figure 67: Energy Absorption Capacities (Toughness Values) ..........................................69 Figure 68: Straight line fit to load and deflection measurements........................................71 Figure 69: Representation of tested SafPlank by a single axi-symmetric section...............72 Figure 70: Buckled shapes of Specimens PF-3, PF-4 and PF-5 (l to r)...............................72
xv
Figure 71: Cracking and Failure Strength of Impact Test Specimens.................................75 Figure 72: Percentage increase in total energy (in decreasing order) .................................76 Figure 73: Sketch showing the wasted concrete on a typical wide flange girder................80 Figure 74: Plan view of SIP formwork indicating its dimensions.......................................81 Figure 75: Ratio of residual stress at L/150 to cracking stress (average values) ................82 Figure 76: Ratio of peak residual stress over cracking stress (average values) ..................83 Figure 77: Moment due to uniform live load and point live load (1.5 in FRC panel) ........85 Figure 78: Shear force due to uniform live load and point live load (1.5in. FRC Panel) ...85 Figure 79: Flexural stress demand at the extreme fiber (1.0 in, 1.5 in, 2.0 in thick) ..........86 Figure 80: Shear stress demand (1.0 in, 1.5 in and 2.0 in thick FRC panel).......................87 Figure 81: Ratio of capacity over demand for flexural and shear stresses..........................88 Figure 82: Extreme fiber stresses for SafPlank ...................................................................88 Figure 83: Ductility Ratio for reinforced formwork panels (from static flexural test) ......90 Figure 84: Expected maximum deflection (Class-A2)........................................................93 Figure 85: Total material cost of the formwork panel (per SF) ..........................................95 Figure 86: Experimental moment capacity per cost of panel (4ft x 32” x 1.5”) .................96
1
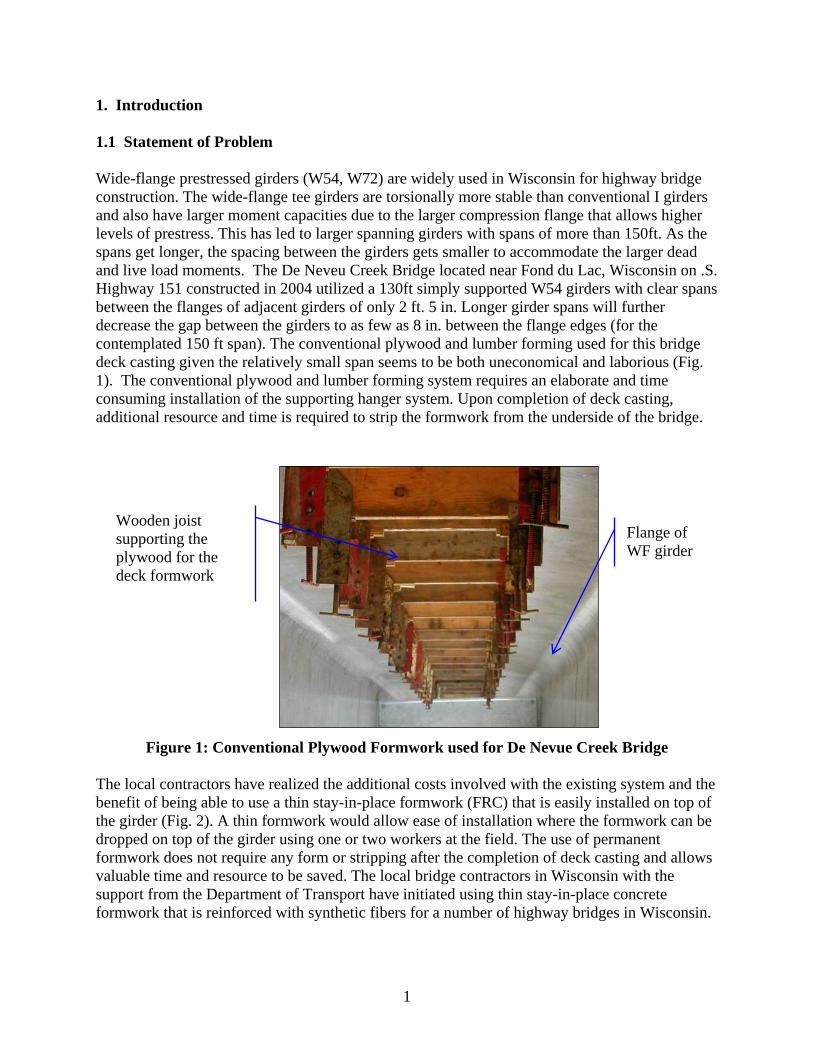
1. Introduction 1.1 Statement of Problem Wide-flange prestressed girders (W54, W72) are widely used in Wisconsin for highway bridge construction. The wide-flange tee girders are torsionally more stable than conventional I girders and also have larger moment capacities due to the larger compression flange that allows higher levels of prestress. This has led to larger spanning girders with spans of more than 150ft. As the spans get longer, the spacing between the girders gets smaller to accommodate the larger dead and live load moments. The De Neveu Creek Bridge located near Fond du Lac, Wisconsin on .S. Highway 151 constructed in 2004 utilized a 130ft simply supported W54 girders with clear spans between the flanges of adjacent girders of only 2 ft. 5 in. Longer girder spans will further decrease the gap between the girders to as few as 8 in. between the flange edges (for the contemplated 150 ft span). The conventional plywood and lumber forming used for this bridge deck casting given the relatively small span seems to be both uneconomical and laborious (Fig. 1). The conventional plywood and lumber forming system requires an elaborate and time consuming installation of the supporting hanger system. Upon completion of deck casting, additional resource and time is required to strip the formwork from the underside of the bridge.
Figure 1: Conventional Plywood Formwork used for De Nevue Creek Bridge The local contractors have realized the additional costs involved with the existing system and the benefit of being able to use a thin stay-in-place formwork (FRC) that is easily installed on top of the girder (Fig. 2). A thin formwork would allow ease of installation where the formwork can be dropped on top of the girder using one or two workers at the field. The use of permanent formwork does not require any form or stripping after the completion of deck casting and allows valuable time and resource to be saved. The local bridge contractors in Wisconsin with the support from the Department of Transport have initiated using thin stay-in-place concrete formwork that is reinforced with synthetic fibers for a number of highway bridges in Wisconsin.
Wooden joist supporting the plywood for the deck formwork
Flange of WF girder
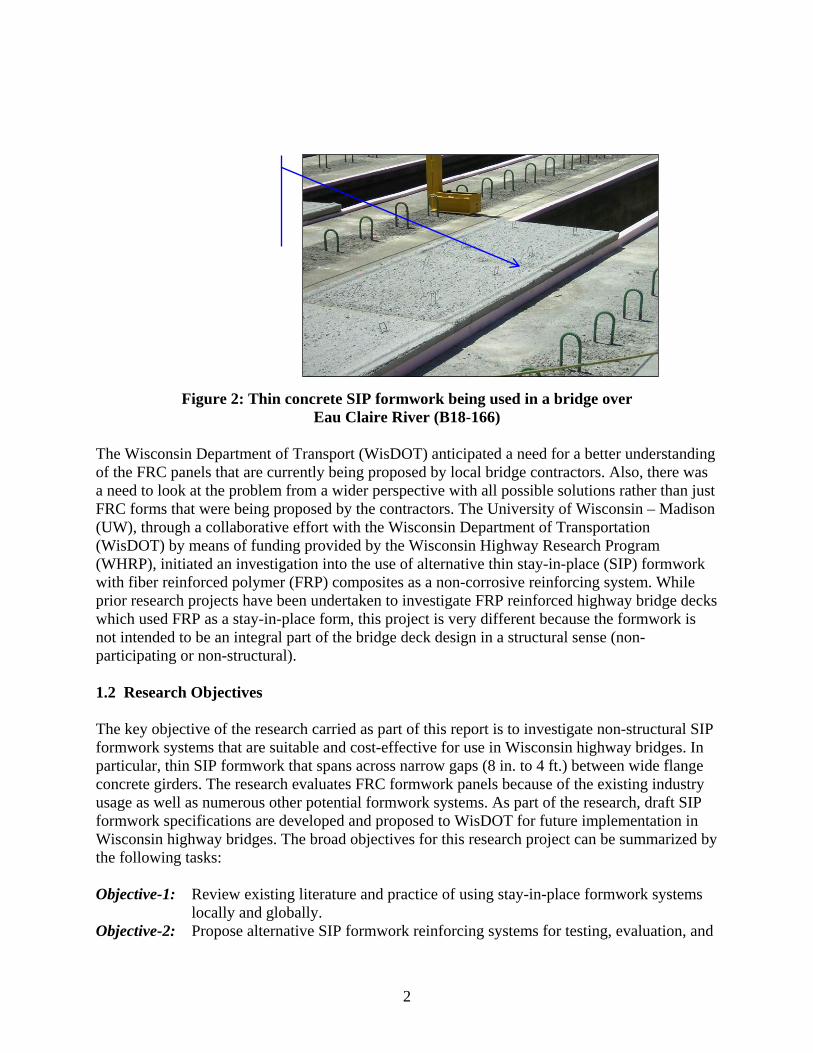
2
Figure 2: Thin concrete SIP formwork being used in a bridge over Eau Claire River (B18-166)
The Wisconsin Department of Transport (WisDOT) anticipated a need for a better understanding of the FRC panels that are currently being proposed by local bridge contractors. Also, there was a need to look at the problem from a wider perspective with all possible solutions rather than just FRC forms that were being proposed by the contractors. The University of Wisconsin – Madison (UW), through a collaborative effort with the Wisconsin Department of Transportation (WisDOT) by means of funding provided by the Wisconsin Highway Research Program (WHRP), initiated an investigation into the use of alternative thin stay-in-place (SIP) formwork with fiber reinforced polymer (FRP) composites as a non-corrosive reinforcing system. While prior research projects have been undertaken to investigate FRP reinforced highway bridge decks which used FRP as a stay-in-place form, this project is very different because the formwork is not intended to be an integral part of the bridge deck design in a structural sense (non-participating or non-structural). 1.2 Research Objectives The key objective of the research carried as part of this report is to investigate non-structural SIP formwork systems that are suitable and cost-effective for use in Wisconsin highway bridges. In particular, thin SIP formwork that spans across narrow gaps (8 in. to 4 ft.) between wide flange concrete girders. The research evaluates FRC formwork panels because of the existing industry usage as well as numerous other potential formwork systems. As part of the research, draft SIP formwork specifications are developed and proposed to WisDOT for future implementation in Wisconsin highway bridges. The broad objectives for this research project can be summarized by the following tasks: Objective-1: Review existing literature and practice of using stay-in-place formwork systems
locally and globally. Objective-2: Propose alternative SIP formwork reinforcing systems for testing, evaluation, and

3
further in-depth study. Objective-3: Analyze and evaluate proposed specimens experimentally and theoretically to
understand and categorize the behavior of the proposed reinforcement systems. Objective-4: Develop a design and performance specification for the use of SIP forms for
bridge decks for WisDOT. 1.3 Scope of Work There are many variables that affect the development of a cost-effective SIP formwork system. The key quantifiable variables are the span of the formwork and the maximum and minimum thickness of the formwork system. Without some form of practical constraint on these variables, the number of solutions would be too large to be undertaken as part of this research project. The following are the practical constraints that were imposed at the beginning of the research process in order to provide more focus to the research. 1. SIP formwork developed as part of this research would not be structurally integrated with the
design of the deck slab. This would imply that the formwork panel is ‘non-participating’ and would only serve to support the temporary construction loads.
2. Although maximum span limitations are not imposed, it is expected that a clear span of approximately 4 ft. is a reasonable practical value and has been used as a guide for analytical studies. It is to be noted that some of the proposed solutions can accommodate much larger spans.
3. The total thickness of the SIP formwork is limited to 1.5 in. for panels with a rectangular cross section (non- profiled shape). While the thickness is related to the stiffness required to span the required gap, it has a direct impact on the girder design for dead load and the constructability. The non-participating formwork design results in additional extra concrete dead load on top of the wide-flange girder (equal to the thickness of the SIP form) that reduces the efficiency of the girder design.
4. The overall weight of the panel is limited so as to enable two construction workers to install the panel. This translates to a maximum overall weight of the panel to be 200 lbf (approximate). One of the key advantages of using thin formwork panels is the ease of installation in the field and this constraint avoids any heavy lifting for the placement of formwork panels.
5. The SIP formwork and any reinforcement that are used as part of the formwork shall be non-corrosive. This constraint is part of the WisDOT’s requirements for the severe environment in the State due to the use of de-icing salt during the winter period.

4
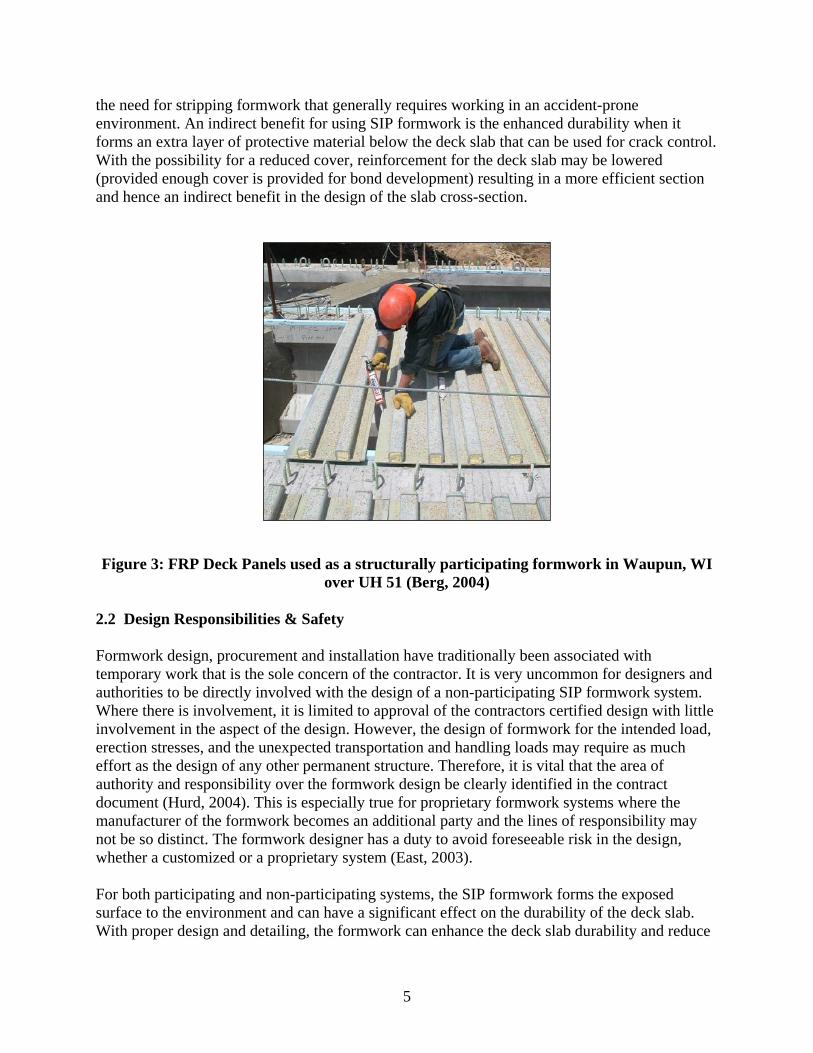
2. Background Information This Chapter provides the core background information for the research work carried out as part of this report. It forms a very valuable part of this research not just because it provides an understanding of the existing practice in thin SIP formwork but because it also forms the key drivers for the subsequent research work. The background research not only allowed the reinforcement systems for the experimental testing to be selected for further investigation, but it also allowed the draft specification to be formulated to suit the existing local practices. This Chapter has been broken down into two main parts. The first part explores the existing SIP formwork systems available in the market that can potentially be used in our particular application. The SIP formwork systems are reviewed and categorized based on the reinforcing system used; namely – fiber reinforced concrete, fiber reinforced polymer (FRP) textile and grid reinforced concrete panels, FRP bars, pultruded profiles, and proprietary systems that cannot be specifically classified. The second part of the literature review focuses on the existing practices in the State of Wisconsin. A review of the three local bridges studied is presented and is followed by a critique of the deficiencies that are apparent from the study. 2.1 Current Formwork Systems The cost of formwork in United States can be as much as 60% of the cost of the total cost of the completed concrete structure (ACI 347R-03). Forms for bridge construction are no exception and require careful thought and planning by all parties (engineer/architect as well as the formwork engineer/contractor). Bridge decks in the United States are typically constructed using the three main types; removable wooden formwork system, precast concrete deck panels, or corrugated metal stay-in-place formwork. Wooden formwork falls into the class of conventional formwork where the forms are used to temporarily support the concrete deck and removed following a predetermined gain in strength of the deck structure. Precast deck panels and corrugated metal deck panels are a common formwork system employed today and fall into the category of stay-in-place formwork (SIP) where it is left-in-place permanently in the structure after the completion of bridge deck casting. While the primary role of a formwork is to support the wet concrete until the deck is able to support itself, precast deck formwork serves a dual role by incorporating the tensile reinforcement of the bridge deck and acts in a composite manner with the top half of the bridge deck. On the other hand, corrugated metal panels used in bridge deck construction in the United States are limited to temporary applications where they do not contribute to the structural capacity of the bridge deck slab. There are many types of formwork systems used throughout the world. This report focuses on SIP formwork systems that do not behave compositely with the poured deck slab. Forms that make a pre-determined contribution to the strength of the composite section are termed, structurally participating (Wrigley, 2001). These types of formwork are used in the structural design of the bridge deck for ultimate strength or serviceability requirements (Fig. 3). Our focus for this research is directed solely towards the use of formwork for “structurally non-participating’’ applications where the formwork is assumed to make no contribution to the strength of the final bridge deck slab. While it does not have a direct beneficial effect on the deck slab design, it greatly boosts constructability in bridge sites and reduces labor costs. It also provides a safe construction method by providing instant work platforms for workers and avoids
5
the need for stripping formwork that generally requires working in an accident-prone environment. An indirect benefit for using SIP formwork is the enhanced durability when it forms an extra layer of protective material below the deck slab that can be used for crack control. With the possibility for a reduced cover, reinforcement for the deck slab may be lowered (provided enough cover is provided for bond development) resulting in a more efficient section and hence an indirect benefit in the design of the slab cross-section. Figure 3: FRP Deck Panels used as a structurally participating formwork in Waupun, WI
over UH 51 (Berg, 2004)
2.2 Design Responsibilities & Safety Formwork design, procurement and installation have traditionally been associated with temporary work that is the sole concern of the contractor. It is very uncommon for designers and authorities to be directly involved with the design of a non-participating SIP formwork system. Where there is involvement, it is limited to approval of the contractors certified design with little involvement in the aspect of the design. However, the design of formwork for the intended load, erection stresses, and the unexpected transportation and handling loads may require as much effort as the design of any other permanent structure. Therefore, it is vital that the area of authority and responsibility over the formwork design be clearly identified in the contract document (Hurd, 2004). This is especially true for proprietary formwork systems where the manufacturer of the formwork becomes an additional party and the lines of responsibility may not be so distinct. The formwork designer has a duty to avoid foreseeable risk in the design, whether a customized or a proprietary system (East, 2003). For both participating and non-participating systems, the SIP formwork forms the exposed surface to the environment and can have a significant effect on the durability of the deck slab. With proper design and detailing, the formwork can enhance the deck slab durability and reduce

6
maintenance costs in the bridge deck. Hence, SIP formwork should not be isolated as the sole responsibility of the contractor’s temporary works designer. To maximize the benefits of constructability and maintainability, the designer of the permanent structure should consider the intended construction method and maintenance requirements of the bridge deck slab in the design and detailing of both the girders and deck slab. In doing so, maximum benefit can be accrued by the client in terms of both cost and time. 2.3 Stay-in-Place Formwork Systems This section discusses the various generic formwork systems used in the United States and locally. Formwork systems are then categorized into distinct groups based on the material used with an elaborate discussion for each type. Precast concrete, precast-prestressed concrete, corrugated steel formwork and proprietary systems are common generic formwork systems. Precast-prestressed concrete formwork is typically used as a structurally participating formwork where the panels serve to support the topping that is placed above it and also acts as positive moment reinforcement for the deck slab. These panels are used extensively in Texas and have become the preferred option by bridge contractors in that State (Freeby, 2003). These types of formwork systems are also used in Wisconsin and specified in the Bridge Manual (1999). Steel deck forms for bridge deck slab formwork are used in at least 26 states in the United States based on survey carried out with State DOT agencies (Grace, 2004). These are typically profiled with some form of corrugation that are chamfered and closed at the ends to allow concreting on top (Fig. 4). As expected, the use of steel deck forms is more prevalent in the southern states where winter snow and the use of de-icing salt is not a durability concern. This type of formwork is not allowed in the State of Wisconsin because of corrosion and is not explored in this research.
Figure 4: Stay-in-place Metal Deck Formwork (United Steel Deck Inc, 2007) To provide more focus to the research, the literature review for this research is mainly focused on reviewing formwork systems that comply with the following criteria:
1. Stay-in-place 2. Structurally non-participating 3. Made of non-corrosive material 4. Thin panels which can be easily installed on site
7
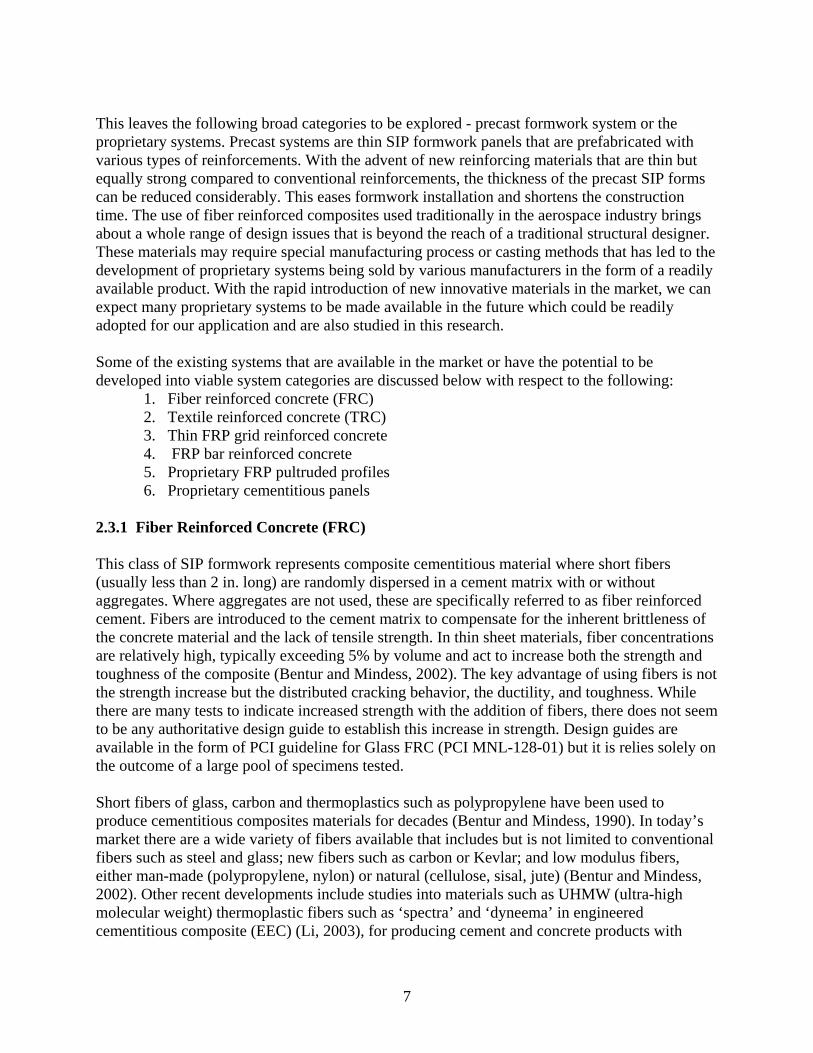
This leaves the following broad categories to be explored - precast formwork system or the proprietary systems. Precast systems are thin SIP formwork panels that are prefabricated with various types of reinforcements. With the advent of new reinforcing materials that are thin but equally strong compared to conventional reinforcements, the thickness of the precast SIP forms can be reduced considerably. This eases formwork installation and shortens the construction time. The use of fiber reinforced composites used traditionally in the aerospace industry brings about a whole range of design issues that is beyond the reach of a traditional structural designer. These materials may require special manufacturing process or casting methods that has led to the development of proprietary systems being sold by various manufacturers in the form of a readily available product. With the rapid introduction of new innovative materials in the market, we can expect many proprietary systems to be made available in the future which could be readily adopted for our application and are also studied in this research. Some of the existing systems that are available in the market or have the potential to be developed into viable system categories are discussed below with respect to the following:
1. Fiber reinforced concrete (FRC) 2. Textile reinforced concrete (TRC) 3. Thin FRP grid reinforced concrete 4. FRP bar reinforced concrete 5. Proprietary FRP pultruded profiles 6. Proprietary cementitious panels
2.3.1 Fiber Reinforced Concrete (FRC) This class of SIP formwork represents composite cementitious material where short fibers (usually less than 2 in. long) are randomly dispersed in a cement matrix with or without aggregates. Where aggregates are not used, these are specifically referred to as fiber reinforced cement. Fibers are introduced to the cement matrix to compensate for the inherent brittleness of the concrete material and the lack of tensile strength. In thin sheet materials, fiber concentrations are relatively high, typically exceeding 5% by volume and act to increase both the strength and toughness of the composite (Bentur and Mindess, 2002). The key advantage of using fibers is not the strength increase but the distributed cracking behavior, the ductility, and toughness. While there are many tests to indicate increased strength with the addition of fibers, there does not seem to be any authoritative design guide to establish this increase in strength. Design guides are available in the form of PCI guideline for Glass FRC (PCI MNL-128-01) but it is relies solely on the outcome of a large pool of specimens tested. Short fibers of glass, carbon and thermoplastics such as polypropylene have been used to produce cementitious composites materials for decades (Bentur and Mindess, 1990). In today’s market there are a wide variety of fibers available that includes but is not limited to conventional fibers such as steel and glass; new fibers such as carbon or Kevlar; and low modulus fibers, either man-made (polypropylene, nylon) or natural (cellulose, sisal, jute) (Bentur and Mindess, 2002). Other recent developments include studies into materials such as UHMW (ultra-high molecular weight) thermoplastic fibers such as ‘spectra’ and ‘dyneema’ in engineered cementitious composite (EEC) (Li, 2003), for producing cement and concrete products with
8
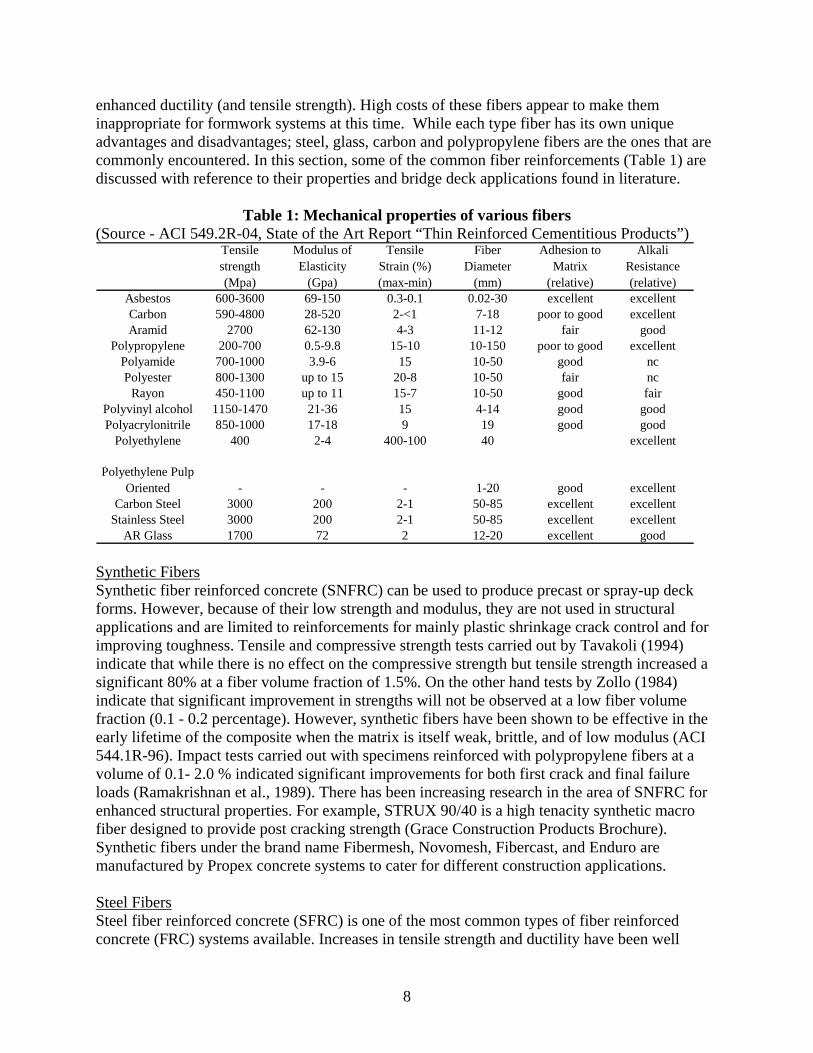
enhanced ductility (and tensile strength). High costs of these fibers appear to make them inappropriate for formwork systems at this time. While each type fiber has its own unique advantages and disadvantages; steel, glass, carbon and polypropylene fibers are the ones that are commonly encountered. In this section, some of the common fiber reinforcements (Table 1) are discussed with reference to their properties and bridge deck applications found in literature.
Table 1: Mechanical properties of various fibers (Source - ACI 549.2R-04, State of the Art Report “Thin Reinforced Cementitious Products”)
Tensilestrength(Mpa)
Modulus of Elasticity
(Gpa)
TensileStrain (%)(max-min)
FiberDiameter
(mm)
Adhesion to Matrix
(relative)
Alkali Resistance(relative)
Asbestos 600-3600 69-150 0.3-0.1 0.02-30 excellent excellentCarbon 590-4800 28-520 2-<1 7-18 poor to good excellentAramid 2700 62-130 4-3 11-12 fair good
Polypropylene 200-700 0.5-9.8 15-10 10-150 poor to good excellentPolyamide 700-1000 3.9-6 15 10-50 good ncPolyester 800-1300 up to 15 20-8 10-50 fair nc
Rayon 450-1100 up to 11 15-7 10-50 good fairPolyvinyl alcohol 1150-1470 21-36 15 4-14 good goodPolyacrylonitrile 850-1000 17-18 9 19 good good
Polyethylene 400 2-4 400-100 40 excellent
Polyethylene PulpOriented - - - 1-20 good excellent
Carbon Steel 3000 200 2-1 50-85 excellent excellentStainless Steel 3000 200 2-1 50-85 excellent excellent
AR Glass 1700 72 2 12-20 excellent good Synthetic Fibers Synthetic fiber reinforced concrete (SNFRC) can be used to produce precast or spray-up deck forms. However, because of their low strength and modulus, they are not used in structural applications and are limited to reinforcements for mainly plastic shrinkage crack control and for improving toughness. Tensile and compressive strength tests carried out by Tavakoli (1994) indicate that while there is no effect on the compressive strength but tensile strength increased a significant 80% at a fiber volume fraction of 1.5%. On the other hand tests by Zollo (1984) indicate that significant improvement in strengths will not be observed at a low fiber volume fraction (0.1 - 0.2 percentage). However, synthetic fibers have been shown to be effective in the early lifetime of the composite when the matrix is itself weak, brittle, and of low modulus (ACI 544.1R-96). Impact tests carried out with specimens reinforced with polypropylene fibers at a volume of 0.1- 2.0 % indicated significant improvements for both first crack and final failure loads (Ramakrishnan et al., 1989). There has been increasing research in the area of SNFRC for enhanced structural properties. For example, STRUX 90/40 is a high tenacity synthetic macro fiber designed to provide post cracking strength (Grace Construction Products Brochure). Synthetic fibers under the brand name Fibermesh, Novomesh, Fibercast, and Enduro are manufactured by Propex concrete systems to cater for different construction applications. Steel Fibers Steel fiber reinforced concrete (SFRC) is one of the most common types of fiber reinforced concrete (FRC) systems available. Increases in tensile strength and ductility have been well

9
documented in the literature (Craig, R., 1987). A summary of mechanical properties summarized by Bentur and Mindess (2002) indicate tensile strength increases in the range of 60-133% and flexural strength of as much as 100% by using 5% volume of steel fibers. However, the use of steel fiber which may corrode is not allowed by the WisDOT. Research into corrosion issues with SFRC indicate that since the fiber is short, discontinuous, and rarely touch each other, there is no continuous conductive path for stray or induced currents or currents from electromotive potential between different areas of the concrete (ACI 544.1R2002). Therefore this may not be as significant an issue as anticipated. There are plenty of commercial grade steel fibers in the market today. For example, Bekaert markets Dramix RC 80/60-CN as galvanized cold drawn wires with hooked ends as reinforcements for concrete (www.bekaert.com). Carbon Fibers Because of their strength and stiffness, carbon fibers have properties that make them suitable for structural applications. Short-fiber carbon FRC systems have been developed on an experimental basis for a steel-free deck in Canada (Banthia, 2000). Carbon FRC with a length of 50mm was developed for a typical girder spanning 2m (6.6ft). Ramakrishnan (1981) suggests application of carbon fiber reinforced concrete for corrugated units for floor construction, boat hulls and scaffold boards. A curtain wall for a 37 story building has been constructed in Japan using carbon FRC resulting substantial saving in both time and money (ACI 544.1R-96). However, carbon fiber reinforced systems are currently economically not viable, although the durability of the carbon fiber is superior to glass fibers. Glass Fibers In the late 1970s and early 1980s glass fiber reinforced cement (GRC) systems were developed for thin-precast concrete panels and for use as permanent formwork (True, 1985). Problems with durability and brittleness of GRC systems initially plagued the development of these materials; however with the advent of alkali-resistant glass containing zirconia (ARG) and less permeable cements, GRC systems have improved and GRC products are manufactured for a variety of applications (Gilbert, 2004). ARG glass fibers have a modulus of elasticity that is approximately double that of the cement matrix. On the other hand, synthetic fibers such as nylon or polypropylene have a modulus that is around 20% of a typical cement matrix. GRC bridge deck forms have been used in U-girder bridges and I girders in the United Kingdom, the Scandinavian countries and in Australia for structural applications (BCMGRC Brochure, 2005). Fig. 5 shows a GRC bridge deck form system placed over concrete U-girders. A table of the typical thicknesses and spanning capabilities from the supplier’s website is shown in Fig. 6 (BCMGRC Brochure, 2005). This type of formwork seems ideal for our type of application. However, we were unable to get any response to our attempt to obtain samples for testing. GRC panels are typically less than 1 in. thick and are produced by “spray-up” of cement/fiber slurry onto molds. The Glass Fiber Reinforced Concrete Association reports that more than 2 million square meters of GRC permanent formwork have been used over the years (GRCA, 2000).
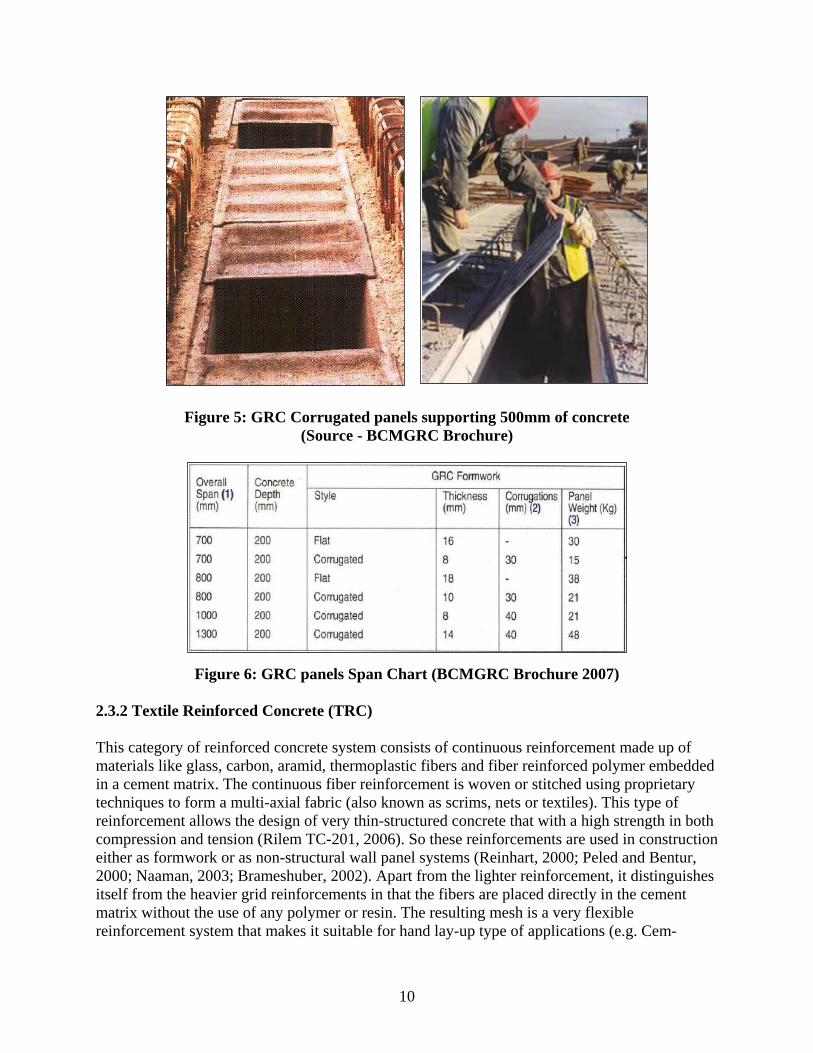
10
Figure 5: GRC Corrugated panels supporting 500mm of concrete (Source - BCMGRC Brochure)
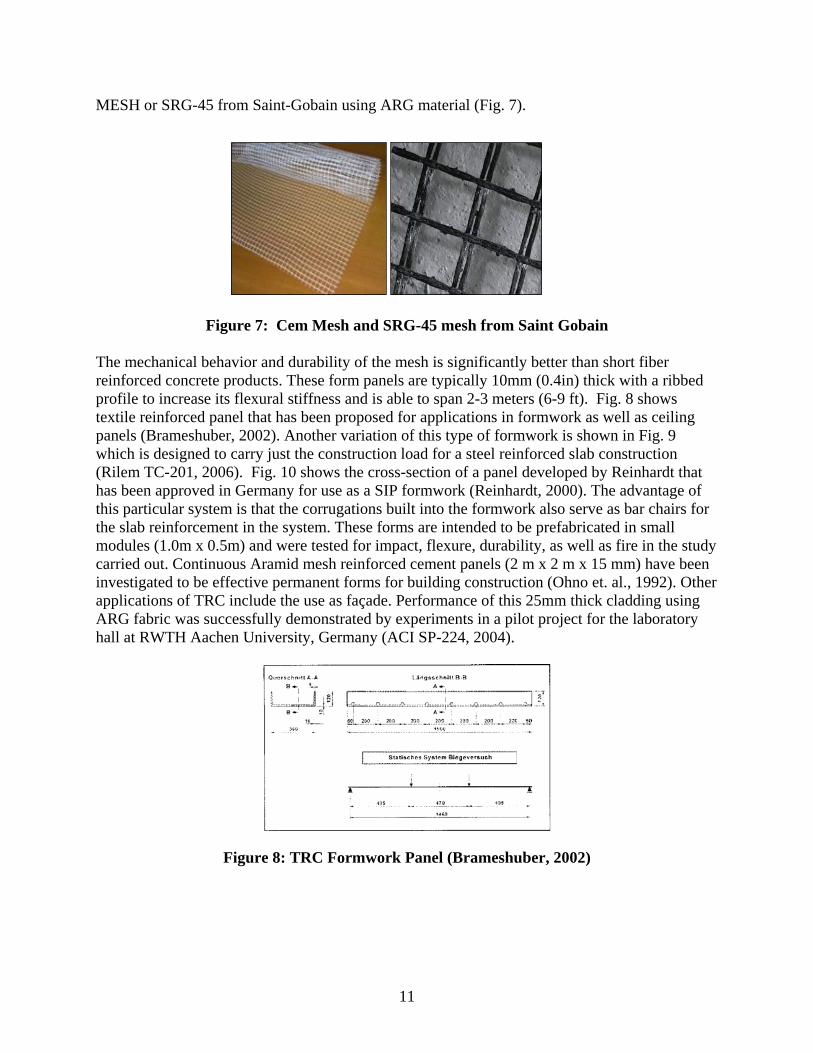
Figure 6: GRC panels Span Chart (BCMGRC Brochure 2007) 2.3.2 Textile Reinforced Concrete (TRC) This category of reinforced concrete system consists of continuous reinforcement made up of materials like glass, carbon, aramid, thermoplastic fibers and fiber reinforced polymer embedded in a cement matrix. The continuous fiber reinforcement is woven or stitched using proprietary techniques to form a multi-axial fabric (also known as scrims, nets or textiles). This type of reinforcement allows the design of very thin-structured concrete that with a high strength in both compression and tension (Rilem TC-201, 2006). So these reinforcements are used in construction either as formwork or as non-structural wall panel systems (Reinhart, 2000; Peled and Bentur, 2000; Naaman, 2003; Brameshuber, 2002). Apart from the lighter reinforcement, it distinguishes itself from the heavier grid reinforcements in that the fibers are placed directly in the cement matrix without the use of any polymer or resin. The resulting mesh is a very flexible reinforcement system that makes it suitable for hand lay-up type of applications (e.g. Cem-
11
MESH or SRG-45 from Saint-Gobain using ARG material (Fig. 7).
Figure 7: Cem Mesh and SRG-45 mesh from Saint Gobain The mechanical behavior and durability of the mesh is significantly better than short fiber reinforced concrete products. These form panels are typically 10mm (0.4in) thick with a ribbed profile to increase its flexural stiffness and is able to span 2-3 meters (6-9 ft). Fig. 8 shows textile reinforced panel that has been proposed for applications in formwork as well as ceiling panels (Brameshuber, 2002). Another variation of this type of formwork is shown in Fig. 9 which is designed to carry just the construction load for a steel reinforced slab construction (Rilem TC-201, 2006). Fig. 10 shows the cross-section of a panel developed by Reinhardt that has been approved in Germany for use as a SIP formwork (Reinhardt, 2000). The advantage of this particular system is that the corrugations built into the formwork also serve as bar chairs for the slab reinforcement in the system. These forms are intended to be prefabricated in small modules (1.0m x 0.5m) and were tested for impact, flexure, durability, as well as fire in the study carried out. Continuous Aramid mesh reinforced cement panels (2 m x 2 m x 15 mm) have been investigated to be effective permanent forms for building construction (Ohno et. al., 1992). Other applications of TRC include the use as façade. Performance of this 25mm thick cladding using ARG fabric was successfully demonstrated by experiments in a pilot project for the laboratory hall at RWTH Aachen University, Germany (ACI SP-224, 2004).
Figure 8: TRC Formwork Panel (Brameshuber, 2002)
12
Figure 9: Integrated TRC formwork (Brameshuber, 2003)
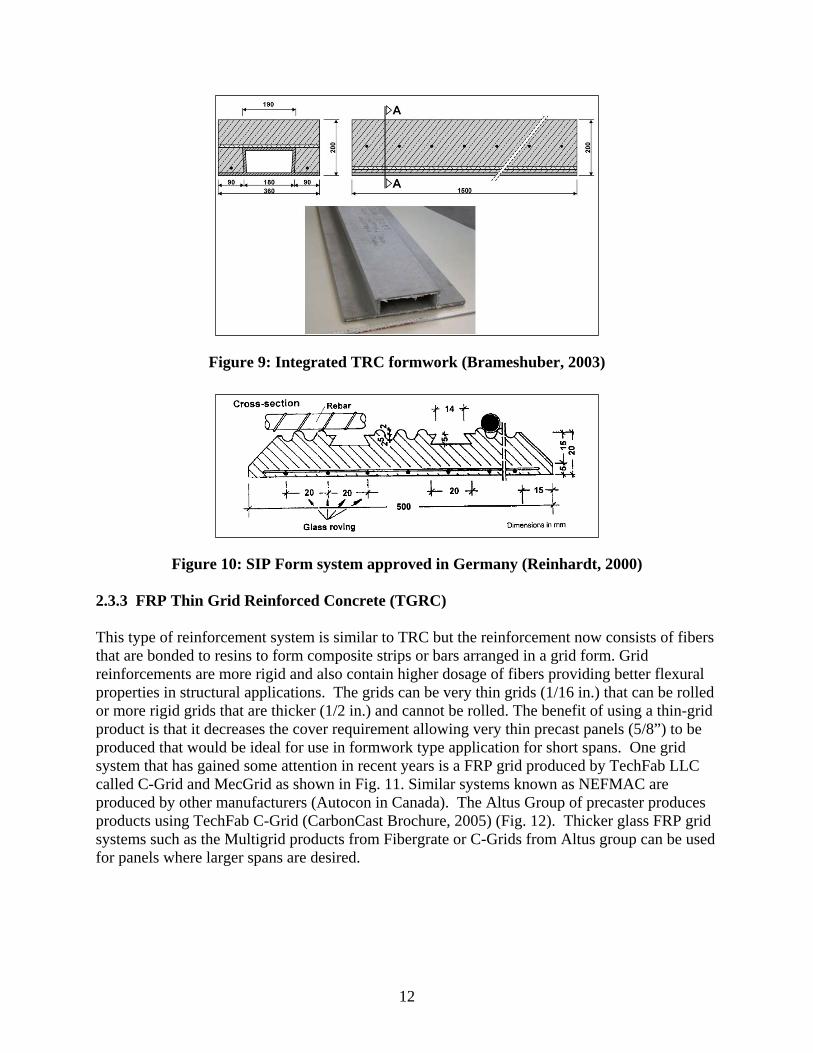
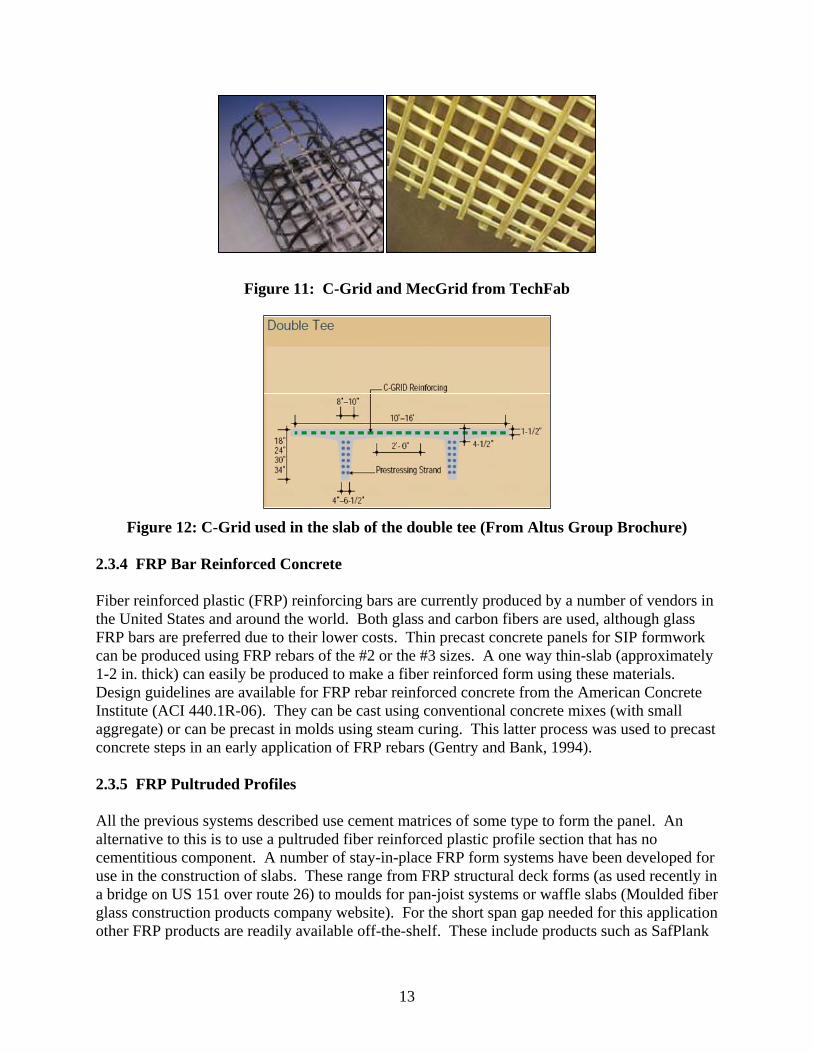
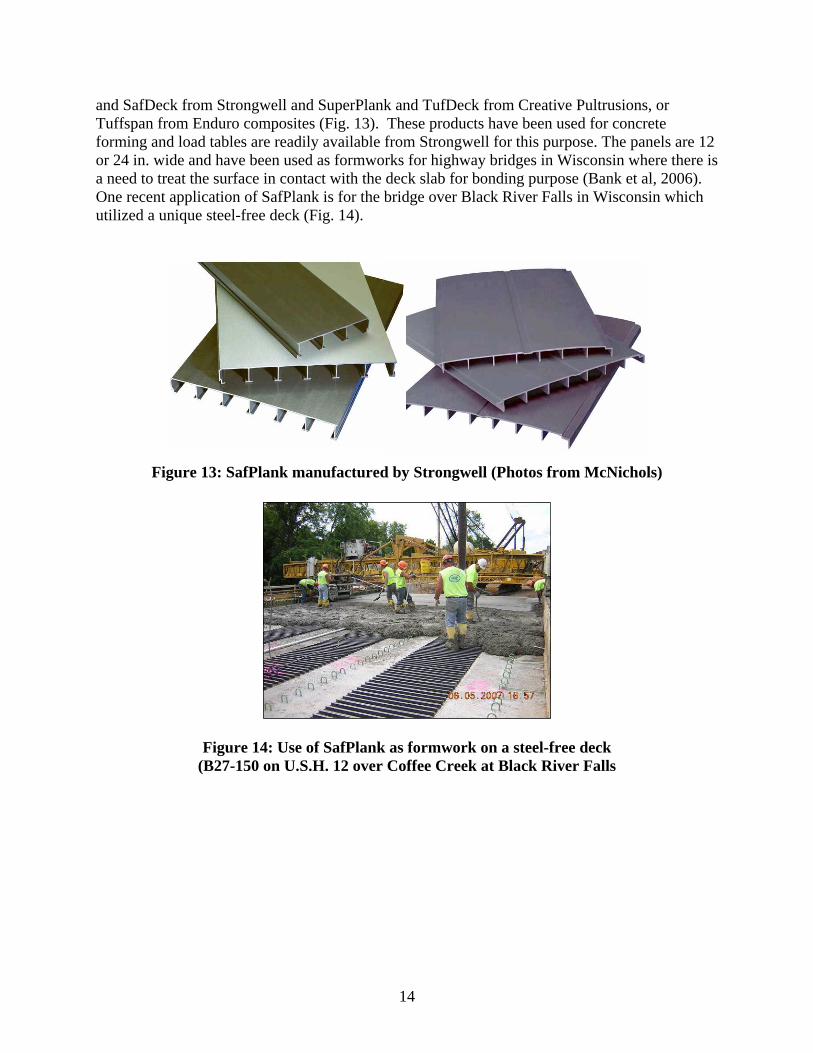
Figure 10: SIP Form system approved in Germany (Reinhardt, 2000) 2.3.3 FRP Thin Grid Reinforced Concrete (TGRC) This type of reinforcement system is similar to TRC but the reinforcement now consists of fibers that are bonded to resins to form composite strips or bars arranged in a grid form. Grid reinforcements are more rigid and also contain higher dosage of fibers providing better flexural properties in structural applications. The grids can be very thin grids (1/16 in.) that can be rolled or more rigid grids that are thicker (1/2 in.) and cannot be rolled. The benefit of using a thin-grid product is that it decreases the cover requirement allowing very thin precast panels (5/8”) to be produced that would be ideal for use in formwork type application for short spans. One grid system that has gained some attention in recent years is a FRP grid produced by TechFab LLC called C-Grid and MecGrid as shown in Fig. 11. Similar systems known as NEFMAC are produced by other manufacturers (Autocon in Canada). The Altus Group of precaster produces products using TechFab C-Grid (CarbonCast Brochure, 2005) (Fig. 12). Thicker glass FRP grid systems such as the Multigrid products from Fibergrate or C-Grids from Altus group can be used for panels where larger spans are desired.
13
Figure 11: C-Grid and MecGrid from TechFab
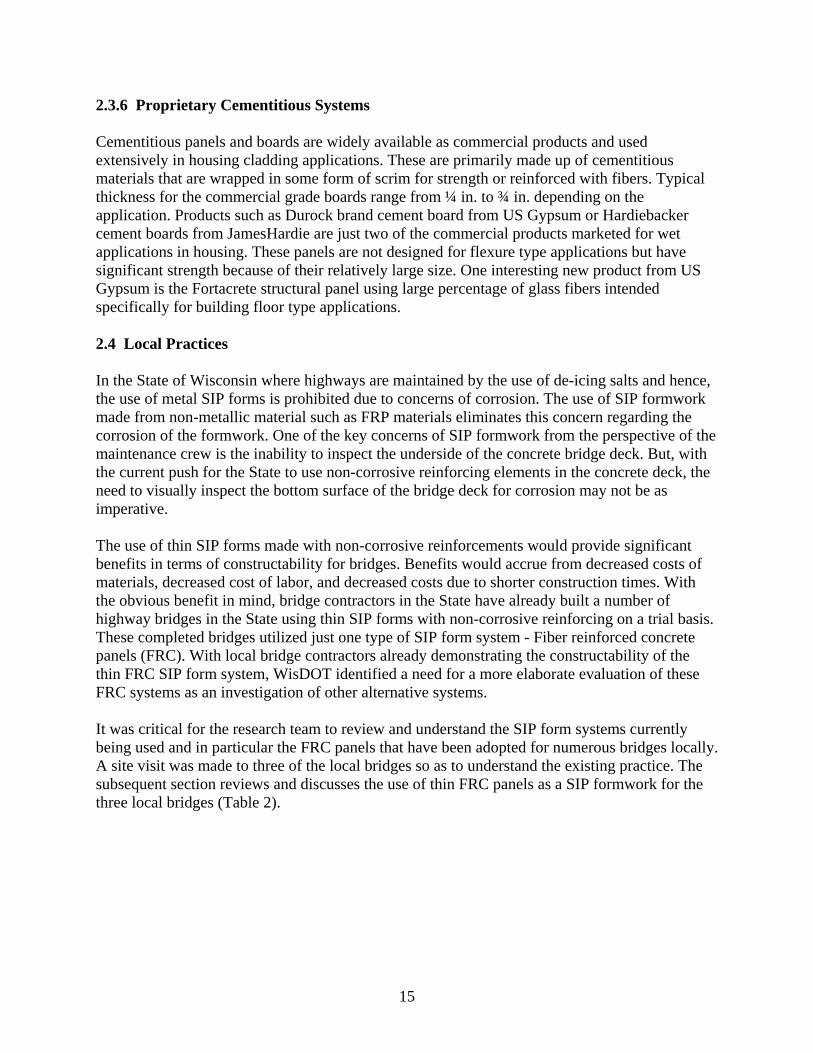
Figure 12: C-Grid used in the slab of the double tee (From Altus Group Brochure) 2.3.4 FRP Bar Reinforced Concrete Fiber reinforced plastic (FRP) reinforcing bars are currently produced by a number of vendors in the United States and around the world. Both glass and carbon fibers are used, although glass FRP bars are preferred due to their lower costs. Thin precast concrete panels for SIP formwork can be produced using FRP rebars of the #2 or the #3 sizes. A one way thin-slab (approximately 1-2 in. thick) can easily be produced to make a fiber reinforced form using these materials. Design guidelines are available for FRP rebar reinforced concrete from the American Concrete Institute (ACI 440.1R-06). They can be cast using conventional concrete mixes (with small aggregate) or can be precast in molds using steam curing. This latter process was used to precast concrete steps in an early application of FRP rebars (Gentry and Bank, 1994). 2.3.5 FRP Pultruded Profiles All the previous systems described use cement matrices of some type to form the panel. An alternative to this is to use a pultruded fiber reinforced plastic profile section that has no cementitious component. A number of stay-in-place FRP form systems have been developed for use in the construction of slabs. These range from FRP structural deck forms (as used recently in a bridge on US 151 over route 26) to moulds for pan-joist systems or waffle slabs (Moulded fiber glass construction products company website). For the short span gap needed for this application other FRP products are readily available off-the-shelf. These include products such as SafPlank
14
and SafDeck from Strongwell and SuperPlank and TufDeck from Creative Pultrusions, or Tuffspan from Enduro composites (Fig. 13). These products have been used for concrete forming and load tables are readily available from Strongwell for this purpose. The panels are 12 or 24 in. wide and have been used as formworks for highway bridges in Wisconsin where there is a need to treat the surface in contact with the deck slab for bonding purpose (Bank et al, 2006). One recent application of SafPlank is for the bridge over Black River Falls in Wisconsin which utilized a unique steel-free deck (Fig. 14).
Figure 13: SafPlank manufactured by Strongwell (Photos from McNichols)
Figure 14: Use of SafPlank as formwork on a steel-free deck (B27-150 on U.S.H. 12 over Coffee Creek at Black River Falls
15
2.3.6 Proprietary Cementitious Systems Cementitious panels and boards are widely available as commercial products and used extensively in housing cladding applications. These are primarily made up of cementitious materials that are wrapped in some form of scrim for strength or reinforced with fibers. Typical thickness for the commercial grade boards range from ¼ in. to ¾ in. depending on the application. Products such as Durock brand cement board from US Gypsum or Hardiebacker cement boards from JamesHardie are just two of the commercial products marketed for wet applications in housing. These panels are not designed for flexure type applications but have significant strength because of their relatively large size. One interesting new product from US Gypsum is the Fortacrete structural panel using large percentage of glass fibers intended specifically for building floor type applications. 2.4 Local Practices In the State of Wisconsin where highways are maintained by the use of de-icing salts and hence, the use of metal SIP forms is prohibited due to concerns of corrosion. The use of SIP formwork made from non-metallic material such as FRP materials eliminates this concern regarding the corrosion of the formwork. One of the key concerns of SIP formwork from the perspective of the maintenance crew is the inability to inspect the underside of the concrete bridge deck. But, with the current push for the State to use non-corrosive reinforcing elements in the concrete deck, the need to visually inspect the bottom surface of the bridge deck for corrosion may not be as imperative. The use of thin SIP forms made with non-corrosive reinforcements would provide significant benefits in terms of constructability for bridges. Benefits would accrue from decreased costs of materials, decreased cost of labor, and decreased costs due to shorter construction times. With the obvious benefit in mind, bridge contractors in the State have already built a number of highway bridges in the State using thin SIP forms with non-corrosive reinforcing on a trial basis. These completed bridges utilized just one type of SIP form system - Fiber reinforced concrete panels (FRC). With local bridge contractors already demonstrating the constructability of the thin FRC SIP form system, WisDOT identified a need for a more elaborate evaluation of these FRC systems as an investigation of other alternative systems. It was critical for the research team to review and understand the SIP form systems currently being used and in particular the FRC panels that have been adopted for numerous bridges locally. A site visit was made to three of the local bridges so as to understand the existing practice. The subsequent section reviews and discusses the use of thin FRC panels as a SIP formwork for the three local bridges (Table 2).

16
Table 2: Local Bridges Studied
Bridge Description
Bridge ID # State ID #
Letting Date (Completed Yr.)
Contractor
Bridge at Fond du Lac (175 South over USH 41)
B20-069 1105-01-06N
12 May 2004 (2005)
Zenith Tech Inc.
Bridge at Wausau (Robin Lane over USH 51 South)
B37-342 1166-08-70
12 July 2005 (2005)
Lunda Construction
Bridge at Eau Claire (Birch St over Eau Claire River)
B18-166 1190-00-79
9 Aug 2005 (2006)
Zenith Tech Inc.
Bridge at Fond du Lac (B20-069) The bridge at Fond du Lac is a 2-span bridge with spans of 133 ft and a total deck width of 71 ft (Fig. 15 and Fig. 16). The clear spacing between the top flange of the 54W prestressed girder is 2ft. 5 in. for which the main contractor for the project, Zenith Tech proposed a 1.5 in. thick concrete panel with a total length of 2 ft. 8 in.
Figure 15: View of bridge from USH 41 from the East side (West bound traffic) It was understood from discussions with the contractor that no specific design was carried out for the panels but it was in fact tested for structural integrity. However, we were unable to obtain any information on this structural integrity test performed. The SIP formwork panel was manufactured by a local precaster in section widths of 4ft. The width was governed by the overall weight of the panel for ease of installation (approximately 200 lbf for this project). The concrete mix for the panels was a 4000 psi regular ¾ in. aggregate with a mix design that was the same as used in the bridge deck slab.
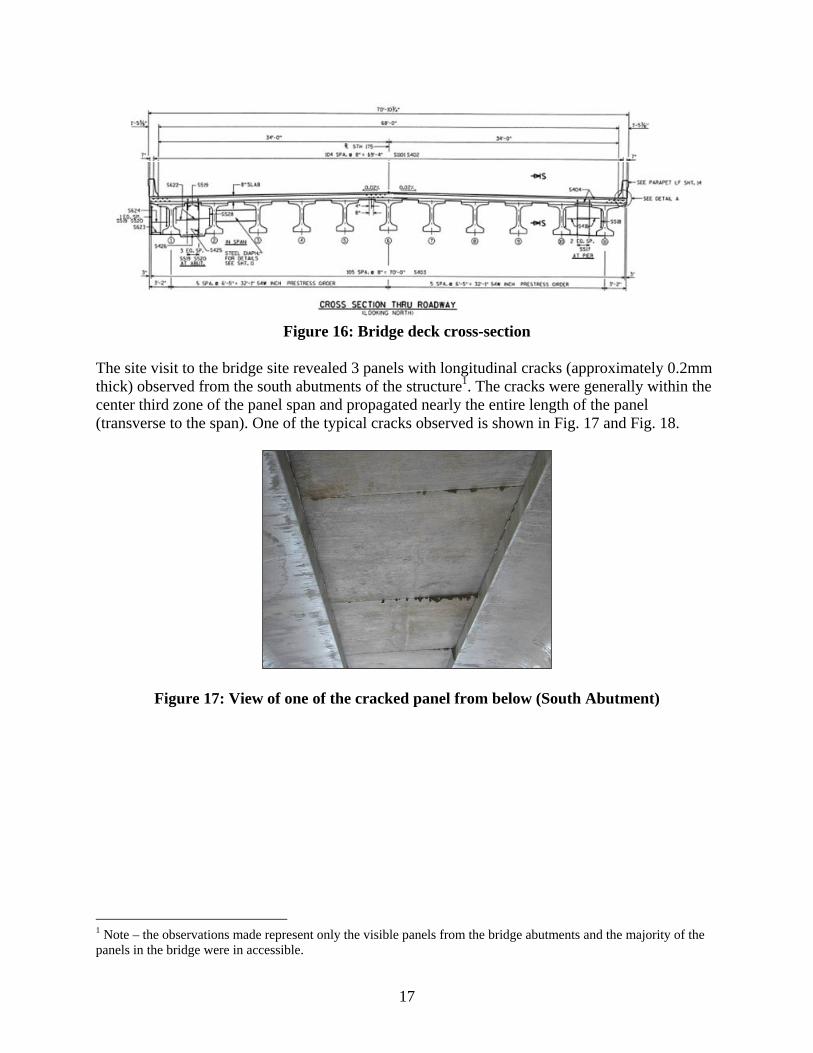
17
Figure 16: Bridge deck cross-section The site visit to the bridge site revealed 3 panels with longitudinal cracks (approximately 0.2mm thick) observed from the south abutments of the structure1. The cracks were generally within the center third zone of the panel span and propagated nearly the entire length of the panel (transverse to the span). One of the typical cracks observed is shown in Fig. 17 and Fig. 18.
Figure 17: View of one of the cracked panel from below (South Abutment)
1 Note – the observations made represent only the visible panels from the bridge abutments and the majority of the panels in the bridge were in accessible.

18
Figure 18: Crack in panel observed from the south abutment Bridge at Wausau (B37-342) The bridge at Wausau is a recently completed two span bridge (128 ft & 141ft) on Robin Lane over USH 51 South constructed by Lunda Construction (Fig. 19). The 51.5 ft. wide bridge deck (8 in. thick) was supported by closely spaced 54 W girders with a clear span between the edges at the top flange of just 8 in. The formwork panels were seated on wet grout applied to the flange of the girder. A site visit was carried out during the course of the research work.
Figure 19: Completed Bridge at Wausau (Robin Lane over USH 51 South) The contract specification for the bridge called for a maximum of 1.5 in. thick concrete panel as the stay-in-place formwork (Fig. 20). Lunda Construction proposed a 1.5 thick concrete panel
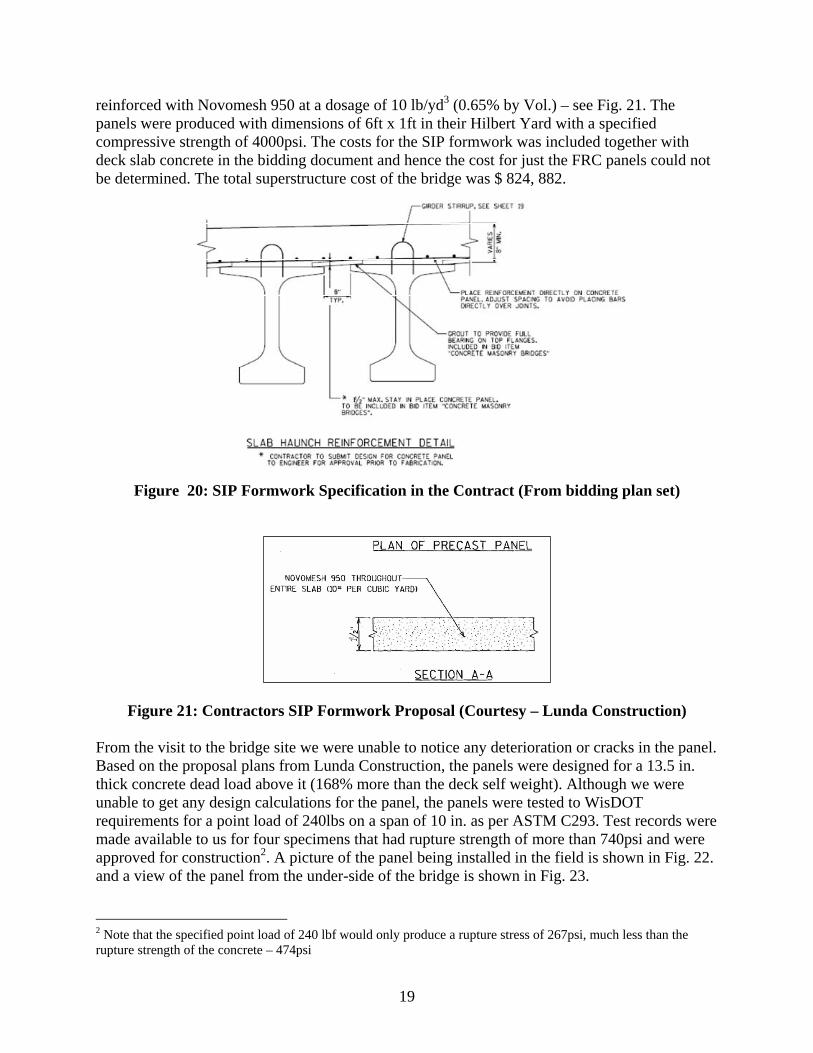
19
reinforced with Novomesh 950 at a dosage of 10 lb/yd3 (0.65% by Vol.) – see Fig. 21. The panels were produced with dimensions of 6ft x 1ft in their Hilbert Yard with a specified compressive strength of 4000psi. The costs for the SIP formwork was included together with deck slab concrete in the bidding document and hence the cost for just the FRC panels could not be determined. The total superstructure cost of the bridge was $ 824, 882.
Figure 20: SIP Formwork Specification in the Contract (From bidding plan set)
Figure 21: Contractors SIP Formwork Proposal (Courtesy – Lunda Construction) From the visit to the bridge site we were unable to notice any deterioration or cracks in the panel. Based on the proposal plans from Lunda Construction, the panels were designed for a 13.5 in. thick concrete dead load above it (168% more than the deck self weight). Although we were unable to get any design calculations for the panel, the panels were tested to WisDOT requirements for a point load of 240lbs on a span of 10 in. as per ASTM C293. Test records were made available to us for four specimens that had rupture strength of more than 740psi and were approved for construction2. A picture of the panel being installed in the field is shown in Fig. 22. and a view of the panel from the under-side of the bridge is shown in Fig. 23. 2 Note that the specified point load of 240 lbf would only produce a rupture stress of 267psi, much less than the rupture strength of the concrete – 474psi
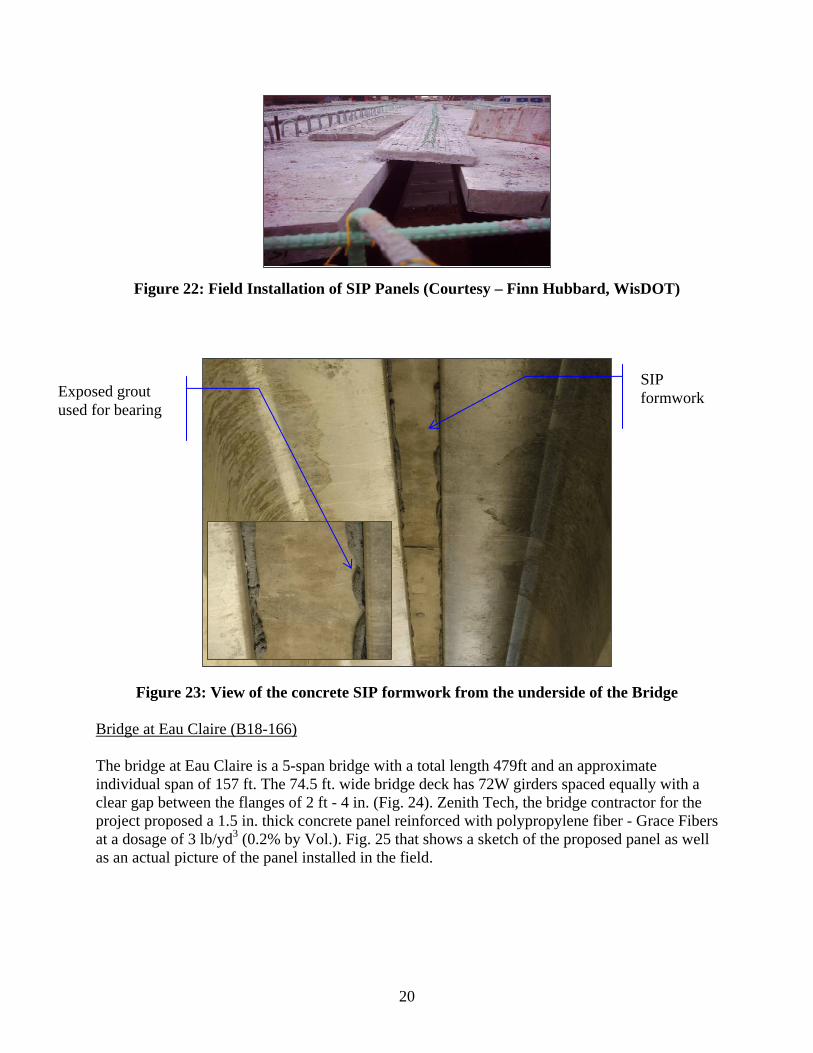
20
Figure 22: Field Installation of SIP Panels (Courtesy – Finn Hubbard, WisDOT)
Figure 23: View of the concrete SIP formwork from the underside of the Bridge Bridge at Eau Claire (B18-166) The bridge at Eau Claire is a 5-span bridge with a total length 479ft and an approximate individual span of 157 ft. The 74.5 ft. wide bridge deck has 72W girders spaced equally with a clear gap between the flanges of 2 ft - 4 in. (Fig. 24). Zenith Tech, the bridge contractor for the project proposed a 1.5 in. thick concrete panel reinforced with polypropylene fiber - Grace Fibers at a dosage of 3 lb/yd3 (0.2% by Vol.). Fig. 25 that shows a sketch of the proposed panel as well as an actual picture of the panel installed in the field.
SIP formwork Exposed grout
used for bearing
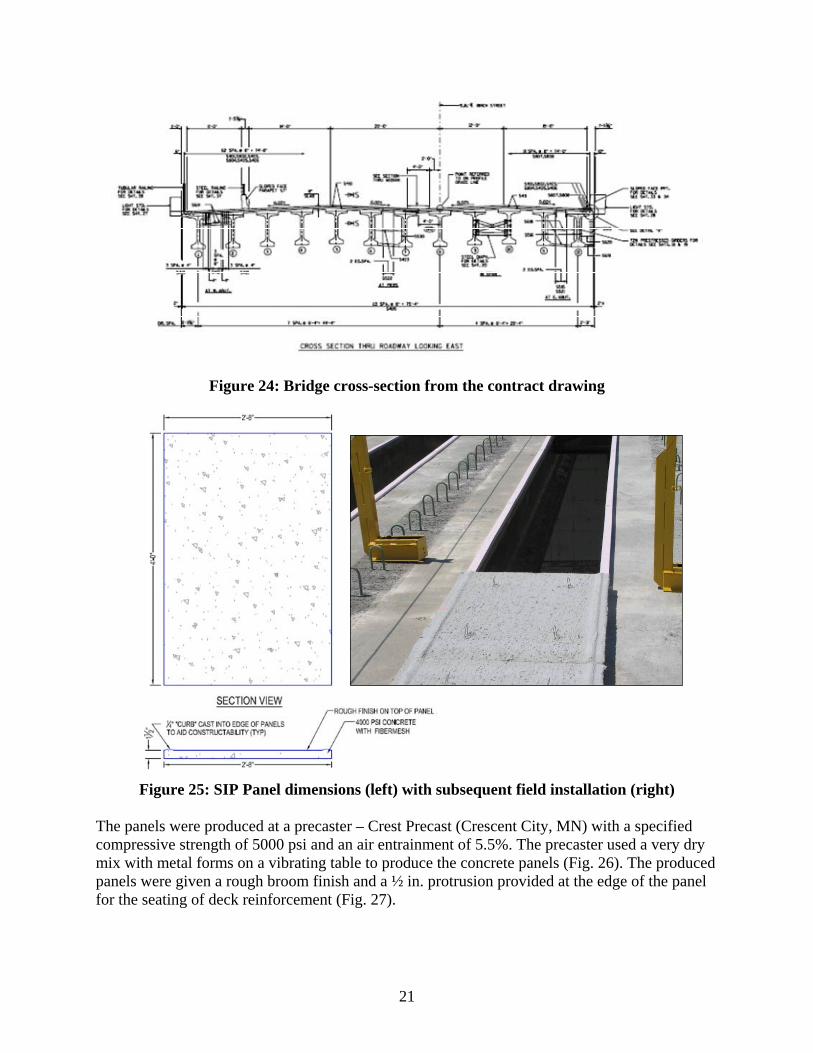
21
Figure 24: Bridge cross-section from the contract drawing
Figure 25: SIP Panel dimensions (left) with subsequent field installation (right) The panels were produced at a precaster – Crest Precast (Crescent City, MN) with a specified compressive strength of 5000 psi and an air entrainment of 5.5%. The precaster used a very dry mix with metal forms on a vibrating table to produce the concrete panels (Fig. 26). The produced panels were given a rough broom finish and a ½ in. protrusion provided at the edge of the panel for the seating of deck reinforcement (Fig. 27).
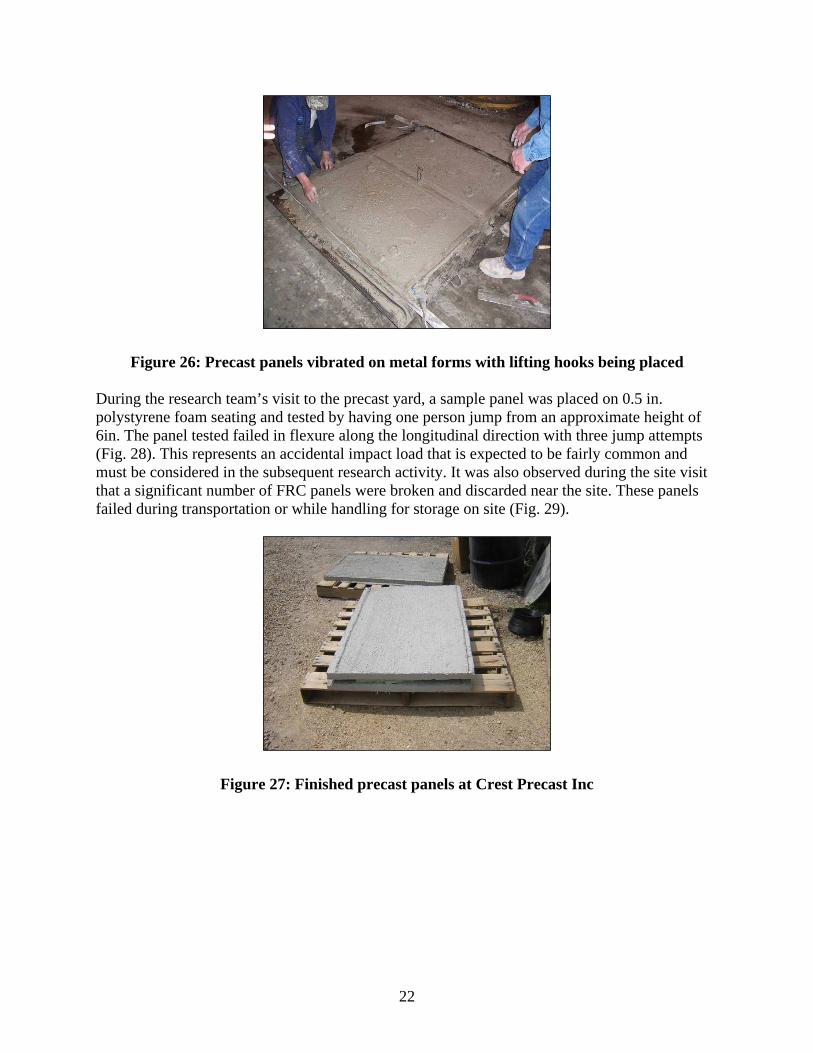
22
Figure 26: Precast panels vibrated on metal forms with lifting hooks being placed During the research team’s visit to the precast yard, a sample panel was placed on 0.5 in. polystyrene foam seating and tested by having one person jump from an approximate height of 6in. The panel tested failed in flexure along the longitudinal direction with three jump attempts (Fig. 28). This represents an accidental impact load that is expected to be fairly common and must be considered in the subsequent research activity. It was also observed during the site visit that a significant number of FRC panels were broken and discarded near the site. These panels failed during transportation or while handling for storage on site (Fig. 29).
Figure 27: Finished precast panels at Crest Precast Inc
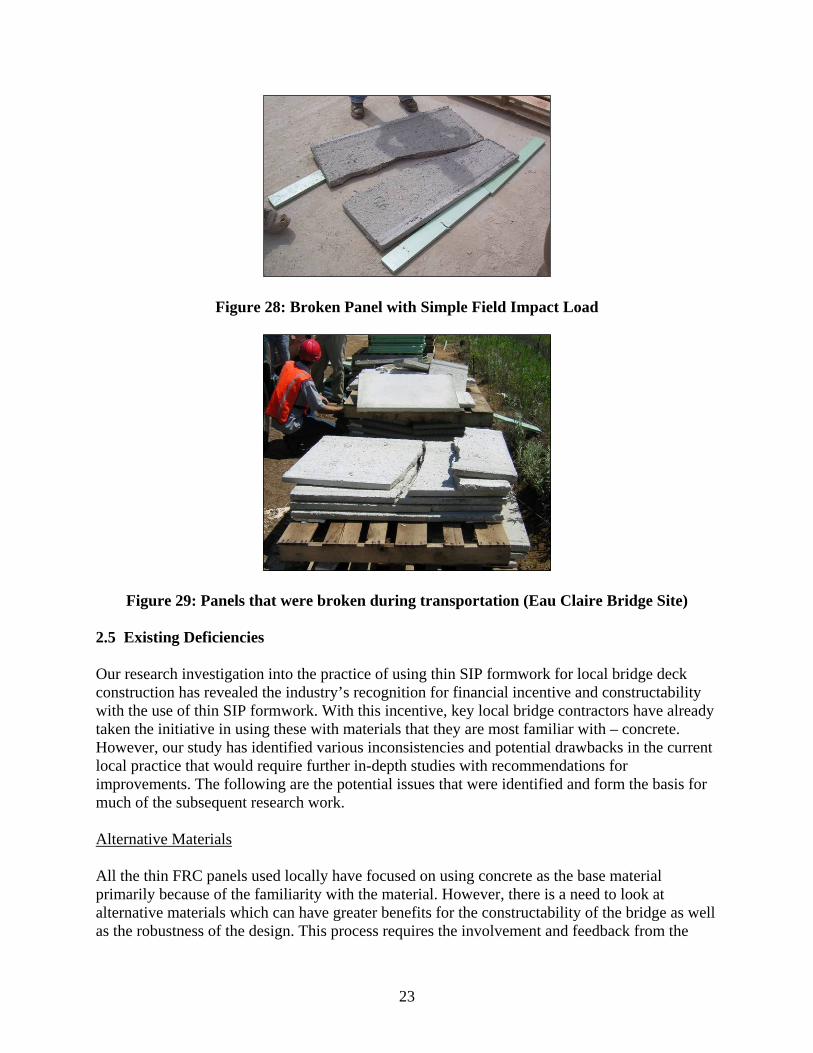
23
Figure 28: Broken Panel with Simple Field Impact Load
Figure 29: Panels that were broken during transportation (Eau Claire Bridge Site) 2.5 Existing Deficiencies Our research investigation into the practice of using thin SIP formwork for local bridge deck construction has revealed the industry’s recognition for financial incentive and constructability with the use of thin SIP formwork. With this incentive, key local bridge contractors have already taken the initiative in using these with materials that they are most familiar with – concrete. However, our study has identified various inconsistencies and potential drawbacks in the current local practice that would require further in-depth studies with recommendations for improvements. The following are the potential issues that were identified and form the basis for much of the subsequent research work. Alternative Materials All the thin FRC panels used locally have focused on using concrete as the base material primarily because of the familiarity with the material. However, there is a need to look at alternative materials which can have greater benefits for the constructability of the bridge as well as the robustness of the design. This process requires the involvement and feedback from the
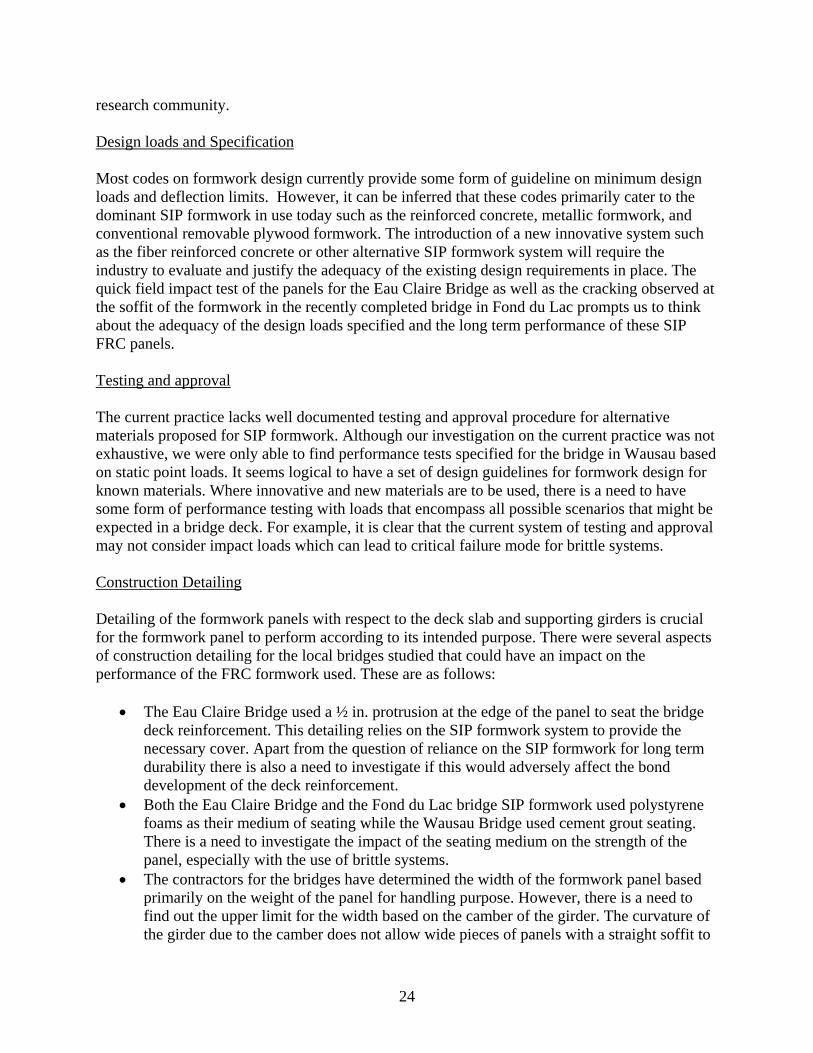
24
research community. Design loads and Specification Most codes on formwork design currently provide some form of guideline on minimum design loads and deflection limits. However, it can be inferred that these codes primarily cater to the dominant SIP formwork in use today such as the reinforced concrete, metallic formwork, and conventional removable plywood formwork. The introduction of a new innovative system such as the fiber reinforced concrete or other alternative SIP formwork system will require the industry to evaluate and justify the adequacy of the existing design requirements in place. The quick field impact test of the panels for the Eau Claire Bridge as well as the cracking observed at the soffit of the formwork in the recently completed bridge in Fond du Lac prompts us to think about the adequacy of the design loads specified and the long term performance of these SIP FRC panels. Testing and approval The current practice lacks well documented testing and approval procedure for alternative materials proposed for SIP formwork. Although our investigation on the current practice was not exhaustive, we were only able to find performance tests specified for the bridge in Wausau based on static point loads. It seems logical to have a set of design guidelines for formwork design for known materials. Where innovative and new materials are to be used, there is a need to have some form of performance testing with loads that encompass all possible scenarios that might be expected in a bridge deck. For example, it is clear that the current system of testing and approval may not consider impact loads which can lead to critical failure mode for brittle systems. Construction Detailing Detailing of the formwork panels with respect to the deck slab and supporting girders is crucial for the formwork panel to perform according to its intended purpose. There were several aspects of construction detailing for the local bridges studied that could have an impact on the performance of the FRC formwork used. These are as follows:
• The Eau Claire Bridge used a ½ in. protrusion at the edge of the panel to seat the bridge deck reinforcement. This detailing relies on the SIP formwork system to provide the necessary cover. Apart from the question of reliance on the SIP formwork for long term durability there is also a need to investigate if this would adversely affect the bond development of the deck reinforcement.
• Both the Eau Claire Bridge and the Fond du Lac bridge SIP formwork used polystyrene foams as their medium of seating while the Wausau Bridge used cement grout seating. There is a need to investigate the impact of the seating medium on the strength of the panel, especially with the use of brittle systems.
• The contractors for the bridges have determined the width of the formwork panel based primarily on the weight of the panel for handling purpose. However, there is a need to find out the upper limit for the width based on the camber of the girder. The curvature of the girder due to the camber does not allow wide pieces of panels with a straight soffit to

25
be used as panels will not be seated throughout the width on the girder. • The local bridges investigated used a bearing width of the formwork panel that ranged
from 1.5 in. to 2 in. There is a need to review the adequacy not just from a structural viewpoint but from stability perspective as a result of accidental loading.
• Bridge deck slabs are haunched to cater for either the camber in the girder or for the cross-slope of the deck slab so as to avoid redundant concrete slab dead load on the girder. These are typically built up in the plywood forms. For the bridge in Eau Claire, haunches were in fact built-up using the polystyrene foam and were required to cater for the girder camber. (See Fig. 30).
Figure 30: Polystyrene foams used to haunch the slab (Eau Claire Bridge)
Polystyrene foam forming the haunch
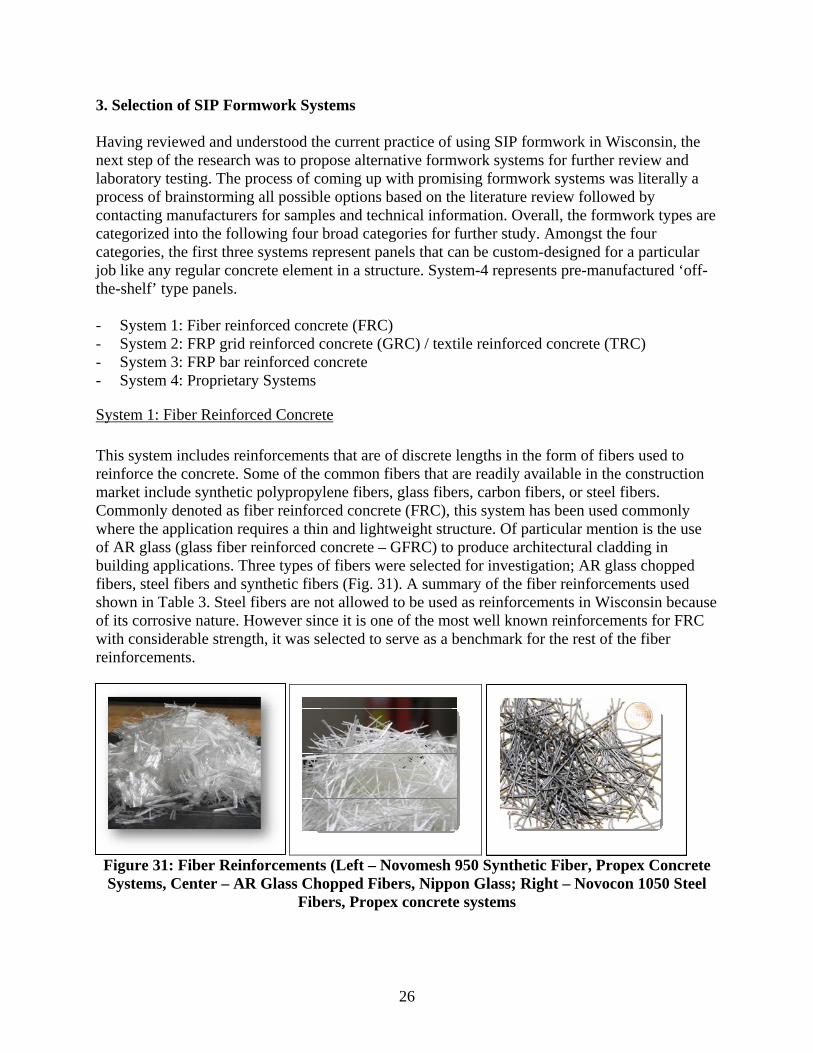
26
3. Selection of SIP Formwork Systems Having reviewed and understood the current practice of using SIP formwork in Wisconsin, the next step of the research was to propose alternative formwork systems for further review and laboratory testing. The process of coming up with promising formwork systems was literally a process of brainstorming all possible options based on the literature review followed by contacting manufacturers for samples and technical information. Overall, the formwork types are categorized into the following four broad categories for further study. Amongst the four categories, the first three systems represent panels that can be custom-designed for a particular job like any regular concrete element in a structure. System-4 represents pre-manufactured ‘off-the-shelf’ type panels.
- System 1: Fiber reinforced concrete (FRC) - System 2: FRP grid reinforced concrete (GRC) / textile reinforced concrete (TRC) - System 3: FRP bar reinforced concrete - System 4: Proprietary Systems
System 1: Fiber Reinforced Concrete
This system includes reinforcements that are of discrete lengths in the form of fibers used to reinforce the concrete. Some of the common fibers that are readily available in the construction market include synthetic polypropylene fibers, glass fibers, carbon fibers, or steel fibers. Commonly denoted as fiber reinforced concrete (FRC), this system has been used commonly where the application requires a thin and lightweight structure. Of particular mention is the use of AR glass (glass fiber reinforced concrete – GFRC) to produce architectural cladding in building applications. Three types of fibers were selected for investigation; AR glass chopped fibers, steel fibers and synthetic fibers (Fig. 31). A summary of the fiber reinforcements used shown in Table 3. Steel fibers are not allowed to be used as reinforcements in Wisconsin because of its corrosive nature. However since it is one of the most well known reinforcements for FRC with considerable strength, it was selected to serve as a benchmark for the rest of the fiber reinforcements.
Figure 31: Fiber Reinforcements (Left – Novomesh 950 Synthetic Fiber, Propex Concrete Systems, Center – AR Glass Chopped Fibers, Nippon Glass; Right – Novocon 1050 Steel
Fibers, Propex concrete systems

27
Table 3: Summary of Proposed Fiber Reinforcements for Testing
Fiber Type Proprietary Name
Manufacturer Fiber Detail
Synthetic Fiber Novomesh 950 Propex Concrete Systems
Polypropylene / polyethylene high performance macro filament fibers Fiber length – 2 in. Fiber Diameter – 0.83 mm
Glass Fiber ARG Chopped Strand
Nippon Electric Glass Fiber length – 1 in.
Steel Fibers Novocon 1050 Propex Concrete Systems
Cold drawn wire fiber with hooked end Fiber length – 2 in. Fiber Diameter – 1mm Fiber Strength – 152 ksi
System 2: FRP Grid Reinforcements / Textile Reinforcements This system represents a host of different types of thin continuous fibers in the form of textile fabrics or FRP composite reinforcements in the form of a grid made of glass and carbon. A total of 8 different types of FRP grid reinforcements are proposed for further testing in the laboratory (See Table 4 and Fig. 32). Amongst these 8 reinforcement types, SRG-45 is a fairly new product launched by Saint-Gobain that has been tested for enhanced ductility in seismic resistance of masonry walls. It is manufactured from alkali resistant Cem-FIL glass fibers with proprietary coatings to enhance bonding with concrete and cementitious materials.
Table 4: Summary of Grid Reinforcements
Broad Category
Grid Type Manufacturer Description
TD 5x5 5mm x 5mm grid size TD 10x10 10mm x 10mm grid size LW110
Nippon Electric Glass Company
www.negamerica.com 25mm x 25mm grid size
Continuous Fiber Fabric (AR Glass) SRG-45 Saint Gobain
www.sgtf.com 25mm x 25mm grid size Proprietary coating for improved bonding
AR Glass Grid
G2800 25mm x 25mm grid size (Glass tow bonded with epoxy)
C2750- BX1 50mm x 50mm grid size (carbon tow bonded with epoxy)
C3000- AX1 25mm x 25mm grid size (carbon tow bonded with epoxy)
Carbon Grid
C5500- AX1
TechFab LLC www.techfabllc.com
45mm x 40mm grid size (carbon tow bonded with epoxy)
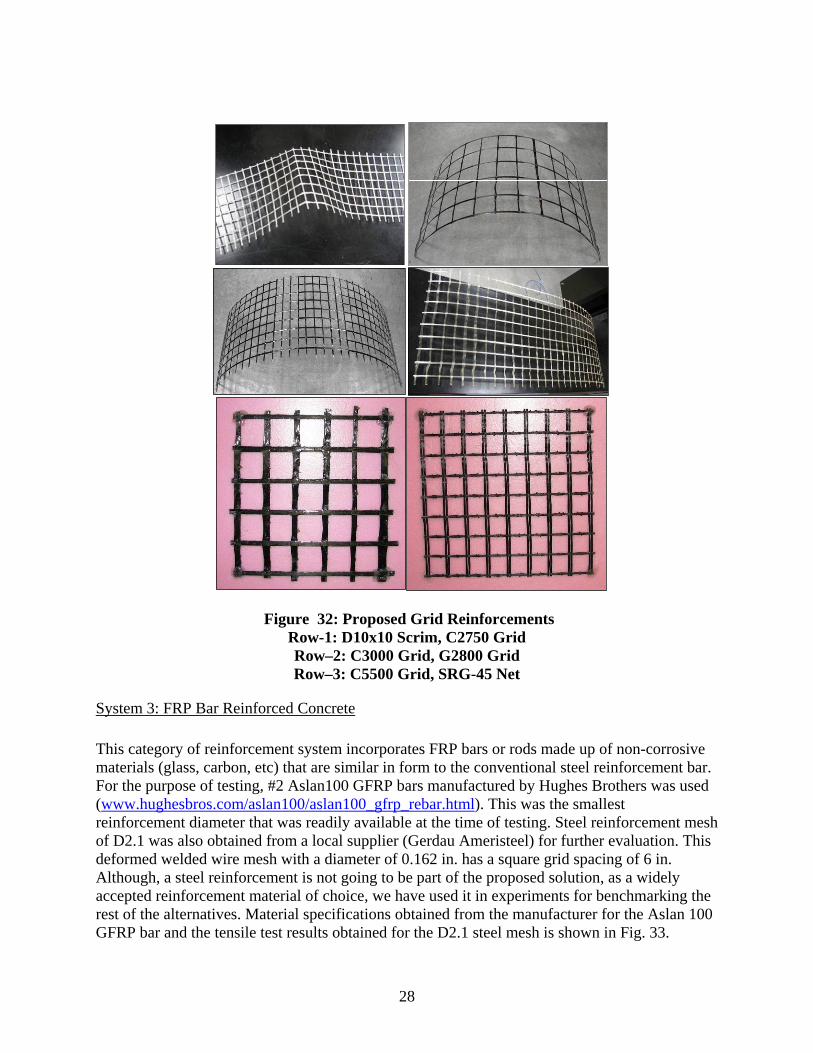
28
Figure 32: Proposed Grid Reinforcements Row-1: D10x10 Scrim, C2750 Grid Row–2: C3000 Grid, G2800 Grid Row–3: C5500 Grid, SRG-45 Net
System 3: FRP Bar Reinforced Concrete This category of reinforcement system incorporates FRP bars or rods made up of non-corrosive materials (glass, carbon, etc) that are similar in form to the conventional steel reinforcement bar. For the purpose of testing, #2 Aslan100 GFRP bars manufactured by Hughes Brothers was used (www.hughesbros.com/aslan100/aslan100_gfrp_rebar.html). This was the smallest reinforcement diameter that was readily available at the time of testing. Steel reinforcement mesh of D2.1 was also obtained from a local supplier (Gerdau Ameristeel) for further evaluation. This deformed welded wire mesh with a diameter of 0.162 in. has a square grid spacing of 6 in. Although, a steel reinforcement is not going to be part of the proposed solution, as a widely accepted reinforcement material of choice, we have used it in experiments for benchmarking the rest of the alternatives. Material specifications obtained from the manufacturer for the Aslan 100 GFRP bar and the tensile test results obtained for the D2.1 steel mesh is shown in Fig. 33.
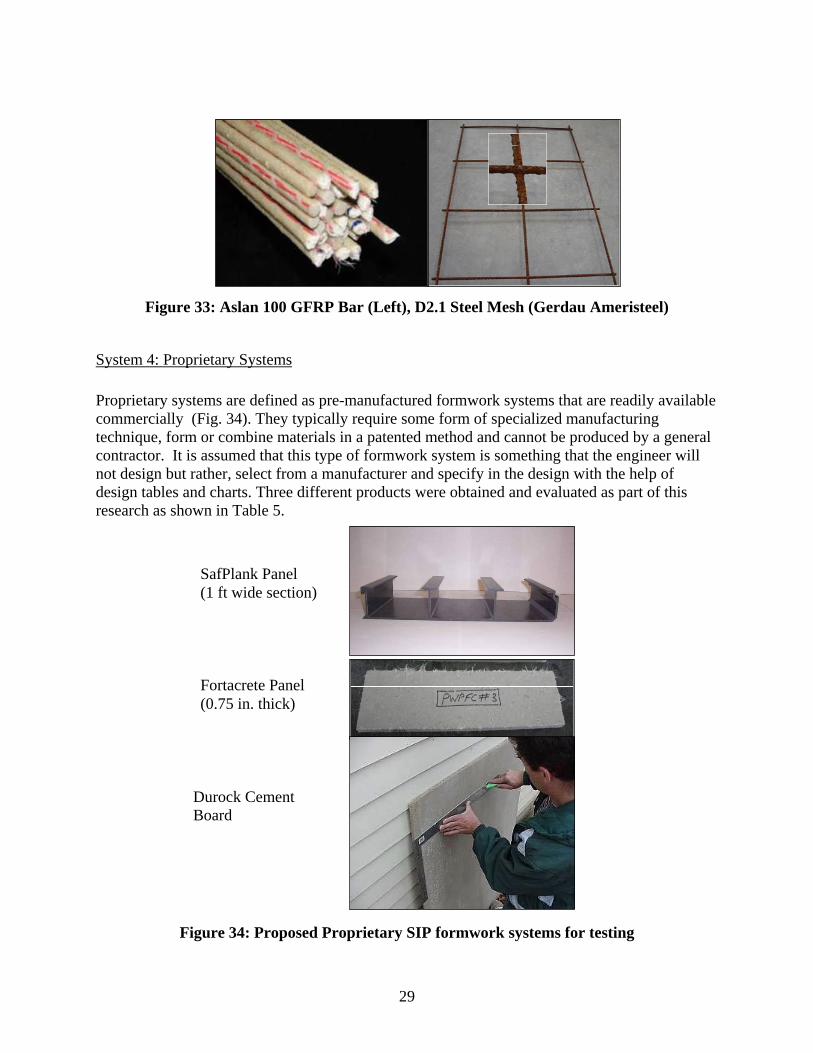
29
Figure 33: Aslan 100 GFRP Bar (Left), D2.1 Steel Mesh (Gerdau Ameristeel)
System 4: Proprietary Systems Proprietary systems are defined as pre-manufactured formwork systems that are readily available commercially (Fig. 34). They typically require some form of specialized manufacturing technique, form or combine materials in a patented method and cannot be produced by a general contractor. It is assumed that this type of formwork system is something that the engineer will not design but rather, select from a manufacturer and specify in the design with the help of design tables and charts. Three different products were obtained and evaluated as part of this research as shown in Table 5.
Figure 34: Proposed Proprietary SIP formwork systems for testing
SafPlank Panel (1 ft wide section)
Fortacrete Panel (0.75 in. thick)
Durock Cement Board

30
Table 5: Proprietary Systems Evaluated
Panel Name Panel Type Panel Details Manufacturer Durock Cement Board Cementitious matrix
with ARG glass scrims ½ in. deep US Gypsum
Fortacrete Panel Cementitious matrix reinforced with AR Glass Fibers
¾ in. deep US Gypsum
SafPlank FRP composite Pultruded Section
2 ft / 1 ft wide 2 in. deep
Strongwell

31
4. Design Considerations and Laboratory Testing This chapter of the report discusses the various considerations required for formwork design (static loads, impact loads, serviceability considerations). Various codes and standards were examined to establish the proposed design requirements. This was used as a basis for proposing the laboratory tests. Once the laboratory test set-up and procedures are explained, the identification systems used for all the tests are summarized.
4.1 Design Considerations Design requirements are typically expressed in the form of dead loads, live loads and serviceability criteria. It is important for us to examine the design loads stipulated by the current code of practice (primarily AASHTO LRFD, ACI 347) and demonstrate that the specified loads are appropriate loads for our particular application. In particular, this section will focus on identifying any deficiencies in the existing load specification. The establishment of design loads and acceptability criterions were used subsequently in the following areas:
1. Evaluate existing SIP panels that are used locally for adequacy 2. Development of testing procedure and setting the loading limits for the testing 3. Development of SIP formwork design specification
A wide range of standards was reviewed as part of the process for establishing the appropriate design loads for SIP formwork (Table 6). AS 3610 and the BS EN 12812 do not specifically refer to precast SIP formwork. However, it can be assumed that SIP forms must perform to the same level as the removable forms. This is what has been assumed for our purpose. Overall, the AASHTO (LRFD) is the governing code of practice for bridge design in Wisconsin and is used as a key reference for our application.
Table 6: National Design Standards Reviewed
ASCE 37 – 2002 Design Loads on Structures during Construction ANSI A10.8 – 2001 American National Standard for Construction and Demolition
Operations: Safety Requirements for Scaffolding AASHTO – 2004 LRFD Bridge Design Specifications ACI 347R – 2004 Guide to Formwork for Concrete AS 3610 – 1995 Formwork for Concrete BS 5975 – 1996 Code of Practice for Falsework BS EN 12812 - 2004 Falsework – Performance Requirements and General Design ACI 318 – 2005 Building code requirements for structural concrete
Design Loads – Static or Quasi-static Design loads are typically expressed as a set of static dead and live loads. Dead loads are more straightforward as they consist of self weight of the structure and the actual superimposed dead loads that can be accurately estimated for design or are clearly stipulated in design codes. There are two major philosophies of design – allowable stress design (ASD) and load and resistant factor design (LRFD). ASD is a more straightforward method that places a safety factor on
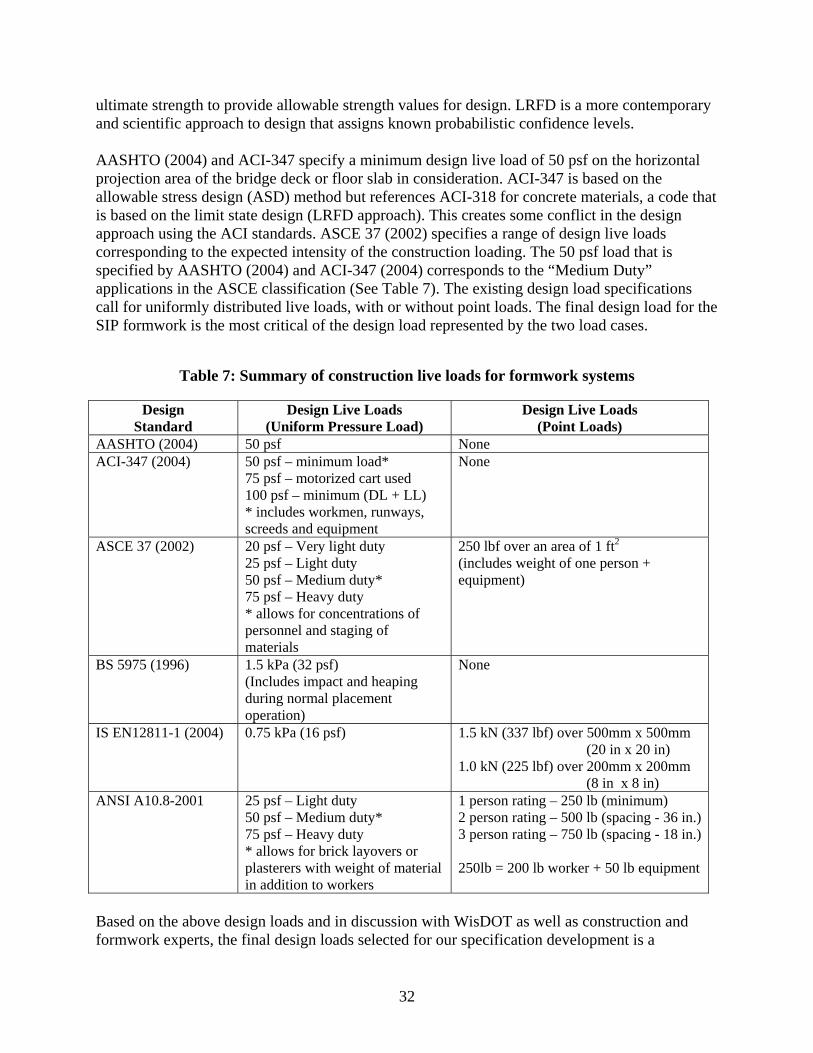
32
ultimate strength to provide allowable strength values for design. LRFD is a more contemporary and scientific approach to design that assigns known probabilistic confidence levels. AASHTO (2004) and ACI-347 specify a minimum design live load of 50 psf on the horizontal projection area of the bridge deck or floor slab in consideration. ACI-347 is based on the allowable stress design (ASD) method but references ACI-318 for concrete materials, a code that is based on the limit state design (LRFD approach). This creates some conflict in the design approach using the ACI standards. ASCE 37 (2002) specifies a range of design live loads corresponding to the expected intensity of the construction loading. The 50 psf load that is specified by AASHTO (2004) and ACI-347 (2004) corresponds to the “Medium Duty” applications in the ASCE classification (See Table 7). The existing design load specifications call for uniformly distributed live loads, with or without point loads. The final design load for the SIP formwork is the most critical of the design load represented by the two load cases.
Table 7: Summary of construction live loads for formwork systems
Design Standard
Design Live Loads (Uniform Pressure Load)
Design Live Loads (Point Loads)
AASHTO (2004) 50 psf None ACI-347 (2004) 50 psf – minimum load*
75 psf – motorized cart used 100 psf – minimum (DL + LL) * includes workmen, runways, screeds and equipment
None
ASCE 37 (2002) 20 psf – Very light duty 25 psf – Light duty 50 psf – Medium duty* 75 psf – Heavy duty * allows for concentrations of personnel and staging of materials
250 lbf over an area of 1 ft2 (includes weight of one person + equipment)
BS 5975 (1996) 1.5 kPa (32 psf) (Includes impact and heaping during normal placement operation)
None
IS EN12811-1 (2004) 0.75 kPa (16 psf)
1.5 kN (337 lbf) over 500mm x 500mm (20 in x 20 in) 1.0 kN (225 lbf) over 200mm x 200mm (8 in x 8 in)
ANSI A10.8-2001 25 psf – Light duty 50 psf – Medium duty* 75 psf – Heavy duty * allows for brick layovers or plasterers with weight of material in addition to workers
1 person rating – 250 lb (minimum) 2 person rating – 500 lb (spacing - 36 in.) 3 person rating – 750 lb (spacing - 18 in.) 250lb = 200 lb worker + 50 lb equipment
Based on the above design loads and in discussion with WisDOT as well as construction and formwork experts, the final design loads selected for our specification development is a

33
combination of uniform live load and point live load (see Table 8). The uniform loading represents typical construction loads that can be expected in local highway bridges (medium duty). For any special loading scenarios, design loads would need to be increased accordingly. There is no specific design code that requires an increase in point load for wider panel. ANSI A10.8 (2001) requires additional point load for a longer span. It is logical that for wider SIP forms, additional point loads need to be considered and the above ANSI code has been used as a guide to establish the width of the panel over which the 250lb point load can be expected to be applied (Fig. 35).
Table 8: Final established static design construction live loads
Design Live Loads (Uniform Pressure Load)
Design Live Loads (Point Loads)
50 psf – Medium duty 250 lb (Width < 3 ft) 2 x 250 lb (<3ft < Width < 6 ft)
Figure 35: Plan view sketch of formwork width with respect to girder orientation
Design Loads – Dynamic and Impact As was evident from the field impact test and based on feedback from the local contractors, accidental impact loads could be significant for the design of the SIP formwork panels. For our particular application which involves handling of the formwork over considerable height, the failure of a formwork panel could represent a serious safety hazard. Considerations for safety of the workers require the consideration of typical impact loads that can be expected during construction and how the panels can be designed for such loads. AASHTO (2004) and the ACI-347 (2004) do not have any requirements for impact loads. ASCE 37 (2002) indicates that the point load specified includes some form of impact load. The code
SIP Forms(3 panels)
Width
Bridge Girder(top-flange)
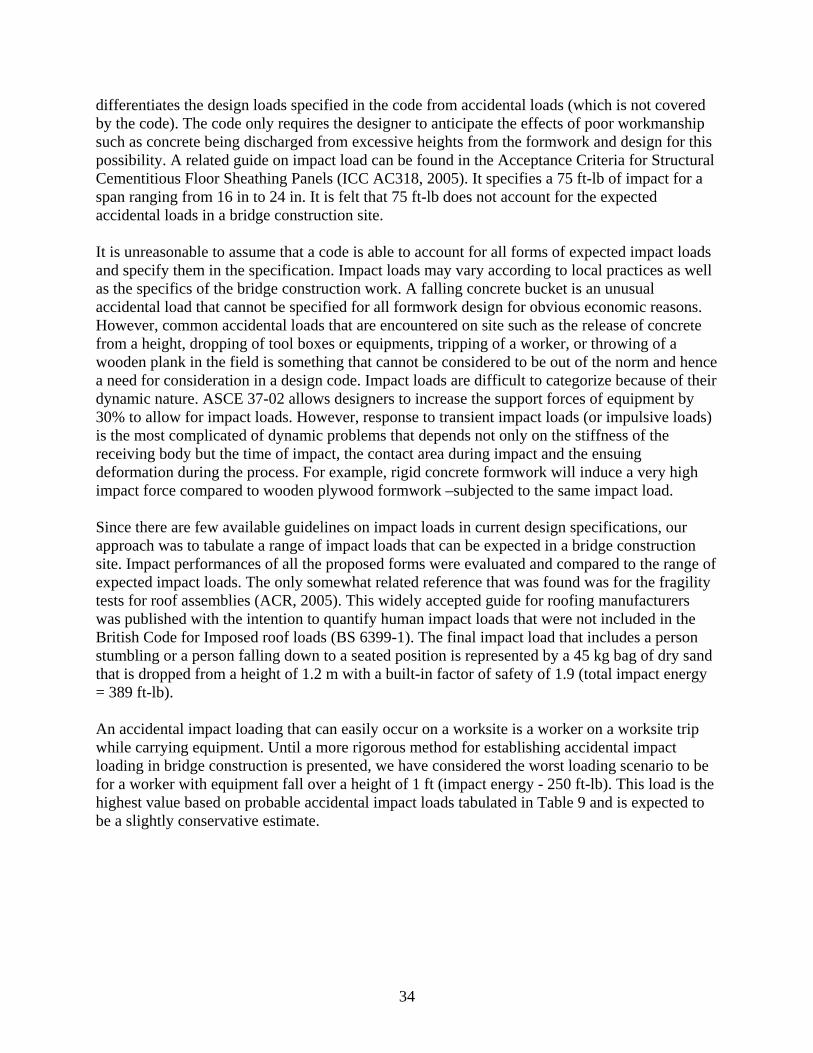
34
differentiates the design loads specified in the code from accidental loads (which is not covered by the code). The code only requires the designer to anticipate the effects of poor workmanship such as concrete being discharged from excessive heights from the formwork and design for this possibility. A related guide on impact load can be found in the Acceptance Criteria for Structural Cementitious Floor Sheathing Panels (ICC AC318, 2005). It specifies a 75 ft-lb of impact for a span ranging from 16 in to 24 in. It is felt that 75 ft-lb does not account for the expected accidental loads in a bridge construction site. It is unreasonable to assume that a code is able to account for all forms of expected impact loads and specify them in the specification. Impact loads may vary according to local practices as well as the specifics of the bridge construction work. A falling concrete bucket is an unusual accidental load that cannot be specified for all formwork design for obvious economic reasons. However, common accidental loads that are encountered on site such as the release of concrete from a height, dropping of tool boxes or equipments, tripping of a worker, or throwing of a wooden plank in the field is something that cannot be considered to be out of the norm and hence a need for consideration in a design code. Impact loads are difficult to categorize because of their dynamic nature. ASCE 37-02 allows designers to increase the support forces of equipment by 30% to allow for impact loads. However, response to transient impact loads (or impulsive loads) is the most complicated of dynamic problems that depends not only on the stiffness of the receiving body but the time of impact, the contact area during impact and the ensuing deformation during the process. For example, rigid concrete formwork will induce a very high impact force compared to wooden plywood formwork –subjected to the same impact load. Since there are few available guidelines on impact loads in current design specifications, our approach was to tabulate a range of impact loads that can be expected in a bridge construction site. Impact performances of all the proposed forms were evaluated and compared to the range of expected impact loads. The only somewhat related reference that was found was for the fragility tests for roof assemblies (ACR, 2005). This widely accepted guide for roofing manufacturers was published with the intention to quantify human impact loads that were not included in the British Code for Imposed roof loads (BS 6399-1). The final impact load that includes a person stumbling or a person falling down to a seated position is represented by a 45 kg bag of dry sand that is dropped from a height of 1.2 m with a built-in factor of safety of 1.9 (total impact energy = 389 ft-lb). An accidental impact loading that can easily occur on a worksite is a worker on a worksite trip while carrying equipment. Until a more rigorous method for establishing accidental impact loading in bridge construction is presented, we have considered the worst loading scenario to be for a worker with equipment fall over a height of 1 ft (impact energy - 250 ft-lb). This load is the highest value based on probable accidental impact loads tabulated in Table 9 and is expected to be a slightly conservative estimate.
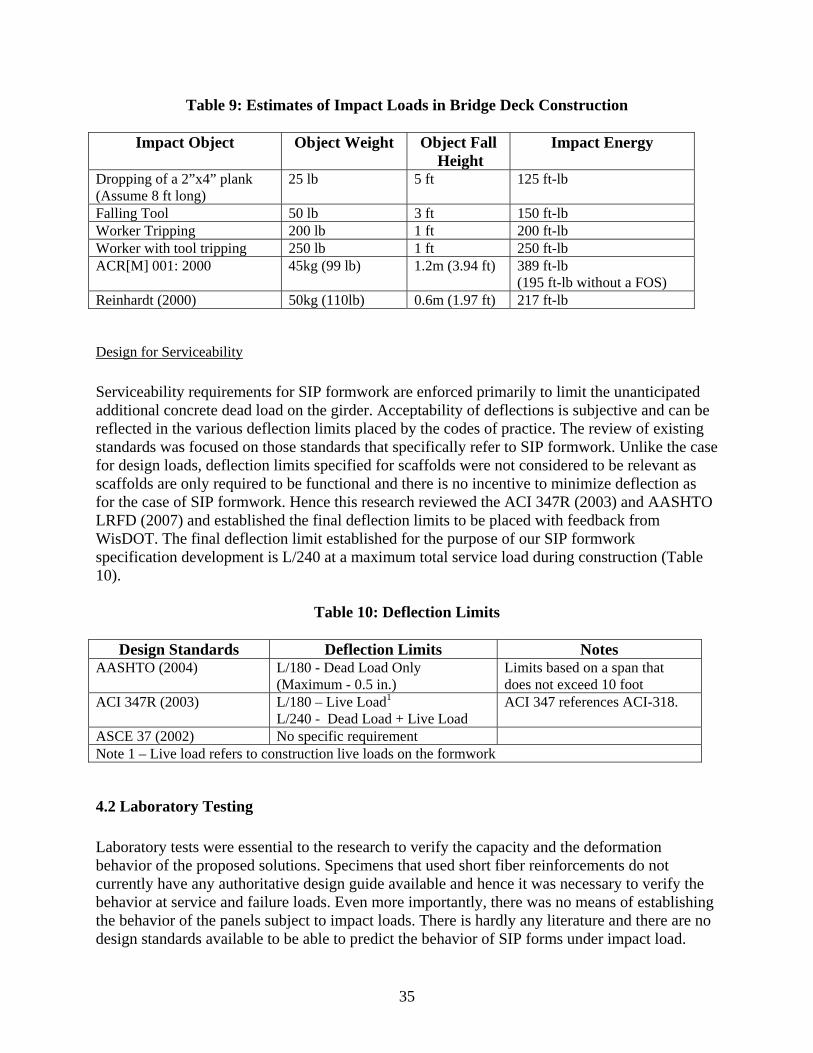
35
Table 9: Estimates of Impact Loads in Bridge Deck Construction
Impact Object Object Weight Object Fall Height
Impact Energy
Dropping of a 2”x4” plank (Assume 8 ft long)
25 lb 5 ft 125 ft-lb
Falling Tool 50 lb 3 ft 150 ft-lb Worker Tripping 200 lb 1 ft 200 ft-lb Worker with tool tripping 250 lb 1 ft 250 ft-lb ACR[M] 001: 2000 45kg (99 lb) 1.2m (3.94 ft) 389 ft-lb
(195 ft-lb without a FOS) Reinhardt (2000) 50kg (110lb) 0.6m (1.97 ft) 217 ft-lb
Design for Serviceability Serviceability requirements for SIP formwork are enforced primarily to limit the unanticipated additional concrete dead load on the girder. Acceptability of deflections is subjective and can be reflected in the various deflection limits placed by the codes of practice. The review of existing standards was focused on those standards that specifically refer to SIP formwork. Unlike the case for design loads, deflection limits specified for scaffolds were not considered to be relevant as scaffolds are only required to be functional and there is no incentive to minimize deflection as for the case of SIP formwork. Hence this research reviewed the ACI 347R (2003) and AASHTO LRFD (2007) and established the final deflection limits to be placed with feedback from WisDOT. The final deflection limit established for the purpose of our SIP formwork specification development is L/240 at a maximum total service load during construction (Table 10).
Table 10: Deflection Limits
Design Standards Deflection Limits Notes AASHTO (2004) L/180 - Dead Load Only
(Maximum - 0.5 in.) Limits based on a span that does not exceed 10 foot
ACI 347R (2003) L/180 – Live Load1 L/240 - Dead Load + Live Load
ACI 347 references ACI-318.
ASCE 37 (2002) No specific requirement Note 1 – Live load refers to construction live loads on the formwork
4.2 Laboratory Testing
Laboratory tests were essential to the research to verify the capacity and the deformation behavior of the proposed solutions. Specimens that used short fiber reinforcements do not currently have any authoritative design guide available and hence it was necessary to verify the behavior at service and failure loads. Even more importantly, there was no means of establishing the behavior of the panels subject to impact loads. There is hardly any literature and there are no design standards available to be able to predict the behavior of SIP forms under impact load.
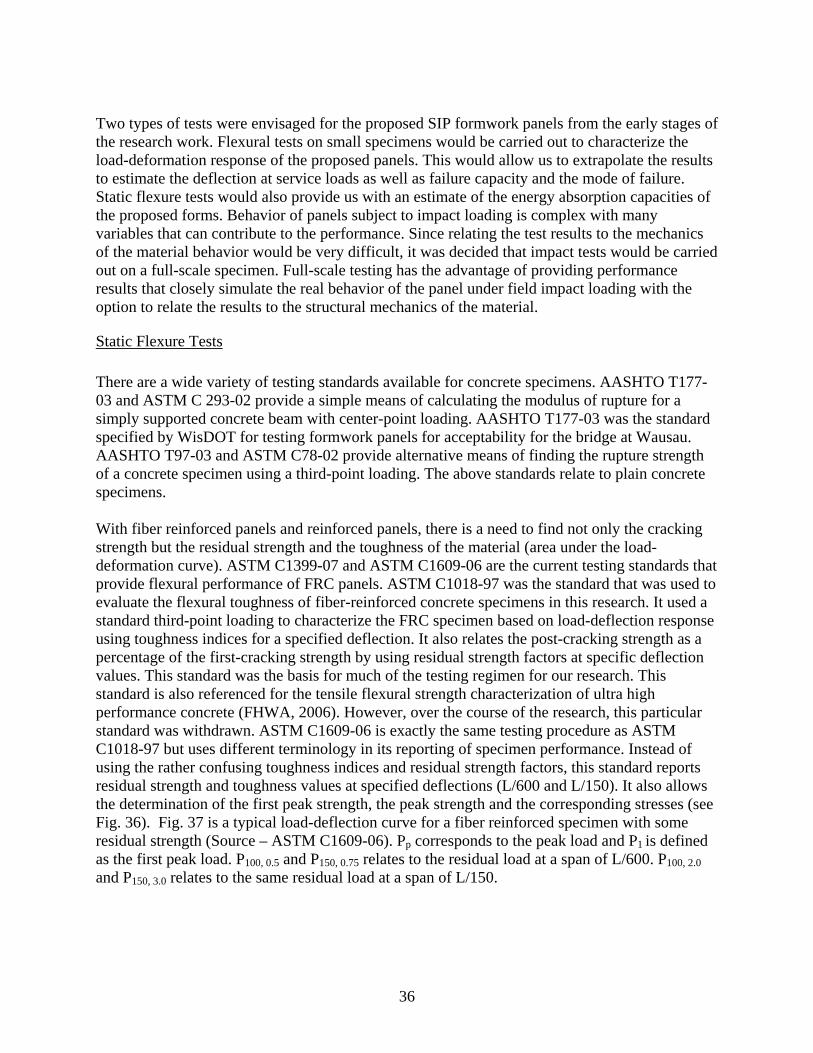
36
Two types of tests were envisaged for the proposed SIP formwork panels from the early stages of the research work. Flexural tests on small specimens would be carried out to characterize the load-deformation response of the proposed panels. This would allow us to extrapolate the results to estimate the deflection at service loads as well as failure capacity and the mode of failure. Static flexure tests would also provide us with an estimate of the energy absorption capacities of the proposed forms. Behavior of panels subject to impact loading is complex with many variables that can contribute to the performance. Since relating the test results to the mechanics of the material behavior would be very difficult, it was decided that impact tests would be carried out on a full-scale specimen. Full-scale testing has the advantage of providing performance results that closely simulate the real behavior of the panel under field impact loading with the option to relate the results to the structural mechanics of the material.
Static Flexure Tests There are a wide variety of testing standards available for concrete specimens. AASHTO T177-03 and ASTM C 293-02 provide a simple means of calculating the modulus of rupture for a simply supported concrete beam with center-point loading. AASHTO T177-03 was the standard specified by WisDOT for testing formwork panels for acceptability for the bridge at Wausau. AASHTO T97-03 and ASTM C78-02 provide alternative means of finding the rupture strength of a concrete specimen using a third-point loading. The above standards relate to plain concrete specimens. With fiber reinforced panels and reinforced panels, there is a need to find not only the cracking strength but the residual strength and the toughness of the material (area under the load-deformation curve). ASTM C1399-07 and ASTM C1609-06 are the current testing standards that provide flexural performance of FRC panels. ASTM C1018-97 was the standard that was used to evaluate the flexural toughness of fiber-reinforced concrete specimens in this research. It used a standard third-point loading to characterize the FRC specimen based on load-deflection response using toughness indices for a specified deflection. It also relates the post-cracking strength as a percentage of the first-cracking strength by using residual strength factors at specific deflection values. This standard was the basis for much of the testing regimen for our research. This standard is also referenced for the tensile flexural strength characterization of ultra high performance concrete (FHWA, 2006). However, over the course of the research, this particular standard was withdrawn. ASTM C1609-06 is exactly the same testing procedure as ASTM C1018-97 but uses different terminology in its reporting of specimen performance. Instead of using the rather confusing toughness indices and residual strength factors, this standard reports residual strength and toughness values at specified deflections (L/600 and L/150). It also allows the determination of the first peak strength, the peak strength and the corresponding stresses (see Fig. 36). Fig. 37 is a typical load-deflection curve for a fiber reinforced specimen with some residual strength (Source – ASTM C1609-06). Pp corresponds to the peak load and P1 is defined as the first peak load. P100, 0.5 and P150, 0.75 relates to the residual load at a span of L/600. P100, 2.0 and P150, 3.0 relates to the same residual load at a span of L/150.
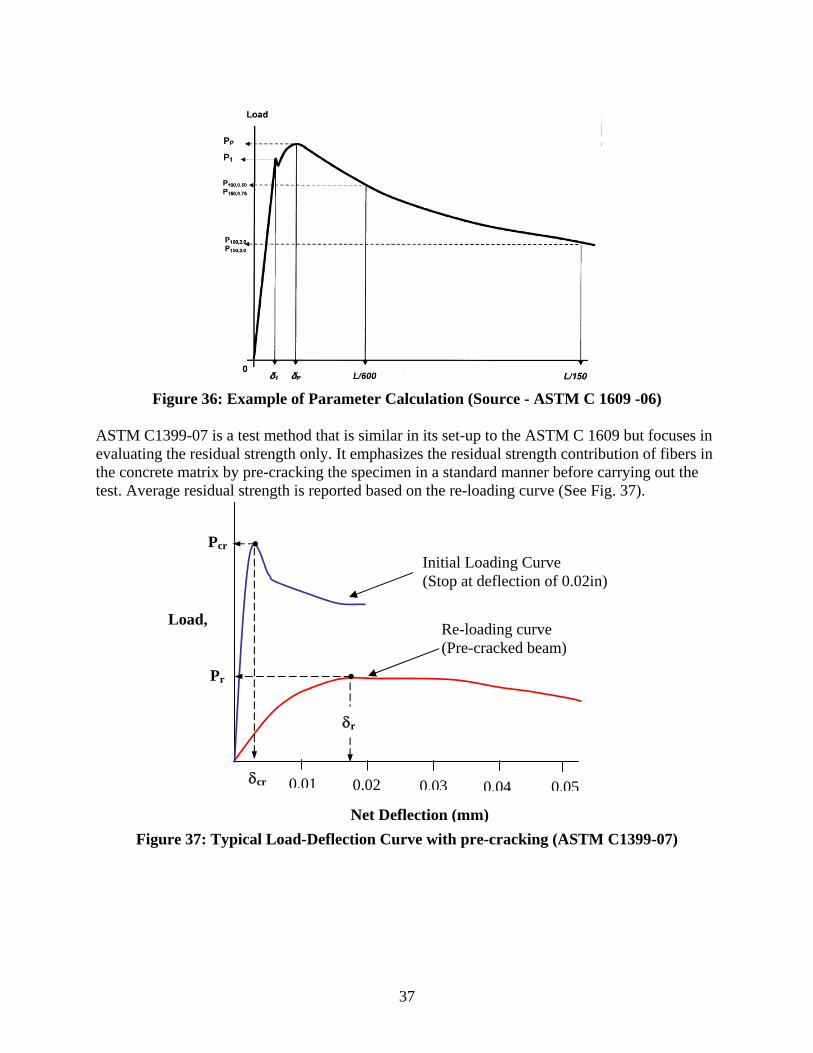
37
Figure 36: Example of Parameter Calculation (Source - ASTM C 1609 -06)
ASTM C1399-07 is a test method that is similar in its set-up to the ASTM C 1609 but focuses in evaluating the residual strength only. It emphasizes the residual strength contribution of fibers in the concrete matrix by pre-cracking the specimen in a standard manner before carrying out the test. Average residual strength is reported based on the re-loading curve (See Fig. 37).
Figure 37: Typical Load-Deflection Curve with pre-cracking (ASTM C1399-07)
Net Deflection (mm)
Load,
0.01 0.02 0.03 0.04 0.05
Re-loading curve (Pre-cracked beam)
Initial Loading Curve (Stop at deflection of 0.02in)
Pcr
δr
Pr
δcr
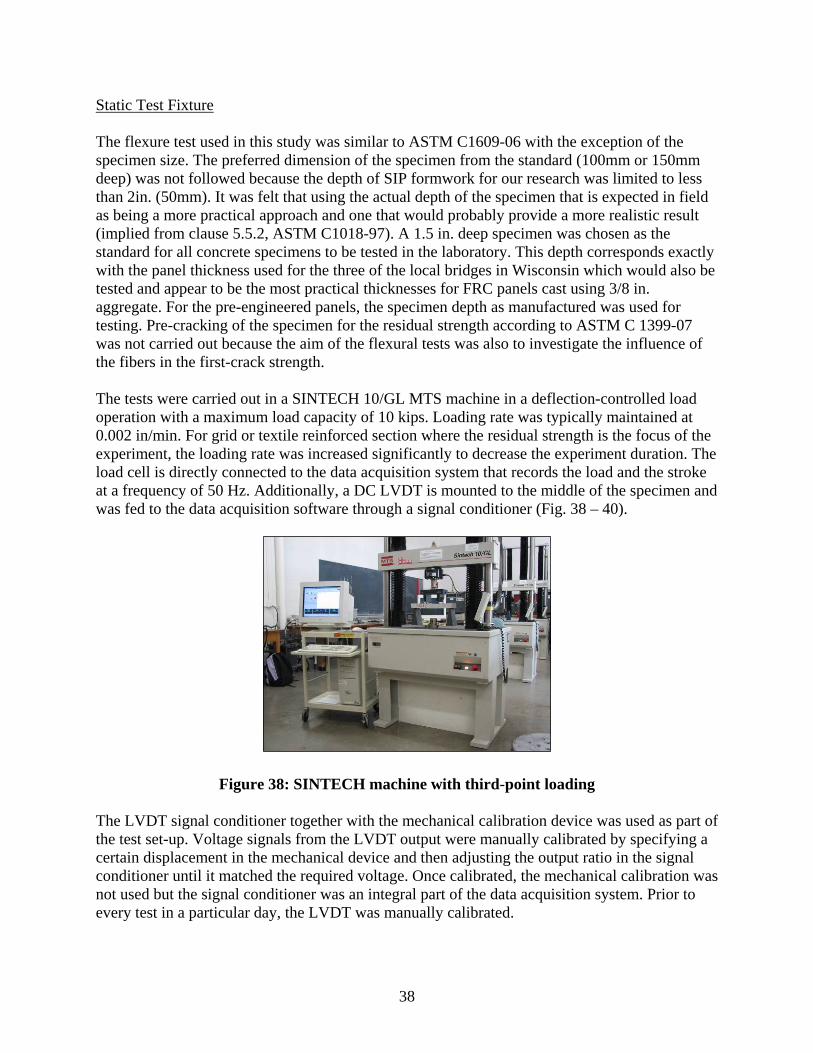
38
Static Test Fixture The flexure test used in this study was similar to ASTM C1609-06 with the exception of the specimen size. The preferred dimension of the specimen from the standard (100mm or 150mm deep) was not followed because the depth of SIP formwork for our research was limited to less than 2in. (50mm). It was felt that using the actual depth of the specimen that is expected in field as being a more practical approach and one that would probably provide a more realistic result (implied from clause 5.5.2, ASTM C1018-97). A 1.5 in. deep specimen was chosen as the standard for all concrete specimens to be tested in the laboratory. This depth corresponds exactly with the panel thickness used for the three of the local bridges in Wisconsin which would also be tested and appear to be the most practical thicknesses for FRC panels cast using 3/8 in. aggregate. For the pre-engineered panels, the specimen depth as manufactured was used for testing. Pre-cracking of the specimen for the residual strength according to ASTM C 1399-07 was not carried out because the aim of the flexural tests was also to investigate the influence of the fibers in the first-crack strength. The tests were carried out in a SINTECH 10/GL MTS machine in a deflection-controlled load operation with a maximum load capacity of 10 kips. Loading rate was typically maintained at 0.002 in/min. For grid or textile reinforced section where the residual strength is the focus of the experiment, the loading rate was increased significantly to decrease the experiment duration. The load cell is directly connected to the data acquisition system that records the load and the stroke at a frequency of 50 Hz. Additionally, a DC LVDT is mounted to the middle of the specimen and was fed to the data acquisition software through a signal conditioner (Fig. 38 – 40).
Figure 38: SINTECH machine with third-point loading
The LVDT signal conditioner together with the mechanical calibration device was used as part of the test set-up. Voltage signals from the LVDT output were manually calibrated by specifying a certain displacement in the mechanical device and then adjusting the output ratio in the signal conditioner until it matched the required voltage. Once calibrated, the mechanical calibration was not used but the signal conditioner was an integral part of the data acquisition system. Prior to every test in a particular day, the LVDT was manually calibrated.
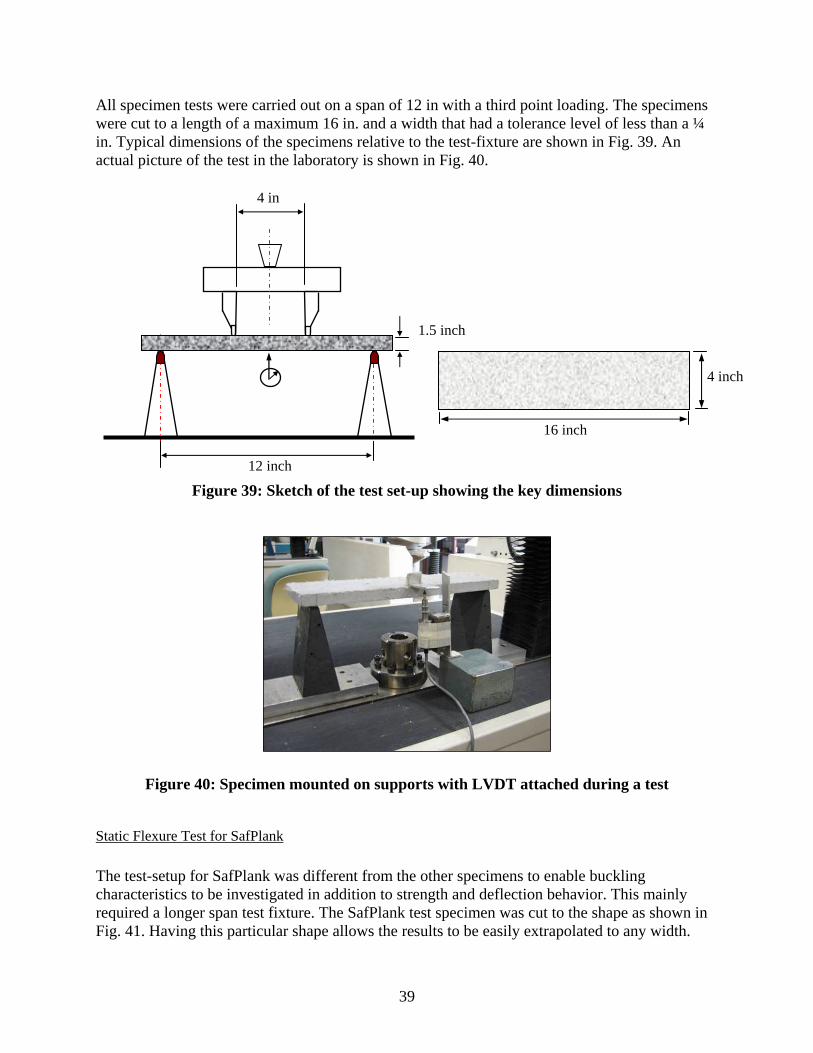
39
All specimen tests were carried out on a span of 12 in with a third point loading. The specimens were cut to a length of a maximum 16 in. and a width that had a tolerance level of less than a ¼ in. Typical dimensions of the specimens relative to the test-fixture are shown in Fig. 39. An actual picture of the test in the laboratory is shown in Fig. 40.
Figure 39: Sketch of the test set-up showing the key dimensions
Figure 40: Specimen mounted on supports with LVDT attached during a test
Static Flexure Test for SafPlank The test-setup for SafPlank was different from the other specimens to enable buckling characteristics to be investigated in addition to strength and deflection behavior. This mainly required a longer span test fixture. The SafPlank test specimen was cut to the shape as shown in Fig. 41. Having this particular shape allows the results to be easily extrapolated to any width.
4 inch
16 inch
12 inch
4 in
1.5 inch

40
The testing was carried out using an INSTRON – 30kip testing machine attached with an X-Y plotter that would continuously output hard-copies of the load-deflection behavior throughout the testing process. The cross-head movements and the load cell readings were captured by a separate data acquisition system running the proprietary LabView software. The picture of the actual test in progress is shown Fig. 41 and 42.
Figure 41: INSTRON (30kip) Control Panel and X-Y Plotter Bottom) and load head (top)

41
Figure 42: INSTRON Testing Frame with adjustable supports
Full-Scale Impact Test Numerous impact tests exist for flat, partially homogenous materials such as plastics. These are either represented by a falling object type impact (Gardner Impact) or a pendulum type impact (Izod). ASTM D5420 (2004) uses a falling weight to activate a striker and crack or break a specimen which allows impact resistance values to be reported (Gardner Impact). ASTM D 5628 (2001) uses a similar falling dart (tup) to directly strike and crack/break the specimen. ASTM D256 (2006) uses a Izod-type impact machine to strike and break a notched specimen allowing energy absorbed per unit width or area to be reported. All these tests are for very small specimen sizes (thickness typically less than ½ in.) that are homogenous to some extent and hence are not applicable for our SIP formwork (which requires the panel to be tested compositely with the reinforcement). For full-sized large specimens, Banthia et al (1989) used a modified falling weight machine to test concrete beam specimens undergoing three-point flexural impact loading. Beams reinforced with fibers and conventional steel reinforcement were tested successfully using this test set-up. The full-scale test methods in the ASTM standards for impact loading are ASTM E 661 (2003) and ASTM E 695-03. Both these test methods provide a basis for measuring the relative impact resistance of floor, roof and wall panels by dropping a leather bag filled with lead pellets. Both these test methods provide response of the panels subject to soft-body impact loads where the load is not expressly stated but is to be specified by the party requiring the tests. Although similar in testing set-up, ASTM E 661 caters primarily for wood-based materials and is not applicable for our tests. ASTM E695 provides a deflection reading after each successive drop of the load and hence is not rigorous in its test setup to provide useful data for research purpose. However, the test set-up protocols are useful for the development of our specification for the full sized impact load test.

42
ICC Acceptance Criteria, AC32 and AC318 provide acceptability criteria for impact loads. ICC AC32 provides acceptability criteria for SNFRC by counting the number of steel ball drops (15 ft-lb energy per drop) required to crack or fail the specimen. ICC AC318 (2005) specifies a 75ft-lb impact load followed by a 400 lbf static load as performance criteria for structural cementitious floor sheathing. There are very limited test data on formwork panels for impact loading. Reinhardt (2000) used a 50kg leather bag filled with glass beads (0.4m diameter) dropped from a height of 0.6m to simulate a falling object or a person jumping on a panel during construction (impact energy = 216 ft-lb). Roofing assembly fragility tests (ACR, 2000) which has similar concerns for safety of workers specifies a 45kg sand bag dropped from a height of 1.2m with a built in safety factor of 1.9 (Fig. 43). Based on the above two impact load tests that have the same concern of human impact load or a falling object impact load, the set-up for our impact test was defined.
Figure 43: Arrangement for Drop Test (Source – ACR [M]-001, 2000)
Full-Scale Impact Test Fixture
A schematic of the test fixture used for the laboratory tests on full sized SIP form work panel is shown in Fig. 44. The dimensions of the specimen and striker head are shown in Fig. 45. Tests were conducted on a span of 28 in. for a full sized panel of total length 32 in. and 4 ft. wide. The 50lbf weight consisting of steel block is dropped on top of a neoprene pad at approximately 6in. height increments until failure. Crack developments are marked and photographed after each impact drop. For those specimens where the impact drop height reaches 84in (7ft), the drops are repeated three times from the same height. Video of the impact was captured for each impact test at a frame rate of 30 frames per second. Failure of the specimen is defined as when the panel breaks completely into two or more pieces. A picture of an actual test specimen with the striker object is shown in Fig. 46. Accelerometers (DC types) were mounted on both the striker and the formwork panel. The two types of accelerometers used are listed in Table 11. The 500g accelerometers were primarily used in the striker object because of the expected higher accelerations. For very high impact
300 mm
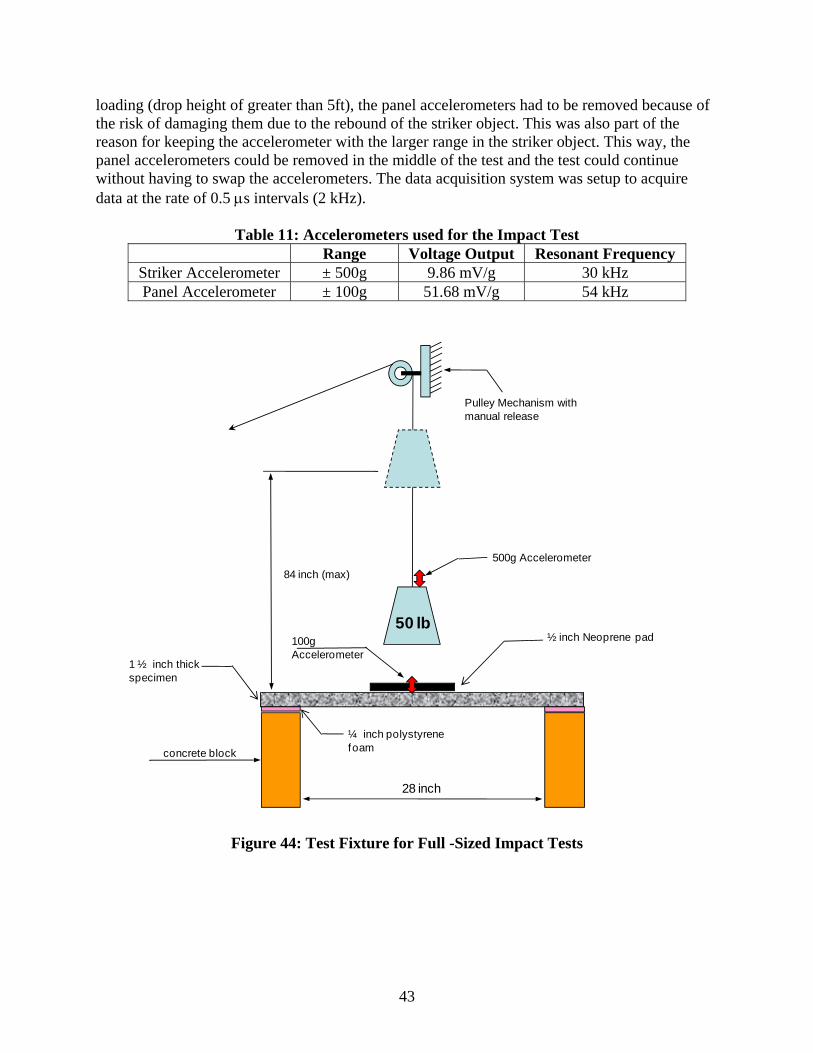
43
loading (drop height of greater than 5ft), the panel accelerometers had to be removed because of the risk of damaging them due to the rebound of the striker object. This was also part of the reason for keeping the accelerometer with the larger range in the striker object. This way, the panel accelerometers could be removed in the middle of the test and the test could continue without having to swap the accelerometers. The data acquisition system was setup to acquire data at the rate of 0.5 μs intervals (2 kHz).
Table 11: Accelerometers used for the Impact Test Range Voltage Output Resonant Frequency
Striker Accelerometer ± 500g 9.86 mV/g 30 kHz Panel Accelerometer ± 100g 51.68 mV/g 54 kHz
Figure 44: Test Fixture for Full -Sized Impact Tests
100g Accelerometer
50 lb½ inch Neoprene pad
84 inch (max)
1 ½ inch thick specimen
¼ inch polystyrene foam
28 inch
concrete block
Pulley Mechanism with manual release
500g Accelerometer
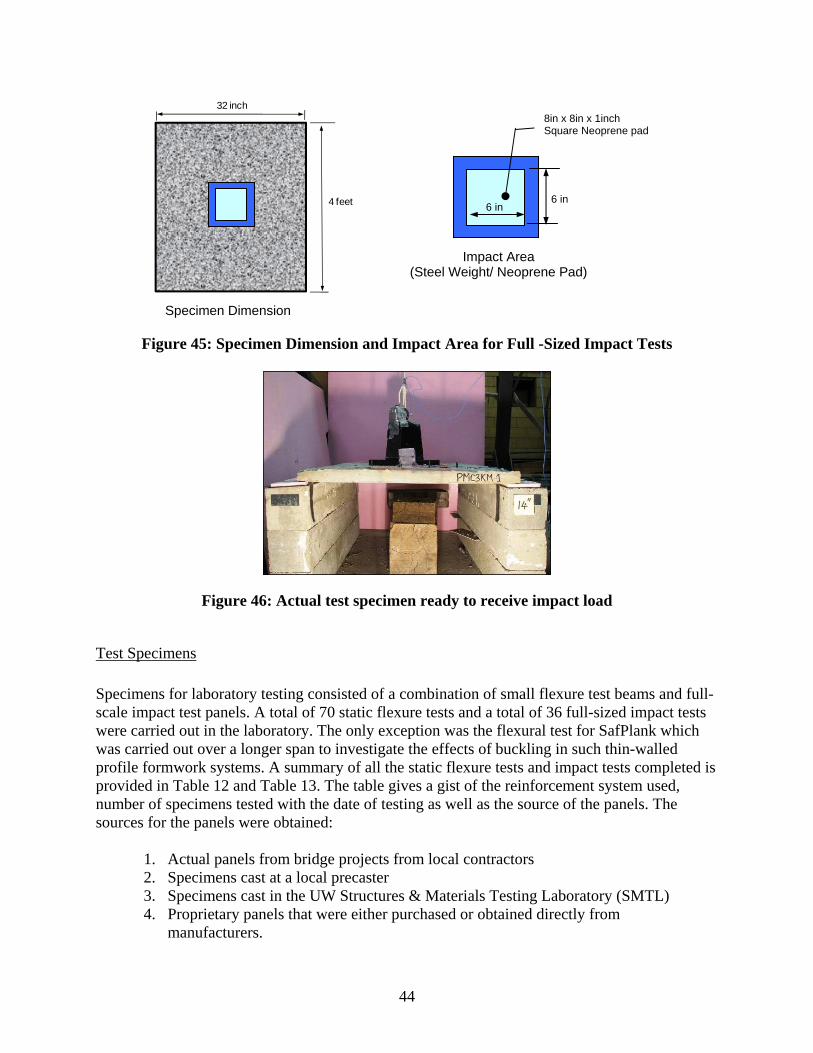
44
Figure 45: Specimen Dimension and Impact Area for Full -Sized Impact Tests
Figure 46: Actual test specimen ready to receive impact load
Test Specimens
Specimens for laboratory testing consisted of a combination of small flexure test beams and full-scale impact test panels. A total of 70 static flexure tests and a total of 36 full-sized impact tests were carried out in the laboratory. The only exception was the flexural test for SafPlank which was carried out over a longer span to investigate the effects of buckling in such thin-walled profile formwork systems. A summary of all the static flexure tests and impact tests completed is provided in Table 12 and Table 13. The table gives a gist of the reinforcement system used, number of specimens tested with the date of testing as well as the source of the panels. The sources for the panels were obtained:
1. Actual panels from bridge projects from local contractors 2. Specimens cast at a local precaster 3. Specimens cast in the UW Structures & Materials Testing Laboratory (SMTL) 4. Proprietary panels that were either purchased or obtained directly from
manufacturers.
32 inch
4 feet
Specimen Dimension
Impact Area (Steel Weight/ Neoprene Pad)
6 in
8in x 8in x 1inch Square Neoprene pad
6 in
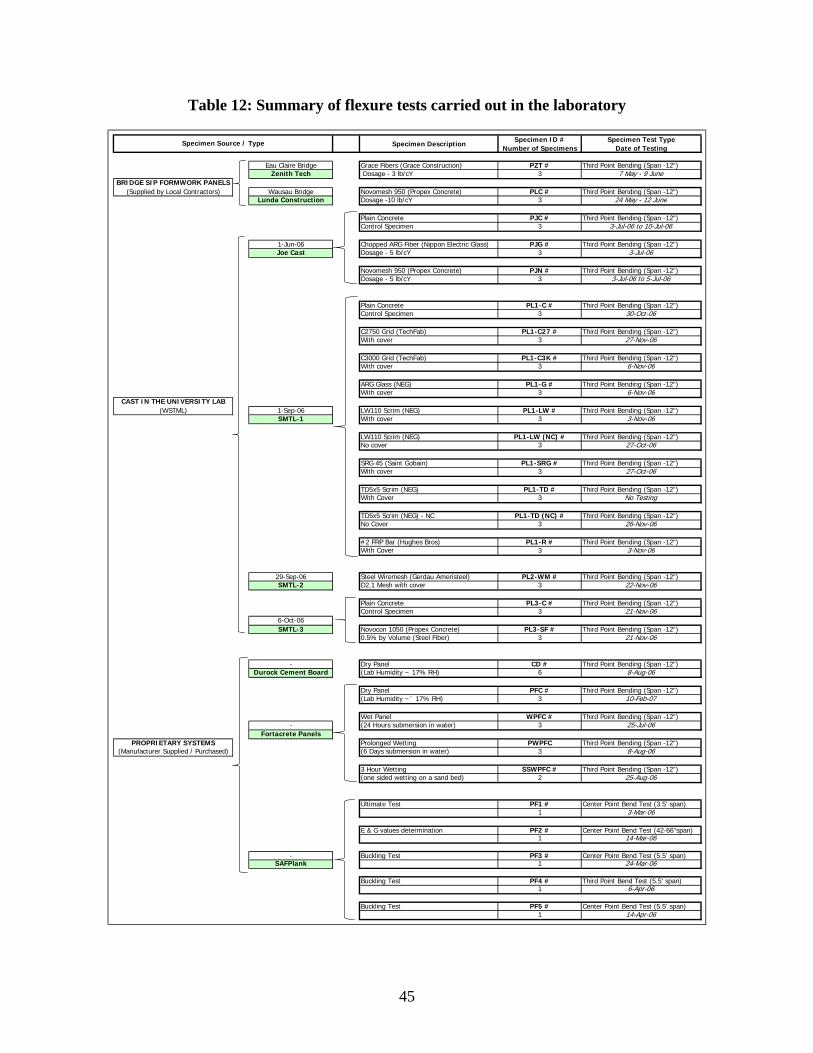
45
Table 12: Summary of flexure tests carried out in the laboratory
Specimen DescriptionSpecimen ID #
Number of SpecimensSpecimen Test Type
Date of Testing
Eau Claire Bridge Grace Fibers (Grace Construction) PZT # Third Point Bending (Span -12")Zenith Tech Dosage - 3 lb/cY 3 7 May - 9 June
BRIDGE SIP FORMWORK PANELS(Supplied by Local Contractors) Wausau Bridge Novomesh 950 (Propex Concrete) PLC # Third Point Bending (Span -12")
Lunda Construction Dosage -10 lb/cY 3 24 May - 12 June
Plain Concrete PJC # Third Point Bending (Span -12")Control Specimen 3 3-Jul-06 to 10-Jul-06
1-Jun-06 Chopped ARG Fiber (Nippon Electric Glass) PJG # Third Point Bending (Span -12")Joe Cast Dosage - 5 lb/cY 3 3-Jul-06
Novomesh 950 (Propex Concrete) PJN # Third Point Bending (Span -12")Dosage - 5 lb/cY 3 3-Jul-06 to 5-Jul-06
Plain Concrete PL1-C # Third Point Bending (Span -12")Control Specimen 3 30-Oct-06
C2750 Grid (TechFab) PL1-C27 # Third Point Bending (Span -12")With cover 3 27-Nov-06
C3000 Grid (TechFab) PL1-C3K # Third Point Bending (Span -12")With cover 3 6-Nov-06
ARG Glass (NEG) PL1-G # Third Point Bending (Span -12")With cover 3 6-Nov-06
CAST IN THE UNIVERSITY LAB(WSTML) 1-Sep-06 LW110 Scrim (NEG) PL1-LW # Third Point Bending (Span -12")
SMTL-1 With cover 3 3-Nov-06
LW110 Scrim (NEG) PL1-LW (NC) # Third Point Bending (Span -12")No cover 3 27-Oct-06
SRG 45 (Saint Gobain) PL1-SRG # Third Point Bending (Span -12")With cover 3 27-Oct-06
TD5x5 Scrim (NEG) PL1-TD # Third Point Bending (Span -12")With Cover 3 No Testing
TD5x5 Scrim (NEG) - NC PL1-TD (NC) # Third Point Bending (Span -12")No Cover 3 26-Nov-06
#2 FRP Bar (Hughes Bros) PL1-R # Third Point Bending (Span -12")With Cover 3 3-Nov-06
29-Sep-06 Steel Wiremesh (Gerdau Ameristeel) PL2-WM # Third Point Bending (Span -12")SMTL-2 D2.1 Mesh with cover 3 22-Nov-06
Plain Concrete PL3-C # Third Point Bending (Span -12")Control Specimen 3 21-Nov-06
6-Oct-06SMTL-3 Novocon 1050 (Propex Concrete) PL3-SF # Third Point Bending (Span -12")
0.5% by Volume (Steel Fiber) 3 21-Nov-06
- Dry Panel CD # Third Point Bending (Span -12")Durock Cement Board (Lab Humidity ~ 17% RH) 6 8-Aug-06
Dry Panel PFC # Third Point Bending (Span -12")(Lab Humidity ~` 17% RH) 3 10-Feb-07
Wet Panel WPFC # Third Point Bending (Span -12")- (24 Hours submersion in water) 3 25-Jul-06
Fortacrete PanelsPROPRIETARY SYSTEMS Prolonged Wetting PWPFC Third Point Bending (Span -12")
(Manufacturer Supplied / Purchased) (6 Days submersion in water) 3 8-Aug-06
3 Hour Wetting SSWPFC # Third Point Bending (Span -12")(one sided wetting on a sand bed) 2 25-Aug-06
Ultimate Test PF1 # Center Point Bend Test (3.5' span)1 3-Mar-06
E & G values determination PF2 # Center Point Bend Test (42-66"span)1 14-Mar-06
- Buckling Test PF3 # Center Point Bend Test (5.5' span)SAFPlank 1 24-Mar-06
Buckling Test PF4 # Third Point Bend Test (5.5' span)1 6-Apr-06
Buckling Test PF5 # Center Point Bend Test (5.5' span)1 14-Apr-06
Specimen Source / Type
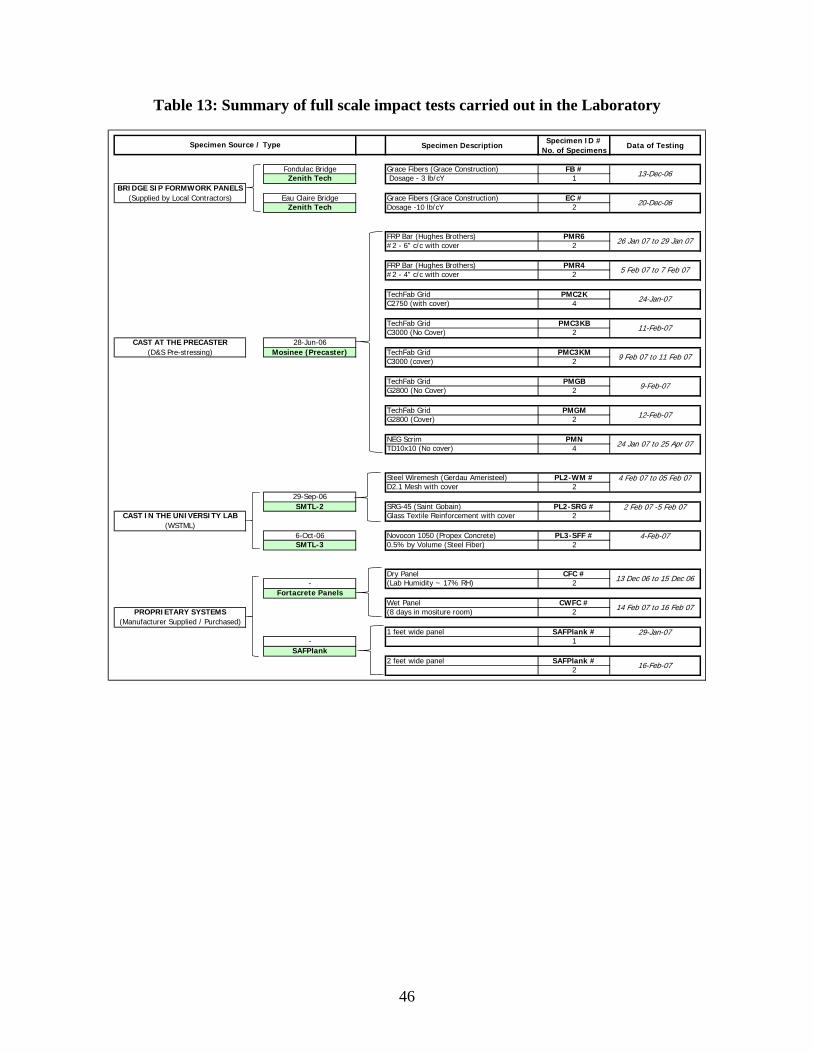
46
Table 13: Summary of full scale impact tests carried out in the Laboratory
Specimen DescriptionSpecimen ID #
No. of SpecimensData of Testing
Fondulac Bridge Grace Fibers (Grace Construction) FB #Zenith Tech Dosage - 3 lb/cY 1
BRIDGE SIP FORMWORK PANELS(Supplied by Local Contractors) Eau Claire Bridge Grace Fibers (Grace Construction) EC #
Zenith Tech Dosage -10 lb/cY 2
FRP Bar (Hughes Brothers) PMR6#2 - 6" c/c with cover 2
FRP Bar (Hughes Brothers) PMR4#2 - 4" c/c with cover 2
TechFab Grid PMC2KC2750 (with cover) 4
TechFab Grid PMC3KBC3000 (No Cover) 2
CAST AT THE PRECASTER 28-Jun-06(D&S Pre-stressing) Mosinee (Precaster) TechFab Grid PMC3KM
C3000 (cover) 2
TechFab Grid PMGBG2800 (No Cover) 2
TechFab Grid PMGMG2800 (Cover) 2
NEG Scrim PMNTD10x10 (No cover) 4
Steel Wiremesh (Gerdau Ameristeel) PL2-WM # 4 Feb 07 to 05 Feb 07D2.1 Mesh with cover 2
29-Sep-06SMTL-2 SRG-45 (Saint Gobain) PL2-SRG # 2 Feb 07 -5 Feb 07
CAST IN THE UNIVERSITY LAB Glass Textile Reinforcement with cover 2(WSTML)
6-Oct-06 Novocon 1050 (Propex Concrete) PL3-SFF # 4-Feb-07SMTL-3 0.5% by Volume (Steel Fiber) 2
Dry Panel CFC #- (Lab Humidity ~ 17% RH) 2
Fortacrete PanelsWet Panel CWFC #
PROPRIETARY SYSTEMS (8 days in mositure room) 2(Manufacturer Supplied / Purchased)
1 feet wide panel SAFPlank # 29-Jan-07- 1
SAFPlank2 feet wide panel SAFPlank #
2
24 Jan 07 to 25 Apr 07
11-Feb-07
9 Feb 07 to 11 Feb 07
9-Feb-07
12-Feb-07
13 Dec 06 to 15 Dec 06
14 Feb 07 to 16 Feb 07
16-Feb-07
Specimen Source / Type
13-Dec-06
20-Dec-06
26 Jan 07 to 29 Jan 07
5 Feb 07 to 7 Feb 07
24-Jan-07

47
Local Bridge Test Specimens
Full sized test specimens were obtained from the local bridge contractors for the three bridges described in Section 0 to Section 0. For the Eau Claire and Wausau bridge panels, pieces were cut from the full sized panels to carry out static flexure tests as per ASTM C1018. For the Fond du Lac bridge panels, only impact tests were carried out due to of time constraints. A summary of all the panels obtained from local bridge contractors and the type of tests carried out in the laboratory is provided in Table 14. The identification numbers for the test specimens are shown in Table 15 with the appropriate source for each of the test specimens. Concrete compressive strength data was not available readily except the strength that was specified in the contract. Mix design and the 7 day cylinder test results were available for the Eau Claire bridge panels (See Table 16). Static flexure tests in the lab required small specimens to be cut from the supplied panel (See Fig. 47).
Table 14: Distribution of static flexure and impact load tests for the bridge SIP forms
Table 15: Specimen Identification and Test Type (Bridge SIP Form Panels)
Specimen I.D SIP Formwork Source Test Type
PZT-1PZT-2PZT-3PLC-1PLC-2PLC-3
FB-1 Fond du Lac BridgeEC-1EC-2
ASTMStatic
Flexure
ImpactTest
Eau Claire Bridge
Wausau Bridge
Eau ClaireBridge
Bridge SIP Panels Bridge I.D.
Panel Dimensions
Fiber Reinforcements
Concrete Strength
# of PanelsReceived
# of Flexure Tests
# of ImpactTests
Eau Claire Bridge B18-166 2'- 8" x 4" x 1.5" Grace Fibers (3lb/cY) 5000 psi 3 3 2Fond du Lac Bridge B20-069 2'- 8" x 4" x 1.5" Grace Fibers (3lb/cY) 4000 psi 1 - 1Wausau Bridge B37-342 1' x 6' x 1.5" Novomesh 950 (10lb/cY) 4000 psi 3 3 -
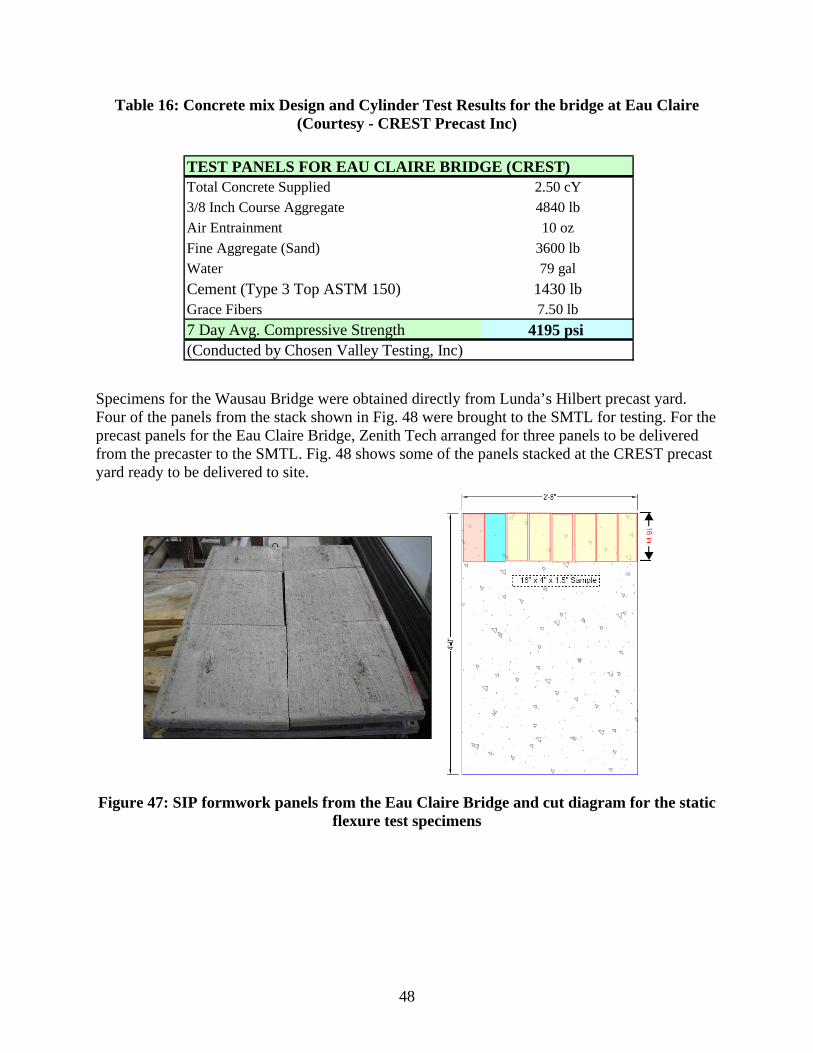
48
Table 16: Concrete mix Design and Cylinder Test Results for the bridge at Eau Claire (Courtesy - CREST Precast Inc)
Specimens for the Wausau Bridge were obtained directly from Lunda’s Hilbert precast yard. Four of the panels from the stack shown in Fig. 48 were brought to the SMTL for testing. For the precast panels for the Eau Claire Bridge, Zenith Tech arranged for three panels to be delivered from the precaster to the SMTL. Fig. 48 shows some of the panels stacked at the CREST precast yard ready to be delivered to site.
Figure 47: SIP formwork panels from the Eau Claire Bridge and cut diagram for the static flexure test specimens
TEST PANELS FOR EAU CLAIRE BRIDGE (CREST)Total Concrete Supplied 2.50 cY3/8 Inch Course Aggregate 4840 lbAir Entrainment 10 ozFine Aggregate (Sand) 3600 lbWater 79 galCement (Type 3 Top ASTM 150) 1430 lbGrace Fibers 7.50 lb7 Day Avg. Compressive Strength 4195 psi (Conducted by Chosen Valley Testing, Inc)
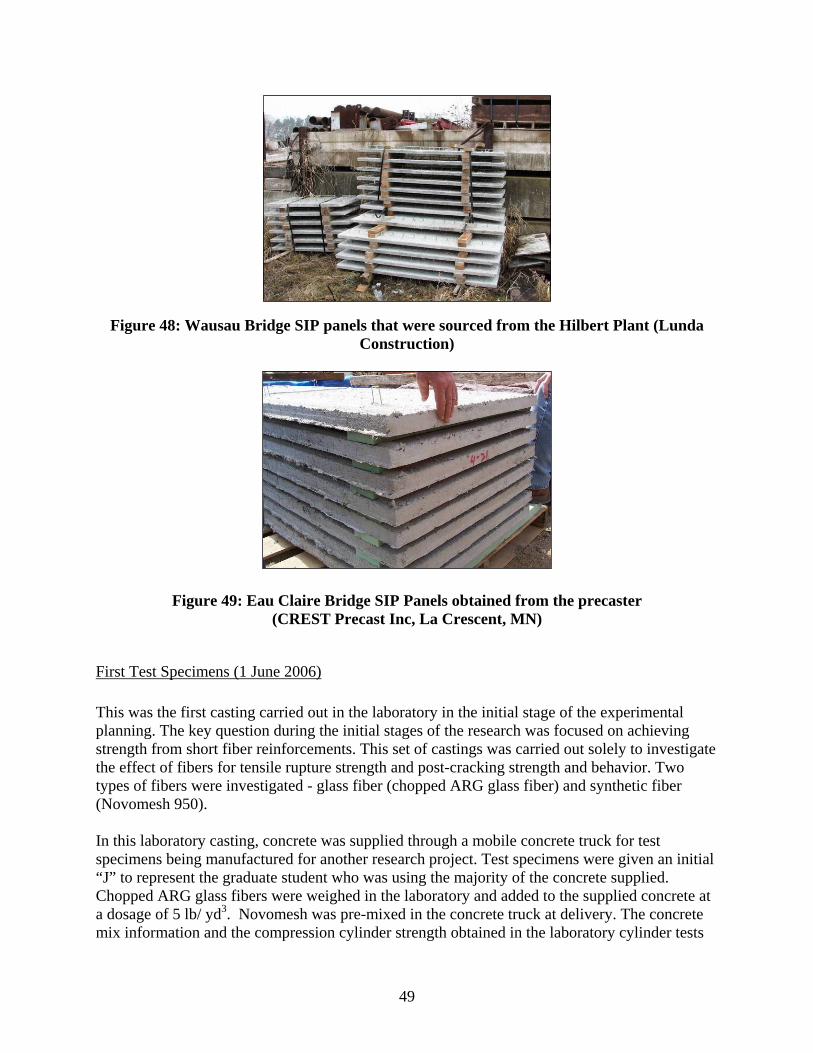
49
Figure 48: Wausau Bridge SIP panels that were sourced from the Hilbert Plant (Lunda Construction)
Figure 49: Eau Claire Bridge SIP Panels obtained from the precaster
(CREST Precast Inc, La Crescent, MN)
First Test Specimens (1 June 2006)
This was the first casting carried out in the laboratory in the initial stage of the experimental planning. The key question during the initial stages of the research was focused on achieving strength from short fiber reinforcements. This set of castings was carried out solely to investigate the effect of fibers for tensile rupture strength and post-cracking strength and behavior. Two types of fibers were investigated - glass fiber (chopped ARG glass fiber) and synthetic fiber (Novomesh 950). In this laboratory casting, concrete was supplied through a mobile concrete truck for test specimens being manufactured for another research project. Test specimens were given an initial “J” to represent the graduate student who was using the majority of the concrete supplied. Chopped ARG glass fibers were weighed in the laboratory and added to the supplied concrete at a dosage of 5 lb/ yd3. Novomesh was pre-mixed in the concrete truck at delivery. The concrete mix information and the compression cylinder strength obtained in the laboratory cylinder tests

50
are summarized in Table 17.. Unfortunately no separate cylinder tests were carried out for glass reinforced concrete specimens. Compressive strength was measured for both the fiber reinforced concrete and the plain concrete supplied. The specimen identification number used in this report with the corresponding information on the test specimens are shown in Table 18. The specimens were manufactured in metal forms and were placed on a vibrating table for a maximum of 10 seconds during the compacting process.
Table 17: Concrete Mix Design and Compressive Strength
Table 18: Test Specimen Identification Information
Concrete Mix Design Information
Concrete Supplier: Lycon Inc.Total Concrete Supplied 2.75 cY3/4 Inch Course Aggregate (#67 gravel) 4898 lbAir Entrainment 17 ozFine Aggregate (Sand) 3728 lbWater 63galCEM Lafarge 1680 lb
Plain Concrete 4762 psi (SD 143 psi)Fiber Reinforced Concrete (Novomesh 950) 5292 psi (SD 135 psi)
28 Day Compressive Strength (Laboratory Testing)
Specimen I.D SIP Formwork Source Test Type
PJC-1PJC-2PJC-3
PJN-1PJN-2PJN-3
PJG-1PJG-2PJG-3
Plain Concrete(Control Specimen)
ARG Glass Fibers(Nippon Electric Glass)
Dosage - 5 lb/cY
Novomesh 950(Propex Concrete Systems)
Dosage - 5 lb/cY
ASTMStatic
Flexure

51
Figure 50: Formwork and materials for the test specimens (1 June 2006)
Mosinee Test Specimens (28 June 2006)
Full sized impact test panels were tested for toughness and impact properties as part of the research. Because of the volume of concreting that would be required to cast 20 panels, it was decided that services from a local precaster would be sought. The test panels were cast at D&S pre-stressing in Mosinee, WI using a standard WisDOT type “D” bridge deck mix with a specified 4000 psi compressive strength at 28 days. Concrete was supplied by Northwood Concrete using a portable concrete mix truck and testing for slump, air content, and compressive strength of the concrete was carried out by Maxim Technologies Inc (Fig. 51). The testing report indicated an average compressive strength of the concrete at 28 days to be 5570 psi) The panels (2’–8” x 4’ x 1.5” deep) were cast on a concrete bed with 1.5 in. wooden separator forms (See Fig. 52). All the reinforcements (tabulated in Table 19) were pre-cut in the University Laboratory to a width of 2’-4” to facilitate installation in field. Appropriate de-bonding form release agents were applied for the lifting of panels upon concrete hardening. Slump for the concrete was specified as 2.5 in. and air content as 4.5%. The panels were finished with a semi-rough finish by very briefly trowelling the concrete surface. The bottom of the specimen is expected to be smooth finished. These were carried out to mimic the typical usage on a bridge deck where the top surface is semi-rough to provide bond to the deck slab. Inverted rebar chairs were placed on the top surface to enable lifting/handling. Figs. 53-55 show photographs taken during and after the completion of the casting.
Chopped Glass Fiber
Vibrating Table

52
Figure 51: Portable Concrete Mixer (LHS) and air content being measured by Maxim Technologies representatives
PMR4
PMR4
PMR6
PMR6
PMC2K
PMC2K
PMC2K
PMC2K
PMC3KM
PMC3KB
PMC3KM
PMC3KB
PMGM
PMGB
PMGM
PMGB
PMN
PMN
PMN
PMN
Figure 52: Pre-stressing bed at Mosinee ready for the concrete pour
(Panel position in the bed – Left Hand Side)
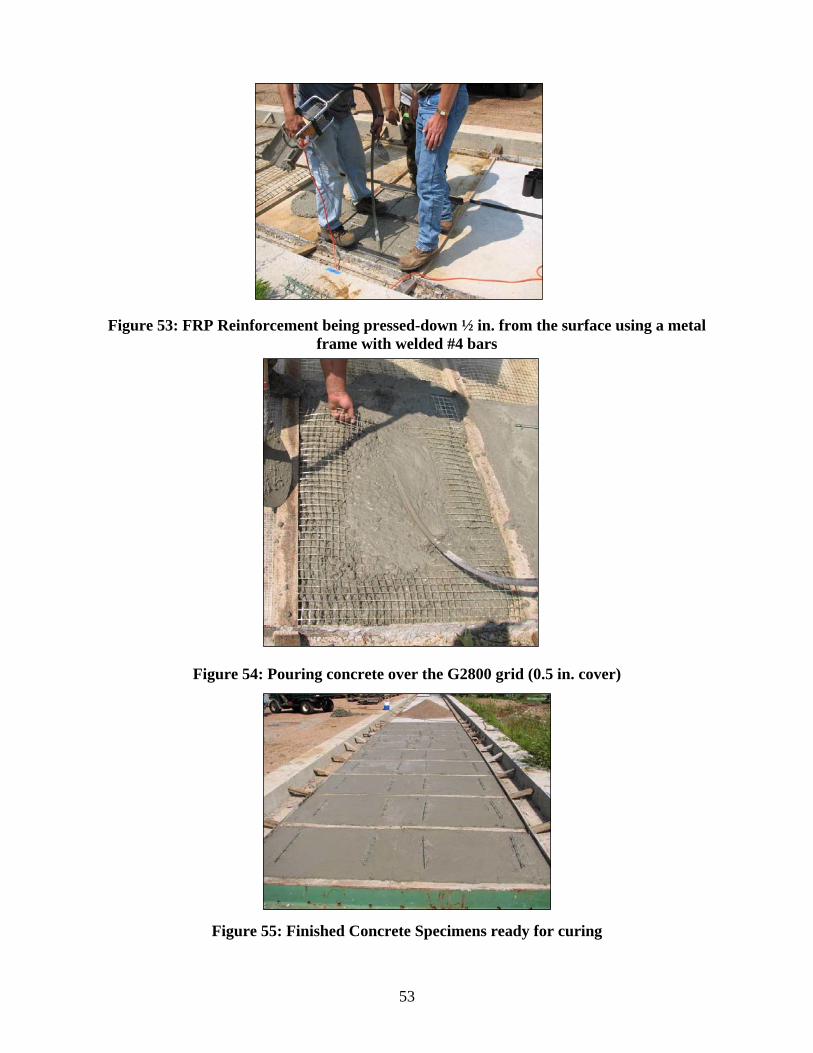
53
Figure 53: FRP Reinforcement being pressed-down ½ in. from the surface using a metal frame with welded #4 bars
Figure 54: Pouring concrete over the G2800 grid (0.5 in. cover)
Figure 55: Finished Concrete Specimens ready for curing
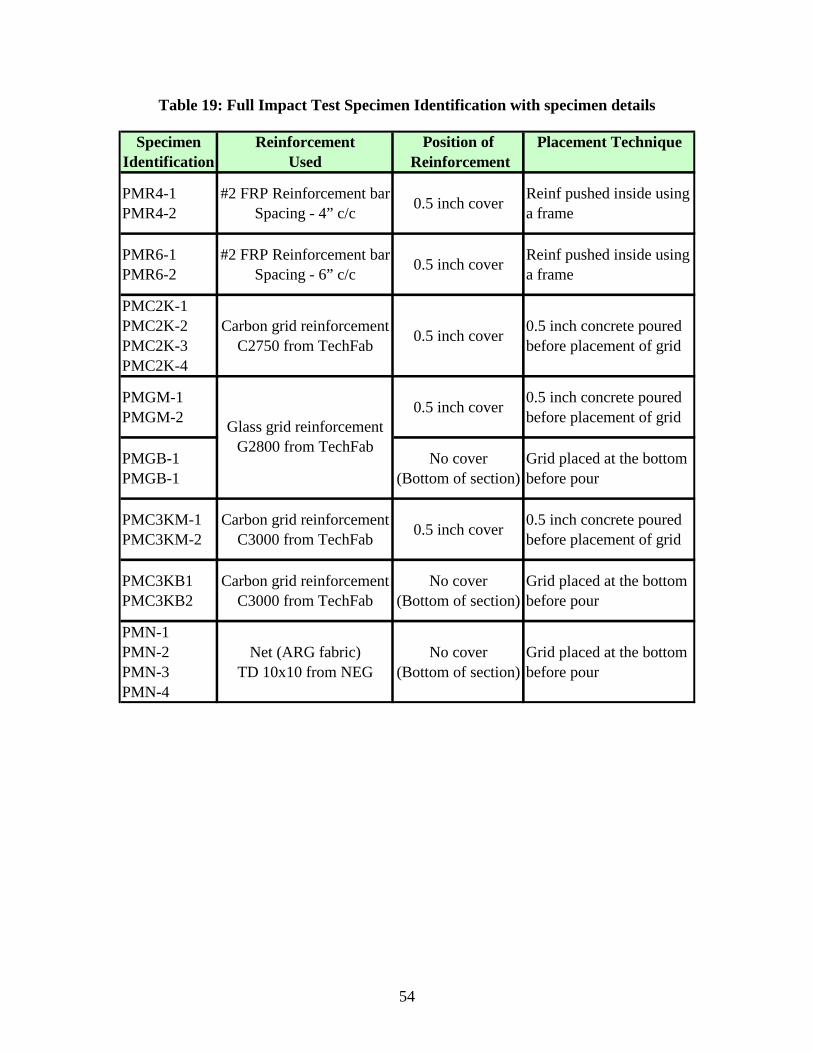
54
Table 19: Full Impact Test Specimen Identification with specimen details
Position of Reinforcement
PMR4-1PMR4-2
#2 FRP Reinforcement barSpacing - 4” c/c 0.5 inch cover Reinf pushed inside using
a frame
PMR6-1PMR6-2
#2 FRP Reinforcement barSpacing - 6” c/c 0.5 inch cover Reinf pushed inside using
a frame
PMC2K-1PMC2K-2PMC2K-3 PMC2K-4
Carbon grid reinforcementC2750 from TechFab 0.5 inch cover 0.5 inch concrete poured
before placement of grid
PMGM-1PMGM-2 0.5 inch cover 0.5 inch concrete poured
before placement of grid
PMGB-1PMGB-1
No cover(Bottom of section)
Grid placed at the bottom before pour
PMC3KM-1PMC3KM-2
Carbon grid reinforcement C3000 from TechFab 0.5 inch cover 0.5 inch concrete poured
before placement of grid
PMC3KB1PMC3KB2
Carbon grid reinforcement C3000 from TechFab
No cover(Bottom of section)
Grid placed at the bottom before pour
PMN-1PMN-2 PMN-3PMN-4
Net (ARG fabric)TD 10x10 from NEG
No cover(Bottom of section)
Grid placed at the bottom before pour
Specimen Identification
ReinforcementUsed
Placement Technique
Glass grid reinforcement G2800 from TechFab
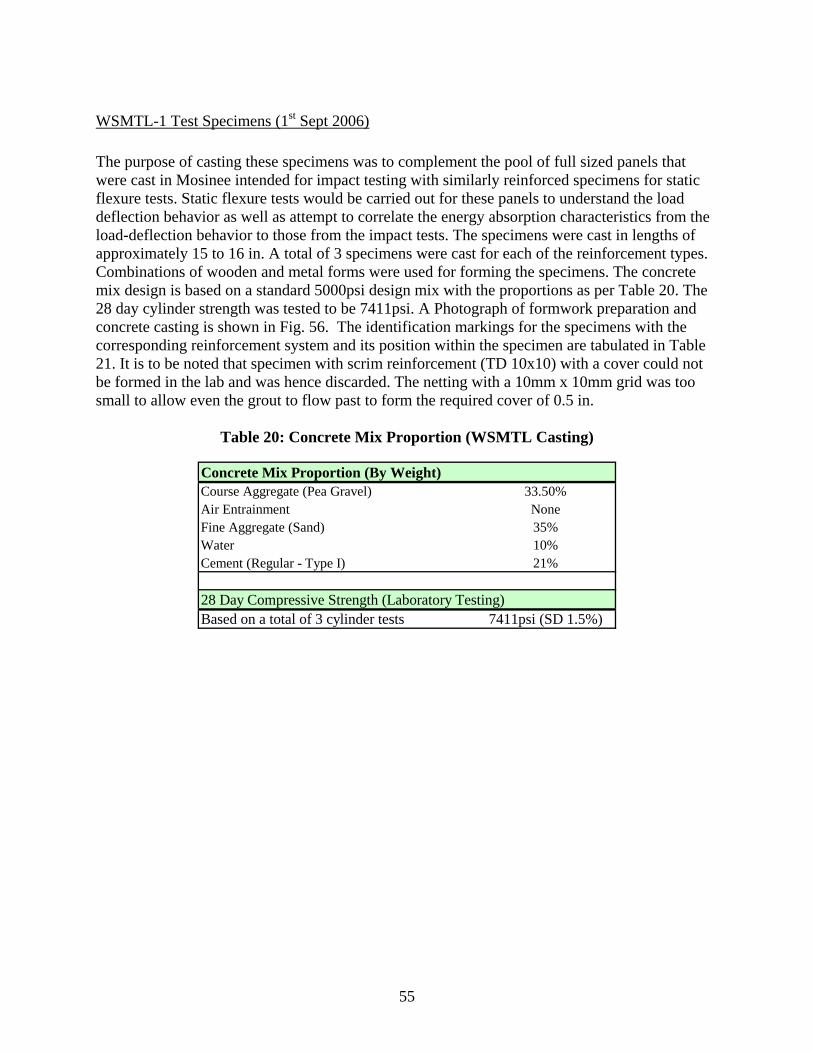
55
WSMTL-1 Test Specimens (1st Sept 2006) The purpose of casting these specimens was to complement the pool of full sized panels that were cast in Mosinee intended for impact testing with similarly reinforced specimens for static flexure tests. Static flexure tests would be carried out for these panels to understand the load deflection behavior as well as attempt to correlate the energy absorption characteristics from the load-deflection behavior to those from the impact tests. The specimens were cast in lengths of approximately 15 to 16 in. A total of 3 specimens were cast for each of the reinforcement types. Combinations of wooden and metal forms were used for forming the specimens. The concrete mix design is based on a standard 5000psi design mix with the proportions as per Table 20. The 28 day cylinder strength was tested to be 7411psi. A Photograph of formwork preparation and concrete casting is shown in Fig. 56. The identification markings for the specimens with the corresponding reinforcement system and its position within the specimen are tabulated in Table 21. It is to be noted that specimen with scrim reinforcement (TD 10x10) with a cover could not be formed in the lab and was hence discarded. The netting with a 10mm x 10mm grid was too small to allow even the grout to flow past to form the required cover of 0.5 in.
Table 20: Concrete Mix Proportion (WSMTL Casting)
Concrete Mix Proportion (By Weight)Course Aggregate (Pea Gravel) 33.50%Air Entrainment NoneFine Aggregate (Sand) 35%Water 10%Cement (Regular - Type I) 21%
28 Day Compressive Strength (Laboratory Testing)Based on a total of 3 cylinder tests 7411psi (SD 1.5%)

56
Table 21: Specimen Identification (WSMTL-1)
Figure 56 : Casting specimens in laboratory
Position of Reinforcement
PL1C-1PL1C-2PL1C-3
Plain Concrete (control specimen) NA
PL1C27-1PL1C27-2PL1C27-3
C2750 Carbon Grid(Tech Fab) 0.5 inch cover
PL1C3K-1PL1C3K-2PL1C3K-3
C3000 Carbon Grid(TechFab) 0.5 inch cover
PL1G-1PL1G-2PL1G-3
G2800 Glass Grid(Tech Fab) 0.5 inch cover
PL1LW-1PL1LW-2PL1LW-3
0.5 inch cover
PL1LW-1 (NC)PL1LW-2 (NC)PL1LW-3 (NC)
No cover(Bottom of section)
PL1SRG-1PL1SRG-2PL1SRG-3
SRG-45 Glass Grid(Saint Gobain) 0.5 inch cover
PL1TD-1PL1TD-2PL1TD-3
0.5 inch cover
PL1TD-1 (NC)PL1TD-2 (NC)PL1TD-3 (NC)
No cover(Bottom of section)
TD 10x10 ARG Net(Nippon Electric Glass)
Specimen Identification
ReinforcementUsed
LW110 Scrim(Nippon Electric Glass)

57
WSMTL-2 Test Specimens (29th Sept 2006)
The purpose of this test was to supplement the pool of full sized panels that were cast in Mosinee intended for impact testing. Two types of reinforcement systems; SRG-45 glass grid reinforcement and steel wire mesh (D2.1) were used for the panels. Steel reinforcement was used despite the prohibition on their use in the State of Wisconsin to serve as a benchmark for the rest of the reinforcement systems. Steel wire mesh uses a 0.159 in. diameter bar with a nominal area of 0.02 in2 (Fig. 57). Reinforcement tensile test results were available from the supplier. All the test specimens as part of this casting operation were provided with a cover of 0.5 in. For the steel wire mesh, this was achieved by using very short pieces of ½ in. reinforcement as a bar chair. For the SRG-45 mesh, the mesh was pulled manually between supports and sandwiched between the formwork that holds the mesh in place. However, it was realized that SRG-45 stretched as concrete was placed and the mesh sagged to the bottom from the weight of the concrete above it. It was noticed that SRG-45 reinforcement has very little memory compared to the carbon grids and could easily be placed flat at the bottom of the formwork for manufacturing specimens without any cover. The specimen dimension was chosen to be the same as those used for previous specimens cast in Mosinee which are also representative of the actual size used in two of the local bridges in Wisconsin (specimen dimension - 48in x 32in x 1.5in). The concrete mix used was the same as for the WSMTL-1 mix described in Table 22. A total of three 4”x16”x 1.5” concrete prisms were made by inserting one steel reinforcement bar from the mesh to enable static flexure tests to be carried out. Refer to Table 22 for a complete tabulation of the specimen identification system used. The average 28 day compressive strength for the cast was 6275 psi with a standard deviation of 5.1%. Photographs taken during the casting of the specimens are shown in Figs. 58 – 60.
Figure 57: Sectional view of the reinforcement in the full sized impact test specimen
48 in
1.5
0.5 in2.67 ft
32 in
D2.1 WireMesh
6in x 6 in grid (Both Directions)

58
Table 22: Specimen Identification (SMTL-2)
Figure 58: Impact test panel with the sagging of the mesh (top-right)
Figure 59: Half completed impact test panel with D2.1 wire mesh
Type of Lab Test
PL2WM-1PL2WM-2PL2WM-3
Static Flexure Test
PL2WM-1PL2WM-2PL2WM-3
Full ScaleImpact Test
PL2-SRG-1PL2-SRG-2PL2-SRG-3
SRG-45 Glass Grid(Saint Gobain)
Full ScaleImpact Test
Specimen Identification
ReinforcementUsed
D2.1 Steel Wire Mesh(Gerdau Ameristeel)
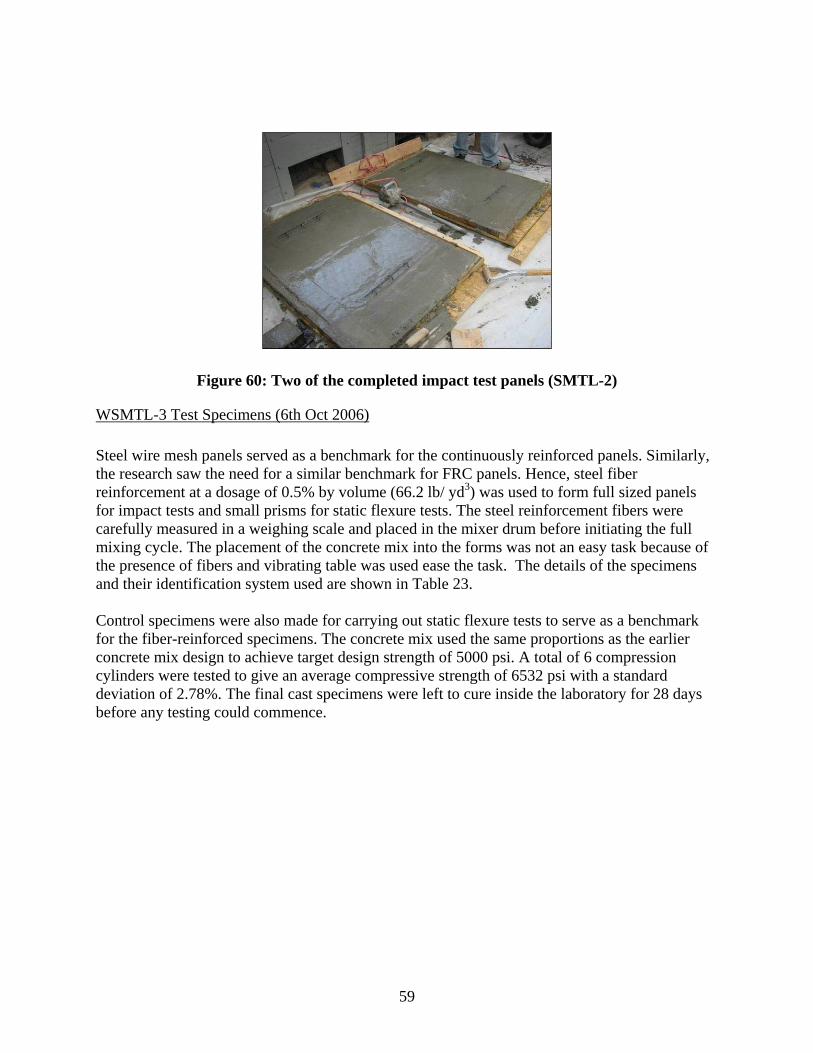
59
Figure 60: Two of the completed impact test panels (SMTL-2)
WSMTL-3 Test Specimens (6th Oct 2006)
Steel wire mesh panels served as a benchmark for the continuously reinforced panels. Similarly, the research saw the need for a similar benchmark for FRC panels. Hence, steel fiber reinforcement at a dosage of 0.5% by volume (66.2 lb/ yd3) was used to form full sized panels for impact tests and small prisms for static flexure tests. The steel reinforcement fibers were carefully measured in a weighing scale and placed in the mixer drum before initiating the full mixing cycle. The placement of the concrete mix into the forms was not an easy task because of the presence of fibers and vibrating table was used ease the task. The details of the specimens and their identification system used are shown in Table 23. Control specimens were also made for carrying out static flexure tests to serve as a benchmark for the fiber-reinforced specimens. The concrete mix used the same proportions as the earlier concrete mix design to achieve target design strength of 5000 psi. A total of 6 compression cylinders were tested to give an average compressive strength of 6532 psi with a standard deviation of 2.78%. The final cast specimens were left to cure inside the laboratory for 28 days before any testing could commence.

60
Table 23: Specimen Identification marking (WSMTL-3)
Proprietary Test Specimens
Three types of proprietary systems were tested in the laboratory. These were Durock Cement Board, Fortacrete Structural Panel, and SafPlank. Both the Fortacrete Panels and the SafPlank were considered to be viable options and hence considerable effort was spent trying to test them. Fortacrete panels were tested for both static flexure and impact loading at various moisture levels. SafPlank was also tested for both static flexure and impact tests. Unlike the concrete specimens, which had to be made into smaller pieces for standard tests, SafPlank was supplied by the manufacturer in 1 ft. or 2 ft. widths. Due to the thin walled profiles it was felt to be inappropriate to test it in the small FRC flexural test setting but rather as a full scale flexure specimen. Hence, it was decided that it was meaningful to carry out both static flexure tests and impact loading tests on a full-scale panel. Additionally, with a longer test span, the advantage of being able to investigate the buckling characteristics was possible. Table 24 summarizes all the different types of proprietary systems tested with the corresponding specimen identification marking. A total of 11 Fortacrete specimens were subject to static flexure tests in the laboratory (1st Batch of supplies). However, all the results indicated a very low flexural strength compared to the manufacturer reported values. Upon enquiry, we were informed that the sample was probably defective and a fresh set of supply was provided for testing. Due to time constraint, only one test could be repeated for each of the variables. Only the results for the 2nd batch of supplies are indicated in this report. The specimen identifications for the new supplies are also indicated in Table 24 in the last row.
Type of Lab TestOverall Dimension
PL3-C1PL3-C2PL3-C3
Plain ConcreteControl Specimen
Static Flexure Test4” x 16” x 1.5” thk
PL3-SF1PL3-SF2PL3-SF3
Static Flexure Test4” x 16” x 1.5” thk
PL3-SFF1PL3-SFF2PL3-SFF3
Impact Test4ft x 32” x 1.5” thk
Specimen Identification
ReinforcementUsed
Novocon 1050 Steel Fibers(0.5% by Vol - 66.2lb/cY)

61
Table 24: Summary of Proprietary Systems Tested Proprietary System
TestedSpecimen
IdentificationPanel Condition Test Type/ Dimension
PF-1 Ultimate Strength Test Center Point Bend Test (3.5' span)
PF-2 Test to determine E & G Values Center Point Bend Test (3.5' span)
PF-3 Buckling Test -1 Center Point Bend Test(5.5' span)
PF-4 Buckling Test - 2 Third Point Bend Test (5.5' span)
PF-5 Buckling Test - 3 Center Point Bend Test (5.5' span)
SAFPlank-1 -SAFPlank(2 ft. wide)
SAFPlank-1SAFPlank-2 -
Durock Cement Board
CD-1CD-2CD-3CD-4CD-5CD-6
Dry Panel(17% RH)
Static Flexure Test4” x 15” x 0.5” thk
PFC-1PFC-2PFC-3
Dry Panel(17% RH)
WPFC-1WPFC-2WPFC-3
Wet Panel(24 Hrs water submersion)
PWPFC-1PWPFC-2PWPFC-3
Prolonged Wet Panel(6 day water submersion)
SSWPFC-1SSWPFC-2
Single Side - Wet Exposure(3 hour wet sand bed)
CFCD-1 Dry Panel(Lab Humidity Level - 17%RH)
CFCW-1 Wet Panel(24 Hrs water submersion)
CFCSB-1 Single Side - 3 Hr exposure(Wet sand on compression face)
CFCI-1 Dry Panel(17% RH)
CFCI-2 Wet Panel(8 Days in Moisture Rm)
Static Flexure Test4” x 15” x 0.75” thk
Full ScaleImpact Test
Full ScaleImpact Test
32" x 48" x 3/4"
Fortacrete Panel(2nd Batch of Supply)
Fortacrete Panel(1st Batch of Supply)
SAFPlank (1 ft. wide)
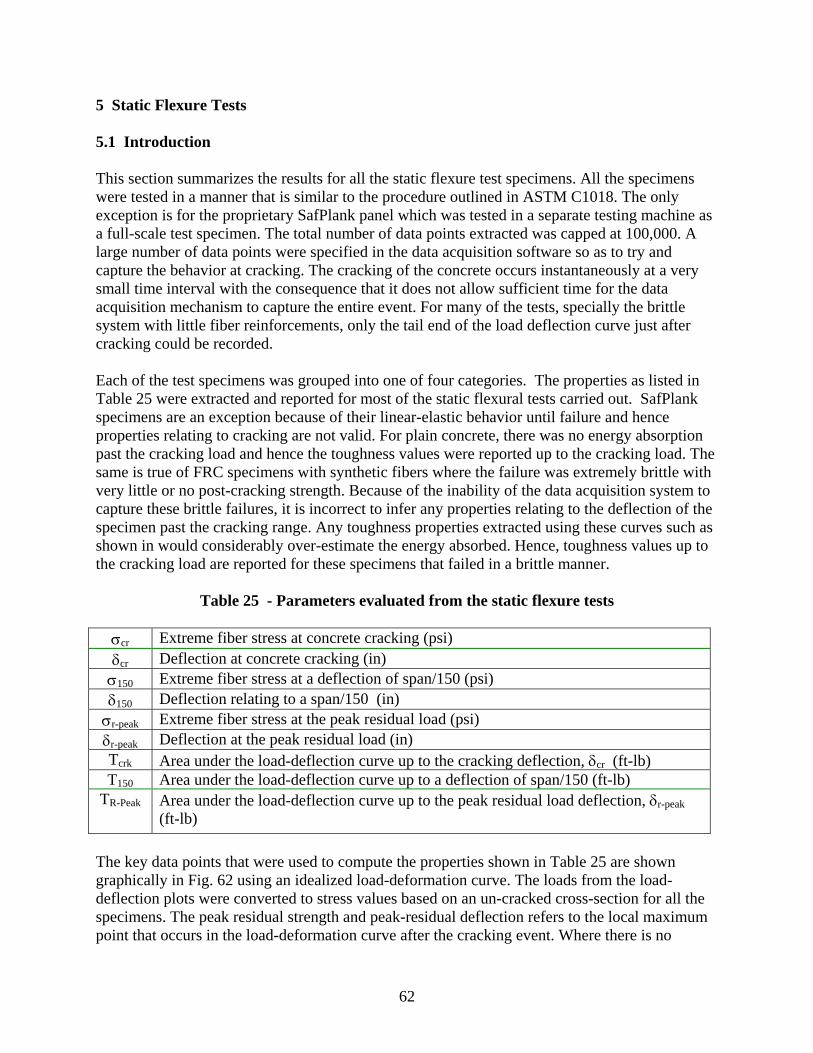
62
5 Static Flexure Tests 5.1 Introduction This section summarizes the results for all the static flexure test specimens. All the specimens were tested in a manner that is similar to the procedure outlined in ASTM C1018. The only exception is for the proprietary SafPlank panel which was tested in a separate testing machine as a full-scale test specimen. The total number of data points extracted was capped at 100,000. A large number of data points were specified in the data acquisition software so as to try and capture the behavior at cracking. The cracking of the concrete occurs instantaneously at a very small time interval with the consequence that it does not allow sufficient time for the data acquisition mechanism to capture the entire event. For many of the tests, specially the brittle system with little fiber reinforcements, only the tail end of the load deflection curve just after cracking could be recorded.
Each of the test specimens was grouped into one of four categories. The properties as listed in Table 25 were extracted and reported for most of the static flexural tests carried out. SafPlank specimens are an exception because of their linear-elastic behavior until failure and hence properties relating to cracking are not valid. For plain concrete, there was no energy absorption past the cracking load and hence the toughness values were reported up to the cracking load. The same is true of FRC specimens with synthetic fibers where the failure was extremely brittle with very little or no post-cracking strength. Because of the inability of the data acquisition system to capture these brittle failures, it is incorrect to infer any properties relating to the deflection of the specimen past the cracking range. Any toughness properties extracted using these curves such as shown in would considerably over-estimate the energy absorbed. Hence, toughness values up to the cracking load are reported for these specimens that failed in a brittle manner.
Table 25 - Parameters evaluated from the static flexure tests
σcr Extreme fiber stress at concrete cracking (psi) δcr Deflection at concrete cracking (in)
σ150 Extreme fiber stress at a deflection of span/150 (psi) δ150 Deflection relating to a span/150 (in)
σr-peak Extreme fiber stress at the peak residual load (psi) δr-peak Deflection at the peak residual load (in) Tcrk Area under the load-deflection curve up to the cracking deflection, δcr (ft-lb) T150 Area under the load-deflection curve up to a deflection of span/150 (ft-lb)
TR-Peak Area under the load-deflection curve up to the peak residual load deflection, δr-peak (ft-lb)
The key data points that were used to compute the properties shown in Table 25 are shown graphically in Fig. 62 using an idealized load-deformation curve. The loads from the load-deflection plots were converted to stress values based on an un-cracked cross-section for all the specimens. The peak residual strength and peak-residual deflection refers to the local maximum point that occurs in the load-deformation curve after the cracking event. Where there is no

63
obvious maximum point after the cracking event, then the load and toughness value at a deflection of span/150 is reported (Fig. 63). The toughness value (area under the load-deflection curve) is calculated by numerically integrating the area as described earlier.
The stresses calculated for each of the loads is not a real stress but an equivalent stress calculated using the full depth of the specimen as per Equation (5-1).
(5-1)
where, M = Applied maximum moment df – depth of the specimen I – Second moment of inertia of the cross-section
For the standard ASTM flexure test, the above expression can be written in terms of just the thickness of the specimen and the applied load as shown in Equation (5-2)
(5-2)
Figure 61: Sketch of a load-deflection plot indicating the key data points for a specimen
with a peak residual strength
Net Deflection (in)
Load (lb)
Pcr
δcr δr
Pr-peak
Area – Tr-peak
2
3
f
Pd
σ =
IdM f
2=σ
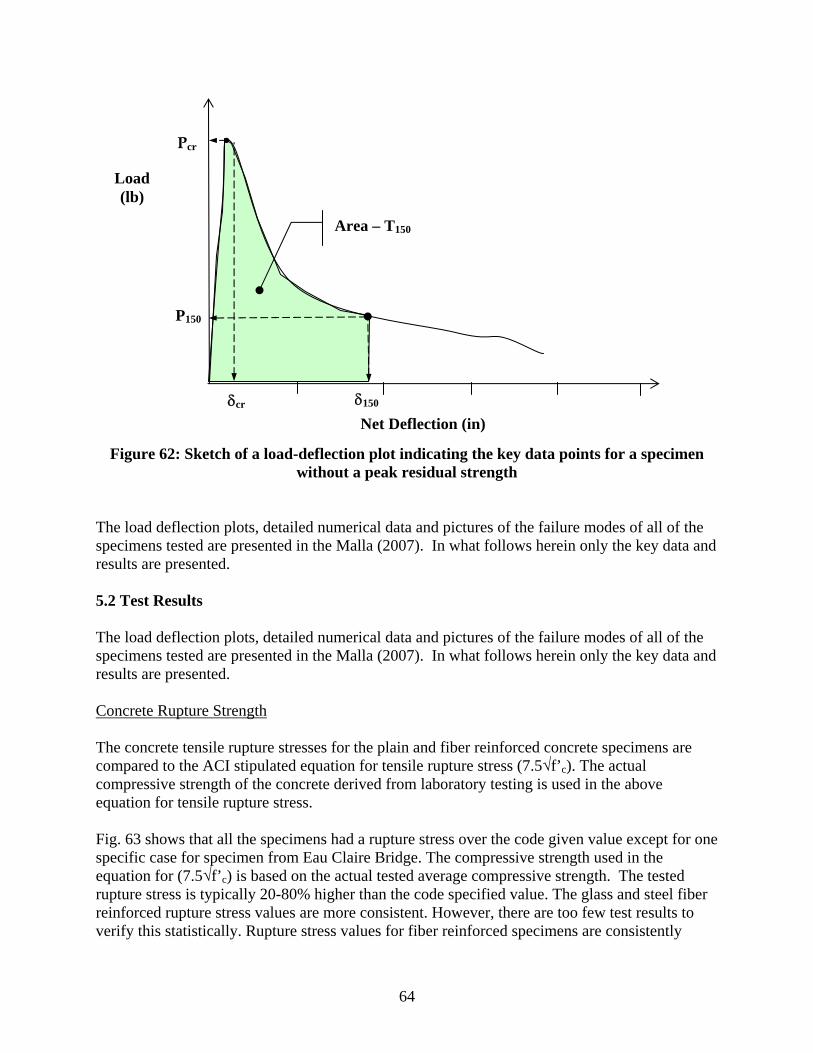
64
Figure 62: Sketch of a load-deflection plot indicating the key data points for a specimen without a peak residual strength
The load deflection plots, detailed numerical data and pictures of the failure modes of all of the specimens tested are presented in the Malla (2007). In what follows herein only the key data and results are presented. 5.2 Test Results The load deflection plots, detailed numerical data and pictures of the failure modes of all of the specimens tested are presented in the Malla (2007). In what follows herein only the key data and results are presented. Concrete Rupture Strength The concrete tensile rupture stresses for the plain and fiber reinforced concrete specimens are compared to the ACI stipulated equation for tensile rupture stress (7.5√f’c). The actual compressive strength of the concrete derived from laboratory testing is used in the above equation for tensile rupture stress.
Fig. 63 shows that all the specimens had a rupture stress over the code given value except for one specific case for specimen from Eau Claire Bridge. The compressive strength used in the equation for (7.5√f’c) is based on the actual tested average compressive strength. The tested rupture stress is typically 20-80% higher than the code specified value. The glass and steel fiber reinforced rupture stress values are more consistent. However, there are too few test results to verify this statistically. Rupture stress values for fiber reinforced specimens are consistently
Net Deflection (in)
Load (lb)
Pcr
δcr δ150
P150
Area – T150

65
within the range of the plain concrete rupture stress. This makes us draw the conclusion that the fibers added to the specimens (within the dosage specified) do not have an effect on the cracking strength of the concrete that can be relied upon for structural design.
Figure 63: Comparison of Tensile Rupture Stress Ratio
Ductility Ratios The deflection at peak failure loads have been summarized for all specimens that had significant residual strengths. The deflection at peak residual strength provides an indication of the amount of deflection that the formwork will undergo prior to failure and has important design implications. An ideal structural element would undergo significant deformation with sustained load carrying capacity prior to failure to provide ample warning to avoid any form of accident. Because of the nature of the static loading carried out, we were unable to get any form of residual strength for the glass and synthetic fibers. It is to be noted that with tests like ASTM C1399 that pre-cracks the specimen prior to failure, it is possible to achieve some amount of residual strength in these specimens.
Test results charted in Fig. 64 indicate that steel fibers have a significant ductility ratio for the post-cracking strength compared to any of the other fibers that were tested in this project and is even comparable to light scrims from NEG (TD 5x5 and LW110). As expected, with the carbon grids, the heavier grids were able to reach a higher deflection at failure. Glass Grid, SRG-45 performed very well with a ductility ratio of 25. The FRP bar had the highest ductility ratio that is even higher than the steel wire reinforced specimen. However, this is misleading and cannot be compared directly because the FRP bar has larger area and higher strength compared to the steel wire. The strength of a single FRP bar based on the guaranteed tensile strength is approximately 5 times more than the yield strength of the welded wire mesh bar.
0
0.5
1
1.5
2
2.5
PL1C
-1
PJC-
1
PJC-
3
PL3-
C-2
PJN
-2
PL1N
-1
PL1N
-3
PZT-
2
PLC-
1
PLC-
3
PJG
-1
PJG
-3
PL3-
SF-2
Plain & Fiber Reinforced Concrete Specimens
Ratio
Synthetic Fibers
Plain Concrete
'7.5crk
cfσ
GlassFibers
SteelFibers

66
Comparison of Ductility Ratio
1013
6
25
14
27
32
44
17
7 7
0
10
20
30
40
50
60
Stee
l Fibe
rs (0
.5% V
ol)
TD5x
5 Scr
im (N
o Cov
er)
LW11
0 Scr
im (N
o Cov
er)SR
G-45
Glas
s Grid
C275
0 Car
bon G
ridC3
000 C
arbo
n Grid
C550
0 Car
bon G
rid
#2 F
RP B
arSt
eel W
ire M
esh
Duro
ck C
emen
t Boa
rdFo
rtacr
ete P
anel
Test Specimen Types
Ratio
Discrete CtsReinforcementsGrid Reinforcements
Proprietary SystemsFRC
R Peak
crk
δδ
−
The proprietary systems Durock and Fortacrete have smaller ductility ratios (Fig. 64). Again, this does not imply that it is an inferior product compared to the rest of the specimens from a ductility standpoint. Taking a closer look at the numbers, because of their low elastic modulus, the deflection at cracking for the Fortacrete panel is approximately 10 times larger than concrete. Hence the plotted ratio would provide a misleading number. For this comparison, it is logical to compare the absolute deflection at peak residual strength. Fig. 65 indicates that the Fortacrete panel performed better than all the grid reinforced specimens. It is to be noted that ductility ratios or deflection at peak residual strength shown in Fig. 64 and Fig. 65 do not include SafPlank as it is a very different type of material with no cracking behavior. Deflections at cracking for the Fortacrete and the Durock panels have been approximated as the point where there is a sudden change in the slope of the load-deflection curve.
Figure 64: Ductility ratio comparison chart
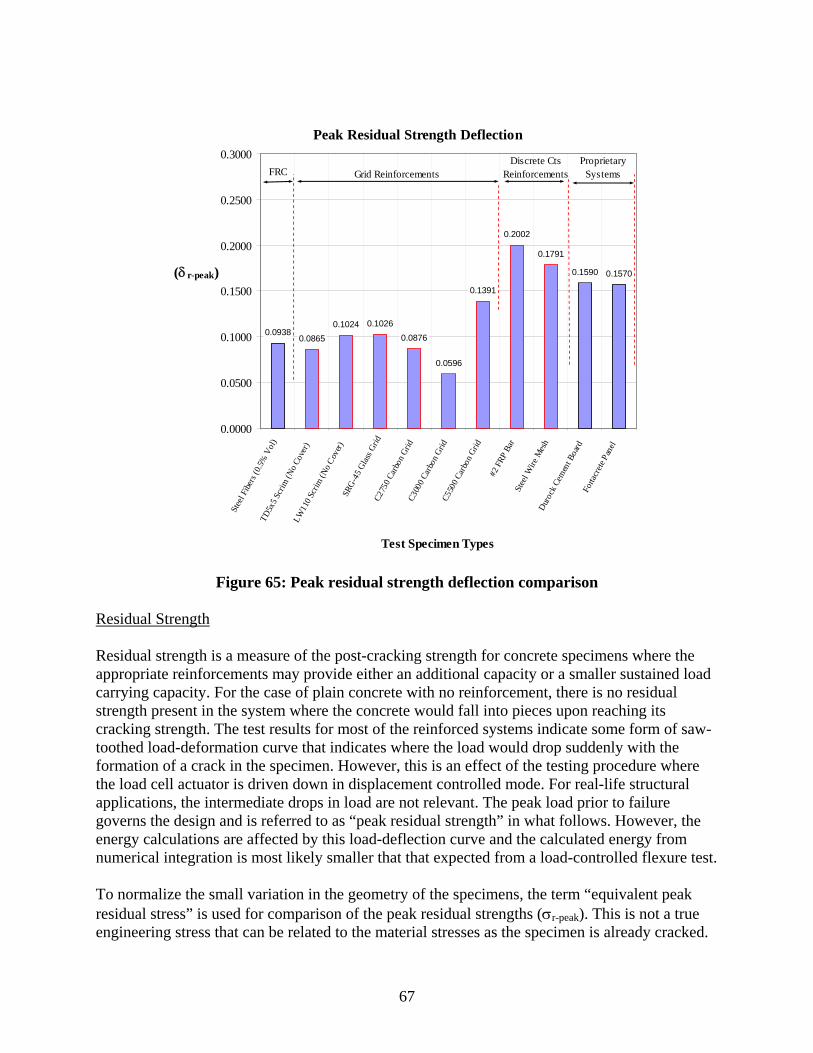
67
Peak Residual Strength Deflection
0.09380.0865
0.1024 0.10260.0876
0.0596
0.1391
0.2002
0.1791
0.1590 0.1570
0.0000
0.0500
0.1000
0.1500
0.2000
0.2500
0.3000
Stee
l Fibe
rs (0
.5% V
ol)
TD5x
5 Scr
im (N
o Cov
er)
LW11
0 Scr
im (N
o Cov
er)SR
G-45
Glas
s Grid
C275
0 Car
bon G
ridC3
000 C
arbo
n Grid
C550
0 Car
bon G
rid
#2 F
RP B
arSt
eel W
ire M
esh
Duro
ck C
emen
t Boa
rdFo
rtacr
ete P
anel
Test Specimen Types
(δ r-peak)
Discrete CtsReinforcementsGrid Reinforcements
Proprietary SystemsFRC
Figure 65: Peak residual strength deflection comparison Residual Strength Residual strength is a measure of the post-cracking strength for concrete specimens where the appropriate reinforcements may provide either an additional capacity or a smaller sustained load carrying capacity. For the case of plain concrete with no reinforcement, there is no residual strength present in the system where the concrete would fall into pieces upon reaching its cracking strength. The test results for most of the reinforced systems indicate some form of saw-toothed load-deformation curve that indicates where the load would drop suddenly with the formation of a crack in the specimen. However, this is an effect of the testing procedure where the load cell actuator is driven down in displacement controlled mode. For real-life structural applications, the intermediate drops in load are not relevant. The peak load prior to failure governs the design and is referred to as “peak residual strength” in what follows. However, the energy calculations are affected by this load-deflection curve and the calculated energy from numerical integration is most likely smaller that that expected from a load-controlled flexure test.
To normalize the small variation in the geometry of the specimens, the term “equivalent peak residual stress” is used for comparison of the peak residual strengths (σr-peak). This is not a true engineering stress that can be related to the material stresses as the specimen is already cracked.
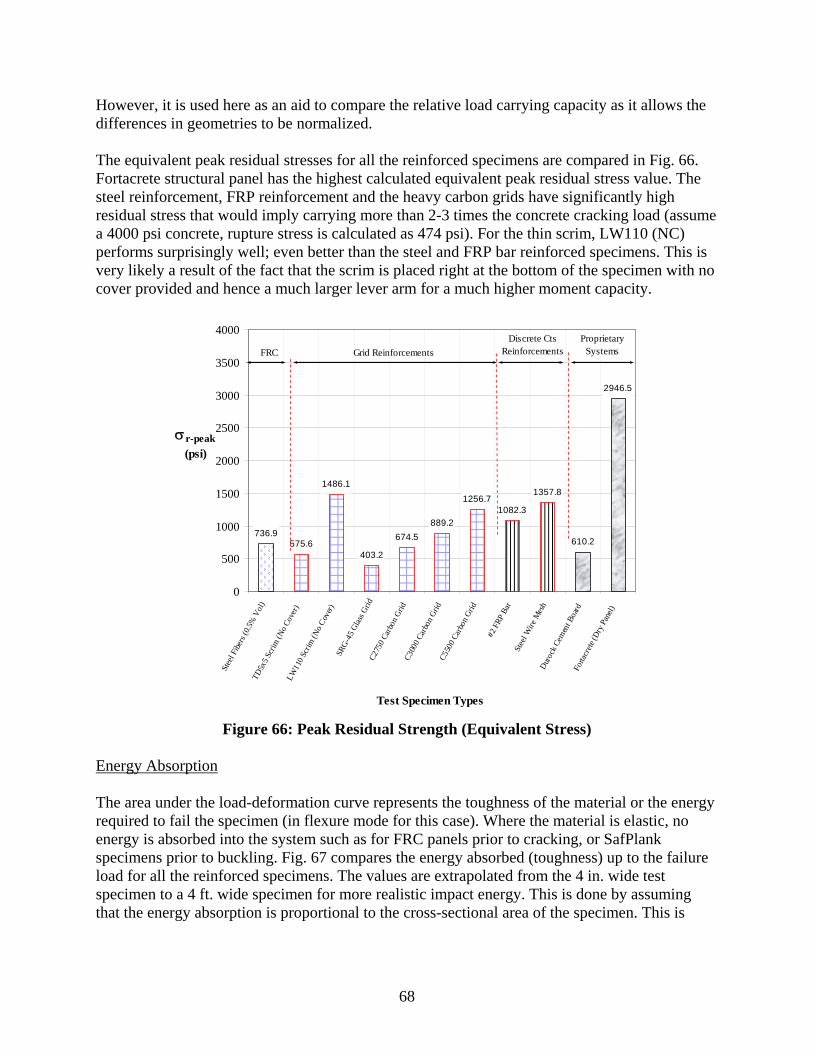
68
However, it is used here as an aid to compare the relative load carrying capacity as it allows the differences in geometries to be normalized.
The equivalent peak residual stresses for all the reinforced specimens are compared in Fig. 66. Fortacrete structural panel has the highest calculated equivalent peak residual stress value. The steel reinforcement, FRP reinforcement and the heavy carbon grids have significantly high residual stress that would imply carrying more than 2-3 times the concrete cracking load (assume a 4000 psi concrete, rupture stress is calculated as 474 psi). For the thin scrim, LW110 (NC) performs surprisingly well; even better than the steel and FRP bar reinforced specimens. This is very likely a result of the fact that the scrim is placed right at the bottom of the specimen with no cover provided and hence a much larger lever arm for a much higher moment capacity.
Figure 66: Peak Residual Strength (Equivalent Stress) Energy Absorption
The area under the load-deformation curve represents the toughness of the material or the energy required to fail the specimen (in flexure mode for this case). Where the material is elastic, no energy is absorbed into the system such as for FRC panels prior to cracking, or SafPlank specimens prior to buckling. Fig. 67 compares the energy absorbed (toughness) up to the failure load for all the reinforced specimens. The values are extrapolated from the 4 in. wide test specimen to a 4 ft. wide specimen for more realistic impact energy. This is done by assuming that the energy absorption is proportional to the cross-sectional area of the specimen. This is
736.9575.6
1486.1
403.2
674.5889.2
1256.71082.3
1357.8
610.2
2946.5
0
500
1000
1500
2000
2500
3000
3500
4000
Stee
l Fibe
rs (0
.5% V
ol)
TD5x
5 Scr
im (N
o Cov
er)
LW11
0 Scr
im (N
o Cov
er)SR
G-45
Glas
s Grid
C275
0 Car
bon G
ridC3
000 C
arbo
n Grid
C550
0 Car
bon G
rid
#2 F
RP B
arSt
eel W
ire M
esh
Duro
ck C
emen
t Boa
rdFo
rtacr
ete (D
ry P
anel)
Test Specimen Types
σr-peak(psi)
Discrete CtsReinforcementsGrid Reinforcements
Proprietary SystemsFRC
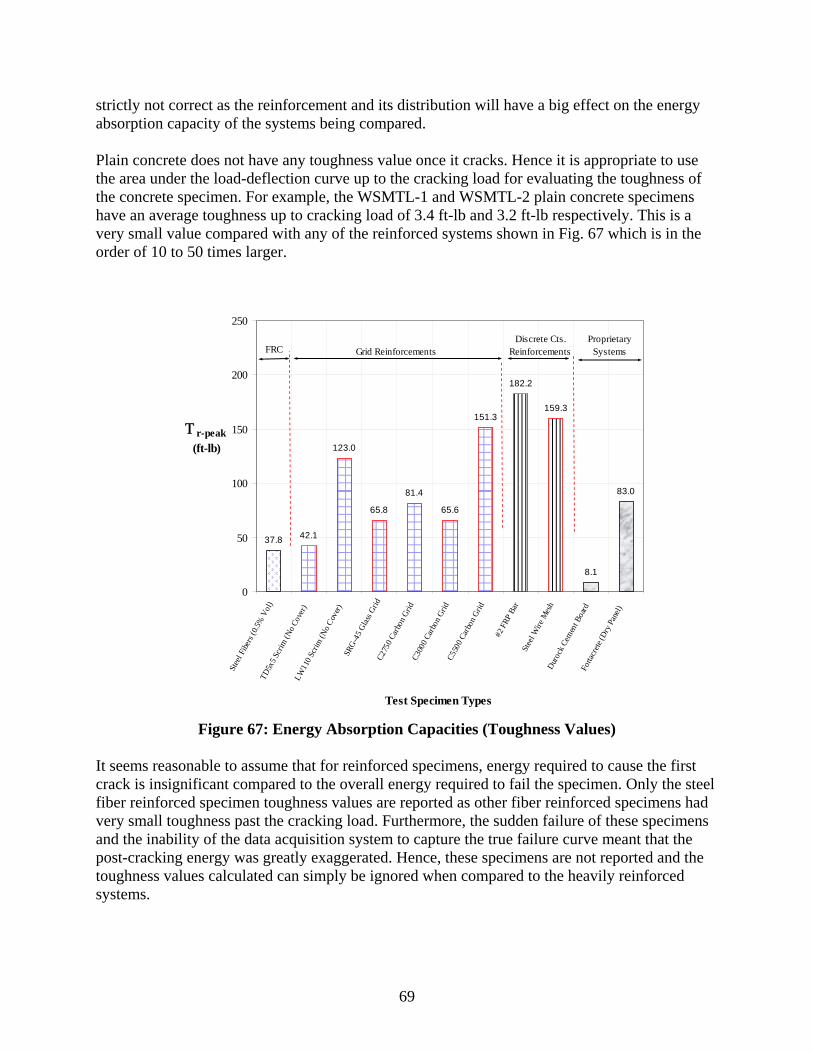
69
37.8 42.1
123.0
65.8
81.4
65.6
151.3
182.2
159.3
8.1
83.0
0
50
100
150
200
250
Stee
l Fibe
rs (0
.5% V
ol)
TD5x
5 Scr
im (N
o Cov
er)
LW11
0 Scr
im (N
o Cov
er)SR
G-45
Glas
s Grid
C275
0 Car
bon G
ridC3
000 C
arbo
n Grid
C550
0 Car
bon G
rid
#2 F
RP B
arSt
eel W
ire M
esh
Duro
ck C
emen
t Boa
rdFo
rtacr
ete (D
ry P
anel)
Test Specimen Types
Τ r-peak(ft-lb)
Discrete Cts.ReinforcementsGrid Reinforcements
Proprietary SystemsFRC
strictly not correct as the reinforcement and its distribution will have a big effect on the energy absorption capacity of the systems being compared.
Plain concrete does not have any toughness value once it cracks. Hence it is appropriate to use the area under the load-deflection curve up to the cracking load for evaluating the toughness of the concrete specimen. For example, the WSMTL-1 and WSMTL-2 plain concrete specimens have an average toughness up to cracking load of 3.4 ft-lb and 3.2 ft-lb respectively. This is a very small value compared with any of the reinforced systems shown in Fig. 67 which is in the order of 10 to 50 times larger.
Figure 67: Energy Absorption Capacities (Toughness Values)
It seems reasonable to assume that for reinforced specimens, energy required to cause the first crack is insignificant compared to the overall energy required to fail the specimen. Only the steel fiber reinforced specimen toughness values are reported as other fiber reinforced specimens had very small toughness past the cracking load. Furthermore, the sudden failure of these specimens and the inability of the data acquisition system to capture the true failure curve meant that the post-cracking energy was greatly exaggerated. Hence, these specimens are not reported and the toughness values calculated can simply be ignored when compared to the heavily reinforced systems.
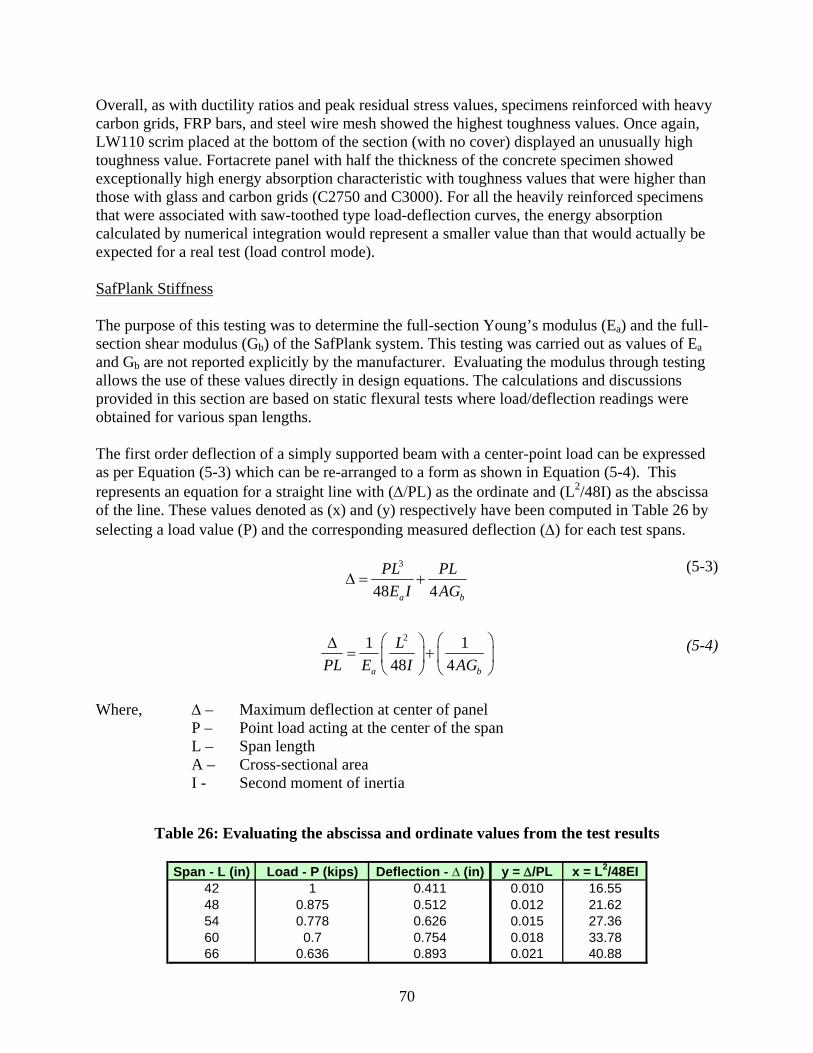
70
Span - L (in) Load - P (kips) Deflection - ∆ (in) y = Δ/PL x = L2/48EI42 1 0.411 0.010 16.5548 0.875 0.512 0.012 21.6254 0.778 0.626 0.015 27.3660 0.7 0.754 0.018 33.7866 0.636 0.893 0.021 40.88
Overall, as with ductility ratios and peak residual stress values, specimens reinforced with heavy carbon grids, FRP bars, and steel wire mesh showed the highest toughness values. Once again, LW110 scrim placed at the bottom of the section (with no cover) displayed an unusually high toughness value. Fortacrete panel with half the thickness of the concrete specimen showed exceptionally high energy absorption characteristic with toughness values that were higher than those with glass and carbon grids (C2750 and C3000). For all the heavily reinforced specimens that were associated with saw-toothed type load-deflection curves, the energy absorption calculated by numerical integration would represent a smaller value than that would actually be expected for a real test (load control mode).
SafPlank Stiffness
The purpose of this testing was to determine the full-section Young’s modulus (Ea) and the full-section shear modulus (Gb) of the SafPlank system. This testing was carried out as values of Ea and Gb are not reported explicitly by the manufacturer. Evaluating the modulus through testing allows the use of these values directly in design equations. The calculations and discussions provided in this section are based on static flexural tests where load/deflection readings were obtained for various span lengths.
The first order deflection of a simply supported beam with a center-point load can be expressed as per Equation (5-3) which can be re-arranged to a form as shown in Equation (5-4). This represents an equation for a straight line with (Δ/PL) as the ordinate and (L2/48I) as the abscissa of the line. These values denoted as (x) and (y) respectively have been computed in Table 26 by selecting a load value (P) and the corresponding measured deflection (Δ) for each test spans.
(5-3)
(5-4)
Where, Δ – Maximum deflection at center of panel
P – Point load acting at the center of the span L – Span length A – Cross-sectional area I - Second moment of inertia
Table 26: Evaluating the abscissa and ordinate values from the test results
3
48 4a b
PL PLE I AG
Δ = +
21 148 4a b
LPL E I AG
⎛ ⎞⎛ ⎞Δ= + ⎜ ⎟⎜ ⎟
⎝ ⎠ ⎝ ⎠

71
y = 4.72536E-04x + 1.97046E-03R2 = 9.99993E-01
0.005
0.007
0.009
0.011
0.013
0.015
0.017
0.019
0.021
0.023
10.00 15.00 20.00 25.00 30.00 35.00 40.00 45.00L2/(48*I)
Δ/(P
*L)
L=5.5'
L=5.0'
L=4.5'
L=4.0'
L=3.5' 3
2
48 4
1 148 4
a b
a b
PL PLE I AG
LPL E I AG
Δ = +
⎛ ⎞⎛ ⎞Δ⎛ ⎞ = + ⎜ ⎟⎜ ⎟⎜ ⎟⎝ ⎠ ⎝ ⎠ ⎝ ⎠
The points (x, y) from Table 26 are plotted in Fig. 68 with a linear trend line. As we can observe, the points form a straight line with a R2 value (goodness of fit for linear regression) of very close to 1.0. This allows us to find the slope (1/Ea) and y-intercept (1/4AGb) of the line resulting in the values of Ea and Gb. Ea = 3.36 Msi; Gb = 46.9 ksi. Using these values of E and G the deflection of the SafPlank under load can be determined for design.
Figure 68: Straight line fit to load and deflection measurements
SafPlank Buckling Tests carried out for SafPlank indicated that failure of SafPlank over a practical span length is governed by lateral torsional instability of this thin profiled section. In this section, we correlate the observed buckling load with theoretical equations. A theoretical method of predicting the ultimate failure load (buckling) will provide an easy method of selecting SafPlank for use as a SIP formwork. Various methods of calculating the lateral torsional buckling strength exists in the literature. Lateral torsional buckling of the thin profiled I-beams were estimated using finite difference method which involves dividing the beams into a number of equal length elements (Mottram, 1992). Exact solutions for buckling of structural members are provided by Wang et al (2002). For this section, the critical value of the transverse concentrated load, P for the buckling of the beam is calculated using the solution presented by Timoshenko and Gere (1961). This calculated value of the concentrated load is then used to find the corresponding critical stresses for the top flange which is compared with the experimental value. The solution presented considers the placement of load with reference to the section (upper flange, centriod or lower flange). The results of the calculations are presented in Table 27. The idealization of the SafPlank as three axi-symmetric sections is shown in Fig 69.
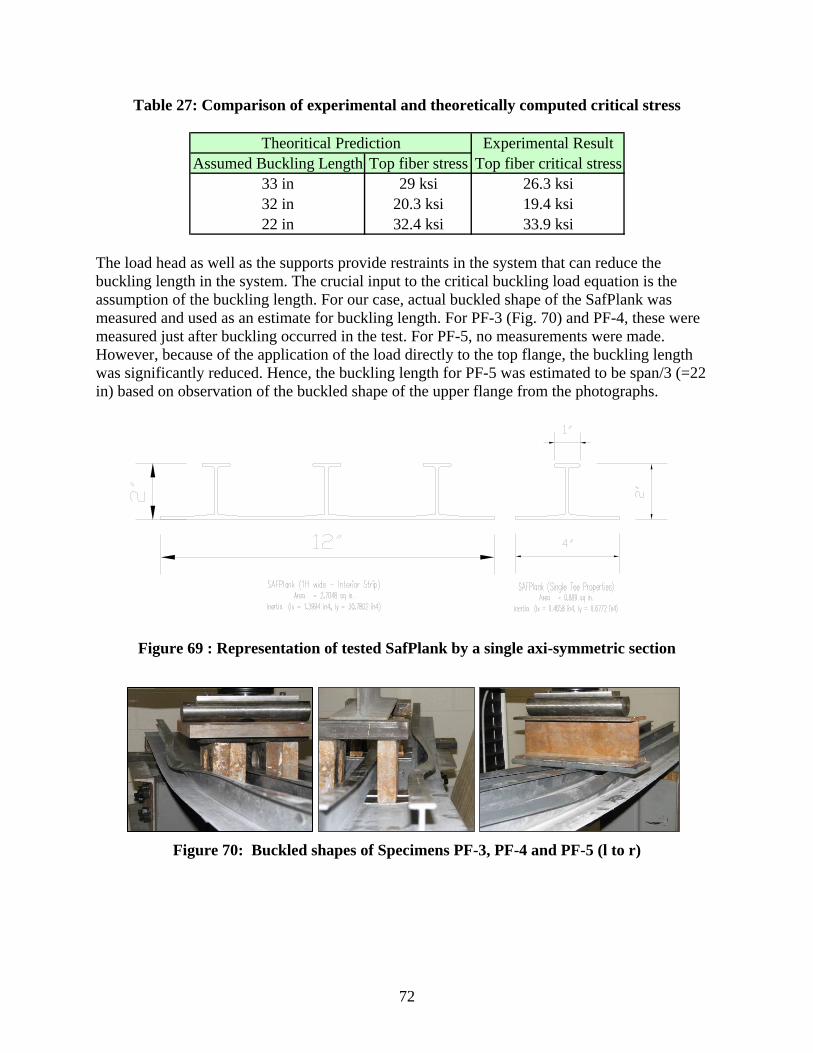
72
Table 27: Comparison of experimental and theoretically computed critical stress
Experimental ResultAssumed Buckling Length Top fiber stress Top fiber critical stress
33 in 29 ksi 26.3 ksi32 in 20.3 ksi 19.4 ksi22 in 32.4 ksi 33.9 ksi
Theoritical Prediction
The load head as well as the supports provide restraints in the system that can reduce the buckling length in the system. The crucial input to the critical buckling load equation is the assumption of the buckling length. For our case, actual buckled shape of the SafPlank was measured and used as an estimate for buckling length. For PF-3 (Fig. 70) and PF-4, these were measured just after buckling occurred in the test. For PF-5, no measurements were made. However, because of the application of the load directly to the top flange, the buckling length was significantly reduced. Hence, the buckling length for PF-5 was estimated to be span/3 (=22 in) based on observation of the buckled shape of the upper flange from the photographs.
Figure 69 : Representation of tested SafPlank by a single axi-symmetric section
Figure 70: Buckled shapes of Specimens PF-3, PF-4 and PF-5 (l to r)

73
6. Full Scale Impact Tests 6.1 Introduction A total of 36 full sized specimens were tested in the UW-SMTL under impact loading. Of these 36 panels, 20 panels were cast at a precaster in Mosinee and 6 of the panels were manufactured in the laboratory. The remaining 10 specimens were either obtained from manufacturers or local contractors in the State of Wisconsin. The rationale behind the impact tests was to characterize the specimens according to their energy absorption capacities and to try to correlate the results with the static test results discussed previously. Videos of the impact test (30 frames per second) were taken for all the specimens to provide a visual understanding of the movement of the striker object and the panel during impact. This report summarizes the key results from the impact drop tests. Elaborate graphics and photographs used to illustrate the behavior of the tested SIP formwork panels are provided in Malla (2007). Although the standard increments in drop heights have been defined as 6 in., this was only used as a guide and was not enforced for all tests. Instead, based on engineering judgment, refined increments were made in the experiments with drop heights increment of as small as 1 in. There were typically two test panels for each type of reinforcement. The first panel was tested with impact drop increments of typically 6 in. For the second specimen, where we knew the failure loads, smaller impact increments was used near the expected failure load to reduce the errors due to the abrupt steps specified for the impact loading. Key information is summarized in Malla (2007) for each specimen in this section including acceleration plots, impact drop heights for cracking, impact drop heights for failure, and any information on static loads placed on the specimen during the test. 6.2 Test Results This section analyzes the results of the impact tests in an attempt to make meaningful conclusions that will be helpful in the development of the specification. But, more importantly, it tries to understand the behavior of the specimens subject to impact load and the effect of the various reinforcement systems and how they affected the results. Total Impact Energy The total impact energy required to fail the specimen or crack the specimen (Etotal) includes the following energy components - energy required to fail the specimen (Efail), energy associated with the stiffness of the formwork (spring energy – ES), energy required to overcome damping (damping energy - ED), and energy required to accelerate the specimen during the impact process (inertial energy - EI). Refer to Equation (6-1)
(6-1)
failE E E E EI D Stotal = + + +
74
The above Equation (6-1) can be related to the equation for dynamic equilibrium of forces (Chopra, 2002) Equation (6-2), where the only missing component is the energy/force that is associated with failure of the specimen (Efail).
(6-2) For this case where there is loss of energy to damping, inertial, or spring forces, the individual energy components are not so important. The vital data is the total energy expended in failing or cracking a specimen. For the experiments that are carried out in the lab, this energy is the total potential energy of the striker object dropped from a specific height. In this simple method, the drop height that causes the specimen to fail is recorded. Although a crude method, it requires no computation and most importantly simulates a test that is very similar to a real impact that can be expected in field. The total impact energy is approximated from Equation (6-3). One possible drawback of this method is that since the weights are dropped from successive heights, it is not possible to find out the exact energy that is required to break the specimen. For our test procedure, since the striker object (50 lb) is dropped at 6 in. increments, the predicted impact energy can only be accurate to the nearest 25ft-lbf (50 lbf x ½ ft).
(6-3))
Where, P.E = potential energy (lbf-ft) m = mass of the drop striker object (lbf s2/ft) h = height that causes the panel to fail (ft) Fig. 71 shows the total energy required to either crack or break the specimen for the laboratory tests carried out. The red arrows on top of the bar chart indicate that the energy required to completely fail the specimen is probably higher than indicated. This is a result of either the impact loads reaching the maximum range of the laboratory test setup or the test being terminated without complete failure of the specimen. The cracking energy shown for SafPlank represents the energy at which visible local damage was first noticed in the system. Table 28 shows the actual values of the potential energy used for the plot.
.P E mgh Etotal= =
.. .( )mu c u ku p t+ + =
Inertial Force ~ EI External Force ~ E total
Damping Force ~ ED Spring Force ~ ES

75
0
50
100
150
200
250
300
350
400
Fondu
lac (N
ovom
esh)
Eau-C
laire
(Grac
e)
Steel F
iber
TD10x1
0 (NC)
G2800
@Mid
G2800
@Bot
SRG
C2750
@Mid
C2750
@Bot
C3000
@Mid
C3000
@Bot
FRP@6"
FRP@4"
W2 M
esh
Fortacr
ete W
et
Fortacr
ete D
ry
SAFPlank(1
F)
SAFPlank (
2F)
Tota
l Ene
rgy
(ft-l
b)
Cracking Failure
Fiber Reinforcement Grid Reinforcement (Glass/Carbon) Discrete Cts. Reinf Proprietary Systems
(250 lbf x 1ft )
(50lbf x 5ft)
Figure 71: Cracking and Failure Strength of Impact Test Specimens
Table 28: Total Energy to crack or fail the specimen
Energy Increase (%)Cracking Failure (Failure - Cracking)
Fondulac (Novomesh) 50 50 0%Eau-Claire (Grace) 37.5 37.5 0%Steel Fiber 83.3 300 260%TD10x10 (NC) 62.5 81.25 30%G2800@Mid 50.0 66.7 33%G2800@Bot 50.0 75 50%SRG 66.7 350 425%C2750@Mid 58.3 83.3 43%C2750@Bot 58.3 175 200%C3000@Mid 62.5 150 140%C3000@Bot 75.0 250 233%FRP@6" 62.5 333 433%FRP@4" 62.5 300 380%W2 Mesh 66.7 350 425%Fortacrete Wet 233 242 4%Fortacrete Dry 250 250 0%SAFPlank (1F) 250 300 20%SAFPlank (2F) 200 300 50%
Total Energy (ft-lb)Panel Type/Reinforcement System
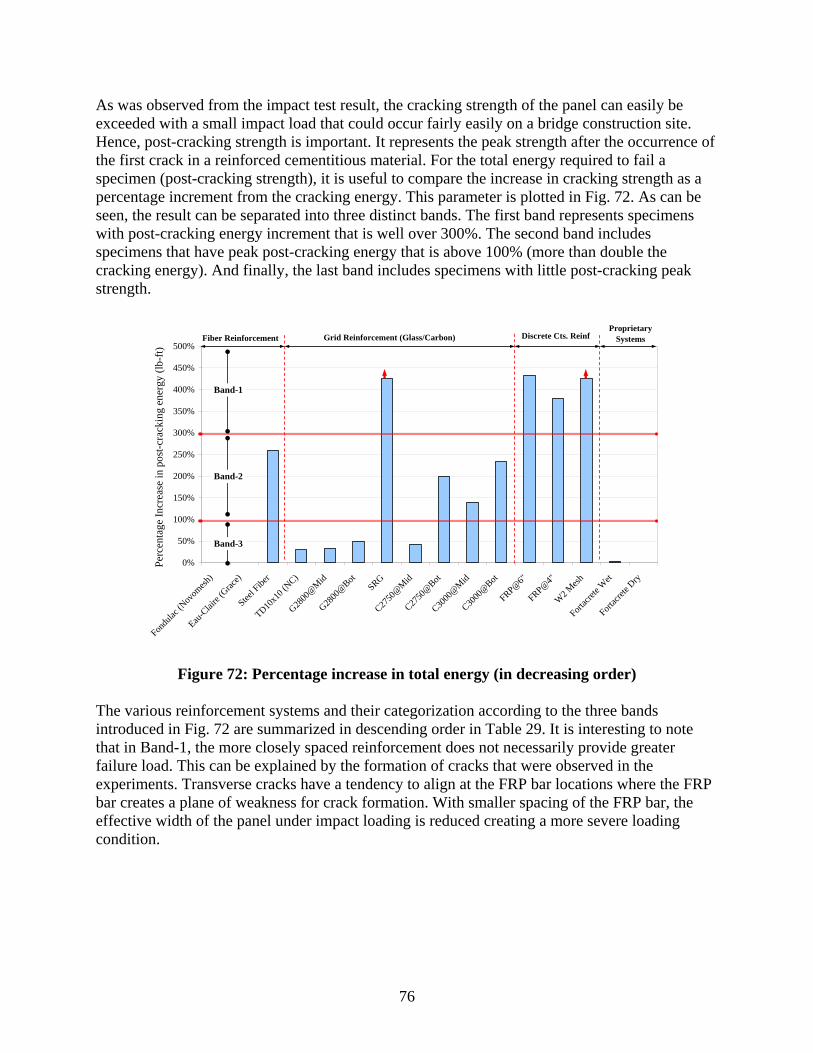
76
As was observed from the impact test result, the cracking strength of the panel can easily be exceeded with a small impact load that could occur fairly easily on a bridge construction site. Hence, post-cracking strength is important. It represents the peak strength after the occurrence of the first crack in a reinforced cementitious material. For the total energy required to fail a specimen (post-cracking strength), it is useful to compare the increase in cracking strength as a percentage increment from the cracking energy. This parameter is plotted in Fig. 72. As can be seen, the result can be separated into three distinct bands. The first band represents specimens with post-cracking energy increment that is well over 300%. The second band includes specimens that have peak post-cracking energy that is above 100% (more than double the cracking energy). And finally, the last band includes specimens with little post-cracking peak strength.
Figure 72: Percentage increase in total energy (in decreasing order) The various reinforcement systems and their categorization according to the three bands introduced in Fig. 72 are summarized in descending order in Table 29. It is interesting to note that in Band-1, the more closely spaced reinforcement does not necessarily provide greater failure load. This can be explained by the formation of cracks that were observed in the experiments. Transverse cracks have a tendency to align at the FRP bar locations where the FRP bar creates a plane of weakness for crack formation. With smaller spacing of the FRP bar, the effective width of the panel under impact loading is reduced creating a more severe loading condition.
0%
50%
100%
150%
200%
250%
300%
350%
400%
450%
500%
Fondu
lac (N
ovom
esh)
Eau-C
laire
(Grac
e)
Steel F
iber
TD10x1
0 (NC)
G2800
@Mid
G2800
@BotSRG
C2750
@Mid
C2750
@Bot
C3000
@Mid
C3000
@Bot
FRP@6"
FRP@4"
W2 M
esh
Fortacr
ete W
et
Fortacr
ete D
ry
Perc
enta
ge In
crea
se in
pos
t-cra
ckin
g en
ergy
(lb-
ft)
Fiber Reinforcement Grid Reinforcement (Glass/Carbon) Discrete Cts. ReinfProprietary
Systems
Band-3
Band-1
Band-2
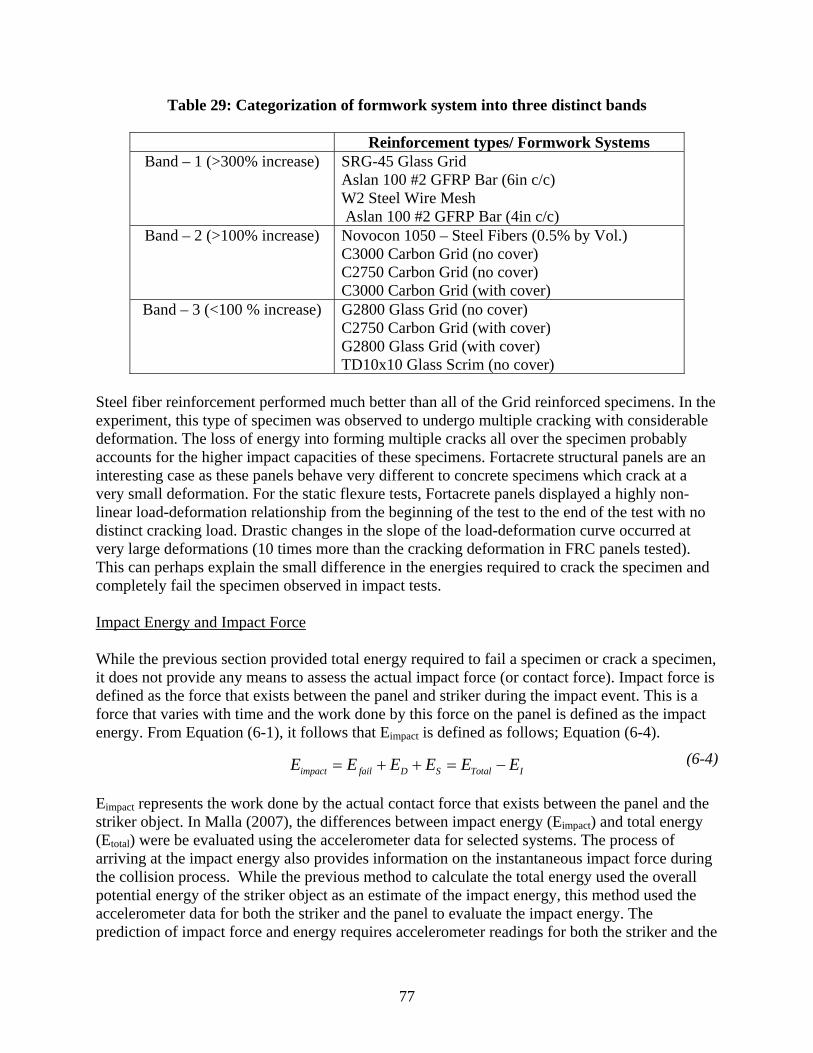
77
Table 29: Categorization of formwork system into three distinct bands
Reinforcement types/ Formwork Systems Band – 1 (>300% increase) SRG-45 Glass Grid
Aslan 100 #2 GFRP Bar (6in c/c) W2 Steel Wire Mesh Aslan 100 #2 GFRP Bar (4in c/c)
Band – 2 (>100% increase) Novocon 1050 – Steel Fibers (0.5% by Vol.) C3000 Carbon Grid (no cover) C2750 Carbon Grid (no cover) C3000 Carbon Grid (with cover)
Band – 3 (<100 % increase) G2800 Glass Grid (no cover) C2750 Carbon Grid (with cover) G2800 Glass Grid (with cover) TD10x10 Glass Scrim (no cover)
Steel fiber reinforcement performed much better than all of the Grid reinforced specimens. In the experiment, this type of specimen was observed to undergo multiple cracking with considerable deformation. The loss of energy into forming multiple cracks all over the specimen probably accounts for the higher impact capacities of these specimens. Fortacrete structural panels are an interesting case as these panels behave very different to concrete specimens which crack at a very small deformation. For the static flexure tests, Fortacrete panels displayed a highly non-linear load-deformation relationship from the beginning of the test to the end of the test with no distinct cracking load. Drastic changes in the slope of the load-deformation curve occurred at very large deformations (10 times more than the cracking deformation in FRC panels tested). This can perhaps explain the small difference in the energies required to crack the specimen and completely fail the specimen observed in impact tests. Impact Energy and Impact Force While the previous section provided total energy required to fail a specimen or crack a specimen, it does not provide any means to assess the actual impact force (or contact force). Impact force is defined as the force that exists between the panel and striker during the impact event. This is a force that varies with time and the work done by this force on the panel is defined as the impact energy. From Equation (6-1), it follows that Eimpact is defined as follows; Equation (6-4).
(6-4)
Eimpact represents the work done by the actual contact force that exists between the panel and the striker object. In Malla (2007), the differences between impact energy (Eimpact) and total energy (Etotal) were be evaluated using the accelerometer data for selected systems. The process of arriving at the impact energy also provides information on the instantaneous impact force during the collision process. While the previous method to calculate the total energy used the overall potential energy of the striker object as an estimate of the impact energy, this method used the accelerometer data for both the striker and the panel to evaluate the impact energy. The prediction of impact force and energy requires accelerometer readings for both the striker and the
impact fail D S Total IE E E E E E= + + = −

78
panel. For most of the high impact loads, the accelerometer was removed from the specimen and hence data from these panels cannot be used to predict the impact energy or the impact force. For more details of the acceleration data and the results see Malla (2007.)

79
7 Specification Development The specification for thin SIP formwork was developed based on both the research work carried out as part of this project and test results from the experimental investigations. As this is a specification developed largely for the Wisconsin Department of Transportation, emphasis has been made throughout the specification development to make the format of the specification compatible with the local practices in the State of Wisconsin. This involved a detailed study and observations of bridge construction work carried out by local bridge contractors and the procedures used in forming, installing as well as testing and approving of formwork panels. The draft specification developed as part of this project is included in Appendix A. The specification is a culmination of all the research work carried out as part of this study. However, it is to be emphasized that it is based on investigation on current materials that can form viable thin SIP formwork systems. While there has been a considerable attempt to generalize the specification to make it applicable for a wide range of formwork types, it is not possible to make detailed provisions for every single kind of formwork system that is currently available or will be developed in the near future. Additionally, every bridge structure is unique and hence, it is expected that the specification will require some form of customization for each bridge project. This section of the report discusses important aspects of the formwork design that were considered in the development of the specification. While most of the issues were performance related (strength, ductility, deflection, etc.) others were also related to constructability (costs, installation of the formwork, and detailing). Extensive references are made to the formwork panels tested in the discussion that ensues which also forms the basis for the particular requirements stipulated in the specification. Limits of the Specification The three constraints that were imposed on the formwork systems based on feedback from the contractors and common logic. These were: thickness of the panel, span of the panel, and width of the panel (Table 30). One of the key goals of the research was to be able to minimize installation time for the formwork panels. In doing so, it was decided that the formwork panel would be readily lifted and placed by a maximum of two workers without the aid of any lifting devices. This necessitated that the total weight of the formwork panel be capped at 200 lb. The thickness of the panel, the span of the panel, and the width of the panel are all related to the total weight limitations placed on the formwork.
Table 30: Constraints placed on the thin SIP formwork panels
Width of the formwork : 6 ft.Thickness of the formwork : 1.5 inSpan of the formwork : 4 ft.Overall weight of the panel : 200 lbf
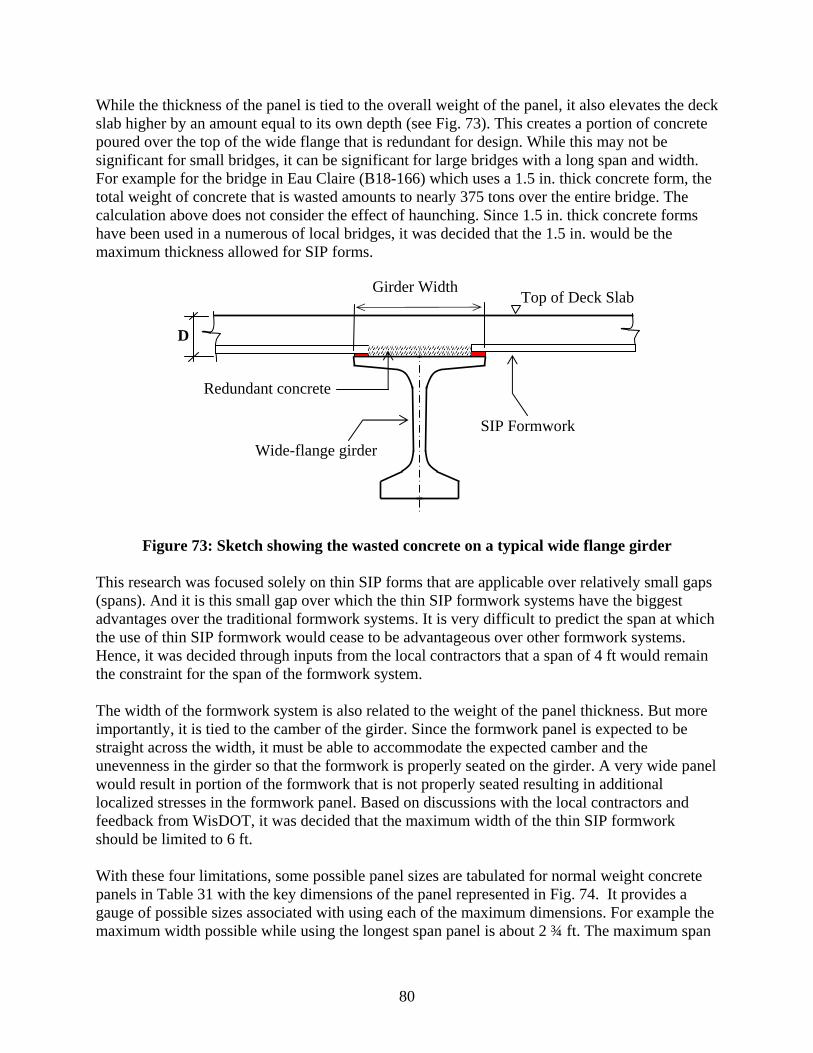
80
D
Top of Deck Slab
Wide-flange girderSIP Formwork
Girder Width
Redundant concrete
While the thickness of the panel is tied to the overall weight of the panel, it also elevates the deck slab higher by an amount equal to its own depth (see Fig. 73). This creates a portion of concrete poured over the top of the wide flange that is redundant for design. While this may not be significant for small bridges, it can be significant for large bridges with a long span and width. For example for the bridge in Eau Claire (B18-166) which uses a 1.5 in. thick concrete form, the total weight of concrete that is wasted amounts to nearly 375 tons over the entire bridge. The calculation above does not consider the effect of haunching. Since 1.5 in. thick concrete forms have been used in a numerous of local bridges, it was decided that the 1.5 in. would be the maximum thickness allowed for SIP forms.
Figure 73: Sketch showing the wasted concrete on a typical wide flange girder
This research was focused solely on thin SIP forms that are applicable over relatively small gaps (spans). And it is this small gap over which the thin SIP formwork systems have the biggest advantages over the traditional formwork systems. It is very difficult to predict the span at which the use of thin SIP formwork would cease to be advantageous over other formwork systems. Hence, it was decided through inputs from the local contractors that a span of 4 ft would remain the constraint for the span of the formwork system. The width of the formwork system is also related to the weight of the panel thickness. But more importantly, it is tied to the camber of the girder. Since the formwork panel is expected to be straight across the width, it must be able to accommodate the expected camber and the unevenness in the girder so that the formwork is properly seated on the girder. A very wide panel would result in portion of the formwork that is not properly seated resulting in additional localized stresses in the formwork panel. Based on discussions with the local contractors and feedback from WisDOT, it was decided that the maximum width of the thin SIP formwork should be limited to 6 ft. With these four limitations, some possible panel sizes are tabulated for normal weight concrete panels in Table 31 with the key dimensions of the panel represented in Fig. 74. It provides a gauge of possible sizes associated with using each of the maximum dimensions. For example the maximum width possible while using the longest span panel is about 2 ¾ ft. The maximum span
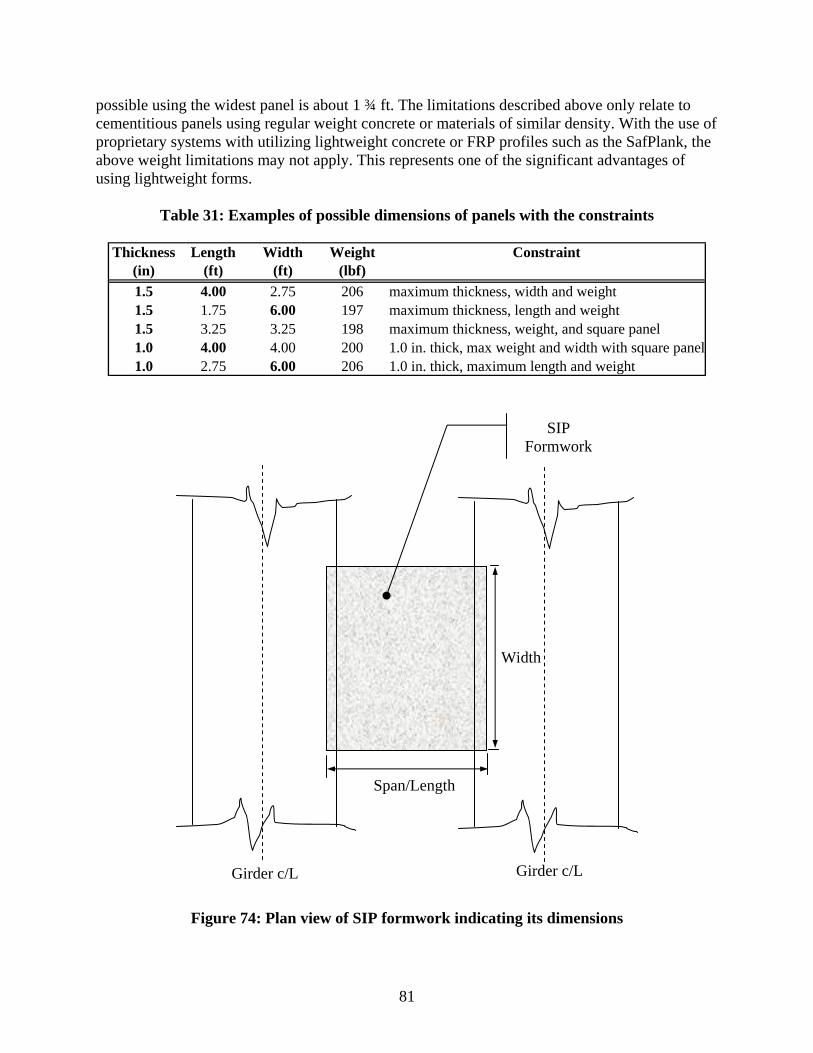
81
Girder c/L Girder c/L
Width
Span/Length
SIP Formwork
possible using the widest panel is about 1 ¾ ft. The limitations described above only relate to cementitious panels using regular weight concrete or materials of similar density. With the use of proprietary systems with utilizing lightweight concrete or FRP profiles such as the SafPlank, the above weight limitations may not apply. This represents one of the significant advantages of using lightweight forms.
Table 31: Examples of possible dimensions of panels with the constraints
Figure 74: Plan view of SIP formwork indicating its dimensions
Thickness Length Width Weight Constraint(in) (ft) (ft) (lbf)1.5 4.00 2.75 206 maximum thickness, width and weight1.5 1.75 6.00 197 maximum thickness, length and weight1.5 3.25 3.25 198 maximum thickness, weight, and square panel1.0 4.00 4.00 200 1.0 in. thick, max weight and width with square panel1.0 2.75 6.00 206 1.0 in. thick, maximum length and weight

82
System Classification It was clear from the static flexural testing carried out (Chapter 5) that there were tremendous variations in the load-deflection behavior of the different specimens tested. An ideal SIP formwork panel would have significant residual strength past the cracking load and would also possess a high level of ductility. With so many different types of unique load-deflection curves, it was essential to categorize them into groups. By doing so, relevant strength and safety requirements could be placed on each group based on the level of risk involved, simplifying the specification. The loading behavior up to the point of concrete cracking was similar for all cementitious specimens except for proprietary systems such as Fortacrete which did not have a well defined linear elastic range. Other proprietary systems such as SafPlank failed abruptly in the linearly elastic range. While pure concrete specimens did not have any residual strength, introduction of synthetic fibers resulted in a small residual strength. Considerable residual strength of more than 200% could be achieved by using grid reinforcing, discrete continuous reinforcing, and proprietary systems. The bar chart in Fig. 75 indicates the ratio of the residual stress at a deflection of L/150 over the cracking stress for the various fiber reinforced concrete specimens. All the five FRC systems indicate a very low residual stress (<20% approximate). In fact, there was no increment in stress to produce a distinct peak residual stress for these specimens and hence the residual stress at L/150 deflection is used. The only exception to this was the steel fiber reinforced concrete where there was a distinct post cracking peak load.
Figure 75: Ratio of residual stress at L/150 to cracking stress (average values)
0.06
0.11
0.15
0.21
0.00
0.05
0.10
0.15
0.20
0.25
Glas
s Fibe
rs (P
JG)
Grac
e Fib
ers (P
ZT)
Novo
mesh
950 (
PJN)
Novo
mesh 9
50 (P
LC)
Fiber Reinforced Specimens
σ15
0 / σ
cr
Fiber Reinforced Concrete

83
0.84
0.16
0.330.48
1.42
0.52
0.810.89
1.70
1.23
2.03
1.34
2.18
0.00
0.50
1.00
1.50
2.00
2.50
3.00
Stee
l Fib
ers (
0.5%
Vol
)LW
110
Mes
hG2
800
Glas
s Grid
SRG-
45 G
lass
Grid
LW11
0 Sc
rim (N
o Co
ver)
TD5x
5 Sc
rim (N
o Co
ver)
C275
0 Ca
rbon
Grid
C300
0 Ca
rbon
Grid
C550
0 Ca
rbon
Grid
#2 F
RP B
arSt
eel W
ire M
esh
Duro
ck C
emen
t Boa
rdFo
rtacr
ete (D
ry P
anel
)
Test Specimen Types
σr-
peak
/ σ
cr
Discrete CtsReinforcementsGrid Reinforcements
Proprietary SystemsFRC
This is shown separately with the rest of the reinforcement systems which had a post-cracking peak load (Fig. 76). All the ratios plotted are based on average effective stresses of the three specimens tested in the laboratory. Fig. 76 indicates that the addition of grid reinforcement produces a wide range of residual strength (33% to 170%) depending on the location, type, and amount of reinforcing used. The discrete continuous reinforcing and the proprietary systems tested produced residual strength that well exceeded 100% of the cracking strength.
Figure 76: Ratio of peak residual stress over cracking stress (average values) Examination of the various residual stress ratios obtained provides a clear picture of the residual stresses that can potentially be achieved in thin SIP formwork systems. All regular concrete formwork with reinforcing are expected to have a distinct cracking load followed by some residual strength. On the other hand, proprietary systems come in too many varieties and material types to use the same method of categorization that involves cracking stress and residual stress. Hence, it was decided to create two primary formwork classes (Class A and Class B) where Class A are custom-made cementitious panels and Class B are proprietary pre-engineered panels. Class A panels are further sub-divided into three major classes (A1, A2 and A3) based on the residual stress to cracking stress ratios (see Table 32). Class B refers to formwork that cannot be categorized in the above three categories because the product has multiple uses and is offered as a “off-the-shelf’ product in the market (e.g., Fortacrete manufactured by US Gypsum for

84
building structural floor panels). Class B panels are further subdivided into FRP pultruded profile panels and other (non-pultruded) premanufactured panels. The categorization described in Table 32 forms the basis for the specification of strength, serviceability, and safety requirements described in the remainder of this Chapter.
Table 32: SIP formwork classification Class Test Specimens Broad Definition
Class-A1
5.0≤cr
r
σσ
Glass Fibers Synthetic Fibers G2800 glass grid SRG-45 glass grid TD10x10 glass scrim LW110 glass scrim
All short synthetic and glass fiber reinforcements Light scrims
Class-A2
0.15.0 ≤<cr
r
σσ
Steel Fibers LW110 glass scrim (no cover) C2750 carbon grid C3000 carbon grid
Heavy steel fibers Scrims with no covers Light carbon grids
Class-A3
0.1>cr
r
σσ
C5500 carbon grid #2 FRP Bars Steel wire mesh
Heavy carbon grids FRP bars Steel bars and meshes
Class-B1 SafPlank FRP profiled shapes
Class-B2 Durock Fortacrete panels
Other proprietary (non-pultruded) systems
Design loads and stresses The formwork panels for the tests were designed based on dead loads and live loads as discussed in Chapter 4. However, these design loads were only used to size the panels for performance tests and not as a means of quantifying the panels. An overall study on the existing SIP forms used locally was relevant to see how these panels compared to the required loads established in this report. The load factors for the ultimate load combination are based on the ACI load factors of 1.2 (DL) and 1.6 (LL). An analysis of a typical fiber reinforced concrete specimen was carried out to understand the intensity of the specified loads. The severity of the loading compared to the capacity of the plain concrete specimens was used to develop the safety factors for static strength design in the subsequent section. The key aim of this part of the study was to understand the criticality of the flexural stresses and shear stresses for the design of FRC formwork panels. Three different thicknesses of FRC panels (1.0 in, 1.5 in, and 2.0 in. thick) were investigated using a MathCAD application (Malla 2007). Calculations were performed to find out the regions where the point load specification or the uniformly distributed load specification would govern the design of the section. As defined in Chapter 4, dead load consists of an 8 in thick wet concrete and live load consists of either a point load (250 lb) or a uniform load (50 psf). Fig. 77 plots the moment due to a uniformly distributed load (Mudl) and moment due to a point load (Mpt) as a function of the clear span length (Lc) for a 1.5 in. thick concrete panel. It indicates that
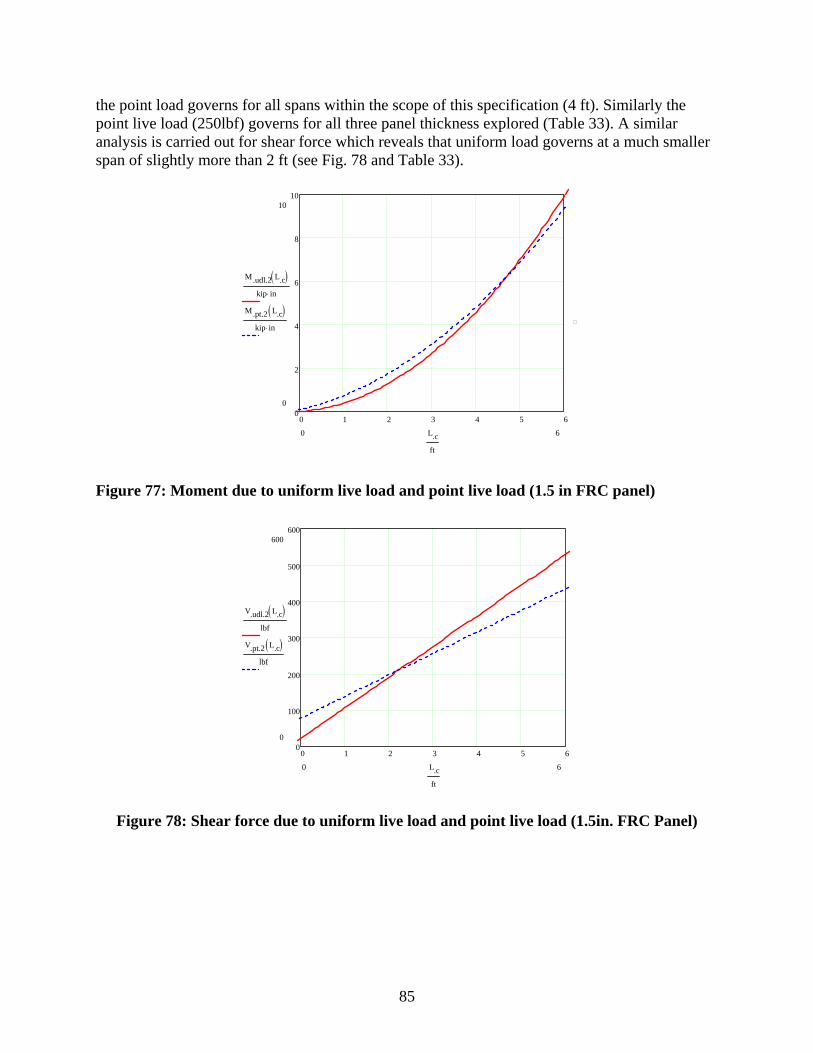
85
0 1 2 3 4 5 60
2
4
6
8
1010
0
M.udl.2 L.c( )kip in⋅
M.pt.2 L.c( )kip in⋅
60 L.c
ft
the point load governs for all spans within the scope of this specification (4 ft). Similarly the point live load (250lbf) governs for all three panel thickness explored (Table 33). A similar analysis is carried out for shear force which reveals that uniform load governs at a much smaller span of slightly more than 2 ft (see Fig. 78 and Table 33).
Figure 77: Moment due to uniform live load and point live load (1.5 in FRC panel)
Figure 78: Shear force due to uniform live load and point live load (1.5in. FRC Panel)
0 1 2 3 4 5 60
100
200
300
400
500
600600
0
V.udl.2 L.c( )lbf
V.pt.2 L.c( )lbf
60 L.c
ft

86
0 2 4 60
200
400
600
800
SIP Formwork Span (ft)
Extre
me
Fibe
r Fle
xura
l Stre
ss (p
si)
800
0
σ.max
psi
σ.s1 L.c( )psi
σ.s2 L.c( )psi
σ.s3 L.c( )psi
60 L.c
ft
Table 33: Critical span where uniformly distributed load governs
Critical span (ft) FRC Panel Thickness (in) Moment critical location Shear critical location
1.0 4.83 2.33 1.5 4.75 2.25 2.0 4.67 2.17
The next step was to look at the implication of the moment and shear on the cross section. This was carried out by calculating the flexural stress at the extreme fiber and shear stress across the cross section of the panel as per Equation (7-1) and (7-2). The stresses were plotted as a function of span in Fig. 79 and Fig.80. The plot clearly indicates that flexural stress is much more critical than the shear stress where the flexural stress demand increases exponentially with the span. The maximum flexural and shear stress as per Equation (7-3) nd (7-4) also shown in the same chart for a normal weight 4000 psi concrete. The maximum stresses are based on tensile rupture stress and shear capacity of plain concrete provided by ACI-318 (2005).
(7-1)
(7-2)
(7-3)
(7-4)
Figure 79: Flexural stress demand at the extreme fiber (1.0 in, 1.5 in, 2.0 in thick)
sMyI
σ =
sf
VW d
τ =×
'max 7.5 cfσ =
'max 2 cfτ =

87
0 2 4 60
50
100
SIP Formwork Span (ft)
Ave
rage
She
ar S
tress
(psi
)
140
0
τ .max
psi
ν.s1 L.c( )psi
ν.s2 L.c( )psi
ν.s3 L.c( )psi
60 L.c
ft
Figure 80: Shear stress demand (1.0 in, 1.5 in and 2.0 in thick FRC panel)
Comparison of demand to capacity of the section for both shear and flexural stresses was carried out by calculating the ratio of the above (capacity /demand) for each of the thickness as a function of the span length (Fig. 81). Since the moments and shears are based on the unfactored loads, the ratio can be interpreted as a form of safety factor available. The plot indicates that for a span of 4ft (our limit in this specification for Class A), the safety factor against flexural stresses is less than 1 and the safety factor against shear stress is close to 4.5. The analysis provides a good understanding of the existing loads with respect to fiber reinforced concrete panels. It is apparent that the shear is probably not going to be a critical part of the design and the simple ACI equation for shear can be safely used for all FRC panels. Flexural tensile stress is expected to be the governing design criterion for FRC panels. For a 1.5 in. thick panel, to achieve a factor of safety of at least 2.5 against flexural failure due to cracking, the span has to be limited to 1.2 ft. This is within the maximum span limit of 18 in. intended for Class A1 and Class A2 forms (see span limits imposed for different classes – Table 34. A similar study was carried out using one of the Class B formwork systems (SafPlank from Strongwell). The flange average stress is plotted as a function of the span length in Fig. 82 which indicates that the top flange compressive stress would always be larger than the tensile stress. The tensile strength assumed to be 69 ksi (Ringelstetter, 2006) would never be reached for any practical formwork span length and the failure would most likely be buckling of the thin flanges. This is the observation made for all the SafPlank specimens tested where the buckling stress in the top flange varied from 19 ksi to 34 ksi (72% to 51% less than the tensile strength). The study implies that Class B formwork system can span a much larger girder gap and that there is no reason to limit the span length in the specification. Additionally, the prediction of failure of SafPlank would need to consider the span as well as the restraints provided ageist buckling of the top flange.
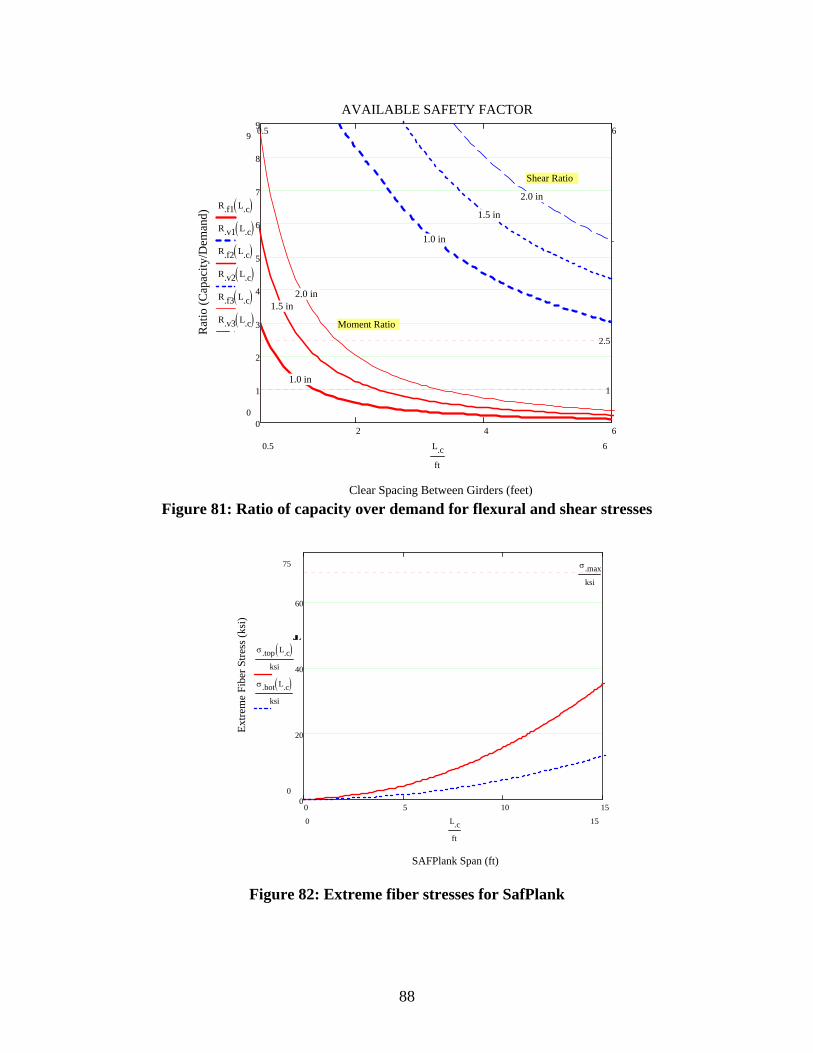
88
0 5 10 150
20
40
60
SAFPlank Span (ft)
Extre
me
Fibe
r Stre
ss (k
si)
75
0
σ.max
ksi
σ.top L.c( )ksi
σ.bot L.c( )ksi
150 L.c
ft
Figure 81: Ratio of capacity over demand for flexural and shear stresses
Figure 82: Extreme fiber stresses for SafPlank
2 4 60
1
2
3
4
5
6
7
8
9AVAILABLE SAFETY FACTOR
Clear Spacing Between Girders (feet)
Rat
io (C
apac
ity/D
eman
d)
9
0
1
2.5
R.f1 L.c( )R.v1 L.c( )R.f2 L.c( )R.v2 L.c( )R.f3 L.c( )R.v3 L.c( )
60.5
0.5 6
L.c
ft
Shear Ratio
2.0 in
1.5 in
1.0 in
2.0 in1.5 in
Moment Ratio
1.0 in
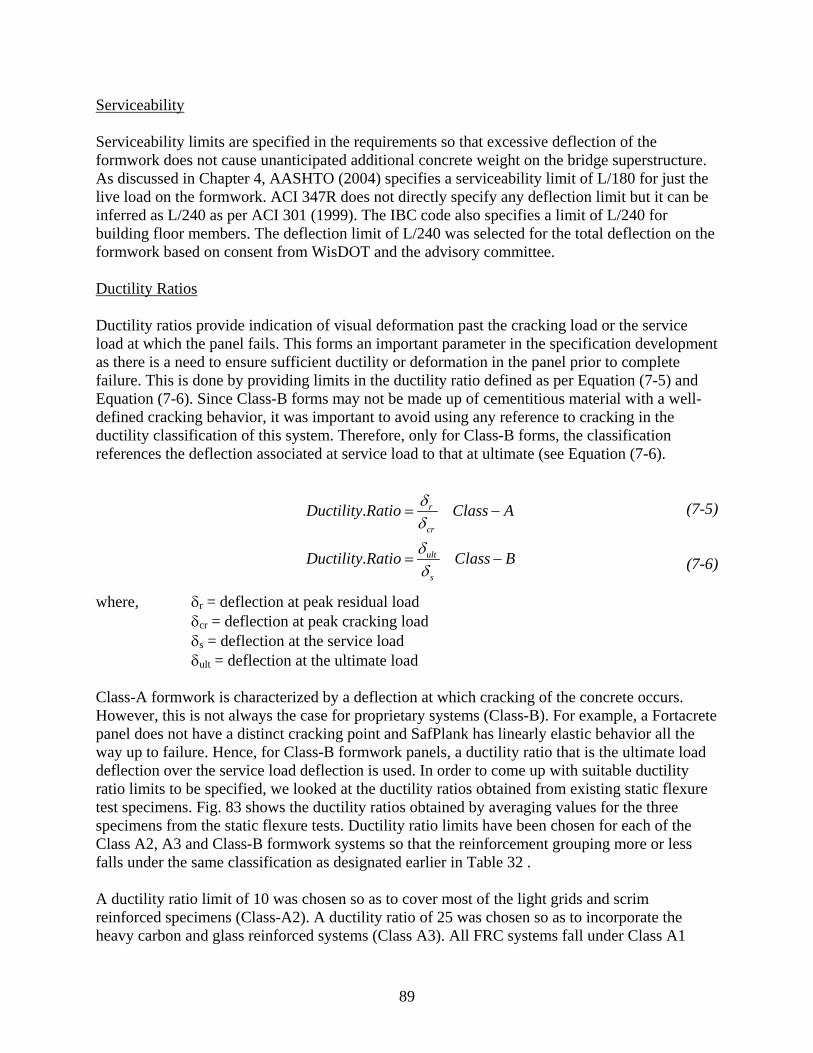
89
Serviceability Serviceability limits are specified in the requirements so that excessive deflection of the formwork does not cause unanticipated additional concrete weight on the bridge superstructure. As discussed in Chapter 4, AASHTO (2004) specifies a serviceability limit of L/180 for just the live load on the formwork. ACI 347R does not directly specify any deflection limit but it can be inferred as L/240 as per ACI 301 (1999). The IBC code also specifies a limit of L/240 for building floor members. The deflection limit of L/240 was selected for the total deflection on the formwork based on consent from WisDOT and the advisory committee. Ductility Ratios Ductility ratios provide indication of visual deformation past the cracking load or the service load at which the panel fails. This forms an important parameter in the specification development as there is a need to ensure sufficient ductility or deformation in the panel prior to complete failure. This is done by providing limits in the ductility ratio defined as per Equation (7-5) and Equation (7-6). Since Class-B forms may not be made up of cementitious material with a well-defined cracking behavior, it was important to avoid using any reference to cracking in the ductility classification of this system. Therefore, only for Class-B forms, the classification references the deflection associated at service load to that at ultimate (see Equation (7-6).
(7-5)
(7-6)
where, δr = deflection at peak residual load δcr = deflection at peak cracking load δs = deflection at the service load δult = deflection at the ultimate load Class-A formwork is characterized by a deflection at which cracking of the concrete occurs. However, this is not always the case for proprietary systems (Class-B). For example, a Fortacrete panel does not have a distinct cracking point and SafPlank has linearly elastic behavior all the way up to failure. Hence, for Class-B formwork panels, a ductility ratio that is the ultimate load deflection over the service load deflection is used. In order to come up with suitable ductility ratio limits to be specified, we looked at the ductility ratios obtained from existing static flexure test specimens. Fig. 83 shows the ductility ratios obtained by averaging values for the three specimens from the static flexure tests. Ductility ratio limits have been chosen for each of the Class A2, A3 and Class-B formwork systems so that the reinforcement grouping more or less falls under the same classification as designated earlier in Table 32 . A ductility ratio limit of 10 was chosen so as to cover most of the light grids and scrim reinforced specimens (Class-A2). A ductility ratio of 25 was chosen so as to incorporate the heavy carbon and glass reinforced systems (Class A3). All FRC systems fall under Class A1
. r
cr
Ductility Ratio Class Aδδ
= −
. ult
s
Ductility Ratio Class Bδδ
= −
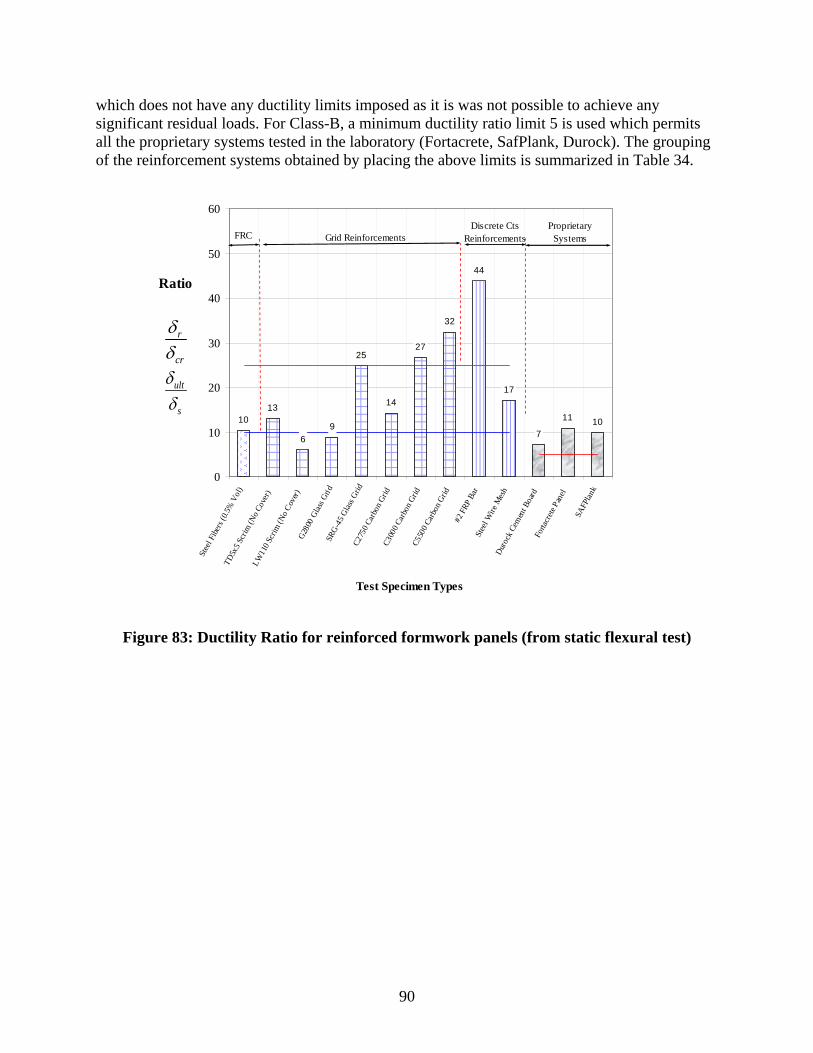
90
1013
69
25
14
27
32
44
17
7
11 10
0
10
20
30
40
50
60St
eel F
ibers
(0.5%
Vol
)TD
5x5 S
crim
(No C
over
)LW
110 S
crim
(No C
over)
G280
0 Gl
ass G
ridSR
G-45
Glas
s Grid
C275
0 Car
bon G
ridC3
000 C
arbo
n Grid
C550
0 Car
bon G
rid#2
FRP
Bar
Stee
l Wire
Mes
hDu
rock
Cem
ent B
oard
Forta
crete
Pan
el
SAFP
lank
Test Specimen Types
Ratio
Discrete CtsReinforcementsGrid Reinforcements
Proprietary SystemsFRC
r
cr
δδ
ult
s
δδ
which does not have any ductility limits imposed as it is was not possible to achieve any significant residual loads. For Class-B, a minimum ductility ratio limit 5 is used which permits all the proprietary systems tested in the laboratory (Fortacrete, SafPlank, Durock). The grouping of the reinforcement systems obtained by placing the above limits is summarized in Table 34.
Figure 83: Ductility Ratio for reinforced formwork panels (from static flexural test)
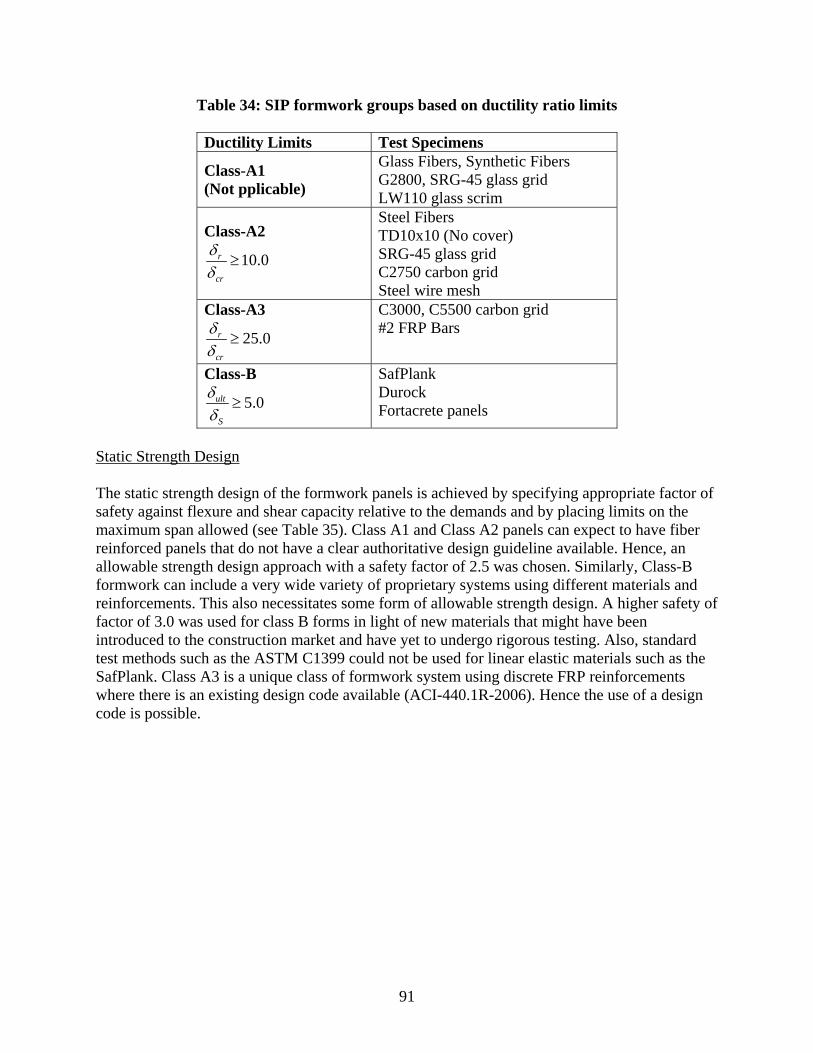
91
Table 34: SIP formwork groups based on ductility ratio limits
Ductility Limits Test Specimens
Class-A1 (Not pplicable)
Glass Fibers, Synthetic Fibers G2800, SRG-45 glass grid LW110 glass scrim
Class-A2
10.0r
cr
δδ
≥
Steel Fibers TD10x10 (No cover) SRG-45 glass grid C2750 carbon grid Steel wire mesh
Class-A3
25.0r
cr
δδ
≥
C3000, C5500 carbon grid #2 FRP Bars
Class-B
5.0ult
S
δδ
≥
SafPlank Durock Fortacrete panels
Static Strength Design The static strength design of the formwork panels is achieved by specifying appropriate factor of safety against flexure and shear capacity relative to the demands and by placing limits on the maximum span allowed (see Table 35). Class A1 and Class A2 panels can expect to have fiber reinforced panels that do not have a clear authoritative design guideline available. Hence, an allowable strength design approach with a safety factor of 2.5 was chosen. Similarly, Class-B formwork can include a very wide variety of proprietary systems using different materials and reinforcements. This also necessitates some form of allowable strength design. A higher safety of factor of 3.0 was used for class B forms in light of new materials that might have been introduced to the construction market and have yet to undergo rigorous testing. Also, standard test methods such as the ASTM C1399 could not be used for linear elastic materials such as the SafPlank. Class A3 is a unique class of formwork system using discrete FRP reinforcements where there is an existing design code available (ACI-440.1R-2006). Hence the use of a design code is possible.
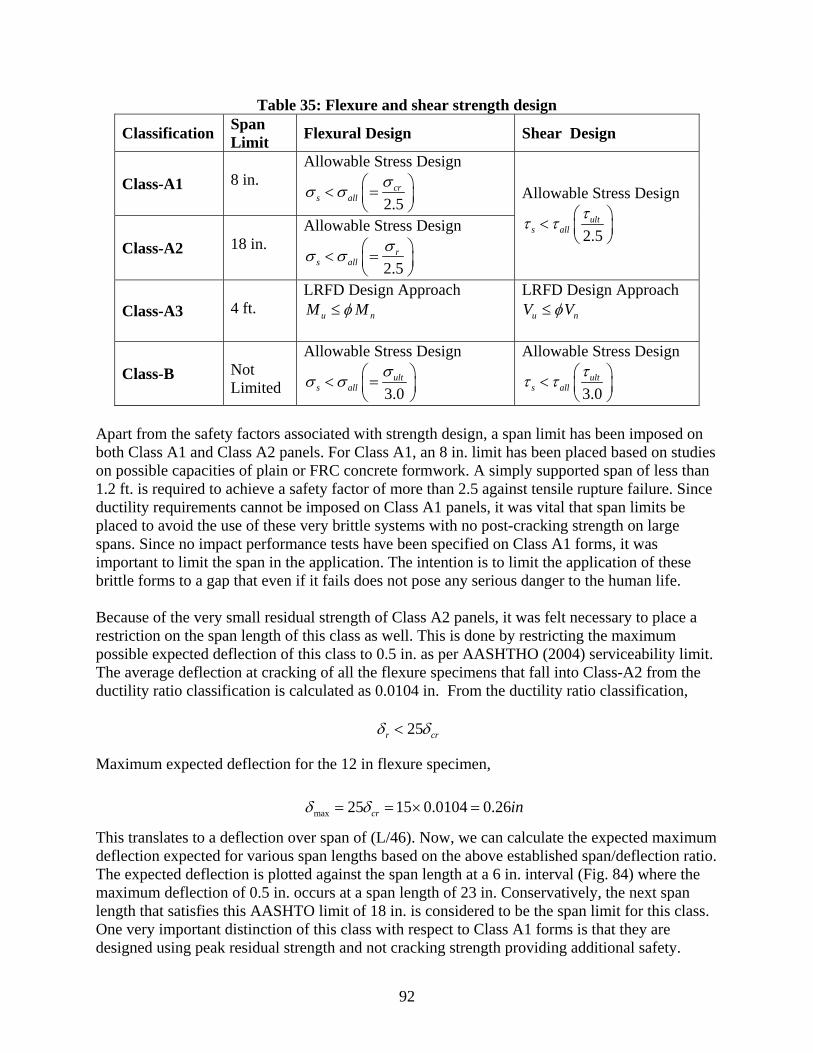
92
Table 35: Flexure and shear strength design
Classification Span Limit Flexural Design Shear Design
Class-A1
8 in.
Allowable Stress Design
2.5cr
s allσσ σ ⎛ ⎞< =⎜ ⎟
⎝ ⎠ Class-A2
18 in.
Allowable Stress Design
2.5r
s allσσ σ ⎛ ⎞< =⎜ ⎟
⎝ ⎠
Allowable Stress Design
2.5ult
s allττ τ ⎛ ⎞< ⎜ ⎟
⎝ ⎠
Class-A3 4 ft.
LRFD Design Approach nu MM φ≤
LRFD Design Approach nu VV φ≤
Class-B
Not Limited
Allowable Stress Design
3.0ult
s allσσ σ ⎛ ⎞< =⎜ ⎟
⎝ ⎠
Allowable Stress Design
3.0ult
s allττ τ ⎛ ⎞< ⎜ ⎟
⎝ ⎠ Apart from the safety factors associated with strength design, a span limit has been imposed on both Class A1 and Class A2 panels. For Class A1, an 8 in. limit has been placed based on studies on possible capacities of plain or FRC concrete formwork. A simply supported span of less than 1.2 ft. is required to achieve a safety factor of more than 2.5 against tensile rupture failure. Since ductility requirements cannot be imposed on Class A1 panels, it was vital that span limits be placed to avoid the use of these very brittle systems with no post-cracking strength on large spans. Since no impact performance tests have been specified on Class A1 forms, it was important to limit the span in the application. The intention is to limit the application of these brittle forms to a gap that even if it fails does not pose any serious danger to the human life. Because of the very small residual strength of Class A2 panels, it was felt necessary to place a restriction on the span length of this class as well. This is done by restricting the maximum possible expected deflection of this class to 0.5 in. as per AASHTHO (2004) serviceability limit. The average deflection at cracking of all the flexure specimens that fall into Class-A2 from the ductility ratio classification is calculated as 0.0104 in. From the ductility ratio classification, Maximum expected deflection for the 12 in flexure specimen, This translates to a deflection over span of (L/46). Now, we can calculate the expected maximum deflection expected for various span lengths based on the above established span/deflection ratio. The expected deflection is plotted against the span length at a 6 in. interval (Fig. 84) where the maximum deflection of 0.5 in. occurs at a span length of 23 in. Conservatively, the next span length that satisfies this AASHTO limit of 18 in. is considered to be the span limit for this class. One very important distinction of this class with respect to Class A1 forms is that they are designed using peak residual strength and not cracking strength providing additional safety.
25r crδ δ<
max 25 15 0.0104 0.26cr inδ δ= = × =

93
0.00
0.20
0.40
0.60
0.80
1.00
1.20
0 6 12 18 24 30 36 42 48 54
Span (in)
Exp
ecte
d M
ax D
efle
ctio
n (in
)
23 in.
L/46
0.5 in
Figure 84: Expected maximum deflection (Class-A2)
Impact Strength The requirement for impact strength for the formwork panel is to allow for accidental loads in the construction of the bridge deck. The behavior of the formwork under impact loads is highly complex and is very difficult to generalize. As we observed from the impact tests on the full sized panels, the performance is dependent on many variables including but not limited to the hardness of the drop object, the support bearing material, ductility of the reinforced panel, drop height, area of impact, number of impacts (fatigue) etc. For the draft specification, three successive drop of 250 ft-lb was considered to be an acceptable performance test for construction impact loads. This value is based on impact loads expected on a construction site which considers two simple cases (Table 36) where a construction worker is assumed to weigh 200 lb. and a typical tool carried by the person weighs 50 lb (ASCE 37, 2002). Human impact loads on roofs present a similar safety concern where the advisory committee on roof works (ACR, 2005) has come up with tests on non-fragility of roof panels. The development of these tests includes measurements of accidental falling of a worker which can be represented by having a 45kg sandbag fall 1.2m (389 ft-lb) with a built in safety factor of 1.9. Without the factor of safety, the impact load is approximately 200 ft-lb which corresponds well with our specification of 250 ft-lb. Based on this limit, for our full sized impact tests on a 28 in. span, only a handful of the tested specimens are likely to pass the impact requirement (namely- SFRC, SRG-45, C3000, C5500, FRP bar, Fortacrete, and SafPlank).
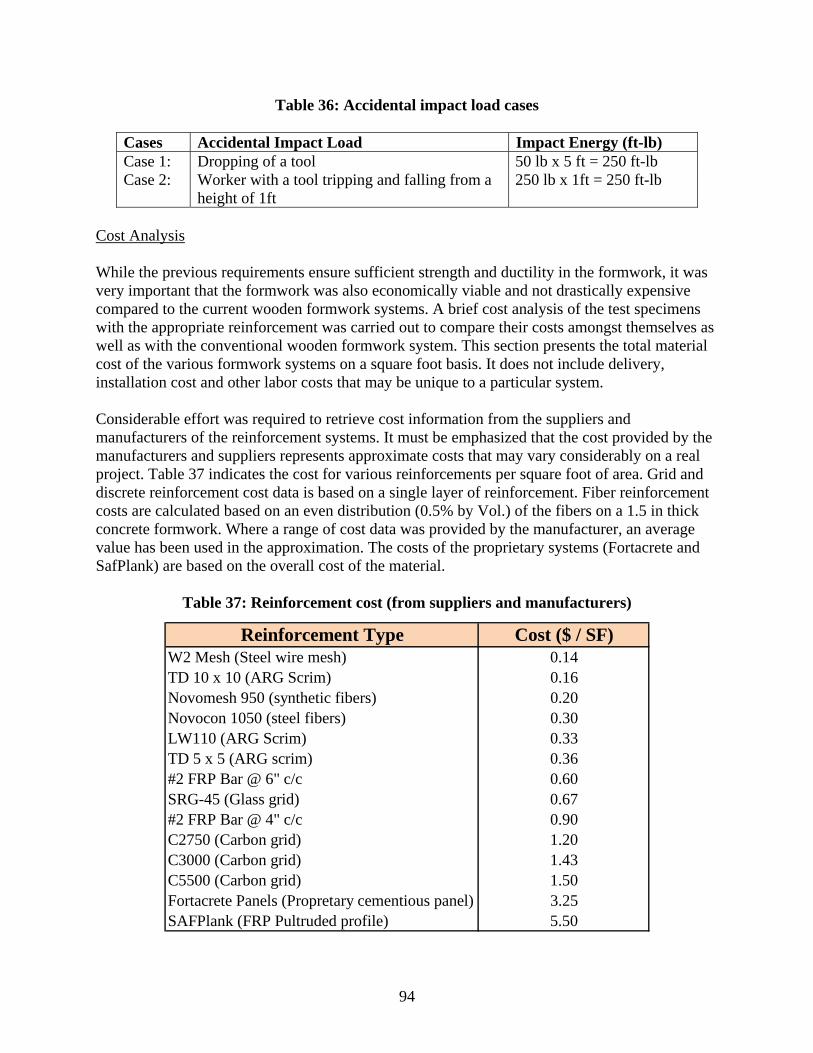
94
Table 36: Accidental impact load cases
Cases Accidental Impact Load Impact Energy (ft-lb) Case 1: Dropping of a tool 50 lb x 5 ft = 250 ft-lb Case 2: Worker with a tool tripping and falling from a
height of 1ft 250 lb x 1ft = 250 ft-lb
Cost Analysis While the previous requirements ensure sufficient strength and ductility in the formwork, it was very important that the formwork was also economically viable and not drastically expensive compared to the current wooden formwork systems. A brief cost analysis of the test specimens with the appropriate reinforcement was carried out to compare their costs amongst themselves as well as with the conventional wooden formwork system. This section presents the total material cost of the various formwork systems on a square foot basis. It does not include delivery, installation cost and other labor costs that may be unique to a particular system. Considerable effort was required to retrieve cost information from the suppliers and manufacturers of the reinforcement systems. It must be emphasized that the cost provided by the manufacturers and suppliers represents approximate costs that may vary considerably on a real project. Table 37 indicates the cost for various reinforcements per square foot of area. Grid and discrete reinforcement cost data is based on a single layer of reinforcement. Fiber reinforcement costs are calculated based on an even distribution (0.5% by Vol.) of the fibers on a 1.5 in thick concrete formwork. Where a range of cost data was provided by the manufacturer, an average value has been used in the approximation. The costs of the proprietary systems (Fortacrete and SafPlank) are based on the overall cost of the material.
Table 37: Reinforcement cost (from suppliers and manufacturers)
Reinforcement Type Cost ($ / SF)W2 Mesh (Steel wire mesh) 0.14TD 10 x 10 (ARG Scrim) 0.16Novomesh 950 (synthetic fibers) 0.20Novocon 1050 (steel fibers) 0.30LW110 (ARG Scrim) 0.33TD 5 x 5 (ARG scrim) 0.36#2 FRP Bar @ 6" c/c 0.60SRG-45 (Glass grid) 0.67#2 FRP Bar @ 4" c/c 0.90C2750 (Carbon grid) 1.20C3000 (Carbon grid) 1.43C5500 (Carbon grid) 1.50Fortacrete Panels (Propretary cementious panel) 3.25SAFPlank (FRP Pultruded profile) 5.50
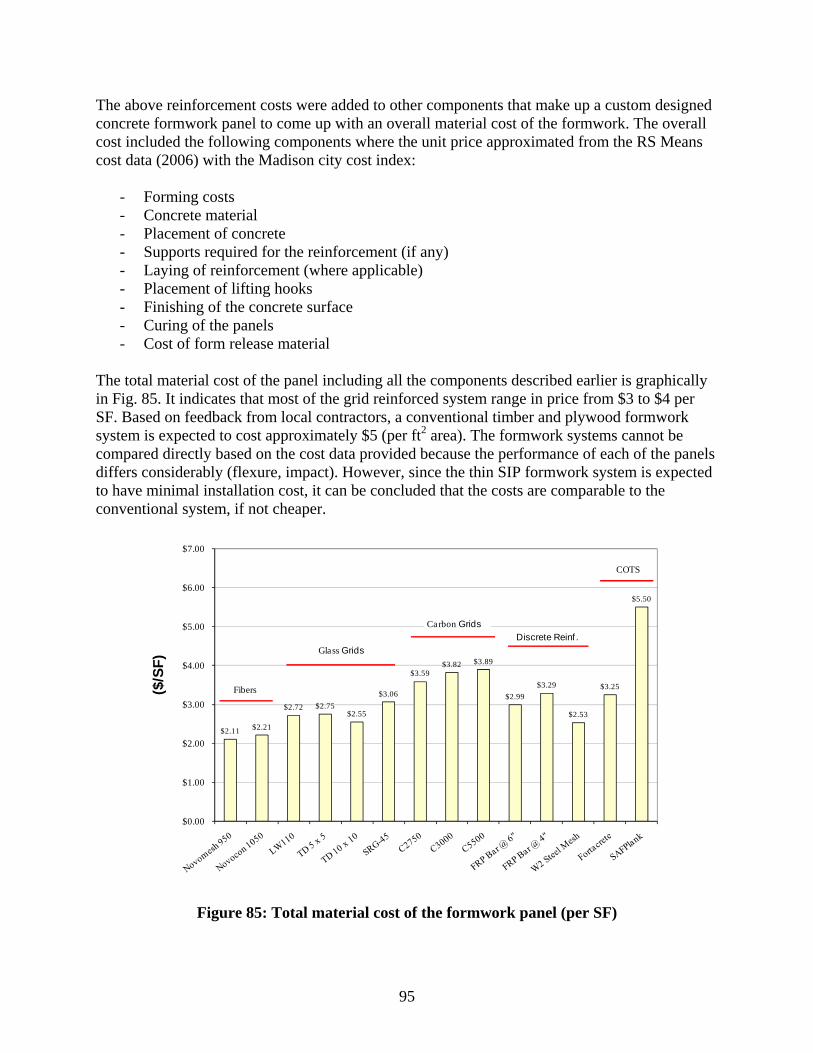
95
$2.11 $2.21
$2.72 $2.75 $2.55
$3.06
$3.59 $3.82 $3.89
$2.99 $3.29
$2.53
$3.25
$5.50
$0.00
$1.00
$2.00
$3.00
$4.00
$5.00
$6.00
$7.00
($/S
F)
Glass Grids
Carbon GridsDiscrete Reinf .
COTS
Fibers
The above reinforcement costs were added to other components that make up a custom designed concrete formwork panel to come up with an overall material cost of the formwork. The overall cost included the following components where the unit price approximated from the RS Means cost data (2006) with the Madison city cost index:
- Forming costs - Concrete material - Placement of concrete - Supports required for the reinforcement (if any) - Laying of reinforcement (where applicable) - Placement of lifting hooks - Finishing of the concrete surface - Curing of the panels - Cost of form release material
The total material cost of the panel including all the components described earlier is graphically in Fig. 85. It indicates that most of the grid reinforced system range in price from $3 to $4 per SF. Based on feedback from local contractors, a conventional timber and plywood formwork system is expected to cost approximately $5 (per ft2 area). The formwork systems cannot be compared directly based on the cost data provided because the performance of each of the panels differs considerably (flexure, impact). However, since the thin SIP formwork system is expected to have minimal installation cost, it can be concluded that the costs are comparable to the conventional system, if not cheaper.
Figure 85: Total material cost of the formwork panel (per SF)

96
0.91
0.71
0.22
0.31
0.55
0.46
0.78
0.54
0.37
0.00
0.10
0.20
0.30
0.40
0.50
0.60
0.70
0.80
0.90
1.00
(k-in
/ $)
One of the key performance requirements for the panels that could have been compared would be the static flexural capacity. Reinforcement supplied by the manufacturers did not all come with technical information to enable theoretical computations of moment capacities to be made and compared. Therefore to make some form of meaningful comparison amongst the various formwork systems, the experimentally obtained moment capacities were used. Experimental moment capacities from the ASTM static flexure tests were extrapolated for a full sized panel (4ft wide x 32” x 1.5”) and divided by the total material cost of the panel to obtain moment capacities per dollar cost of the panel (kip-in/$). These have been plotted in Fig. 86 which indicates, as expected, the steel wire mesh, FRP bar, and C5500 grid reinforced panels provide the most value for money based on the flexural capacity (assuming only a single reinforcement grid can be used per panel).
Figure 86: Experimental moment capacity per cost of panel (4ft x 32” x 1.5”)

97
8 Summary and Recommendations 8.1 Summary The first task of the research was to review existing literature on formwork design and practice (Chapter 2). The review not only touched on the various innovative formwork materials on the market but also studied three local bridges using thin SIP formwork. This allowed the researchers to interact with the local contractors and understand the problematic issues with the use of thin SIP formwork panels in Wisconsin. Two of the biggest local bridge contractors were included in the advisory committee and invited to meetings with the WisDOT to guide the research from the very beginning. The requirement for the use of non-metallic reinforcement in the State of Wisconsin meant that FRP type materials would be an obvious choice. Hence, FRP manufacturers and suppliers of other innovative materials that could potentially be part of the formwork system were included in the advisory committee and provided valuable suggestions and directions for the research. The review of the current state-of-the-practice in using thin SIP formwork revealed some of the flaws of the existing detailing practice, lack of robustness in some of the panels being used leading to perhaps an unsafe environment for workers, and the absence of guidance on dynamic loads from an authoritative standpoint. Various issues regarding construction detailing that are currently being used were questioned. The understanding of the local practice proved to be immensely helpful in the subsequent steps of the research starting from proposal of test specimens to the final specification development. The next key step in the research process was to propose suitable SIP formwork systems for testing and to carry out a more in-depth study. Selection of SIP formwork systems was carried out in Chapter 3 and relied heavily on the information gathered during the literature review. Various reinforcement types were gathered from manufacturers and suppliers in the country and grouped into four distinct groups – fiber reinforcements, thin grid reinforcements, discrete continuous reinforcements, and proprietary systems. Fiber reinforcements included synthetic fibers such as grace fibers and Novomesh 950, and chopped glass fibers. There was interest during this phase of the research on the ability of synthetic fibers to contribute towards the tensile rupture stress of the concrete. Steel fibers (Novocon 1050) were also collected for testing to serve as a benchmark for the non-metallic fiber reinforcements. Thin grid reinforcements included a variety of Alkali Resistant Glass (ARG) scrims, grids as well as carbon grids from manufacturers such as Techfab, Saint Gobain, and Nippon Electric Glass Company. Thin grid reinforcements varied from a grid size of 0.2 in. to 2.5 in. The smallest available size of Aslan 100 GFRP reinforcement was chosen as the only discrete continuous FRP reinforcement that was benchmarked against the conventional steel wire mesh. Finally, proprietary systems included products such as Fortacrete (US Gypsum), and SafPlank (Strongwell). A commonly available housing product, “Durock cement board” was also tested to understand how these commercial products performed compared to the others. Overall, we were successful in collecting a wide range of reinforcements for formwork manufacturing and subsequent testing.
98
Prior to the testing, the design loads needed to be clearly established. This enabled the test set-up to be chosen to accommodate the maximum design loads expected. Various national standards were reviewed to establish the design live loads; a combination of 50 psf and 250 lbf point load as described in Chapter 4. The serviceability limits were also established based on ACI 301-99 as span/240. While there was much information available for static design loads, impact design loads were not available in any of the existing standards on formwork design. The final impact load for design was established through rational means by considering a variety of possible accidental loads on a bridge construction site. This was established to be impact energy of 250 ft-lb based on the worst case scenario of a 200 lbf worker carrying a 50 lbf tool falling from a height of 1ft. With the establishment of both the static and impact design loads, the appropriate test procedures and fixtures for the laboratory tests were chosen. Because of the conflicting information on the strength contribution from fibers, it was essential that the test fixture was able to report on any gains in tensile rupture stress from the addition of fibers. For this reason, the flexure test method for fiber reinforced concrete specimens (ASTM C1018-97) was used. The testing of fiber reinforced specimens is a new and evolving area as we witnessed during the course of the research with the release of ASTM C1609-06 and ASTM C1399-07, as well as the withdrawal of the original ASTM C1018 test method. Most of the existing test methods for impact are based on homogenous materials such as plastics and ceramics that could only be tested on extremely small test specimens. Because of the complexity of the impact test and the possibility of not being able to get meaningful data from the impact tests, it was decided that full scale impact tests would be more appropriate. The most convincing reason was that if in the event of not being able to get meaningful results from the test data, a full scale impact test would still be able to provide relevant performance tests. A laboratory test method for impact was developed using a simple test fixture that used a 50 lb weight dropped from varying height. Accelerometers were attached to both the striker object and the formwork panel to enable the contact force during the impact to be estimated. A total of 70 static flexure test specimens and 36 full-sized impact test specimens were tested in the laboratory. The results of the flexure tests and the analysis of the data to gain further understanding of the behavior of the various reinforcing system was described in Chapter 5. Similarly, the results of the full scale impact tests are reported in Chapter 6 with further analysis of the recorded accelerometer data. The results from the static flexure test data were analyzed to understand three important properties – cracking behavior and the effect of fibers, peak residual strength and the nature of the load deflection curve up to the peak residual strength, and the impact energy required to reach the peak residual strength. The flexure tests indicated that the addition of glass and synthetic fibers at the dosage (up to a maximum of 0.5% by volume) made no significant difference to the cracking strength of the concrete. It was observed that the synthetic fiber reinforced specimens from the actual bridge formwork (Wausau and Eau Claire) displayed widely varying cracking strength (400 psi to 721 psi) compared to those specimens cast in the lab (683 psi to 880 psi). This could either be related to the strength of the concrete which was considerably higher in the laboratory tests or the related to the larger size of the aggregate used in the bridge formwork panels. For the specimens using

99
chopped glass fibers, the cracking strength was observed to be very consistent for the three specimens compared to the control specimen. A coefficient of variation for the control specimens was nearly 75% verses just 6 % for the glass reinforced specimens. It is suspected that minor cracks existed in the control specimens that failed immediately at a much lower load. While the gain in any cracking strength from the addition of fibers is insignificant, fibers provide an important benefit in that it is possible to avoid cracking due to shrinkage, transportation or handling stresses resulting in a more consistent cracking strength for the actual load application. All the synthetic fiber reinforced specimens showed little or no residual strength (<5% approximate). The deficiencies in the test method to capture data during the abrupt failure meant that any area computed under the curve during the failure was overestimated. Hence, any means of reporting the energy absorbed for synthetic and glass fiber reinforced concrete was not possible. Glass fiber reinforced concrete specimens behaved very differently to synthetic fiber reinforced concrete specimens. The failure was not as abrupt as the SNFRC specimens and test data could be recorded in sufficient detail during the failure process. The residual strength at L/150 was significantly higher (approximately 20% of the cracking strength). Steel reinforced specimens (SFRC) displayed extremely high residual strength (~80% of the cracking strength) with a distinct post-cracking peak in the load-deflection curve that was unlike any of the other fiber reinforced concrete specimens. The introduction of alkali resistant glass scrims, glass and carbon FRP grid reinforcement in the concrete matrix allowed significant residual strength to be attained depending on both the location (cover) and the tensile strength of the reinforcement. Specimens reinforced with light ARG scrims displayed an abrupt drop in load upon cracking followed by a gradual drop in load to failure as fibers ruptured progressively. On the other hand, the heavy grids (C2750, C3000, and C5500) displayed a saw toothed type of load-deflection curve past the cracking load with each of the drops in load for the saw tooth corresponding to the development of a flexural tensile crack. The peak residual strength for these grid reinforced specimens varied from approximately 140% to 180% of the cracking strength. Both the SafPlank and Fortacrete panels had unique load deflection curves. SafPlank was linearly elastic to the point of failure where failure occurred as a result of lateral torsional buckling of the upper flange. The Fortacrete panel displayed a non linear load-deflection curve with no readily identifiable cracking point. Energy absorbed up to the peak residual strength was calculated for each of the reinforced specimens which had distinct post peak strength. These energy values were extrapolated to a full width specimen (4ft wide) that would be used for the impact tests. The results indicate that the thin grid reinforced specimens required anywhere from 42 ft-lb to 150 ft-lb of energy to reach the peak residual strength. The #2 FRP reinforced specimen displayed the highest energy required of 182 ft-lb. The Fortacrete panel had an energy absorption that was relatively high (83 ft-lb); more than the thicker concrete panels reinforced with light carbon and glass grids. Overall, the static flexure tests allowed detailed understanding of the load-deflection behavior of the panels and the expected failure mechanism which would be important in the development of specifications for the SIP forms. The full scale impact tests carried out in the laboratory served to fulfill three functions- understand the cracking behavior leading up to failure, provide a performance test of the

100
formwork panel, and furnish means of developing a method for analyzing and numerical manipulation of the accelerometer data for impact energy. The impact energy required to fail the specimens varied from 50 ft-lb for SNFRC specimens to 350 ft-lb or more for the SRG-45 grid and the steel wire mesh. It was observed that as the specimen becomes more ductile with significant deformation to the peak residual stress, the impact capacity of the panel increases. The effect of using the reinforcement towards the extreme tensile face (no cover) was observed to increase the impact capacity of all the panels significantly (more than 100% for the case of C2750 carbon grid reinforcement). One of the important findings of the impact testing was that the provision of a soft bearing for the formwork panel has a significant effect of reducing the flexural strength of the panel under impact loading. The observation of the failed specimen with reinforcements provided with a ½ inch cover indicated that the actual cover varies considerably within the specimen because of the flexibility of the reinforcement grids. This could have considerable implications on both the flexural and impact capacity of the formwork panel. Another interesting observation made was that for the FRP bar reinforced specimens, the formation of transverse cracks occurred along the FRP bar locations. This results in the formation of transverse cracks adjacent to the striker head leading to localized failure of the specimen. Hence, closer spacing of the FRP bar may not necessarily increase the impact capacity of the formwork system and in fact may have the opposite effect. A theoretical method based on the acquired accelerometer readings was used to estimate the contact force between the formwork and the striker object to enable force-deformation curves during the impact to be plotted. This allowed the energy required to fail the specimen to be approximated. The results did not provide a meaningful correlation to be made with the energy computed from the static tests and is probably the result of having too many variables in the specimens (static and full-impact specimens). Overall, the full sized impact tests provided a deep understanding of the failure behavior of formwork panels under impact loads that was valuable in developing the specification. The final objective of the research was to develop a design/performance specification for thin SIP formwork for highway bridge girders. This was achieved by assimilating all the information gathered from both the literature review and the test results and applying the knowledge in a rational way in the specification development process. The process of developing the specification is explained in detail in Chapter 7. It includes the general good construction detailing observed from visits to the local bridge sites to the more detailed ductility ratios to be imposed based on test results. Also, cost analysis carried out on the tested panels indicates a price that is competitive compared to the traditional wood and plywood formwork system. There is still more room for the specification to be improved further in the future. But, based on the current available knowledge and the limited tests carried out, we believe that the draft specification represents a significant first attempt. The development of the draft specification successfully completes the primary goal of this research.
101
8.2 Recommendations for further Research During the course of performing the research, a number of areas in which further research is warranted were discovered. These areas of recommended continuing research are presented in the following discussion. There were variations in concrete strength as well as the mix design between the impact specimens that were cast at the precaster in Mosinee and the ones cast in the laboratory. More significantly, the aggregate size used in the laboratory specimens was pea gravel while the ones in Mosinee used a standard ¾ inch aggregate. While the strength of concrete can be normalized to some extent for the properties such as the tensile rupture strength or the compressive strength in the compressive stress block, the effect of aggregate size cannot be accounted for. This could potentially have a significant impact for thin panels. On a positive side, the goal of the research was not to compare different formwork systems in detail but to understand each formwork system to be able to apply the knowledge in the development of the specification. It is recommended that any testing carried out in the future have specimens for both static and impact tests manufactured from the same batch of concrete. Additionally, the effect of aggregate size in the flexural and impact performance of thin concrete formwork needs to be further investigated so that future SIP formwork specifications can incorporate the findings of the study. For the static flexure tests, the method used in this report requires the cracking of the specimen and the measurement of the subsequent residual strength. This can either over-estimate or under-estimate the residual strength of a pre-cracked panel depending on the panel material type. For example, synthetic FRC panels that are lightly reinforced (< 10 lb/yd3) are expected to undergo a sudden drop in load at failure because of the sudden release of spring energy at this instance. For this case, residual strength from an already pre-cracked specimen is expected to be higher. Hence, for this reason, the ASTM C1399 test is proposed as the appropriate static flexure strength test. It is recommended that where the strength of the fiber contribution towards the concrete cracking strength is not expected, ASTM C1399 be used for all future tests. The provision of a ½ inch polystyrene bearing contact at the formwork support may have a significant effect on the progression of cracks as well as the strength of the panel. While this detail was used in the Eau Claire Bridge, it is perhaps not the recommended detail because of the laborious process of cutting the polystyrene to account for the haunching across the bridge span. There is also an undesirable possibility of settlement of the deck slab over the long run. Hence, it is suggested that similar impact tests be carried out without using the soft deformable bearing. For any subsequent tests carried out, it is recommended that the static test panel and the impact test panel be of the same size so as to prevent this type of error in the comparison. In order to avoid the problem of two-way bending, both the specimens need to be sized so that there is primarily one-way bending in the specimens throughout the duration of the test. If full-sized panel tests are required to be tested, the flexure test specimens could be the same size as the impact test specimens so that two-way bending occurs in both specimens. For the full sized impact tests, positioning of the reinforcement was very difficult. Although some of the panels were provided with a ½ in. cover, the cover varied considerably over the
102
cross section. If these flexible grid reinforcements are to be used with cover, there is a need to investigate methods to more accurately position the reinforcement. As we observed from both the static and impact tests, there are significant increases in both strength and impact energies by lowering the reinforcement location in the section. It is fruitless to theoretically attempt to analyze the effect of reinforcement location on the capacities of the panels unless the location of the reinforcement can be accurately positioned. The impact tests of the full-sized panels were carried out assuming that effects of repeated loads are ignored. However, it is clearly observed that after the elastic range of the specimen (post-cracking), the system is highly non-linear with loss of energy occurring with each impact load. Hence, the final impact load is an underestimate of the actual impact capacity of the panel as it has suffered considerable damage from the previous impact loads. It is highly recommended that in order to ascertain the exact impact load capacity of a specimen, many tests be carried out to find out the single impact load that causes the specimen to fail. This would represent the exact impact capacity of the specimen. The performance tests of 3 successive impact of 250 ft-lb are expected to be conservative compared to the type of impact that can occur on a site. With a single drop of 250 ft-lb, considerable cracking and deformation is expected warranting the replacement of the installed panel. The full scale impact tests were carried out using a hard body striker object which is expected to have a significantly different contact force and distribution over time during impact compared to a soft body object such as those specified in the specification (leather bag striker object specified in ASTM E695). A hard body striker object is expected to produce a larger impact contact force compared to a soft body. Therefore, impact test capacities predicted from this research for the various formwork panels are probably an under-estimate of the final specification based soft body impact loads. There is a need to calibrate the force produced by a soft body impactor with those from a hard body impactor. This would enable meaningful interpretation of the results impact test results reported in this research. Although there was considerable collaboration between the research team and the industry professionals and local contractors, the extent of partnership could be further enhanced to provide additional benefits to the research. One of the possible viable formwork systems for this research was the use of thin glass fiber reinforced concrete. These are well known to be used for architectural cladding panels and have even been used as SIP forms for similar applications (BCMGRC). Attempts to obtain samples from this British precaster were unsuccessful and we were unable to partner with local GFRC precaster to investigate this type of formwork system. Further research in this area would need to include thin GFRC specimens manufactured using spray-up type methods and produced in corrugated or profiled forms to increase its stiffness. This is the first attempt to create a draft specification requiring a significant number of tests over a relatively short time. Because of the shear number of reinforcement types explored, an in-depth study into each reinforcement type could not possibly be made. Because of the small number of test specimens for each type; two for impact tests and three for static flexure tests, we were unable to make strong statements with any significant statistical confidence levels. It is recommended that the next study in this area consider only the most promising systems and carry

103
out tests in significant numbers so as to derive results that can have a definite statistical basis for acceptance.

104
References American Association of State Highway and Transportation Officials (1994), Manual for
condition evaluation of bridges, AASHTO, Washington, D.C. American Association of State Highway and Transportation Officials (2007), AASHTO LRFD
Bridge Design Specifications, AASHTO, Washington, D.C. American Association of State Highway and Transportation Officials (2003), Standard Method
of Test for Flexural Strength of Concrete (Using Simple Beam with Center-Point Loading), AASHTO T 177-03, AASHTO, Washington, D.C.
American Association of State Highway and Transportation Officials (2003), Standard Method of Test for Flexural Strength of Concrete (Using Simple Beam with Third-Point Loading), AASHTO T 97-03, Washington, D.C.
American Concrete Institute, Committee 440 (2006), Guide for the Design and Construction of Structural Concrete Reinforced with FRP Bars, ACI 440.1R-06, Farmington Hills, Michigan.
American Concrete Institute, Committee 318 (2005), Building Code Requirements for Structural Concrete and Commentary, ACI 318-05, American Concrete Institute, Farmington Hills, Michigan.
American Concrete Institute, Committee 440. (2002), Guide for the design and construction of externally bonded FRP systems for strengthening concrete structures, American Concrete Institute, Farmington Hills, Michigan.
American Concrete Institute, Committee 544 (2002), State-of-the-Art Report on Fiber Reinforced Concrete, ACI 544.1R-96 (Reapproved 2002), Farmington Hills, Michigan.
American Concrete Institute (2000), Guide for Measuring, Mixing, Transporting, and Placing Concrete, ACI 304R-00, American Concrete Institute, Farmington Hills, Michigan.
American Concrete Institute (1999), "Structural applications of fiber reinforced concrete", ACI SP-182, ACI International, Farmington Hills, Michigan.
American Concrete Institute (1994), “Fiber Reinforced Concrete: Developments and Innovations”, ACI SP-142, American Concrete Institute, Farmington Hills, Michigan.
Advisory Committee for Roof-work (2005), "Test for Non-Fragility of Profiled Sheeted Roofing Assemblies." Rep. No. ACR [M] 001:2005, 3rd Ed., http://www.ridba.org.uk/advicenotes/ACR_Red_book_3rd_editionfinal240505amend.pdf(05/20, 2007).
American Concrete Institute (2004), Report on Thin Reinforced Cementitious Products, ACI 549.2 R, Farmington Hills, Michigan.
American Concrete Institute (2004), Guide to Formwork for Concrete, ACI 347R-04, Farmington Hills, Michigan.
American National Standards Institute (2001), American National Standard for Construction and Demolition Operations: Safety Requirements for Scaffolding, ANSI/ASSE A10.8-2001, American Society of Safety Engineers, Des Plaines, Illinois.
American Society of Civil Engineers (2002), Design Loads on Structures during Construction, ASCE 37-02, Reston, VA.
American Society for Testing and Materials (2007), Standard Test Method for Obtaining Average Residual-Strength of Fiber-Reinforced Concrete, ASTM C1399-07, ASTM International, West Conshohocken, PA.

105
American Society for Testing and Materials (2007), Standard Test Method for Impact Resistance of Flat Rigid Plastic Specimens by Means of a Falling Dart (Tup or Falling Mass), ASTM D 5628-07, ASTM International, West Conshohocken, PA.
American Society for Testing and Materials (2006), Standard Specification for Steel Fibers for Fiber-Reinforced Concrete, ASTM A820-06, ASTM International, West Conshohocken, PA.
American Society for Testing and Materials (2006), Standard Test Method for Flexural Performance of Fiber-Reinforced Concrete (Using Beam with Third-Point Loading, ASTM C1609-06, ASTM International, West Conshohocken, PA.
American Society for Testing and Materials (2006), Standard Test Methods for Determining the Izod Pendulum Impact Resistance of Plastics, ASTM D256-06, ASTM International, West Conshohocken, PA.
American Society for Testing and Materials (2005), Standard Test Methods of Conducting Strength Tests of Panels for Building Construction, ASTM E 72-05, ASTM International, West Conshohocken, PA.
American Society for Testing and Materials (2005), Standard Practice for Reporting Data from Structural Tests of Building Constructions, Elements, Connections, and Assemblies, ASTM E575-05, ASTM International, West Conshohocken, PA.
American Society for Testing and Materials (2004), Standard Test Method for Flexural Toughness of Fiber Reinforced Concrete (Using Centrally Loaded Round Panel, ASTM C 1550-04, ASTM International, West Conshohocken, PA.
American Society for Testing and Materials (2004), Standard Test Method for Compressive Strength of Cylindrical Concrete Specimens, ASTM C39-04a, ASTM International, West Conshohocken, PA.
American Society for Testing and Materials (2004), Standard Test Method for Impact Resistance of Flat, Rigid Plastic Specimen by Means of a Striker Impacted by a Falling Weight (Gardner Impact), ASTM D 5420-04, ASTM International, West Conshohocken, PA.
American Society for Testing and Materials (2003), Standard Specification for Fiber-Reinforced Concrete, ASTM C1116-03, ASTM International, West Conshohocken, PA.
American Society for Testing and Materials (2003), Standard Test Method for Resistance of Concrete to Rapid Freezing and thawing, ASTM C666/C666M-03, ASTM International, West Conshohocken, PA.
American Society for Testing and Materials (2003), Standard Test Method for Conducting Transverse and Concentrated Load Tests on Panels used in Floor and Roof Construction, ASTM E 2322-03, ASTM International, West Conshohocken, PA.
American Society for Testing and Materials (2003), Standard Test Method for Performance of Wood and Wood-Based Floor and Roof Sheathing Under Concentrated Static and Impact Loads, ASTM E661-03, ASTM International, West Conshohocken, PA.
American Society for Testing and Materials (2003), Standard Method for Measuring Relative Resistance of Wall, Floor, and Roof Construction to Impact Loading, ASTM E695-2003, ASTM International, West Conshohocken, PA.
American Society for Testing and Materials (2002), Standard Test Method for Flexural Strength of Concrete (Using Simple Beam with Center-Point Loading), ASTM C 293-02, ASTM International, West Conshohocken, PA.

106
American Society for Testing and Materials (2002), Standard Test Method for Flexural Strength of Concrete (Using Simple Beam with Third-Point Loading), ASTM C 78-02, ASTM International, West Conshohocken, PA.
American Society for Testing and Materials (2002), Standard Test Method for Making and Curing Concrete Test Specimens in the Laboratory, ASTM C192-02, ASTM International, West Conshohocken, PA.
American Society for Testing and Materials (1997), Standard Test Method for Flexural Toughness and First-Crack Strength of Fiber-Reinforced Concrete (Using Beam with Third-Point Loading), ASTM C 1018-97, ASTM International, West Conshohocken, PA.
American Concrete Institute (2004), “Thin Reinforced Cement-Based Products and Construction Systems", ACI SP-224, ACI International, Farmington Hills, Michigan.
Bakis, C. E., Bank, L. C., Brown, V. L., Cosenza, E., Davalos, J. F., Lesko, J. J., Machida, A., Rizkalla, S. H., and Triantafillou, T. C. (2003), "Fiber-Reinforced Polymer Composites for Construction - State-of-the-Art Review", Perspectives in Civil Engineering: Commemorating the 150th Anniversary of the American Society of Civil Engineers, American Society of Civil Engineers, Reston, VA, pp 369-383.
Bank, L. C., Yin, J., and Gentry, T. R. (1998), "Pendulum Impact Tests on Steel W-Beam Guardrails", Journal of Transportation Engineering, Vol. 124, No. 4, pp 319-325.
Bank, L., Hargrave, M., Svenson, A. (1994), "Data Analysis Techniques for Impact Test of Composite Materials." Journal of Testing and Evaluation, 22(5), pp 431-439.
Bank, L.C., Gentry, T.R., Thompson B.P., and Russell, J.S. (2003), "A Model Specification for FRP Composites for Civil Engineering Structures", Construction and Building Materials, Vol. 17, No. 6-7, pp 405-437.
Bank, L. C. (2006), Composites for Construction: Structural Design with FRP Materials, John Wiley & Sons, Hoboken, N.J.
Banthia, N., Yan, C., Mufti, A.A., and Bakht, B. (2000), "CFRC Permanent Formwork for Steel free Bridge Deck in High Performance Fiber-Reinforced Thin Sheet Products", ACI SP-190, ACI International, Farmington Hills, Michigan, pp. 21-27.
Banthia, N., Yan, C., and Sakai, K. (1996), "Concrete Plates Reinforced with an FRP Grid Under Impact", Advanced Composite Materials in Bridges and Structures, Canadian Society for Civil Engineering, Montreal, pp. 707-716.
Banthia, S., Mindess, S., and Bentur, A., Pigeon, M. (1989), "Impact Testing of Concrete Using a Drop-weight Impact Machine" Experimental Mechanics, Vol. 29, No. 1, 63-69.
BCMGRC (2005), "BCMGRC Brochure - Permanent Formwork: Corrugated or Flat to Suit All Supporting Beam Design." www.bcmgrc.com (05/01, 2007).
Bentur, A., Mindess, S. (2007), Fibre Reinforced Cementitious Composites, 2nd Ed., Taylor & Francis, New York.
Berg, A.C. (2004). “Analysis of a Bridge Deck Built on U.S. Highway 151 with FRP Stay-In-Place Forms, FRP Grids, and FRP Rebars,” MS Report, Department of Civil and Environmental Engineering, University of Wisconsin-Madison.
Wollmann, C. L. R., Guirola, M., Easterling, S. (2004), "Strength and Performance of Fiber-Reinforced Concrete Composite Slabs", Journal of Structural Engineering, Vol. 130, No. 3, pp. 520-528.
Glass Fibre Reinforced Concrete Association (2003), GRC In Action, Today’s GRC for Architects and Engineers, GRCA International, Berkshire, U.K.

107
Glass Fibre Reinforced Concrete Association (2000), Specification for the Manufacture, Curing and Testing of GRC Products, 2nd Ed., GRCA International (14), U.K.
Hegger, J., Schneider, H., Sherif, A., Molter, M.,Voss, S., (2005), "Exterior Cladding Panels as an Application of Textile Reinforced Concrete" ACI-SP224, American Concrete Institute, Farmington Hills, Michigan, pp. 55-70.
British Standards Institute (2004), Falsework- Performance Requirements and General Design, BS 12812: 2004, British Standards Institute, London.
British Standards Institute (1996), Code of Practice for Falsework, BS 5975: 1996, British Standards Institute, London.
Chopra, A. K. (2002), Dynamics of Structure - Theory and Applications to Earthquake Engineering, Prentice Hall of India, New Delhi, India.
Chou, P. H., Chou, Y. L., Lin, C. J., Su, F. C., Lou, S. Z., Lin, C., and Huang, G. F. (2001), "Effect of elbow flexion on upper extremity impact forces during a fall" Clinical Biomechanics, Vol. 16, No. 10, pp. 888-894.
Clough R. W., Penzien, J. (1993). "Response to Impulsive Loading" Dynamics of Structures, McGraw-Hill, New York, pp. 73-85.
Cook, R. D. (1999), Advanced Mechanics of Materials, Prentice Hall, Upper Saddle River, N.J. East, A. (2003). "Safety - A Formwork Issue", Concrete, 37(5), pp. 28-29. Ferreira, J. P. J. G., Branco, F. A. B. (2007), "The Use of Glass Fiber-Reinforced Concrete as a
Structural Material" Experimental Techniques, Vol. 31, No. 3, pp. 64-73. Gentry, T. R., Bank, L. C. (1994), "Application of FRP Reinforcement in Structural Precast
Concrete", Proceedings of the 3rd Materials Engineering Conference, American Society of Civil Engineers, NY, pp. 575-582.
Gilbert, G. T. (2004), "GRC-Durable and Mouldable", Concrete Engineering International, Vol. 8, No. 3, pp. 58-59.
Grace Construction Products (2007), Brochure - Applications of STRUX 90/40 in Slab-On-Ground Construction, www.graceconstruction.com, (04/15, 2007).
Grace Construction Products (2007), Brochure – A Guide to Specifying the Use of Synthetic Macro Fibers, as an Alternative to Welded Wiremesh, in Precast Concrete Septic Tanks, www.graceconstruction.com, (04/15, 2007).
Grace, N. F., Hanson, J. F., Farahat, W., Till, R. D. (2004), "Survey of State DOTS on Performance of Concrete Bridge Decks Constructed Using Stay in Place Metal Forms" National Academy of Science, Washington D.C.
Gupta, P., Banthia, N., and Yan, C. (2000), "Fiber Reinforced Wet-Mix Shotcrete under Impact", Journal of Materials in Civil Engineering, Vol. 12, No. 1, pp. 81-90.
Herseim, R., Moore, J., Glancey, J., Saman, K. R., Walker, W., Trentacosta, J., and Popper, P. (2004), "Simulating the mechanics of human falls" ASAE Annual International Meeting 2004, Aug 1-4 2004, American Society of Agricultural Engineers, St. Joseph, MI 49085-9659, Ottawa, ON, 7681-7698.
Bachmann, H. (1994), Vibration Problems in Structures - Practical Guidelines, Birkhauser Verlag Basel.
Hurd, M. K. (2004), Formwork for Concrete, 7th Ed., American Concrete Institute, Farmington Hills, Michigan.
ICC Evaluation Service, Inc. (2005). "Acceptance Criteria for Structural Cementitious Floor Sheathing Panels” ICC AC318, http://www.icc-es.org/criteria/pdf_files/ac318.pdf, (06/20, 2007).
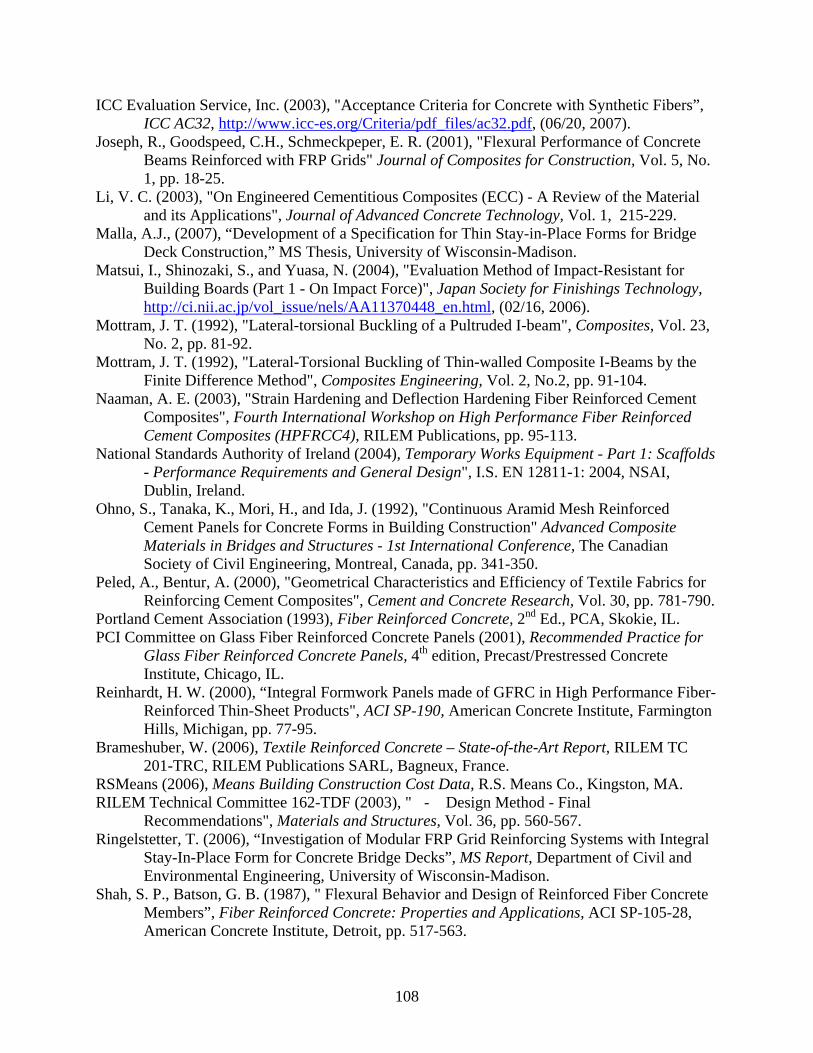
108
ICC Evaluation Service, Inc. (2003), "Acceptance Criteria for Concrete with Synthetic Fibers”, ICC AC32, http://www.icc-es.org/Criteria/pdf_files/ac32.pdf, (06/20, 2007).
Joseph, R., Goodspeed, C.H., Schmeckpeper, E. R. (2001), "Flexural Performance of Concrete Beams Reinforced with FRP Grids" Journal of Composites for Construction, Vol. 5, No. 1, pp. 18-25.
Li, V. C. (2003), "On Engineered Cementitious Composites (ECC) - A Review of the Material and its Applications", Journal of Advanced Concrete Technology, Vol. 1, 215-229.
Malla, A.J., (2007), “Development of a Specification for Thin Stay-in-Place Forms for Bridge Deck Construction,” MS Thesis, University of Wisconsin-Madison.
Matsui, I., Shinozaki, S., and Yuasa, N. (2004), "Evaluation Method of Impact-Resistant for Building Boards (Part 1 - On Impact Force)", Japan Society for Finishings Technology, http://ci.nii.ac.jp/vol_issue/nels/AA11370448_en.html, (02/16, 2006).
Mottram, J. T. (1992), "Lateral-torsional Buckling of a Pultruded I-beam", Composites, Vol. 23, No. 2, pp. 81-92.
Mottram, J. T. (1992), "Lateral-Torsional Buckling of Thin-walled Composite I-Beams by the Finite Difference Method", Composites Engineering, Vol. 2, No.2, pp. 91-104.
Naaman, A. E. (2003), "Strain Hardening and Deflection Hardening Fiber Reinforced Cement Composites", Fourth International Workshop on High Performance Fiber Reinforced Cement Composites (HPFRCC4), RILEM Publications, pp. 95-113.
National Standards Authority of Ireland (2004), Temporary Works Equipment - Part 1: Scaffolds - Performance Requirements and General Design", I.S. EN 12811-1: 2004, NSAI, Dublin, Ireland.
Ohno, S., Tanaka, K., Mori, H., and Ida, J. (1992), "Continuous Aramid Mesh Reinforced Cement Panels for Concrete Forms in Building Construction" Advanced Composite Materials in Bridges and Structures - 1st International Conference, The Canadian Society of Civil Engineering, Montreal, Canada, pp. 341-350.
Peled, A., Bentur, A. (2000), "Geometrical Characteristics and Efficiency of Textile Fabrics for Reinforcing Cement Composites", Cement and Concrete Research, Vol. 30, pp. 781-790.
Portland Cement Association (1993), Fiber Reinforced Concrete, 2nd Ed., PCA, Skokie, IL. PCI Committee on Glass Fiber Reinforced Concrete Panels (2001), Recommended Practice for
Glass Fiber Reinforced Concrete Panels, 4th edition, Precast/Prestressed Concrete Institute, Chicago, IL.
Reinhardt, H. W. (2000), “Integral Formwork Panels made of GFRC in High Performance Fiber-Reinforced Thin-Sheet Products", ACI SP-190, American Concrete Institute, Farmington Hills, Michigan, pp. 77-95.
Brameshuber, W. (2006), Textile Reinforced Concrete – State-of-the-Art Report, RILEM TC 201-TRC, RILEM Publications SARL, Bagneux, France.
RSMeans (2006), Means Building Construction Cost Data, R.S. Means Co., Kingston, MA. RILEM Technical Committee 162-TDF (2003), "�-� Design Method - Final
Recommendations", Materials and Structures, Vol. 36, pp. 560-567. Ringelstetter, T. (2006), “Investigation of Modular FRP Grid Reinforcing Systems with Integral
Stay-In-Place Form for Concrete Bridge Decks”, MS Report, Department of Civil and Environmental Engineering, University of Wisconsin-Madison.
Shah, S. P., Batson, G. B. (1987), " Flexural Behavior and Design of Reinforced Fiber Concrete Members”, Fiber Reinforced Concrete: Properties and Applications, ACI SP-105-28, American Concrete Institute, Detroit, pp. 517-563.

109
Brameshuber, W., Koster, M., Hegger, J.,Voss, S., Gries, T., Barle, M., Reinhardt, H. W., Kruger, M., (2002), "Integrated Formwork Elements Made of Textile Reinforced Concrete", ACI SP-224, American Concrete Institute, Michigan, pp. 45-54.
Saint-Gobain (2007), CEM-FIL GRC Technical Data, www.cem-fil.com/pdf/CompleteManual.pdf, (06/25, 2007).
Shapira, A.(1999), "Contemporary Trends in Formwork Standards - A Case Study", Journal of Construction Engineering and Management, Vol.125, 69-75.
Standards Australia International Ltd. (1995), Formwork for Concrete, AS 3610-1995, Standards Australia International, Sydney, Australia.
State of Wisconsin, Department of Transportation (1999), Wisconsin Bridge Manual (WBM), State of Wisconsin – Dept. of Transportation, Madison, Wisconsin.
State of Wisconsin, Department of Transportation (1996), Standard Specifications for Highway and Structure Construction, State of Wisconsin - Dept. of Transportation, Madison, Wisconsin.
Steffen, R., Scott, D., Goodseed, C., Bowman, M., and Trunfio, J. (2001), "Design Issues and Constructability of a CFRP Grid Reinforced Bridge Deck", High Performance Materials in Bridges: Proceedings of the International Conference, pp. 106-116.
Tang, B. (1997), "Fiber Reinforced Polymer Composites Applications in USA", First Korea/U.S.A. Road Workshop Proceedings, January 28-29, 1997, DOT-Federal Highway Administration, Farmington Hills, Washington, D.C.
Tavakoli, M., (1994), " Tensile and Compressive Strengths of Polypropylene Fiber Reinforced Concrete”, Fiber Reinforced Concrete: Developments and Innovations, ACI SP-142, American Concrete Institute, Detroit, pp 61-72.
The Altus Group (2005), "CarbonCast Brochure", www.techfabllc.com/altusgroup.htm (05/24, 2007).
Timoshenko, S., Gere, J. (1961), Theory of Elastic Stability, 2nd Ed., McGraw-Hill, New York. True, G. F. (1985), "Glass Fibre Reinforced Cement Permanent Formwork”, Concrete, Vol. 19,
pp. 31-33. United Steel Deck (2007), "Bridge Form Manual”, www.njb-united.com/usd/bfcat.htm, (04/16,
2007). Wang, C. M., Wang, C. Y., and Reddy, J. N. (2002), "Chapter 2 - Buckling of Columns", Exact
Solutions for Buckling of Structural Members, CRC Press, Washington, D.C., pp. 9-75. Wrigley, R. G. (2001), Permanent Formwork in Construction, Construction Industry Research
and Information Association, London. Yao W., Li, J., Wu, K. (2003), "Mechanical properties of hybrid fiber-reinforced concrete at low
fiber volume fraction" Cement and Concrete Research, Vol. 33, pp. 27-30. Zhu, Z., Mirmiran, A., Shahawy, Mohsen (2004), "Stay-in-Place Fiber Reinforced Polymer
Forms for Precast Modular Bridge Pier System" Journal of Composites for Construction, Vol.8, No. 6, pp. 560-568.

110
APPENDIX A
DRAFT SPECIFICATION (SEPT 2007)
Specification for the Design and Performance of Non-participating Fiber Reinforced Stay-in-
place Formwork for Deck Slabs in Highway Bridges
Prepared By: Department of Civil & Environmental Engineering
University of Wisconsin-Madison
Submitted To: Wisconsin Highway Research Program
Wisconsin Department of Transportation
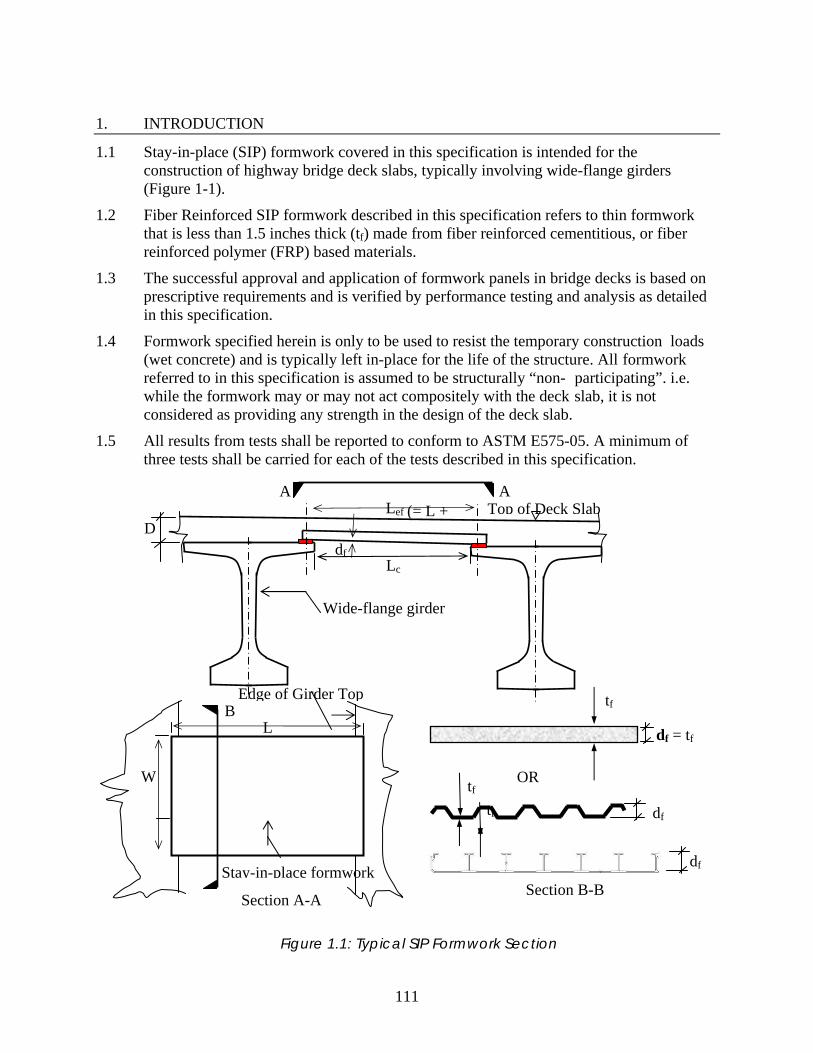
111
1. INTRODUCTION
1.1 Stay-in-place (SIP) formwork covered in this specification is intended for the construction of highway bridge deck slabs, typically involving wide-flange girders (Figure 1-1).
1.2 Fiber Reinforced SIP formwork described in this specification refers to thin formwork that is less than 1.5 inches thick (tf) made from fiber reinforced cementitious, or fiber reinforced polymer (FRP) based materials.
1.3 The successful approval and application of formwork panels in bridge decks is based on prescriptive requirements and is verified by performance testing and analysis as detailed in this specification.
1.4 Formwork specified herein is only to be used to resist the temporary construction loads (wet concrete) and is typically left in-place for the life of the structure. All formwork referred to in this specification is assumed to be structurally “non- participating”. i.e. while the formwork may or may not act compositely with the deck slab, it is not considered as providing any strength in the design of the deck slab.
1.5 All results from tests shall be reported to conform to ASTM E575-05. A minimum of three tests shall be carried for each of the tests described in this specification.
Figure 1.1: Typical SIP Formwork Section
Ddf
Top of Deck Slab
Wide-flange girder
Lc
Lef
W
L
(= L + A A
Section A-A
B
B
Section B-B
OR
tf
tf
df = tf
df
Edge of Girder Top
Stay-in-place formwork df
tf

112
2. REFERENCED DOCUMENTS
2.1 ASTM C39/C 39M-05, Standard Test Method for Compressive Strength of Cylindrical Concrete Specimens, ASTM International (2005).
2.2 ASTM E575-05, Reporting Data from Structural Tests of Building Constructions, Elements, Connections, and Assemblies, 04.02., ASTM International (2005).
2.3 ASTM C1116-03, Standard Specification for Fiber-Reinforced Concrete and Shortcrete. 04.01., ASTM International (2003).
2.4 ASTM D3917, Standard Specification of Dimensional Tolerance of Thermosetting Glass-Reinforced Plastic Pultruded Shapes, ASTM International (2002)
2.5 ASTM C1609-06, Standard Test Method for Flexural Performance of Fiber- Reinforced Concrete (Using Beam with Third-Point Loading), ASTM International (2005)
2.6 ACI 318R-05, Building code requirements for structural concrete and commentary, American Concrete Institute (2005), Farmington Hills, Mich.Bridge Manual – Wisconsin
2.7 Wisconsin. Dept. of Transportation (1996). Standard specifications for highway and structure construction. State of Wisconsin Dept. of Transportation, Madison, Wis.
2.8 American Association of State Highway and Transportation Officials. (2004). AASHTO LRFD Bridge Design Specifications. Washington, 4th Edn
2.9 ACI 347R, Guide to formwork for Concrete, American Concrete Institute (2004).
2.10 ACI 440.1R-06, Guide for the Design and Construction of Structural Concrete Reinforced with FRP Bars, American Concrete Institute Committee 440 (2006)
2.11 ASTM C1399-07, Standard Test Method for Obtaining Average Residual-Strength of Fiber-Reinforced Concrete. 04.02. ASTM International (2007)
2.12 ASTM C666/C666M-03, Standard Test Method for Resistance of Concrete to Rapid Freezing and Thawing, 04.02, ASTM International (2003)
2.13 ASTM E695, Method for measuring relative resistance of wall, floor, and roof construction to impact loading, 04.11, ASTM International. (2003)
2.14 Hurd, M. K. (1995). Formwork for concrete. American Concrete Institute, Detroit, Mich.
2.15 AC 318, Acceptance Criteria for Structural Cementitious Floor Sheathing Panels, ICC Evaluation Service, Inc. (2005)
2.16 Wrigley, R. G. (2001). Permanent formwork in construction. Construction Industry Research and Information Association, London
3. NOTATION
Af Area of profiled or thin-walled panels per unit width (in2/ft)
ds Depth of concrete deck slab above the formwork panel (inch)
113
df Overall depth of concrete formwork panel (inch)
DL Total dead load (lbf/ft)
(DL)f Self weight of the formwork panel (lbf/ft) per unit width
(DL)s Self-weight of the deck slab (lbf/ft) per unit width
Ec Secant modulus of elasticity
δcr Deflection at cracking strength
δr Deflection at the peak residual strength
δs ,δult Deflection at service load, Deflection at ultimate load for the formwork
I Second moment of inertia of the cross-section per unit foot width (ft4/ft)
L Total length of formwork panel perpendicular to the girder (ft)
Lc Formwork clear girder span (ft)
Leff Formwork effective span length (ft)
(LL)udl Uniform live load on the formwork panel (psf)
(LL)pt Point live load on the formwork panel (lbf)
ms, mult Design service moment per unit width (ft), ultimate moment per unit width(ft)
ρs Unit weight of slab (lbf/ft3)
ρf Unit weight of formwork panel (lbf/ft3)
σcr , σr Cracking strength, Peak residual strength
σs Design service stress
σall Allowable flexural tensile strength
σm Design flexural strength reported by the manufacturer
σult Ultimate design strength
tf Thickness of thin-walled SIP formwork (see Figure 1-1Figure )
τs ,τall Service shear stress, Allowable shear strength
w Formwork total width (feet, parallel to girder)
y Distance from the neutral axis of the cross section to the extreme fiber
4. ABBREVIATIONS
ASD Allowable stress design
AR Glass Fiber Fibers made from alkali resistant (AR) glass with a minimum zirconia content of at least 16%
CDP Custom designed panel

114
FRC Fiber reinforced concrete, concrete containing dispersed, discrete, and randomly oriented short fibers
FRP Fiber reinforced polymer, containing continuous reinforcing fibers of indefinite length
GFRC/GRC Glass fiber reinforced concrete
LRFD Load and resistance factor design
MOR Modulus of rupture (flexural)
Panel Entire piece of stay-in-place formwork
Partial volume Fiber volume expressed as a percentage of the total fiber volume fraction PEP Pre-engineered panel
Sealants Materials applied between adjacent panels to prevent water and concrete grout seepage during the casting of the bridge deck
Service Load Total unfactored load (Dead load and live load) on formwork panel
SIP Stay-in-place
SFRC Steel fiber reinforced concrete
SNFRC Synthetic fiber reinforced concrete
TRC Textile reinforced concrete
Thermoplastic Resin that is capable of being repeatedly softened or melted by resin increases in temperature followed by subsequent solidification on cooling Thermosetting Resin manufactured by a thermosetting reaction that cures to a resin stronger form and cannot usually be melted or reshaped after being cured. Ultimate Load Combination of factored dead and live load specified according to AASHTO (2004)
5. FORMWORK CLASSIFICATION
5.1 All formwork systems covered in this specification shall be limited to a maximum thickness of 1.5 inches (tf ≤ 1.5 in., see Figure 1-1Figure ).
5.2 These formwork systems are classified as either “Custom designed panels (CDP)” - Type A or the readily available “Pre-engineered panels (PEP)” - Type B.
5.3 CDP refers to cementitious formwork that is designed by the Contractor or the Engineer of record for a specific job and is typically manufactured at a precaster or even at the field site depending on site requirements.
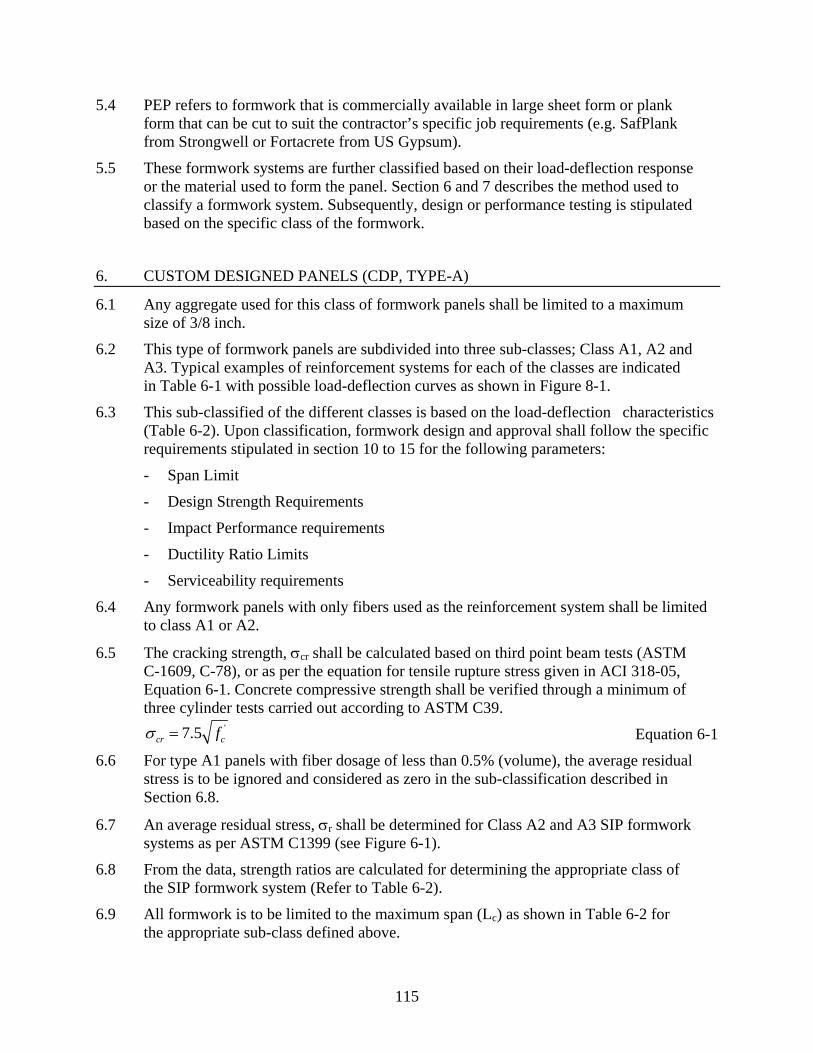
115
5.4 PEP refers to formwork that is commercially available in large sheet form or plank form that can be cut to suit the contractor’s specific job requirements (e.g. SafPlank from Strongwell or Fortacrete from US Gypsum).
5.5 These formwork systems are further classified based on their load-deflection response or the material used to form the panel. Section 6 and 7 describes the method used to classify a formwork system. Subsequently, design or performance testing is stipulated based on the specific class of the formwork.
6. CUSTOM DESIGNED PANELS (CDP, TYPE-A)
6.1 Any aggregate used for this class of formwork panels shall be limited to a maximum size of 3/8 inch.
6.2 This type of formwork panels are subdivided into three sub-classes; Class A1, A2 and A3. Typical examples of reinforcement systems for each of the classes are indicated in Table 6-1 with possible load-deflection curves as shown in Figure 8-1.
6.3 This sub-classified of the different classes is based on the load-deflection characteristics (Table 6-2). Upon classification, formwork design and approval shall follow the specific requirements stipulated in section 10 to 15 for the following parameters:
- Span Limit
- Design Strength Requirements
- Impact Performance requirements
- Ductility Ratio Limits
- Serviceability requirements
6.4 Any formwork panels with only fibers used as the reinforcement system shall be limited to class A1 or A2.
6.5 The cracking strength, σcr shall be calculated based on third point beam tests (ASTM C-1609, C-78), or as per the equation for tensile rupture stress given in ACI 318-05, Equation 6-1. Concrete compressive strength shall be verified through a minimum of three cylinder tests carried out according to ASTM C39.
Equation 6-1
6.6 For type A1 panels with fiber dosage of less than 0.5% (volume), the average residual stress is to be ignored and considered as zero in the sub-classification described in Section 6.8.
6.7 An average residual stress, σr shall be determined for Class A2 and A3 SIP formwork systems as per ASTM C1399 (see Figure 6-1).
6.8 From the data, strength ratios are calculated for determining the appropriate class of the SIP formwork system (Refer to Table 6-2).
6.9 All formwork is to be limited to the maximum span (Lc) as shown in Table 6-2 for the appropriate sub-class defined above.
'7.5cr cfσ =

116
6.10 Class A1 type formwork panel is intended to be uncracked for the designed service loads. Class A2 and A3 type formwork panel is intended to be cracked for the designed service loads.
Table 6-1: Examples of typical reinforcements for CDP systems
Class A1:
Materials in this class will typically consist of fiber reinforced concrete (FRC). Fibers used typically consist of glass or synthetic (polypropylene) short fibers, glass fiber scrim cloths and light glass and carbon fiber reinforced polymer meshes in a concrete matrix.
Class A2: Materials in the class will typically consist of light glass and carbon fiber reinforced polymer meshes and FRP rebars in a concrete matrix.
Class A3: Materials in the class will typically consist of heavy carbon fiber reinforced polymer meshes and FRP rebars in a concrete matrix.
Table 6-2: Sub-Classification of CDP
Strength Ratio CDP formwork Class Max Span, Lc (in)
5.0≤cr
r
σσ Class-A1: Brittle softening fiber
reinforced concrete panels
8
0.15.0 ≤<cr
r
σσ Class-A2: Ductile softening fiber
reinforced concrete panels 18
0.1>cr
r
σσ Class-A3: Ductile hardening fiber
reinforced concrete panels None
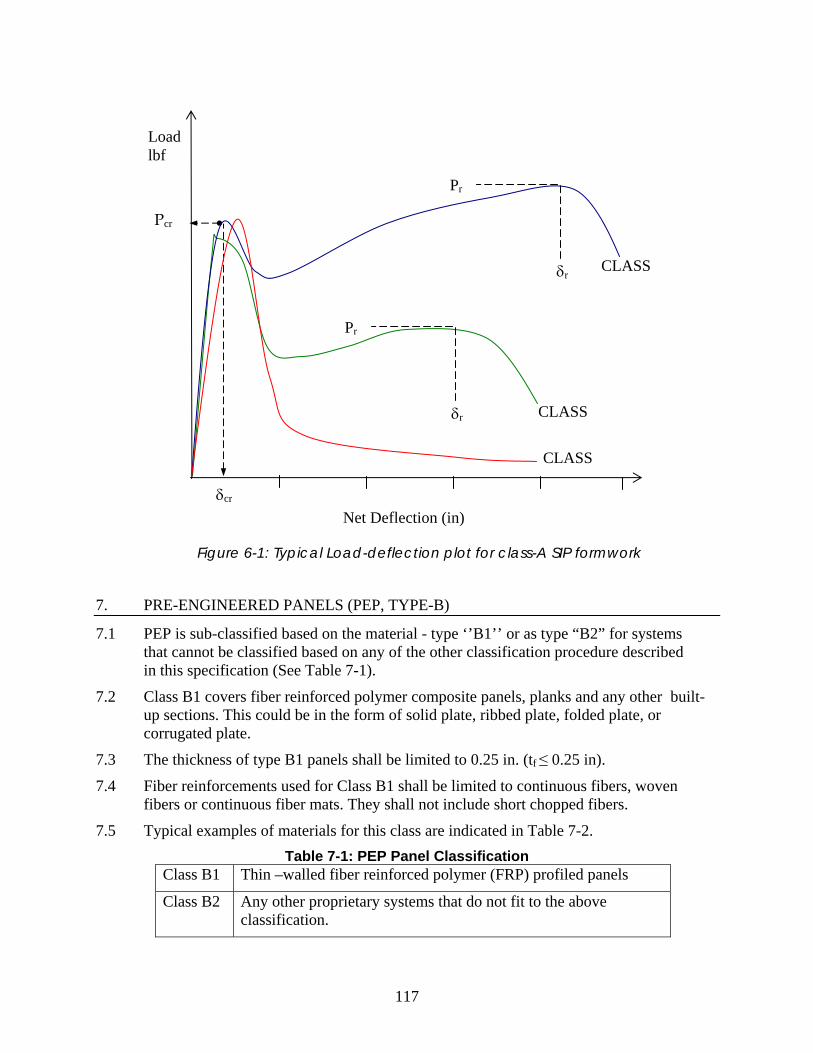
117
Figure 6-1: Typical Load-deflection plot for class-A SIP formwork
7. PRE-ENGINEERED PANELS (PEP, TYPE-B)
7.1 PEP is sub-classified based on the material - type ‘’B1’’ or as type “B2” for systems that cannot be classified based on any of the other classification procedure described in this specification (See Table 7-1).
7.2 Class B1 covers fiber reinforced polymer composite panels, planks and any other built-up sections. This could be in the form of solid plate, ribbed plate, folded plate, or corrugated plate.
7.3 The thickness of type B1 panels shall be limited to 0.25 in. (tf ≤ 0.25 in).
7.4 Fiber reinforcements used for Class B1 shall be limited to continuous fibers, woven fibers or continuous fiber mats. They shall not include short chopped fibers.
7.5 Typical examples of materials for this class are indicated in Table 7-2. Table 7-1: PEP Panel Classification
Class B1 Thin –walled fiber reinforced polymer (FRP) profiled panels
Class B2 Any other proprietary systems that do not fit to the above classification.
Net Deflection (in)
Load lbf
CLASS
Pcr
δcr
CLASS
CLASS δr
Pr
δr
Pr

118
Table7-2: Examples of typical reinforcements for PEP systems
Class B1:
Materials in this class will typically consist of Pultruded FRP panels such as “SafPlank” from Strongwell or “StepTuff” from Enduro systems Inc.
Class B2: Materials in the class will typically consist of some form of FRP reinforcements in both cementitious and non-cementitious matrix. Example of one type of PEP Class B2 is the “Fortacrete” manufactured by US Gypsum.
8. CALCULATION OF DESIGN LOADS AND STRESSES
8.1 All formwork panels (both type A and type B) shall be designed for a combination of dead load (DL) and live load (LL) as per AASHTO LRFD Design Specification (2004).
8.2 DL shall comprise of self weight of the panel, (DL)f and the weight of the wet concrete for the deck slab (DL)s per unit width of the formwork panel.
DL (lb/ft) = (DL)f + (DL)s
Where, (DL)f =ρf x df/12
(DL)s =ρs x ds/12
8.3 For profiled formwork sections or proprietary systems made of unknown material, the (DL)f shall be obtained directly from the manufacturer (lb/ft).
8.4 Two different Live loads (LL) on the panel shall be considered for design. The live load that results in maximum peak moment of the two cases is to be used for design.
(LL)udl - 50 psf distributed live load or
(LL)pt - 250 lbs concentrated load applied at the center of the panel for every 3 feet width (parallel to girder)
8.5 The service moment in the panel (mser) per foot width of the formwork shall be calculated as follows.
Equation 8-1
where, n is a unit-less number that is a function of the width of the panel defined as follows:
For w < 3 ft, n = 1
For 3ft < w <6 ft, n = 2
[ ]
{ }
2( ) ( )8
( ) ( )2 4
,
udl effudl
eff pt effpt
ser udl pt
DL LL Lm
DL L n LL Lm
w
m Max m m
+ ×=
⎡ ⎤ ⎛ ⎞= + ×⎜ ⎟⎢ ⎥
⎣ ⎦ ⎝ ⎠
=

119
For 6ft < w < 9ft, n = 3
8.6 The ultimate moment in the panel (Mult) per foot width of the formwork shall be calculated as per ACI load combination factors as follows.
Equation 8-2
8.7 The service and ultimate limit state shear on the panel (vser ,Vult) shall be calculated as follows where n is defined similarly as per section 8.5.
Equation 8-3
Equation 8-4
8.8 For forms with a rectangular cross-section, the flexural stress at service loads in the extreme fiber (σs ) is to be calculated as per Equation 8-5. For non-rectangular and profiled sections, extreme fiber flexural stress shall be calculated using Equation 8-6.
Flexural service stress:
Equation 8-5
Equation 8-6
8.9 The average service shear stress due to service loads in the formwork panel (τs) is to be calculated as follows:
[ ]
{ }
21.2( ) 1.6( )8
1.2( ) 1.6 ( )2 4
,
udl effudl
eff pt effpt
ult udl pt
DL LL LM
DL L n LL LM
w
M Max M M
+ ×=
⎡ ⎤ ⎛ ⎞= + ×⎜ ⎟⎢ ⎥
⎣ ⎦ ⎝ ⎠
=
[ ]
{ }
( ) ( ) 12
( ) 11 ( )2
,
udl effudl
ptpt eff
ser udl pt
DL LL ft Lv
n LL ftv DL L
w
v Max v v
+ × ×=
×⎡ ⎤= +⎢ ⎥
⎣ ⎦
=
[ ]
{ }
1.2( ) 1.6( ) 121.6 ( ) 11 1.2( )
2
,
udl effudl
ptpt eff
ult udl pt
DL LL ft lV
n LL ftV DL L
w
V Max V V
+ × ×=
×⎡ ⎤= +⎢ ⎥
⎣ ⎦
=
2
61
ss
f
mft d
σ =×
ss
m yI
σ ×=

120
Net Deflection (mm)
Load,
0.01 0.02 0.03 0.04 0.05
Re-loading curve (Pre-cracked beam)
Initial Loading Curve (Stop at deflection of 0.02in)
σcr
δr
σr
δr
Shear service stress (Class-A formwork panels):
Equation 8-7
Shear service stress (Thin walled profiled section formwork panels):
Equation 8-8
8.10 The maximum shear strength for cementitious panels (Class-A), τ max , is calculated as per the simple method provided in ACI 318 (2005) shown in Equation 8-9.
Equation 8-9
Where,
λ = 1.0 (normal weight concrete)
λ = 0.75 (all other cementitious panels)
8.11 The maximum flexural strength for cementitious panels, (σmax) shall be either the cracking strength defined in Sec 6.5 (σcr) or the residual strength (σr) depending on the class of the formwork panel (see Figure 8-1).
Figure 8-1: Typical Loading Curves (including re-loading) – ASTM C1399-07
9. MATERIAL REQUIREMENTS
9.1 Concrete
12( )s
sf
vin d
τ =×
'max 2 cfτ λ=
ss
f
vA
τ =
121
Portland cement concrete materials in Classes A1, A2 and A3 materials shall have a minimum 6% air entrainment and shall have a minimum compressive strength of 4000 psi. The concrete used shall be compatible with the concrete grade type specified for the bridge deck as per the classification system used in the “Bridge Manual” for Wisconsin Department of Transport.
Fiber reinforced concrete that may fall into class A1, A2, or B2 shall confirm to ASTM C 116.
9.2 Aggregate
Aggregate shall be limited to a maximum of 3/8 inch and shall confirm to ASTM C33, C 330, or C 637 consistent with the type of concrete required
9.3 Fibers
Glass fibers (short-fibers or scrim cloths) used shall be alkali-resistant (AR) type. Commercial grade synthetic polymer fibers typically used in FRC products for crack control shall be permitted. Commercial grade E-glass or carbon fibers permitted in FRP rebars, grids, or FRP panels shall be continuous fibers of indefinite length.
The material specification of the fiber and the fiber manufacturer details shall be included as part of the submittal for approval.
9.4 Polymer
Thermosetting vinylester or epoxy resins shall be permitted in FRP rebars grids or FRP panels. Thermosetting polyester, phenolic and polyeurethane resins are not permitted. Styrene may be added to the polymer resin during processing and shall be limited to a maximum of 10% by weight of the resin (pph resin). Thermoplastic resins are permitted as fiber coatings in non-composite scrims such as SRG-45 from Saint Gobain.
9.5 FRP Pultruded or moulded sections
FRP Pultruded sections shall compose of fiber architecture with layers of continuous E-glass rovings and E-glass continuous filament mats (CFMs). FRP material shall have a minimum total fiber volume fraction of 40% or greater and a minimum partial longitudinal fiber volume (relative to the total fiber volume) of greater than 75%. Manufactured panels shall confirm to dimensional tolerance as per ASTM D3917.
10. SPECIFIC STRENGTH REQUIREMENTS
10.1 Class A1 and A2 formwork systems are to be designed based on an allowable stress design basis (ASD) to establish its design capacity with a factor of safety of 2.5 (see Table 1).
Class A1 – Flexural strength design based on peak cracking stress
2.5cr
s allσσ σ ⎛ ⎞< =⎜ ⎟
⎝ ⎠

122
Class A2 – Flexural strength design based on residual stress
2.5
rs all
σσ σ ⎛ ⎞< =⎜ ⎟⎝ ⎠
Class A1 and A2 – Shear design based on allowable shear stress defined as
Section 8-10.
max
2.5s allττ τ ⎛ ⎞< =⎜ ⎟
⎝ ⎠
Where, σr will be read from the load-deflection plot corresponding to ASTM C1399-07 as follows (see Figure 8-1):
peak postcracking stress
min orLstress at deflection of60
rσ
⎧ ⎫⎪ ⎪⎪ ⎪
= ⎨ ⎬⎪ ⎪⎪ ⎪⎩ ⎭
10.2 Class A3 formwork systems are to be designed using a Load and Resistance Factor Design basis, following the ACI 440.1R-06 design procedures to determine the capacity.
nu MM φ≤
nu VV φ≤ Where,
Mu and Vu are the factored moment and shear based on the design loads
Mn and Vn are the nominal moment capacities of the section in one-way bending
φ Is the resistance factor for flexural or shear failure according to ACI 440.1R-06.
10.3 For Class B, manufacturer reported design values of flexural stress (σm) and shear stress (τm) maybe used as allowable strength (σall and τall) provided it has a built-in factor of safety of at least 3.0 compared to the ultimate strength of the product. Submittal for approval shall have test reports from the manufacturer indicating the factor of safety assumed in the reported design values. If the factor of safety assumed is less than 3, (σall) and (τall) shall be adjusted and based on the ultimate strength (σult and τult) as follows:
Equation 10-1
Equation 10-2
3.0ult
s allττ τ ⎛ ⎞< =⎜ ⎟
⎝ ⎠
3.0ult
s allσσ σ ⎛ ⎞< =⎜ ⎟
⎝ ⎠
123
Where manufacturer reported design values are not available, a full section test of the as-received product, for the intended design span or ultimate values, shall be conducted to determine the failure stresses; flexural failure stress - σult, Shear failure stress - τult and deflection at failure, δult. Checks on strength shall be carried out based on Equation 10-1 and Equation 10-2.
11. SERVICIBILITY LIMITS
1.1 The service load maximum deflection, δs is to be calculated from unfactored design loads (service loads) defined in Section 8.2 and Section 8.3.
11.2 The service load deflection shall be limited3 to Leff/240.
Equation 11-1
11.3 For class A1 panels where the formwork is expected to be un-cracked in its service life, the service deflection, δs shall be calculated using the secant modulus of elasticity of concrete (Ec) as specified in ACI 318-05.
δs is calculated according to the following equation:
Equation 11-2
Equation 11-3
Equation 11-4
Where, n is defined as per Section 8.5.
11.4 The service deflection for type A2 and A3 formwork shall be determined from tests carried out according to ASTM flexure test (ASTM C1399).
11.5 The deflection for type B formwork shall be based on modulus of elasticity obtained from the manufacturer of the panel. Where this is not available, performance tests on full-sized panels subjected to full service load shall be carried out. Secant modulus of the panel shall be calculated from the load-deflection plot up to the ultimate strength (σult).
12. CONSTRUCTION SAFETY – IMPACT PERFORMANCE
12.1 Impact performance tests are to be carried for all classes of the SIP formwork except Class A1 where the requirements are waived. 3 Based on AASTHO (2004)
[ ]4
3
5 ( ) ( )32
eff udludl
c f
l DL LLE wd
δ+
=
3
3
5( ) ( )4 8
eff eff ptpt
f
l DL l n LLEwd w
δ⎡ ⎤
= +⎢ ⎥⎣ ⎦
{ },s udl ptMaxδ δ δ=
240eff
s
Lδ <
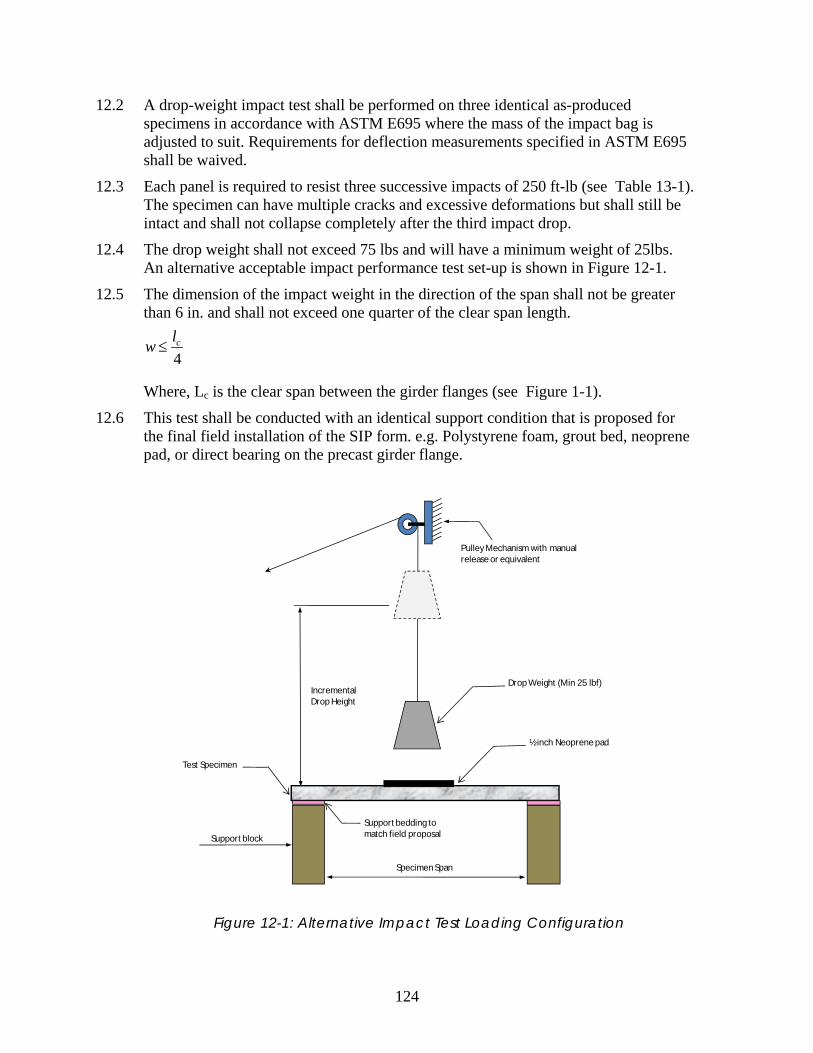
124
12.2 A drop-weight impact test shall be performed on three identical as-produced specimens in accordance with ASTM E695 where the mass of the impact bag is adjusted to suit. Requirements for deflection measurements specified in ASTM E695 shall be waived.
12.3 Each panel is required to resist three successive impacts of 250 ft-lb (see Table 13-1). The specimen can have multiple cracks and excessive deformations but shall still be intact and shall not collapse completely after the third impact drop.
12.4 The drop weight shall not exceed 75 lbs and will have a minimum weight of 25lbs. An alternative acceptable impact performance test set-up is shown in Figure 12-1.
12.5 The dimension of the impact weight in the direction of the span shall not be greater than 6 in. and shall not exceed one quarter of the clear span length.
Where, Lc is the clear span between the girder flanges (see Figure 1-1).
12.6 This test shall be conducted with an identical support condition that is proposed for the final field installation of the SIP form. e.g. Polystyrene foam, grout bed, neoprene pad, or direct bearing on the precast girder flange.
Figure 12-1: Alternative Impact Test Loading Configuration
4clw ≤
½ inch Neoprene pad
Incremental Drop Height
Test Specimen
Support bedding to match field proposalSupport block
Pulley Mechanism with manual release or equivalent
Specimen Span
Drop Weight (Min 25 lbf)
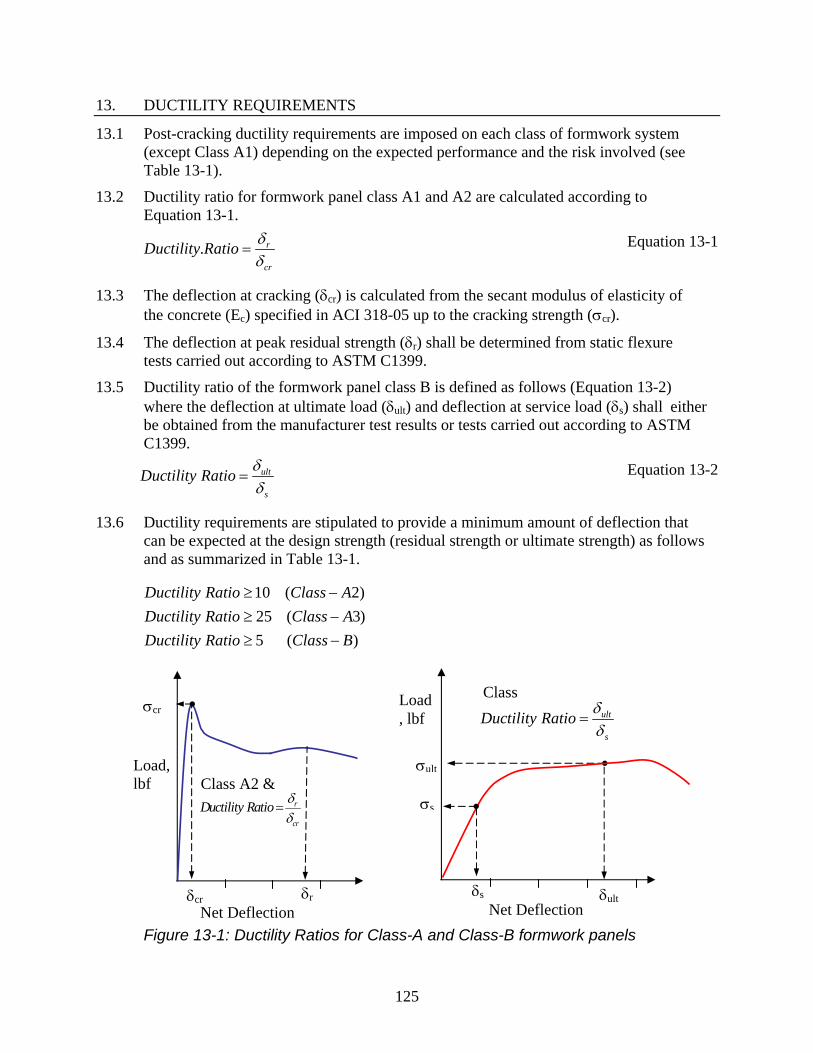
125
13. DUCTILITY REQUIREMENTS
13.1 Post-cracking ductility requirements are imposed on each class of formwork system (except Class A1) depending on the expected performance and the risk involved (see Table 13-1).
13.2 Ductility ratio for formwork panel class A1 and A2 are calculated according to Equation 13-1.
Equation 13-1
13.3 The deflection at cracking (δcr) is calculated from the secant modulus of elasticity of the concrete (Ec) specified in ACI 318-05 up to the cracking strength (σcr).
13.4 The deflection at peak residual strength (δr) shall be determined from static flexure tests carried out according to ASTM C1399.
13.5 Ductility ratio of the formwork panel class B is defined as follows (Equation 13-2) where the deflection at ultimate load (δult) and deflection at service load (δs) shall either be obtained from the manufacturer test results or tests carried out according to ASTM C1399.
Equation 13-2
13.6 Ductility requirements are stipulated to provide a minimum amount of deflection that can be expected at the design strength (residual strength or ultimate strength) as follows and as summarized in Table 13-1.
Figure 13-1: Ductility Ratios for Class-A and Class-B formwork panels
. r
cr
Ductility Ratio δδ
=
ult
s
Ductility Ratio δδ
=
10 ( 2)25 ( 3)5 ( )
Ductility Ratio Class ADuctility Ratio Class ADuctility Ratio Class B
≥ −≥ −≥ −
Net Deflection
Load, lbf
δult
σult
δs
Net Deflection
Load, lbf Class A2 &
σcr
δr δcr
r
cr
Ductility Ratio δδ
= σs
Class ult
s
Ductility Ratio δδ
=
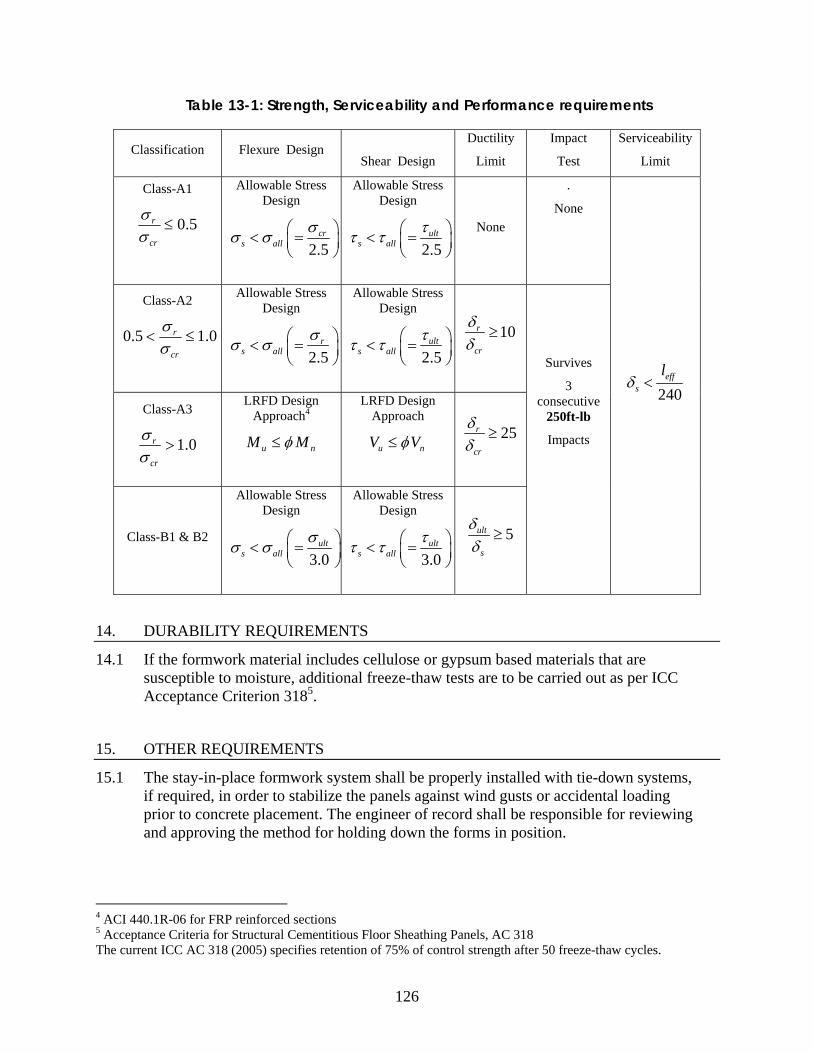
126
Table 13-1: Strength, Serviceability and Performance requirements
Classification Flexure Design
Shear Design
Ductility
Limit
Impact
Test
Serviceability
Limit
Class-A1
5.0≤cr
r
σσ
Allowable Stress Design
2.5cr
s allσσ σ ⎛ ⎞< =⎜ ⎟
⎝ ⎠
Allowable Stress Design
2.5ult
s allττ τ ⎛ ⎞< =⎜ ⎟
⎝ ⎠
None
.
None
Class-A2
0.15.0 ≤<cr
r
σσ
Allowable Stress Design
2.5r
s allσσ σ ⎛ ⎞< =⎜ ⎟
⎝ ⎠
Allowable Stress Design
2.5ult
s allττ τ ⎛ ⎞< =⎜ ⎟
⎝ ⎠
10r
cr
δδ
≥
Class-A3
0.1>cr
r
σσ
LRFD Design Approach4
nu MM φ≤
LRFD Design Approach
nu VV φ≤ 25r
cr
δδ
≥
Class-B1 & B2
Allowable Stress Design
3.0ult
s allσσ σ ⎛ ⎞< =⎜ ⎟
⎝ ⎠
Allowable Stress Design
3.0ult
s allττ τ ⎛ ⎞< =⎜ ⎟
⎝ ⎠
5ult
s
δδ
≥
Survives
3 consecutive
250ft-lb
Impacts
240eff
s
lδ <
14. DURABILITY REQUIREMENTS
14.1 If the formwork material includes cellulose or gypsum based materials that are susceptible to moisture, additional freeze-thaw tests are to be carried out as per ICC Acceptance Criterion 3185.
15. OTHER REQUIREMENTS
15.1 The stay-in-place formwork system shall be properly installed with tie-down systems, if required, in order to stabilize the panels against wind gusts or accidental loading prior to concrete placement. The engineer of record shall be responsible for reviewing and approving the method for holding down the forms in position.
4 ACI 440.1R-06 for FRP reinforced sections 5 Acceptance Criteria for Structural Cementitious Floor Sheathing Panels, AC 318 The current ICC AC 318 (2005) specifies retention of 75% of control strength after 50 freeze-thaw cycles.
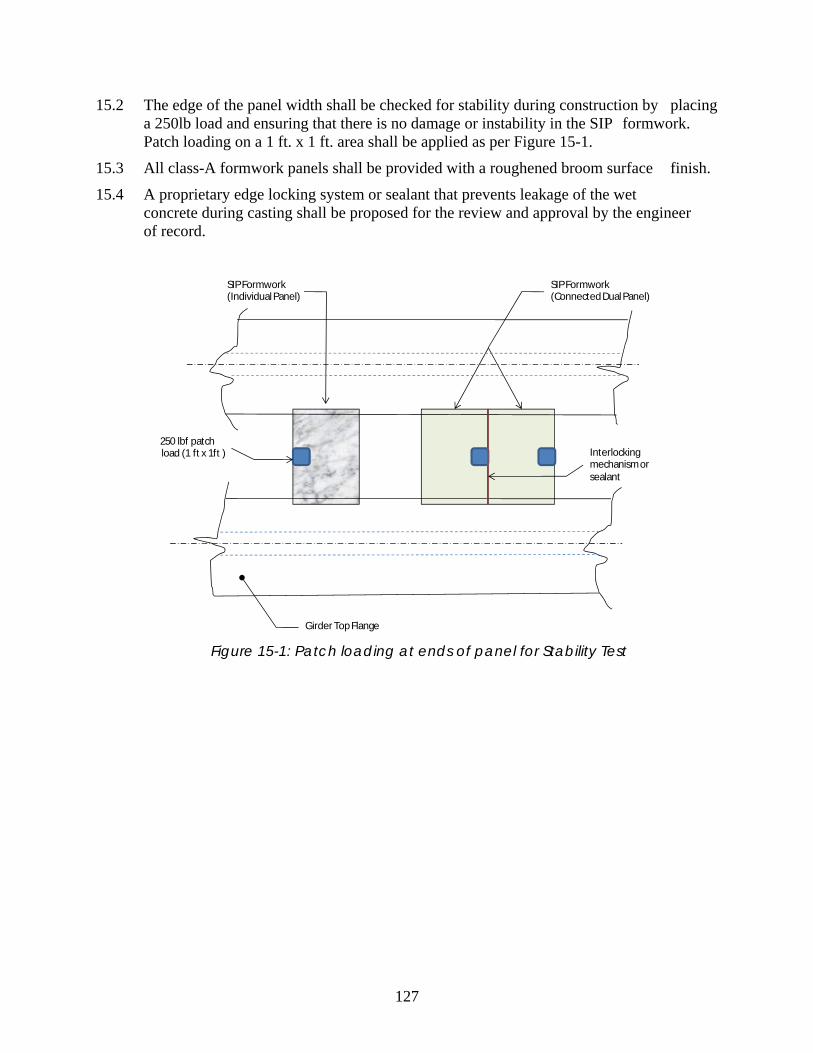
127
15.2 The edge of the panel width shall be checked for stability during construction by placing a 250lb load and ensuring that there is no damage or instability in the SIP formwork. Patch loading on a 1 ft. x 1 ft. area shall be applied as per Figure 15-1.
15.3 All class-A formwork panels shall be provided with a roughened broom surface finish.
15.4 A proprietary edge locking system or sealant that prevents leakage of the wet concrete during casting shall be proposed for the review and approval by the engineer of record.
Figure 15-1: Patch loading at ends of panel for Stability Test
Girder Top Flange
SIP Formwork (Individual Panel)
SIP Formwork (Connected Dual Panel)
250 lbf patchload (1 ft x 1ft ) Interlocking
mechanism or sealant

Wisconsin Highway Research Program
University of Wisconsin-Madison 1415 Engineering Drive
Madison, WI 53706 608/262-2013 www.whrp.org