specialty and geographic distribution of the physician ... and geographic distribution of the...
TRANSCRIPT
Specialty and Geographic Distribution of the Physician Workforce:
What Influences Medical Student & Resident
Choices? Funded by the Josiah Macy, Jr. Foundation
Specialty and Geographic Distribution of the Physician Workforce: What Influences Medical Student and Resident Choices? The Robert Graham Center: Policy Studies in Family Medicine and Primary Care Robert L. Phillips, Jr., MD MSPH Martey S. Dodoo, PhD Stephen Petterson, PhD Imam Xierali, PhD Andrew Bazemore, MD MPH Bridget Teevan, MS Keisa Bennett, MD Cindy Legagneur, BS JoAnn Rudd, MA and Julie Phillips, MD MPH Michigan State University College of Human Medicine March 2, 2009 Copyright 2009 Josiah Macy, Jr. Foundation Grant B07-09 Approved by the Georgetown University IRB
Specialty and Geographic Distribution of the Physician Workforce:
What Influences Medical Student & Resident
Choices?
The Robert Graham Center Washington, DC
With Support From: The Josiah Macy, Jr. Foundation

ii
Collaborators Advisory Board Candice Chen, MD MPH George Washington University Medical Education Futures Study George E. Fryer, Jr., PhD University of Arkansas for Medical Sciences Diane R. Rittenhouse, MD MPH University of California San Francisco Scott Shipman, MD MPH Dartmouth Medical College
iii
Acknowledgements We thank the following for their generous help with Study Data and Recommendations: David C. Goodman, MD MS Dartmouth Medical College Sarah Brotherton, PhD American Medical Association Bob Edsall American Academy of Family Physicians
iv

Table of Contents
About The Robert Graham Center……………………………………….......…….……..….....................vi
Executive Summary…………………………………………………….………………………..….............vii
Foreword………………………………………………………………...............………………...................xi
Message from the Josiah Macy, Jr. Foundation…………………………….........................................xiii
Figures...........………………………………………………………………...............…….…....................xv
Chapter One What We Know About Factors Affecting Medical Student & Resident Career Decisions...........1
Chapter Two
Study Aims, Questions, Methods, Limitations.............................................................................8
Chapter Three Outcomes of Current Physician Training..................................................................................13
Chapter Four
Debt...........................................................................................................................................16
Chapter Five
Title VII Effect, Personal Interests, and Experiences in Medical School...................................33
Chapter Six
Return on Investment……………………………………………………...........……………………40
Chapter Seven
Conclusions and Recommendations…...........…..…………………………………………………45
Appendices……………………………………......…………………….…………………....………………53
References…...……………………………......……………….……….……………………....……………75
v
About The Robert Graham Center The Robert Graham Center: Policy Studies in Family Medicine and Primary Care The Robert Graham Center is a research center that exists to improve individual and population health
by enhancing the delivery of primary care. The Center aims to achieve this mission through the
generation or synthesis of evidence that brings a family medicine and primary care perspective to health
policy deliberations from the local to international levels. It is a functioning division of the American
Academy of Family Physicians that operates with editorial independence.
This project was completed with the support of the Josiah Macy, Jr. Foundation.
The information and opinions contained in research from the Graham Center do not necessarily reflect
the views or policy of the AAFP.
vi
Executive Summary
Unlike many Western nations, the United States does not manage or actively regulate the number, type,
or geographic distribution of its physician workforce. As a result, medical trainees choose how and where
to work. As with most free markets, equitable distribution is at risk without well-informed, evidence-based
policies and incentives capable of promoting equitable access to appropriate care. This study contributes
to understanding of important policy options and incentives by identifying factors that influence medical
student and resident choices about medical specialties and location of practice. Specifically, it identifies
factors that are associated with choice of primary care specialties, particularly family medicine, and with
caring for rural and underserved populations.
Prior studies of the impact of debt on student specialty choice have revealed mixed effects. Recent
studies suggest that physician payment disparities and the medical school learning environment are
potent factors for specialty choice, and that exposure to Federal Title VII grant-funded programs during
medical school and residency is associated with higher likelihood of students choosing primary care
specialties and practice in underserved settings. Most studies of specialty choice or practice location
focus on the decisions students make at graduation or immediately thereafter. This study is perhaps the
most comprehensive to date, as it examines multiple factors along the training path and how they relate
to the end result, which is specialty of physician practice and where they practice.
This study incorporates nearly 20 years worth of survey data from graduating medical students about
their experiences, their debt, their beliefs, and their intentions. It includes historical files over the same
period of exposure to Title VII funds during training, and of participation in National Health Service Corps
(NHSC). It includes cross-sectional data about physicians' current specialties and practice locations, and
a five-year cross-section of service in Rural and Federally Qualified Health Centers. All of these data
about individual physicians were brought together to test for associations between student characteristics
and training influences that may have policy relevance for a more purposefully produced health care
workforce.
Findings: The income gap between primary care and subspecialists has an impressively negative impact on choice
of primary care specialties and of practicing in rural or underserved settings. At the high end of the range,
radiologist and orthopedic surgeon incomes are nearly three times that of a primary care physician. Over
vii
a 35-40 year career, this payment disparity produces a $3.5 million gap in return on investment between
primary care physicians and the midpoint of income for subspecialist physicians.
There are measurable student characteristics, intentions, and training experiences that are significant
predictors of our study outcomes. Rural birth, interest in serving underserved or minority populations,
exposure to Title VII in medical school, and rural or inner-city training experiences all significantly
increased the likelihood of students choosing primary care, rural and underserved careers. Being married
increased the likelihood of choosing family medicine. Attending a public medical school significantly
increased the probability of choosing a primary care specialty and practicing in a rural, shortage or
underserved area, compared with private medical schools. Title VII exposure in residency increased the
likelihood of serving in the National Health Service Corps and physician shortage areas but not primary
care or rural practice. Other student characteristics reduced the likelihood of study outcomes. Women are
much less likely to choose rural practice, and men are less likely to choose primary care.
The outcomes associated with debt were complex. Students with no debt and no obligating scholarships
(NHSC or Armed Forces) were the least likely to later practice in primary care, in a rural area or in a
health center. Debt above $250,000 also reduced these outcomes compared to other levels of debt.
Students who took scholarships and reduced debt were much more likely to have careers in all three.
There is a group of students sensitive to debt or agreeable to trading debt for service that chooses NHSC
and, possibly, other loan repayment programs. The NHSC is currently only available to 3-4% of
physicians despite a much larger applicant pool.
Conclusions: The outcomes we studied -- practicing in primary care, practicing in family medicine, practicing in a rural
community, practicing in a health center, practicing in an underserved area, ever having served in the
NHSC-- are important if we hope to secure access to primary care for all people in the United States.
Within the last decade, US medical student interest in and choice of these important outcomes fell well
below the thresholds necessary to maintain the physician workforce in primary care and underserved
settings, threatening to enhance an existing workforce maldistribution.
The complex relationship between debt and career outcomes likely has several explanations. Medical
students increasingly come from affluent families who may influence career specialty and income
expectations, and limited exposure to rural or underserved populations. Alternatively, debt-averse
students may not apply to medical school due to fear of debt or may choose less expensive public
schools. Both suggest a selection bias against our study outcomes--schools may select students less
likely to choose these careers, or students more likely to make these choices are not applying. Students
willing to accept obligating debt reduction (NHSC, military), are much more likely to later practice and
viii
remain in primary care and underserved settings and such programs could be an option for more
students and residents.
This study reaffirms the positive relationship between Title VII exposure and most of our study outcomes
despite severe reductions in Title VII funding. It is an important support for the presence and quality of
student training experiences and is an immediately relevant policy option that promotes these outcomes
as it is currently due for reauthorization.
Growing physician income disparities are a major driver of student behavior. It does so directly, but also
indirectly through messages about prestige, intellectual rigor, need to increase “productivity,” and status.
In many academic health centers, primary care is labeled as the revenue “loss leader” rather than as a
core function or even producer of downstream revenue. This income disparity explains much of the
difficulty in achieving the balance in specialty and geographic physician distribution and will continue to
inhibit achieving the workforce needed for better quality, efficiency and equity.
These potent effects of market factors do not absolve medical schools and residency programs of their
role in affecting student choices. We found clear evidence that the student selection process and
curriculum are very important in producing primary care physicians and physicians willing to serve in rural
and underserved settings. In general, public and rural schools do a better job of producing primary care,
rural and health center physicians, which should be an important consideration in the ongoing expansion
of medical school capacity and in the design of new schools. They should also be a focus for state and
federal funding of programs that enhance their success with these outcomes.
Feminization of primary care, particularly pediatrics and family medicine, threatens the rural workforce
without efforts to make rural practice a more attractive or viable choice for women. We also need to
understand male resistance to primary care careers and how to improve it as an option.
Finally, there is a convergence of interest in assuring sustaining healing relationships through primary
care among large employers and federal advisory bodies and agencies. Previously unthinkable
conversations are happening about investing more in primary care and in specific models of care that can
unfetter primary care’s capacity to achieve the effectiveness, efficiency and equity realized in other
countries. There are also calls for changes in how training is financed and the settings in which training
can be supported to purposefully align training with desirable population health outcomes. Both policy
efforts—enhancement of primary care functions and accountable training of the next generation of
physicians—will be needed to reverse the current trends for more expensive and less equitable health
care. We believe that this study offers supporting evidence for these policy efforts and suggests ways that
the training pipeline can be modified to help.
ix

Recommendations:
1. Create more opportunities for students and young physicians to trade debt for service, through effective programs such as the National Health Service Corps.
2. Reduce or resolve disparities in physician income. 3. Admit a greater proportion of students to medical school who are more likely to choose
primary care, rural practice, and care of the underserved. 4. Study the degree to which educational debt prevents middle class and poor students from
applying to medical school and potential policies to reduce such barriers. 5. Shift substantially more training of medical students and residents to community, rural and
underserved settings. 6. Support primary care departments and residency programs and their roles in teaching and
mentoring trainees. 7. Reauthorize and revitalize funding through Title VII, Section 747 of the Public Health Service
Act. 8. Study how to make rural areas more likely practice options, especially for women physicians. 9. New medical schools should be public with preference for rural locations.
x
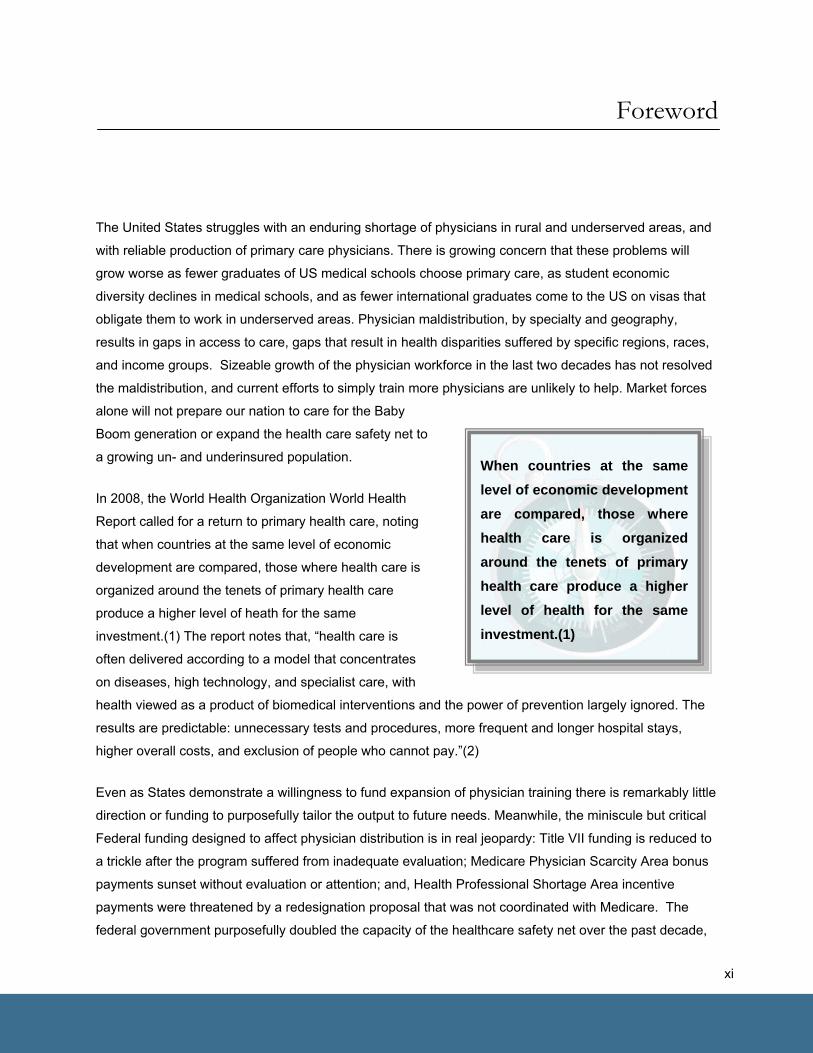
When countries at the same level of economic development are compared, those where health care is organized around the tenets of primary health care produce a higher level of health for the same investment.(1)
Foreword
The United States struggles with an enduring shortage of physicians in rural and underserved areas, and
with reliable production of primary care physicians. There is growing concern that these problems will
grow worse as fewer graduates of US medical schools choose primary care, as student economic
diversity declines in medical schools, and as fewer international graduates come to the US on visas that
obligate them to work in underserved areas. Physician maldistribution, by specialty and geography,
results in gaps in access to care, gaps that result in health disparities suffered by specific regions, races,
and income groups. Sizeable growth of the physician workforce in the last two decades has not resolved
the maldistribution, and current efforts to simply train more physicians are unlikely to help. Market forces
alone will not prepare our nation to care for the Baby
Boom generation or expand the health care safety net to
a growing un- and underinsured population.
In 2008, the World Health Organization World Health
Report called for a return to primary health care, noting
that when countries at the same level of economic
development are compared, those where health care is
organized around the tenets of primary health care
produce a higher level of heath for the same
investment.(1) The report notes that, “health care is
often delivered according to a model that concentrates
on diseases, high technology, and specialist care, with
health viewed as a product of biomedical interventions and the power of prevention largely ignored. The
results are predictable: unnecessary tests and procedures, more frequent and longer hospital stays,
higher overall costs, and exclusion of people who cannot pay.”(2)
Even as States demonstrate a willingness to fund expansion of physician training there is remarkably little
direction or funding to purposefully tailor the output to future needs. Meanwhile, the miniscule but critical
Federal funding designed to affect physician distribution is in real jeopardy: Title VII funding is reduced to
a trickle after the program suffered from inadequate evaluation; Medicare Physician Scarcity Area bonus
payments sunset without evaluation or attention; and, Health Professional Shortage Area incentive
payments were threatened by a redesignation proposal that was not coordinated with Medicare. The
federal government purposefully doubled the capacity of the healthcare safety net over the past decade,
xi
but failed to coordinate a physician training effort to staff further expansion. Policy makers could
purposefully couple these very expensive efforts--physician production and improving health care access-
-but need evidence to guide the use of scant resources to good effect.
Like the Macy Foundation, the Robert Graham Center is committed to finding evidence-based policy
options for healthcare workforce improvement and the related goal of securing access to care for all
Americans. This is our first collaboration with the Macy Foundation and we are most grateful for their
support of our research.
xii

Message from the Josiah Macy, Jr. Foundation
There is once again a serious discussion about extending health care to all Americans, and there is the
real possibility that this time it is going to happen. In this context, the question about whether there will be
enough primary care physicians, in the right locations, to serve the needs of the public takes on a greater
urgency. With a declining number of medical graduates choosing careers in primary care or willing to
practice in underserved areas, it is important to understand the factors that increase or decrease the
likelihood of students and residents choosing such career paths. This understanding can then be the
basis for interventions that might influence these outcomes in a socially desirable way.
The Josiah Macy, Jr. Foundation is pleased to have funded this study by the Robert Graham Center. It is
one of the most comprehensive assessments of the influences on medical student and resident career
choice. It incorporates nearly 20 years of survey data and looks at the final outcomes of type and location
of practice rather than the proximate outcomes of residency choices.
The results indicate that the determinants of career choice are complex and multifactorial. It is clear that
the large and increasing income gap between primary care and specialty care has a negative impact on
the decision to enter primary care or to practice in an underserved area. This is not surprising, but the
findings from this study should give further impetus to policy and payment changes that would narrow this
gap.
Beyond this, one of the most important findings of this study is that the content and milieu of the medical
school experience do matter in career choice. Medical educators sometimes have taken a fatalistic view
that they cannot influence these choices because they are solely driven by market forces. But this study
clearly shows that the nature of clinical experiences in medical school and residency as well as the
learning environment itself can have a positive impact on the likelihood of choosing careers in primary
care. It is also clear from this study, even with its limitations in the amount of socioeconomic data
available, that the characteristics of the students upon admission are important determinants as well.
Both of these findings are important messages to medical school leaders to encourage innovations in
admissions policies and curriculum at this time of medical school expansion.
The role of student debt in the decision making process is extremely complex. In this study, as in several
other studies, it has failed to emerge as a dominant factor. I suspect this is because it is powerfully
xiii
confounded by the overlap between the student characteristics that predict debt or freedom from debt and
those that predict the likelihood of primary care or specialty care as a career choice. Students most likely
to incur high debt are also those most predisposed to go into primary care or to practice underserved
areas; and those from the highest socioeconomic strata who are most likely to be debt-free are also most
likely to be interested in specialty care and in practice sites that afford them a similar lifestyle to that in
which they were raised. That said, we have no reliable way to assess who never enters the profession
because of prospective debt or the full extent of the negative influence of debt among the subset of
students most predisposed to careers in primary care. Targeted programs to address these issues would
be highly desirable, and expanded programs to allow recent graduates to reduce debt by providing public
services would make good policy sense.
This document should serve as an important input to health care reform discussions in the new Obama
administration, in Congress and in wider health policy circles. I applaud Robert Phillips and his team at
the Graham Center for their excellent work.
George E. Thibault, MD President Josiah Macy, Jr. Foundation
xiv
Figures
Report Table 1: Physician specialty, practice location and NHSC service.........................................................15
Table 2: Debt among graduating medical students who have debt and practice location
(deflated with the CPI, 1979-2001)...........................................................................................18
Table 3: Relative risk of medical school primary care experience and career aspirations
for specialty outcome................................................................................................................38
Table 4: Average years of exposure and estimated annual average costs of medical
education and physician earnings.............................................................................................43
Table 5: Estimated total cost of medical education, physician earnings and the returns to
investment in medical education...............................................................................................44
Figure 1: Mean debt among graduating medical students who have debt in public and private
schools (adjusted with the Consumer Price Index)...................................................................18
Figure 2: Relative likelihood of choosing a primary care career ……....……………….............................22
Figure 3: Relative likelihood of choosing a family medicine career..........................................................23
Figure 4: Relative likelihood of serving in the National Health Service Corps..........................................24
Figure 5: Relative likelihood of practice in a Federally Qualified or Rural Health Center.........................25
Figure 6: Relative likelihood of practice in a rural area............................................................................26
Figure 7: Relative likelihood of practice in a shortage area or underserved area....................................27
Figure 8: Relative likelihood of association between various outcomes and exposure
to Title VII Funding....................................................................................................................28
Figure 9a: Title VII exposure, debt and obligating scholarships in relation to selected outcomes:
Choice of primary care specialty...............................................................................................29
Figure 9b: Title VII exposure, debt and obligating scholarships in relation to selected outcomes:
Practice type.............................................................................................................................30
Figure 9c: Title VII exposure, debt and obligating scholarships in relation to selected outcomes:
Practice location........................................................................................................................31
Figure 10: Progress of the physician payment gap....................................................................................32
Figure 11: Relative likelihood of association between various medical school experiences
and exposure to programs funded by Title VII..........................................................................37
Appendix Table A1: Creation of analysis data file and data management……………….......................................…57
xv
Table A2: Distribution of physicians by specialty and analysis group (2001-2005)…………….................59 Table A3: Distribution of sites, providers and beneficiaries with Medicare claims (2001-2005)............…59
Table A4: Distribution of GQ survey respondents -- from 1992…………………………………………...…60
Table A5: Mean and median debt among graduating medical students in public schools
who have debt (deflated with the CPI)……………………………………….........................……60
Table A6: Mean and median debt among graduating medical students in private schools
who have debt (deflated with the CPI)……………………………………………………..............61
Table A7: Distribution of graduating medical students by whether they received medical school
scholarships……………………………………………………………………………................…..62
Table A8: Basic statistics from the analysis file………………………………………...................................62
Table B1: Response variable: Chose primary care career....……………………………….....................…65
Table B2: Response variable: Chose family medicine (FP/GP) career……………….…...…....................66
Table B3: Response variable: Ever provided NHSC service………………………………………………....67
Table B4: Response variable: Ever provided service in FQHC or RHC..............…………………….....…68
Table B5: Response variable: Ever practice in rural area.........................................................................69
Table B6: Response variable: Ever practiced in a shortage area or underserved area............................70
Table C1: List of analysis variables………………………………………….……………………………….....71
Figure 1: Flow diagram showing match-merge results………………….................................................…58
xvi
It is critical for our nation’s future health to understand why most U.S. medical students are not choosing to practice primary care careers or service to the nation’s most needy populations, and where state, federal, and private funding sources can best be used to address these shortfalls.
Chapter One What We Know About Factors Affecting Medical Student & Resident Career Decisions Medical schools and residency training programs in the United States produce fewer primary care
physicians than subspecialist physicians, and have done so for decades.(3) The popularity of primary
care among US medical students has been steadily declining for the last decade, and is now at historic
lows.(4) This is especially true for Family Medicine, the broadest primary care field, and the one in which
residents are least likely to eventually subspecialize and most likely to care for underserved
populations.(5) The imbalance of primary care to
specialist physicians in the U.S. physician
workforce contributes to high health care
costs(3;6;7) and leaves many parts of the country
without primary care physician access, especially
rural and low-income urban areas. In the coming
decades, some have projected a substantial
physician shortage in the United States,(8)
including primary care physicians.(9) While these
projections are debatable, two things are
becoming more clear: 1) There is a problem with
sufficient access to primary care physicians in rural
and impoverished areas(3); and 2) current practice
configuration or organization will have great
difficulty absorbing all uninsured patients if universal access is achieved.(10) Now more than ever, it is
critical for our nation’s future health to understand why most U.S. medical students are not choosing to
practice primary care careers or service to the nation’s most needy populations, and where state, federal,
and private funding sources can best be used to address these shortfalls.
Medical students’ career decision-making has been discussed and studied extensively. Studies have
shown that students’ choices of primary care or specialty careers are influenced by student-related
factors, such as gender, race and ethnicity, socioeconomic status, rural or urban background, and
attitudes and values (11;12) ; and curriculum factors, particularly exposure to required Family Medicine
curriculum during the third or fourth year of medical school.(11-14) Debt studies are mixed but Specialty
income difference has been a consistent factor in student specialty choice out of school. Specialty choice
1
is also related to institutional factors, such as state funding, Title VII funding, and the strength of Family
Medicine departments, which all contribute to the “institutional culture.”(13;13;15-19)
Studies of student and physician decisions to practice in underserved areas are less extensive, but have
uncovered important predictors. Students who grow up in rural areas, plan to choose family medicine at
matriculation to medical school, and are male, have historically been more likely to practice rural primary
care.(20-24) Similarly, students who grow up in urban underserved areas are more likely to practice in
inner cities.(20) Under-represented minority physicians(25;26) and women(26) are more likely to care for
underserved populations. Personal values, spirituality, and mentoring also increase students’ likelihood
of choosing service careers.(25-27) Finally, longitudinal, comprehensive medical school and residency
educational programs with the explicit goals of preparation of students and physicians for underserved
practice have demonstrated clear success.(28-33)
Despite the importance of these issues, and the understanding gained from previous researchers,
significant gaps in knowledge remain about the role of medical student debt, scholarship and loan
programs, type of school, curriculum, institutional culture, and potential income on medical students’
specialty choices and decisions to care for underserved populations.
Medical Student Debt The role of medical student debt in specialty choice has received significant attention, but is most often
examined through attitudinal surveys of students still in the process of training. Most medical students
carry a debt burden on graduation that is out of proportion to that of other professions, and there is a
substantial income gap between primary care and specialist physicians, making a primary care career a
relatively poor financial investment.(34) Nearly one in four 2008 medical school graduates carried more
than $200,000 in educational debt, and the rate of growth of debt is out of proportion to most inflation
indices or even rate of growth of physician income.(35) Research to date has not consistently
demonstrated a convincing relationship between low debt and primary care specialty choice.(36-39)
(18;40-46)
Likewise, the relationship between debt and service careers is poorly understood. One might expect that
higher debt would motivate physicians to maximize their income by excluding low-paying patients, such
as uninsured and Medicaid patients, and by practicing in affluent areas, where the exclusion of such
patients is feasible. Two older studies failed to demonstrate that debt correlated with graduating medical
students’ intentions to practice in an underserved area.(38;47) However, these studies only examined
practice intentions, rather than actual physician behaviors; they examined broadly defined practice
locations rather than actual patient panels; and they were performed at a time when student and
physician debt levels were significantly lower than they are now. A more recent study, examining the
career intentions of graduates in 2002, found that students with higher debt loads were slightly more likely
2
to plan to work in underserved areas than their peers.(39) Only one study has directly examined the
relationship between physicians’ debt level and proportion of needy patients, and this study demonstrated
that Family Medicine physicians and Pediatricians with more debt were more likely to care for Medicaid
and uninsured patients.(48) Although the findings of the latter appear counterintuitive, it is likely that
willingness to care for indigent patients and level of debt are both associated with other determinants,
such as the socioeconomic status of the physician’s family of origin, students’ interest in serving the
underserved, and loan repayment options. The effect of educational debt on physicians’ willingness to
care for uninsured and impoverished patients, and actual practice in underserved settings, needs further
study.
A recent, important study on debt was done with law students.(49) In the study, potential students were
randomized to one of two financial aid packages of equivalent monetary value prior to enrollment: one
offered loan repayment to graduates who pursued public interest law; the second offered full tuition
scholarships contingent upon students working in public interest law. Randomization was announced
prior to enrollment and tuition assistance students were twice as likely to enroll in law school as loan
repayment students. Tuition assistance recipients were 36-45% more likely to work in public interest law
than were students with loan repayment options. This study was exceptionally well done and suggests
that the risk of incurring debt is a psychological deterrent to enrollment for some students, and to
choosing non-service careers for graduates. It is difficult to say how well this generalizes to medical
students, but it is an important contribution to research on the effects of debt.
Scholarship and Loan Repayment Programs Medical students have limited opportunities to benefit from low-interest loans and loan repayment and
scholarship programs, including Primary Care Loans, Loans for Disadvantaged Students, state-based
loan repayment and scholarship programs, National Health Service Corps loan repayment and
scholarships, Armed Forces scholarships, as well as other private loans and scholarships. Federal
Primary Care Loans were created to induce medical students to choose primary care careers by offering
low interest rates to students committed to primary care practice. Loans for Disadvantaged Students are
low-interest loans for financially needy students from disadvantaged backgrounds, regardless of specialty
or practice intentions. The US Armed Forces offer medical school scholarships and financial support
during residency for students who commit to service in the Armed Forces. Since 1972, the National
Health Service Corps (NHSC) has offered scholarships for students who commit to practice primary care
in federally designated Health Professional Shortage Areas. In the last decade the NHSC reduced
scholarships in lieu of loan repayment, moving the choice to trade debt for service after training has
finished.
3
NHSC alumni provide vital health care in their sponsoring communities and have a high likelihood of
continuing to care for underserved populations even after their commitments have ended,(25;50-52)
although they are less likely to remain in underserved practice than physicians who initially care for
underserved populations without NHSC financial support.(53;54;54) Pathman also demonstrated that
state-sponsored scholarship and loan repayment programs support a substantial work force of physicians
in underserved communities throughout the country,(55) and that physicians who benefit from state-
based financial incentives are more likely than other generalist physicians to practice in needy areas and
care for uninsured and Medicaid.(56) A few studies of specific state or Canadian province-based loan or
scholarship programs have shown mixed success.(57)
The impact of the Primary Care Loan program, Armed Forces Scholarships, and Loans for
Disadvantaged Students has not been studied with regard to career choice and underserved practice.
Although the primary purposes of Armed Forces Scholarships and Loans for Disadvantaged Students are
to provide medical care for military personnel and provide access to higher education for needy students,
respectively, the possible secondary outcome of providing a primary care physician workforce for the
nation’s underserved is worthy of investigation. In addition, Pathman’s study of state programs is the only
study to comprehensively examine the national impact of non-NHSC loans. The specialty choices of
students who benefit from state-based scholarships and loan repayment have never been compared to
those without such support.
Institutional Funding There is evidence that students’ decisions to choose primary care and service careers are influenced not
only by their personal finances, but by the financial structures that underpin their medical schools. As
noted above, multiple studies have demonstrated that public medical schools, which are supported by the
state and generally view service to the state as core to their mission, generate a larger proportion of
primary care physicians than privately funded schools.(58) The proportion of state financial support per
student at a given school has also been correlated with the percentage of graduates entering Family
Medicine residencies.(16) Public schools also produce more students interested in rural practice(59) and
more rural physicians,(60) although public medical education is not predictive of rural physician
retention.(61)
Since 1976, Title VII funding from the U.S. Department of Health and Human Services has provided
substantial support for Family Medicine educational programs at medical schools in many states. These
curricula focus on development of primary care physicians who would care for urban and rural
underserved populations.(62) Studies have found strong, sometimes dose-dependent associations
between Title VII funding and increased production of primary care graduates, and physicians who
eventually practice in rural areas and federally designated physician shortage areas.(13;15;63) The
4
Studies have found strong, sometimes dose-dependent associations between Title VII funding and increased production of primary care graduates, and physicians who eventually practice in rural areas and federally designated physician
shortage areas. (13,15,63)
manner in which it might affect these outcomes is unclear but speculated to be related to curriculum
content and to training experiences developed as a result of Title VII funding.(64) Title VII funding was
reduced from $92.4 million in fiscal year 2003 to $48.0 million in 2008 and the President’s budget typically
recommends cutting it out altogether.
Specialist / Primary Care Income Gap Physician income disparities are consistently and
strongly correlated with the initial specialty choices
students make.(65;66) It is unclear how this factor
relates to the other factors affecting student choices.
Steinbrook recently suggested that this strong, direct
correlation between income and specialty choice
was related to debt since primary care income can
make paying off debt a difficult burden.(35)
Institutional Culture Data about the influence of “institutional culture” on
students’ career choices is somewhat limited, primarily because it is difficult to differentiate recruitment
from educational effects. Institutional culture is also closely related to funding and to curriculum.
Regardless of the underlying contributors, medical schools’ institutional culture seems to correlate with
career choice. For example, medical schools located in rural areas graduate substantially more rural
physicians,(60) and training away from urban centers is believed to be a core component of preparation
for eventual rural practice. Schools that graduate a greater proportion of primary care physicians are
more likely to: 1) have community hospital teaching sites, rather than academic medical centers(67); 2)
have explicit primary care missions; 3) have been founded since 1960; and, 4) have Family Medicine
departments.(68) Some studies have found an inverse relationship between the amount of institutional
NIH funding and the proportion of primary care graduates, and NIH funding is hypothesized to be a
measurable proxy for the research culture of medical schools.(58)
The influence of institutional culture, particularly as it can be assessed independently from other factors,
deserves further study. In particular, the influence of residency program (vs. medical school) institutional
culture has not been systematically evaluated. Unfortunately, the culture of academic medicine, as a
whole, has a negative disposition toward primary care.(69;70)
Curriculum Longitudinal, comprehensive medical school and residency educational programs with the explicit goals
of preparing trainees for primary care rural and/or underserved practice have demonstrated clear
5
success.(23;28;29;71-75) It is difficult to isolate the effect of the educational experiences from the effect
of selection of motivated students, but several studies have shown evidence of success beyond that of
recruitment alone.(22;31;76;77) Family medicine residents who train in Community Health Centers are
also more likely to later care for underserved populations.(33)
Although the achievements of these longitudinal educational experiences are commendable, they include
only a small fraction of the total number of medical students educated in the United States.
Unfortunately, only a few studies have examined the outcomes of brief educational interventions, such as
isolated rural rotations or exposure to underserved populations, and these have not demonstrated a long-
term impact on career outcomes. Both Fryer(78) and Brooks(24) have demonstrated a correlation
between participation in a rural medical school rotation and rural practice, but these findings did not
control for the effect of interest in rural practice prior to the rotation – which has been shown in other
studies to correlate strongly with eventual rural practice. In Brooks’ study, rural medical school rotation
was not predictive of rural practice in multivariate analysis. Easterbrook et al found no association
between medical school or residency exposure to rural health care and eventual rural practice.(79)
Pathman demonstrated that non-NHSC physicians have the same level of retention in rural communities,
regardless of whether they completed rural rotations as students or residents.(61) Brush et al evaluated
the impact of participation in medical school service-learning activities, and did not find a relationship with
specialty choice.(80) Public health and community medicine teaching are increasingly incorporated into
medical school curricula, either as requirements or elective experiences. Underserved clinical electives
are also widely available to most students. However, it remains unclear whether brief rotations with inner
city or rural populations, or curriculum in public health or community medicine, are related to eventual
specialty choice or practice with underserved populations.
Previous studies substantiate that required exposure to primary care in the curriculum influences students
toward primary care specialty choices. Multiple studies have shown that implementation of a required
clinical clerkship in family medicine increases the proportion of medical students who choose Family
Medicine careers. Longer clerkships in Family Medicine appear to be more effective.(81) Similarly, a
required outpatient rotation in Internal Medicine increases the proportion of students choosing Internal
Medicine careers.(82) (A more recent study found that an outpatient Internal Medicine clerkship made a
general internal medicine career appear less appealing to students, but final career choices of these
students were not compared to students without such an experience.(45)) Several randomized studies
have also demonstrated that longitudinal community primary care experiences increase students'
likelihood of choosing primary care careers,(68;81) although these results have not been replicated in all
studies.(83) Brief curricular interventions in the first and second year do not appear to influence specialty
choice.(11)
6
Students report that mentors and training experiences are also important in their specialty intentions.(45)
We recognize that the mentoring and training experiences are very important and are interested in
whether Title VII funding makes specific types of experiences and mentoring possible. Medical students
often receive negative messages from mentors about primary care and these messages may be
influenced by the academic culture and income disparities.(69;70;84)
7
Chapter Two Study Aims, Questions, Methods, Limitations Purpose: The purpose of our study is to further examine the impact of financial and educational factors on medical
students’ likelihood of eventually practicing as primary care physicians and caring for underserved
populations. We systematically examined most of the US medical student population over several
decades to assess the effects of these factors on students’ practice choices over time, using a very large
sample size that will be sensitive to subtle relationships.
Specific Aims: 1. To understand whether or not debt at graduation from medical school is predictive of choices related
to specialty or location of practice, with working in a community health center (CHC), or with National
Health Service Corps (NHSC) participation. To assess whether or not exposure to Title VII Section
747 funding modifies the effects of or interacts with debt.
Hypotheses to guide our analyses:
Hypothesis 1: Higher levels of debt at graduation will be associated with decreased likelihood of
choosing a primary care specialty, rural practice location, care for underserved
populations, and lower likelihood of current work in a CHC but will increase likelihood
of ever having been in the NHSC despite controlling for other factors. The association
will be curvilinear, increasing as debt increases. The effect of exposure to Title VII
funds (predoctorate, residency, departmental) on choices related to practice location,
work in a CHC, or NHSC participation will be attenuated by debt.
Hypothesis 2: Acceptance of scholarships with service commitments, including NHSC and Armed
Forces scholarships will be associated with low levels of medical student debt,
greater likelihood of primary care practice, service to underserved populations, rural
practice, and practice in community health centers.
2. To understand the association of Title VII exposure in medical school with career choice and with
perceptions of primary care training and underserved populations while in medical school.
8
Hypothesis 3: Exposure to Title VII funding will be associated with greater likelihood of primary care
practice, service to underserved populations, rural practice, and practice in
community health centers.
Hypothesis 4: Students exposed to Title VII in medical school will have measurably better
assessments of their training experiences in primary care with underserved
populations.
3. To understand how specialty income differences are associated with student specialty choices and to
quantify the eventual Return on Investment and Rate of Return of student specialty choices.
Hypothesis 5: Differences between primary care and subspecialty income at graduation will be
associated with reduced selection of primary care specialty.
Hypothesis 6: Subspecialty physicians will have a higher Return on Investment than primary care
and debt at graduation will exacerbate these differences.
4. To understand how the type of medical school, the quality of primary care training experiences,
experiences with underserved populations in medical school, and interest in underserved populations
affect subsequent decisions about specialty and practice location.
Hypothesis 7: There will be differences in choice of primary care specialty or in practice location
associated with the quality (or presence) of such experiences in medical school
Hypothesis 8: Medical school rotations in rural and inner-city underserved locations will predict
primary care and service careers.
Hypothesis 9: Attending public medical school will be more predictive of primary care and
underserved area career.
Hypothesis 10: Students’ intentions to care for underserved populations and to enter primary care
will be highly correlated with later practice patterns.
Brief Methods (see appendix A for complete methods): The financial factors examined include medical student debt, scholarships, loan repayment programs,
and Title VII funding of medical schools. Educational factors include participation in primary care
clerkships, student-assessed quality of these clerkships, exposure to clerkships in rural or inner city
9
settings, exposure to Public Health or Community Health curriculum, and education about “health issues
for underserved populations.” Because previous studies have shown medical student debt to be a
complex issue, itself influenced by many factors, the study also examines medical student debt as an
outcome variable, evaluating geographic and institutional (public v. private) factors associated with higher
debt at graduation. The study also examines the strength of the relationship between stated student
intentions in the American Association of Medical Colleges’ Graduate Questionnaire and eventual
practice patterns. This should offer better assessment of outcome than many previous career choice
studies that rely on student intentions or first year residency positions as outcomes of interest. Finally, we
sought and quantify the relationship between career choice and the income difference between primary
care and specialist physicians at the time of graduation from medical school. We take this one step
further and objectively assess the Return on Investment for choosing a primary care career vs.
subspecialty career.
Predictive variables are primarily drawn from the American Association of Medical Colleges’ Medical
School Graduation Questionnaire, which has been administered to most graduating medical students
annually since 1972. These predictive variables include total educational debt; the presence of Armed
Forces, NHSC, or need-based scholarships; the presence of Primary Care Loans, Loans for
Disadvantaged Students, or state-based loans; educational experiences, including primary care
clerkships, the quality assessment of these clerkships, and underserved or community medicine/public
health experiences; medical school; and residency program. Medical school and residency predictive
variables include the presence or absence of Title VII funding during training. We planned to test the
effect of university affiliation during residency training as a marker for institutional culture during the
residency years (provided by the American Medical Association), and the presence of a rural or primary
care track in residency; however we were unable to get a sizeable match for these factors with physicians
during training.
These predictive variables were examined for relationships to the primary outcomes of interest: primary
care career choice and care for underserved populations. Career specialty and location (rural vs. urban)
data were obtained from the AMA Physician Masterfile. Underserved care is defined to include work in a
Community Health Center (CHC), Rural Health Center (RHC), National Health Service Corps (NHSC),
federally designated rural or urban Health Professional Shortage Area (HPSA), and Medically
Underserved Area/Population (MUA/P). These were obtained from Medicare claims data (CHC or RHC)
for the period of 2001-2005; from historical NHSC data (1978-2004), and from geographic linkage
between the AMA Masterfile and shortage area shapefiles from the US Health Resources and Services
Administration. Data on Title VII grant awards were obtained from US Health Resources and Services
Administration’s Bureau of Health Professions and were previously linked to individual physicians in the
AMA Masterfile in a prior study, the methods of which are published.(85) Nine grant types were included
10

and grouped into 3 categories: Pre-doctoral Education (“pre-doctoral grants”), Department Development
(Academic Administrative Unit or “academic unit grants”), and Residency Training (“residency grants”).
We evaluated emerging variables in stepwise multivariate analysis, including known demographic factors,
in order to establish a model demonstrating their interactivity and relative importance in determining
students’ likelihood of choosing primary care specialties and service to underserved populations. Relative
risk calculations were done independent of the logistic regression analysis to explore the relationships
between this Federal support for primary care training and the presence and quality of curriculum
associated with desirable physician workforce. Relative risk calculations were also used to explore the
interaction effects of Title VII, debt and obligating scholarships on study outcomes.
Limitations: This study has several real and potential limitations. First, the student response rates to the AAMC
Graduate Questionnaire were variable over the last thirty years. We restricted our analysis to those years
for which most complete responses were obtained (after 1980 and before 2004). The 310,000 responding
students represent more than 2/3rds of graduating allopathic students (Figure 1, Appendix A). We were
unable to obtain similar data from the American Association of Colleges of Osteopathic Medicine and so
our analyses exclude osteopathic physicians. Since international medical graduate (IMG) physicians do
not attend medical school in the US, and therefore did not complete the Graduate Questionnaire, we
excluded IMGs from our analyses as well. Doctors of osteopathy and IMGs make important contributions
to the primary care workforce and underserved communities. Many of these excluded physicians are
reflected in the incomplete matches for Medicare claims from Federally Qualified and Rural Health
Centers (FQHC, RHC), and from the National Health Service Corps files (Figure 1, Appendix A).
Otherwise, we were remarkably successful (greater than 90%) in matching study subjects to these
important career choices.
Since Pediatricians rarely file Medicare claims, our ability to identify their contributions to FQHCs and
RHCs is necessarily limited. Largely due to disabled children with social security benefits, we were able to
identify hundreds of Pediatricians in health centers, but this may belie the true commitment by these
physicians to underserved care.
Finally, we did not have access to the AAMC Matriculation Survey Questionnaire data that would have
enabled assessment of parental income, education and profession as additional predictive variables.
These data would also have provided more complete race and ethnicity data, more about geography of
upbringing, and more on undergraduate experiences. This gap in our predictive variable pool also
reminds us that the associations we find may be reflective of other missing predictive factors. That said,
11

this study is an important step forward in terms of the collection of predictive factors and in terms of being
able to connect these to ultimate practice specialty and location.
12
Chapter Three Outcomes of Current Physician Training Primary Care Between 2001 and 2005, slightly more than 1/3rd of practicing physicians were doing so in primary care
(Table 1). A recent survey found that just 2% of students were interested in general internal medicine
careers, 4.9% in family medicine, and 11.7% in general pediatrics.(45) Current US graduate interest falls
short of maintaining the current proportion of primary care in the physician workforce. As a result,
maintaining the primary care physician workforce is increasingly reliant on International Medical
Graduates. In 2008, 37.9% of first year residency positions that could potentially produce primary care
physicians were filled by International Medical Graduates.(86) Of those who do graduate from primary
care residencies, an increasing number of internal medicine graduates are avoiding primary care and
pursuing subspecialty training and hospitalist careers.(87) Pediatricians are also increasingly
subspecializing. In fact, Salsberg estimates that between 2002 and 2006, the percentage of all residents
in training who will potentially practice primary care decreased from 28.1% to 23.8%.(88) This loss in
production of primary care physicians may join the problem of maldistribution and further erode access to
primary care services.
Shortage areas Nearly one in four physicians was practicing in a Primary Care Health Profession Shortage Area (HPSA),
Medically Underserved Area (MUA), or Medically Underserved Population (MUP) (Table 1). This does not
mean that 25% of physicians care for underserved patients in these areas. The MUA and population
HPSA designations are often used to designate an area that has many underserved people with poor
health outcomes among a much larger and better served population. The MUP and geographic HPSA
designations are more specific for isolated, underserved communities and account for just over 3% of
physicians. One estimate places the number of people with potentially reduced access to care in these
areas at 56 million.(89) There are many federal and state programs that use these designations to place
health care resources and incent physician location.
Federally Qualified and Rural Health Centers Based on Medicare claims (2001-2005), one in ten practicing physicians work in a Federally Qualified
Health Center (FQHC) or Rural Health Center (RHC) with the latter having the larger proportion; however
we know from the Uniform Data Set, that the full time equivalent physician counts are lower (7,505 FTE
physicians in FQHCs in 2006 from UDS vs. 10,642 submitting any Medicare claims).(90) The clinical
13
Historically, rural areas have depended more on family physicians than
other specialties.(91)
capacity of FQHCs increased by 57% between 2000 and 2006 and similar expansion is planned through
2015. The expected capacity to care for 30 million people will require nearly 16,000 more full-time primary
care providers. This goal cannot be achieved with the current choices made by graduating medical
students and or contributions of the NHSC.(90)
Rural Practice Nearly 10% of physicians are in rural practice compared to about
20% of the US population. Historically, rural areas have
depended more on family physicians than other specialties.(91)
There has been a sharp decline in other primary care specialties
choosing rural practice; for example, between 1981 and 2001,
the percentage of new pediatricians choosing rural practice fell
from 14.6% to less than 1%.(92) The decline in acceptance of
rural-born students to medical school and general loss of new
graduates to primary care will likely exacerbate the relative
access shortage in rural areas.
National Health Service Corps Between 1978 and 2005, we were able to identify 2.3% of physicians who served in the National Health
Service Corps (NHSC). The majority of Corps participants were medical school scholarship recipients
(1.7%) despite the fact that most NHSC physicians now come through loan repayment during or after
residency training (0.7%). NHSC scholarship recipients are likely to have lower or no debt, while elevated
levels of debt at graduation may be predictive of acceptance of NHSC loan repayment. For these
reasons we chose to study them independently.
14
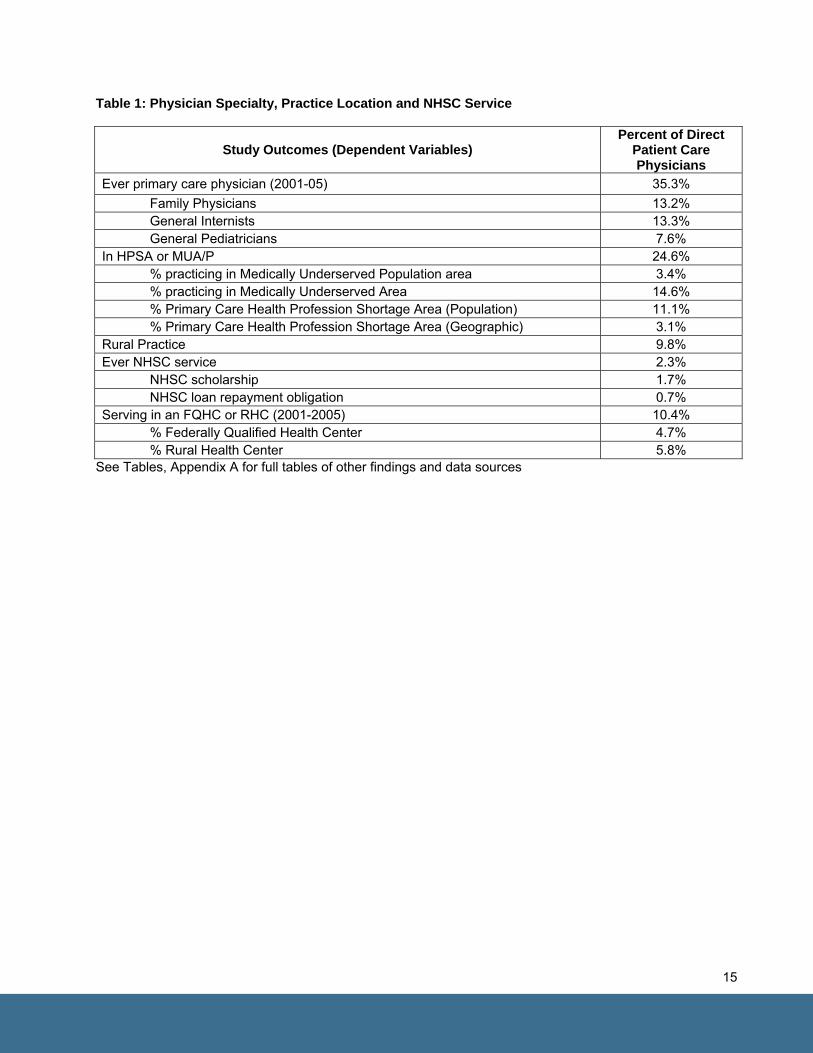
Table 1: Physician Specialty, Practice Location and NHSC Service
Study Outcomes (Dependent Variables) Percent of Direct
Patient Care Physicians
Ever primary care physician (2001-05) 35.3% Family Physicians 13.2% General Internists 13.3% General Pediatricians 7.6% In HPSA or MUA/P 24.6% % practicing in Medically Underserved Population area 3.4% % practicing in Medically Underserved Area 14.6% % Primary Care Health Profession Shortage Area (Population) 11.1% % Primary Care Health Profession Shortage Area (Geographic) 3.1% Rural Practice 9.8% Ever NHSC service 2.3% NHSC scholarship 1.7% NHSC loan repayment obligation 0.7% Serving in an FQHC or RHC (2001-2005) 10.4% % Federally Qualified Health Center 4.7% % Rural Health Center 5.8%
See Tables, Appendix A for full tables of other findings and data sources
15
Chapter Four Debt The role of medical school debt in specialty choice and location of practice has received considerable scrutiny, but remains unclear.
Aim To understand whether or not debt at graduation from medical school is predictive of choices related to
specialty or location of practice, with working in a community health center (CHC), or with National Health
Service Corps (NHSC) participation. To assess whether or not exposure to Title VII Section 747 funding
modifies the effects of or interacts with debt.
Hypothesis 1: Higher levels of debt at graduation will be associated with decreased likelihood of
choosing a primary care specialty, rural practice location, or current work in a CHC
but will increase likelihood of ever having been in the NHSC despite controlling for
other factors. The association will be curvilinear, increasing as debt increases. The
effect of exposure to Title VII funds (predoctorate, residency, departmental) on
choices related to practice location, work in a CHC, or NHSC participation will be
attenuated by debt.
Hypothesis 2: Acceptance of scholarships with service commitments, including NHSC and Armed
Forces scholarships, will correlate with low levels of medical student debt and predict
primary care and service to underserved populations.
Hypothesis 3: Exposure to Title VII funding will be associated with greater likelihood of primary care
practice, service to underserved populations, rural practice, and practice in
community health centers.
Hypothesis 9: Attending public medical school is more predictive of primary care and underserved
area career.
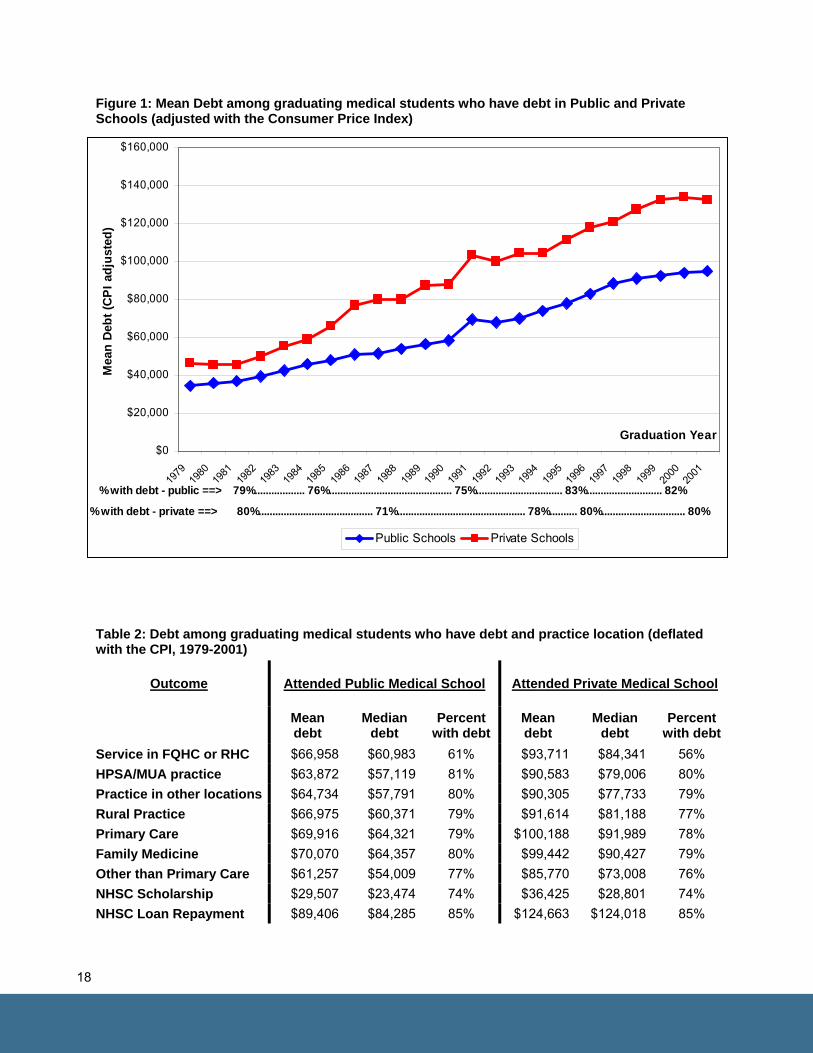
Findings Debt: The proportion of students with debt and average debt per student rose steadily over the last 30
years (Figure 1). Three out of four students in private and public schools graduate with debt, but for those
16
The proportion of students with debt and average debt per student rose steadily over the last 30 years (Figure 1).
in private schools average debt is nearly 50% higher (Table 2). For students with any debt, the average in
2006 was $130,000.(93) After adjusting for inflation using the Consumer Price Index and excluding
scholarship recipients, we found that the average public school debt ranged from $61,000 – $91,000, and
average private school debt ranged from $85,000 - $129,000 (Table 2). As we expected, NHSC
scholarship recipients had lower average debt and loan repayment physicians had higher debt than the
average student.
In the aggregate, debt does not appear to have a notable effect
on most of our study outcomes except National Health Service
Corps and rural practice. The odds of serving in the NHSC are
significantly higher at all debt levels except more than $250,000,
likely due to the lower debt levels of scholarship recipients, and
higher debt levels of loan repayment physicians (Figure 4). The
odds of practicing in a rural area rise as debt level rises but only
modestly compared with other factors (Figure 6).
Separate analyses for public and private schools revealed two different pictures for the odds of choosing
primary care associated with debt. For private schools, odds of choosing primary care practice increases
as debt increases, with those having no debt (and no scholarships) less likely to choose primary care.
For public schools, debt had more of a bell-curve shape. Students with no or low debt (less than $50,000)
and those with high debt (more than $150,000) had higher odds of not choosing primary care, while those
with debt between $100,000 and $150,000 had the highest odds of choosing primary care. This same
pattern remained when we controlled for public school attendance, but the significance was less robust
due to the effects of private school (Figure 2).
17
$0
$20,000
$40,000
$60,000
$80,000
$100,000
$120,000
$140,000
$160,000
1979
1980
1981
1982
1983
1984
1985
1986
1987
1988
1989
1990
1991
1992
1993
1994
1995
1996
1997
1998
1999
2000
2001
Graduation Year
Mea
n De
bt (C
PI a
djus
ted)
Public Schools Private Schools
% with debt - public ==> 79%.................. 76%............................................ 75%............................... 83%........................... 82%
% with debt - private ==> 80%......................................... 71%.............................................. 78%.......... 80%.............................. 80%
Figure 1: Mean Debt among graduating medical students who have debt in Public and Private Schools (adjusted with the Consumer Price Index)
Table 2: Debt among graduating medical students who have debt and practice location (deflated with the CPI, 1979-2001)
Outcome
Attended Public Medical School
Attended Private Medical School
Mean debt
Median debt
Percent with debt
Mean debt
Median debt
Percent with debt
Service in FQHC or RHC $66,958 $60,983 61% $93,711 $84,341 56% HPSA/MUA practice $63,872 $57,119 81% $90,583 $79,006 80% Practice in other locations $64,734 $57,791 80% $90,305 $77,733 79% Rural Practice $66,975 $60,371 79% $91,614 $81,188 77% Primary Care $69,916 $64,321 79% $100,188 $91,989 78% Family Medicine $70,070 $64,357 80% $99,442 $90,427 79% Other than Primary Care $61,257 $54,009 77% $85,770 $73,008 76% NHSC Scholarship $29,507 $23,474 74% $36,425 $28,801 74% NHSC Loan Repayment $89,406 $84,285 85% $124,663 $124,018 85%
18

National Health Service Corps: NHSC scholars had much lower debt on average. NHSC loan
repayment recipients were more likely to have debt and had much higher debt than their peers (Table 2).
NHSC obligation is to an underserved area, sometimes, but not necessarily in an FQHC or RHC.
Participation in the NHSC scholarship program is associated with a quadrupling of the odds of choosing
primary care (Figure 2) and family medicine career (Figure 3). The association is even stronger for NHSC
loan repayment but this option is chosen in or after residency when specialty is more decided. Working in
an FQHC or RHC are not the only options open to NHSC physicians but participation in either the
scholarship or loan repayment program increases the likelihood of working in either by 3.6 times (Figure
5). Participation in the loan repayment and scholarship programs increases the likelihood of rural practice
by 2.1 and 1.9 times, respectively (Figure 6). The scholar program is associated with a small but
significant increase in the odds of working in a shortage or underserved area (Figure 7).
Title VII: Matriculation in a medical school during the time that the school received Title VII funding was a
proxy for potential exposure to the effects of these funds which are designed to increase primary and
underserved care. The logistic regression analysis found the most impressive, independent effect to be a
24% increase in likelihood of NHSC selection for Title VII exposure in residency (Figure 4). Medical
school exposure to Title VII significantly increased the likelihood of a primary care career (11%), family
medicine career (12%), or rural practice (11%)(Figures 2,3,6). Strangely, exposure to Title VII in
residency was associated with significantly reduced likelihood of a primary care career (-42%), family
medicine (-6%), practice in a health center (-42%), or rural practice (-10%)(Figures 2, 3, 5, 6). Title VII
exposure in residency was associated with a small but significant increase in likelihood of practice in a
shortage/underserved area (10%) (Figure 7), which may explain why it had a positive association with
NHSC but negative with rural (greater association with NHSC physicians in urban areas).
We conducted bivariate relative risk analysis of Title VII exposure in medical school to test for interactive
effects beyond the independent effects found in the logistic regression. We found that Title VII exposure
is associated with increased likelihood of students choosing primary care careers and for choosing to
work in an FQHC or RHC (Figure 8). It does not appear to have a significant association with choosing to
practice in underserved areas more broadly than health center staffing. The interaction of Title VII
exposure, debt and obligating scholarships (NHSC or Armed Forces) produces interesting outcomes
(Figures 9a-9c). Title VII exposure is associated with a step-wise increase in likelihood of choosing
primary care or family medicine careers when combined with debt or debt and an obligating scholarship
(Figure 9a). Practice in an FQHC or RHC is maximized by having an obligating scholarship and is
reduced by any debt (Figure 9b). Exposure to Title VII is not associated with health center location when
there is no scholarship but is associated with a reduced effect of debt when a student has a scholarship.
Title VII exposure is associated with an increase in likelihood of practicing in a rural area, especially in
conjunction with obligating scholarships (Figure 9c).
19
Other Factors
Physician income gap at graduation: Ebell demonstrated a tight correlation between specialty income
at graduation and choice of residency specialty.(65) We found that the income gap is a significant and
substantial factor in students’ eventual practice location and specialty (Figures 2-7). Medical Group
Management Association data on physician income show that the income gap has grown steadily since
1979 such that the difference between diagnostic radiology or orthopedic surgery and primary care was
$250,000 in 2005 (Figure 10). This gap reduced the odds of students’ choice of primary care or family
medicine by nearly half. It reduced the odds of working in an FQHC or RHC by 30%, and of practicing in a
rural area by almost 20%. Only practice in a shortage or underserved area had slightly higher odds with
relative expected income at graduation which is largely due to the designations made in areas with poor
people and access despite dense physician population (Figure 7). The association between this income
gap and most of these outcomes is stronger than debt at graduation.
Being male: Being male was associated with a similar odds reduction of choosing primary care as the
income gap, that is to say, the odds of choosing primary care was cut in half for men (Figure 2). The
associated effect for choice of family medicine was not as drastic, in that male students were only 13%
less likely to choose family medicine (Figure 3). Males had no reduction in odds of working in an FQHC or
RHC, and were substantially more likely than women to practice in rural and underserved areas. The
majority role that women now play in the Pediatrician workforce may be one of the explanations for why
Pediatricians have nearly stopped going to rural and small towns.(92)
Rural birth: Birth in a rural county may not necessarily mean that someone grew up in a rural area or that
they are wedded to returning to one. This potentially poor and temporally distant marker of rural
background is still associated with some important outcomes. It increases the odds of practice in a rural
area by 2.4 times and nearly doubles the odds of choosing Family Medicine (Figures 3 and 6). It
increased students’ odds of choosing primary care or serving in a health center by approximately 50%
and of serving in a shortage /underserved area by nearly 30% (Figures 2, 5 and 7). For its faults, it is a
potent marker if not predictor of students who will make these important choices. It is therefore not
surprising that the significant declines of acceptance of rural-born students to medical school overlaps so
well with the declines in student interest in choosing primary care, rural practice, and care for
underserved populations.(94)
Type of Medical School: Attending a public medical school is positively associated with most of our
outcomes including a 77% increase in the odds of students choosing to practice as Family Physicians
and a 66% increase in practicing in a rural area (Figures 3 and 6). Not many medical schools are in rural
areas, but graduating from one of them nearly triples the likelihood of practicing in a rural area. Further,
20
medical schools that have purposefully built community linkages realize 20% or more increase in the
odds of most of our study outcomes. As states consider investments in the expansion of their existing
medical schools, or in building new ones, they would do well to consider these findings if they expect a
return on investment related to our study outcomes.
Summary:
Hypothesis 1:
• Higher levels of debt at graduation were not associated with decreased likelihood of choosing a
primary care specialty, or current work in a community health center relative to no debt
• Higher levels of debt were associated with greater likelihood of rural practice
• Students with any debt were more likely to participate in the NHSC compared to no debt—lower
debt is associated more with scholarships and higher with loan repayment
• The interplay of Title VII funding and debt was complicated:
o Title VII enhanced the likelihood of work in either an RHC or FQHC and debt
attenuated this effect
o Title VII enhanced the likelihood of primary care practice and debt enhanced this
effect; the two combined with scholarships produced the greatest likelihood.
Hypothesis 2: Scholarships were strongly associated with increased likelihood of primary care
practice, rural practice, service in health centers and in underserved areas.
Hypothesis 3: Title VII exposure in medical school enhanced the likelihood of primary care practice,
family medicine careers, and rural practice. Title VII exposure in residency was
significantly associated with increased likelihood of community health center service
and practice in physician shortage or underserved areas. Title VII exposure in
residency was curiously associated with a reduction in likelihood of primary care and
rural careers and even had a smaller but significant negative effect for family
medicine. Title VII exposure in medical school interacted with debt and scholarships
to increase likelihood of practice in rural areas but not of serving in the NHSC.
Hypothesis 9: Attending public medical school strongly increased likelihood of family medicine
practice and significantly increased all other outcomes (primary care practice, health
centers, rural practice, and underserved area practice). Attending a medical school in
a rural area substantially increased the likelihood of future rural practice.
21

Figure 2. Relative Likelihood of Choosing a Primary Care Career (Odds Ratios)
4.44†7.05†
0.46†0.53†
0.58†0.91
1.01†1.03
1.10†1.11†1.11†1.15†1.18†1.19†1.22†1.27†
1.38†1.45†
1.05†
0.10 1.00 10.00
Relative expected income
Male
Experience in Title VII funded residency
Medical School debt over $250K*
Age at graduation
Medical School debt $200-$250K*
Year of medical school graduation
Medical School debt $1-$50K*
Experience in Title VII funded school
Medical School debt $150-$200K*
Medical School debt $100-$150K*
Medical School debt $50-$100K*
Medical school is community related
Married
Public medical school
Medical School is in rural area
Born in rural county
NHSC scholarship
NHSC Loan repayment
Interpreting the display: The odds that someone in the NHSC Loan Repayment program (top bar) will make a career of primary care medicine are 7.05 times as great as the odds of someone not in the program. † Statistically Significant (Confidence interval do not cross 1.0)Red bars identify odds ratios > 2.0 or < 0.5, indicating particularly strong positive or negative associations.* Reference variable: no debtSee Appendix B, Table B1 for full logistic regression outputs and goodness-of-fit statistics.
22
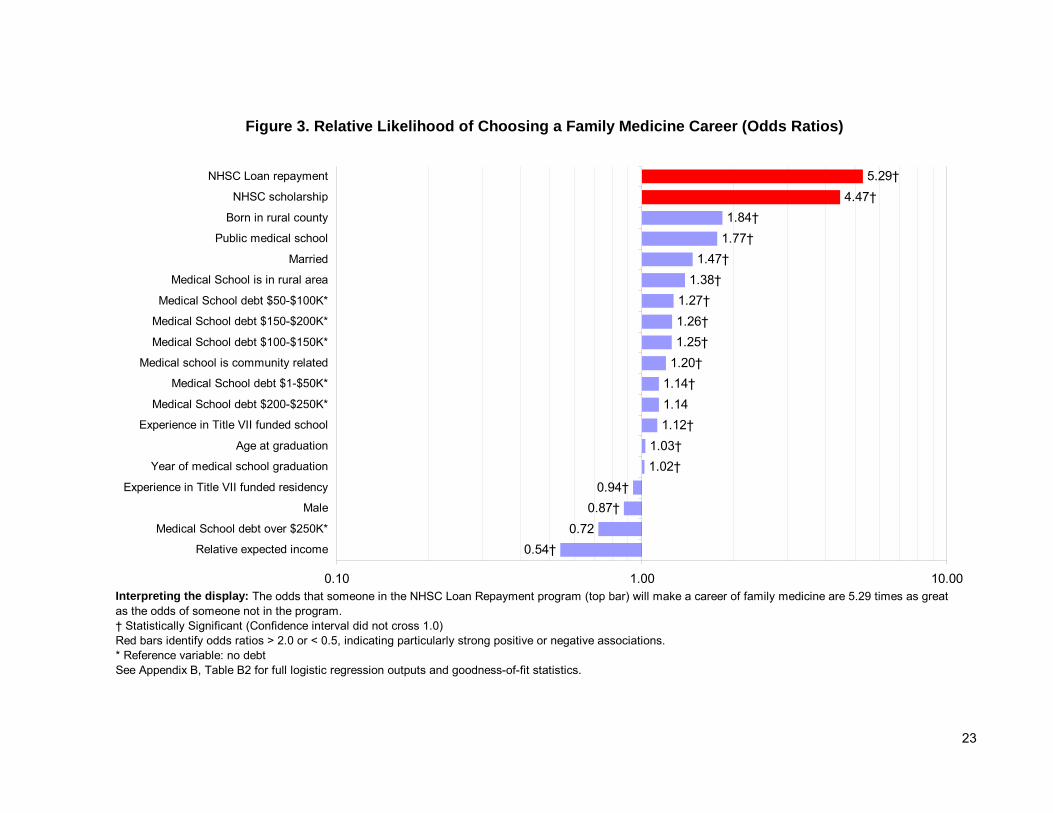
Figure 3. Relative Likelihood of Choosing a Family Medicine Career (Odds Ratios)
4.47†5.29†
0.87†
1.84†1.77†
1.47†1.38†
1.27†1.26†1.25†
1.20†1.14†1.141.12†
1.03†1.02†
0.94†
0.720.54†
0.10 1.00 10.00
Relative expected income
Medical School debt over $250K*
Male
Experience in Title VII funded residency
Year of medical school graduation
Age at graduation
Experience in Title VII funded school
Medical School debt $200-$250K*
Medical School debt $1-$50K*
Medical school is community related
Medical School debt $100-$150K*
Medical School debt $150-$200K*
Medical School debt $50-$100K*
Medical School is in rural area
Married
Public medical school
Born in rural county
NHSC scholarship
NHSC Loan repayment
Interpreting the display: The odds that someone in the NHSC Loan Repayment program (top bar) will make a career of family medicine are 5.29 times as great as the odds of someone not in the program. † Statistically Significant (Confidence interval did not cross 1.0)Red bars identify odds ratios > 2.0 or < 0.5, indicating particularly strong positive or negative associations.* Reference variable: no debtSee Appendix B, Table B2 for full logistic regression outputs and goodness-of-fit statistics.
23
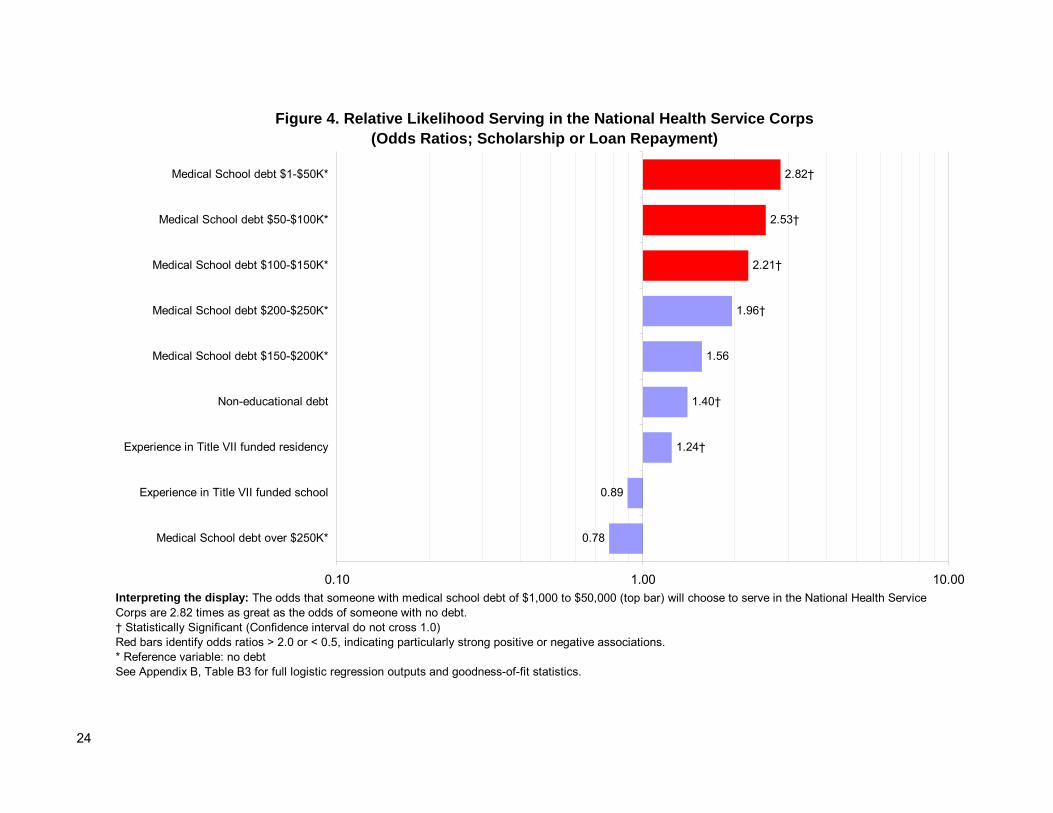
Figure 4. Relative Likelihood Serving in the National Health Service Corps (Odds Ratios; Scholarship or Loan Repayment)
0.78
2.53†
2.82†
2.21†
1.96†
1.56
1.40†
1.24†
0.89
0.10 1.00 10.00
Medical School debt over $250K*
Experience in Title VII funded school
Experience in Title VII funded residency
Non-educational debt
Medical School debt $150-$200K*
Medical School debt $200-$250K*
Medical School debt $100-$150K*
Medical School debt $50-$100K*
Medical School debt $1-$50K*
Interpreting the display: The odds that someone with medical school debt of $1,000 to $50,000 (top bar) will choose to serve in the National Health Service Corps are 2.82 times as great as the odds of someone with no debt. † Statistically Significant (Confidence interval do not cross 1.0)Red bars identify odds ratios > 2.0 or < 0.5, indicating particularly strong positive or negative associations.* Reference variable: no debtSee Appendix B, Table B3 for full logistic regression outputs and goodness-of-fit statistics.
24
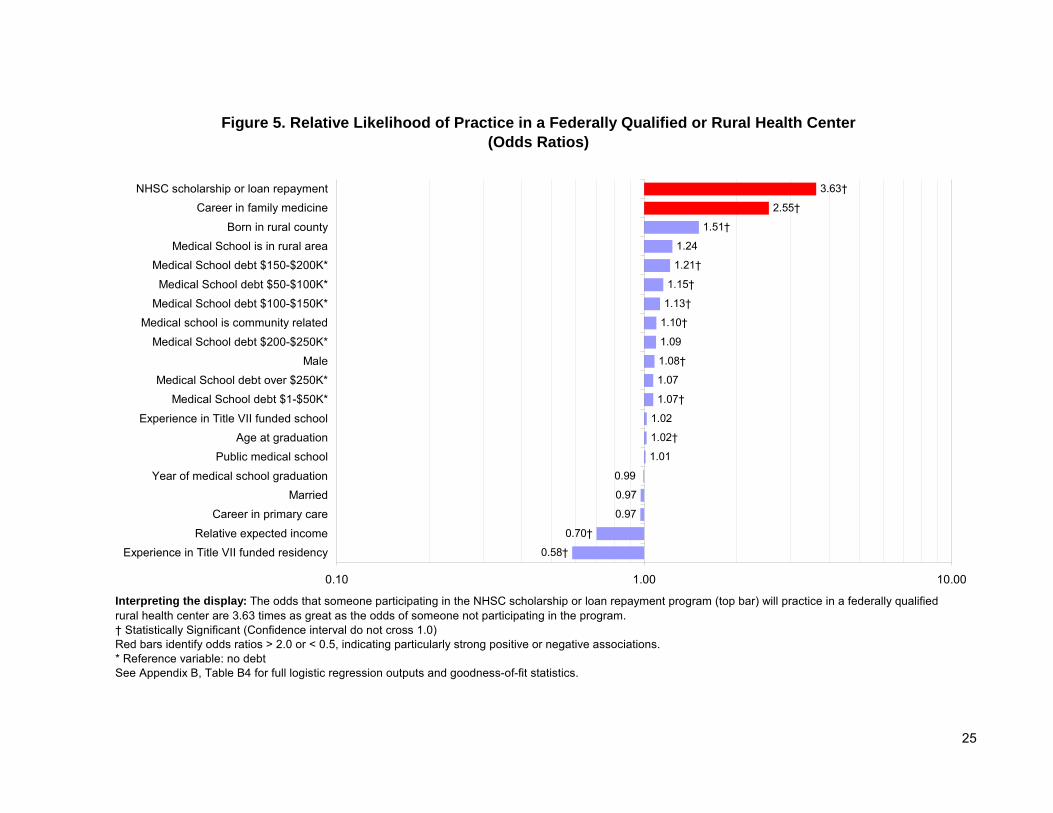
Figure 5. Relative Likelihood of Practice in a Federally Qualified or Rural Health Center (Odds Ratios)
2.55†
3.63†
1.08†
1.09
1.10†
0.58†
0.70†
0.97
0.97
0.99
1.01
1.02†
1.02
1.07†
1.07
1.13†
1.15†
1.21†
1.24
1.51†
0.10 1.00 10.00
Experience in Title VII funded residencyRelative expected income
Career in primary careMarried
Year of medical school graduation
Public medical schoolAge at graduation
Experience in Title VII funded school
Medical School debt $1-$50K*Medical School debt over $250K*
MaleMedical School debt $200-$250K*
Medical school is community relatedMedical School debt $100-$150K*
Medical School debt $50-$100K*
Medical School debt $150-$200K*Medical School is in rural area
Born in rural county
Career in family medicineNHSC scholarship or loan repayment
Interpreting the display: The odds that someone participating in the NHSC scholarship or loan repayment program (top bar) will practice in a federally qualified rural health center are 3.63 times as great as the odds of someone not participating in the program. † Statistically Significant (Confidence interval do not cross 1.0)Red bars identify odds ratios > 2.0 or < 0.5, indicating particularly strong positive or negative associations.* Reference variable: no debtSee Appendix B, Table B4 for full logistic regression outputs and goodness-of-fit statistics.
25
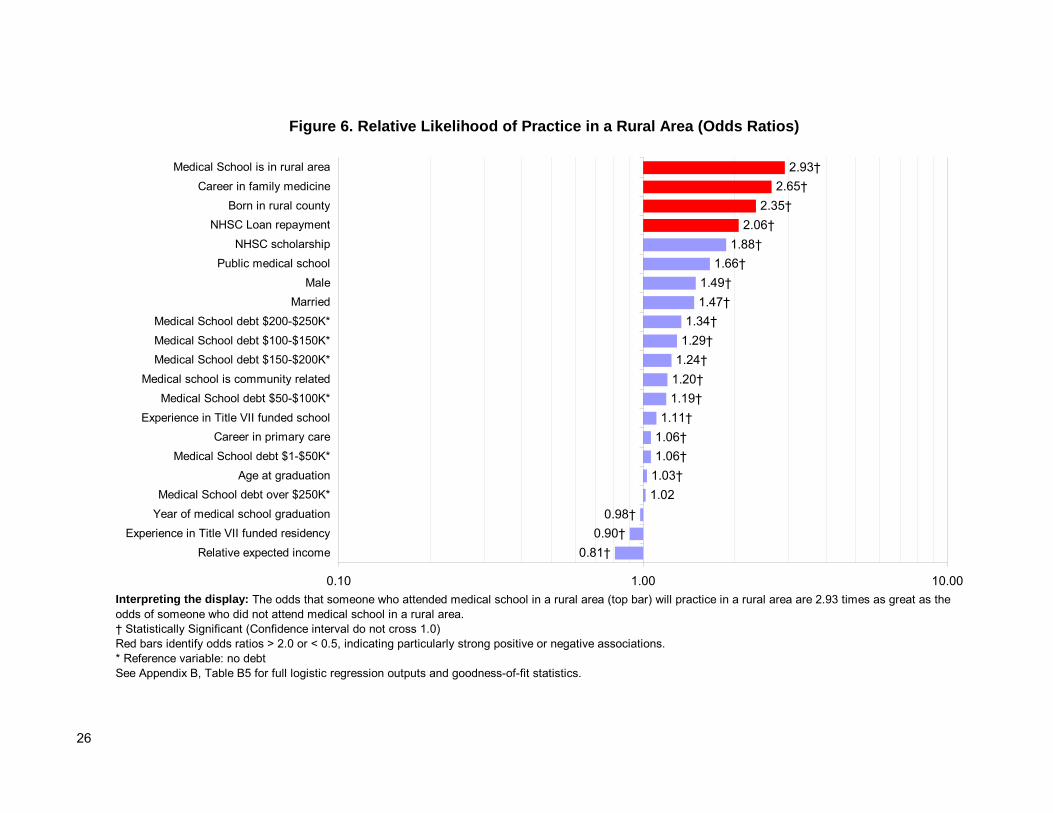
Figure 6. Relative Likelihood of Practice in a Rural Area (Odds Ratios)
2.65†2.93†
0.81†0.90†
0.98†1.021.03†1.06†1.06†1.11†
1.19†1.20†1.24†1.29†1.34†
1.47†1.49†
1.66†1.88†
2.06†2.35†
0.10 1.00 10.00
Relative expected incomeExperience in Title VII funded residency
Year of medical school graduationMedical School debt over $250K*
Age at graduationMedical School debt $1-$50K*
Career in primary careExperience in Title VII funded school
Medical School debt $50-$100K*Medical school is community related
Medical School debt $150-$200K*Medical School debt $100-$150K*Medical School debt $200-$250K*
MarriedMale
Public medical schoolNHSC scholarship
NHSC Loan repaymentBorn in rural county
Career in family medicineMedical School is in rural area
Interpreting the display: The odds that someone who attended medical school in a rural area (top bar) will practice in a rural area are 2.93 times as great as the odds of someone who did not attend medical school in a rural area. † Statistically Significant (Confidence interval do not cross 1.0)Red bars identify odds ratios > 2.0 or < 0.5, indicating particularly strong positive or negative associations.* Reference variable: no debtSee Appendix B, Table B5 for full logistic regression outputs and goodness-of-fit statistics.
26
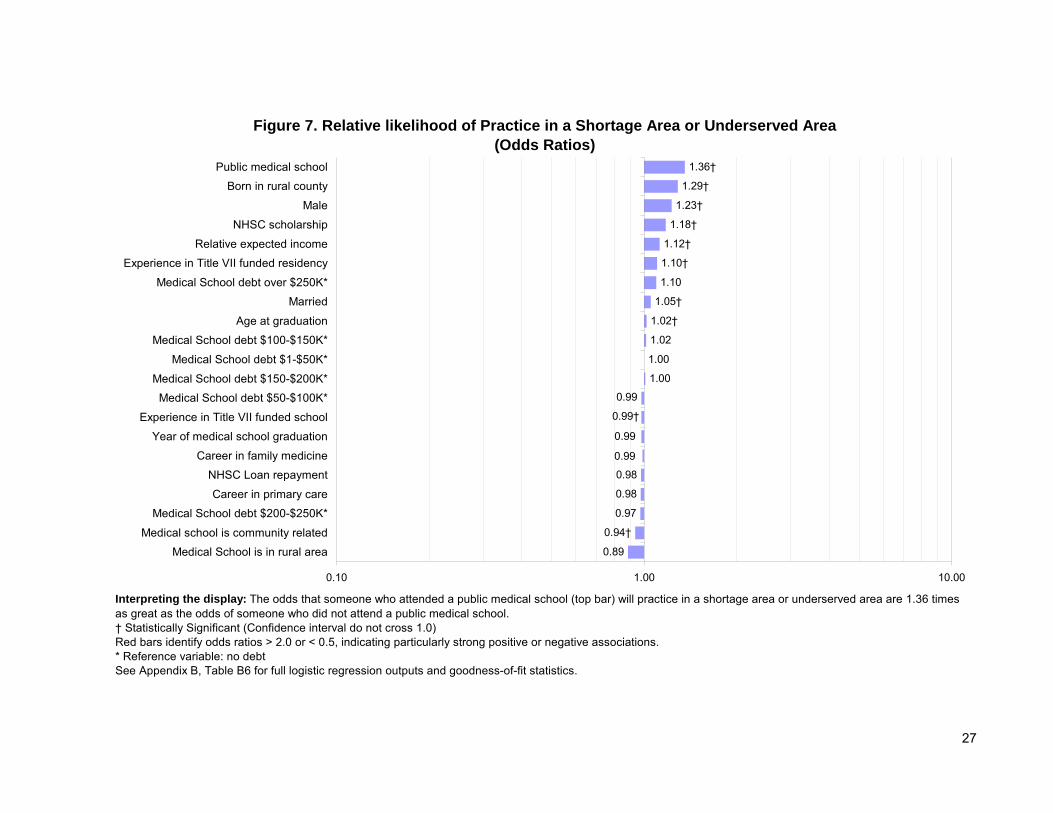
Figure 7. Relative likelihood of Practice in a Shortage Area or Underserved Area (Odds Ratios)
0.89
0.97
0.98
1.00
1.00
0.99
0.99
1.29†
1.36†
1.05†
0.99†
0.94†
0.98
0.99
1.02
1.02†
1.10
1.10†
1.12†
1.18†
1.23†
0.10 1.00 10.00
Medical School is in rural area
Medical school is community related
Medical School debt $200-$250K*
Career in primary care
NHSC Loan repayment
Career in family medicine
Year of medical school graduation
Experience in Title VII funded school
Medical School debt $50-$100K*
Medical School debt $150-$200K*
Medical School debt $1-$50K*
Medical School debt $100-$150K*
Age at graduation
Married
Medical School debt over $250K*
Experience in Title VII funded residency
Relative expected income
NHSC scholarship
Male
Born in rural county
Public medical school
Interpreting the display: The odds that someone who attended a public medical school (top bar) will practice in a shortage area or underserved area are 1.36 times as great as the odds of someone who did not attend a public medical school. † Statistically Significant (Confidence interval do not cross 1.0)Red bars identify odds ratios > 2.0 or < 0.5, indicating particularly strong positive or negative associations.* Reference variable: no debtSee Appendix B, Table B6 for full logistic regression outputs and goodness-of-fit statistics.
27
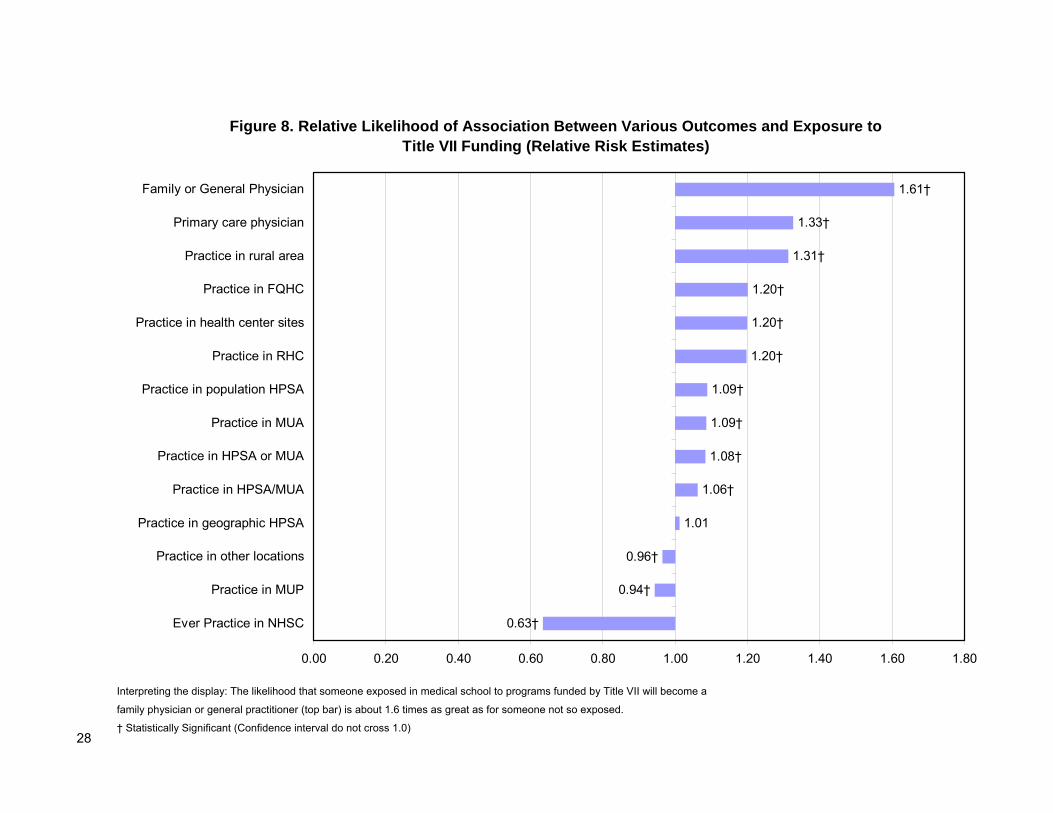
Figure 8. Relative Likelihood of Association Between Various Outcomes and Exposure to Title VII Funding (Relative Risk Estimates)
1.01
1.61†
1.33†
1.31†
1.20†
1.20†
1.20†
1.09†
1.09†
1.08†
1.06†
0.96†
0.94†
0.63†
0.00 0.20 0.40 0.60 0.80 1.00 1.20 1.40 1.60 1.80
Ever Practice in NHSC
Practice in MUP
Practice in other locations
Practice in geographic HPSA
Practice in HPSA/MUA
Practice in HPSA or MUA
Practice in MUA
Practice in population HPSA
Practice in RHC
Practice in health center sites
Practice in FQHC
Practice in rural area
Primary care physician
Family or General Physician
Interpreting the display: The likelihood that someone exposed in medical school to programs funded by Title VII will become a
family physician or general practitioner (top bar) is about 1.6 times as great as for someone not so exposed.
† Statistically Significant (Confidence interval do not cross 1.0)
28

Figure 9a. Title VII Exposure, Debt and Obligating Scholarships* in Relation To Selected Outcomes:
Choice of Primary Care Specialty
7.10%
9.20%
10.40%
12.90%
14.50%
11.00%
15.70%
18.10%
26.00%
28.30%
33.00%
30.90%
37.30%
30.80%
36.00%
41.90%
0.00% 5.00% 10.00% 15.00% 20.00% 25.00% 30.00% 35.00% 40.00% 45.00%
NO Exposure, NO Debt, NO scholarship(N=7,939)
NO Exposure, Debt, NO scholarship(N=18,621)
Exposure, NO Debt, NO scholarship(N=24,870)
NO Exposure, NO Debt, Scholarship(N=3,645)
Exposure, Debt, NO scholarship (N=60,633)
NO Exposure, Debt, Scholarship (N=20,920)
Exposure, NO Debt, Scholarship (N=9,070)
Exposure, Debt, Scholarship (N=76,527)
Ever FP/GP Ever primary care physician
Interpreting the display: Of respondents who had no exposure to Title VII programs, no debt and no NHSC or armed forces scholarship (top pair of bars), about 7% ever practiced as a family physician or general practitioner, and about 26% ever practiced as a primary care physician.
*NHSC and armed forces scholarships.
29
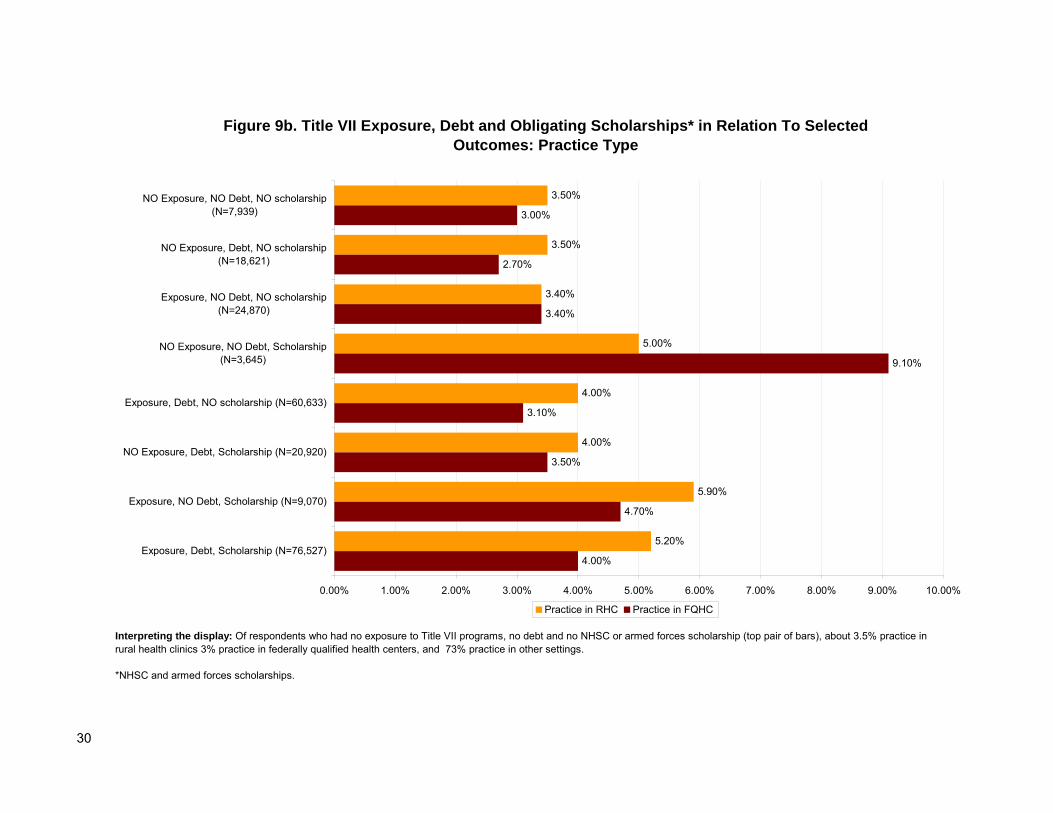
Figure 9b. Title VII Exposure, Debt and Obligating Scholarships* in Relation To Selected Outcomes: Practice Type
3.50%
3.50%
3.40%
5.00%
4.00%
4.00%
5.90%
5.20%
3.00%
2.70%
3.40%
9.10%
3.10%
3.50%
4.70%
4.00%
0.00% 1.00% 2.00% 3.00% 4.00% 5.00% 6.00% 7.00% 8.00% 9.00% 10.00%
NO Exposure, NO Debt, NO scholarship(N=7,939)
NO Exposure, Debt, NO scholarship(N=18,621)
Exposure, NO Debt, NO scholarship(N=24,870)
NO Exposure, NO Debt, Scholarship(N=3,645)
Exposure, Debt, NO scholarship (N=60,633)
NO Exposure, Debt, Scholarship (N=20,920)
Exposure, NO Debt, Scholarship (N=9,070)
Exposure, Debt, Scholarship (N=76,527)
Practice in RHC Practice in FQHC
Interpreting the display: Of respondents who had no exposure to Title VII programs, no debt and no NHSC or armed forces scholarship (top pair of bars), about 3.5% practice in rural health clinics 3% practice in federally qualified health centers, and 73% practice in other settings.
*NHSC and armed forces scholarships.
30
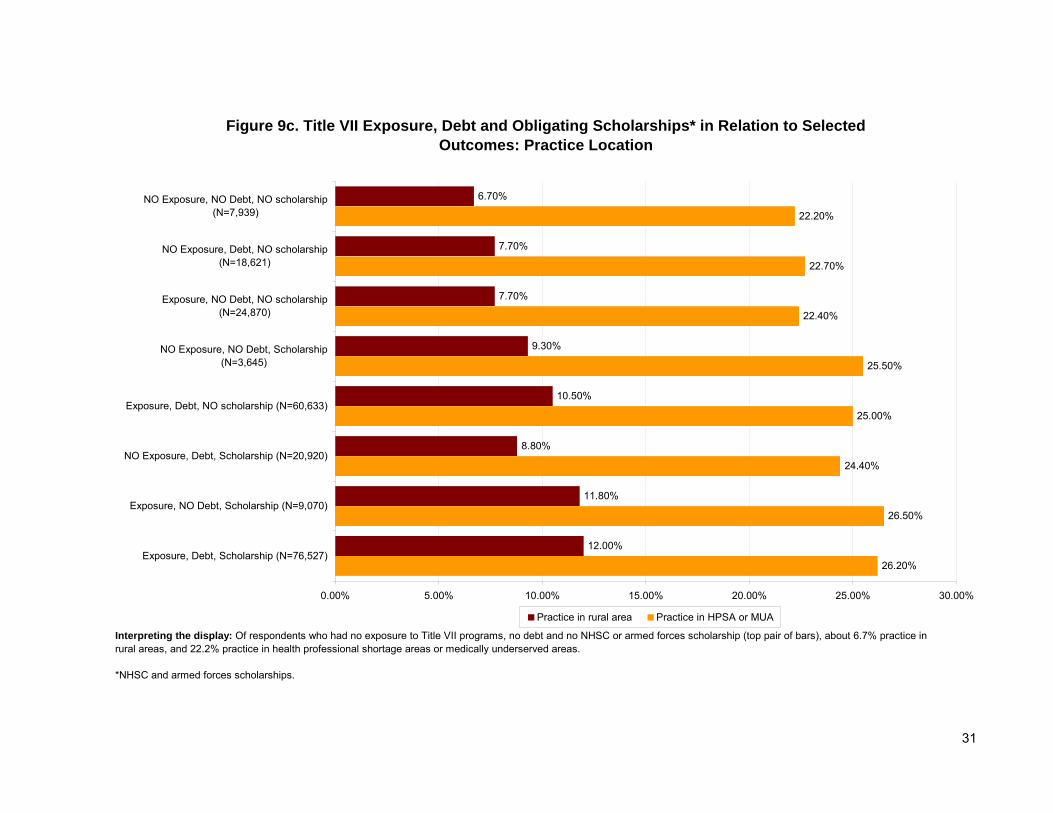
Figure 9c. Title VII Exposure, Debt and Obligating Scholarships* in Relation to Selected Outcomes: Practice Location
6.70%
7.70%
7.70%
9.30%
10.50%
8.80%
11.80%
12.00%
22.20%
22.70%
22.40%
25.50%
25.00%
24.40%
26.50%
26.20%
0.00% 5.00% 10.00% 15.00% 20.00% 25.00% 30.00%
NO Exposure, NO Debt, NO scholarship(N=7,939)
NO Exposure, Debt, NO scholarship(N=18,621)
Exposure, NO Debt, NO scholarship(N=24,870)
NO Exposure, NO Debt, Scholarship(N=3,645)
Exposure, Debt, NO scholarship (N=60,633)
NO Exposure, Debt, Scholarship (N=20,920)
Exposure, NO Debt, Scholarship (N=9,070)
Exposure, Debt, Scholarship (N=76,527)
Practice in rural area Practice in HPSA or MUA
Interpreting the display: Of respondents who had no exposure to Title VII programs, no debt and no NHSC or armed forces scholarship (top pair of bars), about 6.7% practice in rural areas, and 22.2% practice in health professional shortage areas or medically underserved areas.
*NHSC and armed forces scholarships.
31
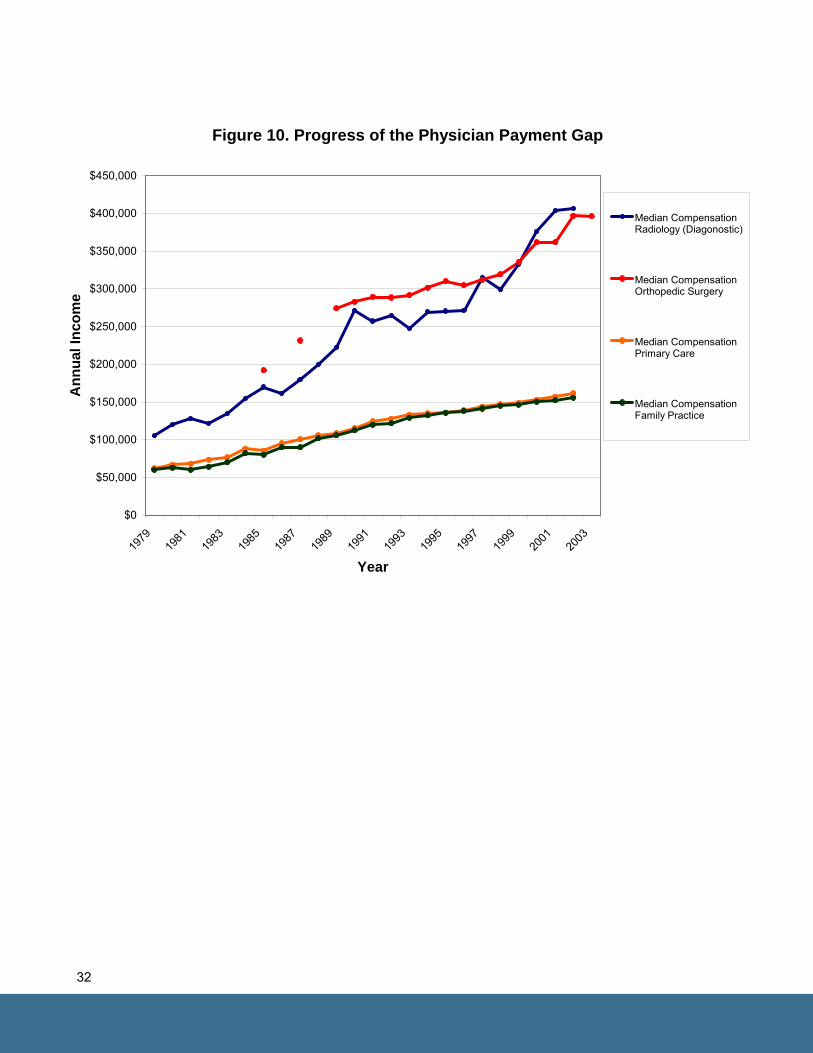
Figure 10. Progress of the Physician Payment Gap
$0
$50,000
$100,000
$150,000
$200,000
$250,000
$300,000
$350,000
$400,000
$450,000
1979
1981
1983
1985
1987
1989
1991
1993
1995
1997
1999
2001
2003
Year
Ann
ual I
ncom
e
Median CompensationRadiology (Diagonostic)
Median CompensationOrthopedic Surgery
Median CompensationPrimary Care
Median CompensationFamily Practice
32

Chapter Five Title VII Effect, Personal Interests, and Experiences in Medical School There is considerable evidence that Title VII is associated with increasing trainee selection of primary care, rural, and underserved practice, but the means of this effect has not been
demonstrated.
Aim To understand the association of Title VII exposure in medical school with career choice and with
perceptions of primary care training and underserved populations while in medical school.
Hypothesis 4: Students exposed to Title VII in medical school will have measurably better
assessments of their training experiences in primary care with underserved
populations.
Aim To understand how the quality of primary care training experiences, experiences with underserved
populations in medical school, and interest in underserved populations affect subsequent decisions about
specialty and practice location.
Hypothesis 7: There will be differences in choice of primary care specialty or in practice location
associated with the quality (or presence) of such experiences in medical school.
Hypothesis 8: Medical school rotations in rural and inner-city underserved locations will predict
primary care and service careers.
Hypothesis 10: Students’ intentions to care for underserved populations and to enter primary care
will be highly correlated with later practice patterns.
Findings The presence of Title VII funding to both medical schools and departments of family medicine while
students were matriculated proved to have a strong effect on student assessments of their primary care
33
Schools and residency programs that can foster interest in serving disadvantaged populations and create training experiences with them may enhance choice of
primary care careers.
experience regardless of where they ultimately practiced (Figure 11). This supports prior contention that it
exerts some of its effect via curriculum and the quality of training experience.(64)
Primary care and family medicine physicians were moderately more likely as students to rate their primary
care experience as being excellent than were subspecialists, regardless of where their practice was
located (Table 3). Title VII may be an important mediator of students choosing primary care careers since
it is associated with a greater likelihood of a good primary care experience.
Primary care physicians Primary care physicians were more likely as students to
express interest in serving minority populations and
serving in socially deprived or underserved areas than
were subspecialists (Table 3). Interest in service in
underserved areas was particularly predictive of primary
care careers regardless of whether the physician wound
up in underserved area. Interest in certifying in a primary
care specialty was not predictive of all primary care
specialties but was slightly significant for family
physicians. These findings suggest that altruistic student
intent may have a stronger association with students
who will choose primary care careers than does
students’ expressed interest in a primary care career. It also suggests that schools and residency
programs that can foster interest in serving disadvantaged populations and create training experiences
with them may enhance choice of primary care careers.
Practice in a Rural Health Center The relative risk of working in an RHC nearly quadrupled for students interested in serving in an
underserved area (Table 3). It was also substantially higher if students had clerkships in family medicine,
rural experiences, planned to certify in primary care or serve in a socially deprived area. Physicians
completing primary care residency were nearly twice as likely to work in a rural health center.
Practice in a Federally Qualified Health Center The likelihood of practicing in an FQHC was nearly tripled by interest in serving an underserved
population and more than doubled by an interest in serving a minority population (Table 3). It was also
significantly increased by school experiences delivering care to underserved people and by inner city and
primary care electives (experiences selected in the fourth year of medical school).
34
Practice in a HPSA or MUA/P
The relative risk of working in any one of the four shortage or underserved areas were only slightly
increased by interest in serving an underserved population or a community-based rural training
experience (Table 3). Focusing on geographic HPSAs, the most pure of shortage areas, intent to serve
underserved areas or minority populations increased the relative risk by more than two and nearly two,
respectively. Training in primary care, community health electives, and highly rating one’s primary care
elective all significantly increased the relative risk of working in a geographic HPSA. Rural community
medicine electives and experiencing a family medicine clerkship both significantly increased the relative
risk of practicing in a MUP.
National Health Service Corps The NHSC appears to be a strong calling for students with intentions to serve minority populations, to
serve underserved populations, and particularly those with an interest in working in underserved areas
(Table 3). Each of these was significant multipliers of the relative risk of this outcome. Experiences in
community health and underserved populations were robustly associated with an increased relative risk
of this outcome. These students were more likely to plan primary care careers and to do primary care
residencies. Curiously, the higher the quality of their primary care experiences in medical school, the less
likely they were to choose NHSC.
Rural Practice Intention to serve underserved populations more than tripled the relative risk of this practice outcome and
rural experiences in medical school doubled it. Family medicine and community medicine experiences
both had significant effects. Title VII funding is also associated with significant increase in likelihood of
rural practice.
Summary:
Hypothesis 2: Students exposed to Title VII in medical school were significantly more likely to have
primary care and family medicine training experiences and to rate them as excellent
or very good compared to students in schools that did not have Title VII funding.
Rural experiences were also more likely to occur in funded schools. Students were
less likely to have inner-city community medicine experiences in schools receiving
Title VII funding than those not receiving funding.
Hypothesis 7: While intentions to serve underserved or minority populations were more profoundly
associated with an increased likelihood to practice in primary care or underserved
areas, there was also a significantly increased likelihood of primary care specialty or
35
in practice location associated with the presence and quality of such experiences in
medical school.
Hypothesis 8: Medical school rotations in inner-city locations increased the likelihood of serving in
an FQHC. Rural rotations were associated with increased likelihood of most study
outcomes, especially rural practice.
Hypothesis 10: Intentions to serve underserved or minority populations were profoundly associated
with an increased likelihood to practice in primary care, health centers, rural areas,
and underserved areas.
36

Figure 11. Relative Likelihood of Association Between Various Medical School Experiences and Exposure to Programs Funded by Title VII (Relative Risk Estimates)
0.91†
1.01†
1.01†
1.04†
1.08†
1.25†
1.21†
1.21†
1.20†
1.18†
1.09†
1.09†
0.80 0.85 0.90 0.95 1.00 1.05 1.10 1.15 1.20 1.25 1.30
Community medicine inner cityexperience
Clinical elective caring for theunderserved
Primary care clerkship
Field experience in communityhealth
Clinical experience in inner city
Elective in primary care
Community medicine ruralexperience
Clinical experience in ruralcommunity
Primary care elective excellent
Primary care elective very good orexcellent
Family-community medicineclerkship
Assessed quality of family medicineclerkship as excellent
Interpreting the display: The likelihood that someone exposed to Title VII funding will give a positive assessment of the quality of his or her family medicine clerkship (top bar) is about 1.2 times as great as for someone not so exposed. † Statistically Significant (Confidence interval do not cross 1.0)
37
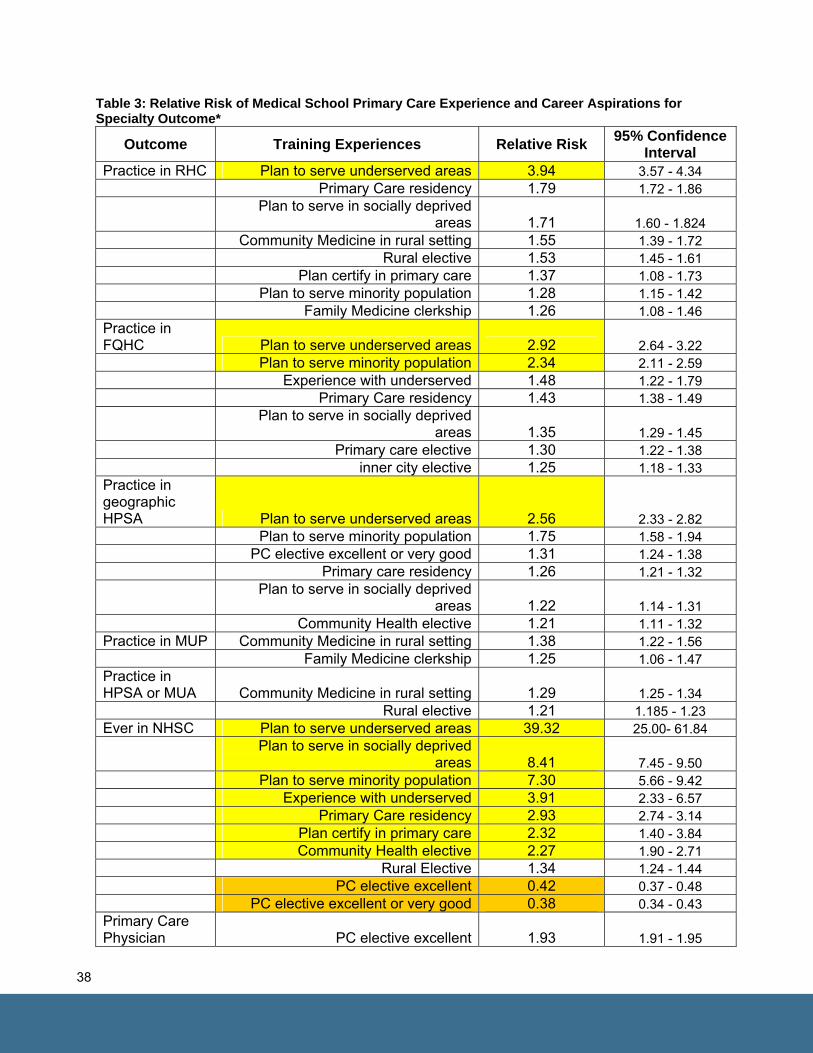
Table 3: Relative Risk of Medical School Primary Care Experience and Career Aspirations for Specialty Outcome*
Outcome Training Experiences Relative Risk 95% Confidence Interval
Practice in RHC Plan to serve underserved areas 3.94 3.57 - 4.34 Primary Care residency 1.79 1.72 - 1.86
Plan to serve in socially deprived areas 1.71 1.60 - 1.824
Community Medicine in rural setting 1.55 1.39 - 1.72 Rural elective 1.53 1.45 - 1.61 Plan certify in primary care 1.37 1.08 - 1.73 Plan to serve minority population 1.28 1.15 - 1.42 Family Medicine clerkship 1.26 1.08 - 1.46 Practice in FQHC Plan to serve underserved areas 2.92 2.64 - 3.22 Plan to serve minority population 2.34 2.11 - 2.59 Experience with underserved 1.48 1.22 - 1.79 Primary Care residency 1.43 1.38 - 1.49
Plan to serve in socially deprived areas 1.35 1.29 - 1.45
Primary care elective 1.30 1.22 - 1.38 inner city elective 1.25 1.18 - 1.33 Practice in geographic HPSA Plan to serve underserved areas 2.56 2.33 - 2.82 Plan to serve minority population 1.75 1.58 - 1.94 PC elective excellent or very good 1.31 1.24 - 1.38 Primary care residency 1.26 1.21 - 1.32
Plan to serve in socially deprived areas 1.22 1.14 - 1.31
Community Health elective 1.21 1.11 - 1.32 Practice in MUP Community Medicine in rural setting 1.38 1.22 - 1.56 Family Medicine clerkship 1.25 1.06 - 1.47 Practice in HPSA or MUA Community Medicine in rural setting 1.29 1.25 - 1.34 Rural elective 1.21 1.185 - 1.23 Ever in NHSC Plan to serve underserved areas 39.32 25.00- 61.84
Plan to serve in socially deprived areas 8.41 7.45 - 9.50
Plan to serve minority population 7.30 5.66 - 9.42 Experience with underserved 3.91 2.33 - 6.57 Primary Care residency 2.93 2.74 - 3.14 Plan certify in primary care 2.32 1.40 - 3.84 Community Health elective 2.27 1.90 - 2.71 Rural Elective 1.34 1.24 - 1.44 PC elective excellent 0.42 0.37 - 0.48 PC elective excellent or very good 0.38 0.34 - 0.43 Primary Care Physician PC elective excellent 1.93 1.91 - 1.95
38
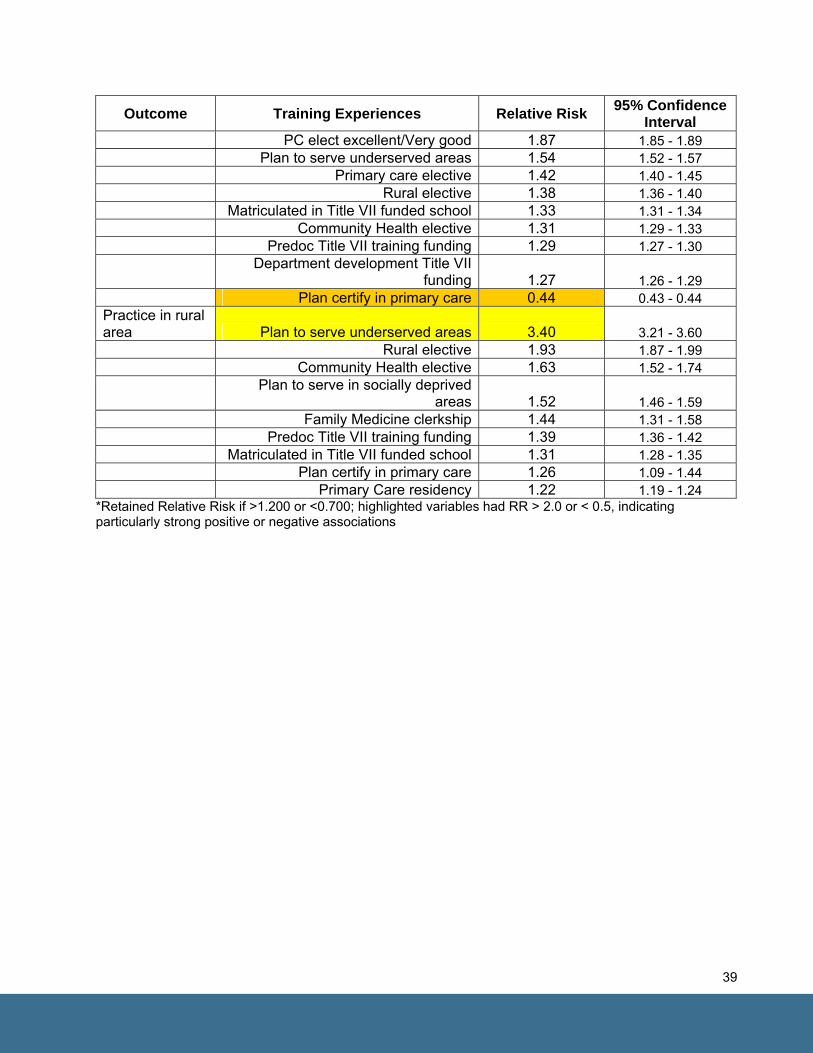
Outcome Training Experiences Relative Risk 95% Confidence Interval
PC elect excellent/Very good 1.87 1.85 - 1.89 Plan to serve underserved areas 1.54 1.52 - 1.57 Primary care elective 1.42 1.40 - 1.45 Rural elective 1.38 1.36 - 1.40 Matriculated in Title VII funded school 1.33 1.31 - 1.34 Community Health elective 1.31 1.29 - 1.33 Predoc Title VII training funding 1.29 1.27 - 1.30
Department development Title VII funding 1.27 1.26 - 1.29
Plan certify in primary care 0.44 0.43 - 0.44 Practice in rural area Plan to serve underserved areas 3.40 3.21 - 3.60 Rural elective 1.93 1.87 - 1.99 Community Health elective 1.63 1.52 - 1.74
Plan to serve in socially deprived areas 1.52 1.46 - 1.59
Family Medicine clerkship 1.44 1.31 - 1.58 Predoc Title VII training funding 1.39 1.36 - 1.42 Matriculated in Title VII funded school 1.31 1.28 - 1.35 Plan certify in primary care 1.26 1.09 - 1.44 Primary Care residency 1.22 1.19 - 1.24
*Retained Relative Risk if >1.200 or <0.700; highlighted variables had RR > 2.0 or < 0.5, indicating particularly strong positive or negative associations
39
The income gap that stratifies much of society often stratifies the physician
community as well.
Chapter Six Return on Investment Return on Investment may compound the effects of a physician specialty income gap
Aim To understand the Return on Investment of student specialty choices, and the significance of debt at
graduation from medical school on ROI (depending on specialty choice).
Hypothesis 3: There will be measurable differences in ROI for students choosing subspecialty
careers over primary care and debt at graduation will exacerbate these differences.
Findings
We found that the annual income gap between primary care specialties and highly compensated
specialists (radiology or orthopedic surgery) is associated with dramatic reductions in choice of primary
care careers. Information on this difference is readily available to students. We were interested to
understand how this annual difference relates to a career-long
difference in the return on investment yielded by students’
career choices. People can rarely access information on career
ROI, but they see the differences in the lifestyles, offices, and
personal property of their physician-teachers and role models.
The income gap that stratifies much of society often stratifies
the physician community as well, in terms of where they live,
the types of cars they drive, and which universities their
children attend. It is also reflected in where they work; the
“heart hospital” side of a medical campus may have fountains
and artwork, while the mental image of the primary care offices
is a necessarily full waiting room of a practice where physicians see 40 or more patients a day. Many of
the cognitive subspecialties that don’t have well-reimbursed procedures and technology, or that depend
on Medicaid and other low-margin insurance streams, like pediatric subspecialists, share primary care’s
lower career ROI and struggle to compete for students. Our goal is not to bemoan the career ROI of
primary care physicians, most of whom will still occupy the top 10% of the US income strata. It is to show
40
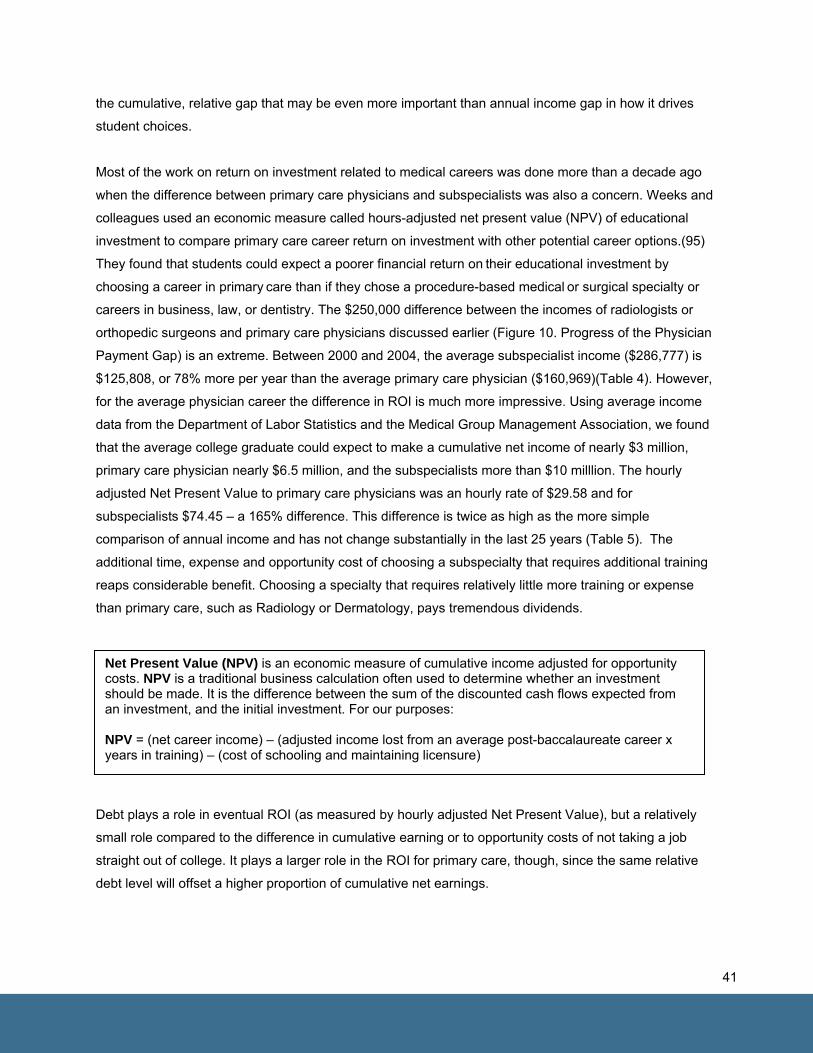
the cumulative, relative gap that may be even more important than annual income gap in how it drives
student choices.
Most of the work on return on investment related to medical careers was done more than a decade ago
when the difference between primary care physicians and subspecialists was also a concern. Weeks and
colleagues used an economic measure called hours-adjusted net present value (NPV) of educational
investment to compare primary care career return on investment with other potential career options.(95)
They found that students could expect a poorer financial return on their educational investment by
choosing a career in primary care than if they chose a procedure-based medical or surgical specialty or
careers in business, law, or dentistry. The $250,000 difference between the incomes of radiologists or
orthopedic surgeons and primary care physicians discussed earlier (Figure 10. Progress of the Physician
Payment Gap) is an extreme. Between 2000 and 2004, the average subspecialist income ($286,777) is
$125,808, or 78% more per year than the average primary care physician ($160,969)(Table 4). However,
for the average physician career the difference in ROI is much more impressive. Using average income
data from the Department of Labor Statistics and the Medical Group Management Association, we found
that the average college graduate could expect to make a cumulative net income of nearly $3 million,
primary care physician nearly $6.5 million, and the subspecialists more than $10 milllion. The hourly
adjusted Net Present Value to primary care physicians was an hourly rate of $29.58 and for
subspecialists $74.45 – a 165% difference. This difference is twice as high as the more simple
comparison of annual income and has not change substantially in the last 25 years (Table 5). The
additional time, expense and opportunity cost of choosing a subspecialty that requires additional training
reaps considerable benefit. Choosing a specialty that requires relatively little more training or expense
than primary care, such as Radiology or Dermatology, pays tremendous dividends.
Debt plays a role in eventual ROI (as measured by hourly adjusted Net Present Value), but a relatively
small role compared to the difference in cumulative earning or to opportunity costs of not taking a job
straight out of college. It plays a larger role in the ROI for primary care, though, since the same relative
debt level will offset a higher proportion of cumulative net earnings.
Net Present Value (NPV) is an economic measure of cumulative income adjusted for opportunity costs. NPV is a traditional business calculation often used to determine whether an investment should be made. It is the difference between the sum of the discounted cash flows expected from an investment, and the initial investment. For our purposes: NPV = (net career income) – (adjusted income lost from an average post-baccalaureate career x years in training) – (cost of schooling and maintaining licensure)
41
The cumulative income difference between a subspecialist and a primary care physician is nearly the
same as the cumulative income difference between a primary care physician and an average college
graduate. However, the relative ROI gap between primary care physician and college graduate is smaller
than that between the two physician groups. The smaller gap is because the opportunity cost represented
by the college graduate’s first seven years of income is a much higher proportion of the primary care
physician’s cumulative net earnings than it will be for the subspecialist.
The consistency of the ROI gap between primary care and subspecialty physicians over the three-
decades we studied suggests that the findings for the studies done in the early 1990’s still hold—that ROI
is higher for busines, law and dentistry than for primary care. We did not repeat this comparison but it is
unlikely that these three professions will have lost much ground in ROI. This suggests that primary care is
not only competing with subspecialty care for our best and brightest students, but with other professions
as well. Interestingly, in 2002, when medical school applications dropped to their lowest levels in
decades, applications to law schools were peaking and applications to business schools were also
rising.(96) These trends have sinse reversed, but with little benefit acruing to primary care.
42
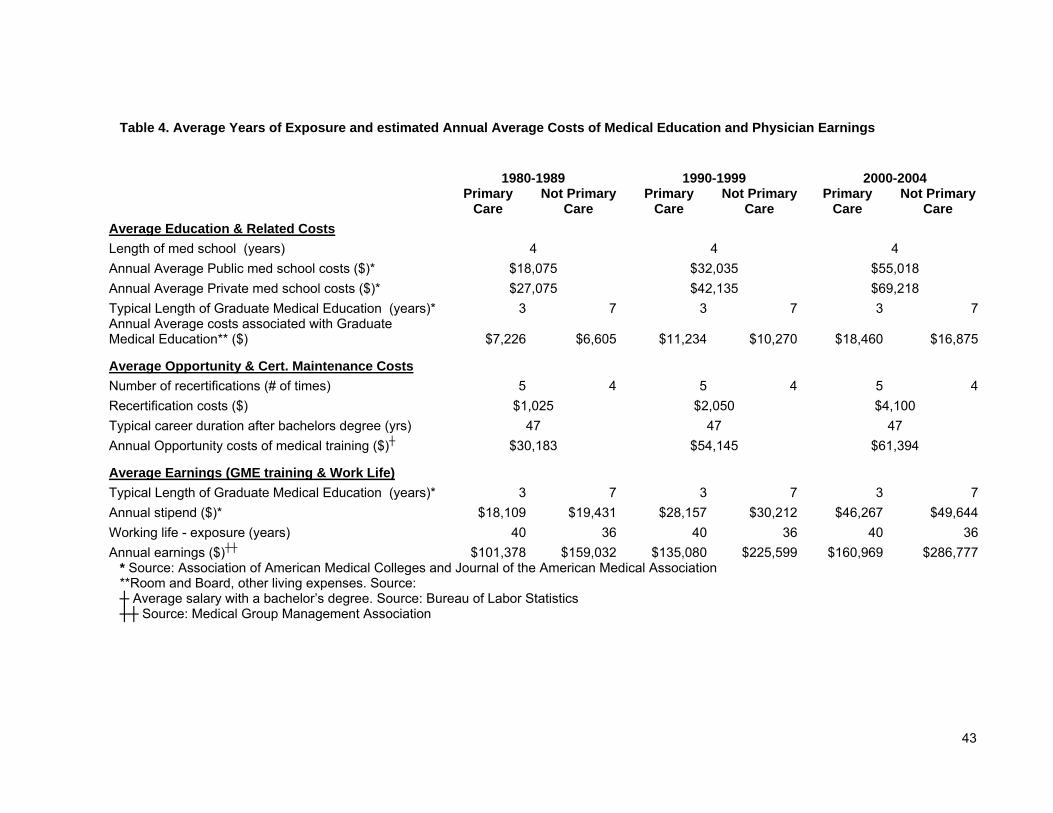
Table 4. Average Years of Exposure and estimated Annual Average Costs of Medical Education and Physician Earnings
1980-1989 1990-1999 2000-2004
Primary
Care Not Primary
Care Primary
Care Not Primary
Care Primary
Care Not Primary
Care Average Education & Related Costs Length of med school (years) 4 4 4 Annual Average Public med school costs ($)* $18,075 $32,035 $55,018 Annual Average Private med school costs ($)* $27,075 $42,135 $69,218 Typical Length of Graduate Medical Education (years)* 3 7 3 7 3 7Annual Average costs associated with Graduate Medical Education** ($) $7,226 $6,605 $11,234 $10,270 $18,460 $16,875
Average Opportunity & Cert. Maintenance Costs Number of recertifications (# of times) 5 4 5 4 5 4Recertification costs ($) $1,025 $2,050 $4,100 Typical career duration after bachelors degree (yrs) 47 47 47 Annual Opportunity costs of medical training ($)┼ $30,183 $54,145 $61,394
Average Earnings (GME training & Work Life) Typical Length of Graduate Medical Education (years)* 3 7 3 7 3 7Annual stipend ($)* $18,109 $19,431 $28,157 $30,212 $46,267 $49,644Working life - exposure (years) 40 36 40 36 40 36Annual earnings ($)┼┼ $101,378 $159,032 $135,080 $225,599 $160,969 $286,777
* Source: Association of American Medical Colleges and Journal of the American Medical Association **Room and Board, other living expenses. Source: ┼ Average salary with a bachelor’s degree. Source: Bureau of Labor Statistics ┼┼ Source: Medical Group Management Association
43
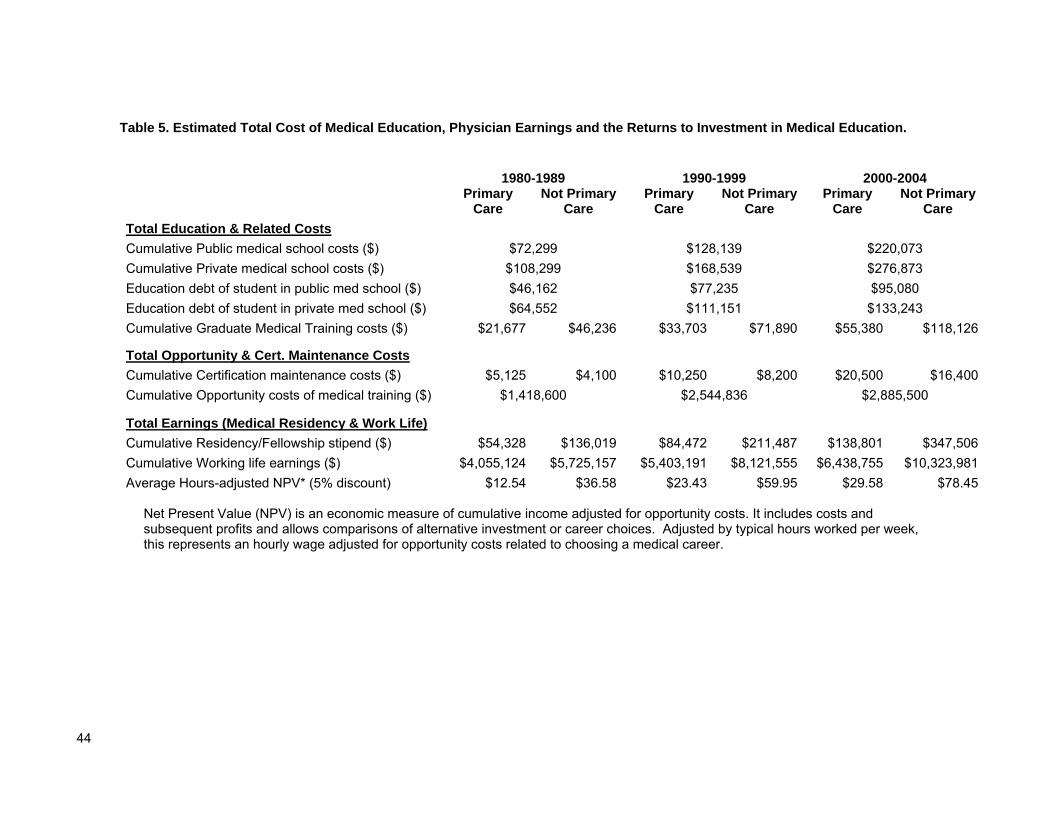
Table 5. Estimated Total Cost of Medical Education, Physician Earnings and the Returns to Investment in Medical Education. 1980-1989 1990-1999 2000-2004
Primary
Care Not Primary
Care Primary
Care Not Primary
Care Primary
Care Not Primary
Care Total Education & Related Costs Cumulative Public medical school costs ($) $72,299 $128,139 $220,073 Cumulative Private medical school costs ($) $108,299 $168,539 $276,873 Education debt of student in public med school ($) $46,162 $77,235 $95,080 Education debt of student in private med school ($) $64,552 $111,151 $133,243 Cumulative Graduate Medical Training costs ($) $21,677 $46,236 $33,703 $71,890 $55,380 $118,126
Total Opportunity & Cert. Maintenance Costs Cumulative Certification maintenance costs ($) $5,125 $4,100 $10,250 $8,200 $20,500 $16,400Cumulative Opportunity costs of medical training ($) $1,418,600 $2,544,836 $2,885,500
Total Earnings (Medical Residency & Work Life) Cumulative Residency/Fellowship stipend ($) $54,328 $136,019 $84,472 $211,487 $138,801 $347,506Cumulative Working life earnings ($) $4,055,124 $5,725,157 $5,403,191 $8,121,555 $6,438,755 $10,323,981Average Hours-adjusted NPV* (5% discount) $12.54 $36.58 $23.43 $59.95 $29.58 $78.45
Net Present Value (NPV) is an economic measure of cumulative income adjusted for opportunity costs. It includes costs and subsequent profits and allows comparisons of alternative investment or career choices. Adjusted by typical hours worked per week, this represents an hourly wage adjusted for opportunity costs related to choosing a medical career.
44
Chapter Seven Conclusions and Recommendations The outcomes we studied--practicing in primary care, practicing in family medicine, practicing in a rural
community, practicing in a health center, practicing in an underserved area, ever having served in the
National Health Service Corps--are important for securing access to sustaining health care relationships
for all people in the United States. The capacity to connect long-term career choice outcomes over 25
years to medical student survey data, AMA Masterfile data, Medicare data, NHSC data, and Title VII
funding data is an important step forward in understanding the factors that affect student career choice. It
permitted robust re-testing of important past research, and helped begin filling in holes in our
understanding.
Lessons learned about our outcomes:
• Primary care physicians now make up slightly more than 1/3rd of the physician workforce, yet only
slightly more than 1/5th of our current students are interested in a primary care career.(45) This
discrepancy gives little hope of resolving a long-standing specialty maldistribution or securing patient
centered medical homes for all Americans. The resulting dependence on international medical
graduates to shore up our primary care workforce is unethical as it directly and indirectly deprives
many developing countries.(97)
• Less than 10% of physicians practice in rural areas where more than 20% of the US population lives.
In 2003, the US Government Accountability Office found that the physician workforce had grown
faster than the US population but that this growth had not resolved the geographic
maldistribution.(98) Fewer new physicians are choosing to practice in rural areas.
• Only 3% of allopathic physicians are currently located in the most underserved of US communities--
geographic Health Professional Shortage Areas. The proportion in Medically Underserved Population
areas is similarly small and fewer physicians are serving populations in these areas except through
Federally Qualified Health Centers, Rural Health Centers, and the National Health Service Corps.
• At least one in ten allopathic physicians spends some time caring for patients in an FQHC or RHC.
Community health centers are the cornerstone of current Federal policy for securing access to
primary care services for the un- and underinsured in the US and considerable resources have been
poured into rapidly expanding their capacity. Currently, incentives and policies are not sufficiently
aligned for our medical schools and residencies to staff another large expansion. Staffing a rapidly
45
enlarged health center network will likely require incentives to shift currently practicing physicians,
NPs and PAs into these settings.
• Slightly more than 2% of allopathic physicians have served in the NHSC during its first 25 years of
existence. This important program was recently reauthorized and is critical to access to care for
underserved people.
Lessons learned about our hypotheses:
• Debt has an important role in shaping the career choices for some students, but it does not appear to
be a potent factor for most, at least not relative to other important factors. In private schools,
increasing debt is associated with increased likelihood of choosing some of our study outcomes. In
public schools, the mid-range of debt, $100,000 - $150,000, appeared to have the highest likelihood
of choosing primary care practice and this likelihood decreased with no debt or higher debt. The gap
in average debt between graduates of private and public schools may relate to debt tolerance and
how it sorts students into the two types of schools.(49) The lower likelihood of students with no or low
debt with our study outcomes may be explained by the types of students who are able to graduate
from medical school without debt— they often come from households with higher socioeconomic
status which may influence their career choices. Most are likely to not have rural or underserved life
experiences that make such communities career options. There is some evidence that the risk of
educational debt deters students from lower socioeconomic families from ever applying to
professional school.
• Clearly, for NHSC scholars there is a willingness to accept service obligations to avoid debt, and for
NHSC loan repayment physicians, to pay off high debt. There is some evidence that interest in
NHSC and its trade-off of obligation for reduced debt is a growing interest among students. NHSC
physicians had much higher odds of choosing careers reflective of all our study outcomes. The NHSC
obligation is typically 3-5 years, but its desirable outcomes are sustaining, well beyond the initial
obligation. With current interest in the NHSC and requests for NHSC providers well above offered
positions, there is room to expand the program size and offset the effects of debt for many more
students.
• This study confirms that Title VII, Section 747 of the Public Health Service Act serves an important
role in facilitating the choice of primary care, practice in underserved regions, and service to needy
populations. It is a shadow of its former self in terms of funding. Attending medical school receiving
Title VII funds was associated with significantly increased odds of all of our study outcomes except
NHSC. Attending a residency receiving Title VII funds was associated with significantly increased
46
odds of NHSC careers and practice in physician shortage or underserved areas. The latter was
associated with reduced likelihood of some important outcomes (primary care and rural practice)
which deserves further exploration. Maximizing our study outcomes looks to be best when there is
Title VII exposure, debt of any kind, and an obligating scholarship (NHSC or Armed Forces).
• Title VII was associated with better ratings of primary care training experiences in medical school,
and improved ratings were associated with greater likelihood of choosing a primary care career and
working with underserved populations. While we cannot assume this is a causal link, Title VII may be
an important mediator of students choosing primary care careers since it is associated with a greater
likelihood of a good primary care experience.
• The Physician income gap is a potent damper on all of our study outcomes. It decreases odds of
choosing primary care by nearly 50% and most other outcomes by 20% or more. This is consistent
with Ebell’s findings for specialty training choices.(65) This gap has grown and changing the payment
policies that support the widening of the gap has been politically impossible. The higher paid
specialties make 267% of the average primary care income. This potent disincentive for careers in
primary care and rural settings is being discussed in several policy arenas but requires action to
resolve the disparity if improving access, population health outcomes, and health system efficiency
are important goals.
• The Return on Investment for choosing a subspecialty at the average salary of all subspecialties
(lower than the radiology or orthopedic surgery comparison above) produces a net ROI of $3.5 million
over choosing a primary care career. In the early 1990’s, the ROI for primary care was lower than that
for professionals in business, law or dentistry, and likely remains so. Medical students may not be
able to cite the relative ROI difference, but they see its fruits in the lifestyle and respect that many
subspecialists enjoy relative to their primary care colleagues. The difference in ROI makes the
income disparity between primary care and subspecialties more glaring, its outcomes more
understandable, and persistence unconscionable.
• Training in rural locations is important to students’ choosing to practice in rural locations and rural
health centers. Inner city experiences did not seem to have such effect for any of the outcomes. If
rural–born students (2.4 x likelihood of rural practice) interested in serving the underserved (1.5 x
likelihood of Rural Health Center) also have rural training experience, it may have multiples of effect.
Currently, most schools do not purposefully align these enhancing factors. Schools, residency
47
programs, and medical education funders should consider this as they look at curriculum and funding
priorities.
• Attending public medical school is more predictive of primary care and underserved area careers
than private medical school; in fact, it increases the odds of choosing Family Medicine by 77% and
primary care by 27%. To the extent that these outcomes are desirable to state policymakers and
legislators, they should study their relevant schools to help inform their funding decisions. They may
also want to consider public school models and outcomes if they are considering adding new medical
schools.
• Students intent on caring for underserved populations were significantly more likely to do so. For
example, interest in underserved populations nearly tripled the likelihood of practice in an FQHC and
increased the likelihood of serving in the NHSC eight-fold. Interest in serving minority populations,
underserved areas and underserved populations increased the likelihood of our study outcomes
several fold. Schools should institute a series of interview questions about service to underserved,
socioeconomically deprived, rural, minority and inner-city patients—and should give these weight in
acceptance. They could also become markers for targeted mentoring and training experiences.
Schools should partner with community health centers, area health education centers, and private
clinicians to provide related experiences and reinforce student interest. Students could be identified
early for specific mentoring and guided to residency programs that can offer clinical, community, and
leadership training geared to caring for these populations.
Converting knowledge into meaningful policy: A convergence of opportunity? The US Commission on Graduate Medical Education, an advisory body to Congress and the President on
postgraduate medical training, advocated for a 15% expansion of allopathic medical school enrollment,
and the Association of American Medical Colleges (AAMC) increased the recommendation to 30%. As a
result, current schools are projected to expand by 20%(99) and a dozen new schools are in
production.(100) Osteopathic training is also undergoing a significant expansion. Several states have
committed to investing billions of dollars in supporting expansions of existing schools and building new
ones. Federal, state and local policymakers will need other policy levers to correct provider maldistribution
in a free market whose forces offer incentives to maximize provider revenue, not access to care. In many
cases these policymakers lack evidence to guide their policy. The Association of Academic Health
Centers recently recommended that this expansion, and other efforts to increase the health care
workforce, should be purposefully directed to producing a workforce designed to improve the health of the
public.(101)
48
Through this study, we have identified factors that could be purposefully imbedded in the training process
to achieve purposeful physician workforce growth. Recently, employer and physician organizations have
called for a medical home for all Americans, a daunting task given the inequitable distribution of primary
care providers, as Massachusetts recently discovered.(102;103) In parallel to the growing burden of
uninsurance, there are an increasing number of Americans who are ‘medically disenfranchised’ (104;105)
Many of the medically disenfranchised consider federally qualified health centers across the U.S. their
medical home. The 1000 health centers and their more than 5000 clinic sites are a critical component of
the health care safety net. The Federal government has recently invested in an expansion of FQHCs to
enhance access to care for underserved populations. It is not clear that these FQHCs will be able to
recruit the primary care workforce needed to expand their service capacity.(90) As Congress considers
legislation that promotes access to a Medical Home, understanding what predicts eventual service in a
medical home for these disenfranchised is essential.
Several studies support the important role Title VII training grants play in preparing primary care clinicians
to work in safety net settings such as FQHCs, but these studies were unable to account for important
factors such as education debt, rural origins and other factors now available to us from the Association of
American Medical Colleges. This study reveals the important interactions between these factors and their
impact, further validating the role of Title VII funded programs as a key pipeline producing the clinician
workforce for FQHCs. In terms of training support, COGME and the Medicare Payment Advisory
Commission (MedPAC) both recently identified the need to increase GME funding flexibility to better
support primary care training in the settings where they are needed.(106;107) Specifically, MedPAC
offered:
Policymakers could consider ways to use some of these GME and IME subsidies toward
promoting training in primary care. For example, a portion could be targeted specifically to
support medical residency positions in primary care. Further, a share of GME and IME
subsidies could be expressly directed toward training all medical residents on the importance
of primary care and interdisciplinary teams, quality measurement, and clinical uses for
information technology (IT). Encouragement of geriatric training opportunities in nonhospital
settings (e.g., nursing facilities) may also be useful. Medical education subsidies could also
be used to help pay student loans for clinicians committed to primary care specialties.
Primary care providers generally earn lower salaries than their more procedurally based
counterparts. Therefore, student loan subsidies could somewhat offset incentives for medical
students to select higher paid specialties to help pay off their medical school debts more
easily. (page 32)
49

All of these options resonate well with our findings and could go a long way toward supporting the
Commission on Medicare and Medicaid Services’ goals for Medicare beneficiaries.
MedPAC also recently began considering how Medicare could help reduce primary care payment
disparities, help rebuild its infrastructure, and reap the benefits of primary care:
To promote use of primary care and redistribute payments toward services furnished by
primary care providers, the Commission recommends that Medicare’s payment system for
physician services—the physician fee schedule—include an adjustment for primary care.
The adjustment would raise payments for selected primary care services furnished by
physicians, advanced practice nurses, and physician assistants with practices focused on
primary care. (June 08 report of MedPAC)
We hope that these findings will encourage CMS/Medicare and large employers to embrace MedPAC’s
recommendation to secure the primary care workforce for the future.
Recommendations:
1. Create more opportunities for students and young physicians to trade debt for service. The
NHSC experience demonstrates a willingness to make this trade and that it has profound effects for
needed physician specialty and practice location choices. The most immediate rallying reason is the
dire projected need for expansion of community health centers. Certainly, more Federal programs,
such as expansion of the NHSC, are needed but states and municipalities could realize much higher
return on investments in loan repayment than for building new medical schools as measured by
retention and improved distribution.
2. Reduce or resolve disparities in physician income. The current income gap and return on
investment disparity significantly and adversely affects primary care, rural areas, and access for
underserved populations. The current disparity is the product of insidious payment policy and can be
reversed by purposeful payment policy. Countries that reduced or eliminated primary care payment
disparity realized greater interest and entry by their students and reaped economic and health
benefits from investments in primary care.
3. Admit a greater proportion of students to medical school who are more likely to choose primary care, rural practice, and care of the underserved. Our findings and others’ suggest that
rural-born or raised students are more likely to choose primary care and practice in a rural area. Our
50
study also substantiated prior findings that students with demonstrated interest in working with
underserved or minority populations are more likely to serve them in practice. We also feel that
universities and medical schools have an obligation to expose more rural students to health care
professions and increase their ability to compete for medical school.
4. Study the degree to which educational debt prevents middle class and poor students from applying to medical school and potential policies to reduce such barriers. Medical students are
increasingly from more affluent families and, despite the high return on investment from attending
medical school, the risk of high educational debt may be a barrier for students from less affluent
families.(108) Reducing debt during medical training could increase applications from students more
likely to choose primary care, rural and underserved careers. A rise in applicants from less affluent
families could also increase the opportunity for their selection (Recommendation 3).
5. Shift substantially more training of medical students and residents to community, rural and underserved settings. This includes support for Title VII (Section 747 of the Public Health Service
Act) funding expansion since it supports many of the experiences that promote these important
choices. Rural, inner-city and underserved population clerkships and electives are associated with
profound changes in students’ ultimate specialty and location of practice. Learning experiences in
FQHCs, RHCs and Area Health Education Centers can be means of accomplishing these goals.
Arranging summer experiences for NHSC scholars after their first year of medical school could be
another important opportunity.
6. Support primary care departments and residency programs and their roles in teaching and mentoring trainees. Strengthening the viability of primary care programs and their role in teaching
and mentoring of students can provide important exposure and role-modeling. The large growth in
subspecialty programs relative to primary care programs (and contraction of family medicine training
positions) since the turn of this century illustrate the biases of training hospitals to bend training
capacity to their bottom line. Being responsive to their mission to the health of the public will require
strengthening of primary care training and ability to train in appropriate settings. The US Council on
Graduate Medical Education and the Medicare Payment Advisory Committee have called for
reformation of the 40-year old Graduate Medical Education payment model to better serve the public
good. Changes are needed in this nearly $8 billion federal funding stream for training residents to
better prepare them for practicing in communities and afford them opportunities to experience
working in rural and underserved settings.
51
7. Reauthorize and revitalize funding through Title VII, Section 747 of the Public Health Service Act. Title VII Funding has languished over the last decade and is due for reauthorization. There is
overwhelming evidence, confirmed in this study, of the beneficial effects associated with this small
federal program. It is associated with increased primary care selection by trainees, and with rural and
underserved practice. This program deserves expansion to secure these benefits and the viability of
primary care departments in academic health centers.
8. Study how to make rural areas more likely practice options, especially for women physicians. Female physicians are twice as likely as men to choose primary care but half as likely to practice in
rural areas. We need to listen to and learn from young women in medicine about what would make
rural areas more of an option. Such research should also explore how to recruit female students more
likely to make this choice.
9. New medical schools should be public with preference for rural locations. Attending a public
medical school significantly increased the likelihood of primary care, family medicine, and rural
practice. Attending a rural medical school was an even more potent factor for these outcomes, nearly
tripling likelihood of rural practice, and also increased probability of work in a health center.
52
Appendices Appendix A: The data, their sources and our analytical methods Overview: Data was extracted from a variety of sources and various data files were match-merged to create a
unique analysis file for this study. The major data files included the following:
1. American Medical Association (AMA) master file database (2001-2005)
2. An enhanced 2004 AMA master file database
3. Medicare outpatient institutional claims filed from Federally Qualified Health Centers (FQHC),
Rural Health Centers (RHC), and rural primary care hospitals.
4. American Association of Medical Colleges (AAMC) graduation survey (GQ) database
5. Medical School Title VII Exposure database file
6. Primary Care Medical Residency Training History database file
7. National Health Service Corps (NHSC) participant database file
8. Supplementary data on medical student training costs
AMA master file database
The Master file database was obtained from the AMA. It is a flat-file database which contains updated
information on U.S. allopathic physicians and many osteopathic physicians, including those who are not
AMA members. The database is updated using information from medical schools, hospitals, state
licensing agencies, medical societies, professional associations, and an ongoing survey of the physician
population with each physician surveyed every 3 years. Details regarding administration of the Master file
database have been published elsewhere.1,2
Master file variables include for each physician the “preferred mailing address” and “primary office
address” for primary care physicians (family practice, general pediatrics, and general internal medicine),
providing active patient care. The AMA has recently gone to great lengths to clean up the work and home
1 Pasko, Thomas, Derek Smart, ‘Physician Characteristics And Distribution In The US 2005, Amer Medical Assn (December 30, 2004) 2 Kletke Phillip, D. Polsky, G. Wozniak, and J. Escarce “HMO Penetration and the Geographical Redistribution of Generalist and Specialist Physicians, 1987-1997,” Health Services Research October, 2000.
53
address fields in the 2004 Master file. This is the most comprehensive data file available for physician
practice location.
We used data extracted annually from the database in 2001 through 2005. We excluded from the data:
• Osteopathic physicians, • Physicians with an indication in any of the source data files to have died. • International medical graduate physicians not trained in an accredited US medical school.
Enhanced 2004 AMA master file database At the Robert Graham Center the 2004 AMA Master file has specific data enhancements used for
previous projects through an exclusive data agreement with the AMA. This enhanced data file includes
unique identifiers, medical school experience, and up to 6 graduate medical education programs for each
physician. We have geo-coded the practice location of physicians to permit both address and geographic
locality matches with health center sites.
Medicare outpatient institutional claims from Health Centers Medicare data on all physicians filing claims from Federally Qualified Health Centers (FQHC), Rural
Health Centers (RHC), and Rural primary care hospitals, from 2001 through 2005, were obtained from the
Centers for Medicare and Medicaid Centers (CMS). We excluded all claim lines that had clinicians with
surrogate UPINs as the attending provider – billing for services by non-physician clinical providers,
osteopathic physicians, dentists etc.: Anesthesia Assistant, Certified Registered Nurse Anesthetist,
Certified Nurse Midwife, Clinical Nurse Specialist, Clinical Psychologist, Clinical Social Worker, Foreign
Doctor (for all non-United States physicians), non-allopathic medical doctors (e.g.: DO, CH, DDM, DDS,
DPM, OD), Nurse Practitioner, Occupational Therapist, Physician Assistant, Physical Therapist.
We created four extract files for each year of claims data. The first file had one record per physician per
year with a Unique Physician Identification Number (UPIN) as the identifier. The second had one record
per beneficiary per year and included the beneficiary’s zip code. The third was a cross-walk file with one
record for each combination of physician and beneficiary from the claims files. The fourth was an
aggregate file with one record per health center facility or site per year. Each of the first and second
extract files were geo-coded to append geographic variables corresponding to each physician and each
beneficiary. Geographic variables included whether the physician was born in a rural or non-rural county.
54
AAMC graduation survey database We obtained data on the Medical school loans, pre-medical school loans, non-educational loans, and
data on the medical school experience from medical students graduating between 1979 and 2004 from
the AAMC. We found 75 physicians who completed the GQ twice, between 1994 and 2005. In most
cases with double completions (79.45%) there was one year between the completions. We summed the
scholarship amounts reported on double GQ completion, deleted the first GQ completed, and kept the
second (or last) GQ completed. We then substituted the summed scholarship amounts for the reported
scholarship amounts on the second (or last) GQ completion.
The GQ field that indicates whether the physician received a scholarship for medical studies was missing
for all the GQs completed in 1978, and about 24% of the GQs completed in 1984. For all other years the
scholarship indicator is missing for only1 to 3% of the respondents. We excluded all the 1978 GQ data.
Medical School Title VII Exposure database We obtained the Medical School Title VII Exposure database from the Health Resources and Services
Administration (HRSA) of the US Department of Health and Human Services. The HRSA maintained
database has the full listing of Title VII awards for the years 1978-2004. We linked individual physicians’
medical school and date of graduation data from the AMA master file to the Title VII Funding database
resulting in Medical School Title VII Exposure at the physician level for 1979 through 2004.
Primary Care Medical Residency Training History database We obtained a Primary Care Medical Residency Training History database from HRSA. The database
included information on not only residency programs but also hospitals, universities and other institutions
affiliated with residency programs. We invested substantial staff time and effort to identify residency
programs that received Title VII funding to permit matching to residency “institution codes” listed in the
AMA master file and ultimate analyses of potential exposure by graduates of those programs. This effort
included use of the databases maintained by professional organizations, hand searches of ACGME and
AMA-FREIDA databases, and reviews of historical files on residency programs. We matched nearly all of
the Title VII awards granted to residency programs between 1970 and 2004 for all relevant activity codes
available from HRSA.
NHSC Participant Database HRSA provided us with a list of all current and past participants in the NHSC. The list includes information
whether a physician was a NHSC participant and the type of obligation (i.e. scholarship or loan
repayment).We were able to match NHSC participants to the physicians in our AMA master file database
55
extracts using name and date of birth (AMA Med Ed number is not available for NHSC participants). For
those without date of birth information we were able to match using a simple algorithm.
Supplementary data on medical student training costs We also obtained supplementary data primarily to estimate the returns to medical education in the U.S.
These data included for example: The Medical College Admission Test (MCAT) fees from the Association
of American Medical Colleges (AAMC)3. The fees for participation in preparation courses for the MCAT
and USMLE licensing examinations from Kaplan Medical.4 Medical school tuition, fees and medical
student expenses from AAMC5, the Cornell University archives6, the University of Pennsylvania archives7,
and the University of Puerto Rico.8 Professional medical board certification examination fees from the
Board of Medical Examiners and American Board of Family Medicine9, and the American Board of
Neurosurgical Surgery10. Supplementary data on for example the Consumer Price Index (CPI) for
adjusting the debt data to account for inflation, and compensation for various physician specialties for the
1980s, the 1990s, and the 2000s, from various Medical Group Management Association (MGMA) and
AMA sources.
Match-merge of data files After match-merging the data files, we estimated relative incomes for the various physician specialties as
the CPI adjusted salary for radiologist divided by the CPI adjusted salary for a primary care physician. We
deflated individual debt and income data from GQ surveys using the CPI for each year. Residency history
data was first merged with all the physician medical residency Title VII exposure data, prior to merging
with the AMA master file data. Merge rates for each of the components of the analysis file are presented
in the table below:
3 AAMC, 2008 “MCAT Essentials” Association of American Medical Colleges, Washington, DC, 2008, http://www.aamc.org/students/mcat/mcatessentials.pdf 4 Kaplan Medical, 2008, http://www.kaplanmedical.com/ 5 AAMC, “Tuition and Student Fees Reports”, Association of American Medical Colleges, Washington, DC, http://services.aamc.org/tsfreports/ 6 Cornell Historical Tuition, Cornell University, Weill Medical Division, “Tuition and Mandatory Fees, 1980-81 through 2007-08” http://dpb.cornell.edu/documents/1000217.pdf 7 University of Pennsylvania, University Archives and Records Center, “Tuition and mandated fees, Room and Board and other educational costs at Penn: 1970 to 2003” http://www.archives.upenn.edu/histy/features/tuition/1970.html through http://www.archives.upenn.edu/histy/features/tuition/2000.html 8 University of Puerto Rico, School ,of Medicine, “Estimated Fees and Expenses” http://www.md.rcm.upr.edu/index.php?option=com_content&task=view&id=87&Itemid=88 9 American Board of Family Medicine, “Examination Fee Schedule” https://www.theabfm.org/cert/exam_fees.aspx 10 American Board of Neurosurgical Surgery “Application for Oral Examination and Certification”,http://www.abns.org/pdfs/Application_for_Oral_Exam_and_Certification.pdf
56
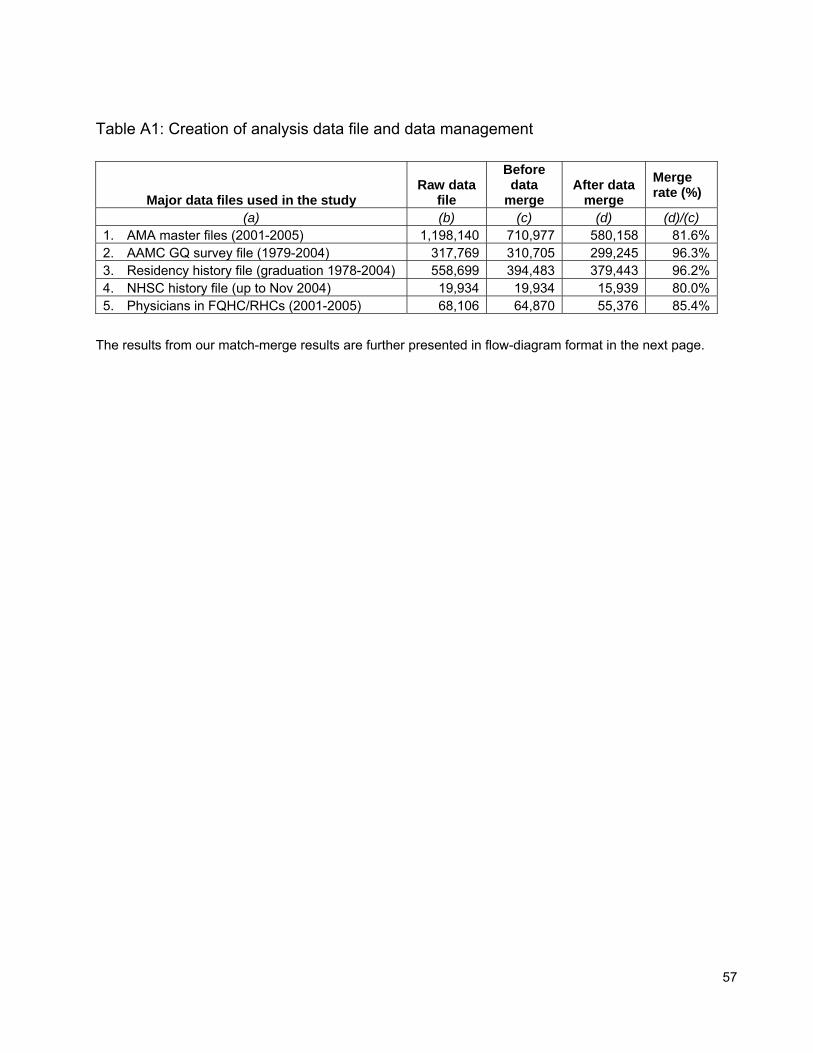
Table A1: Creation of analysis data file and data management
Major data files used in the study Raw data
file
Before data
merge After data
merge Merge rate (%)
(a) (b) (c) (d) (d)/(c) 1. AMA master files (2001-2005) 1,198,140 710,977 580,158 81.6%2. AAMC GQ survey file (1979-2004) 317,769 310,705 299,245 96.3%3. Residency history file (graduation 1978-2004) 558,699 394,483 379,443 96.2%4. NHSC history file (up to Nov 2004) 19,934 19,934 15,939 80.0%5. Physicians in FQHC/RHCs (2001-2005) 68,106 64,870 55,376 85.4%
The results from our match-merge results are further presented in flow-diagram format in the next page.
57
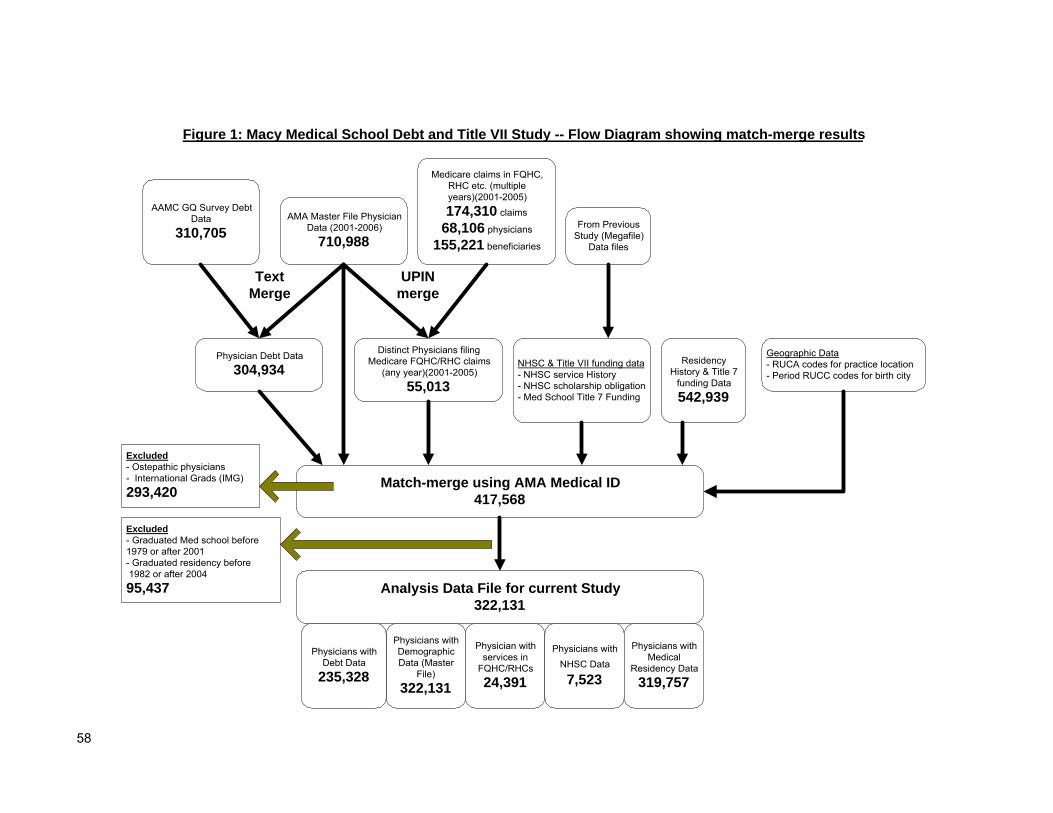
Figure 1: Macy Medical School Debt and Title VII Study -- Flow Diagram showing match-merge results
AAMC GQ Survey DebtData
310,705AMA Master File Physician
Data (2001-2006)710,988
Medicare claims in FQHC,RHC etc. (multipleyears)(2001-2005)174,310 claims
68,106 physicians
155,221 beneficiaries
NHSC & Title VII funding data- NHSC service History- NHSC scholarship obligation- Med School Title 7 Funding
ResidencyHistory & Title 7
funding Data542,939
Excluded- Graduated Med school before1979 or after 2001- Graduated residency before 1982 or after 200495,437
Physician Debt Data304,934
Distinct Physicians filingMedicare FQHC/RHC claims
(any year)(2001-2005)55,013
Match-merge using AMA Medical ID417,568
From PreviousStudy (Megafile)
Data files
Physicians withDemographicData (Master
File)322,131
Physicians withDebt Data
235,328
Physician withservices in
FQHC/RHCs24,391
Physicians withNHSC Data
7,523
Physicians withMedical
Residency Data319,757
UPINmerge
TextMerge
Geographic Data- RUCA codes for practice location- Period RUCC codes for birth city
Analysis Data File for current Study322,131
Excluded- Ostepathic physicians- International Grads (IMG)293,420
58
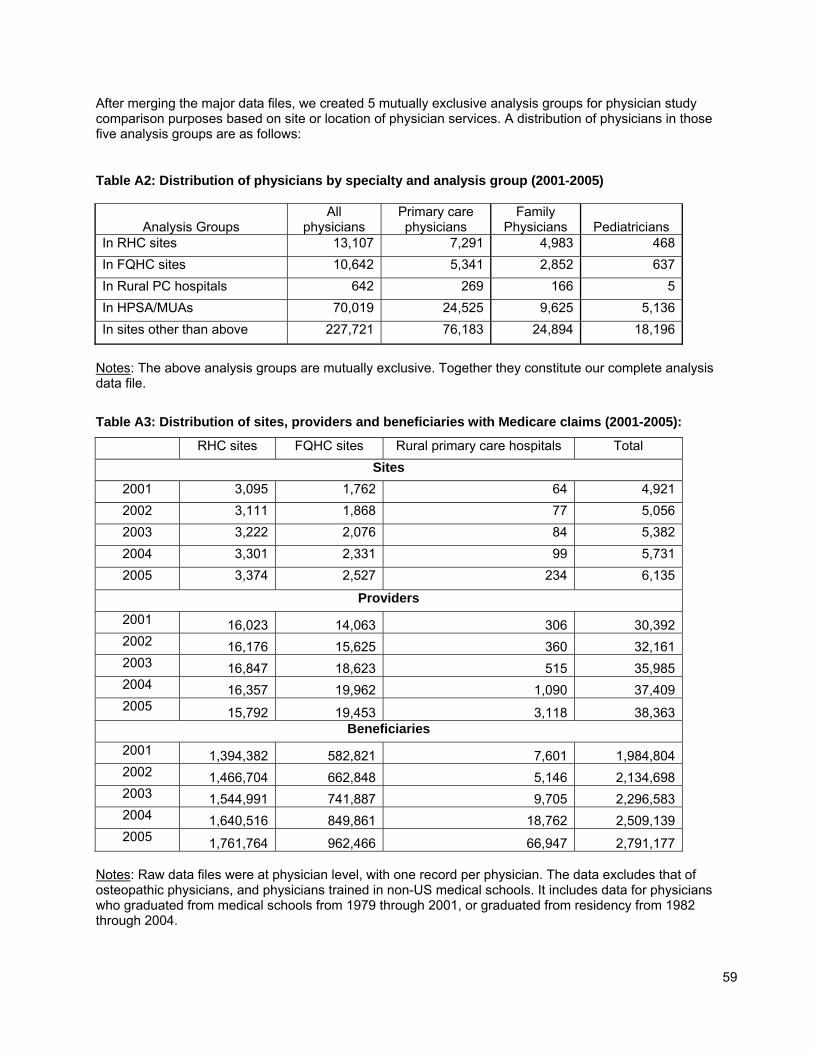
After merging the major data files, we created 5 mutually exclusive analysis groups for physician study comparison purposes based on site or location of physician services. A distribution of physicians in those five analysis groups are as follows:
Table A2: Distribution of physicians by specialty and analysis group (2001-2005)
Analysis Groups All
physicians Primary care physicians
Family Physicians
Pediatricians
In RHC sites 13,107 7,291 4,983 468In FQHC sites 10,642 5,341 2,852 637In Rural PC hospitals 642 269 166 5In HPSA/MUAs 70,019 24,525 9,625 5,136In sites other than above 227,721 76,183 24,894 18,196
Notes: The above analysis groups are mutually exclusive. Together they constitute our complete analysis data file.
Table A3: Distribution of sites, providers and beneficiaries with Medicare claims (2001-2005):
RHC sites FQHC sites Rural primary care hospitals Total Sites
2001 3,095 1,762 64 4,9212002 3,111 1,868 77 5,0562003 3,222 2,076 84 5,3822004 3,301 2,331 99 5,7312005 3,374 2,527 234 6,135
Providers 2001 16,023 14,063 306 30,3922002 16,176 15,625 360 32,1612003 16,847 18,623 515 35,9852004 16,357 19,962 1,090 37,4092005 15,792 19,453 3,118 38,363
Beneficiaries 2001 1,394,382 582,821 7,601 1,984,8042002 1,466,704 662,848 5,146 2,134,6982003 1,544,991 741,887 9,705 2,296,5832004 1,640,516 849,861 18,762 2,509,1392005 1,761,764 962,466 66,947 2,791,177
Notes: Raw data files were at physician level, with one record per physician. The data excludes that of osteopathic physicians, and physicians trained in non-US medical schools. It includes data for physicians who graduated from medical schools from 1979 through 2001, or graduated from residency from 1982 through 2004.
59
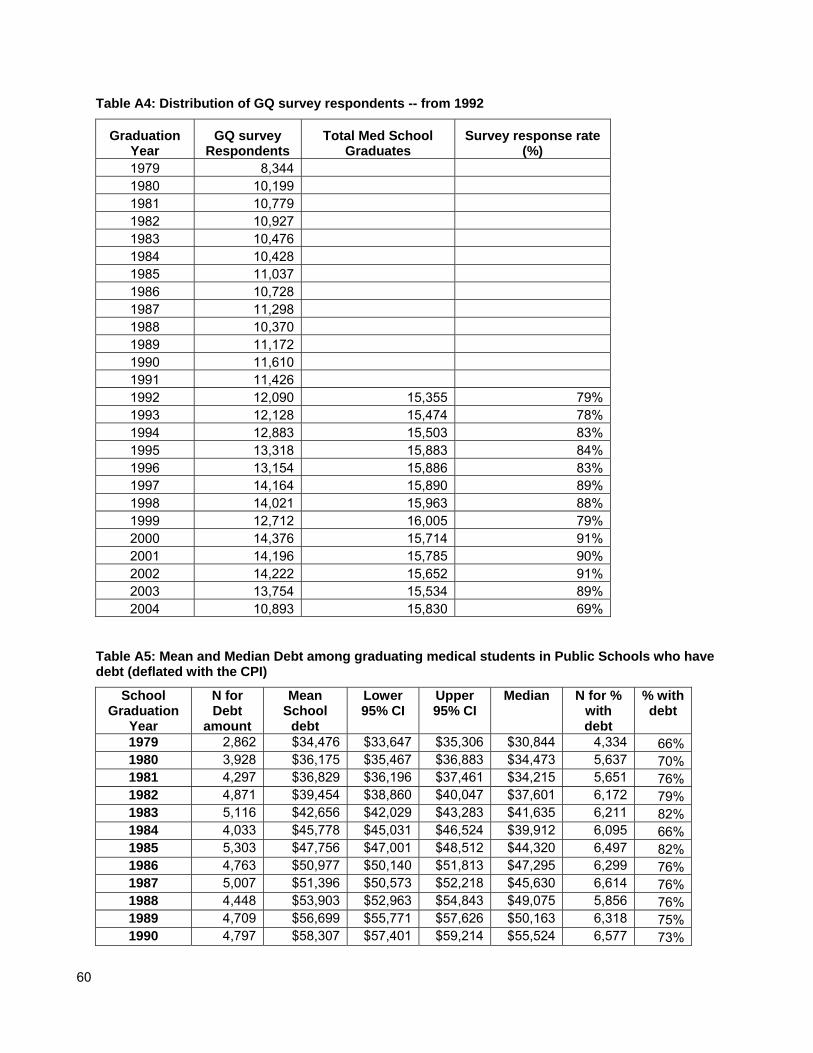
Table A4: Distribution of GQ survey respondents -- from 1992
Graduation Year
GQ survey Respondents
Total Med School Graduates
Survey response rate (%)
1979 8,344 1980 10,199 1981 10,779 1982 10,927 1983 10,476 1984 10,428 1985 11,037 1986 10,728 1987 11,298 1988 10,370 1989 11,172 1990 11,610 1991 11,426 1992 12,090 15,355 79% 1993 12,128 15,474 78% 1994 12,883 15,503 83% 1995 13,318 15,883 84% 1996 13,154 15,886 83% 1997 14,164 15,890 89% 1998 14,021 15,963 88% 1999 12,712 16,005 79% 2000 14,376 15,714 91% 2001 14,196 15,785 90% 2002 14,222 15,652 91% 2003 13,754 15,534 89% 2004 10,893 15,830 69%
Table A5: Mean and Median Debt among graduating medical students in Public Schools who have debt (deflated with the CPI)
School Graduation
Year
N for Debt
amount
Mean School
debt
Lower 95% CI
Upper 95% CI
Median N for % with debt
% with debt
1979 2,862 $34,476 $33,647 $35,306 $30,844 4,334 66%1980 3,928 $36,175 $35,467 $36,883 $34,473 5,637 70%1981 4,297 $36,829 $36,196 $37,461 $34,215 5,651 76%1982 4,871 $39,454 $38,860 $40,047 $37,601 6,172 79%1983 5,116 $42,656 $42,029 $43,283 $41,635 6,211 82%1984 4,033 $45,778 $45,031 $46,524 $39,912 6,095 66%1985 5,303 $47,756 $47,001 $48,512 $44,320 6,497 82%1986 4,763 $50,977 $50,140 $51,813 $47,295 6,299 76%1987 5,007 $51,396 $50,573 $52,218 $45,630 6,614 76%1988 4,448 $53,903 $52,963 $54,843 $49,075 5,856 76%1989 4,709 $56,699 $55,771 $57,626 $50,163 6,318 75%1990 4,797 $58,307 $57,401 $59,214 $55,524 6,577 73%
60
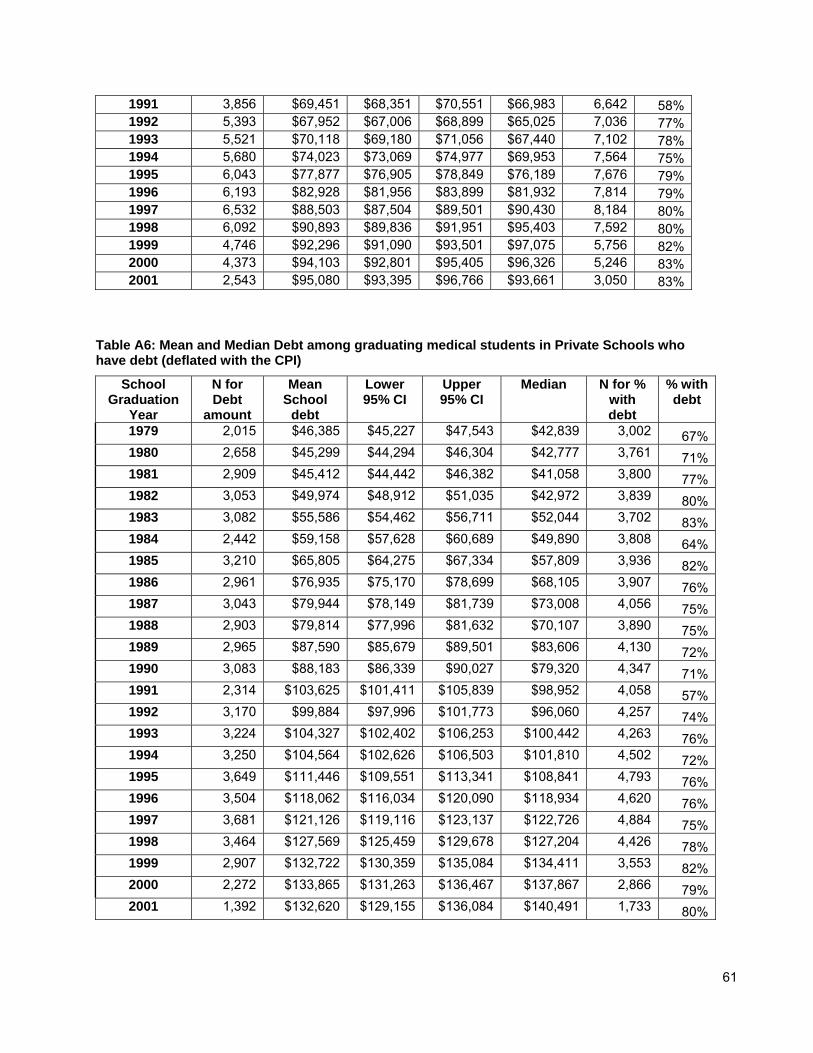
1991 3,856 $69,451 $68,351 $70,551 $66,983 6,642 58%1992 5,393 $67,952 $67,006 $68,899 $65,025 7,036 77%1993 5,521 $70,118 $69,180 $71,056 $67,440 7,102 78%1994 5,680 $74,023 $73,069 $74,977 $69,953 7,564 75%1995 6,043 $77,877 $76,905 $78,849 $76,189 7,676 79%1996 6,193 $82,928 $81,956 $83,899 $81,932 7,814 79%1997 6,532 $88,503 $87,504 $89,501 $90,430 8,184 80%1998 6,092 $90,893 $89,836 $91,951 $95,403 7,592 80%1999 4,746 $92,296 $91,090 $93,501 $97,075 5,756 82%2000 4,373 $94,103 $92,801 $95,405 $96,326 5,246 83%2001 2,543 $95,080 $93,395 $96,766 $93,661 3,050 83%
Table A6: Mean and Median Debt among graduating medical students in Private Schools who have debt (deflated with the CPI)
School Graduation
Year
N for Debt
amount
Mean School
debt
Lower 95% CI
Upper 95% CI
Median N for % with debt
% with debt
1979 2,015 $46,385 $45,227 $47,543 $42,839 3,002 67%1980 2,658 $45,299 $44,294 $46,304 $42,777 3,761 71%1981 2,909 $45,412 $44,442 $46,382 $41,058 3,800 77%1982 3,053 $49,974 $48,912 $51,035 $42,972 3,839 80%1983 3,082 $55,586 $54,462 $56,711 $52,044 3,702 83%1984 2,442 $59,158 $57,628 $60,689 $49,890 3,808 64%1985 3,210 $65,805 $64,275 $67,334 $57,809 3,936 82%1986 2,961 $76,935 $75,170 $78,699 $68,105 3,907 76%1987 3,043 $79,944 $78,149 $81,739 $73,008 4,056 75%1988 2,903 $79,814 $77,996 $81,632 $70,107 3,890 75%1989 2,965 $87,590 $85,679 $89,501 $83,606 4,130 72%1990 3,083 $88,183 $86,339 $90,027 $79,320 4,347 71%1991 2,314 $103,625 $101,411 $105,839 $98,952 4,058 57%1992 3,170 $99,884 $97,996 $101,773 $96,060 4,257 74%1993 3,224 $104,327 $102,402 $106,253 $100,442 4,263 76%1994 3,250 $104,564 $102,626 $106,503 $101,810 4,502 72%1995 3,649 $111,446 $109,551 $113,341 $108,841 4,793 76%1996 3,504 $118,062 $116,034 $120,090 $118,934 4,620 76%1997 3,681 $121,126 $119,116 $123,137 $122,726 4,884 75%1998 3,464 $127,569 $125,459 $129,678 $127,204 4,426 78%1999 2,907 $132,722 $130,359 $135,084 $134,411 3,553 82%2000 2,272 $133,865 $131,263 $136,467 $137,867 2,866 79%2001 1,392 $132,620 $129,155 $136,084 $140,491 1,733 80%
61
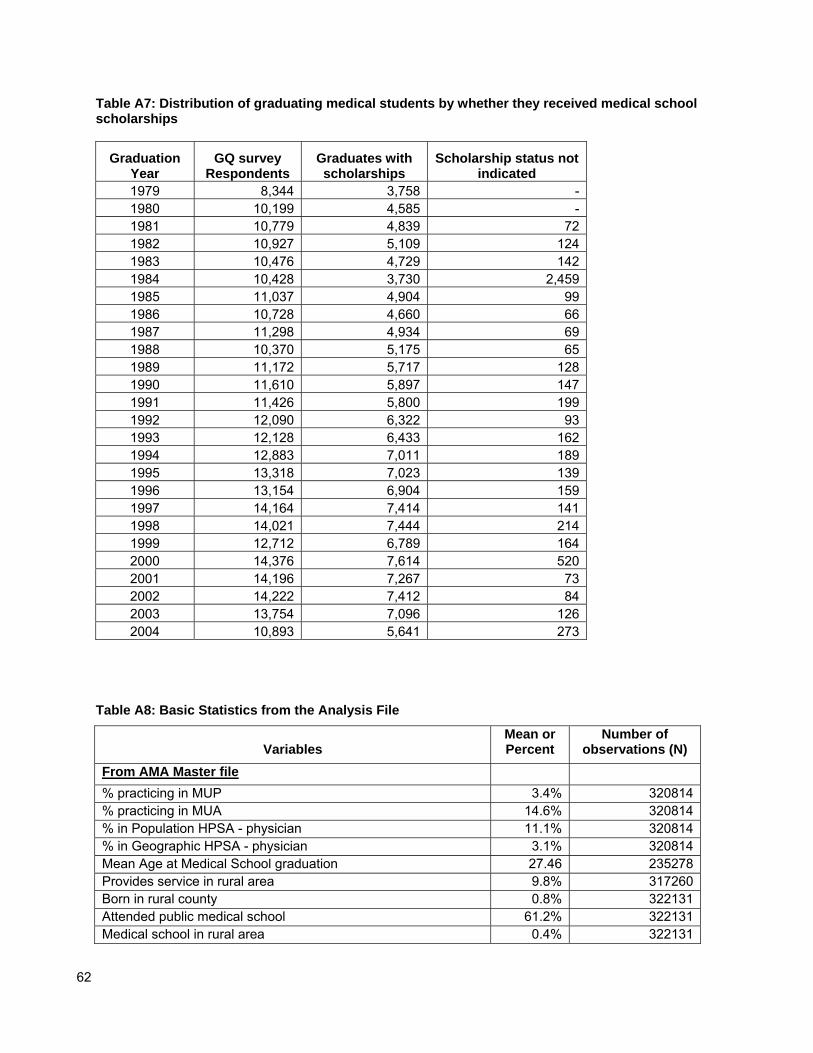
Table A7: Distribution of graduating medical students by whether they received medical school scholarships
Graduation Year
GQ survey Respondents
Graduates with scholarships
Scholarship status not indicated
1979 8,344 3,758 - 1980 10,199 4,585 - 1981 10,779 4,839 72 1982 10,927 5,109 124 1983 10,476 4,729 142 1984 10,428 3,730 2,459 1985 11,037 4,904 99 1986 10,728 4,660 66 1987 11,298 4,934 69 1988 10,370 5,175 65 1989 11,172 5,717 128 1990 11,610 5,897 147 1991 11,426 5,800 199 1992 12,090 6,322 93 1993 12,128 6,433 162 1994 12,883 7,011 189 1995 13,318 7,023 139 1996 13,154 6,904 159 1997 14,164 7,414 141 1998 14,021 7,444 214 1999 12,712 6,789 164 2000 14,376 7,614 520 2001 14,196 7,267 73 2002 14,222 7,412 84 2003 13,754 7,096 126 2004 10,893 5,641 273
Table A8: Basic Statistics from the Analysis File
Variables
Mean or Percent
Number of observations (N)
From AMA Master file % practicing in MUP 3.4% 320814% practicing in MUA 14.6% 320814% in Population HPSA - physician 11.1% 320814% in Geographic HPSA - physician 3.1% 320814Mean Age at Medical School graduation 27.46 235278Provides service in rural area 9.8% 317260Born in rural county 0.8% 322131Attended public medical school 61.2% 322131Medical school in rural area 0.4% 322131
62
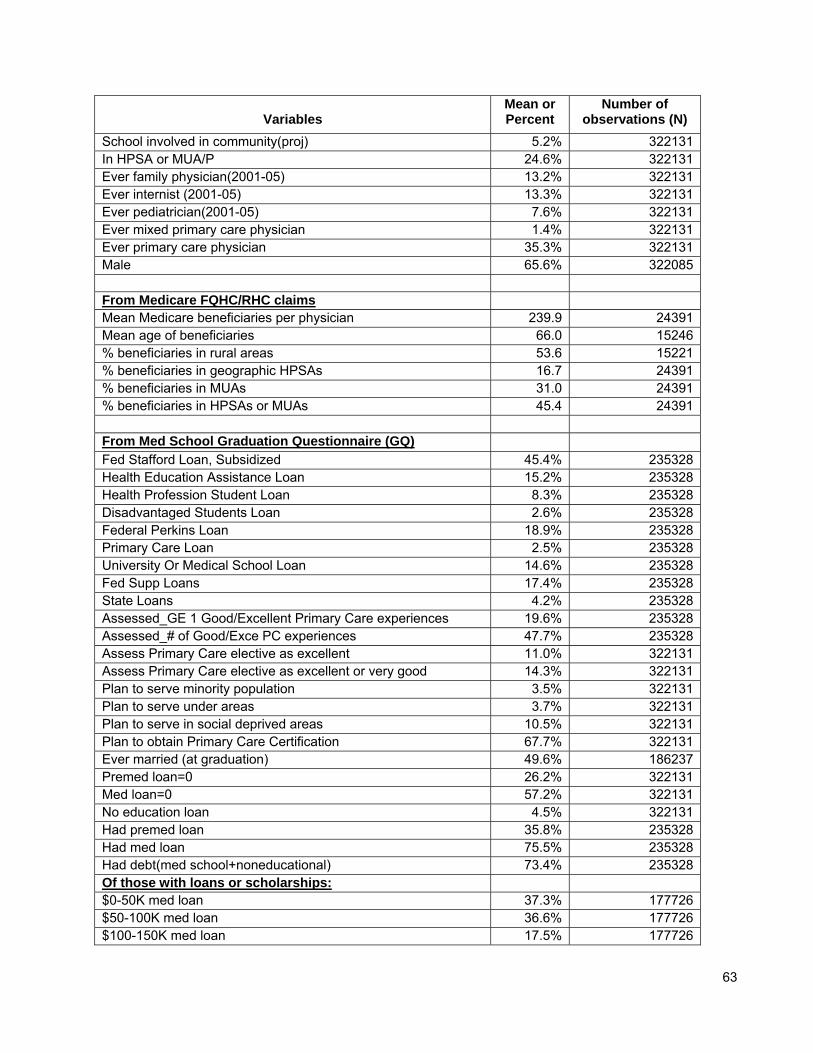
Variables
Mean or Percent
Number of observations (N)
School involved in community(proj) 5.2% 322131In HPSA or MUA/P 24.6% 322131Ever family physician(2001-05) 13.2% 322131Ever internist (2001-05) 13.3% 322131Ever pediatrician(2001-05) 7.6% 322131Ever mixed primary care physician 1.4% 322131Ever primary care physician 35.3% 322131Male 65.6% 322085 From Medicare FQHC/RHC claims Mean Medicare beneficiaries per physician 239.9 24391Mean age of beneficiaries 66.0 15246% beneficiaries in rural areas 53.6 15221% beneficiaries in geographic HPSAs 16.7 24391% beneficiaries in MUAs 31.0 24391% beneficiaries in HPSAs or MUAs 45.4 24391 From Med School Graduation Questionnaire (GQ) Fed Stafford Loan, Subsidized 45.4% 235328Health Education Assistance Loan 15.2% 235328Health Profession Student Loan 8.3% 235328Disadvantaged Students Loan 2.6% 235328Federal Perkins Loan 18.9% 235328Primary Care Loan 2.5% 235328University Or Medical School Loan 14.6% 235328Fed Supp Loans 17.4% 235328State Loans 4.2% 235328Assessed_GE 1 Good/Excellent Primary Care experiences 19.6% 235328Assessed_# of Good/Exce PC experiences 47.7% 235328Assess Primary Care elective as excellent 11.0% 322131Assess Primary Care elective as excellent or very good 14.3% 322131Plan to serve minority population 3.5% 322131Plan to serve under areas 3.7% 322131Plan to serve in social deprived areas 10.5% 322131Plan to obtain Primary Care Certification 67.7% 322131Ever married (at graduation) 49.6% 186237Premed loan=0 26.2% 322131Med loan=0 57.2% 322131No education loan 4.5% 322131Had premed loan 35.8% 235328Had med loan 75.5% 235328Had debt(med school+noneducational) 73.4% 235328Of those with loans or scholarships: $0-50K med loan 37.3% 177726$50-100K med loan 36.6% 177726$100-150K med loan 17.5% 177726
63
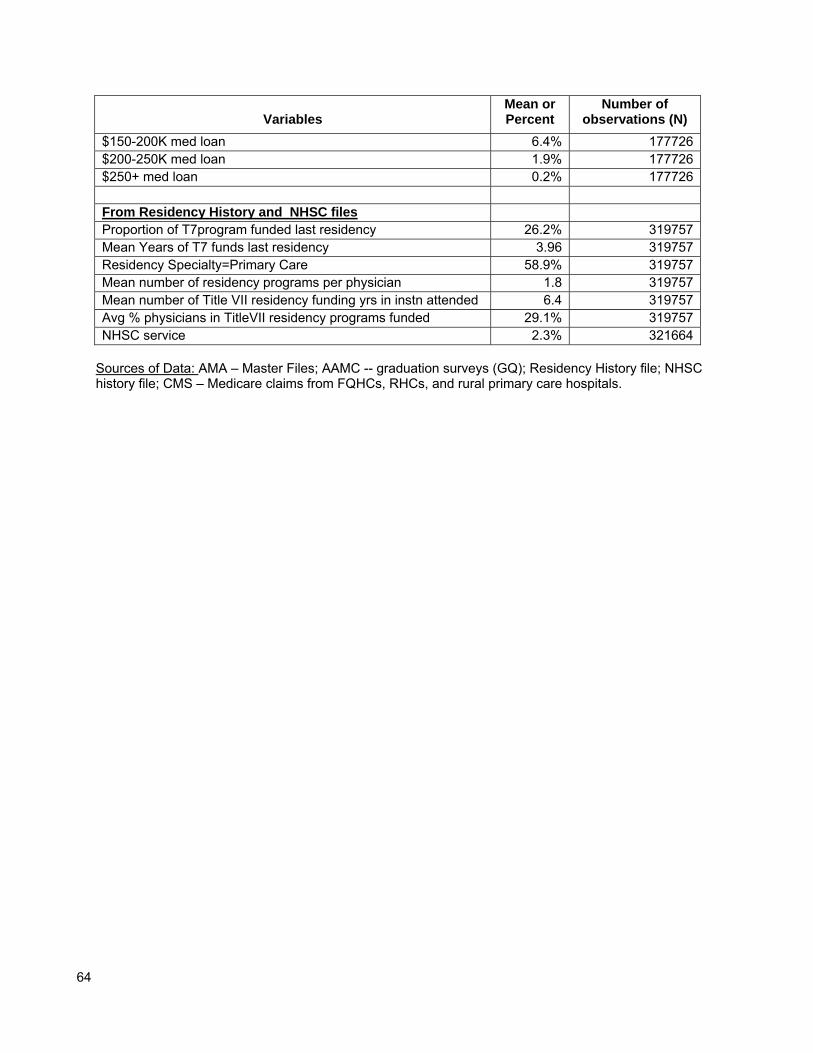
Variables
Mean or Percent
Number of observations (N)
$150-200K med loan 6.4% 177726$200-250K med loan 1.9% 177726$250+ med loan 0.2% 177726 From Residency History and NHSC files Proportion of T7program funded last residency 26.2% 319757Mean Years of T7 funds last residency 3.96 319757Residency Specialty=Primary Care 58.9% 319757Mean number of residency programs per physician 1.8 319757Mean number of Title VII residency funding yrs in instn attended 6.4 319757Avg % physicians in TitleVII residency programs funded 29.1% 319757NHSC service 2.3% 321664
Sources of Data: AMA – Master Files; AAMC -- graduation surveys (GQ); Residency History file; NHSC history file; CMS – Medicare claims from FQHCs, RHCs, and rural primary care hospitals.
64

Appendix B: Statistical Models, Outputs, Statistics Table B1: Response variable: Chose primary care career 95% Wald CI
Variable Estimate Odds ratio Lower Limit Upper limit Response: Chose primary care career Intercept -92.1487 Medical School debt $1-$50K* 0.0917 1.096 1.061 1.132Medical School debt $50-$100K* 0.1690 1.184 1.147 1.222Medical School debt $100-$150K* 0.1373 1.147 1.100 1.197Medical School debt $150-$200K* 0.1038 1.109 1.039 1.185Medical School debt $200-$250K* 0.0332 1.034 0.909 1.176Medical School debt over $250K* -0.0913 0.913 0.631 1.320Male -0.6326 0.531 0.519 0.544Married 0.2009 1.223 1.194 1.252Born in rural county 0.3730 1.452 1.294 1.629Age at graduation 0.00862 1.009 1.005 1.012Year of medical school graduation 0.0469 1.048 1.045 1.051NHSC Loan repayment 1.9526 7.047 6.070 8.180NHSC scholarship 1.4908 4.441 4.054 4.864Relative expected income -0.7834 0.457 0.421 0.496Medical School is in rural area 0.3220 1.380 1.145 1.662Public medical school 0.2377 1.268 1.235 1.303Medical school is community related 0.1744 1.191 1.134 1.249Experience in Title VII funded school 0.1008 1.106 1.074 1.139Experience in Title VII funded residency -0.5428 0.581 0.568 0.595 Hosmer and Lemeshow Goodness-of-Fit Chi-Square DF Pr > ChiSq 134.1014 8 <.0001Notes: *-Reference variable is “Non-educational debt.” d.f. represents “degrees of freedom.”
65
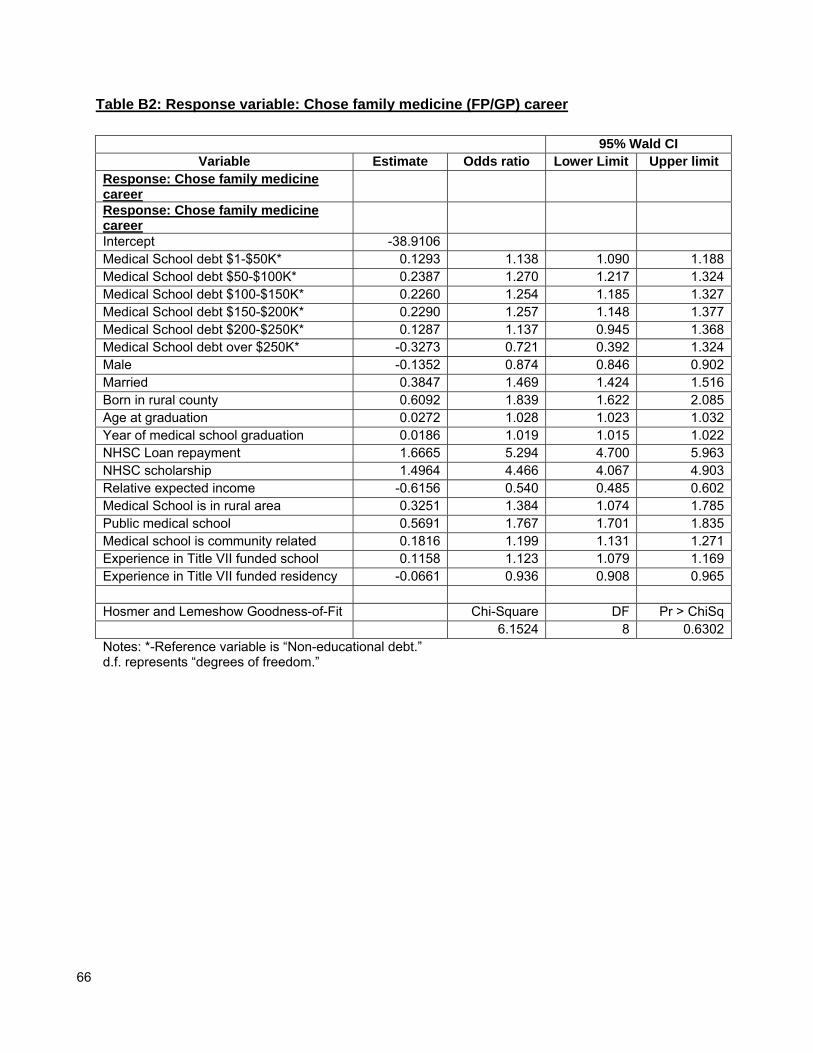
Table B2: Response variable: Chose family medicine (FP/GP) career
95% Wald CI Variable Estimate Odds ratio Lower Limit Upper limit
Response: Chose family medicine career
Response: Chose family medicine career
Intercept -38.9106 Medical School debt $1-$50K* 0.1293 1.138 1.090 1.188Medical School debt $50-$100K* 0.2387 1.270 1.217 1.324Medical School debt $100-$150K* 0.2260 1.254 1.185 1.327Medical School debt $150-$200K* 0.2290 1.257 1.148 1.377Medical School debt $200-$250K* 0.1287 1.137 0.945 1.368Medical School debt over $250K* -0.3273 0.721 0.392 1.324Male -0.1352 0.874 0.846 0.902Married 0.3847 1.469 1.424 1.516Born in rural county 0.6092 1.839 1.622 2.085Age at graduation 0.0272 1.028 1.023 1.032Year of medical school graduation 0.0186 1.019 1.015 1.022NHSC Loan repayment 1.6665 5.294 4.700 5.963NHSC scholarship 1.4964 4.466 4.067 4.903Relative expected income -0.6156 0.540 0.485 0.602Medical School is in rural area 0.3251 1.384 1.074 1.785Public medical school 0.5691 1.767 1.701 1.835Medical school is community related 0.1816 1.199 1.131 1.271Experience in Title VII funded school 0.1158 1.123 1.079 1.169Experience in Title VII funded residency -0.0661 0.936 0.908 0.965 Hosmer and Lemeshow Goodness-of-Fit Chi-Square DF Pr > ChiSq
6.1524 8 0.6302Notes: *-Reference variable is “Non-educational debt.” d.f. represents “degrees of freedom.”
66
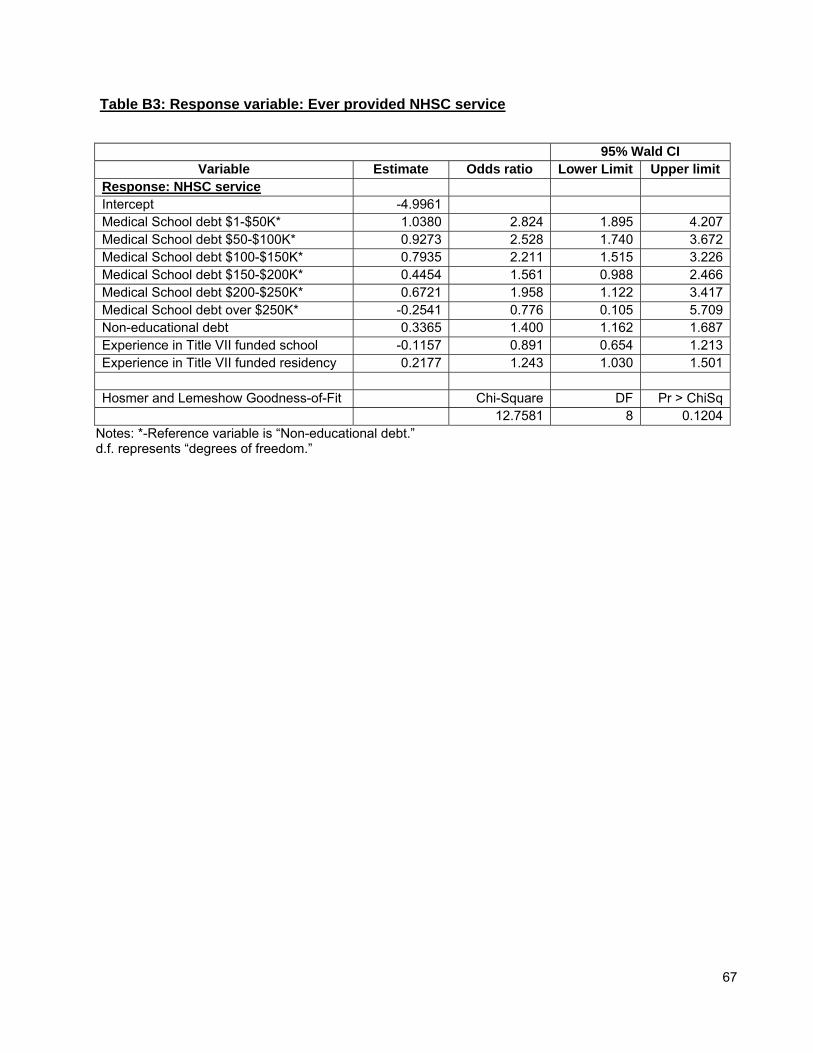
Table B3: Response variable: Ever provided NHSC service
95% Wald CI Variable Estimate Odds ratio Lower Limit Upper limit
Response: NHSC service Intercept -4.9961 Medical School debt $1-$50K* 1.0380 2.824 1.895 4.207Medical School debt $50-$100K* 0.9273 2.528 1.740 3.672Medical School debt $100-$150K* 0.7935 2.211 1.515 3.226Medical School debt $150-$200K* 0.4454 1.561 0.988 2.466Medical School debt $200-$250K* 0.6721 1.958 1.122 3.417Medical School debt over $250K* -0.2541 0.776 0.105 5.709Non-educational debt 0.3365 1.400 1.162 1.687Experience in Title VII funded school -0.1157 0.891 0.654 1.213Experience in Title VII funded residency 0.2177 1.243 1.030 1.501
Hosmer and Lemeshow Goodness-of-Fit Chi-Square DF Pr > ChiSq 12.7581 8 0.1204
Notes: *-Reference variable is “Non-educational debt.” d.f. represents “degrees of freedom.”
67
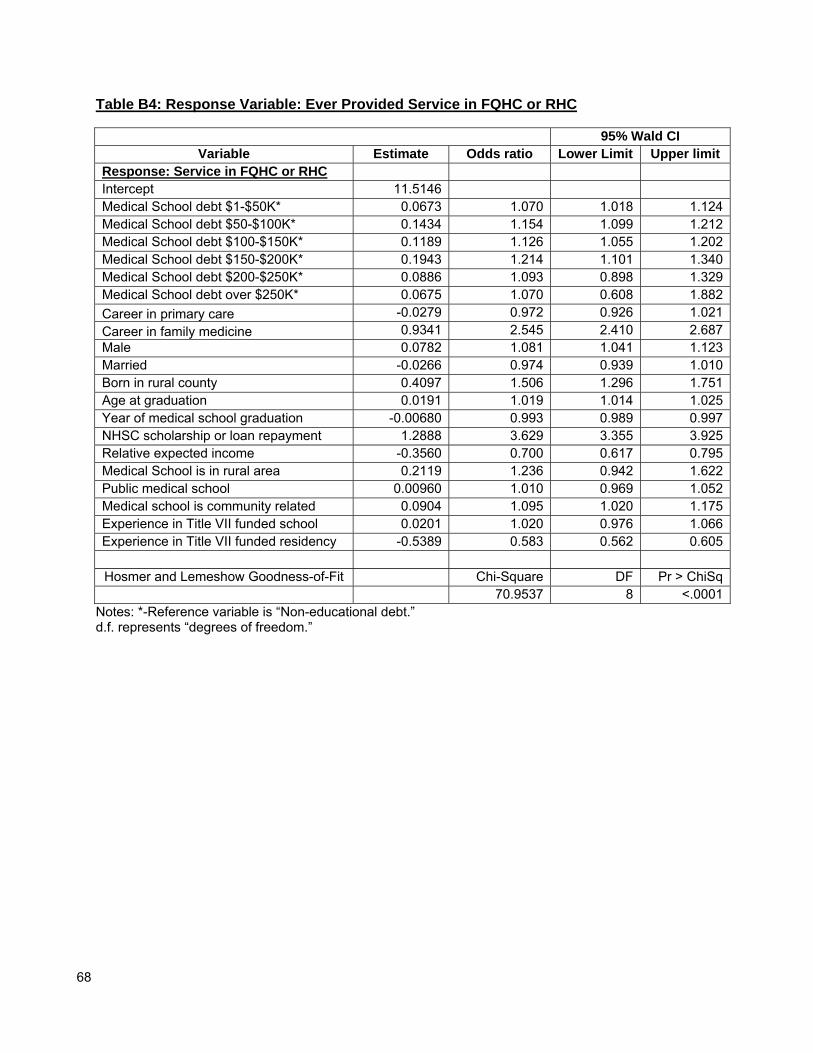
Table B4: Response Variable: Ever Provided Service in FQHC or RHC 95% Wald CI
Variable Estimate Odds ratio Lower Limit Upper limit Response: Service in FQHC or RHC Intercept 11.5146 Medical School debt $1-$50K* 0.0673 1.070 1.018 1.124Medical School debt $50-$100K* 0.1434 1.154 1.099 1.212Medical School debt $100-$150K* 0.1189 1.126 1.055 1.202Medical School debt $150-$200K* 0.1943 1.214 1.101 1.340Medical School debt $200-$250K* 0.0886 1.093 0.898 1.329Medical School debt over $250K* 0.0675 1.070 0.608 1.882Career in primary care -0.0279 0.972 0.926 1.021Career in family medicine 0.9341 2.545 2.410 2.687Male 0.0782 1.081 1.041 1.123Married -0.0266 0.974 0.939 1.010Born in rural county 0.4097 1.506 1.296 1.751Age at graduation 0.0191 1.019 1.014 1.025Year of medical school graduation -0.00680 0.993 0.989 0.997NHSC scholarship or loan repayment 1.2888 3.629 3.355 3.925Relative expected income -0.3560 0.700 0.617 0.795Medical School is in rural area 0.2119 1.236 0.942 1.622Public medical school 0.00960 1.010 0.969 1.052Medical school is community related 0.0904 1.095 1.020 1.175Experience in Title VII funded school 0.0201 1.020 0.976 1.066Experience in Title VII funded residency -0.5389 0.583 0.562 0.605
Hosmer and Lemeshow Goodness-of-Fit Chi-Square DF Pr > ChiSq
70.9537 8 <.0001Notes: *-Reference variable is “Non-educational debt.” d.f. represents “degrees of freedom.”
68
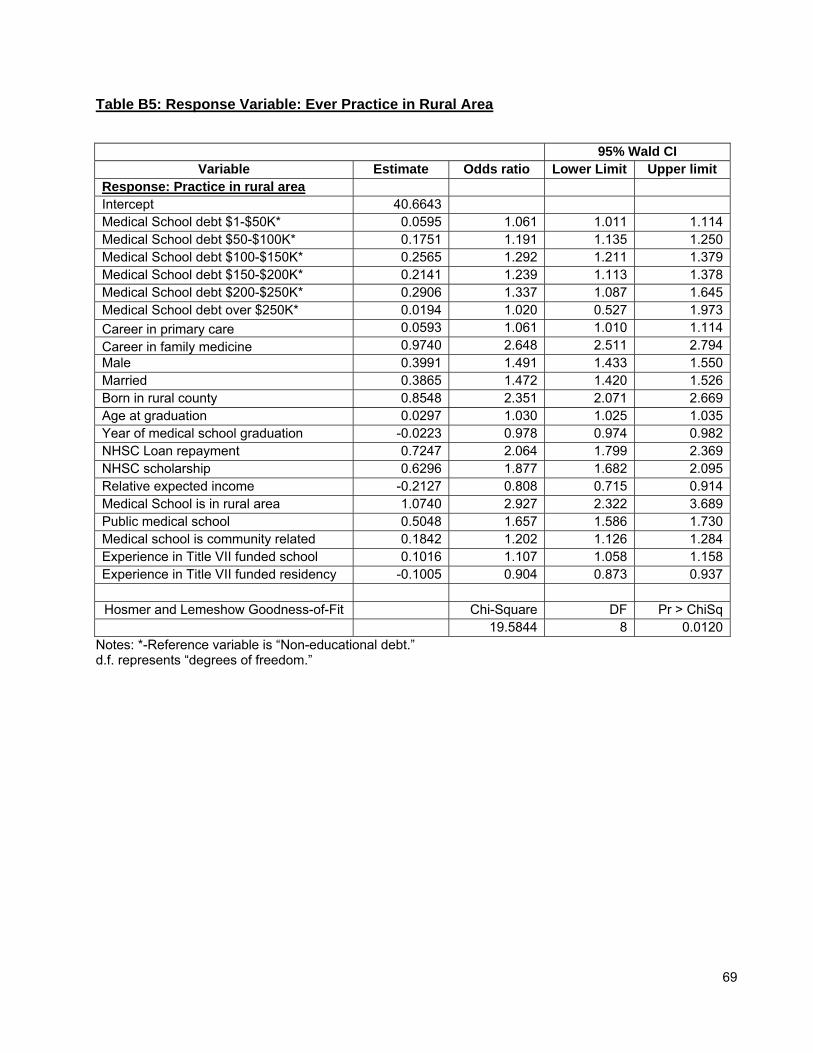
Table B5: Response Variable: Ever Practice in Rural Area 95% Wald CI
Variable Estimate Odds ratio Lower Limit Upper limit Response: Practice in rural area Intercept 40.6643 Medical School debt $1-$50K* 0.0595 1.061 1.011 1.114Medical School debt $50-$100K* 0.1751 1.191 1.135 1.250Medical School debt $100-$150K* 0.2565 1.292 1.211 1.379Medical School debt $150-$200K* 0.2141 1.239 1.113 1.378Medical School debt $200-$250K* 0.2906 1.337 1.087 1.645Medical School debt over $250K* 0.0194 1.020 0.527 1.973Career in primary care 0.0593 1.061 1.010 1.114Career in family medicine 0.9740 2.648 2.511 2.794Male 0.3991 1.491 1.433 1.550Married 0.3865 1.472 1.420 1.526Born in rural county 0.8548 2.351 2.071 2.669Age at graduation 0.0297 1.030 1.025 1.035Year of medical school graduation -0.0223 0.978 0.974 0.982NHSC Loan repayment 0.7247 2.064 1.799 2.369NHSC scholarship 0.6296 1.877 1.682 2.095Relative expected income -0.2127 0.808 0.715 0.914Medical School is in rural area 1.0740 2.927 2.322 3.689Public medical school 0.5048 1.657 1.586 1.730Medical school is community related 0.1842 1.202 1.126 1.284Experience in Title VII funded school 0.1016 1.107 1.058 1.158Experience in Title VII funded residency -0.1005 0.904 0.873 0.937
Hosmer and Lemeshow Goodness-of-Fit Chi-Square DF Pr > ChiSq
19.5844 8 0.0120Notes: *-Reference variable is “Non-educational debt.” d.f. represents “degrees of freedom.”
69
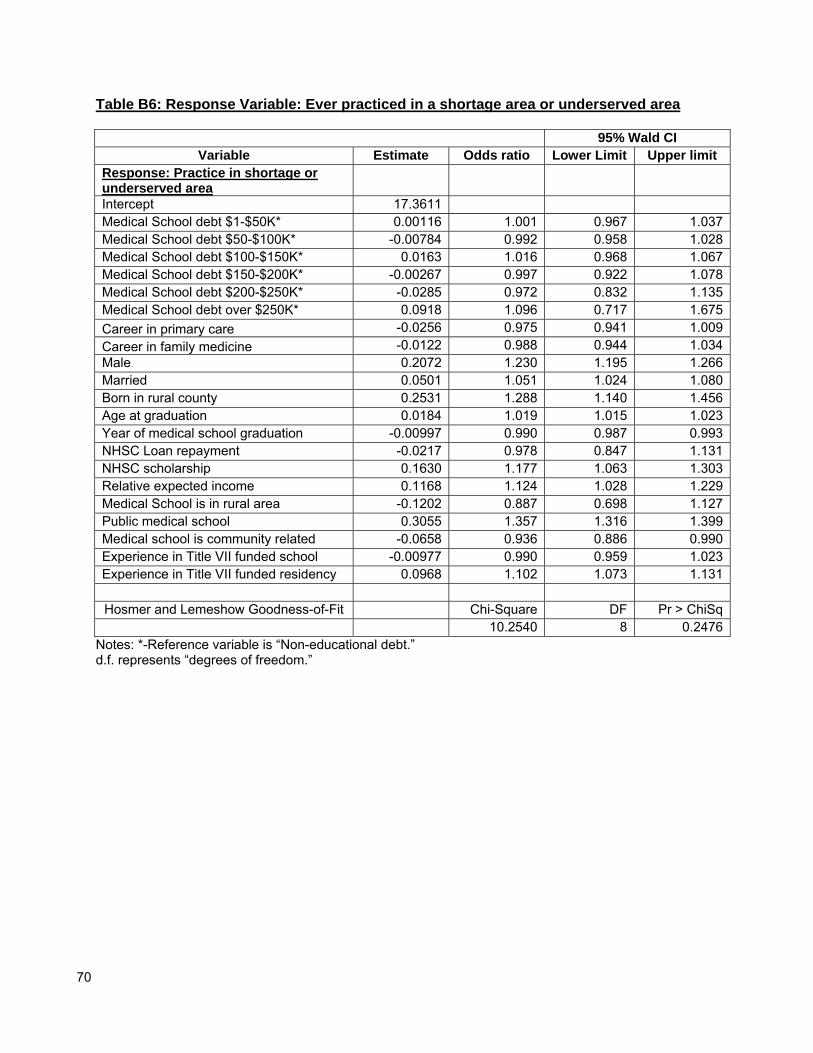
Table B6: Response Variable: Ever practiced in a shortage area or underserved area 95% Wald CI
Variable Estimate Odds ratio Lower Limit Upper limit Response: Practice in shortage or underserved area
Intercept 17.3611 Medical School debt $1-$50K* 0.00116 1.001 0.967 1.037Medical School debt $50-$100K* -0.00784 0.992 0.958 1.028Medical School debt $100-$150K* 0.0163 1.016 0.968 1.067Medical School debt $150-$200K* -0.00267 0.997 0.922 1.078Medical School debt $200-$250K* -0.0285 0.972 0.832 1.135Medical School debt over $250K* 0.0918 1.096 0.717 1.675Career in primary care -0.0256 0.975 0.941 1.009Career in family medicine -0.0122 0.988 0.944 1.034Male 0.2072 1.230 1.195 1.266Married 0.0501 1.051 1.024 1.080Born in rural county 0.2531 1.288 1.140 1.456Age at graduation 0.0184 1.019 1.015 1.023Year of medical school graduation -0.00997 0.990 0.987 0.993NHSC Loan repayment -0.0217 0.978 0.847 1.131NHSC scholarship 0.1630 1.177 1.063 1.303Relative expected income 0.1168 1.124 1.028 1.229Medical School is in rural area -0.1202 0.887 0.698 1.127Public medical school 0.3055 1.357 1.316 1.399Medical school is community related -0.0658 0.936 0.886 0.990Experience in Title VII funded school -0.00977 0.990 0.959 1.023Experience in Title VII funded residency 0.0968 1.102 1.073 1.131
Hosmer and Lemeshow Goodness-of-Fit Chi-Square DF Pr > ChiSq
10.2540 8 0.2476Notes: *-Reference variable is “Non-educational debt.” d.f. represents “degrees of freedom.”
70
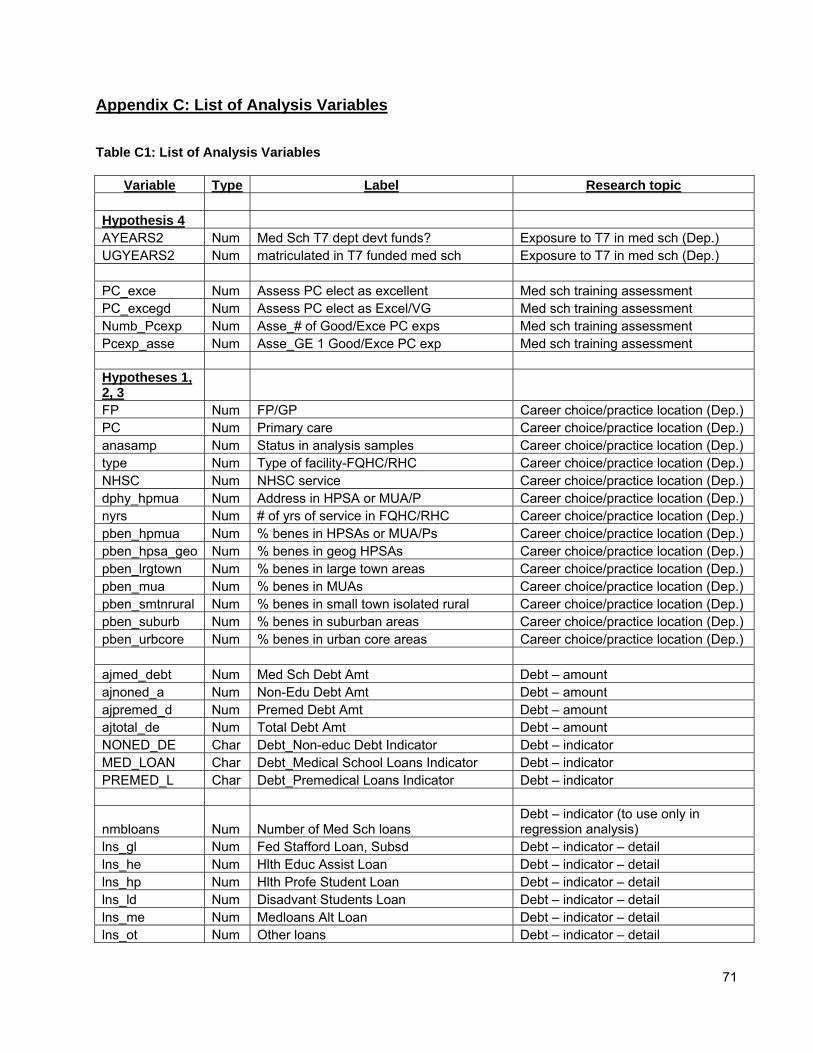
Appendix C: List of Analysis Variables Table C1: List of Analysis Variables
Variable Type Label Research topic Hypothesis 4 AYEARS2 Num Med Sch T7 dept devt funds? Exposure to T7 in med sch (Dep.) UGYEARS2 Num matriculated in T7 funded med sch Exposure to T7 in med sch (Dep.) PC_exce Num Assess PC elect as excellent Med sch training assessment PC_excegd Num Assess PC elect as Excel/VG Med sch training assessment Numb_Pcexp Num Asse_# of Good/Exce PC exps Med sch training assessment Pcexp_asse Num Asse_GE 1 Good/Exce PC exp Med sch training assessment Hypotheses 1, 2, 3 FP Num FP/GP Career choice/practice location (Dep.) PC Num Primary care Career choice/practice location (Dep.) anasamp Num Status in analysis samples Career choice/practice location (Dep.) type Num Type of facility-FQHC/RHC Career choice/practice location (Dep.) NHSC Num NHSC service Career choice/practice location (Dep.) dphy_hpmua Num Address in HPSA or MUA/P Career choice/practice location (Dep.) nyrs Num # of yrs of service in FQHC/RHC Career choice/practice location (Dep.) pben_hpmua Num % benes in HPSAs or MUA/Ps Career choice/practice location (Dep.) pben_hpsa_geo Num % benes in geog HPSAs Career choice/practice location (Dep.) pben_lrgtown Num % benes in large town areas Career choice/practice location (Dep.) pben_mua Num % benes in MUAs Career choice/practice location (Dep.) pben_smtnrural Num % benes in small town isolated rural Career choice/practice location (Dep.) pben_suburb Num % benes in suburban areas Career choice/practice location (Dep.) pben_urbcore Num % benes in urban core areas Career choice/practice location (Dep.) ajmed_debt Num Med Sch Debt Amt Debt – amount ajnoned_a Num Non-Edu Debt Amt Debt – amount ajpremed_d Num Premed Debt Amt Debt – amount ajtotal_de Num Total Debt Amt Debt – amount NONED_DE Char Debt_Non-educ Debt Indicator Debt – indicator MED_LOAN Char Debt_Medical School Loans Indicator Debt – indicator PREMED_L Char Debt_Premedical Loans Indicator Debt – indicator
nmbloans Num Number of Med Sch loans Debt – indicator (to use only in regression analysis)
lns_gl Num Fed Stafford Loan, Subsd Debt – indicator – detail lns_he Num Hlth Educ Assist Loan Debt – indicator – detail lns_hp Num Hlth Profe Student Loan Debt – indicator – detail lns_ld Num Disadvant Students Loan Debt – indicator – detail lns_me Num Medloans Alt Loan Debt – indicator – detail lns_ot Num Other loans Debt – indicator – detail
71
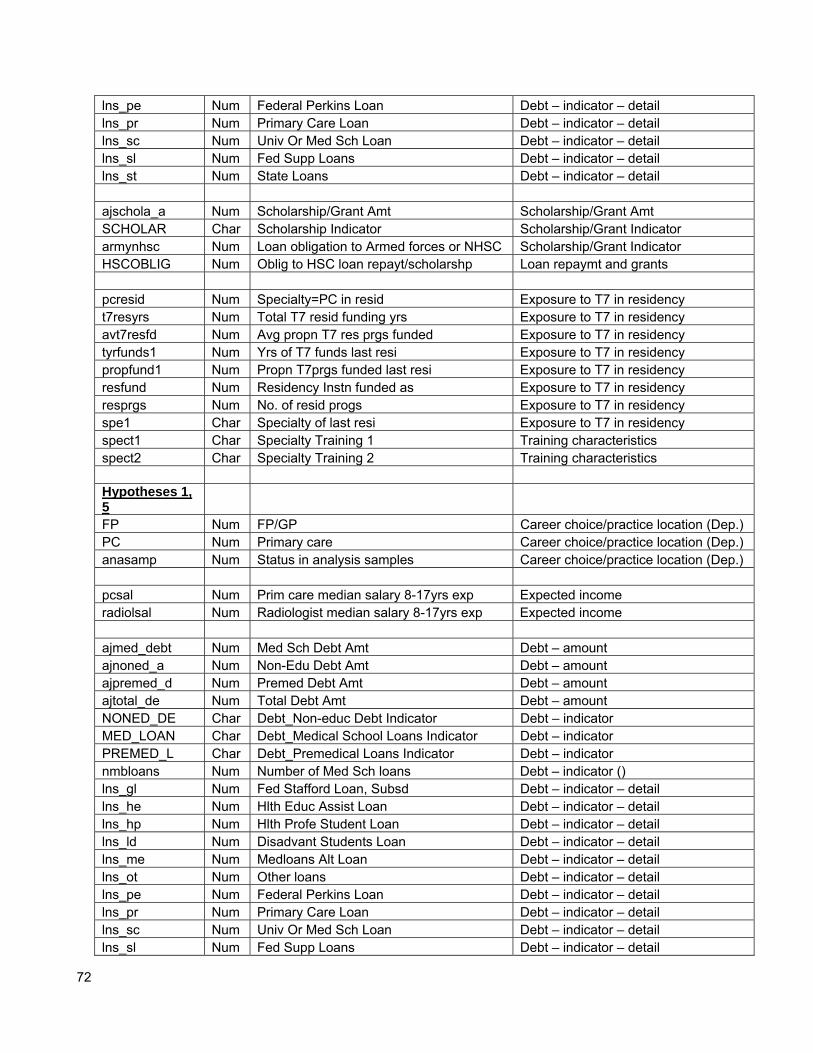
lns_pe Num Federal Perkins Loan Debt – indicator – detail lns_pr Num Primary Care Loan Debt – indicator – detail lns_sc Num Univ Or Med Sch Loan Debt – indicator – detail lns_sl Num Fed Supp Loans Debt – indicator – detail lns_st Num State Loans Debt – indicator – detail ajschola_a Num Scholarship/Grant Amt Scholarship/Grant Amt SCHOLAR Char Scholarship Indicator Scholarship/Grant Indicator armynhsc Num Loan obligation to Armed forces or NHSC Scholarship/Grant Indicator HSCOBLIG Num Oblig to HSC loan repayt/scholarshp Loan repaymt and grants pcresid Num Specialty=PC in resid Exposure to T7 in residency t7resyrs Num Total T7 resid funding yrs Exposure to T7 in residency avt7resfd Num Avg propn T7 res prgs funded Exposure to T7 in residency tyrfunds1 Num Yrs of T7 funds last resi Exposure to T7 in residency propfund1 Num Propn T7prgs funded last resi Exposure to T7 in residency resfund Num Residency Instn funded as Exposure to T7 in residency resprgs Num No. of resid progs Exposure to T7 in residency spe1 Char Specialty of last resi Exposure to T7 in residency spect1 Char Specialty Training 1 Training characteristics spect2 Char Specialty Training 2 Training characteristics Hypotheses 1, 5 FP Num FP/GP Career choice/practice location (Dep.) PC Num Primary care Career choice/practice location (Dep.) anasamp Num Status in analysis samples Career choice/practice location (Dep.) pcsal Num Prim care median salary 8-17yrs exp Expected income radiolsal Num Radiologist median salary 8-17yrs exp Expected income ajmed_debt Num Med Sch Debt Amt Debt – amount ajnoned_a Num Non-Edu Debt Amt Debt – amount ajpremed_d Num Premed Debt Amt Debt – amount ajtotal_de Num Total Debt Amt Debt – amount NONED_DE Char Debt_Non-educ Debt Indicator Debt – indicator MED_LOAN Char Debt_Medical School Loans Indicator Debt – indicator PREMED_L Char Debt_Premedical Loans Indicator Debt – indicator nmbloans Num Number of Med Sch loans Debt – indicator () lns_gl Num Fed Stafford Loan, Subsd Debt – indicator – detail lns_he Num Hlth Educ Assist Loan Debt – indicator – detail lns_hp Num Hlth Profe Student Loan Debt – indicator – detail lns_ld Num Disadvant Students Loan Debt – indicator – detail lns_me Num Medloans Alt Loan Debt – indicator – detail lns_ot Num Other loans Debt – indicator – detail lns_pe Num Federal Perkins Loan Debt – indicator – detail lns_pr Num Primary Care Loan Debt – indicator – detail lns_sc Num Univ Or Med Sch Loan Debt – indicator – detail lns_sl Num Fed Supp Loans Debt – indicator – detail
72
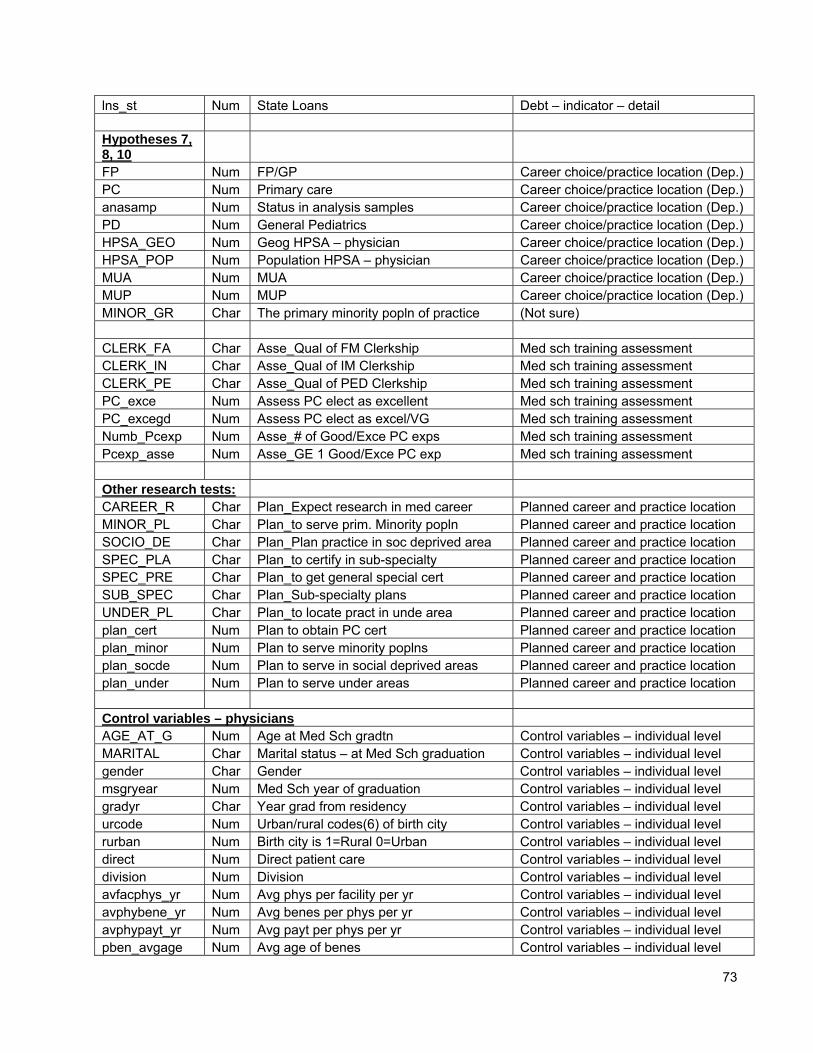
lns_st Num State Loans Debt – indicator – detail Hypotheses 7, 8, 10 FP Num FP/GP Career choice/practice location (Dep.) PC Num Primary care Career choice/practice location (Dep.) anasamp Num Status in analysis samples Career choice/practice location (Dep.) PD Num General Pediatrics Career choice/practice location (Dep.) HPSA_GEO Num Geog HPSA – physician Career choice/practice location (Dep.) HPSA_POP Num Population HPSA – physician Career choice/practice location (Dep.) MUA Num MUA Career choice/practice location (Dep.) MUP Num MUP Career choice/practice location (Dep.) MINOR_GR Char The primary minority popln of practice (Not sure) CLERK_FA Char Asse_Qual of FM Clerkship Med sch training assessment CLERK_IN Char Asse_Qual of IM Clerkship Med sch training assessment CLERK_PE Char Asse_Qual of PED Clerkship Med sch training assessment PC_exce Num Assess PC elect as excellent Med sch training assessment PC_excegd Num Assess PC elect as excel/VG Med sch training assessment Numb_Pcexp Num Asse_# of Good/Exce PC exps Med sch training assessment Pcexp_asse Num Asse_GE 1 Good/Exce PC exp Med sch training assessment Other research tests: CAREER_R Char Plan_Expect research in med career Planned career and practice location MINOR_PL Char Plan_to serve prim. Minority popln Planned career and practice location SOCIO_DE Char Plan_Plan practice in soc deprived area Planned career and practice location SPEC_PLA Char Plan_to certify in sub-specialty Planned career and practice location SPEC_PRE Char Plan_to get general special cert Planned career and practice location SUB_SPEC Char Plan_Sub-specialty plans Planned career and practice location UNDER_PL Char Plan_to locate pract in unde area Planned career and practice location plan_cert Num Plan to obtain PC cert Planned career and practice location plan_minor Num Plan to serve minority poplns Planned career and practice location plan_socde Num Plan to serve in social deprived areas Planned career and practice location plan_under Num Plan to serve under areas Planned career and practice location Control variables – physicians AGE_AT_G Num Age at Med Sch gradtn Control variables – individual level MARITAL Char Marital status – at Med Sch graduation Control variables – individual level gender Char Gender Control variables – individual level msgryear Num Med Sch year of graduation Control variables – individual level gradyr Char Year grad from residency Control variables – individual level urcode Num Urban/rural codes(6) of birth city Control variables – individual level rurban Num Birth city is 1=Rural 0=Urban Control variables – individual level direct Num Direct patient care Control variables – individual level division Num Division Control variables – individual level avfacphys_yr Num Avg phys per facility per yr Control variables – individual level avphybene_yr Num Avg benes per phys per yr Control variables – individual level avphypayt_yr Num Avg payt per phys per yr Control variables – individual level pben_avgage Num Avg age of benes Control variables – individual level
73
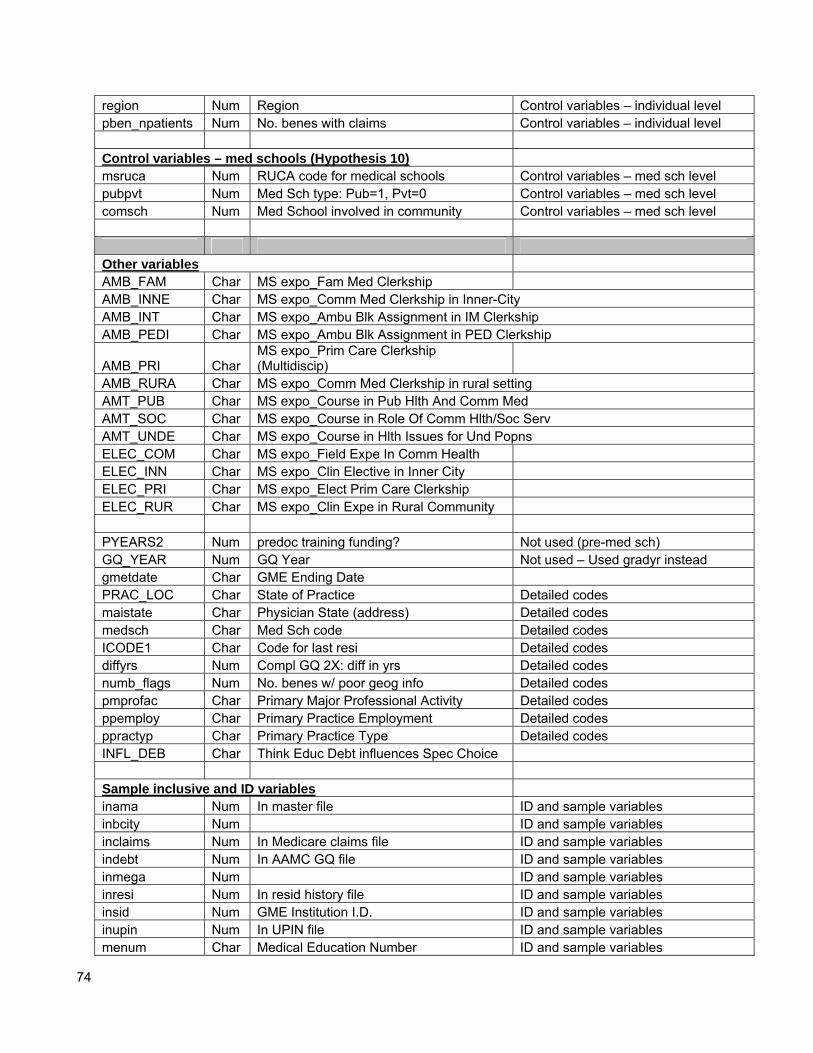
region Num Region Control variables – individual level pben_npatients Num No. benes with claims Control variables – individual level Control variables – med schools (Hypothesis 10) msruca Num RUCA code for medical schools Control variables – med sch level pubpvt Num Med Sch type: Pub=1, Pvt=0 Control variables – med sch level comsch Num Med School involved in community Control variables – med sch level Other variables AMB_FAM Char MS expo_Fam Med Clerkship AMB_INNE Char MS expo_Comm Med Clerkship in Inner-City AMB_INT Char MS expo_Ambu Blk Assignment in IM Clerkship AMB_PEDI Char MS expo_Ambu Blk Assignment in PED Clerkship
AMB_PRI Char MS expo_Prim Care Clerkship (Multidiscip)
AMB_RURA Char MS expo_Comm Med Clerkship in rural setting AMT_PUB Char MS expo_Course in Pub Hlth And Comm Med AMT_SOC Char MS expo_Course in Role Of Comm Hlth/Soc Serv AMT_UNDE Char MS expo_Course in Hlth Issues for Und Popns ELEC_COM Char MS expo_Field Expe In Comm Health ELEC_INN Char MS expo_Clin Elective in Inner City ELEC_PRI Char MS expo_Elect Prim Care Clerkship ELEC_RUR Char MS expo_Clin Expe in Rural Community PYEARS2 Num predoc training funding? Not used (pre-med sch) GQ_YEAR Num GQ Year Not used – Used gradyr instead gmetdate Char GME Ending Date PRAC_LOC Char State of Practice Detailed codes maistate Char Physician State (address) Detailed codes medsch Char Med Sch code Detailed codes ICODE1 Char Code for last resi Detailed codes diffyrs Num Compl GQ 2X: diff in yrs Detailed codes numb_flags Num No. benes w/ poor geog info Detailed codes pmprofac Char Primary Major Professional Activity Detailed codes ppemploy Char Primary Practice Employment Detailed codes ppractyp Char Primary Practice Type Detailed codes INFL_DEB Char Think Educ Debt influences Spec Choice Sample inclusive and ID variables inama Num In master file ID and sample variables inbcity Num ID and sample variables inclaims Num In Medicare claims file ID and sample variables indebt Num In AAMC GQ file ID and sample variables inmega Num ID and sample variables inresi Num In resid history file ID and sample variables insid Num GME Institution I.D. ID and sample variables inupin Num In UPIN file ID and sample variables menum Char Medical Education Number ID and sample variables
74
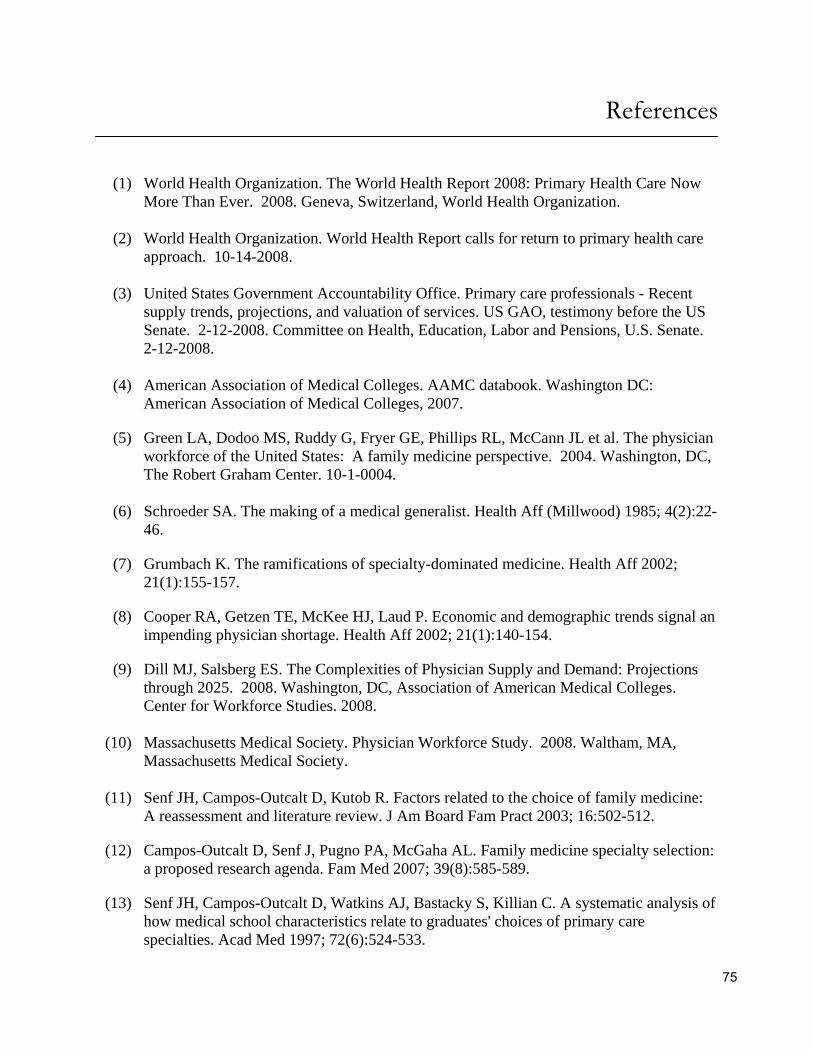
References (1) World Health Organization. The World Health Report 2008: Primary Health Care Now
More Than Ever. 2008. Geneva, Switzerland, World Health Organization. (2) World Health Organization. World Health Report calls for return to primary health care
approach. 10-14-2008. (3) United States Government Accountability Office. Primary care professionals - Recent
supply trends, projections, and valuation of services. US GAO, testimony before the US Senate. 2-12-2008. Committee on Health, Education, Labor and Pensions, U.S. Senate. 2-12-2008.
(4) American Association of Medical Colleges. AAMC databook. Washington DC:
American Association of Medical Colleges, 2007.
(5) Green LA, Dodoo MS, Ruddy G, Fryer GE, Phillips RL, McCann JL et al. The physician workforce of the United States: A family medicine perspective. 2004. Washington, DC, The Robert Graham Center. 10-1-0004.
(6) Schroeder SA. The making of a medical generalist. Health Aff (Millwood) 1985; 4(2):22-
46.
(7) Grumbach K. The ramifications of specialty-dominated medicine. Health Aff 2002; 21(1):155-157.
(8) Cooper RA, Getzen TE, McKee HJ, Laud P. Economic and demographic trends signal an impending physician shortage. Health Aff 2002; 21(1):140-154.
(9) Dill MJ, Salsberg ES. The Complexities of Physician Supply and Demand: Projections through 2025. 2008. Washington, DC, Association of American Medical Colleges. Center for Workforce Studies. 2008.
(10) Massachusetts Medical Society. Physician Workforce Study. 2008. Waltham, MA,
Massachusetts Medical Society. (11) Senf JH, Campos-Outcalt D, Kutob R. Factors related to the choice of family medicine:
A reassessment and literature review. J Am Board Fam Pract 2003; 16:502-512.
(12) Campos-Outcalt D, Senf J, Pugno PA, McGaha AL. Family medicine specialty selection: a proposed research agenda. Fam Med 2007; 39(8):585-589.
(13) Senf JH, Campos-Outcalt D, Watkins AJ, Bastacky S, Killian C. A systematic analysis of how medical school characteristics relate to graduates' choices of primary care specialties. Acad Med 1997; 72(6):524-533.
75
(14) Campos-Outcalt D, Senf J. A longitudinal, national study of the effect of implementing a required third-year family practice clerkship or a department of family medicine on the selection of family medicine by medical students. Acad Med 1999; 74(9):1016-1020.
(15) Rosenblatt RA, Whicomb ME, Cullen TJ, Lishner DM, Hart LG. The effects of federal grants on medical schools' production of primary care physicians. Public Health Policy Forum 1993; 83(3):322-328.
(16) Campos-Outcalt D, Senf J. Medical school financial support, faculty composition, and selection of family practice by medical students. Fam Med 1992; 24(8):596-601.
(17) Bland CJ, Meurer LN, Maldonado G. Determinants of primary care specialty choice: A non-statistical meta-analysis of the literature. Acad Med 1995; 70:620-641.
(18) Colquitt WL, Zeh MC, Killian CD, Cultice JM. Effect of debt on U.S. medical school graduates' preferences for family medicine, general internal medicine, and general pediatrics. Acad Med 1996; 71(4):399-411.
(19) Mengel MB, Davis AB. Required first-year generalist clinical experience courses and their relationship to career choice: the critical effect of family medicine involvement. Fam Med 1995; 27(10):652-657.
(20) Shi L, Samuels ME, Cochran CR, Glover S, Singh DA. Physician practice characteristics and satisfaction: a rural-urban comparison of medical directors at U.S. Community and Migrant Health Centers. J Rural Health 1998; 14(4):346-356.
(21) Curran V, Rourke J. The role of medical education in the recruitment and retention of rural physicians. Med Teach 2004; 26(3):265-272.
(22) Rabinowitz HK, Diamond JJ, Markham FW, Paynter NP. Critical factors for designing programs to increase the supply and retention of rural primary care physicians. JAMA 2001; 286(9):1041-1048.
(23) Brooks RG, Walsh M, Mardon RE, Lewis M, Clawson A. The roles of nature and nurture in the recruitment and retention of primary care physicians in rural areas: a review of the literature. Acad Med 2002; 77(8):790-798.
(24) Brooks RG, Mardon R, Clawson A. The rural physician workforce in Florida: a survey of US- and foreign-born primary care physicians. J Rural Health 2003; 19(4):484-491.
(25) Rabinowitz HK, Diamond JJ, Veloski JJ, Gayle JA. The impact of multiple predictors on generalist physicians' care of underserved populations. Am J Public Health 2000; 90(8):1225-1228.
(26) Chirayath HT. Who serves the underserved? Predictors of physician care to medically indigent patients. Health (London) 2006; 10(3):259-282.
76
(27) Curlin FA, Dugdale LS, Lantos JD, Chin MH. Do religious physicians disproportionately care for the underserved? Ann Fam Med 2007; 5(4):353-360.
(28) Acosta DA. Impact of rural training on physician work force: the role of postresidency education. J Rural Health 2000; 16(3):254-261.
(29) Rabinowitz HK, Diamond JJ, Markham FW, Wortman JR. Medical school programs to increase the rural physician supply: a systematic review and projected impact of widespread replication. Acad Med 2008; 83(3):235-243.
(30) Ko M, Heslin KC, Edelstein RA, Grumbach K. The role of medical education in reducing health care disparities: the first ten years of the UCLA/Drew Medical Education Program. J Gen Intern Med 2007; 22(5):625-631.
(31) Rabinowitz HK, Diamond JJ, Markham FW, Rabinowitz C. Long-term retention of graduates from a program to increase the supply of rural family physicians. Acad Med 2005; 80(8):728-732.
(32) Ko M, Edelstein RA, Heslin KC, Rajagopalan S, Wilkerson L, Colburn L et al. Impact of the University of California, Los Angeles/Charles R. Drew University Medical Education Program on medical students' intentions to practice in underserved areas. Acad Med 2005; 80(9):803-808.
(33) Morris CG, Johnson B, Kim S, Chen F. Training family physicians in community health centers: a health workforce solution. Fam Med 2008; 40(4):271-276.
(34) Weeks WB, Wallace AE. The more things change: revisiting a comparison of educational costs and incomes of physicians and other professionals. Acad Med 2002; 77(4):312-319.
(35) Steinbrook R. Medical Student Debt -- Is There a Limit? The New England Journal of Medicine 2008; 359(25):2629-2632.
(36) Kassebaum DG, Szenas PL. Relationship between indebtedness and the specialty choices of graduating medical students. Acad Med 1992; 67(10):700-707.
(37) Fox M. Medical student indebtedness and choice of specialization. Inquiry 1993; 30(1):84-94.
(38) Kassebaum DG, Szenas PL, Caldwell K. Educational debt, specialty choices, and practice intentions of underrepresented-minority medical school graduates. Acad Med 1993; 68(6):506-511.
(39) Rosenblatt RA, Andrilla CH. The impact of U.S. medical students' debt on their choice of primary care careers: an analysis of data from the 2002 medical school graduation questionnaire. Acad Med 2005; 80(9):815-819.
(40) Spar IL, Pryor KC, Simon W. Effect of debt level on the residency preferences of graduating medical students. Acad Med 1993; 68(7):570-572.
77
(41) Kiker BF, Zeh M. Relative income expectations, expected malpractice premium costs, and other determinants of physician specialty choice. J Health Soc Behav 1998; 39(2):152-167.
(42) Frank E, Feinglass S. Student loan debt does not predict female physicians' choice of primary care specialty. J Gen Intern Med 1999; 14(6):347-350.
(43) Kahn MJ, Markert RJ, Lopez FA, Specter S, Randall H, Krane NK. Is medical student choice of a primary care residency influenced by debt? Med Gen Med 2006; 8(4):18.
(44) Tonkin P. Effect of rising medical student debt on residency specialty selection at the University of Minnesota. Minn Med 2006; 89(6):46-7, 49.
(45) Hauer KE, Durning SJ, Kernan WN, Fagan MJ, Mintz M, O'Sullivan PS et al. Factors associated with medical students' career choices regarding internal medicine. JAMA 2008; 300(10):1154-1164.
(46) McDonald FS, West CP, Popkave C, Kolars JC. Educational debt and reported career plans among internal medicine residents. Ann Intern Med 2008; 149(6):416-420.
(47) Dial TH, Elliott PR. Relationship of scholarships and indebtedness to medical students' career plans. J Med Educ 1987; 62(4):316-324.
(48) Pathman DE, Konrad TR, King TS, Spaulding C, Taylor DH. Medical training debt and service commitments: the rural consequences. J Rural Health 2000; 16(3):264-272.
(49) Field E. Educational debt burden and career choice: Evidence from a financial aid experiment at NYU Law School. Amer Econ J: Applied Econ 2009; 1(1):1-21.
(50) Porterfield DS, Konrad TR, Porter CQ, Leysieffer K, Martinez RM, Niska R et al. Caring for the underserved: current practice of alumni of the National Health Service Corps. J Health Care Poor Underserved 2003; 14(2):256-271.
(51) Rosenblatt RA, Saunders G, Shreffler J, Pirani MJ, Larson EH, Hart LG. Beyond retention: National Health Service Corps participation and subsequent practice locations of a cohort of rural family physicians. J Am Board Fam Pract 1996; 9(1):23-30.
(52) Cullen TJ, Hart LG, Whitcomb ME, Rosenblatt RA. The National Health Service Corps: rural physician service and retention. J Am Board Fam Pract 1997; 10(4):272-279.
(53) Pathman DE, Konrad TR, Ricketts TC III. The comparative retention of National Health Service Corps and other rural physicians Results of a 9-year follow-up study. JAMA 1992; 268(12):1552-1558.
(54) Singer JD, Davidson SM, Graham S, Davidson HS. Physician retention in community and migrant health centers: who stays and for how long? Med Care 1998; 36(8):1198-1213.
78

(55) Pathman DE, Taylor DH Jr, Konrad TR, King TS, Harris T, Henderson TM et al. State scholarship, loan forgiveness, and related programs: the unheralded safety net. JAMA 2000; 284(16):2084-2092.
(56) Pathman DE, Konrad TR, King TS, Taylor DH, Koch GG. Outcomes of states' scholarship, loan repayment and related programs for physicians. Med Care 2004; 42(6):560-568.
(57) Sempowski IP. Effectiveness of financial incentives in exchange for rural and underserviced area return-of-service commitments: systematic review of the literature. Can J Rural Med 2004; 9(2):82-88.
(58) Senf JH, Campos-Outcalt D, Kutob R. Factors related to the choice of family medicine: a reassessment and literature review. J Am Board Fam Pract 2003; 16(6):502-512.
(59) Basco WT Jr, Buchbinder SB, Duggan AK, Wilson MH. Associations between primary care-oriented practices in medical school admission and the practice intentions of matriculants. Acad Med 1998; 73(11):1207-1210.
(60) Rosenblatt RA, Whitcomb ME, Cullen TJ, Lishner DM, Hart LG. Which medical schools produce rural physicians? JAMA 1992; 268(12):1559-65.
(61) Pathman DE, Konrad TR, Ricketts TC. Medical education and the retention of rural physicians. Health Serv Res 1994; 29(1):39-58.
(62) AAMC. AAMC Fact Sheet on the impact of Title VII health professions programs. www.aamc.org. 7-11-2005.
(63) Fryer GE, Meyers DS, Krol DM, Phillips RL, Green LA, Dovey SM et al. The
association of Title VII funding to departments of family medicine with choice of physician specialty and practice location. Fam Med 2002; 4(6):436-440.
(64) Advisory Committee on Training in Primary Care Medicine and Dentistry. Evaluating the impact of Title VII, section 747 programs. 2005.
(65) Ebell MH. Future salary and US residency fill rate revisited. JAMA 2008; 300(10):1131-
1132.
(66) Ebell MH. Choice of specialty: It's money that matters in the USA. JAMA 1989; 262(12):1630.
(67) Whitcomb ME, Cullen TJ, Hart LG, Lishner DM, Rosenblatt RA. Comparing the characteristics of schools that produce high percentages and low percentages of primary care physicians. Acad Med 1992; 67(9):587-591.
(68) Martini CJ, Veloski JJ, Barzansky B, Xu G, Fields SK. Medical school and student characteristics that influence choosing a generalist career. JAMA 1994; 272(9):661-668.
79
(69) Block SD, Clark-Chiarelli N, Peters AS, Singer JD. Academia's chilly climate for primary care. JAMA 1996; 276(9):677-682.
(70) Block SD, Clark-Chiarelli N, Singer JD. Mixed messages about primary care in the culture of U.S. medical schools. Acad Med 1998; 73(10):1087-1094.
(71) Rabinowitz HK. Recruitment, retention, and follow-up of graduates of a program to increase the number of family physicians in rural and underserved areas. N Engl J Med 1993; 328:934-939.
(72) Rabinowitz HK, Diamond JJ, Markham FW, Hazelwood CE. A program to increase the number of family physicians in rural and underserved areas: impact after 22 years. JAMA 1999; 281(3):255-260.
(73) Ramsey PG, Coombs JB, Hunt DD, Marshall SG, Wenrich MD. From concept to culture: the WWAMI program at the University of Washington School of Medicine. Acad Med 2001; 76(8):765-775.
(74) Schwarz MR. The WAMI Program: 25 years later. Med Teach 2004; 26(3):211-214.
(75) Rosenthal TC. Outcomes of rural training tracks: a review. J Rural Health 2000; 16(3):213-216.
(76) Ko M, Heslin KC, Edelstein RA, Grumbach K. The role of medical education in reducing health care disparities: the first ten years of the UCLA/Drew Medical Education Program. J Gen Intern Med 2007; 22(5):625-631.
(77) Ko M, Edelstein RA, Heslin KC, Rajagopalan S, Wilkerson L, Colburn L et al. Impact of the University of California, Los Angeles/Charles R. Drew University Medical Education Program on medical students' intentions to practice in underserved areas. Acad Med 2005; 80(9):803-808.
(78) Fryer GE Jr, Stine C, Vojir C, Miller M. Predictors and profiles of rural versus urban family practice. Fam Med 1997; 29(2):115-118.
(79) Easterbrook M, Godwin M, Wilson R, Hodgetts G, Brown G, Pong R et al. Rural background and clinical rural rotations during medical training: effect on practice location. CMAJ 1999; 160(8):1159-1163.
(80) Brush DR, Markert RJ, Lazarus CJ. The relationship between service learning and medical student academic and professional outcomes. Teach Learn Med 2006; 18(1):9-13.
(81) Meurer LN. Influence of medical school curriculum on primary care specialty choice: analysis and synthesis of the literature. Acad Med 1995; 70(5):388-397.
(82) Schwartz MD, Linzer M, Babbott D, Divine GW, Broadhead WE. The impact of an ambulatory rotation on medical student interest in internal medicine. The Society of
80
General Internal Medicine Task Force on Career Choice in Internal Medicine. J Gen Intern Med 1995; 10(10):542-549.
(83) Herold AH, Woodard LJ, Pamies RJ, Roetzheim RG, van Durme DJ, Micceri T. Influence of longitudinal primary care training on medical students' specialty choices. Acad Med 1993; 68(4):281-284.
(84) Woo B. Primary care--the best job in medicine? N Engl J Med 2006; 355(9):864-866.
(85) Rittenhouse DR, Fryer GE, Phillips RL, Miyoshi T, Neilson C, Goodman DC et al. Impact of Title VII training programs on community health center staffing and national health service corps participation. Ann Fam Med 2008.
(86) AAFP. National resident matching program. 2008. (87) Bodenheimer T. Primary Care-Will it Survive? N Engl J Med 2006; 355(9):861-864.
(88) Salsberg E, Rockey PH, Rivers KL, Brotherton SE, Jackson GR. US Residency Training Before and After the 1997 Balanced Budget Act. JAMA: The Journal of the American Medical Association 2008; 300(10):1174-1180.
(89) National Association of Community Health Centers, Robert Graham Center. Access denied: A look at America's medically disenfranchised. 2007. Washington DC.
(90) National Association of Community Health Centers, Robert Graham Center, The George
Washington University School of Public Health and Public Health Services. Access transformed: Building a primary care workforce for the 20th century. 2008.
(91) Fink KS, Phillips RL, Fryer GE, Koehn NN. International medical graduates and the rural
underserved primary care workforce. Health Aff 2003; 22(2):255-262.
(92) Phillips RL Jr, Bazemore AW, Dodoo MS, Shipman SA, Green LA. Family physicians in the child health care workforce: opportunities for collaboration in improving the health of children. Pediatrics 2006; 118(3):1200-1206.
(93) Fuchs E. With dept on the rise, students and schools face an uphill battle. AAMC Reporter: January 2008. 2008.
(94) Hyer J, Bazemore A, Bowman R, Zhang X, Petterson S, Phillips RL. Medical school
expansion: An immediate opportunity to meet rural health care needs. Robert Graham Center, editor. 50. 2007. Washington DC, AAFP.
(95) Weeks WB, Wallace AE, Wallace MM, Welch HG. A comparison of the educational
costs and incomes of physicians and other professionals. N Engl J Med 1994; 330(18):1280-1286.
(96) Hartman K. Application trends in professional school admissions. 2008. Vermont Law School.
81
(97) Starfield B, Fryer GE Jr. The primary care physician workforce: ethical and policy
implications. Ann Fam Med 2007; 5(6):486-491.
(98) General Accounting Office. Physician workforce: Physician supply increased in metropolitan and nonmetropolitan areas but geographic disparities persisted. GAO-o4-124. 2003. Washington, DC, General Accounting Office.
(99) Bunton SA, Mallon WT. Challenges and strategies of medical school expansion. Analysis
In Brief. 2008. Washington DC, Association of the American Medical Colleges. (100) Croasdale M. Flood of new medical schools filling accreditation pipeline. While some
future medical schools exist only on paper, 12 are in the process of leaping the official hurdle. AMNews. 1-21-2008.
(101) Association of Academic Health Centers. Out of order out of time: The state of the
Nation's health workforce. 2008. 2008. (102) Robert Graham Center. The patient centered medical home: History, seven core features,
evidence and transformational change. 2007. Washington DC. (103) Barr MS. The need to test the patient-centered medical home. JAMA 2008; 300(7):834-
835.
(104) Robert Graham Center, NACHC. Access denied: A look at America's medically disenfranchised. 2007. Washington DC.
(105) Kaiser Commission on Medicaid and the Uninsured. Trends in access to care among
working-age adults, 1997-2006. 7824. 10-15-2008. Washington DC, The Kaiser Family Foundation.
(106) Council on Graduate Medical Education. Nineteenth Report: Enhancing Flexibility in
Medical Education. 19. 2008. Rockville, MD, COGME. (107) Medicare Payment Advisory Commission. Promoting the Use of Primary Care. Report to
Congress: Reforming the Delivery System. Washington, DC: Medpac, 2008: 23-51.
(108) Jolly P. Medical School Tuition And Young Physicians' Indebtedness. Health Aff 2005; 24(2):527-535.
82