special study saskatchewan ict industry profile …s3.amazonaws.com/zanran_storage/ ©2005 idc list...
TRANSCRIPT

Filing Information: April 2005, IDC #05-755, Volume: 1 IDC Canada Consulting: Special Study for the Saskatchewan ITO
S P E C I A L S T U D Y
S a s k a t c h e w a n I C T I n d u s t r y P r o f i l e
Sam Farag Francis Chang Tony Olvet
E X E C U T I V E S U M M A R Y
IDC Canada's most recent market sizing and forecast pegs Saskatchewan's end-user information technology (IT) spending in 2004 at approximately $806 million. IT spending is forecast to grow modestly reaching just under $840 million in 2008 (all figures in Canadian dollars). Of the total IT spending, approximately 87% is generated by business and government organizations in the province.
Telecommunications end-user spending as of 2004 was approximately $928 million. However, in contrast to IT spending, business and government spending represents only half of all telecommunications in the province of Saskatchewan; the remaining half is from home/consumers. Total spending on telecommunications services is forecast to grow at a CAGR of 4.0% from 2003 to 2008 exceeding $1 billion in 2006.
Other key research findings from secondary sources that IDC has covered in the report include:
Saskatchewan makes up 2.7% of total information and communications technology (ICT) spending in Canada.
In 2002, the gross domestic product (GDP) for ICT goods manufacturing in Saskatchewan was $136 million, and the GDP for ICT services was $860 million.
The Prairie region (which includes Manitoba and Saskatchewan) produced approximately 1% of Canada's ICT manufacturing goods exports in 2002.
When comparing all industries' contribution to exports, ICT only accounts for 1% of the Prairie region's exports (as of 2002).
Software and computer services firms represented approximately 62% of total ICT firms in Saskatchewan in 2004.
Saskatchewan employed approximately 1.5% of the total Canadian IT workforce in 2001.
The average earnings of the IT workforce in Saskatchewan ranks sixth against other provinces in Canada.
36 T
oron
to S
treet
Sui
te 3
00 T
oron
to, O
ntar
io M
5C2C
5 C
anad
a P
.416
.369
.003
3

#05-755 ©2005 IDC

©2005 IDC #05-755
T A B L E O F C O N T E N T S
P
Executive Summary 1
In This Study 1
Canadian and Saskatchewan Economic overview 1 National Economic Overview.................................................................................................................... 1
Economy ........................................................................................................................................... 1 Bank Rate.......................................................................................................................................... 1 Employment....................................................................................................................................... 1 Consumer Price Index ....................................................................................................................... 1
Saskatchewan Economic Overview.......................................................................................................... 2 Economy ........................................................................................................................................... 2 Employment....................................................................................................................................... 2 Consumer Price Index ....................................................................................................................... 2 Saskatchewan End-User ICT Spending Forecast ............................................................................. 2
Canadian ICT overview 3 National ICT Economic Overview ............................................................................................................. 3 Prair ie ICT overview 10 Saskatchewan and Manitoba ICT Economic Summary ............................................................................ 10 ICT Revenue: Prairie Region.................................................................................................................... 11 ICT GDP: Saskatchewan.......................................................................................................................... 12 ICT Employment: Prairie Region .............................................................................................................. 13 ICT Exports: Prairies Region .................................................................................................................... 15 ICT R&D: Prairies Region......................................................................................................................... 18 Number of ICT Businesses in Saskatchewan........................................................................................... 19 IT Employment in Saskatchewan ............................................................................................................. 20 Appendix 29
Related Secondary Research and Sources 35

#05-755 ©2005 IDC
L I S T O F T A B L E S
P
1 Saskatchewan and Canada End-User IT and Telecommunications Spending Forecast 2003-2008.................................................................................................................................... 3
2 Regional Comparison of ICT Sector, Compound Annual Growth Rate, by Key Variable, 1995-2002.................................................................................................................................... 10
3 Information and Communications Technology Sectors ................................................................ 29
4 Definition of IT Employment Sector / Occupation Classification as Used in this Document ......... 30
5 ICT Sector GDP at Basic Prices, 2000-2003 (in 1997 constant dollars) ...................................... 31
6 Exports of ICT Goods and Services, 2000-2003 .......................................................................... 32
7 Gross Domestic Product of ICT Sector (GDP millions of chained $ (1997))................................. 33
8 Number of Businesses by ICT Defined Sub-Sectors in Saskatchewan, 2004.............................. 34

©2005 IDC #05-755
L I S T O F F I G U R E S
P
1 ICT Revenues 1997 to 2003 ........................................................................................................ 4
2 National and ICT GDP Growth Rates........................................................................................... 5
3A ICT Exports, 1997 to 2003 ........................................................................................................... 6
3B ICT Imports, 1997 to 2003............................................................................................................ 7
4 ICT Employment, 1997 to 2003.................................................................................................... 8
5 ICT Intramural R&D Expenditures, 1997 to 2003 ......................................................................... 9
6 Distribution of Prairies ICT Revenue by Sub-Sector, 2002 .......................................................... 11
7 Distribution of Canadian ICT Revenue by Region, 2002.............................................................. 12
8 Saskatchewan ICT GDP, 1997 to 2002 ....................................................................................... 13
9 Distribution of Employment by ICT Industry, Prairies, 2002 ......................................................... 14
10 Distribution of Exports of ICT Manufacturing Goods by Region, 2002 ($20.9 Billion) .................. 15
11 Export of ICT Manufacturing Goods Share of Total Regional Exports, 2002 ............................... 16
12 ICT Exports by Product Group, Prairies, 2002 ($216.6 Million).................................................... 17
13 Distribution of R&D Expenditures by Region, 2001 ($6.5 Billion) ................................................. 18
14 Percentage of Total R&D devoted to ICT by Region, 1999-2001................................................. 19
15 Distribution of ICT Businesses in Saskatchewan, 2004 ............................................................... 20
16 Distribution of the IT Workforce by Province and Territories, Canada 2001................................. 21
17 Percent of IT Workforce in the Labour Force of Each Respective Province, Canada 2001 ......... 22
18 Distribution of IT Workforce by Industry 2001 .............................................................................. 23
19 Share of IT Workers in Total Employment by Sector, Saskatchewan 2001 ................................. 24
20 Distribution of IT Workforce by Occupation, 2001 ........................................................................ 25
21 Employment Income (in dollars) for the IT Workforce by Province, Canada 2001 ....................... 26
22 Percent of Male Workers by IT Occupations Saskatchewan 2001............................................... 27
23 Percent of IT Workers with Post-Secondary and University Schooling, Saskatchewan 2001 ...... 28


©2005 IDC #05-755 1
I N T H I S S T U D Y
The Saskatchewan ICT Industry Profile report is the first step to consolidate intelligence on the Saskatchewan ICT industry. It draws information from a number of sources including IDC Canada, Industry Canada, Statistics Canada, the Software Human Resource Council, and the Saskatchewan Bureau of Statistics. The summary of information is provided throughout the report, with brief commentary. Additional supporting data is provided in the appendix.
Throughout this document the ICT sector and IT employment by occupation classification are cited regularly. Please refer to the appendix for definitions of the ICT industry and IT employment used in this document.
C A N A D I A N A N D S A S K A T C H E W A N E C O N O M I C O V E R V I E W
N a t i o n a l E c o n o m i c O v e r v i e w
Economy
Canada's GDP grew at 2.8% in 2004. Rising export demand accounted for the entire gain in Canada's GDP growth last year, which was up from 1.7% in 2003. Growth in domestic demand remained virtually unchanged at 3.8%, supported by strengthening business investment. (The Daily, Statistics Canada, April 14, 2005).
Bank Rate
As of April 2005, the Bank rate stands at 2.75%. After a drop of 75 points from January to April of 2004 to 2.25%, the rate increased 50 points from September to October 2004 and has remained steady to date.
Employment
As of March 2005, Canada's labour force stood at 17,053,300, an annual change of 1.0%, and the number of people employed in Canada stood at 15,800,800, an annual change of 1.5%. The national unemployment rate is 6.9% (The Daily, Statistics Canada, April 8, 2005)
Consumer Price Index
Consumers paid 2.3% more in March 2005 than the same month a year earlier for the goods and services included in the Consumer Price Index (CPI). This increase followed a 12-month rise of 2.1% in February. (The Daily, Statistics Canada, April 22, 2005)

2 #05-755 ©2005 IDC
S a s k a t c h e w a n E c o n o m i c O v e r v i e w
Economy
Following real GDP decline in 2001 of -1.7% and a 0.1% increase in 2002, Saskatchewan rebounded sharply with 4.5% real GDP growth in 2003. A large part of the 2003 rebound in economic growth was a result of the 46% rise in crop production. The province's 2004 real GDP grew at 3.5%, outpacing Canada's overall GDP growth of 2.8%. Petroleum-related production and exploration were spurred by historically high oil prices. The manufacturing sector also experienced 11.5% growth, its strongest performance in a decade. Meat processors boosted production to deal with the surplus of cattle due to the closure of the American border. (Saskatchewan Bureau of Statistics, Economic Review 2004, Number 58, December 2004 and The Daily, Statistics Canada, April 27, 2005)
Employment
As of March 2005, Saskatchewan's labour force stood at 507,600, an annual change of 1.8% and the number of people employed in Saskatchewan stood at 479,500, an annual change of 2.8%. Saskatchewan's unemployment rate is 5.2%. (The Daily, Statistics Canada, April 8, 2005)
Consumer Price Index
Saskatchewan consumers paid 3.2% more in March than the same month a year earlier based on goods and services measured in the Consumer Price Index. The CPI for Saskatchewan in February was 2.9%. (The Daily, Statistics Canada, April 22, 2005)
Saskatchewan End-User ICT Spending Forecast
Saskatchewan's end-user IT spending is forecast to grow modestly reaching almost $840 million in 2008. End-user telecommunications spending is forecast to grow at a CAGR of 4.0% from 2003 to 2008 exceeding $1 billion in 2006 (see Table 1). Saskatchewan accounts for 2.7% of total ICT spending in Canada.
IT spending includes IT hardware, packaged software and external IT services by both businesses and consumers. Telecommunications spending includes local wireline services, long distance, data services, Internet access and wireless voice and data services.

©2005 IDC #05-755 3
T A B L E 1
S a s k a t c h e w a n a n d C a n a d a E n d - U s e r I T a n d T e l e c o m m u n i c a t i o n s S p e n d i n g F o r e c a s t 2 0 0 3 - 2 0 0 8 ( $ M )
2003 2004 2005 2006 2007 2008 03-08 CAGR
Saskatchewan IT 809.4 806.2 822.4 829.9 831.1 839.7 0.7% Telecom 900.8 928.0 964.3 1,008.4 1,053.6 1,095.3 4.0% Saskatchewan Total 1,710.2 1,734.3 1,786.7 1,838.3 1,884.7 1,934.9 2.5%
Canada IT 34,610.0 35,830.4 37,249.5 38,381.5 39,346.3 40,589.7 3.2% Telecom 28,878.6 29,967.7 31,348.4 33,005.5 34,766.3 36,401.9 4.7% Canada Total 63,488.6 65,798.1 68,598.0 71,387.0 74,112.6 76,991.5 3.9%
Notes: The telecom wholesale market segment is not included. The telecom wholesale segment is defined as revenue derived from the lease or sale of telecommunications facilities and services between carriers and from carrier-to-reseller. For further market details, please refer to the SK IT and Telecom spending pivot tables.
Source: IDC Canada, 2005
C A N A D I A N I C T O V E R V I E W
N a t i o n a l I C T E c o n o m i c O v e r v i e w
Revenues: ICT revenues were estimated at $130 billion in 2003, a slight decrease of 1.1% from 2002 in Canada (see Figure 1). Revenues for the entire ICT sector grew at a CAGR of 4.9% over the 1997-2003 period. Revenues in the ICT manufacturing industries declined for a third consecutive year in 2003 whereas ICT services industries has steadily grown in the last 3 years. The ICT wholesaling, rental and leasing industries' revenues remained relatively stable over the last three years. See the Appendix for revenues by ICT sub-sectors.
Source: Information and Communications Technologies Branch – Industry Canada ICT Sector Revenues, 2003 Estimates, November 2004.

4 #05-755 ©2005 IDC
F I G U R E 1
I C T R e v e n u e s 1 9 9 7 t o 2 0 0 3 ( $ B )
32.1 34.1 38.5 40.3 38.3 38.5 38.3
38.448.8
54.760.4 64.3 66.0 66.8
26.8
29.3
33.7
44.8 34.1 26.5 24.4
0
20
40
60
80
100
120
140
160
1997 1998 1999 2000 2001 2002 2003
Year
Rev
enue
s ($
B)
Total ICTManufacturing
Total ICT Services
ICT Wholesaling,Rental and Leasing
97.3 112.2 126.9 145.5 136.7 130.9 129.5
Source: Information and Communications Technologies Branch - Industry Canada ICT Sector Revenues, 2003 Estimates, November 2004
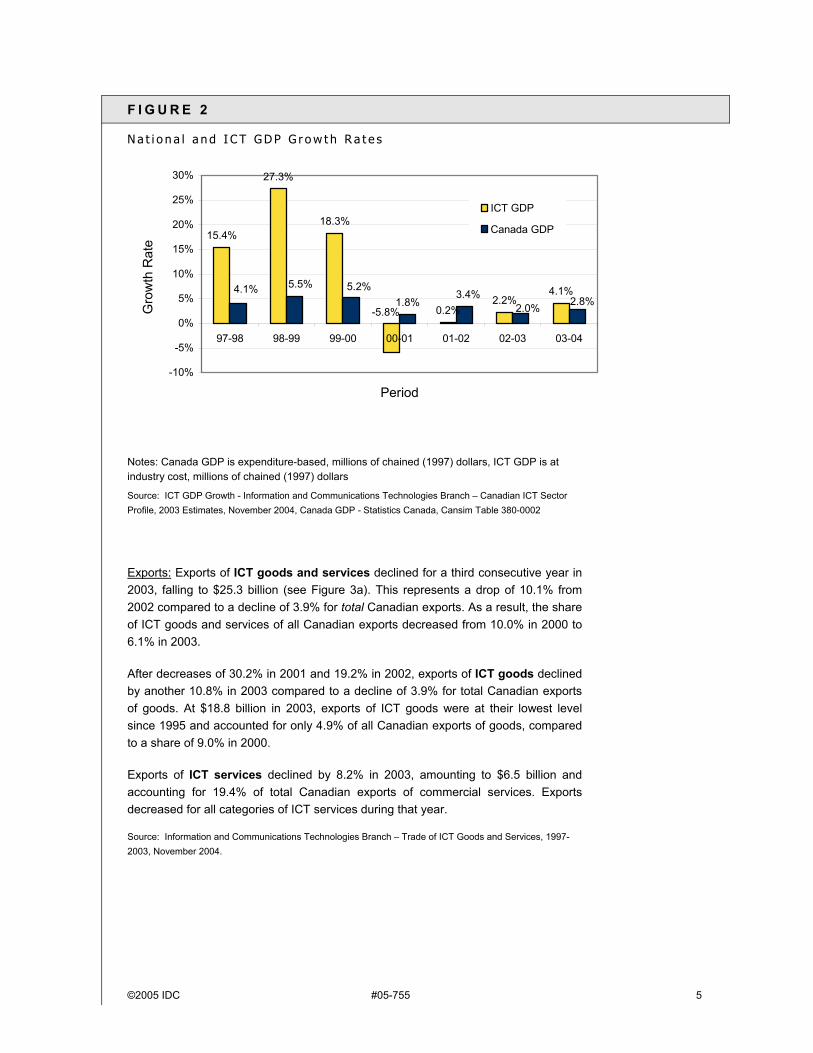
GDP: After posting a compound annual growth rate (CAGR) of 20.2% in GDP growth from 1997 to 2000 driven in part by Y2K compliance, the National ICT industry contracted in 2001 showing –5.8% decline (see Figure 2). The post-Y2K let down was also coupled with the collapse of the Internet boom in 2001.
In 2002, ICT GDP grew slightly at 0.2% and has shown steady positive growth in 2003 and 2004 of 2.2% and 4.1% (estimate) respectively. The ICT GDP has grown at a CAGR of 8.3% over the 1997 to 2004 period, outpacing the National GDP of 3.5% over the same period.
©2005 IDC #05-755 5
F I G U R E 2
N a t i o n a l a n d I C T G D P G r o w t h R a t e s
15.4%
27.3%
18.3%
0.2%2.2%
4.1%1.8%
-5.8%2.8%2.0%
3.4%5.2%5.5%4.1%
-10%
-5%
0%
5%
10%
15%
20%
25%
30%
97-98 98-99 99-00 00-01 01-02 02-03 03-04
Period
Gro
wth
Rat
e
ICT GDP
Canada GDP
Notes: Canada GDP is expenditure-based, millions of chained (1997) dollars, ICT GDP is at industry cost, millions of chained (1997) dollars
Source: ICT GDP Growth - Information and Communications Technologies Branch – Canadian ICT Sector Profile, 2003 Estimates, November 2004, Canada GDP - Statistics Canada, Cansim Table 380-0002
Exports: Exports of ICT goods and services declined for a third consecutive year in 2003, falling to $25.3 billion (see Figure 3a). This represents a drop of 10.1% from 2002 compared to a decline of 3.9% for total Canadian exports. As a result, the share of ICT goods and services of all Canadian exports decreased from 10.0% in 2000 to 6.1% in 2003.
After decreases of 30.2% in 2001 and 19.2% in 2002, exports of ICT goods declined by another 10.8% in 2003 compared to a decline of 3.9% for total Canadian exports of goods. At $18.8 billion in 2003, exports of ICT goods were at their lowest level since 1995 and accounted for only 4.9% of all Canadian exports of goods, compared to a share of 9.0% in 2000.
Exports of ICT services declined by 8.2% in 2003, amounting to $6.5 billion and accounting for 19.4% of total Canadian exports of commercial services. Exports decreased for all categories of ICT services during that year.
Source: Information and Communications Technologies Branch – Trade of ICT Goods and Services, 1997-2003, November 2004.

6 #05-755 ©2005 IDC
F I G U R E 3 A
I C T E x p o r t s , 1 9 9 7 t o 2 0 0 3
22.1 23.6 25.8
37.3
26.021.0 18.8
4.25.2
6.3
6.9
7.2
7.16.5
0
5
10
15
20
25
30
35
40
45
50
1997 1998 1999 2000 2001 2002 2003
Year
($B
)
ICT Services ExportsICT Goods Exports
26.3 28.8 32.1 44.2 33.2 28.1 25.3
Notes: ICT services also includes news agency services, which are not part of the ICT definition.
Source: Information and Communications Technologies Branch – Trade of ICT Goods and Services, 1997-2003, November 2004.

©2005 IDC #05-755 7
Imports: Imports of ICT goods and services continued to decline in 2003. They fell to $42.5 billion, down 7.9% from 2002 compared to a decrease of 3.5% for total Canadian imports. As a result, ICT goods and services accounted for 11.4% of all Canadian imports in 2003 versus 15.7% in 2000.
Imports of ICT goods also declined for a third consecutive year in 2003. They fell to $38.8 billion, down 8.2% from 2002 compared to a decrease of 3.8% in total Canadian imports of goods. As a result, the ICT share of all Canadian imports of goods declined from 16.0% in 2000 to 11.6% in 2003.
Imports of ICT services declined by 4.9% in 2003, totaling $3.8 billion and accounting for 10.1% of all Canadian imports of commercial services.
Source: Information and Communications Technologies Branch – Trade of ICT Goods and Services, 1997-2003, November 2004.
F I G U R E 3 B
I C T I m p o r t s , 1 9 9 7 t o 2 0 0 3
39.3 42.747.2
57.3
47.142.2 38.8
3.64.0
3.9
3.8
3.93.8
3.7
0
10
20
30
40
50
60
70
1997 1998 1999 2000 2001 2002 2003
Year
($B
)
ICT Services ImportsICT Goods Imports
42.9 46.7 51.1 61.0 50.8 46.2 42.5
ICT services also includes news agency services, which are not part of the ICT definition.
Source: Information and Communications Technologies Branch – Trade of ICT Goods and Services, 1997-2003, November 2004.
8 #05-755 ©2005 IDC
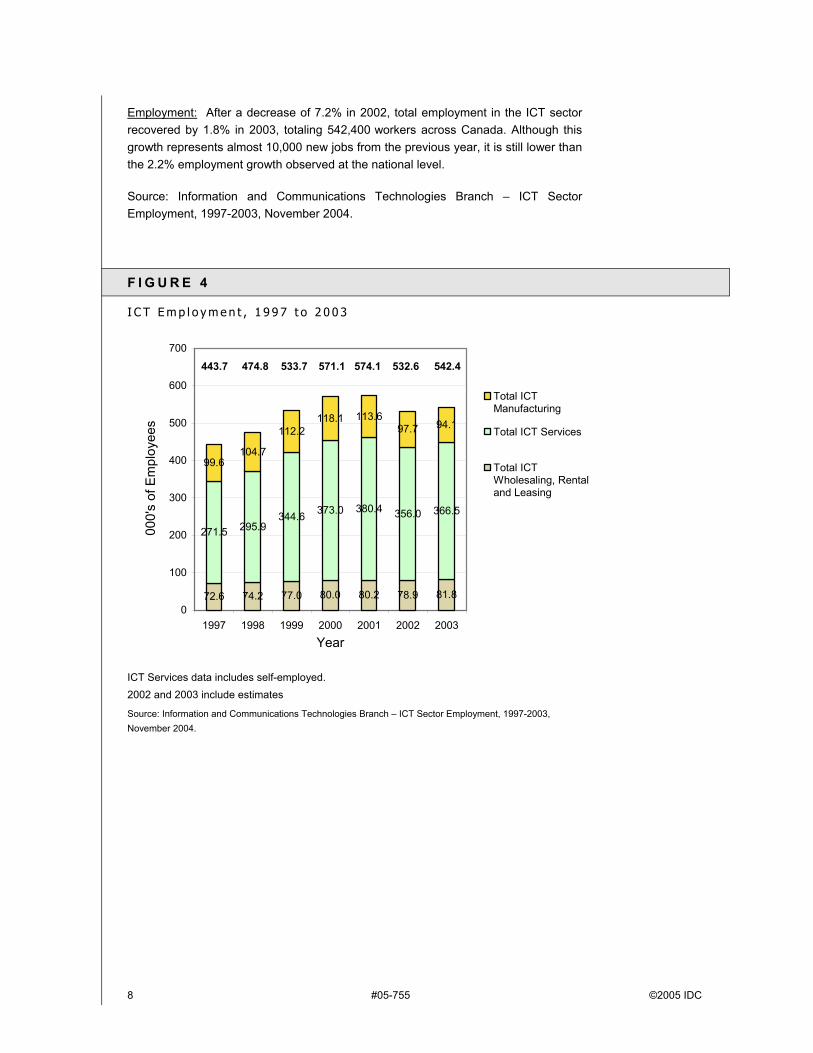
Employment: After a decrease of 7.2% in 2002, total employment in the ICT sector recovered by 1.8% in 2003, totaling 542,400 workers across Canada. Although this growth represents almost 10,000 new jobs from the previous year, it is still lower than the 2.2% employment growth observed at the national level.
Source: Information and Communications Technologies Branch – ICT Sector Employment, 1997-2003, November 2004.
F I G U R E 4
I C T E m p l o y m e n t , 1 9 9 7 t o 2 0 0 3
72.6 74.2 77.0 80.0 80.2 78.9 81.8
271.5 295.9344.6 373.0 380.4 356.0 366.5
99.6104.7
112.2118.1 113.6
97.7 94.1
0
100
200
300
400
500
600
700
1997 1998 1999 2000 2001 2002 2003
Year
000'
s of
Em
ploy
ees
Total ICTManufacturing
Total ICT Services
Total ICTWholesaling, Rentaland Leasing
443.7 474.8 533.7 571.1 574.1 532.6 542.4
ICT Services data includes self-employed. 2002 and 2003 include estimates
Source: Information and Communications Technologies Branch – ICT Sector Employment, 1997-2003, November 2004.

©2005 IDC #05-755 9
R&D Spending: Total Canadian private sector R&D expenditures are expected to be $12.5 billion in 2004, up 1.6% from 2003.
After two years of decline, R&D expenditures in the ICT sector are expected to recover slightly in 2004, up by 0.6% or $32 million. The sector remains the largest private R&D performer in Canada with total expenditures of $5.0 billion.
The substantial decline observed at the sector level in 2002 was mainly due to major reductions by the communications equipment manufacturing industry (including wires and cables) which cut its R&D expenditures by 40% or $1.3 billion. Despite further small reductions in 2003 and 2004, this industry still accounts for 39% of ICT sector and 16% of total Canadian private sector R&D expenditures.
Source: Information and Communications Technologies Branch – ICT Sector R&D Expenditures, November 2004.
F I G U R E 5
I C T I n t r a m u r a l R & D E x p e n d i t u r e s , 1 9 9 7 t o 2 0 0 3
2,7033,240 3,474
4,731 4,879
3,497 3,396 3,423
739814
855
1,0881,629
1,544 1,464 1,466
136133126
169296
5971
85
0
1,000
2,000
3,000
4,000
5,000
6,000
7,000
8,000
1997 1998 1999 2000 2001 2002p 2003p 2004iYear
($M
)
ICT Wholesaling,Rental and Leasing
Total ICT Services
Total ICTManufacturing
3,527 4,125 4,338 6,115 6,677 5,167 4,993 5,025
p=planned for 2002 and 2003, i=intentions for 2004
Source: Information and Communications Technologies Branch – ICT Sector R&D Expenditures, November 2004.

10 #05-755 ©2005 IDC
P R A I R I E I C T O V E R V I E W
S a s k a t c h e w a n a n d M a n i t o b a I C T E c o n o m i c S u m m a r y
Most data pertaining to ICT on Saskatchewan is limited to Saskatchewan and Manitoba grouped as the Prairie region. The Prairie ICT information contained here is mostly sourced from the ICT Sector Regional Report by the Information and Communications Technologies Branch at Industry Canada. While this report contains information on the ICT sector consisting of ICT manufacturing, ICT software and computer services, communications services and ICT wholesaling at a national level, ICT wholesaling at the regional level is not available.
Where data is available on Saskatchewan as a province, it is presented.
The ICT sector (not including ICT wholesaling) in Manitoba and Saskatchewan has encounter growth across all indicators.
Revenues: From 1995 to 2002, revenues increased from $1.8 billion to almost $3 billion, an annual growth rate of close to 8.5%
GDP: Increased from $1.5 billion to $2.1 billion from 1997 to 2002, an annual growth rate of 7.5%
Exports: 5.2% increase annually over the period of 1995 to 2002
R&D Spending: 4.8% annual growth rate from 1995 to 2002 (includes Alberta's R&D expenditures)
Employment: 3.9% growth from 1995 to 2002
Source: Information and Communications Technologies Branch – Canadian ICT Sector Regional Report (Prairies), September 2004
T A B L E 2
R e g i o n a l C o m p a r i s o n o f I C T S e c t o r , C o m p o u n d A n n u a l G r o w t h R a t e , b y K e y V a r i a b l e , 1 9 9 5 - 2 0 0 2
Key Variables Prairies Atlantic Quebec Ontario Alberta BC & Territories
GDP* 7.5% 10.1% 9.6% 7.7% 7.5% 7.5% Exports 5.2% 9.7% 1.4% -0.7% 22.5% 9.5% Revenue 8.5% 12.0% 3.1% 8.8% 11.8% 7.6% Employment 3.9% 7.0% 3.1% 4.3% 5.7% 3.2% R&D** 4.8% -2.2% 10.7% 13.7% 4.8% 11.7%
Notes: * from 1997 to 2002, ** from 1995 to 2001, R&D data for Prairies and Alberta include both regions
Source: Information and Communications Technologies Branch – Canadian ICT Sector Regional Report (Prairies), September 2004

©2005 IDC #05-755 11
I C T R e v e n u e : P r a i r i e R e g i o n
Revenue by ICT Manufacturing in 2002 were approximately $325 million in 2002, down from a peak of $647 million in 2000. From 1995 to 2002, revenues in ICT manufacturing in the prairie region increased by close to 3% annually, much slower than the 8.5% annual growth of the entire Prairies ICT sector in the same period.
ICT Software and Computer Services sub-sector revenue in the Prairies were more that $630 million in 2002, higher than any prior year. From 1995 to 2002, this sub-sector increased by more than 13% annually.
Revenue by the Prairies Communications Services ICT sub-sector was $1.9 billion in 2002. Over the 1995 to 2002 time period, this sub-sector grew at more than 8% per year.
Source: Information and Communications Technologies Branch – Canadian ICT Sector Regional Report (Prairies), September 2004
F I G U R E 6
D i s t r i b u t i o n o f P r a i r i e s I C T R e v e n u e b y S u b - S e c t o r , 2 0 0 2
ICT Manufacturing (11.0%)
Software and Computer
Services (21.4%)
ICT Communciations
(67.6%)
Notes: ICT Wholesaling is not included due to lack of regional data.
Source: Information and Communications Technologies Branch – ICT Sector Regional Report, September 2004.

12 #05-755 ©2005 IDC
F I G U R E 7
D i s t r i b u t i o n o f C a n a d i a n I C T R e v e n u e b y R e g i o n , 2 0 0 2
Atlantic (4.3%)
Quebec (23.3%)
Ontario (48.9%)
Prairies (3.9%)
Alberta (9.5%)
BC* (10.0%)
Notes: *BC includes the Territories
Source: Statistics Canada, Innovation Analysis Bulletin, Vol 6, No. 1, March 2004, Catalogue No. 88-003-XIE.
I C T G D P : S a s k a t c h e w a n
The ICT goods manufacturing sector in Saskatchewan experienced a CAGR of 10.5% from 1997 to 2002. However output by this sector grew from $82.5 million in 1997 to a peak of $278.7 million in 2000. By 2002 the output was less than half of 2000 levels.
On the other hand, ICT services in Saskatchewan grew steadily over the same time period at a CAGR of 6.2% reaching an output of $860 million in 2002.
Compared to Canada, Canadian ICT goods manufacturing showed a CAGR of 6.8% reaching $11.4 billion in 2002 and ICT services grew at 11.9% CAGR reaching $42.9 billion in 2002.
Note that GDP data may not match GDP presented in other sections due to the date of when the data sourced.
Source: Statistics Canada, Innovation Analysis Bulletin, Vol. 6, No. 1, March 2004, Catalogue No. 88-003-XIE.

©2005 IDC #05-755 13
F I G U R E 8
S a s k a t c h e w a n I C T G D P , 1 9 9 7 t o 2 0 0 2
638.1704.0
788.6 817.6 828.7 860.1
135.9205.9202.3
278.7
89.182.5
0
100
200
300
400
500
600
700
800
900
1,000
1997 1998 1999 2000 2001 2002
Year
GD
P (m
illion
s of
cha
ined
$)
GoodsServices
Notes: The source report is not explicit on whether ICT wholesaling is included in Goods or Services
Source: Statistics Canada, Innovation Analysis Bulletin, Vol. 6, No. 1, March 2004, Catalogue No. 88-003-XIE.
I C T E m p l o y m e n t : P r a i r i e R e g i o n
The Communication Services sub-sector in the Prairies region employed approximately 60% of ICT workers in Manitoba and Saskatchewan followed by Software and Computer services with 28% and Manufacturing with 12% of ICT workers.
The number of workers in the Communications services sub-sector in the Prairies increased at an annual rate of close to 2% from 1995 to 2002. As of 2002 there were almost 11,500 people employed in this sub-sector.
The software and computer services sub-sector employed 5,200 workers in 2002. This sector's employment peaked in 2000 at almost 5,800 workers. Since 1995 when 2,500 workers were employed, this sector has increased at an annual rate in excess of 11%, making it the faster growing sub-sector in terms of employment in the Prairie region.
In 1997, the ICT manufacturing sector employed 2,000 workers. By 2000, the number of workers had dropped to 1,400. However employment increased in the subsequent two years resulting in employment of 2,200 in 2002.
Source: Information and Communications Technologies Branch – Canadian ICT Sector Regional Report (Prairies), September 2004

14 #05-755 ©2005 IDC
F I G U R E 9
D i s t r i b u t i o n o f E m p l o y m e n t b y I C T I n d u s t r y , P r a i r i e s , 2 0 0 2
Software & Computer
Services (28.0%)
Communications Services (60.0%)
ICT Manufacturing (12.0%)
Notes: ICT Wholesaling is not included due to lack of regional data.
Source: Information and Communications Technologies Branch – Canadian ICT Sector Regional Report
(Prairies), September 2004

©2005 IDC #05-755 15
I C T E x p o r t s : P r a i r i e s R e g i o n
Regionally, the Prairies (Manitoba and Saskatchewan) accounts for 1% of total exports of ICT manufactured goods (see Figure 10). In contrast, Ontario and Quebec combine for over 80% of all exported ICT manufactured goods. Alberta and British Columbia represent smaller shares, however experienced high rates of growth from 1995 to 2002.
Source: Information and Communications Technologies Branch – Canadian ICT Sector Regional Report (Prairies), September 2004
F I G U R E 1 0
D i s t r i b u t i o n o f E x p o r t s o f I C T M a n u f a c t u r i n g G o o d s b y R e g i o n , 2 0 0 2 ( $ 2 0 . 9 B i l l i o n )
Prairies (1.0%)Alberta (11.0%)
BC & Territories (5.0%)
Atlantic Canada (1.0%)
Quebec (27.0%)
Ontario (55.0%)
Source: Information and Communications Technologies Branch – Canadian ICT Sector Regional Report (Prairies), September 2004
16 #05-755 ©2005 IDC
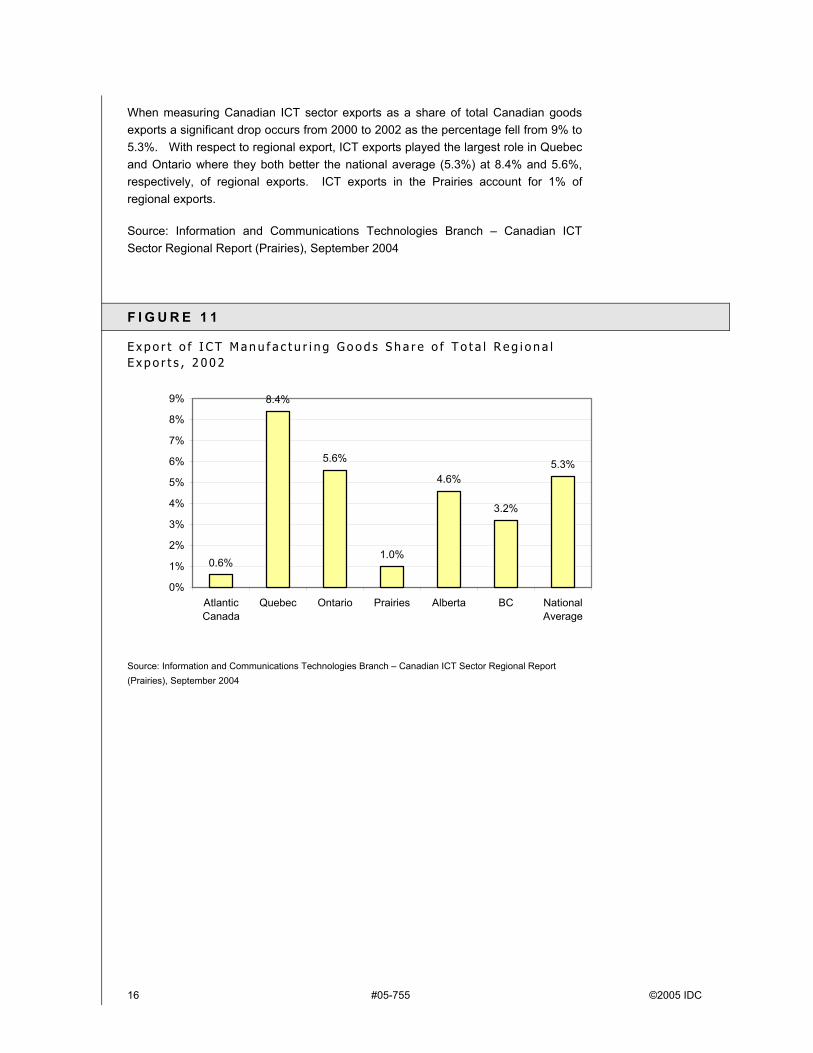
When measuring Canadian ICT sector exports as a share of total Canadian goods exports a significant drop occurs from 2000 to 2002 as the percentage fell from 9% to 5.3%. With respect to regional export, ICT exports played the largest role in Quebec and Ontario where they both better the national average (5.3%) at 8.4% and 5.6%, respectively, of regional exports. ICT exports in the Prairies account for 1% of regional exports.
Source: Information and Communications Technologies Branch – Canadian ICT Sector Regional Report (Prairies), September 2004
F I G U R E 1 1
E x p o r t o f I C T M a n u f a c t u r i n g G o o d s S h a r e o f T o t a l R e g i o n a l E x p o r t s , 2 0 0 2
0.6%
8.4%
5.6%
1.0%
4.6%
3.2%
5.3%
0%
1%
2%
3%
4%
5%
6%
7%
8%
9%
AtlanticCanada
Quebec Ontario Prairies Alberta BC NationalAverage
Source: Information and Communications Technologies Branch – Canadian ICT Sector Regional Report (Prairies), September 2004
©2005 IDC #05-755 17
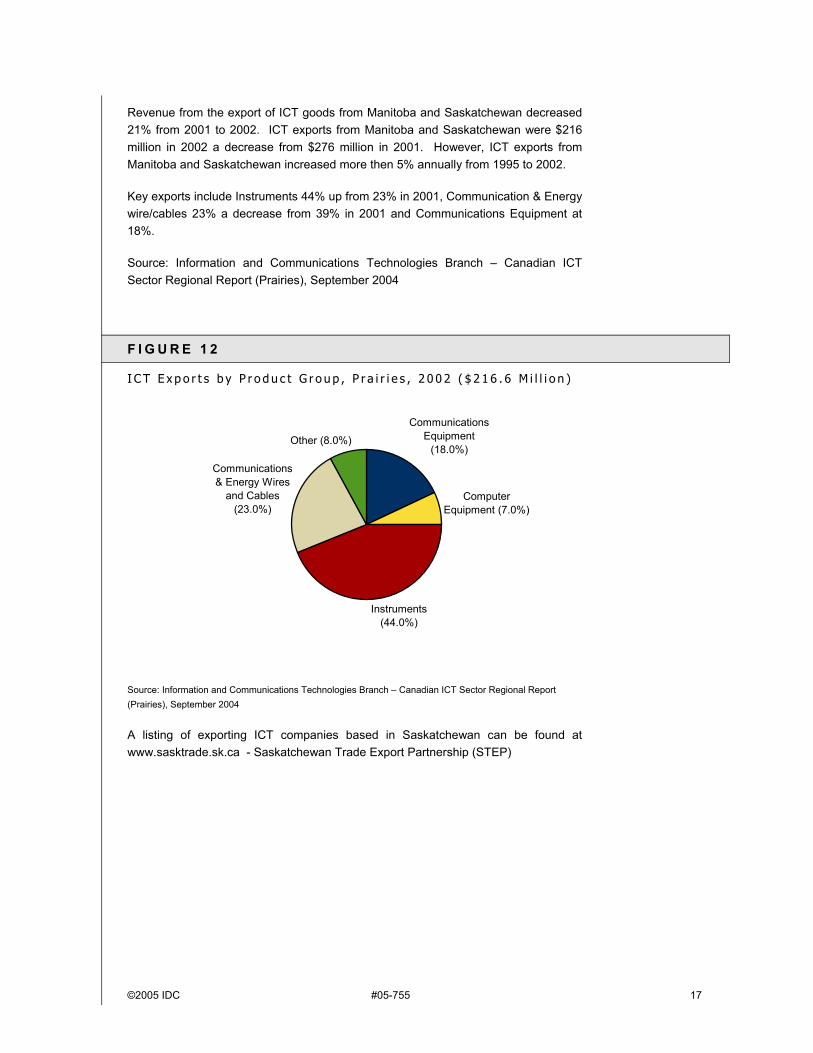
Revenue from the export of ICT goods from Manitoba and Saskatchewan decreased 21% from 2001 to 2002. ICT exports from Manitoba and Saskatchewan were $216 million in 2002 a decrease from $276 million in 2001. However, ICT exports from Manitoba and Saskatchewan increased more then 5% annually from 1995 to 2002.
Key exports include Instruments 44% up from 23% in 2001, Communication & Energy wire/cables 23% a decrease from 39% in 2001 and Communications Equipment at 18%.
Source: Information and Communications Technologies Branch – Canadian ICT Sector Regional Report (Prairies), September 2004
F I G U R E 1 2
I C T E x p o r t s b y P r o d u c t G r o u p , P r a i r i e s , 2 0 0 2 ( $ 2 1 6 . 6 M i l l i o n )
Communications Equipment
(18.0%)
Computer Equipment (7.0%)
Instruments (44.0%)
Communications & Energy Wires
and Cables (23.0%)
Other (8.0%)
Source: Information and Communications Technologies Branch – Canadian ICT Sector Regional Report (Prairies), September 2004
A listing of exporting ICT companies based in Saskatchewan can be found at www.sasktrade.sk.ca - Saskatchewan Trade Export Partnership (STEP)

18 #05-755 ©2005 IDC
I C T R & D : P r a i r i e s R e g i o n
Regional ICT R&D research reports group data for the provinces of Saskatchewan, Manitoba and Alberta together. Based on 2001 data, these three provinces contribute 4% to the total ICT R&D expenditure (Figure 13). As a percentage of total R&D devoted to ICT by region, the Prairies and Alberta combined, contributed just under 29% in 2001 (Figure 14), down from 33% in 1999.
F I G U R E 1 3
D i s t r i b u t i o n o f R & D E x p e n d i t u r e s b y R e g i o n , 2 0 0 1 ( $ 6 . 5 B i l l i o n )
Ontario (70.0%)
Quebec (18.0%)
Atlantic Canada (1.0%)
BC & Territories (7.0%)
Prairies & Alberta (4.0%)
Notes: * Includes Alberta, ** Includes Territories
Source: Information and Communications Technologies Branch – Canadian ICT Sector Regional Report (Regional), September 2004

©2005 IDC #05-755 19
F I G U R E 1 4
P e r c e n t a g e o f T o t a l R & D d e v o t e d t o I C T b y R e g i o n , 1 9 9 9 - 2 0 0 1
29.7%
64.1%
42.4%41.3%33.0%
23.6%
53.9%
25.2%
50.0%47.6%
28.8%25.3%
43.1%
0%
10%
20%
30%
40%
50%
60%
70%
Atlantic Quebec Ontario Prairies* BC** Canada
%
1999 2001 2002
Notes: * Includes Alberta, ** Includes Territories
Source: Information and Communications Technologies Branch – Canadian ICT Sector Regional Report (Prairies), September 2004
N u m b e r o f I C T B u s i n e s s e s i n S a s k a t c h e w a n
In Saskatchewan the number of ICT businesses totaled 481 firms in 2004, a drop of 18 firms from 2003. The number of ICT firms in Saskatchewan accounts for 1.4% of ICT firms in Canada and 1.2% of all firms in Saskatchewan. There are 466 firms with 1 to 99 employees, 14 firms with 100-499 employees and 1 firm with 500+ employees. As illustrated in Figure 15, the Software and Computer Services sub-sector accounts for 62.2% of firms in Saskatchewan followed by ICT Wholesaling, Communications Services and ICT Manufacturing.

20 #05-755 ©2005 IDC
F I G U R E 1 5
D i s t r i b u t i o n o f I C T B u s i n e s s e s i n S a s k a t c h e w a n , 2 0 0 4
ICT Manufacturing (6.2%)
Software and Computer
Services (62.2%)
Communications Services (7.5%)
ICT Wholesaling (24.1%)
Note: Firms defined as indeterminate (556 firms) are not included.
Source: IDC Canada, 2005 and Statistics Canada, Business Register, June 2004
I T E m p l o y m e n t i n S a s k a t c h e w a n
The Software Human Resource Council (SHRC) has created reports on the IT employment market based on the National Occupation Classification (NOC) System from the results of the 2001 Census. The perspective provided by SHRC views IT employment by occupation-type across all industries.
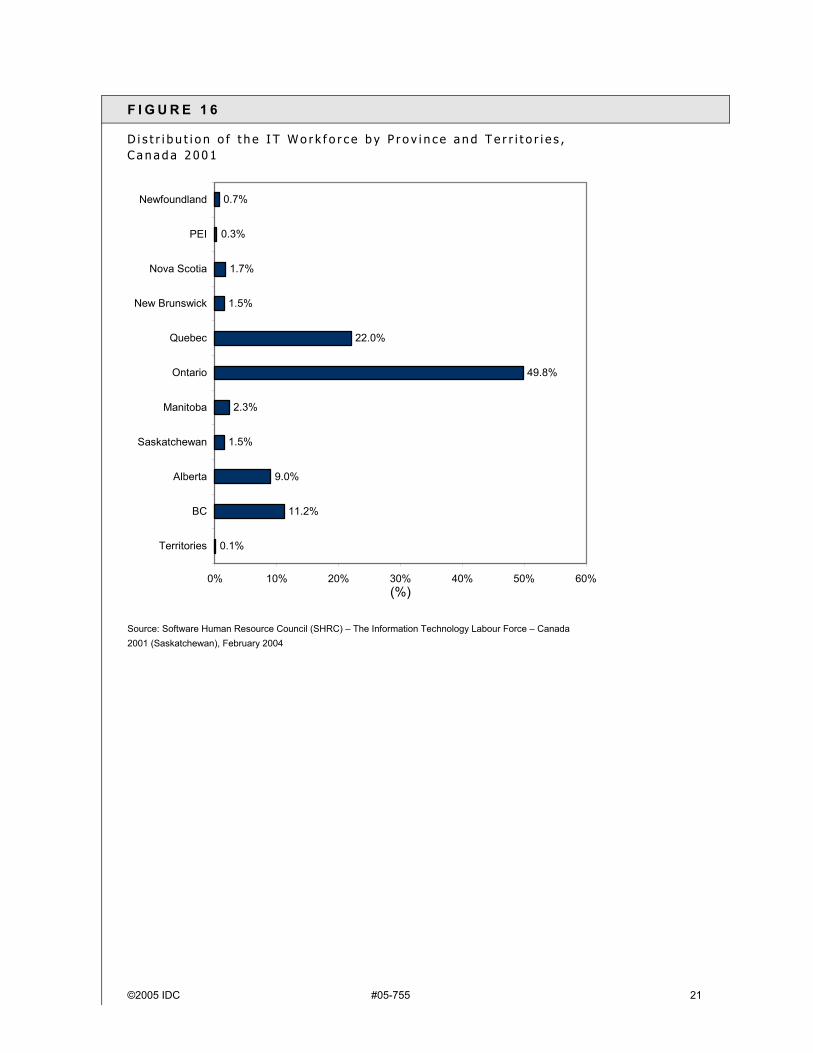
In 2001, the IT workforce in Saskatchewan consisted of 7,720 workers representing 1.5% of the province's total workforce. The province represents 1.5% of the IT workforce in Canada. The mix of males to females in the Saskatchewan IT workforce is 69% to 31%. There were 3,930 IT workers in Regina and 2,550 in Saskatoon.
©2005 IDC #05-755 21
F I G U R E 1 6
D i s t r i b u t i o n o f t h e I T W o r k f o r c e b y P r o v i n c e a n d T e r r i t o r i e s , C a n a d a 2 0 0 1
0.1%
11.2%
9.0%
1.5%
2.3%
49.8%
22.0%
1.5%
1.7%
0.3%
0.7%
0% 10% 20% 30% 40% 50% 60%
Territories
BC
Alberta
Saskatchewan
Manitoba
Ontario
Quebec
New Brunswick
Nova Scotia
PEI
Newfoundland
(%)
Source: Software Human Resource Council (SHRC) – The Information Technology Labour Force – Canada 2001 (Saskatchewan), February 2004

22 #05-755 ©2005 IDC
F I G U R E 1 7
P e r c e n t o f I T W o r k f o r c e i n t h e L a b o u r F o r c e o f E a c h R e s p e c t i v e P r o v i n c e , C a n a d a 2 0 0 1
2.9%
2.8%
1.5%
2.1%
4.4%
3.2%
2.2%
2.1%
2.0%
1.6%
0.0% 0.5% 1.0% 1.5% 2.0% 2.5% 3.0% 3.5% 4.0% 4.5% 5.0%
BC
Alberta
Saskatchewan
Manitoba
Ontario
Quebec
New Brunswick
Nova Scotia
PEI
Newfoundland
(%)
Source: Software Human Resource Council (SHRC) – The Information Technology Labour Force – Canada 2001 (Saskatchewan), February 2004.

©2005 IDC #05-755 23
Distribution of IT workers by Industry in Saskatchewan shows almost 43% of employment is from the services sector (Figure 18). Saskatchewan's financial sector, public administration, transport/utilities and information sectors also employ a higher proportion of IT workers when compared to Canada.
F I G U R E 1 8
D i s t r i b u t i o n o f I T W o r k f o r c e b y I n d u s t r y 2 0 0 1
10.9%
42.8%
11.8%
18.5%
4.2%
11.8%
7.9%
49.7%
6.8%
14.6%
7.6%
13.4%
0% 10% 20% 30% 40% 50% 60%
Public Administration
Services
Financial Sector
Transportation, Utilitiesand Information
Wholesale and RetailTrade
Primary and Secondary CanadaSK
Source: Software Human Resource Council (SHRC) – The Information Technology Labour Force – Canada 2001 (Saskatchewan) February 2004.
24 #05-755 ©2005 IDC
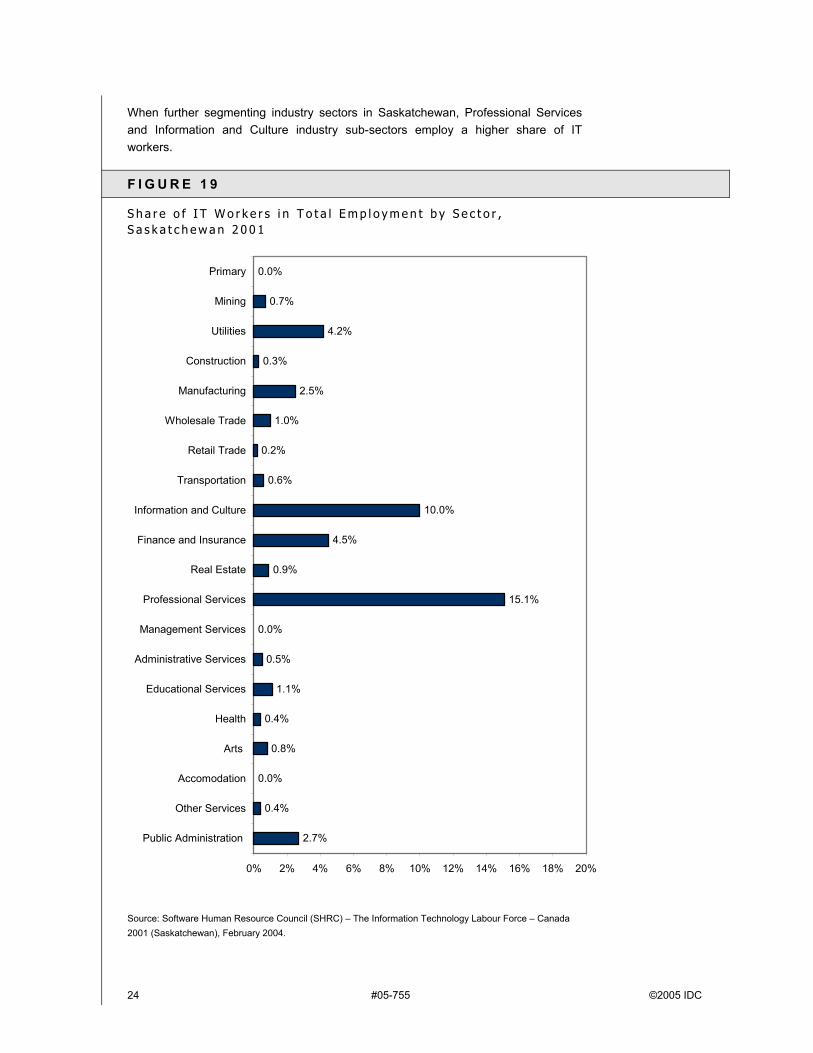
When further segmenting industry sectors in Saskatchewan, Professional Services and Information and Culture industry sub-sectors employ a higher share of IT workers.
F I G U R E 1 9
S h a r e o f I T W o r k e r s i n T o t a l E m p l o y m e n t b y S e c t o r , S a s k a t c h e w a n 2 0 0 1
2.7%
0.4%
0.0%
0.8%
0.4%
1.1%
0.5%
0.0%
15.1%
0.9%
4.5%
10.0%
0.6%
0.2%
1.0%
2.5%
0.3%
4.2%
0.7%
0.0%
0% 2% 4% 6% 8% 10% 12% 14% 16% 18% 20%
Public Administration
Other Services
Accomodation
Arts
Health
Educational Services
Administrative Services
Management Services
Professional Services
Real Estate
Finance and Insurance
Information and Culture
Transportation
Retail Trade
Wholesale Trade
Manufacturing
Construction
Utilities
Mining
Primary
Source: Software Human Resource Council (SHRC) – The Information Technology Labour Force – Canada 2001 (Saskatchewan), February 2004.
©2005 IDC #05-755 25
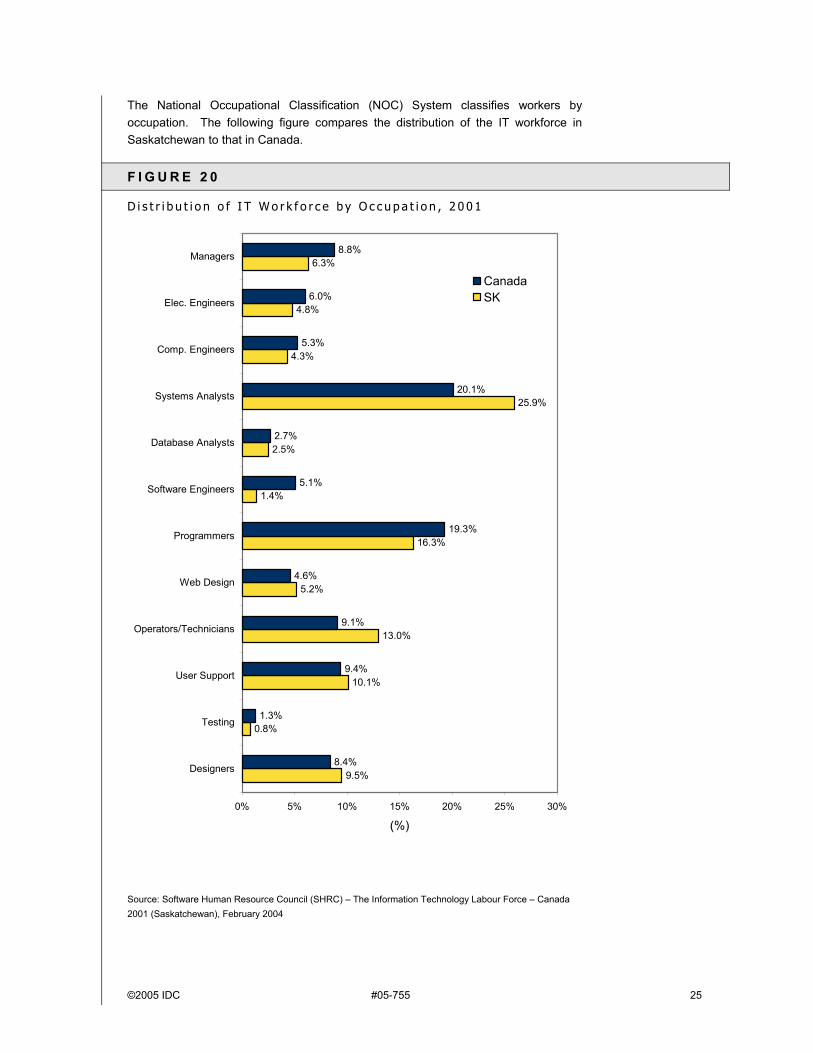
The National Occupational Classification (NOC) System classifies workers by occupation. The following figure compares the distribution of the IT workforce in Saskatchewan to that in Canada.
F I G U R E 2 0
D i s t r i b u t i o n o f I T W o r k f o r c e b y O c c u p a t i o n , 2 0 0 1
9.5%
0.8%
10.1%
13.0%
5.2%
16.3%
1.4%
2.5%
25.9%
4.3%
4.8%
6.3%
8.4%
1.3%
9.4%
9.1%
4.6%
19.3%
5.1%
2.7%
20.1%
5.3%
6.0%
8.8%
0% 5% 10% 15% 20% 25% 30%
Designers
Testing
User Support
Operators/Technicians
Web Design
Programmers
Software Engineers
Database Analysts
Systems Analysts
Comp. Engineers
Elec. Engineers
Managers
(%)
CanadaSK
Source: Software Human Resource Council (SHRC) – The Information Technology Labour Force – Canada 2001 (Saskatchewan), February 2004

26 #05-755 ©2005 IDC
The average employment income of the IT workforce in Saskatchewan is $40,874 in 2001, which is 59% higher than the overall labour force ($25,691). Females in the IT workforce earn $33,622 (77% of their male counterparts) while females in Saskatchewan's overall labour force earn $20,185, (66% of what the average male earns). The average earnings of the IT workforce in Saskatchewan ranks sixth against other provinces in Canada.
F I G U R E 2 1
E m p l o y m e n t I n c o m e ( i n d o l l a r s ) f o r t h e I T W o r k f o r c e b y P r o v i n c e , C a n a d a 2 0 0 1
$44,864
$47,971
$40,874
$41,080
$51,167
$44,371
$37,051
$37,244
$31,712
$36,417
0 10,000 20,000 30,000 40,000 50,000 60,000
BC
Alberta
Saskatchewan
Manitoba
Ontario
Quebec
New Brunswick
Nova Scotia
PEI
Newfoundland
Source: Software Human Resource Council (SHRC) – The Information Technology Labour Force – Canada 2001 (Saskatchewan), February 2004.

©2005 IDC #05-755 27
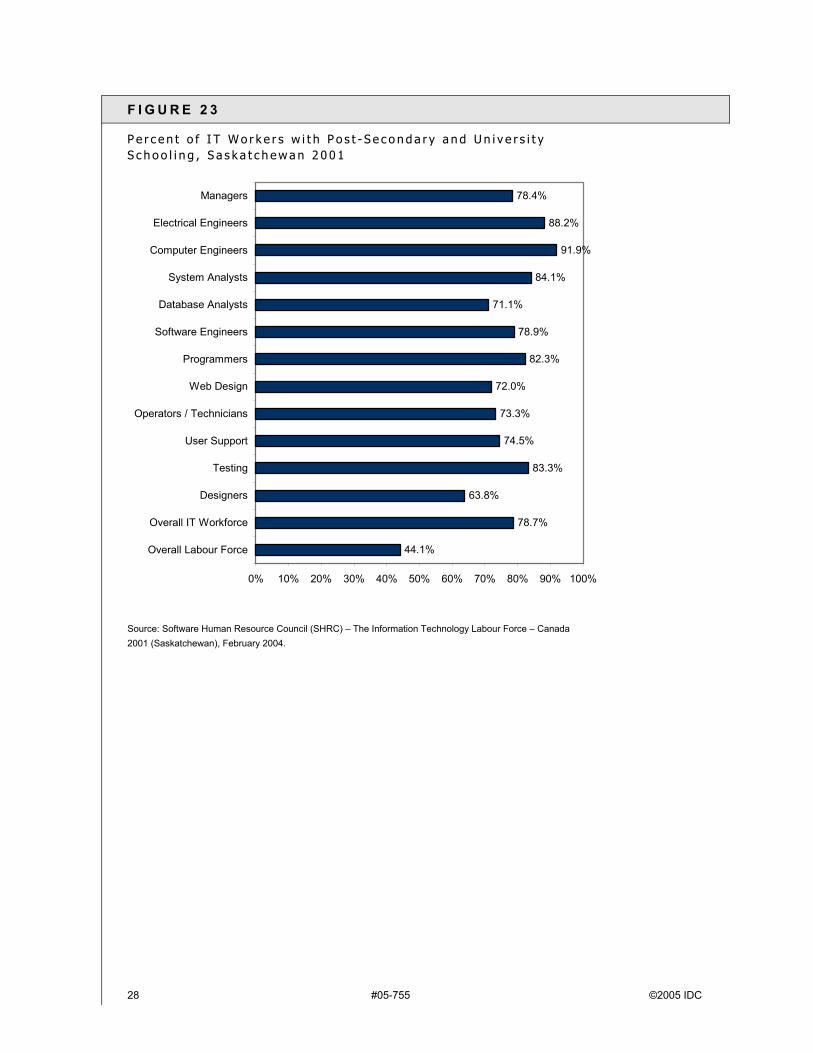
The IT workforce in Saskatchewan is made up of 69.0% males and 78.7% have a post-secondary/university education. This is compared to 53.5% and 44.1% respectively for the entire Saskatchewan workforce. Compared to other provinces, Saskatchewan does not differ substantially from the rest of Canada. A breakdown of male workers by IT occupations and post-secondary and university schooling in Saskatchewan can be seen in figures 22 & 23.
Source: Software Human Resource Council (SHRC) – The Information Technology Labour Force – Canada 2001 (Saskatchewan), February 2004.
F I G U R E 2 2
P e r c e n t o f M a l e W o r k e r s b y I T O c c u p a t i o n s S a s k a t c h e w a n 2 0 0 1
53.5%
69.0%
41.8%
38.5%
59.6%
79.0%
62.5%
77.8%
81.0%
63.2%
65.0%
92.5%
94.6%
71.4%
0% 10% 20% 30% 40% 50% 60% 70% 80% 90% 100%
Overall Labour Force
Overall IT Workforce
Designers
Testing
User Support
Operators / Technicians
Web Design
Programmers
Software Engineers
Database Analysts
System Analysts
Computer Engineers
Electrical Engineers
Managers
Source: Software Human Resource Council (SHRC) – The Information Technology Labour Force – Canada 2001 (Saskatchewan), February 2004.
28 #05-755 ©2005 IDC
F I G U R E 2 3
P e r c e n t o f I T W o r k e r s w i t h P o s t - S e c o n d a r y a n d U n i v e r s i t y S c h o o l i n g , S a s k a t c h e w a n 2 0 0 1
44.1%
78.7%
63.8%
83.3%
74.5%
73.3%
72.0%
82.3%
78.9%
71.1%
84.1%
91.9%
88.2%
78.4%
0% 10% 20% 30% 40% 50% 60% 70% 80% 90% 100%
Overall Labour Force
Overall IT Workforce
Designers
Testing
User Support
Operators / Technicians
Web Design
Programmers
Software Engineers
Database Analysts
System Analysts
Computer Engineers
Electrical Engineers
Managers
Source: Software Human Resource Council (SHRC) – The Information Technology Labour Force – Canada 2001 (Saskatchewan), February 2004.
©2005 IDC #05-755 29
A P P E N D I X
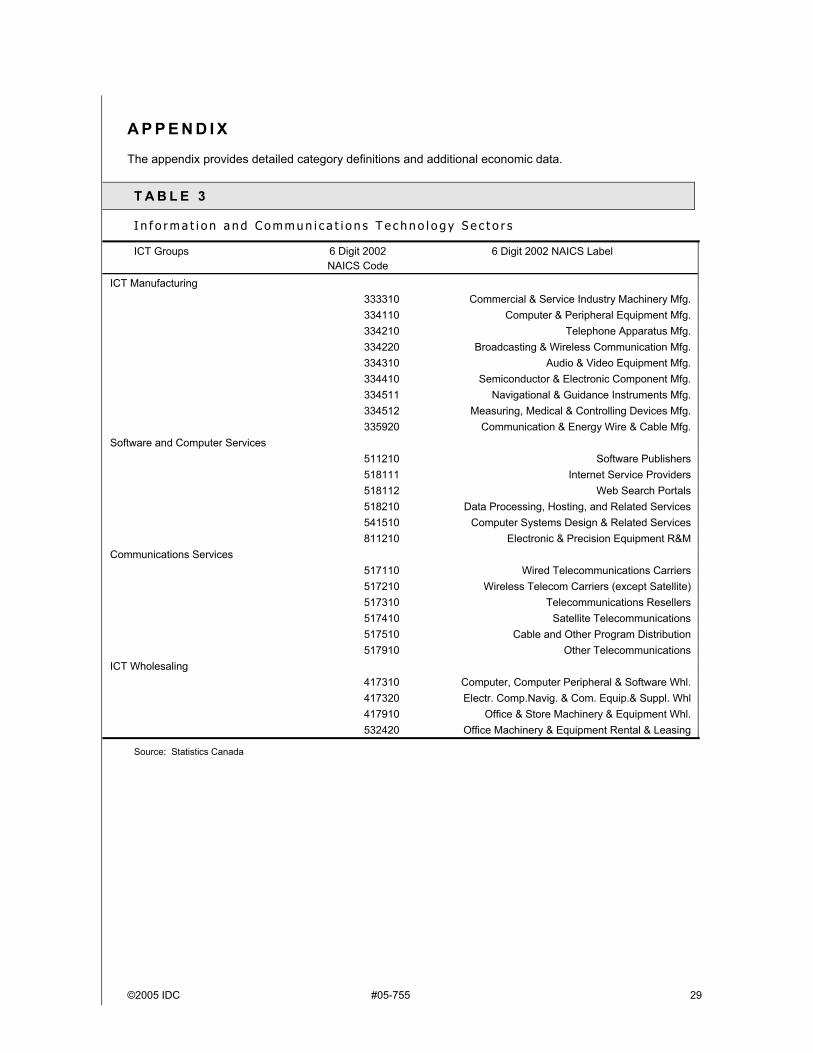
The appendix provides detailed category definitions and additional economic data.
T A B L E 3
I n f o r m a t i o n a n d C o m m u n i c a t i o n s T e c h n o l o g y S e c t o r s
ICT Groups 6 Digit 2002 NAICS Code
6 Digit 2002 NAICS Label
ICT Manufacturing 333310 Commercial & Service Industry Machinery Mfg. 334110 Computer & Peripheral Equipment Mfg. 334210 Telephone Apparatus Mfg. 334220 Broadcasting & Wireless Communication Mfg. 334310 Audio & Video Equipment Mfg. 334410 Semiconductor & Electronic Component Mfg. 334511 Navigational & Guidance Instruments Mfg. 334512 Measuring, Medical & Controlling Devices Mfg. 335920 Communication & Energy Wire & Cable Mfg.
Software and Computer Services 511210 Software Publishers 518111 Internet Service Providers 518112 Web Search Portals 518210 Data Processing, Hosting, and Related Services 541510 Computer Systems Design & Related Services 811210 Electronic & Precision Equipment R&M
Communications Services 517110 Wired Telecommunications Carriers 517210 Wireless Telecom Carriers (except Satellite) 517310 Telecommunications Resellers 517410 Satellite Telecommunications 517510 Cable and Other Program Distribution 517910 Other Telecommunications
ICT Wholesaling 417310 Computer, Computer Peripheral & Software Whl. 417320 Electr. Comp.Navig. & Com. Equip.& Suppl. Whl 417910 Office & Store Machinery & Equipment Whl. 532420 Office Machinery & Equipment Rental & Leasing
Source: Statistics Canada
30 #05-755 ©2005 IDC
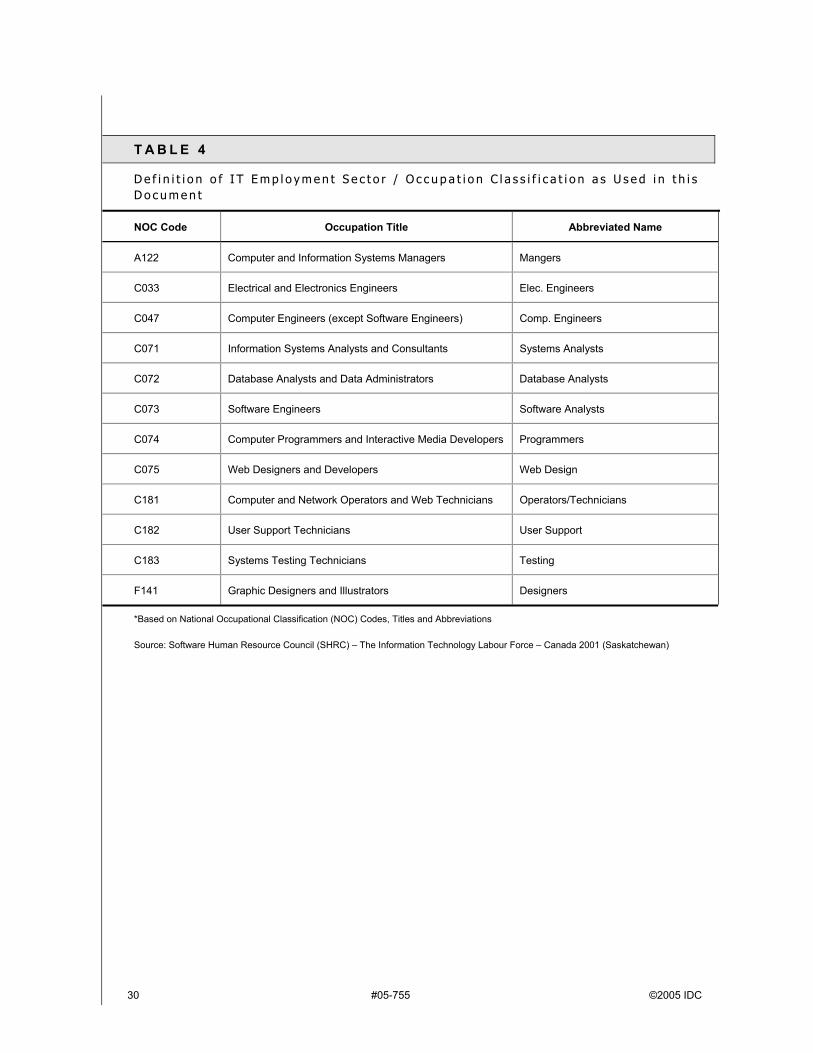
T A B L E 4
D e f i n i t i o n o f I T E m p l o y m e n t S e c t o r / O c c u p a t i o n C l a s s i f i c a t i o n a s U s e d i n t h i s D o c u m e n t
NOC Code Occupation Title Abbreviated Name
A122 Computer and Information Systems Managers Mangers
C033 Electrical and Electronics Engineers Elec. Engineers
C047 Computer Engineers (except Software Engineers) Comp. Engineers
C071 Information Systems Analysts and Consultants Systems Analysts
C072 Database Analysts and Data Administrators Database Analysts
C073 Software Engineers Software Analysts
C074 Computer Programmers and Interactive Media Developers Programmers
C075 Web Designers and Developers Web Design
C181 Computer and Network Operators and Web Technicians Operators/Technicians
C182 User Support Technicians User Support
C183 Systems Testing Technicians Testing
F141 Graphic Designers and Illustrators Designers
*Based on National Occupational Classification (NOC) Codes, Titles and Abbreviations
Source: Software Human Resource Council (SHRC) – The Information Technology Labour Force – Canada 2001 (Saskatchewan)

©2005 IDC #05-755 31
T A B L E 5
I C T S e c t o r G D P a t B a s i c P r i c e s , 2 0 0 0 - 2 0 0 3 ( i n 1 9 9 7 c o n s t a n t d o l l a r s )
NAICS 1997 Industry 2000 2001 2002 2003 ($'000,000) 33331 Commercial and Service Industry Machinery Manufacturing 1,197 1,250 1,122 1,155 33411 Computer and Peripheral Equipment Manufacturing 2,674 2,147 1,837 1,783 33421 Telephone Apparatus Manufacturing (Wired Communications
Equipment 4,943 1,766 1,093 727
33422 Radio and Television Broadcasting and Wireless Communications Equipment Manufacturing
858 821 765 961
33431/33451 Audio and Video Equipment and Navigational, Measuring, Medical and Control Instruments Manufacturing
2,141 2,028 1,776 1,852
33441 Semiconductor and Other Electronic Component Manufacturing 4,719 1,755 1,412 1,527 33592 Communication and Energy Wire and Cable Manufacturing 1,569 1,401 872 772 Total ICT Manufacturing 18,101 11,168 8,877 8,777 51121 Software Publishers 3,189 3,612 3,938 3,996 51322 Cable and Other Program Distribution 1,641 1,780 1,809 1,836 5133 Telecommunications Services 20,512 22,424 23,838 24,245 5141 Information Services 318 328 368 361 51421 Data Processing Services 818 990 964 942 54151 Computer Systems Design and Related Services 9,237 10,225 10,622 11,269 Total ICT Services1 35,715 39,359 41,539 42,649 4173/41791 ICT Wholesaling 2,872 2,858 3,059 3,237 53242 Office Machinery and Equipment Rental and Leasing 123 123 132 132 Total ICT Wholesaling, Rental and Leasing 2,995 2,981 3,191 3,369 Total ICT Sector1 56,811 53,508 53,607 54,795 TOTAL CANADIAN GDP 946,026 961,482 992,724 1,015,969 ICT GDP as a PERCENTAGE of CANADIAN GDP 6.00% 5.60% 5.40% 5.40%
Note: 1-Business sector only for NAICS 5141. Including NAICS 51411 and 51412 which are not part of the ICT definition.
Source: Information and Communications Technologies Branch – Industry Canada ICT Sector Gross Domestic Product (GDP), November 2004

32 #05-755 ©2005 IDC
T A B L E 6
E x p o r t s o f I C T G o o d s a n d S e r v i c e s , 2 0 0 0 - 2 0 0 3
NAICS Goods and Services ($'000,000) 2000 2001 2002 2003 33331 Commercial and Service Industry Machinery 3,857 3,187 2,370 2,061 33411 Computer and Peripheral Equipment 7,764 6,341 4,583 4,014 33421 Telephone Apparatus (Wired Communications Equipment) 12,838 5,402 4,263 3,466 33422 Radio and Television Broadcasting and Wireless
Communications Equipment 2,929 2,526 2,177 1,969
33431 Audio and Video Equipment 406 468 567 514 33441 Semiconductors and Other Electronic Components 6,501 4,814 3,673 3,414 334511 Navigational and Guidance Instruments 265 270 312 310 334512 Measuring, Medical and Controlling Devices 2,349 2,516 2,839 2,828 33592 Communication and Energy Wires and Cables 371 510 259 194 Total ICT Goods 37,279 26,035 21,043 18,771 Total Canadian Exports of Goods 413,215 404,085 396,379 380,815 Telecommunications Services 1,219 1,423 1,528 1,463 Software and Computer Services1 5,406 5,338 5,175 4,664 Information Services2 316 405 395 390 Total ICT Services 1,2 6,941 7,166 7,098 6,517 Total Canadian Exports of Commercial Services 31,101 32,274 34,599 33,551 Total ICT Goods and Services 1,2 44,220 33,202 28,142 25,288 TOTAL CANADIAN EXPORTS (all Goods and Commercial
Services) 444,316 436,359 430,978 414,366
Exports of ICT Goods as a % of Canadian Exports of Goods 9.00% 6.40% 5.30% 4.90% Exports of ICT Services as a % of Canadian Exports of
Commercial Services 22.30% 22.20% 20.50% 19.40%
ICT EXPORTS as a % of CANADIAN EXPORTS 10.00% 7.60% 6.50% 6.10%
Note: 1-Including custom and prepackaged software (medium and content/royalties). Note: 2-Including news agency services, which are not part of the ICT definition.
Source: Information and Communications Technologies Branch – Industry Canada Trade of ICT Goods and Services 1997 – 2003, November 2004

©2005 IDC #05-755 33
T A B L E 7
G r o s s D o m e s t i c P r o d u c t o f I C T S e c t o r ( G D P m i l l i o n s o f c h a i n e d $ ( 1 9 9 7 ) )
1997 1998 1999 2000 2001 2002 Newfoundland Goods 3.6 6.3 10.3 17.7 9.5 10.4 Services 296.2 339.7 350.7 400.9 437.3 477.4 Prince Edward Island Goods 1.6 2.3 0.6 2.0 2.4 1.9 Services 62.9 71.3 81.2 87.5 89.2 97.3 Nova Scotia Goods 36.7 54.5 59.1 73.4 80.1 81.1 Services 562.6 635.9 718.8 753.5 825.2 904.8 New Brunswick Goods 13.8 12.4 19.2 28.8 21.0 20.0 Services 481.9 550.7 610.6 638.4 698.0 763.4 Quebec Goods 2,473.3 3,145.5 4,949.8 5,827.0 4,371.1 3,391.4 Services 5,532.9 6,340.2 7,386.8 7,905.3 8,581.1 9,260.6 Ontario Goods 4,535.4 5,260.4 6,872.1 9,799.1 7,172.3 6,487.8 Services 10,119.6 11,570.1 15,395.9 17,399.7 19,005.2 20,073.4 Manitoba Goods 88.3 89.2 95.8 144.4 112.9 86.0 Services 660.2 758.5 815.0 885.7 965.8 1,032.0 Saskatchewan Goods 82.5 89.1 202.3 278.7 205.9 135.9 Services 638.1 704.0 788.6 817.6 828.7 860.1 Alberta Goods 560.9 616.9 689.6 650.9 524.8 524.4 Services 2,772.9 3,318.6 3,560.2 3,936.9 4,337.9 4,635.3 British Columbia Goods 433.2 509.5 777.2 1,371.1 950.2 681.5 Services 3,252.2 3,575.3 3,913.4 4,075.4 4,426.1 4,620.9 Yukon Goods 0.0 0.0 0.0 0.0 0.0 0.1 Services 22.5 32.8 33.3 39.8 38.4 39.9 NWT Goods 0.0 0.0 0.0 0.0 0.0 0.0 Services 74.8 60.5 53.3 54.3 61.3 67.7 Nunavut Goods 0.0 0.0 0.0 0.0 0.0 0.0 Services 0.1 0.1 15.0 18.6 21.3 23.6 Canada Goods 8,229.2 9,786.2 13,676.0 18,192.9 13,450.3 11,420.4 Services 24,476.7 27,957.6 33,722.7 37,013.6 40,315.3 42,856.3
Source: Statistics Canada, Innovation Analysis Bulletin, Vol. 6, No. 1, March 2004, Catalogue No. 88-003-XIE.

34 #05-755 ©2005 IDC
T A B L E 8
N u m b e r o f B u s i n e s s e s b y I C T D e f i n e d S u b - S e c t o r s i n S a s k a t c h e w a n , 2 0 0 4
ICT Groups
6 Digit 2002 NAICS Code
6 Digit 2002 NAICS Label 1 to 99
100 to 499
500+ Indeter-minate
Total
ICT Manufacturing 333310 Commercial & Service Industry Machinery Mfg. 3 1 0 7 11 334110 Computer & Peripheral Equipment Mfg. 3 0 0 3 6 334210 Telephone Apparatus Mfg. 0 0 0 0 0 334220 Broadcasting & Wireless Communication Mfg. 1 2 0 1 4 334310 Audio & Video Equipment Mfg. 0 0 0 2 2 334410 Semiconductor & Electronic Component Mfg. 4 0 0 4 8 334511 Navigational & Guidance Instruments Mfg. 1 0 0 3 4 334512 Measuring, Medical & Controlling Devices Mfg. 12 1 0 10 23 335920 Communication & Energy Wire & Cable Mfg. 1 1 0 0 2
ICT Manufacturing Total 25 5 0 30 60 Software and ICT Services
511210 Software Publishers 3 1 0 4 8 518111 Internet Service Providers 6 0 0 6 12 518112 Web Search Portals 0 0 0 1 1 518210 Data Processing, Hosting, and Related Services 10 1 0 7 18 541510 Computer Systems Design & Related Services 232 4 0 363 599 811210 Electronic & Precision Equipment R&M 42 0 0 55 97
Software and Computer Services Total 293 6 0 436 735 Communications Services
517110 Wired Telecommunications Carriers 2 0 1 2 5 517210 Wireless Telecom Carriers (except Satellite) 10 1 0 5 16 517310 Telecommunications Resellers 0 0 0 0 0 517410 Satellite Telecommunications 2 0 0 6 8 517510 Cable and Other Program Distribution 19 1 0 9 29 517910 Other Telecommunications 0 0 0 0 0
Communications Services Total 33 2 1 22 58 ICT Wholesaling
417310 Computer, Computer Peripheral & Software Whl. 17 1 0 27 45 417320 Electr. Comp.Navig. & Com. Equip.& Suppl. Whl 38 0 0 16 54 417910 Office & Store Machinery & Equipment Whl. 56 0 0 17 73 532420 Office Machinery & Equipment Rental & Leasing 4 0 0 8 12
ICT Wholesaling Total 115 1 0 68 184 ICT Total 466 14 1 556 1,037
Source: IDC Canada, 2005 and Statistics Canada, Business Register, June 2004

©2005 IDC #05-755 35
R E L A T E D S E C O N D A R Y R E S E A R C H A N D S O U R C E S
Information and Communications Technologies Branch – Canadian ICT Sector Profile, 2003 Estimates, November 2004
Information and Communications Technologies Branch – Canadian ICT Sector Regional Report (Prairies), September 2004
Information and Communications Technologies Branch – ICT Sector Employment, 1997 - 2003, November 2004
Information and Communications Technologies Branch – ICT Sector R&D Expenditures, November 2004
Information and Communications Technologies Branch – Industry Canada ICT Sector Gross Domestic Product (GDP), November 2004
Information and Communications Technologies Branch – Industry Canada ICT Sector Revenues, 2003 Estimates, November 2004
Information and Communications Technologies Branch – Industry Canada Quarterly Monitor of the Canadian ICT Sector Q4 2004, March 2005
Information and Communications Technologies Branch –Trade of ICT Goods and Services 1997 – 2003, November 2004
Saskatchewan Bureau of Statistics, Economic Review 2004, Number 58, December 2004
Saskatchewan Trade Export Partnership (STEP) (www.sasktrade.sk.ca)
Software Human Resource Council (SHRC) – The Information Technology Labour Force – Canada 2001 (Saskatchewan), February 2004
Statistics Canada, Business Register, June 2004
Statistics Canada, Cansim Table 380-0002
Statistics Canada, Innovation Analysis Bulletin, Vol. 6, No. 1, March 2004, Catalogue No. 88-003-XIE
The Daily, Statistics Canada, April 8, 2005
The Daily, Statistics Canada, April 14, 2005
The Daily, Statistics Canada, April 22, 2005
The Daily, Statistics Canada, April 27, 2005

36 #05-755 ©2005 IDC
C o p y r i g h t N o t i c e
External Publication of IDC Information and Data — Any IDC information that is to be used in advertising, press releases, or promotional materials requires prior written approval from the appropriate IDC Vice President or Country Manager. A draft of the proposed document should accompany any such request. IDC reserves the right to deny approval of external usage for any reason.
Copyright 2005 IDC. Reproduction without written permission is completely forbidden.