special eurobarometer 407
TRANSCRIPT
Special Eurobarometer 407
ANTIMICROBIAL RESISTANCE
REPORT
Fieldwork: May – June 2013
Publication: November 2013
This survey has been requested by the European Commission, Directorate-General for Health and
Consumers (DG SANCO) and co-ordinated by Directorate-General for Communication
(DG COMM “Research and Speechwriting” Unit)
http://ec.europa.eu/public_opinion/index_en.htm
This document does not represent the point of view of the European Commission. The interpretations and opinions contained in it are solely those of the authors.

Special Eurobarometer 407
Antimicrobial resistance
Conducted by TNS Opinion & Social at the request of the European Commission, Directorate-General for Health and
Consumers (DG SANCO)
Survey co-ordinated by the European Commission, Directorate-General for Communication
(DG COMM “Research and Speechwriting” Unit)
SPECIAL EUROBAROMETER 407 “Antimicrobial Resistance”
1
TABLE OF CONTENTS
INTRODUCTION .................................................................................................. 2
MAIN FINDINGS ................................................................................................. 5
I. USE OF ANTIBIOTICS ................................................................................... 7
1. Antibiotics use during the last year .............................................................. 7
2. Ways of obtaining antibiotics ..................................................................... 11
3. Reasons for taking antibiotics .................................................................... 16
II. KNOWLEDGE ABOUT ANTIBIOTICS .......................................................... 24
1. Do antibiotics kill viruses? .......................................................................... 24
2. Are antibiotics effective against cold and flu? ............................................ 28
3. Does unnecessary use of antibiotics make them become ineffective? ........ 33
4. Does taking antibiotics often result in side-effects such as diarrhea? ........ 37
5. Overall levels of knowledge on the use of antibiotics ................................. 43
III. ANTIBIOTIC AWARENESS CAMPAIGNS .................................................... 49
1. Taking information on board ...................................................................... 49
2. Means of conveying information ................................................................. 54
3. Impact of the antibiotic awareness campaigns on perception and behaviour .
................................................................................................................... 61
4. The most trustworthy sources of information ............................................ 69
5. Individual responsibility in preserving the effectiveness of antibiotics ...... 75
CONCLUSIONS .................................................................................................. 79
ANNEXES
Technical specifications
Questionnaire
Tables
SPECIAL EUROBAROMETER 407 “Antimicrobial Resistance”
2
INTRODUCTION
Antimicrobial agents are synthetic or natural substances used to destroy or prevent the
growth of bacteria, viruses and other micro-organisms (antibiotics are microbial agents
which only react against bacteria). Since penicillin was introduced in the 1940s,
antimicrobial medicines have been used for the medical treatment of humans and
animals and as disinfectants and preservatives. They have played an essential role in
treating infectious diseases and reducing the risk of post-surgical complications.
However, there is increasing concern that antimicrobial agents are declining in
effectiveness, with the emergence and spread of microbes, which are resistant to the
most affordable and effective drugs. While the emergence of resistant microorganisms is
a natural biological phenomenon, it is exacerbated by the inappropriate use of antibiotics
in human and veterinary medicine and their unnecessary use in non-therapeutic
situations, and also by environmental pollution involving antibiotics. The rise of resistant
microbes is a threat to global public health. It is responsible for the avoidable deaths of
humans and animals, increased healthcare and veterinary costs, and productivity losses.
In response, the European Union has put in place a Community strategy against
antimicrobial resistance. This strategy is intended to prevent the spread of microbial
infections, ensure the appropriate use of antimicrobials, and undertake research into
effective ways to combat resistance.1 Given the widespread persistence of
misconceptions about the nature and effectiveness of antimicrobials, communication,
education and training forms an integral part of this strategy. Since 2008, the European
Centre for Disease Prevention and Control (ECDC) has coordinated the “European
Antibiotic Awareness Day” (EAAD), a European health initiative that provides a platform
for and supports national campaigns to raise awareness on prudent use of antibiotics.2
As part of this strategy, the European Commission seeks to monitor levels of public use
of and knowledge about antibiotics. The Directorate-General for Health and Consumers
commissioned an EU wide survey in late 2009, published in April 2010 as Special
Eurobarometer 3383. The current tracker survey uses the same questions as in 2009,
and the report addresses the same key objectives:
- to identify the use of antibiotics among the EU public: the frequency with which
they take antibiotics, how they obtained them, and for what reason they took
them;
- to measure the levels of public knowledge about the nature and effectiveness of
antibiotics and the risks associated with their unnecessary use;
- to determine the impact of antibiotic awareness campaigns on the knowledge
and actions of Europeans.
1 Communication from the Commission to the European Parliament and the Council, Action plan against the rising threats from Antimicrobial Resistance, COM (2011) 748, November 15, 2011 (http://ec.europa.eu/dgs/health_consumer/docs/communication_amr_2011_748_en.pdf), p.4. 2 European Centre for Disease Prevention and Control, “European Antibiotic Awareness Day”, (http://ecdc.europa.eu/en/eaad/Pages/Home.aspx). 3 http://ec.europa.eu/health/antimicrobial_resistance/eurobarometers/index_en.htm
SPECIAL EUROBAROMETER 407 “Antimicrobial Resistance”
3
The report covers today's 28 EU Member States. Note that as the fieldwork took place
before the official date of Croatia's accession to the European Union on 1 July 2013,
results are presented for the EU27 Member States and Croatia.
This survey was carried out by TNS Opinion & Social network in the 27 Member States of
the European Union and in Croatia between the 24th of May and 9th of June 20134.
27.680 respondents from different social and demographic groups were interviewed face-
to-face at home in their mother tongue on behalf of the European Commission,
Directorate-General for Health and Consumers (DG SANCO). The methodology used is
that of Eurobarometer surveys as carried out by the Directorate-General for
Communication (“Research and Speechwriting” Unit)5.. A technical note on the manner in
which interviews were conducted by the Institutes within the TNS Opinion & Social
network is appended as an annex to this report. Also included are the interview methods
and confidence intervals6.
Note: In this report, countries are referred to by their official abbreviation. The
abbreviations used in this report correspond to:
ABBREVIATIONS BE Belgium LV Latvia CZ Czech Republic LU Luxembourg BG Bulgaria HU Hungary DK Denmark MT Malta DE Germany NL The Netherlands EE Estonia AT Austria EL Greece PL Poland ES Spain PT Portugal FR France RO Romania IE Ireland SI Slovenia IT Italy SK Slovakia CY Republic of Cyprus* FI Finland LT Lithuania SE Sweden UK The United Kingdom HR Croatia EU27 European Union – 27 Member States EU15 BE, IT, FR, DE, LU, NL, DK, UK, IE, PT, ES, EL, AT, SE, FI**
NMS12 BG, CZ, EE, CY, LT, LV, MT, HU, PL, RO, SI, SK***
EURO AREA
BE, FR, IT, LU, DE, AT, ES, PT, IE, NL, FI, EL, EE, SI, CY, MT,
SK
* Cyprus as a whole is one of the 27 European Union Member States. However, the ‘acquis communautaire’ has
been suspended in the part of the country which is not controlled by the government of the Republic of Cyprus.
For practical reasons, only the interviews carried out in the part of the country controlled by the government of
the Republic of Cyprus are included in the ‘CY’ category and in the EU27 average.
** EU15 refers to the 15 countries forming the European Union before the enlargements of 2004 and 2007
*** The NMS12 are the 12 ‘new Member States’ which joined the European Union during the 2004 and 2007
enlargements
4 Croatia was not a member state of the European Union when fieldwork was carried out; therefore results are presented as EU27 plus Croatia. 5 http://ec.europa.eu/public_opinion/index_en.htm. 6 The tables of results are included in the annex. It should be noted that the total of the percentages in the tables of this report may exceed 100% when the respondent has the possibility of giving several answers to the question.

SPECIAL EUROBAROMETER 407 “Antimicrobial Resistance”
4
* * * * *
We wish to thank all the people interviewed throughout Europe
who took the time to participate in this survey.
Without their active participation, this survey would not have been possible.
SPECIAL EUROBAROMETER 407 “Antimicrobial Resistance”
5
MAIN FINDINGS
Just over one third (35%) of respondents say that they have taken antibiotics in
oral form at any time in the last 12 months, a decline of 5 percentage points since
the last survey in 2009.
▫ Differences between countries on this question are quite significant, but
less pronounced and regionally differentiated than in 2009.
▫ Women are significantly more likely to take antibiotics than men, and
those with low levels of education and worse economic circumstances are
more likely to take them than their counterparts.
▫ The vast majority of Europeans obtain antibiotics from their health care
provider, and flu and bronchitis are the most commonly cited reasons for
taking these medicines.
▫ Those with better levels of objective knowledge about antibiotics are more
likely to take them for illnesses and symptoms that antibiotics are able to
treat.
Only over a fifth (22%) of Europeans give the correct answer to four questions
about antibiotics, and the European average of correct answers is 2.4 out of 4.
These figures are very similar to those recorded in 2009.
▫ Most Europeans (84%) are aware that unnecessary use of antibiotics
makes them become ineffective, and two thirds (66%) know that frequent
use of antibiotics can lead to side-effects.
▫ However, nearly half (49%) of Europeans do not know that antibiotics are
ineffective against viruses, and over two fifths (41%) do not know that
they are ineffective against colds and flu.
▫ Despite the fact that antibiotics cannot treat flu, nearly a fifth (18%) of
respondents say it was the reason they last took antibiotics.
▫ Those with low levels of education are particularly likely to have
misconceptions about the nature and efficacy of antibiotics.
Only a third (33%) of respondents remember receiving information about not
taking antibiotics unnecessarily in the last 12 months: in 2009, just over a third
(37%) did.
▫ The proportion of respondents who received information varies
considerably by country: in France, slightly under two thirds (65%) of
respondents recall receiving information about the unnecessary use of
antibiotics, but in Portugal only just over one in ten (12%) do.
SPECIAL EUROBAROMETER 407 “Antimicrobial Resistance”
6
▫ Almost a fifth (19%) of all respondents say that they received this
information from media or communication campaigns, and the most
common source was television advertisements, cited by one in ten (10%)
of those polled. Over one in ten (11%) respondents received information
from professionals; in the majority of cases, from a doctor (9%).
▫ Only just over a third (36%) of those respondents who received
information about the misuse of antibiotics say that the information
changed their views on antibiotics, a proportion which remains unchanged
since 2009.
▫ Respondents in southern European or NMS12 countries and respondents
with poor levels of knowledge about antibiotics are more likely to have had
their views changed by the information they received.
▫ Most (74%) of the respondents whose views were changed by information
on antibiotics say that, as a result, they will always consult a doctor in
situations when they think they need an antibiotic.
▫ Among those respondents who received information, just over four fifths
(82%) of those with low levels of objective knowledge about antibiotics say
that, in future, they will consult a doctor about the use of antibiotics,
compared with 69% of those who have good knowledge.
▫ Four fifths (80%) of those who received advice on antibiotics from a
professional say that they will consult a doctor in future, compared with
only just over two thirds (69%) of those who received information via
media campaigns.
▫ Almost all (94%) respondents would choose to see a medical professional
in order to get trustworthy information about antibiotics, and in particular
they would opt to see a doctor (88%).
▫ Most (79%) respondents agree with the argument that everybody has a
role to play to ensure that antibiotics remain effective. However, since
2009 the proportion of respondents who ‘totally agree’ has declined from
just over two fifths (42%) to just over one third (36%).
Two key conclusions emerge from these findings:
▫ Media campaigns are efficient at disseminating information, but they
should be targeted more effectively at those who currently lack knowledge.
▫ Information can only take us so far: as trusted and influential authorities,
doctors and pharmacies have a key role to play in changing views and
behaviour.
SPECIAL EUROBAROMETER 407 “Antimicrobial Resistance”
7
I. USE OF ANTIBIOTICS
The first set of questions deals with respondents’ use of antibiotics, asking about the
frequency with which they took them, how they obtained them, and the reason for which
they took them.
1. ANTIBIOTICS USE DURING THE LAST YEAR
-More than a third of Europeans have taken antibiotics-
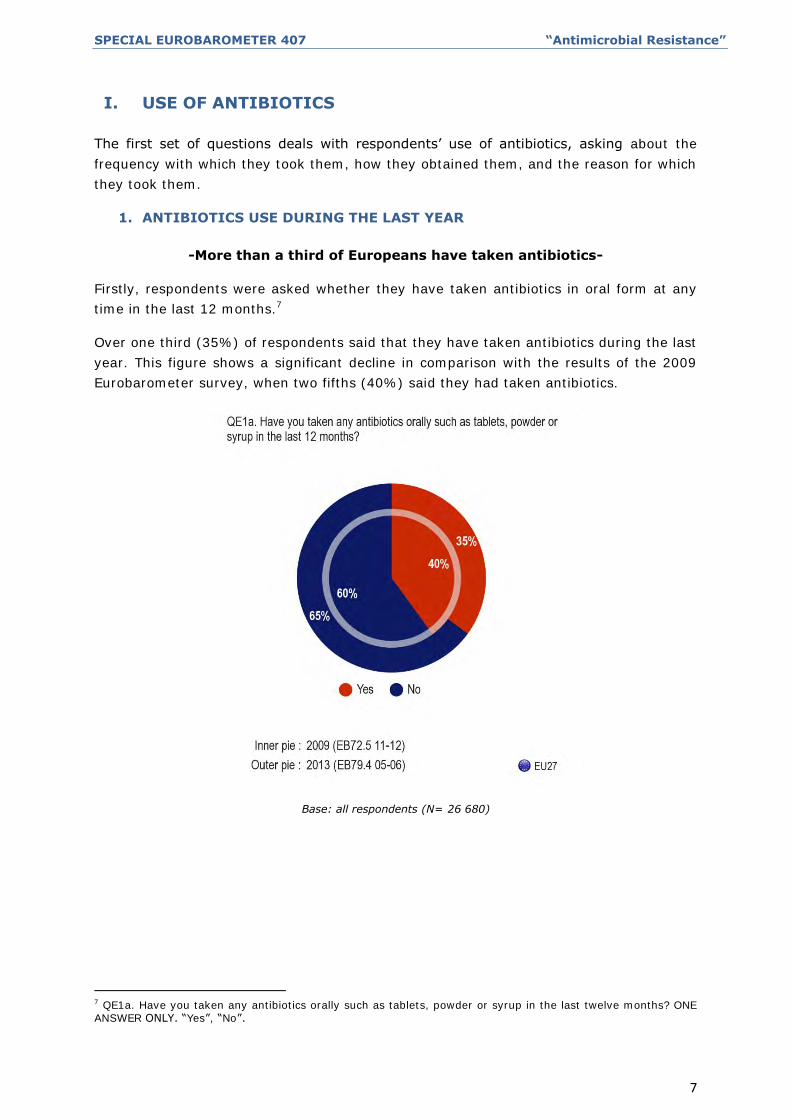
Firstly, respondents were asked whether they have taken antibiotics in oral form at any
time in the last 12 months.7
Over one third (35%) of respondents said that they have taken antibiotics during the last
year. This figure shows a significant decline in comparison with the results of the 2009
Eurobarometer survey, when two fifths (40%) said they had taken antibiotics.
Base: all respondents (N= 26 680)
7 QE1a. Have you taken any antibiotics orally such as tablets, powder or syrup in the last twelve months? ONE ANSWER ONLY. “Yes”, “No”.
SPECIAL EUROBAROMETER 407 “Antimicrobial Resistance”
8
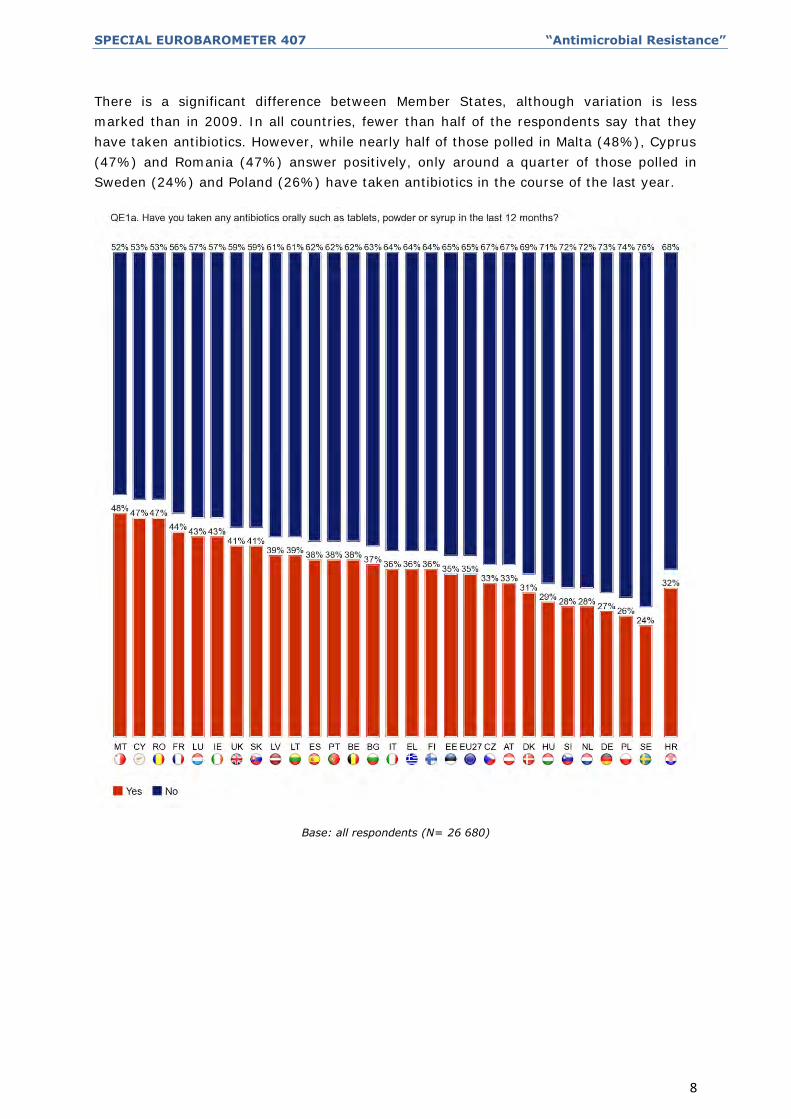
There is a significant difference between Member States, although variation is less
marked than in 2009. In all countries, fewer than half of the respondents say that they
have taken antibiotics. However, while nearly half of those polled in Malta (48%), Cyprus
(47%) and Romania (47%) answer positively, only around a quarter of those polled in
Sweden (24%) and Poland (26%) have taken antibiotics in the course of the last year.
Base: all respondents (N= 26 680)
SPECIAL EUROBAROMETER 407 “Antimicrobial Resistance”
9
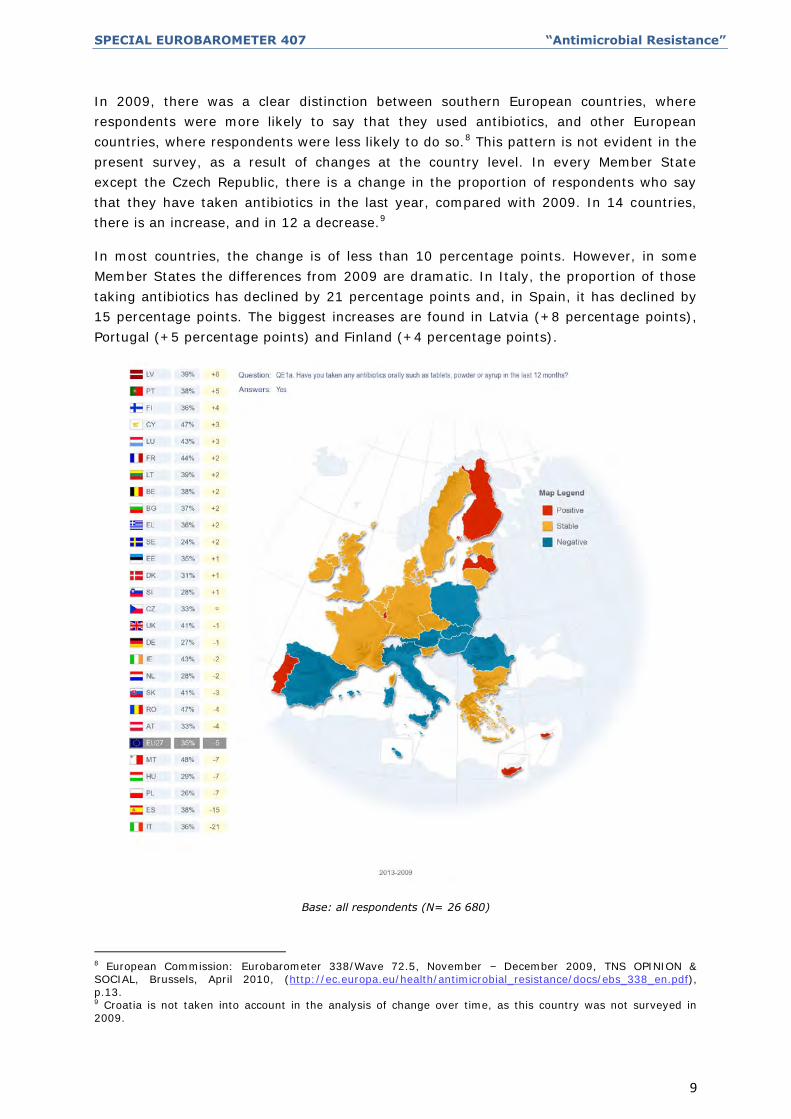
In 2009, there was a clear distinction between southern European countries, where
respondents were more likely to say that they used antibiotics, and other European
countries, where respondents were less likely to do so.8 This pattern is not evident in the
present survey, as a result of changes at the country level. In every Member State
except the Czech Republic, there is a change in the proportion of respondents who say
that they have taken antibiotics in the last year, compared with 2009. In 14 countries,
there is an increase, and in 12 a decrease.9
In most countries, the change is of less than 10 percentage points. However, in some
Member States the differences from 2009 are dramatic. In Italy, the proportion of those
taking antibiotics has declined by 21 percentage points and, in Spain, it has declined by
15 percentage points. The biggest increases are found in Latvia (+8 percentage points),
Portugal (+5 percentage points) and Finland (+4 percentage points).
Base: all respondents (N= 26 680)
8 European Commission: Eurobarometer 338/Wave 72.5, November – December 2009, TNS OPINION & SOCIAL, Brussels, April 2010, (http://ec.europa.eu/health/antimicrobial_resistance/docs/ebs_338_en.pdf), p.13. 9 Croatia is not taken into account in the analysis of change over time, as this country was not surveyed in 2009.
SPECIAL EUROBAROMETER 407 “Antimicrobial Resistance”
10
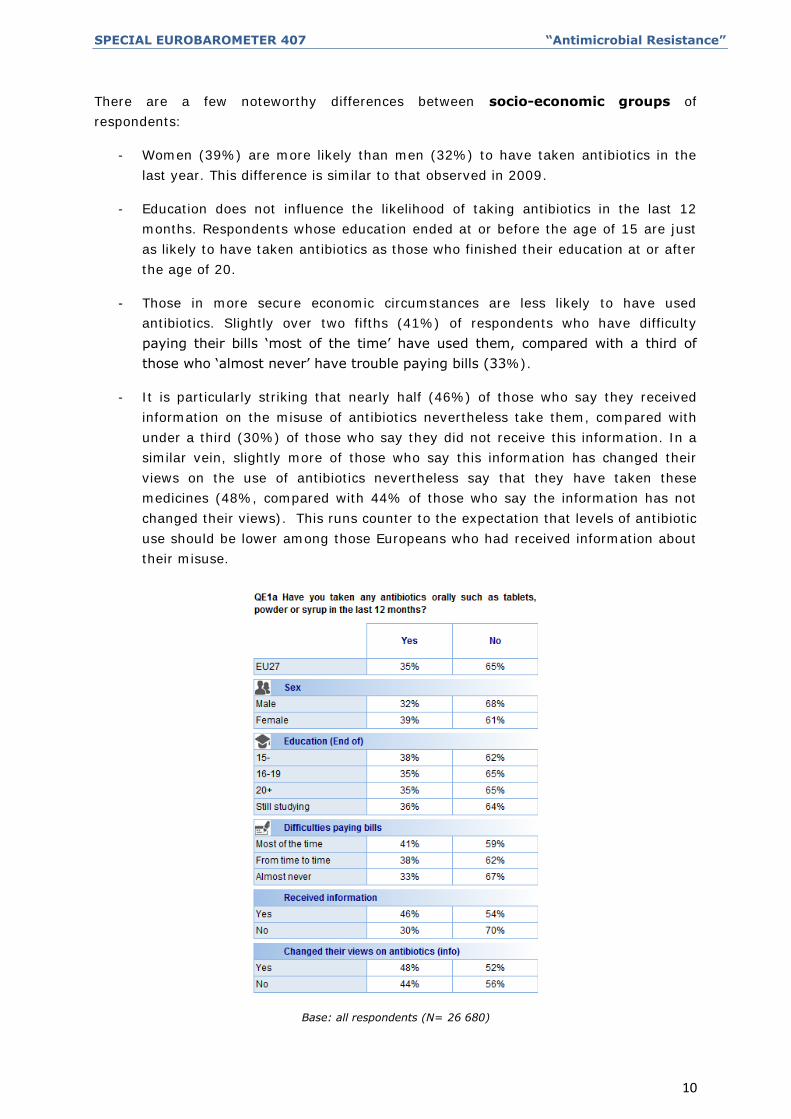
There are a few noteworthy differences between socio-economic groups of
respondents:
- Women (39%) are more likely than men (32%) to have taken antibiotics in the
last year. This difference is similar to that observed in 2009.
- Education does not influence the likelihood of taking antibiotics in the last 12
months. Respondents whose education ended at or before the age of 15 are just
as likely to have taken antibiotics as those who finished their education at or after
the age of 20.
- Those in more secure economic circumstances are less likely to have used
antibiotics. Slightly over two fifths (41%) of respondents who have difficulty
paying their bills ‘most of the time’ have used them, compared with a third of
those who ‘almost never’ have trouble paying bills (33%).
- It is particularly striking that nearly half (46%) of those who say they received
information on the misuse of antibiotics nevertheless take them, compared with
under a third (30%) of those who say they did not receive this information. In a
similar vein, slightly more of those who say this information has changed their
views on the use of antibiotics nevertheless say that they have taken these
medicines (48%, compared with 44% of those who say the information has not
changed their views). This runs counter to the expectation that levels of antibiotic
use should be lower among those Europeans who had received information about
their misuse.
Base: all respondents (N= 26 680)
SPECIAL EUROBAROMETER 407 “Antimicrobial Resistance”
11
2. WAYS OF OBTAINING ANTIBIOTICS
-The vast majority of Europeans obtain antibiotics from their health care
provider-
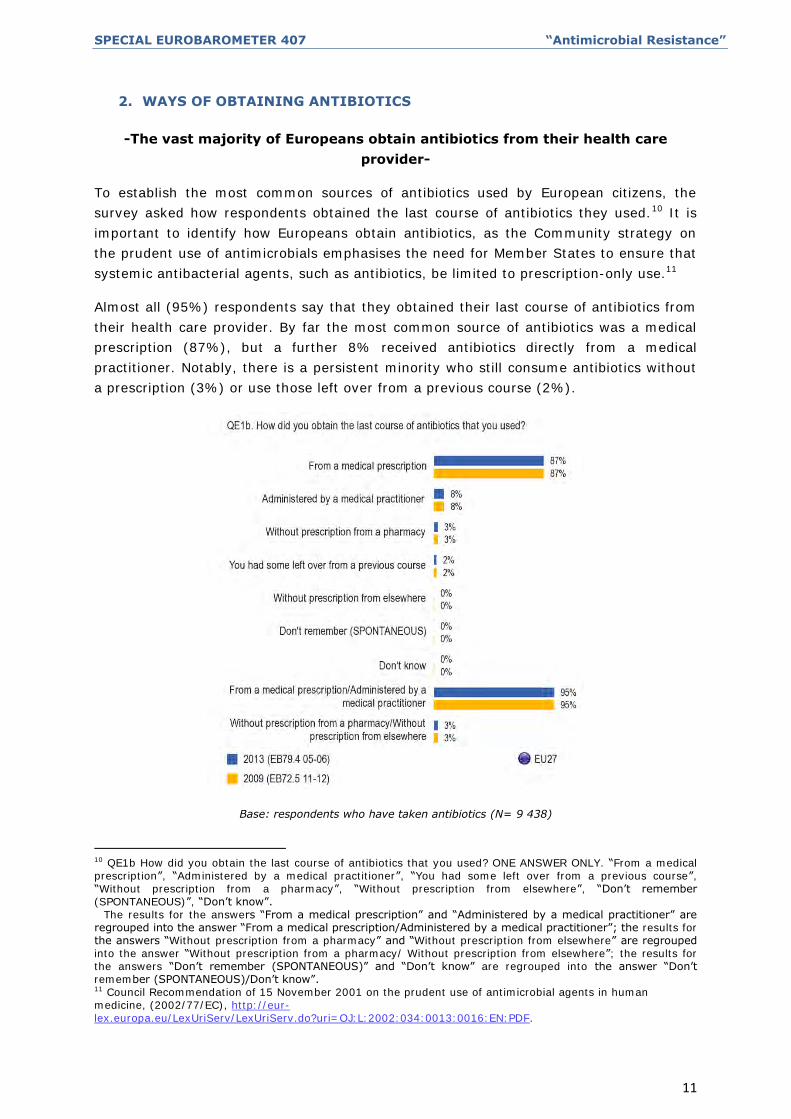
To establish the most common sources of antibiotics used by European citizens, the
survey asked how respondents obtained the last course of antibiotics they used.10 It is
important to identify how Europeans obtain antibiotics, as the Community strategy on
the prudent use of antimicrobials emphasises the need for Member States to ensure that
systemic antibacterial agents, such as antibiotics, be limited to prescription-only use.11
Almost all (95%) respondents say that they obtained their last course of antibiotics from
their health care provider. By far the most common source of antibiotics was a medical
prescription (87%), but a further 8% received antibiotics directly from a medical
practitioner. Notably, there is a persistent minority who still consume antibiotics without
a prescription (3%) or use those left over from a previous course (2%).
Base: respondents who have taken antibiotics (N= 9 438)
10 QE1b How did you obtain the last course of antibiotics that you used? ONE ANSWER ONLY. “From a medical prescription”, “Administered by a medical practitioner”, “You had some left over from a previous course”, “Without prescription from a pharmacy”, “Without prescription from elsewhere”, “Don’t remember (SPONTANEOUS)”, “Don’t know”.
The results for the answers “From a medical prescription” and “Administered by a medical practitioner” are regrouped into the answer “From a medical prescription/Administered by a medical practitioner”; the results for the answers “Without prescription from a pharmacy” and “Without prescription from elsewhere” are regrouped into the answer “Without prescription from a pharmacy/ Without prescription from elsewhere”; the results for the answers “Don’t remember (SPONTANEOUS)” and “Don’t know” are regrouped into the answer “Don’t remember (SPONTANEOUS)/Don’t know”. 11 Council Recommendation of 15 November 2001 on the prudent use of antimicrobial agents in human medicine, (2002/77/EC), http://eur-lex.europa.eu/LexUriServ/LexUriServ.do?uri=OJ:L:2002:034:0013:0016:EN:PDF.
SPECIAL EUROBAROMETER 407 “Antimicrobial Resistance”
12
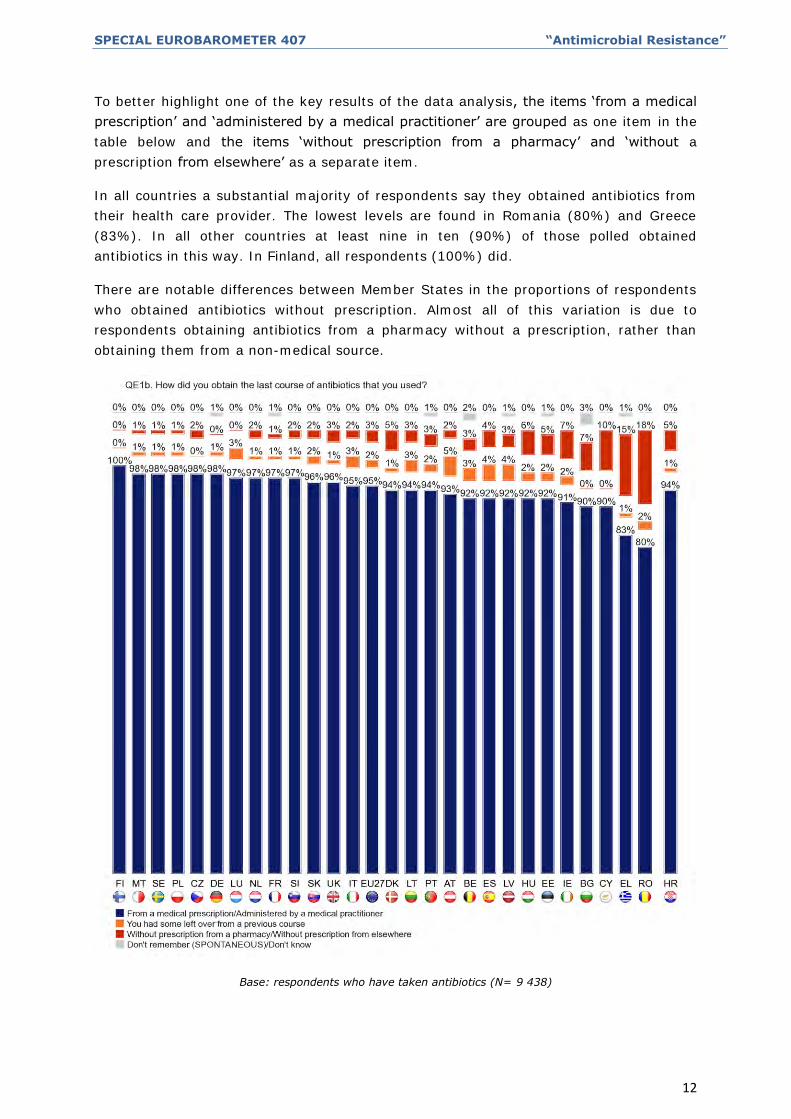
To better highlight one of the key results of the data analysis, the items ‘from a medical
prescription’ and ‘administered by a medical practitioner’ are grouped as one item in the
table below and the items ‘without prescription from a pharmacy’ and ‘without a
prescription from elsewhere’ as a separate item.
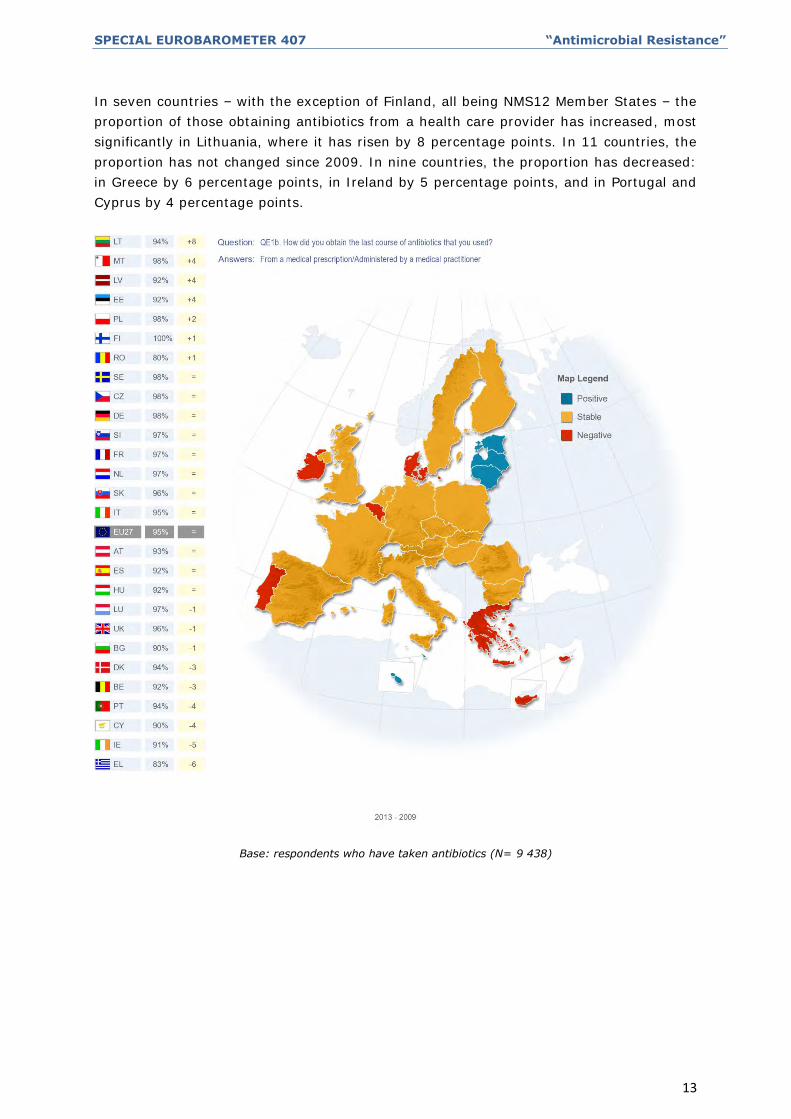
In all countries a substantial majority of respondents say they obtained antibiotics from
their health care provider. The lowest levels are found in Romania (80%) and Greece
(83%). In all other countries at least nine in ten (90%) of those polled obtained
antibiotics in this way. In Finland, all respondents (100%) did.
There are notable differences between Member States in the proportions of respondents
who obtained antibiotics without prescription. Almost all of this variation is due to
respondents obtaining antibiotics from a pharmacy without a prescription, rather than
obtaining them from a non-medical source.
Base: respondents who have taken antibiotics (N= 9 438)
SPECIAL EUROBAROMETER 407 “Antimicrobial Resistance”
13
In seven countries – with the exception of Finland, all being NMS12 Member States – the
proportion of those obtaining antibiotics from a health care provider has increased, most
significantly in Lithuania, where it has risen by 8 percentage points. In 11 countries, the
proportion has not changed since 2009. In nine countries, the proportion has decreased:
in Greece by 6 percentage points, in Ireland by 5 percentage points, and in Portugal and
Cyprus by 4 percentage points.
Base: respondents who have taken antibiotics (N= 9 438)

SPECIAL EUROBAROMETER 407 “Antimicrobial Resistance”
14
This following section provides a more detailed country-by-country analysis as to the way
antibiotics are obtained. All the possible answers are analysed separately, and
interpretations provided as to the most notable country differences.
As to antibiotics obtained from health care providers, we find that in all but three
countries, three quarters (75%) or more of those taking antibiotics obtained them from a
medical prescription. This is very similar to the situation in 2009. However, in Lithuania
fewer than half (43%) of those polled obtained antibiotics from a medical prescription,
while, in Sweden, two-thirds (66%) did. In both countries, these proportions have
increased by 8 percentage points since 2009. By contrast, in Greece just under three
quarters (73%) of respondents obtained antibiotics in this way, a decline of 8 percentage
points.
In most cases, fewer than a fifth (20%) of respondents received antibiotics directly from
a medical practitioner. In Hungary, France and Slovakia, only 1% did. However, in
Lithuania, slightly over half (51%) of those polled say they received antibiotics directly
(unchanged since 2009) and, in Sweden, just under a third (32%, a decrease of 8
percentage points). The biggest increase is found in Malta, where just over a fifth (21%)
of respondents say they received antibiotics directly, compared with 15% in 2009.
In most Member States, only a small minority of respondents obtained antibiotics from a
pharmacist without prescription. No respondents in Finland, Germany or Luxembourg
give this answer. However, proportions are significantly higher in Romania (17%),
Greece (15%) and Cyprus (10%). While, for the most part, changes since 2009 are
minimal, Greece has seen an 8 percentage point increase in the proportion of those
obtaining antibiotics in this way, Ireland an increase of 5 percentage points, while, in
Lithuania, the proportion decreased by 5 percentage points. As noted above, both Greece
and Ireland have seen significant decreases in the proportion of respondents who
obtained antibiotics on prescription.
Very few respondents say they used left-over medicines for their most recent course of
antibiotics. The highest proportion is found in Austria, where 5% of respondents give this
answer (an increase of 3 percentage points since 2009), followed by Spain (4%, +1
percentage point) and Latvia (4%, -1 percentage point).
Hardly any respondents say that they obtained their last course of antibiotics from
elsewhere (i.e. neither from their healthcare practitioner nor off-prescription from a
pharmacy). In 14 of the EU27 Member States, none of those polled give this answer. The
largest proportion can be found in Denmark, where 3% say they obtained antibiotics in
this way.
As in 2009, there are no significant differences between socio-demographic groups on
this question. The low response levels for all options other than ‘From a medical
prescription’ mean that differences in those categories – which in most countries are
minimal – are not statistically significant. However, those with good knowledge of
antibiotics are slightly more likely to have obtained their last course of antibiotics with a
medical prescription (89%, compared with 85% of those whose knowledge of antibiotics
is poor).

SPECIAL EUROBAROMETER 407 “Antimicrobial Resistance”
Base: respondents who have taken antibiotics (N= 9 438)
SPECIAL EUROBAROMETER 407 “Antimicrobial Resistance”
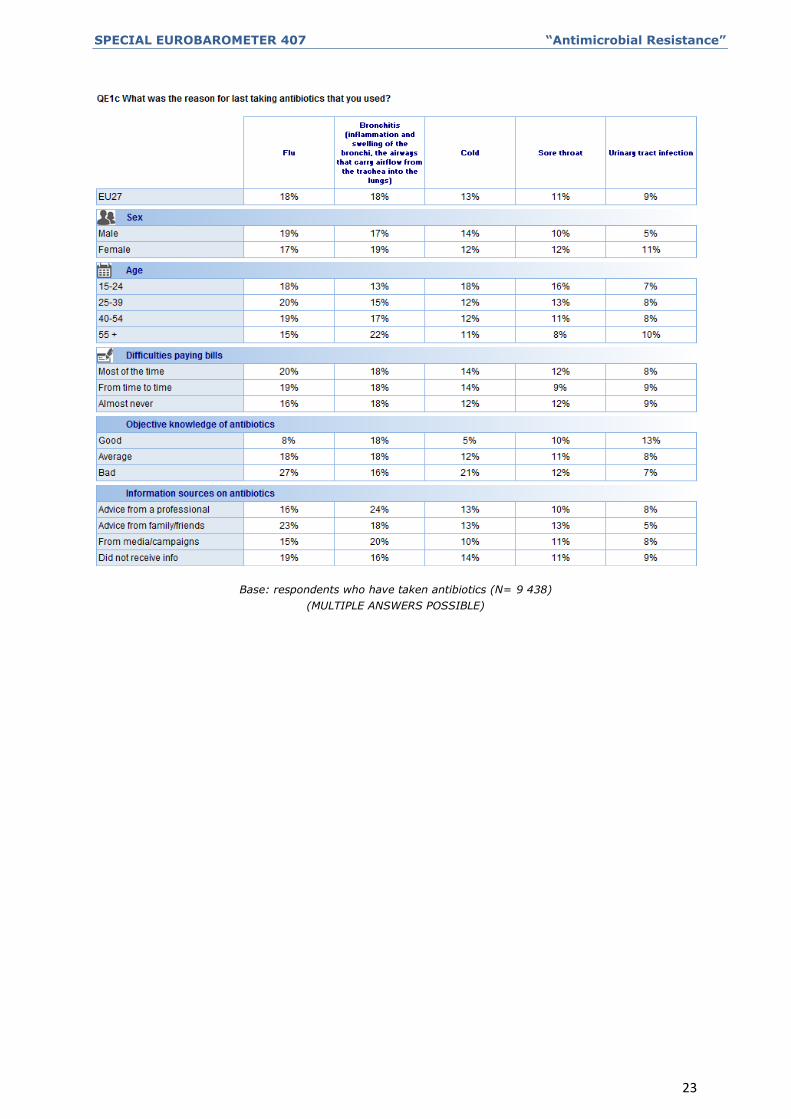
3. REASONS FOR TAKING ANTIBIOTICS
-Flu and bronchitis are the most common reasons for taking antibiotics-
Respondents who said they had taken antibiotics in the last year were asked for what
reasons they had taken them. The interviewer presented respondents with a card on
which a variety of illnesses and symptoms were printed, some of which antibiotics treat
effectively (e.g. pneumonia) and some of which antibiotics are ineffective at treating
(e.g. cold, flu).12 This question allows us to determine the extent to which Europeans use
antibiotics appropriately.
The most common responses among the listed options are flu (18%, down from 20% in
2009) and bronchitis (18%, up from 17% in 2009). Compared with 2009, fewer
respondents say they take antibiotics to treat a sore throat (11%, compared with 15% in
2009). Other differences over time are of negligible magnitude.
The most common answer is non-specific, with slightly over a fifth (21%) of those polled
saying that they took antibiotics for reasons other than the list of options given to them.
One in ten (10%) of those taking antibiotics do so to treat both illnesses and symptoms,
while more than a quarter (26%) of respondents take them to treat symptoms alone13.
These proportions are very similar to those observed in 2009.
12 QE1c What was the reason for last taking antibiotics that you used? MULTIPLE ANSWERS POSSIBLE. “Pneumonia (an infection causing an inflammation of one or both lungs)”, “Bronchitis (inflammation and swelling of the bronchi, the airways that carry airflow from the trachea into the lungs)”, “Rhinopharyngitis (inflammation of the mucous membrane of the nose and pharynx)”, “Flu”, “Cold”, “Sore throat”, “Cough”, “Fever”, “Headache”, “Diarrhea”, “Urinary tract infection”, “Skin or wound infection”, “Other (SPONTANEOUS)”, “Don’t know”.
13 The results for the answers “Pneumonia (an infection causing an inflammation of one or both lungs)”, “Bronchitis (inflammation and swelling of the bronchi, the airways that carry airflow from the trachea into the lungs)”, “Rhinopharyngitis (inflammation of the mucous membrane of the nose and pharynx)”, “Flu” and “Cold” are regrouped into the answer “Illness only”.
The results for the answers “Sore throat”, “Cough”, “Fever”, “Headache”, “Diarrhea”, “Urinary tract infection” and “Skin or wound infection” are regrouped into the answer “Symptom only”.
Any combination of answers containing at least one answer used in the regrouping “Illness only” and at least one answer used in the regrouping “Symptom only” is regrouped into the answer “Illness and symptom”.

SPECIAL EUROBAROMETER 407 “Antimicrobial Resistance”
17
Base: respondents who have taken antibiotics (N= 9 438)
(MULTIPLE ANSWERS POSSIBLE)

SPECIAL EUROBAROMETER 407 “Antimicrobial Resistance”
18
The following table displays country-level answers for five commonly cited illnesses or
symptoms. There are clear differences between respondents in different Member States
on the question as to the reason for their last course of antibiotics.14
- In Bulgaria, one third (34%) of respondents take antibiotics to combat flu, with
Cyprus (31%) and Malta (30%) not far behind. At the other extreme, only 6% of
respondents in the Netherlands and Sweden take antibiotics in these
circumstances, as do 7% of those polled in Finland and 8% in Denmark. The
biggest increases since 2009 in the proportion of those using antibiotics against
flu are found in Bulgaria and France (+8 percentage points), Latvia (+7
percentage points) and Romania (+6 percentage points). The decrease is largest
in Spain, where the proportion of respondents is down by 12 percentage points.
There have also been significant decreases in Germany and Italy, where the
proportion has declined by 6 percentage points.
- One third of those polled in the Czech Republic (34%), Austria (34%) and
Slovakia (32%) say they took antibiotics to treat bronchitis. However, only a
small minority give this answer in Sweden (4%) and Denmark (6%). In Austria,
the proportion of those mentioning bronchitis has risen by 11 percentage points.
Other significant increases have occurred in the Czech Republic and Slovakia (+7
percentage points), and in Italy and Lithuania (+6 percentage points). The only
significant decreases have occurred in Ireland (-6 percentage points) and the
Netherlands (-5 percentage points).
- There are substantial differences between Member States on the question of
whether respondents had used antibiotics to treat a cold. In comparison with the
EU27 average of 13%, Romania stands out with a particularly high figure: over
one third (35%) of respondents in that country say they used antibiotics to treat a
cold. Around a quarter of respondents give the same answer in Bulgaria and
Greece (both 23%), in Cyprus and Austria (both 24%) and in Latvia (26%). In
Sweden and Denmark, only 3% of respondents do. In the majority of Member
States, there has been only negligible change since 2009: the exceptions are
Malta, Spain and Bulgaria, where the proportion has decreased by 6, 7 and 9
percentage points, respectively, and Germany and Ireland, where it has increased
by 6 and 7 percentage points, respectively.
- On the question of whether respondents used antibiotics to treat a sore throat,
most Member States are reasonably close to the EU27 average of 11%. The most
prominent differences are Malta and Croatia (both 30%), Hungary (27%) and
Slovakia (25%).15 No country stands out as particularly low: the smallest
proportions giving this answer are found in Luxembourg, Romania and the
Netherlands (each 6%).
14 Antibiotics are effective in treating urinary tract infection, but ineffective against colds and flu, which are caused by viruses. Most sore throats and bronchial infections are caused by viruses and should not be treated with antibiotics, but in some cases bacteria can be the cause of these illnesses, and then antibiotics are appropriate. 15 It should be remembered that Croatia is not taken into account when calculating the EU27 average shown in the tables.

SPECIAL EUROBAROMETER 407 “Antimicrobial Resistance”
19
Again, in most countries, only small changes have occurred since 2009. There are
two prominent countries, though: in Spain and Austria, the proportion of those using
antibiotics to treat a sore throat has decreased by 12 percentage points. In Portugal,
it has decreased by 6 percentage points.
- The lowest degree of country-level variation occurs in the case of urinary tract
infection. The highest proportions of respondents saying that they used antibiotics
to treat this illness are found in the Netherlands (17%), Denmark and Sweden
(both 15%) and the Czech Republic (14%). The lowest proportions are found in
Latvia and Lithuania (3%). The most significant changes since 2009 are in
Sweden, where the proportion dropped by 8 percentage points, and the United
Kingdom, where it rose by 5 percentage points. In all other countries, change in
either direction did not exceed 5 percentage points.
Base: respondents who have taken antibiotics (N= 9 438)
(MULTIPLE ANSWERS POSSIBLE)
SPECIAL EUROBAROMETER 407 “Antimicrobial Resistance”
20
When answers are aggregated into illnesses and symptoms16, there are some clear
country-level differences. In five countries – all of which are from the NMS12 group of
Member States – half or more of respondents say they used antibiotics only to treat an
illness: these are Poland (59%), Bulgaria (52%), Czech Republic (51%), Lithuania (51%)
and Latvia (50%). Correspondingly, in all these countries the proportion of those saying
they used antibiotics only to treat symptoms is lower than the EU27 average of 26%.
At the other extreme, in Slovenia (22%) and Sweden (23%), fewer than a quarter of
respondents used antibiotics solely to treat an illness, while in both countries two fifths
(38%) used them only for the treatment of symptoms. There is also a notable variation
among the proportions of respondents who say they used antibiotics to treat both
illnesses and symptoms. The highest level is found in Austria, where 29% of respondents
give this answer; levels are also high in Bulgaria (23%) and Slovakia (20%).
For almost all countries, change since 2009 remains below 10 percentage points. The
exceptions are in Luxembourg, where the proportion of those treating only illnesses with
antibiotics declined by 11 percentage points, and Spain, where the proportion of those
treating both illnesses and symptoms decreased by 15 percentage points.
16 The terms ‘Illness only’, ‘Symptom only’ and ‘Illness and symptom’ have been defined as follows: The results for the answers “Pneumonia (an infection causing an inflammation of one or both lungs)”, “Bronchitis (inflammation and swelling of the bronchi, the airways that carry airflow from the trachea into the lungs)”, “Rhinopharyngitis (inflammation of the mucous membrane of the nose and pharynx)”, “Flu” and “Cold” are regrouped into the answer “Illness only”. The results for the answers “Sore throat”, “Cough”, “Fever”, “Headache”, “Diarrhea”, “Urinary tract infection” and “Skin or wound infection” are regrouped into the answer “Symptom only”. Any combination of answers containing at least one answer used in the regrouping “Illness only” and at least one answer used in the regrouping “Symptom only” is regrouped into the answer “Illness and symptom”.

SPECIAL EUROBAROMETER 407 “Antimicrobial Resistance”
21
Base: respondents who have taken antibiotics (N= 9 438)
(MULTIPLE ANSWERS POSSIBLE)
SPECIAL EUROBAROMETER 407 “Antimicrobial Resistance”
22
There are a number of clear differences between socio-demographic groups
concerning the likelihood of taking antibiotics to treat the five illnesses and symptoms
focused on in the country-level analysis:
- Use of antibiotics to treat urinary tract infections is more common in women
(11%) than in men (5%), although some of this difference reflects the greater
propensity of women to develop such infections. Women are also more likely to
use antibiotics to treat symptoms only (28%, compared with 24% of male
respondents).
- Where age is concerned, it is difficult to point out a greater propensity to use
antibiotics from the greater probability that individuals in certain age groups will
suffer from particular illnesses. However, one conclusion is clear: younger
respondents are more likely to use antibiotics to treat illnesses for which they are
not effective. Those in the 25-39 age group (20%) are more likely to use them
when suffering from flu than respondents aged 55 or older (15%). Twice as many
respondents in the 15-24 age group (16%) use antibiotics to treat a sore throat
compared to those aged 55 or older (8%); for colds, the proportions are 18% and
11% respectively. On the other hand, 13% of those aged 15-24 use antibiotics to
treat bronchitis, compared with 22% of those aged 55 and over.
As in 2009, objective knowledge of antibiotics mostly leads respondents to take
antibiotics in ways consistent with that knowledge. While there is no difference in the
case of sore throats, those with poor objective knowledge of antibiotics are significantly
more likely to take these medicines for flu and colds (27% and 21% respectively,
compared with 18% and 12% respectively of those with medium levels of knowledge and
8% and 5% respectively of those with a good level of knowledge).
The source of the information that respondents receive regarding unnecessary use of
antibiotics is also important in some cases. Slightly less than a quarter (24%) of those
who say they received the information from a professional took antibiotics to treat
bronchitis, compared with fewer than a fifth (18%) of those who received information
from family and friends. The relationship is reversed in the case of flu: 23% of those who
received information from family and friends took antibiotics in these circumstances,
compared with only 16% of those who gained information from professionals.
SPECIAL EUROBAROMETER 407 “Antimicrobial Resistance”
23
Base: respondents who have taken antibiotics (N= 9 438)
(MULTIPLE ANSWERS POSSIBLE)
SPECIAL EUROBAROMETER 407 “Antimicrobial Resistance”
24
II. KNOWLEDGE ABOUT ANTIBIOTICS
The second set of questions concern objective knowledge of antibiotics. Respondents
were asked if each of four statements about antibiotics was ‘true’ or ‘false’. The
statements are as follows:
- Antibiotics kill viruses. (FALSE)
- Antibiotics are effective against colds and flu. (FALSE)
- Unnecessary use of antibiotics makes them become ineffective. (TRUE)
- Taking antibiotics often has side-effects, such as diarrhea. (TRUE)
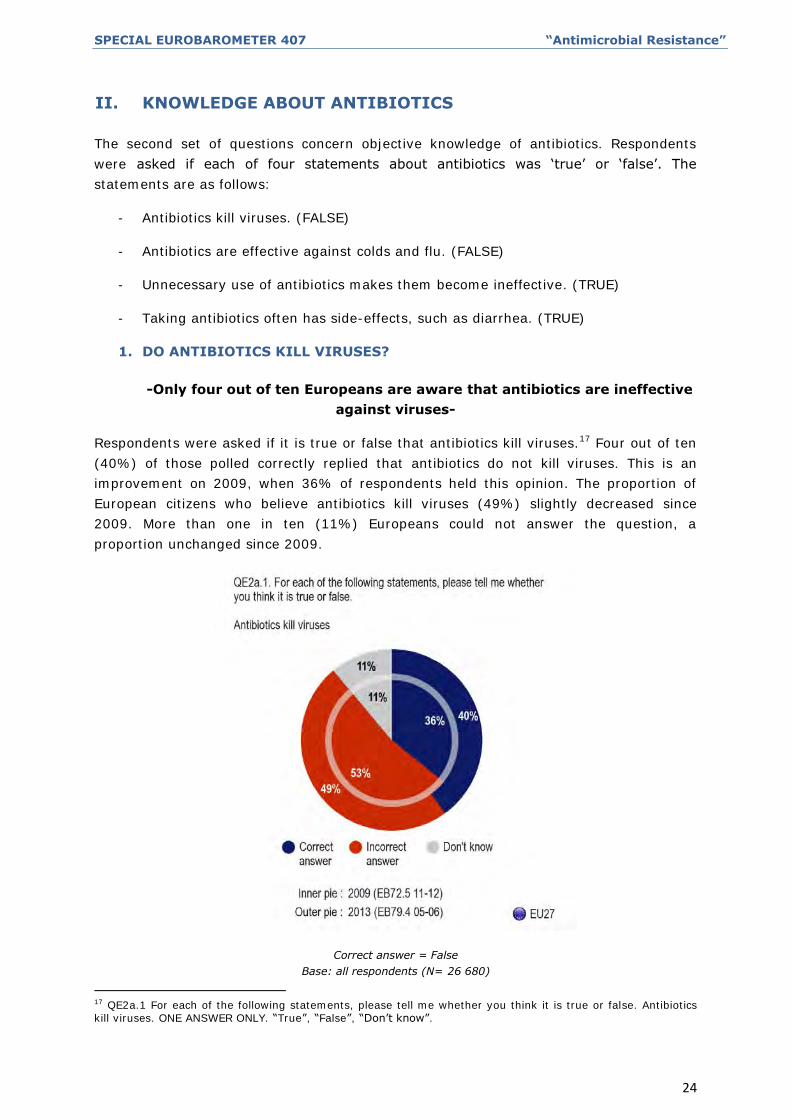
1. DO ANTIBIOTICS KILL VIRUSES?
-Only four out of ten Europeans are aware that antibiotics are ineffective
against viruses-
Respondents were asked if it is true or false that antibiotics kill viruses.17 Four out of ten
(40%) of those polled correctly replied that antibiotics do not kill viruses. This is an
improvement on 2009, when 36% of respondents held this opinion. The proportion of
European citizens who believe antibiotics kill viruses (49%) slightly decreased since
2009. More than one in ten (11%) Europeans could not answer the question, a
proportion unchanged since 2009.
Correct answer = False
Base: all respondents (N= 26 680)
17 QE2a.1 For each of the following statements, please tell me whether you think it is true or false. Antibiotics kill viruses. ONE ANSWER ONLY. “True”, “False”, “Don’t know”.

SPECIAL EUROBAROMETER 407 “Antimicrobial Resistance”
25
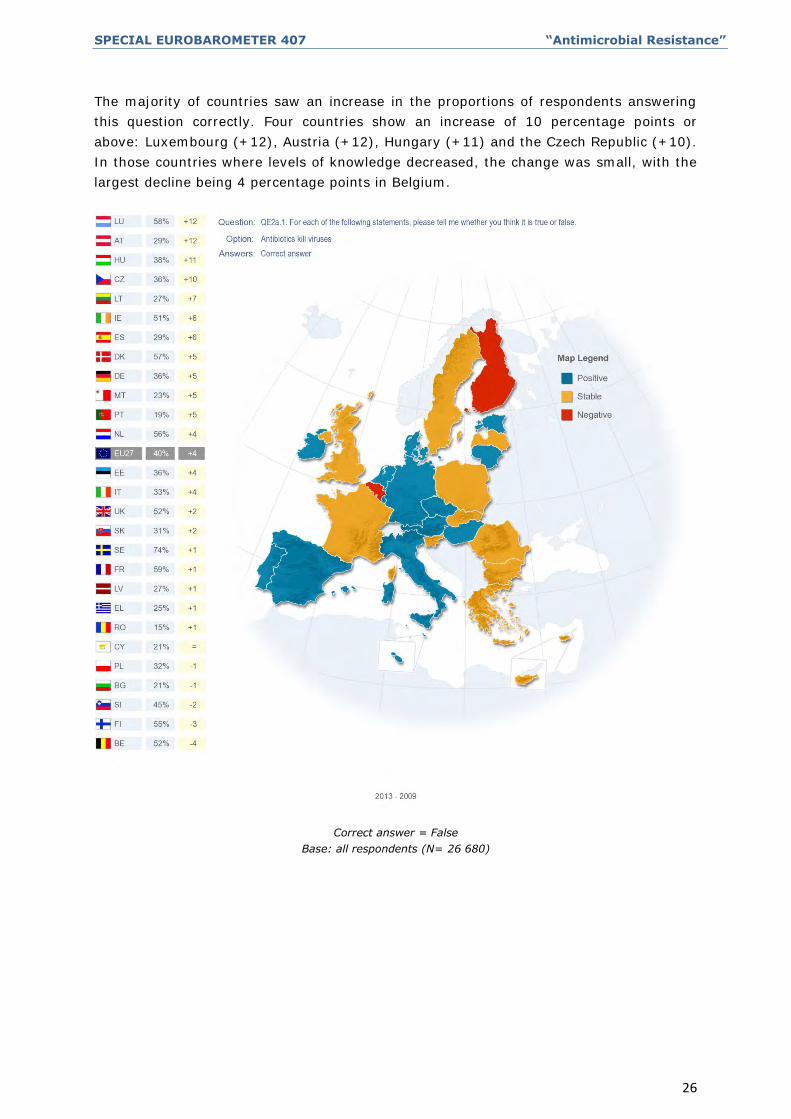
There are significant differences on this question at the country level. In nine countries, a
majority of respondents correctly answered that antibiotics do not kill viruses. All of
these countries are in Northern or Western Europe. In Sweden, three quarters (74%) of
respondents gave the correct reply. In the other eight countries, where a majority of
respondents give a correct answer, the proportion ranges between 51% and 59%.
In 13 countries, only a third (33%) or fewer of those polled give the correct answer.
Levels of knowledge are particularly low in Romania (15%) and Portugal (19%), closely
followed by Cyprus and Bulgaria (both 21%).
More than one in ten respondents in 11 countries answered spontaneously that they do
not know the answer, the highest proportion being in Germany (16%).
Correct answer = False
Base: all respondents (N= 26 680)
SPECIAL EUROBAROMETER 407 “Antimicrobial Resistance”
26
The majority of countries saw an increase in the proportions of respondents answering
this question correctly. Four countries show an increase of 10 percentage points or
above: Luxembourg (+12), Austria (+12), Hungary (+11) and the Czech Republic (+10).
In those countries where levels of knowledge decreased, the change was small, with the
largest decline being 4 percentage points in Belgium.
Correct answer = False
Base: all respondents (N= 26 680)

SPECIAL EUROBAROMETER 407 “Antimicrobial Resistance”
27
A number of relevant socio-demographic differences can be identified.
- Education has a significant influence. Only just over a quarter (27%) of those
whose education ended at or before the age of 15 correctly say that antibiotics
are ineffective against viruses, while more than half (52%) of those whose
education ended at or after the age of 20 give this answer.
- Economic status is also influential: only around a third of those who have trouble
paying bills most of the time (32%) give the correct answer, while over two fifths
of those who almost never have problems paying bills (43%) do.
Although having taken antibiotics did not exert a significant effect, there is evidence that
media campaigns are effective in raising awareness. Over half (52%) of those who
received information about antibiotics give the correct answer to this question, compared
with just over a third (34%) of those who did not receive information. Notably, 55% of
those who received information from media campaigns give the correct answer and 44%
of those who received advice from a professional did so in comparison to people who
have not received any information of whom 34% answered correctly.
Base: all respondents (N= 26 680)
SPECIAL EUROBAROMETER 407 “Antimicrobial Resistance”
28
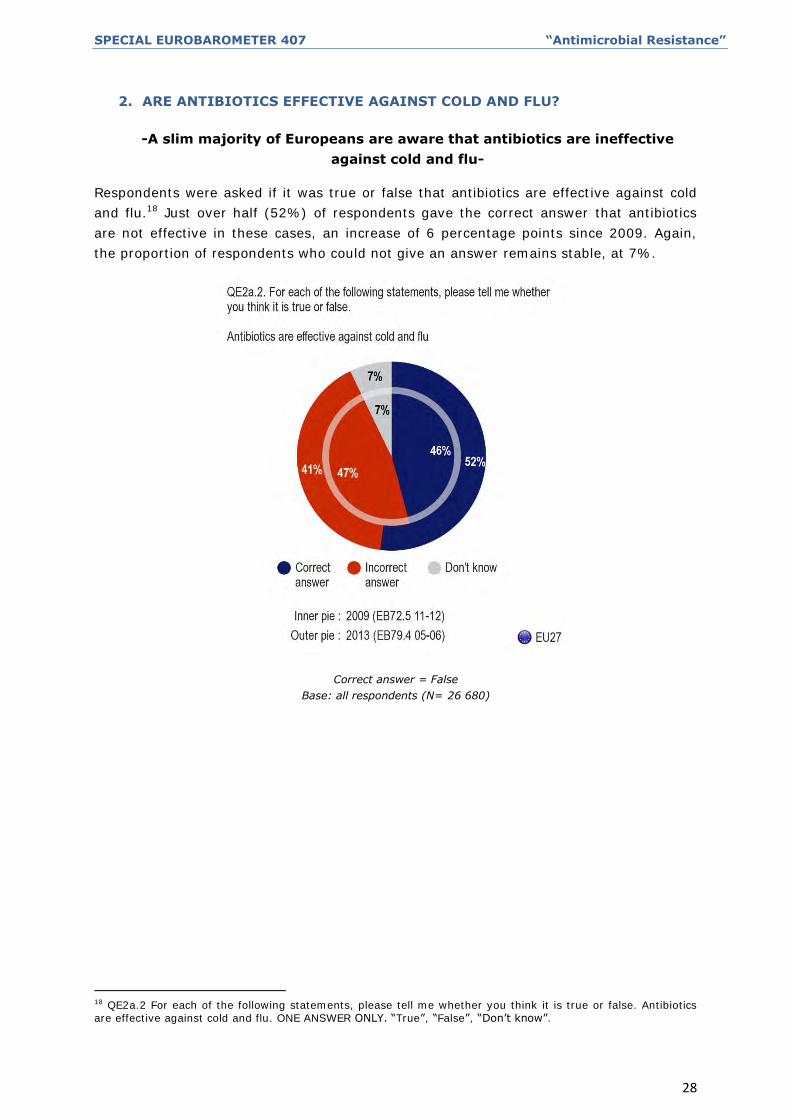
2. ARE ANTIBIOTICS EFFECTIVE AGAINST COLD AND FLU?
-A slim majority of Europeans are aware that antibiotics are ineffective
against cold and flu-
Respondents were asked if it was true or false that antibiotics are effective against cold
and flu.18 Just over half (52%) of respondents gave the correct answer that antibiotics
are not effective in these cases, an increase of 6 percentage points since 2009. Again,
the proportion of respondents who could not give an answer remains stable, at 7%.
Correct answer = False
Base: all respondents (N= 26 680)
18 QE2a.2 For each of the following statements, please tell me whether you think it is true or false. Antibiotics are effective against cold and flu. ONE ANSWER ONLY. “True”, “False”, “Don’t know”.
SPECIAL EUROBAROMETER 407 “Antimicrobial Resistance”
29
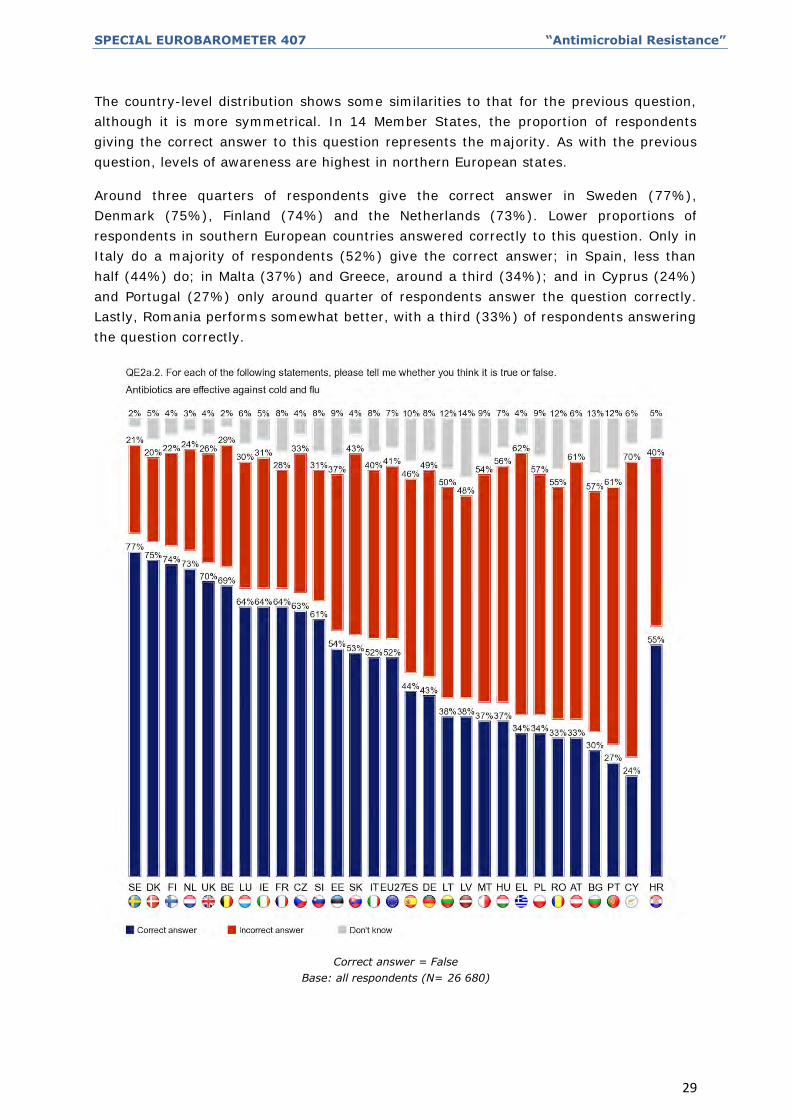
The country-level distribution shows some similarities to that for the previous question,
although it is more symmetrical. In 14 Member States, the proportion of respondents
giving the correct answer to this question represents the majority. As with the previous
question, levels of awareness are highest in northern European states.
Around three quarters of respondents give the correct answer in Sweden (77%),
Denmark (75%), Finland (74%) and the Netherlands (73%). Lower proportions of
respondents in southern European countries answered correctly to this question. Only in
Italy do a majority of respondents (52%) give the correct answer; in Spain, less than
half (44%) do; in Malta (37%) and Greece, around a third (34%); and in Cyprus (24%)
and Portugal (27%) only around quarter of respondents answer the question correctly.
Lastly, Romania performs somewhat better, with a third (33%) of respondents answering
the question correctly.
Correct answer = False
Base: all respondents (N= 26 680)
SPECIAL EUROBAROMETER 407 “Antimicrobial Resistance”
30
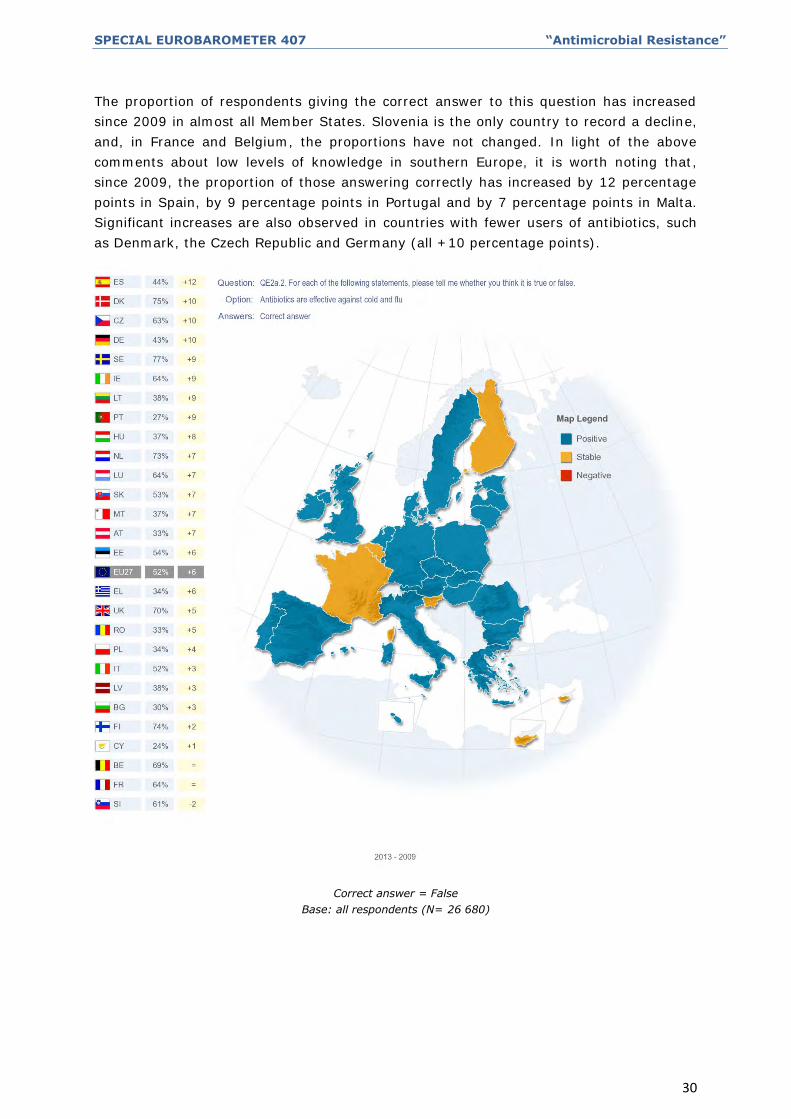
The proportion of respondents giving the correct answer to this question has increased
since 2009 in almost all Member States. Slovenia is the only country to record a decline,
and, in France and Belgium, the proportions have not changed. In light of the above
comments about low levels of knowledge in southern Europe, it is worth noting that,
since 2009, the proportion of those answering correctly has increased by 12 percentage
points in Spain, by 9 percentage points in Portugal and by 7 percentage points in Malta.
Significant increases are also observed in countries with fewer users of antibiotics, such
as Denmark, the Czech Republic and Germany (all +10 percentage points).
Correct answer = False
Base: all respondents (N= 26 680)

SPECIAL EUROBAROMETER 407 “Antimicrobial Resistance”
31
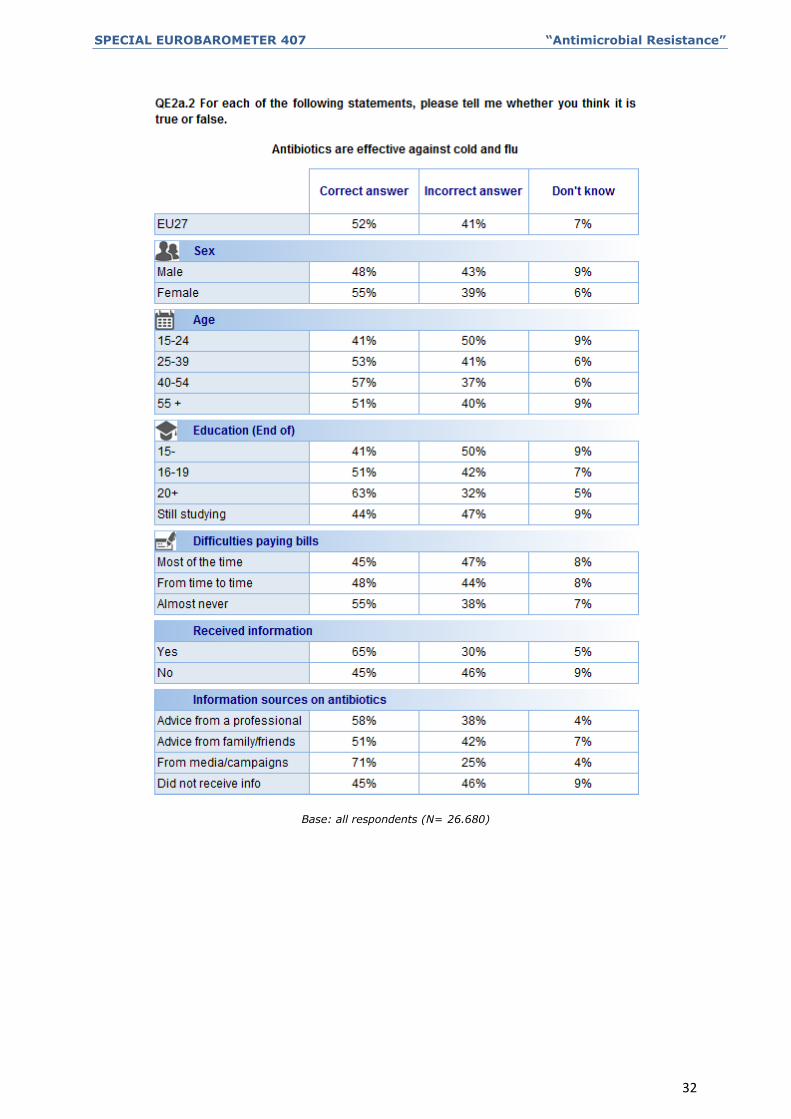
A socio-demographic analysis of the results reveals the following:
- Women (55%) are more likely than men (48%) to give the correct answer that
antibiotics are not effective against colds and flu.
- Younger respondents are less likely than other respondents to give the correct
answer. Around four out of 10 respondents (41%) of the 15 to 24 age cohort give
the correct answer, compared with the EU27 average of 52%.
- Again, education has a clear impact: around four out of 10 respondents (41%) of
those who finished education at the age of 15 or earlier give the correct answer,
compared with nearly two thirds (63%) of those who finished at 20 or later.
- Economic circumstances also matter. Those who are in a more vulnerable position
are less likely to give the correct answer, with only 45% of those who have
trouble paying bills most of the time saying that antibiotics are ineffective in the
case of cold and flu. In contrast, 55% of those who have almost no problems
paying bills give the correct answer.
The positive role of media campaigns is again clear. Just under two thirds (65%) of those
who have received information regarding the unnecessary use of antibiotics give the
correct answer in this case, compared with fewer than half (45%) of those who did not
receive any information. Nearly three quarters (71%) of those who received information
from the media answered correctly and 58% of those who received information from
professionals did so, in comparison to 45% of those who did not receive any information.
SPECIAL EUROBAROMETER 407 “Antimicrobial Resistance”
32
Base: all respondents (N= 26.680)
SPECIAL EUROBAROMETER 407 “Antimicrobial Resistance”
33
3. DOES UNNECESSARY USE OF ANTIBIOTICS MAKE THEM BECOME
INEFFECTIVE?
-Most Europeans are aware that unnecessary use of antibiotics makes
them become ineffective-
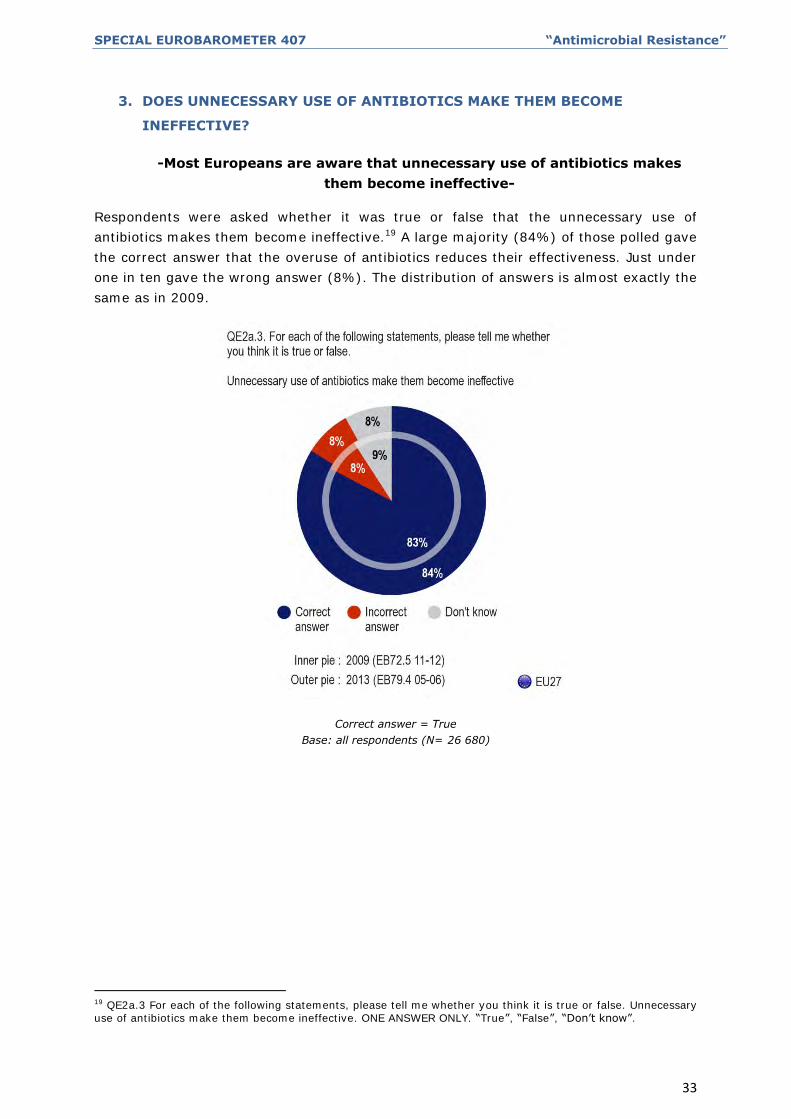
Respondents were asked whether it was true or false that the unnecessary use of
antibiotics makes them become ineffective.19 A large majority (84%) of those polled gave
the correct answer that the overuse of antibiotics reduces their effectiveness. Just under
one in ten gave the wrong answer (8%). The distribution of answers is almost exactly the
same as in 2009.
Correct answer = True
Base: all respondents (N= 26 680)
19 QE2a.3 For each of the following statements, please tell me whether you think it is true or false. Unnecessary use of antibiotics make them become ineffective. ONE ANSWER ONLY. “True”, “False”, “Don’t know”.
SPECIAL EUROBAROMETER 407 “Antimicrobial Resistance”
34
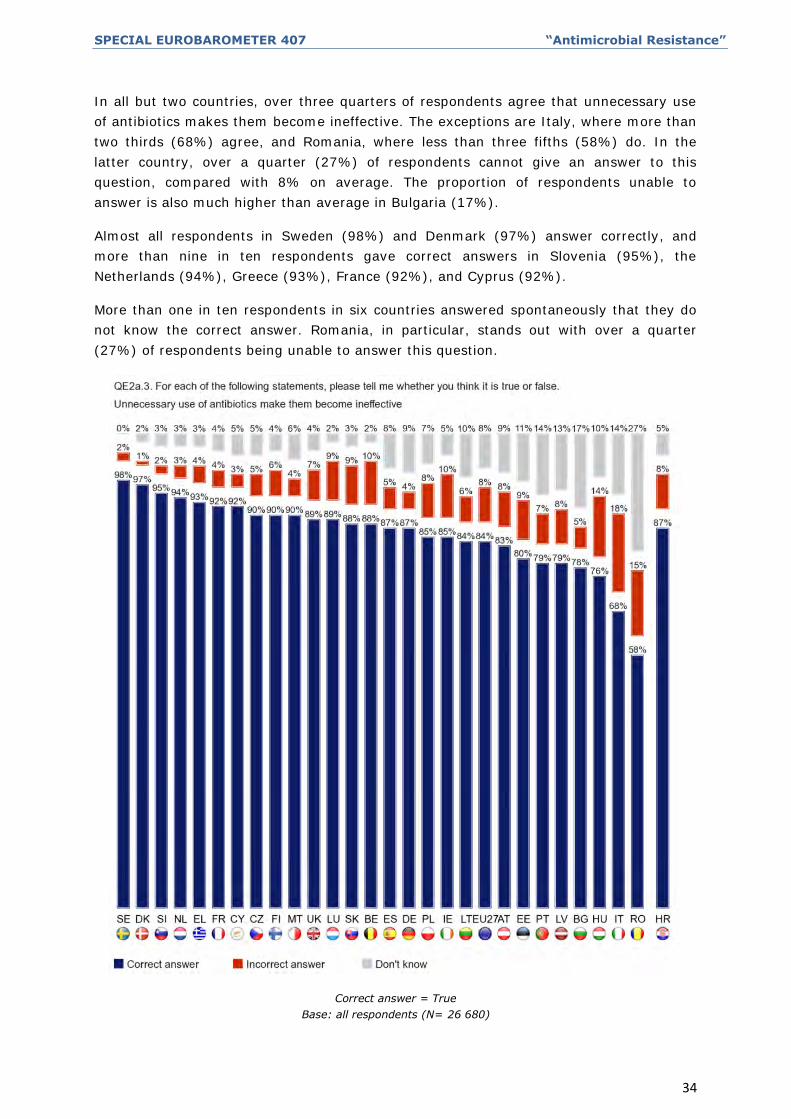
In all but two countries, over three quarters of respondents agree that unnecessary use
of antibiotics makes them become ineffective. The exceptions are Italy, where more than
two thirds (68%) agree, and Romania, where less than three fifths (58%) do. In the
latter country, over a quarter (27%) of respondents cannot give an answer to this
question, compared with 8% on average. The proportion of respondents unable to
answer is also much higher than average in Bulgaria (17%).
Almost all respondents in Sweden (98%) and Denmark (97%) answer correctly, and
more than nine in ten respondents gave correct answers in Slovenia (95%), the
Netherlands (94%), Greece (93%), France (92%), and Cyprus (92%).
More than one in ten respondents in six countries answered spontaneously that they do
not know the correct answer. Romania, in particular, stands out with over a quarter
(27%) of respondents being unable to answer this question.
Correct answer = True
Base: all respondents (N= 26 680)

SPECIAL EUROBAROMETER 407 “Antimicrobial Resistance”
35
As we might expect from the high overall level of knowledge and the lack of overall
change since 2009, country-level changes are minimal and without geographic pattern.
In 15 countries, levels of knowledge have risen, with the greatest increase in France (+5
percentage points). In 10 countries, levels of knowledge have fallen, with the greatest
decrease in Portugal (-5 percentage points). In the United Kingdom and Poland, there is
no change.
Correct answer = True
Base: all respondents (N= 26 680)
SPECIAL EUROBAROMETER 407 “Antimicrobial Resistance”
36
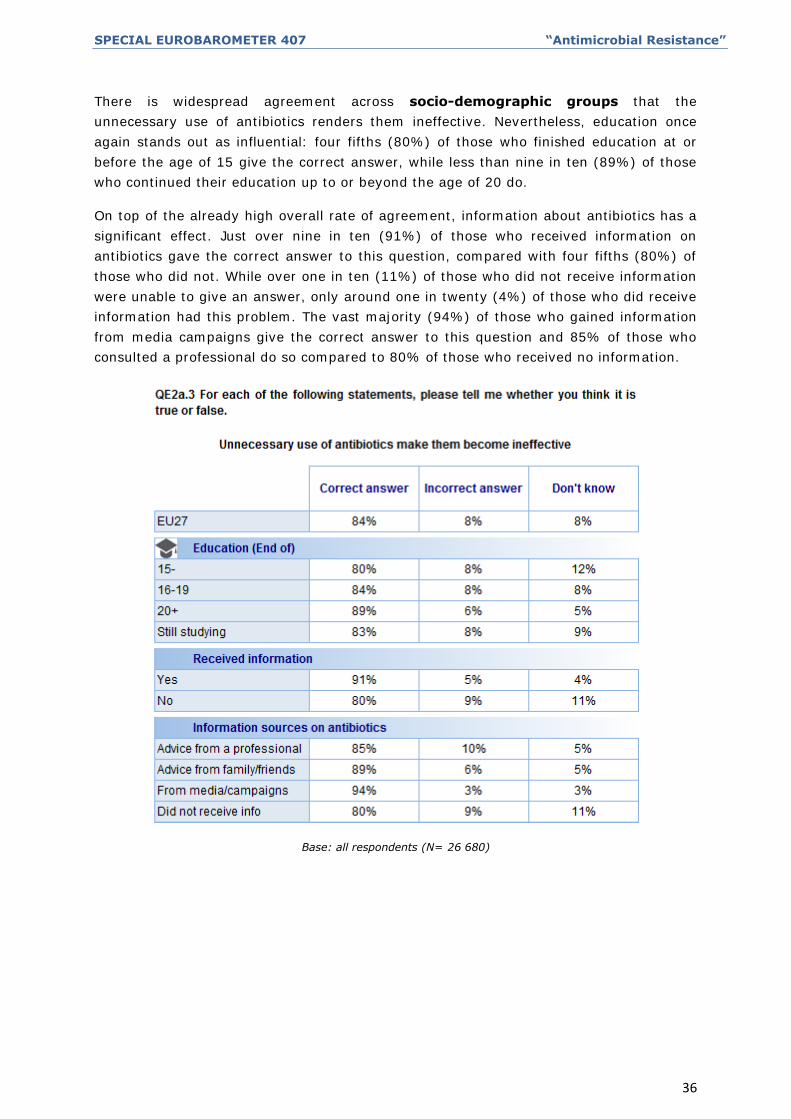
There is widespread agreement across socio-demographic groups that the
unnecessary use of antibiotics renders them ineffective. Nevertheless, education once
again stands out as influential: four fifths (80%) of those who finished education at or
before the age of 15 give the correct answer, while less than nine in ten (89%) of those
who continued their education up to or beyond the age of 20 do.
On top of the already high overall rate of agreement, information about antibiotics has a
significant effect. Just over nine in ten (91%) of those who received information on
antibiotics gave the correct answer to this question, compared with four fifths (80%) of
those who did not. While over one in ten (11%) of those who did not receive information
were unable to give an answer, only around one in twenty (4%) of those who did receive
information had this problem. The vast majority (94%) of those who gained information
from media campaigns give the correct answer to this question and 85% of those who
consulted a professional do so compared to 80% of those who received no information.
Base: all respondents (N= 26 680)
SPECIAL EUROBAROMETER 407 “Antimicrobial Resistance”
37
4. DOES TAKING ANTIBIOTICS OFTEN RESULT IN SIDE-EFFECTS SUCH AS
DIARRHEA?
-Two thirds of Europeans know that frequent use of antibiotics can lead to side-
effects-
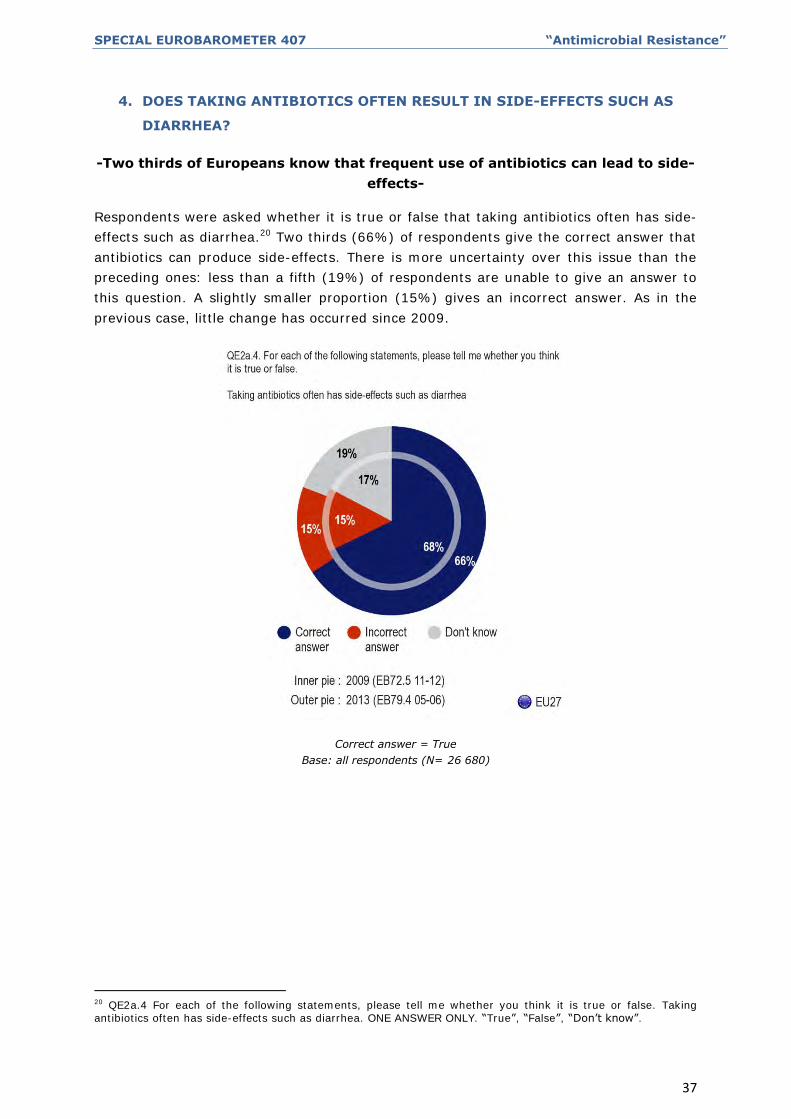
Respondents were asked whether it is true or false that taking antibiotics often has side-
effects such as diarrhea.20 Two thirds (66%) of respondents give the correct answer that
antibiotics can produce side-effects. There is more uncertainty over this issue than the
preceding ones: less than a fifth (19%) of respondents are unable to give an answer to
this question. A slightly smaller proportion (15%) gives an incorrect answer. As in the
previous case, little change has occurred since 2009.
Correct answer = True
Base: all respondents (N= 26 680)
20 QE2a.4 For each of the following statements, please tell me whether you think it is true or false. Taking antibiotics often has side-effects such as diarrhea. ONE ANSWER ONLY. “True”, “False”, “Don’t know”.

SPECIAL EUROBAROMETER 407 “Antimicrobial Resistance”
38
In all but one Member State, more than half of respondents are correct. Interestingly,
three of the five countries where at least three quarters (75%) of respondents answered
correctly are NMS12 Member States, which runs against the aforementioned tendency for
knowledge to be greater in northern European countries. Poland and Luxembourg (both
78%) have the highest proportion of correct answers, closely followed by Estonia (77%),
Finland and Slovakia (both 75%). As in the previous question, Romania stands out for
low levels of knowledge, with fewer than half of those polled (45%) giving the correct
answer.
It should be noted that higher levels of correct answers are not correlated with lower
levels of incorrect ones. There is substantial variation in the country-level proportions of
those who give the wrong answer and those who are unable to give any answer. The
proportion is a quarter or higher in four countries. Inability to answer the question is,
again, a problem in Romania, where nearly two fifths (38%) of respondents cannot give
an answer. At the other end of the scale, in Belgium and Finland, almost one in twenty
(6% in each) of those polled cannot give an answer.
Correct answer = True
Base: all respondents (N= 26 680)
SPECIAL EUROBAROMETER 407 “Antimicrobial Resistance”
39
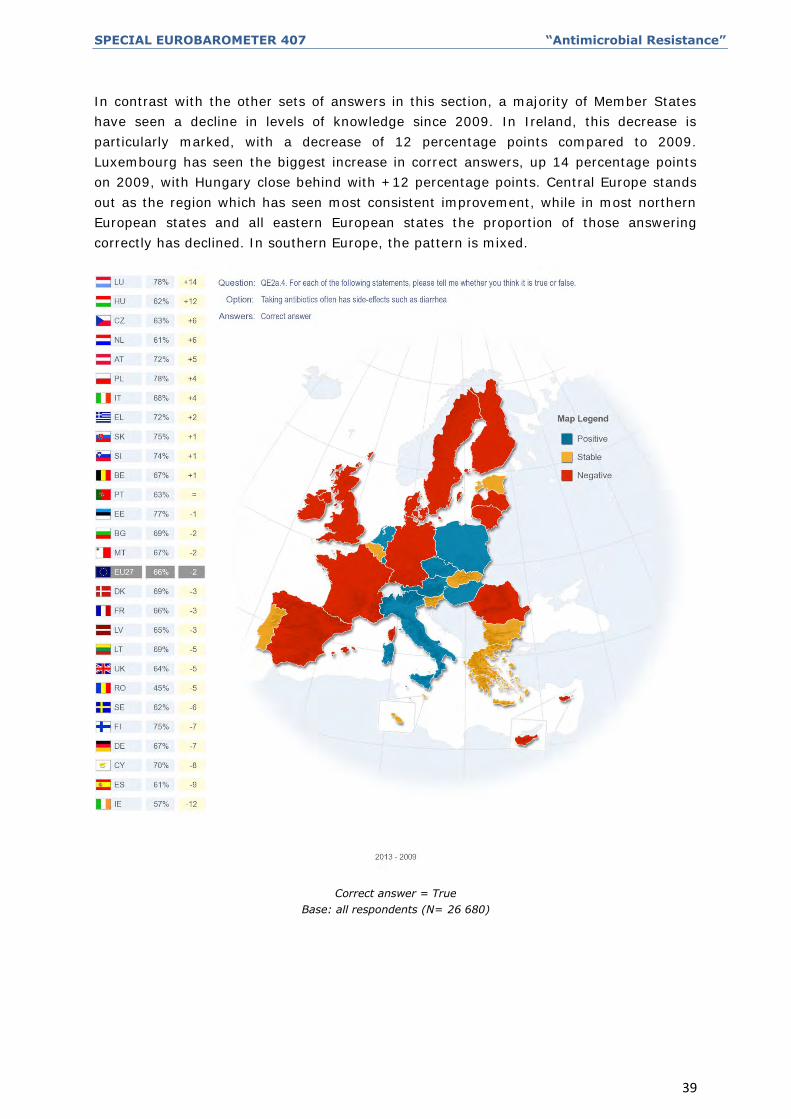
In contrast with the other sets of answers in this section, a majority of Member States
have seen a decline in levels of knowledge since 2009. In Ireland, this decrease is
particularly marked, with a decrease of 12 percentage points compared to 2009.
Luxembourg has seen the biggest increase in correct answers, up 14 percentage points
on 2009, with Hungary close behind with +12 percentage points. Central Europe stands
out as the region which has seen most consistent improvement, while in most northern
European states and all eastern European states the proportion of those answering
correctly has declined. In southern Europe, the pattern is mixed.
Correct answer = True
Base: all respondents (N= 26 680)
SPECIAL EUROBAROMETER 407 “Antimicrobial Resistance”
40
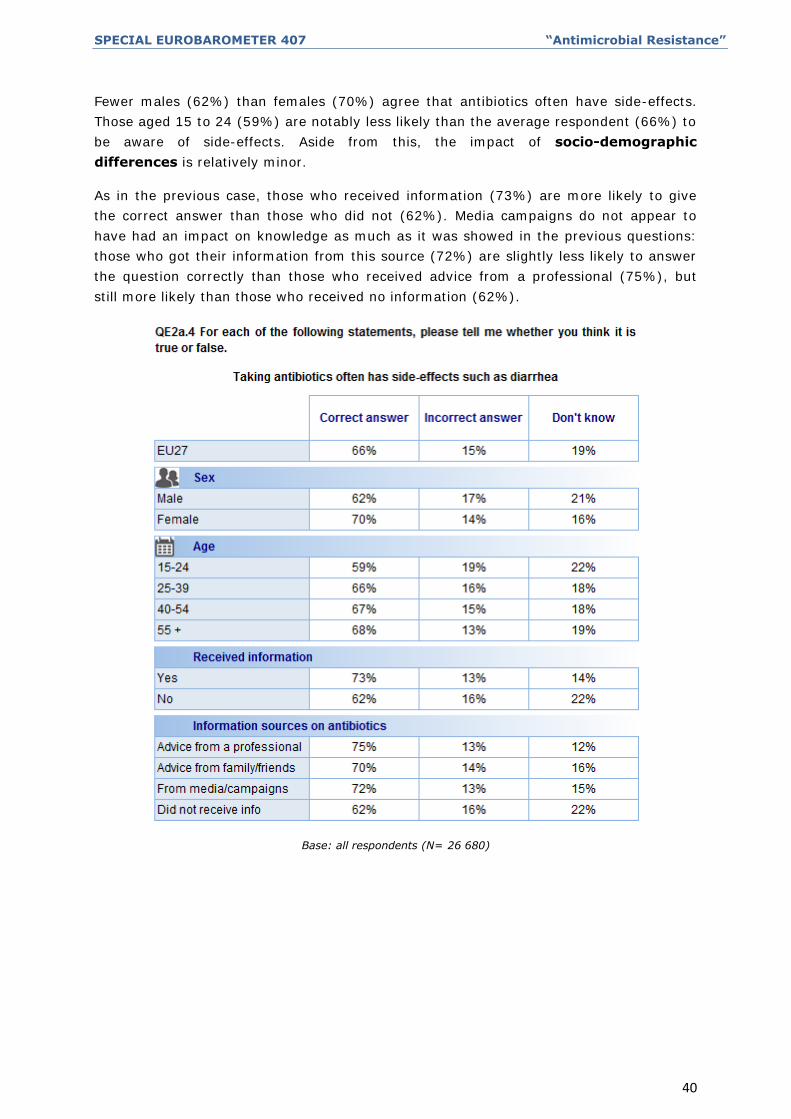
Fewer males (62%) than females (70%) agree that antibiotics often have side-effects.
Those aged 15 to 24 (59%) are notably less likely than the average respondent (66%) to
be aware of side-effects. Aside from this, the impact of socio-demographic
differences is relatively minor.
As in the previous case, those who received information (73%) are more likely to give
the correct answer than those who did not (62%). Media campaigns do not appear to
have had an impact on knowledge as much as it was showed in the previous questions:
those who got their information from this source (72%) are slightly less likely to answer
the question correctly than those who received advice from a professional (75%), but
still more likely than those who received no information (62%).
Base: all respondents (N= 26 680)

SPECIAL EUROBAROMETER 407 “Antimicrobial Resistance”
41
Summary of socio-demographic analyses
Not all of the socio-demographic patterns identified above apply to every question.
However, it is possible to identify certain tendencies.
- Women tend to be better informed than men.
- Respondents in the youngest cohort (15 to 24) tend to be less well informed than
those in other age cohorts.
- Education has a strong influence, with those who left education at the age of 15
or younger significantly less well informed than those who remained in the
education system for longer, particularly in comparison with those who stayed in
education until or beyond the age of 20.
- Unsurprisingly, given the relationship between education and earning power,
economic circumstances are also influential: those respondents who often have
trouble paying bills are notably less likely to answer these questions correctly than
those who do not have any such difficulties.
- Respondents who received information about the misuse of antibiotics are
significantly more likely to give correct answers to these questions. It should be
remembered that this correlation does not necessarily imply a causal link, and
that education is likely to play a mediating role here. However, this finding
supports the general principle that disseminating information about the prudent
use of antibiotics is crucial to tackling widespread misconceptions about their
nature and appropriate use.
- Where sources of information are concerned, media campaigns seem to be more
effective than medical professionals at disseminating information about
antibiotics. However, as the next section shows, those who get their information
from medical professionals are more likely to be influenced to change their
behaviour.

SPECIAL EUROBAROMETER 407 “Antimicrobial Resistance”
42
Base: all respondents (N= 26 680)
SPECIAL EUROBAROMETER 407 “Antimicrobial Resistance”
43
5. OVERALL LEVELS OF KNOWLEDGE ON THE USE OF ANTIBIOTICS
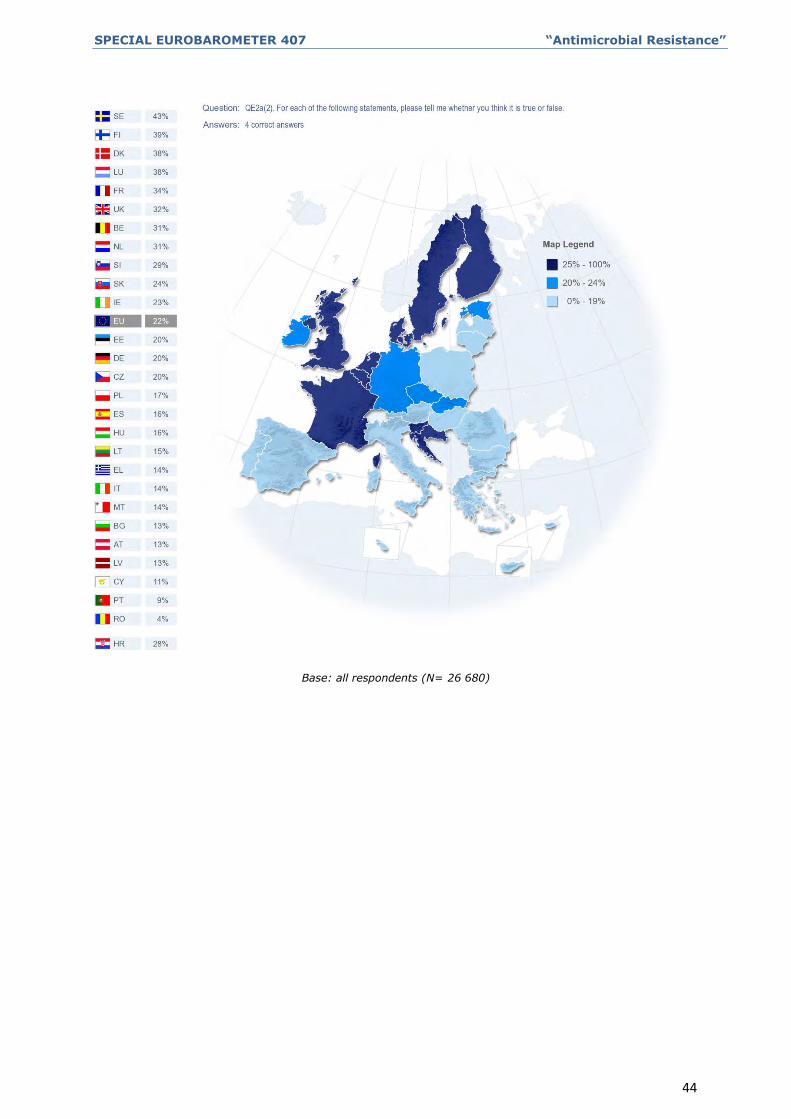
In none of the countries does a majority of those polled answer all four questions
correctly. However, there are significant differences between individual countries and, in
general, respondents in northern European countries perform better than those in other
parts of Europe, although the divide is by no means a clear-cut one. In Sweden, over two
fifths (43%) of respondents give correct answers to all the questions, followed by Finland
(39%), Denmark (38%) and Luxembourg (38%). At the other extreme, less than one in
twenty (4%) of those polled in Romania give correct answers to all the questions, and in
Portugal just under one in ten (9%).
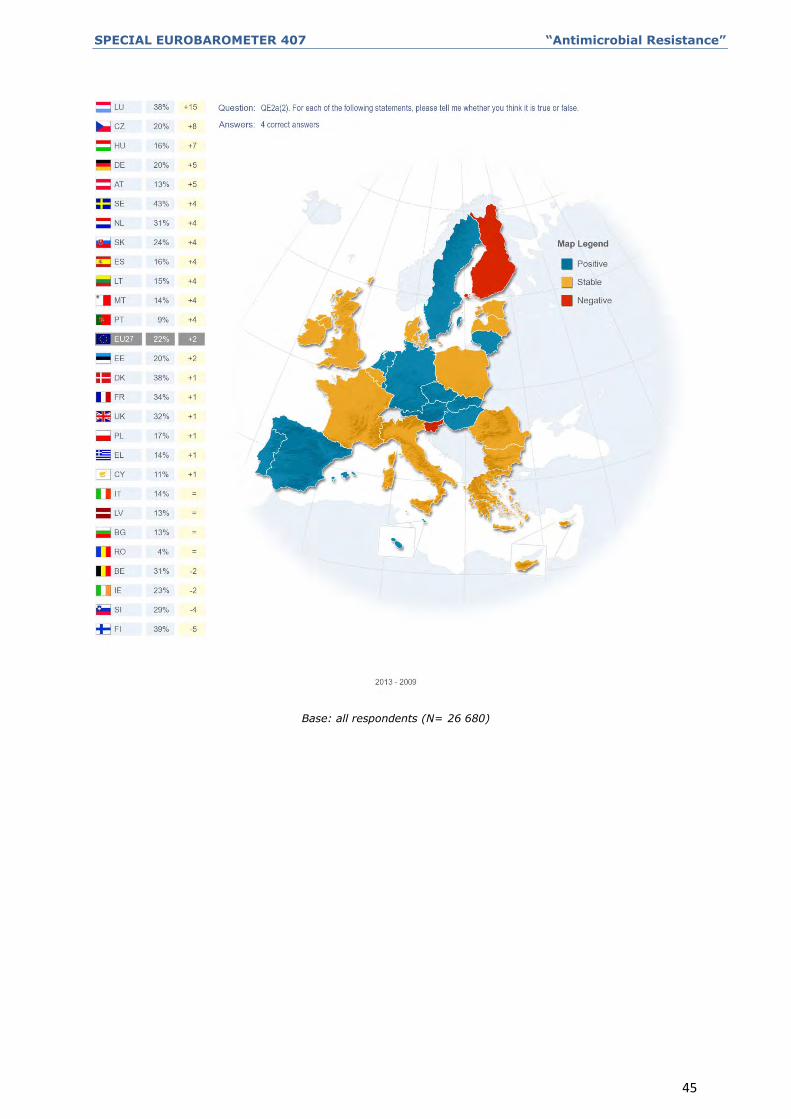
In all but four Member States, the proportion of those giving four correct answers has
changed since 2009. In Luxembourg, the proportion of those giving correct answers to all
the questions increased by 15 percentage points (pp), followed by 8pp in the Czech
Republic and 7pp in Hungary. Elsewhere, changes in the proportion increased or
decreased by no more than 5 percentage points. The biggest decrease was noted in
Finland (5pp), followed by Slovenia (4pp). There is no correlation between overall levels
of knowledge in 2009 and the degree of increase since then.
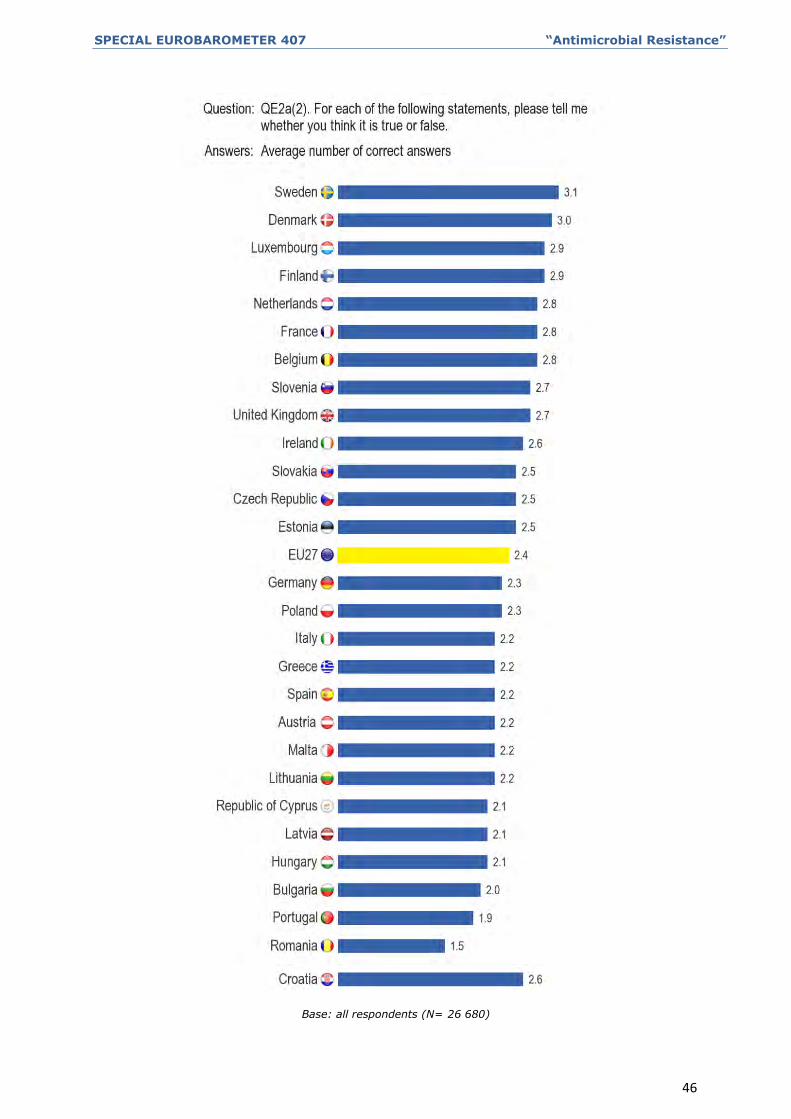
On average, only around a fifth (22%) of Europeans answer all four questions correctly.
94% give at least one correct answer, 32% give two correct answers, and 25% give
three correct answers. The European average of correct answers is 2.4 out of 4. These
figures are very similar to those obtained in 2009.
The average number of correct answers varies between Member States in a manner
consistent with the pattern identified in the case of four correct answers. Sweden has the
highest average at 3.1, followed by Denmark (3.0) and Luxembourg and Finland (2.9).
The lowest averages are observed in Romania (1.5) and Portugal (1.9).
SPECIAL EUROBAROMETER 407 “Antimicrobial Resistance”
44
Base: all respondents (N= 26 680)
SPECIAL EUROBAROMETER 407 “Antimicrobial Resistance”
45
Base: all respondents (N= 26 680)
SPECIAL EUROBAROMETER 407 “Antimicrobial Resistance”
46
Base: all respondents (N= 26 680)
SPECIAL EUROBAROMETER 407 “Antimicrobial Resistance”
47
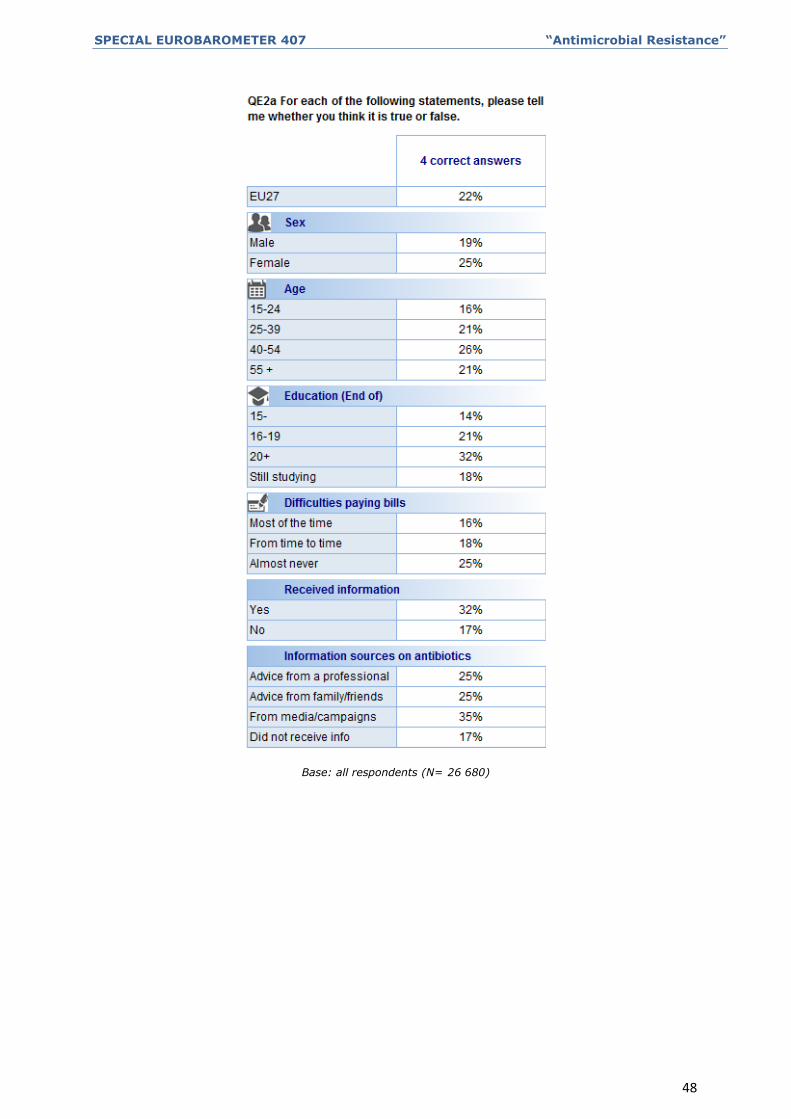
The socio-demographic profile of those who give four correct answers is distinct in a
number of ways:
- Overall knowledge of antibiotics is greater among women: a quarter (25%) give
four correct answers, compared with under one fifth (19%) of men.
- Those aged between 15 and 24 are less likely than the average respondent to
give four correct answers (16%, compared with the EU27 average of 22%).
- The higher the level of education, the more likely respondents are to give four
correct answers. Almost a third (32%) of those who finished their education at the
age of 20 or more answered all questions correctly, in comparison with a mere
14% of those who finished their education no later than the age of 15.
- There is also a relationship between economic status and levels of knowledge: a
quarter of those who almost never have problems paying bills (25%) give four
correct answers, compared with 16% of those who have trouble paying bills most
of the time.
Those who say they have received information about antibiotics are significantly more
likely to give four correct answers (32%, compared with 17% of those who did not
receive information). Over a third (35%) of those who say they received information
from media campaigns give four correct answers and a quarter (25%) of those who
received information from professionals or from family and friends. In comparison, 17%
of those who received no information gave four correct answers, a much lower proportion
than the EU27 average of 22%.
SPECIAL EUROBAROMETER 407 “Antimicrobial Resistance”
48
Base: all respondents (N= 26 680)
SPECIAL EUROBAROMETER 407 “Antimicrobial Resistance”
49
III. ANTIBIOTIC AWARENESS CAMPAIGNS
The third set of questions concerns the impact of antibiotic awareness campaigns. The
answers to these questions enable us to analyse the reach of the campaigns, the most
effective means of communication, and the extent to which these campaigns have had an
impact.
1. TAKING INFORMATION ON BOARD
-Antibiotic awareness campaigns only reach a third of Europeans-
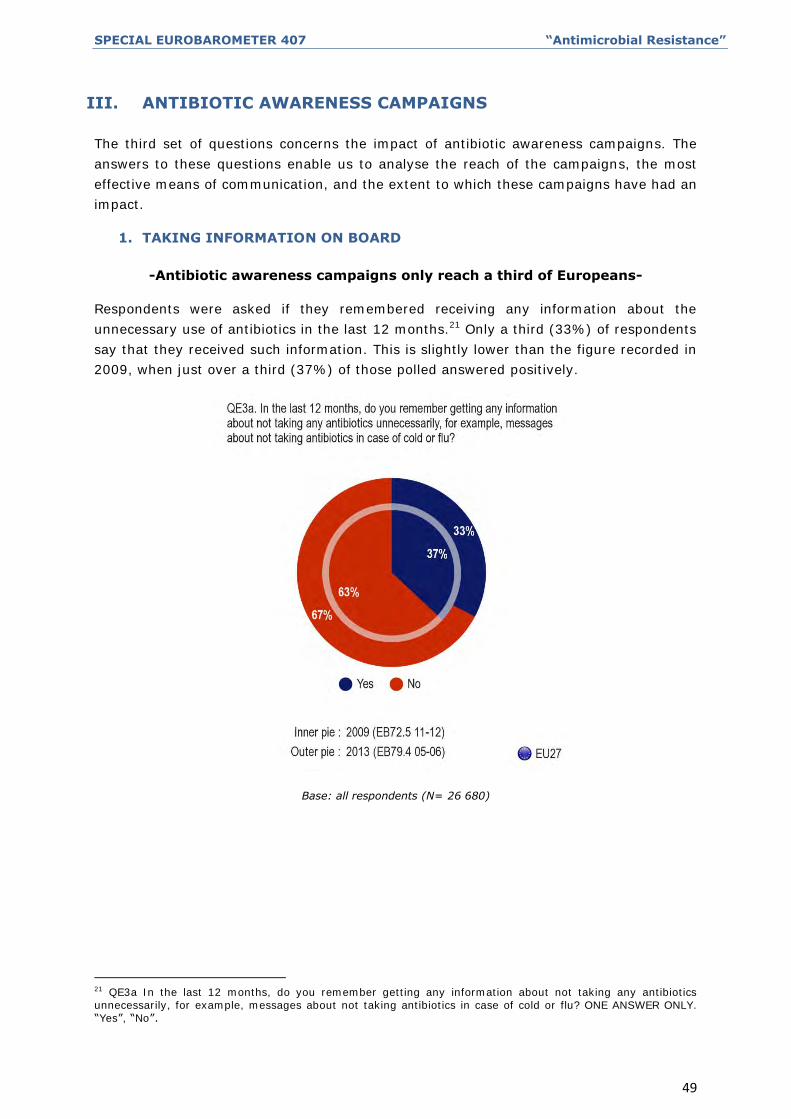
Respondents were asked if they remembered receiving any information about the
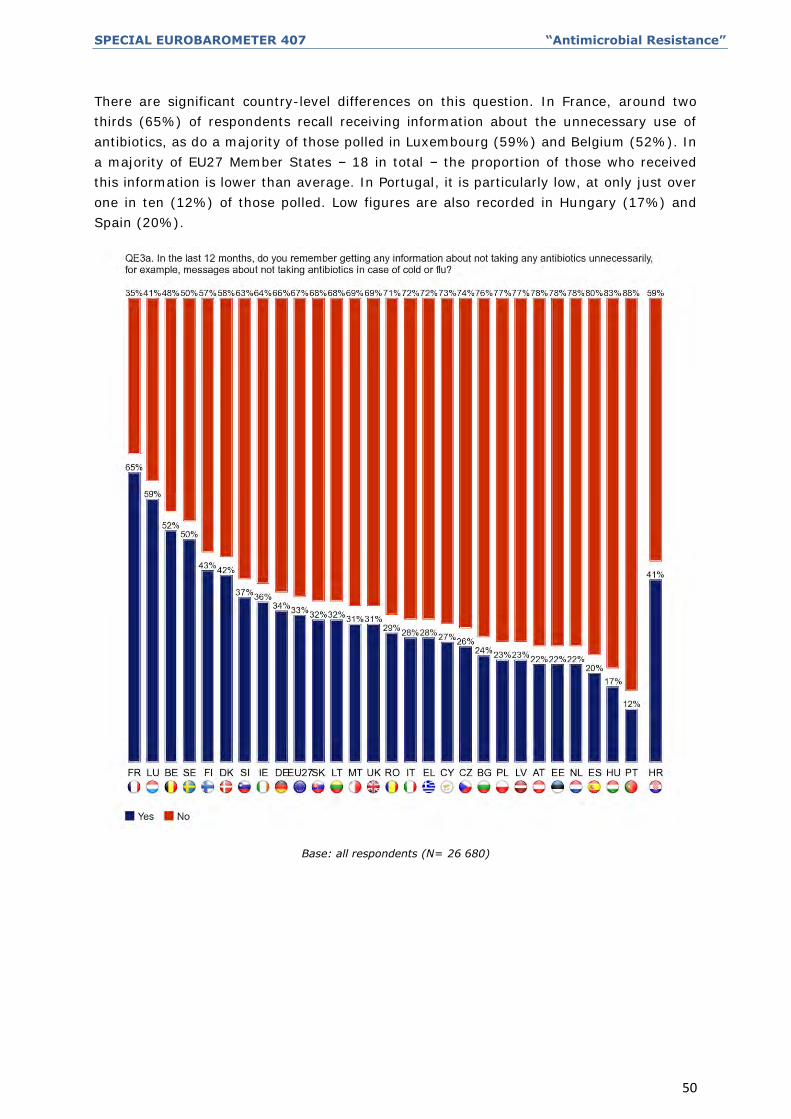
unnecessary use of antibiotics in the last 12 months.21 Only a third (33%) of respondents
say that they received such information. This is slightly lower than the figure recorded in
2009, when just over a third (37%) of those polled answered positively.
Base: all respondents (N= 26 680)
21 QE3a In the last 12 months, do you remember getting any information about not taking any antibiotics unnecessarily, for example, messages about not taking antibiotics in case of cold or flu? ONE ANSWER ONLY. “Yes”, “No”.
SPECIAL EUROBAROMETER 407 “Antimicrobial Resistance”
50
There are significant country-level differences on this question. In France, around two
thirds (65%) of respondents recall receiving information about the unnecessary use of
antibiotics, as do a majority of those polled in Luxembourg (59%) and Belgium (52%). In
a majority of EU27 Member States – 18 in total – the proportion of those who received
this information is lower than average. In Portugal, it is particularly low, at only just over
one in ten (12%) of those polled. Low figures are also recorded in Hungary (17%) and
Spain (20%).
Base: all respondents (N= 26 680)
SPECIAL EUROBAROMETER 407 “Antimicrobial Resistance”
51
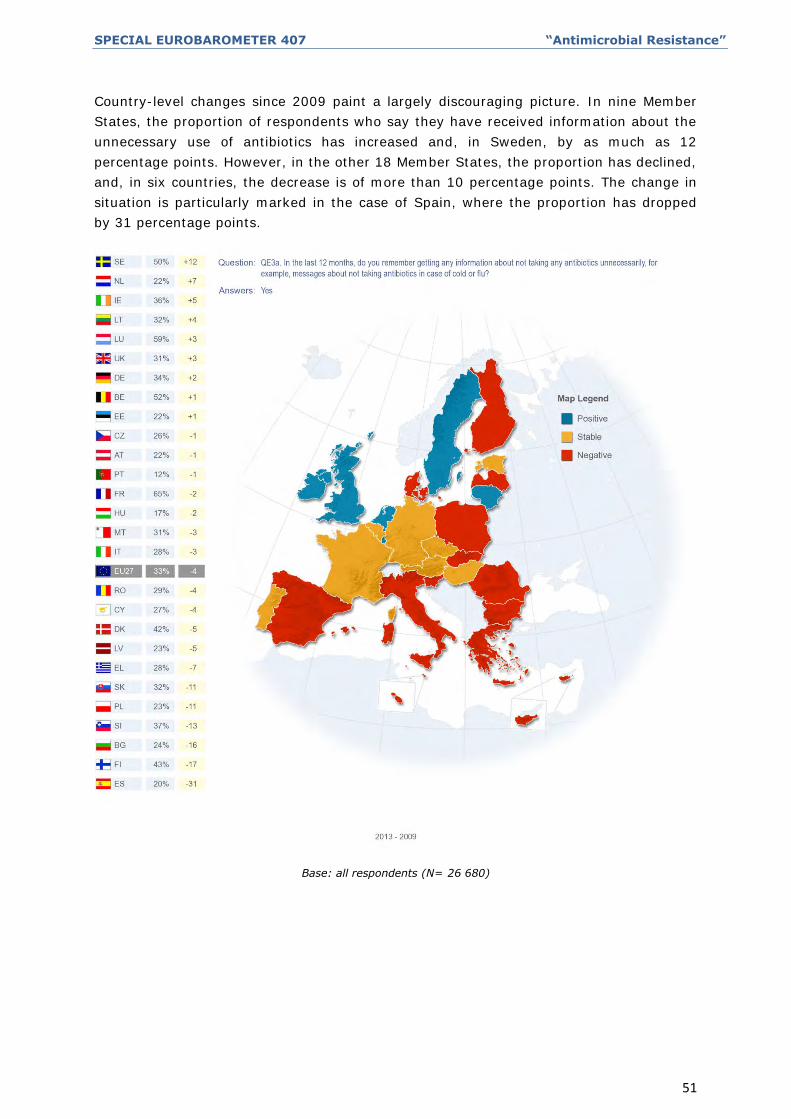
Country-level changes since 2009 paint a largely discouraging picture. In nine Member
States, the proportion of respondents who say they have received information about the
unnecessary use of antibiotics has increased and, in Sweden, by as much as 12
percentage points. However, in the other 18 Member States, the proportion has declined,
and, in six countries, the decrease is of more than 10 percentage points. The change in
situation is particularly marked in the case of Spain, where the proportion has dropped
by 31 percentage points.
Base: all respondents (N= 26 680)
SPECIAL EUROBAROMETER 407 “Antimicrobial Resistance”
52
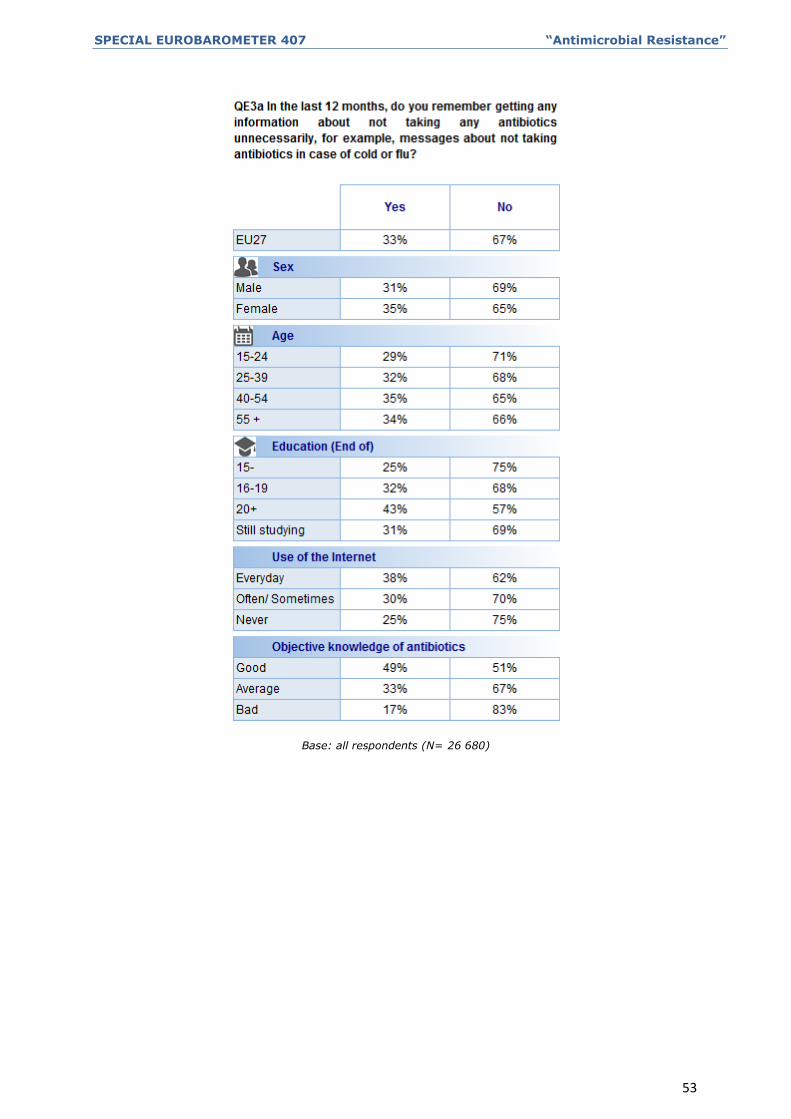
The socio-demographic breakdown of the overall figures yields the following
observations:
- Women (35%) are slightly more likely than men (31%) to have received
information about antibiotics.
- Those aged between 15 and 24 (29%) are slightly less likely than the average
respondent (33%) to have received this information.
- Education is again highly influential. Only a quarter (25%) of those who finished
their education at or before the age of 15 say they received this information,
compared with over two fifths (43%) of those who continued their education up to
or beyond the age of 20.
- The internet is an important medium for the dissemination of this information.
Nearly two fifths (38%) of those who use the internet daily say they have
received information about the unnecessary use of antibiotics, compared with only
a quarter (25%) of those who never use the internet.
Lastly, it is clear that the receipt of information about antibiotics is correlated with good
levels of objective knowledge about them. Slightly less than half (49%) of those with
good objective knowledge of antibiotics received this information, whereas under a fifth
(17%) of those with poor levels of knowledge did. However, given the positive
relationship of some socio-demographic variables – in particular education – with both of
these variables, a causal relationship should not be assumed.
SPECIAL EUROBAROMETER 407 “Antimicrobial Resistance”
53
Base: all respondents (N= 26 680)
SPECIAL EUROBAROMETER 407 “Antimicrobial Resistance”
54
2. MEANS OF CONVEYING INFORMATION
-A majority of informed Europeans receive information about antibiotics from
media campaigns-
Those respondents who said they received information in the last 12 months about not
taking antibiotics unnecessarily were asked to identify the source of this information.22 To
better understand the overall reach of various methods of conveying information, the
following proportions are percentages of the entire sample, rather than the subset of only
those who received information.
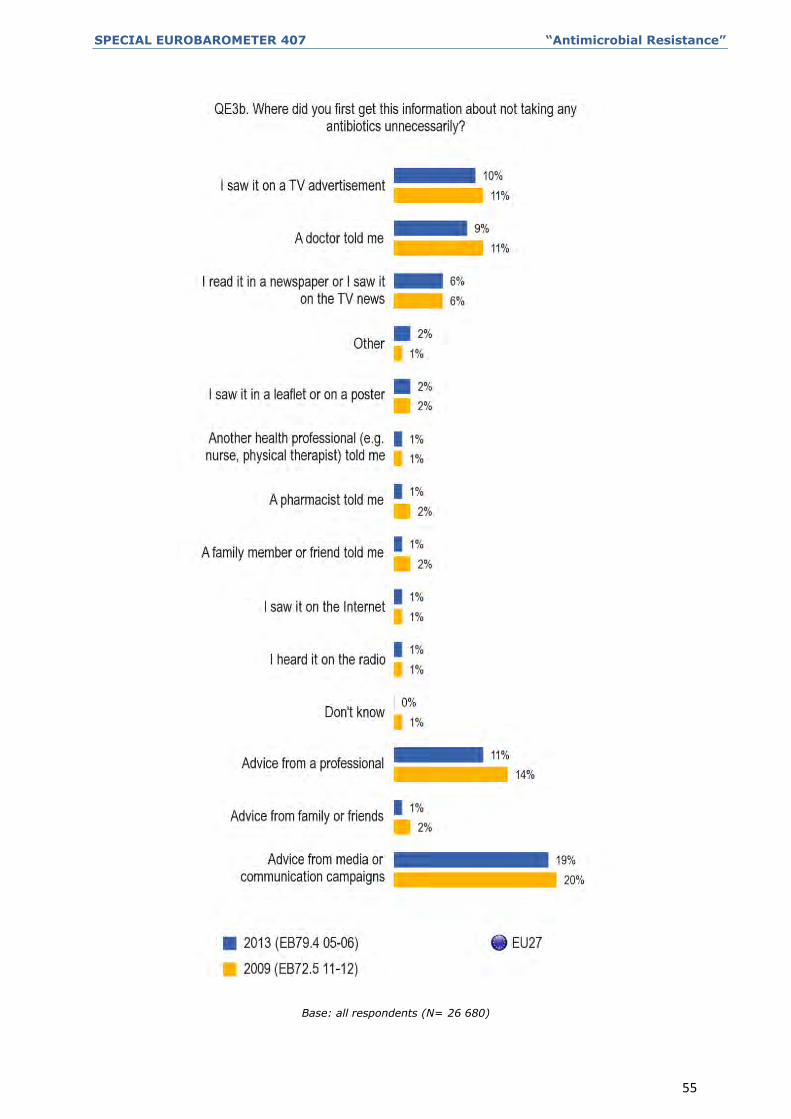
Almost a fifth (19%) of all respondents say they received information from media or
communication campaigns, a decrease of one percentage point since 2009. The most
common media source was television advertisements, cited by one in ten (10%) of
respondents. A further 6% of respondents say they found out via newspapers or the
television news.
More than one in ten (11%) of all respondents say they received information about
antibiotics from a professional: a slight decrease from the figure of 14% recorded in
2009. In the majority of cases (9%, -2 percentage points), the professional in question
was a doctor.
Only 1% of respondents say they got information from family or friends (-1).
22 QE3b Where did you first get this information about not taking any antibiotics unnecessarily? ONE ANSWER ONLY. “A doctor told me”, “A pharmacist told me”, “Another health professional (e.g. nurse, physical therapist) told me”, “A family member or friend told me”, “I saw it on a TV advertisement”, “I saw it in a leaflet or on a poster”, “I read it in a newspaper or I saw it on the TV news”, “I heard it on the radio”, “I saw it on the Internet”, “Other”, “Don’t know”.
The results for the answers “A doctor told me”, “A pharmacist told me” and “Another health professional (e.g. nurse, physical therapist) told me” are regrouped into the answer “Advice from a professional”.
The results for the answer “A family member or friend told me” are regrouped into the answer “Advice from family or friends”.
The results for the answers “I saw it on a TV advertisement”, “I saw it in a leaflet or on a poster”, “I read it in a newspaper or I saw it on the TV news”, “I heard it on the radio” and “I saw it on the Internet” are regrouped into the answer “Advice from media or communication campaigns”.
SPECIAL EUROBAROMETER 407 “Antimicrobial Resistance”
55
Base: all respondents (N= 26 680)
SPECIAL EUROBAROMETER 407 “Antimicrobial Resistance”
56
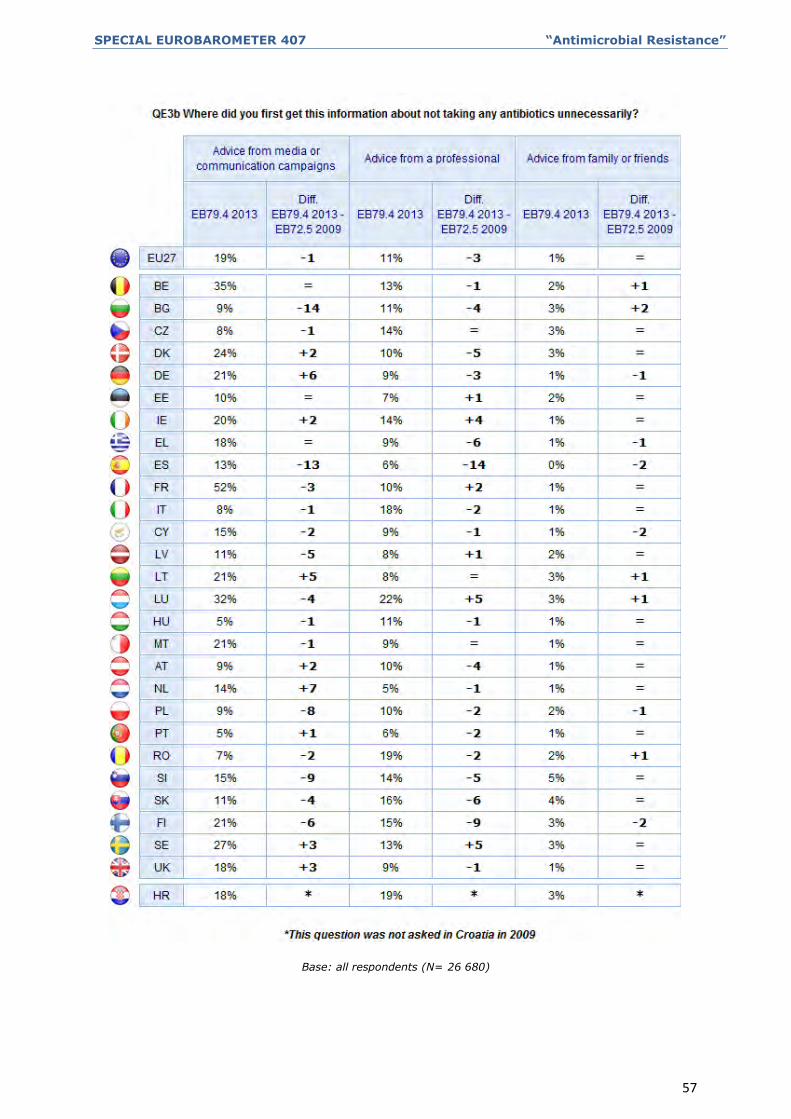
There is substantial country-level variation with respect to sources of advice. The
category ‘Advice from family or friends’ plays a minor role as, in most countries, only a
small minority of respondents get information from these sources. The largest
proportions are observed in Slovenia (5%) and Slovakia (4%). In all other countries, the
proportion is 3% or lower and, in 12 Member States, only 1% of respondents get
information from family and friends. None of the respondents in Spain got the
information from such sources.
There are substantial differences between Member States with respect to media and
communication campaigns. The most striking case is France, where half (52%) of all
respondents say they received information from media campaigns. This can partly be
accounted for by the fact that the proportion of respondents in France who received
information is significantly higher than the average, but it is impressive nevertheless.
High rates of media penetration are also found in Belgium (35%), Luxembourg (32%),
Sweden (27%) and Denmark (24%). At the other extreme, only one in twenty (5%)
respondents in Hungary and Portugal, and only 7% in Romania received information
through this channel.
The largest changes since 2009 are noted in Bulgaria, where the proportion of those
exposed to media campaigns has declined by 14 percentage points, and in Spain, where
it has declined by 13 percentage points. Significant decreases are also found in Slovenia
(-9 percentage points) and Poland (-8 percentage points). Increases are not of the same
magnitude: the biggest increase is in the Netherlands (+7 percentage points), followed
by Germany (+6 percentage points) and Lithuania (+5 percentage points).
Country variation in the case of advice from professionals is not as extreme, although
there are still some substantial differences. Around a fifth of respondents in Luxembourg
(22%), Romania (19%) and Italy (18%) get advice from professionals, with the
proportion also being high in Slovakia (16%) and Finland (15%). The lowest proportions
are found in the Netherlands (5%), Portugal (6%) and Spain (6%), where only around
one in twenty of those polled receives advice from professionals.
In Spain, the proportion of those receiving advice from professionals has declined by 14
percentage points, reflecting the significant decline in the proportion of those who receive
any kind of information in general. Significant decreases are also noted in Finland (-9
percentage points), Greece and Slovakia (-6 percentage points each). Again, increases
are smaller in magnitude: in Luxembourg and Sweden, the proportion of those gaining
advice from doctors has increased by 5 percentage points and, in Ireland, by 4
percentage points.
SPECIAL EUROBAROMETER 407 “Antimicrobial Resistance”
57
Base: all respondents (N= 26 680)
SPECIAL EUROBAROMETER 407 “Antimicrobial Resistance”
58
Where socio-demographic factors are concerned, there are not many substantial and
statistically significant differences between particular cohorts of respondents who
received information. The most noteworthy are listed below, and are based on the subset
of those who say they received information, rather than the whole sample.
- Respondents aged between 15 and 24 years (50%) or between 25 and 39 years
(53%) are less likely to have derived their information from media or
communication campaigns than those aged between 40 and 54 years (59%) or 55
years or older (60%).
- Education is also positively associated with exposure to this message in the
media: 61% of those educated up to or beyond the age of 20, compared with
54% who were not educated beyond the age of 15. Conversely, those in the least
educated cohort are more likely to have received information from a professional,
with over two fifths (41%) of this group citing this source, compared with just
over a quarter (28%) of those with the highest level of education.
- Those who have most difficulty paying bills are more likely to have received
advice from a professional (41%, compared with 29% of those who least often
have difficulty paying bills).
As mentioned above, there is a positive relationship between levels of objective
knowledge about antibiotics and the receipt of information about not taking them
unnecessarily. Breaking this down by source of information, we can identify a positive
relationship between levels of knowledge and exposure to media and communication
campaigns. Of those who received information about antibiotics, nearly two thirds (62%)
of those with good objective knowledge cite the media as their source, compared with
fewer than half (45%) of those with poor knowledge. By contrast, only around a quarter
(26%) of those with good knowledge gained advice from a professional, compared with
over two fifths (44%) of those with poor knowledge.

SPECIAL EUROBAROMETER 407 “Antimicrobial Resistance”
59
Base: respondents who received information
about not taking antibiotics unnecessarily (N= 8 803)
SPECIAL EUROBAROMETER 407 “Antimicrobial Resistance”
60
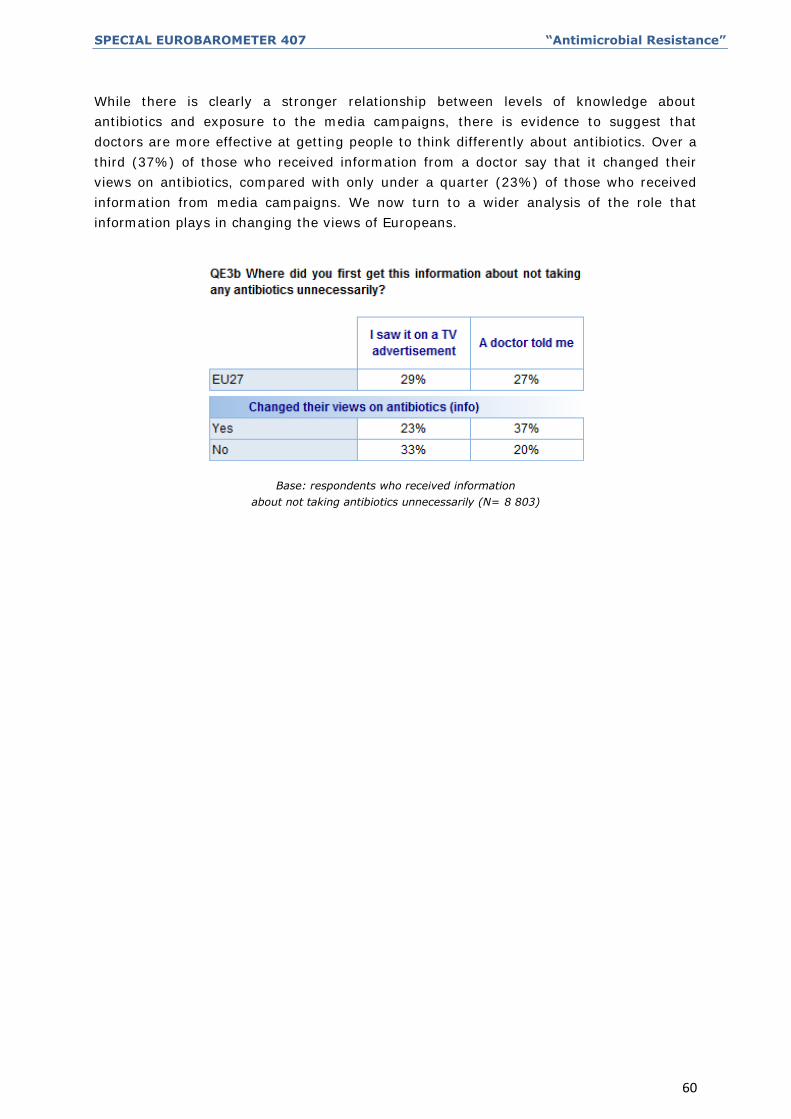
While there is clearly a stronger relationship between levels of knowledge about
antibiotics and exposure to the media campaigns, there is evidence to suggest that
doctors are more effective at getting people to think differently about antibiotics. Over a
third (37%) of those who received information from a doctor say that it changed their
views on antibiotics, compared with only under a quarter (23%) of those who received
information from media campaigns. We now turn to a wider analysis of the role that
information plays in changing the views of Europeans.
Base: respondents who received information
about not taking antibiotics unnecessarily (N= 8 803)

SPECIAL EUROBAROMETER 407 “Antimicrobial Resistance”
61
3. IMPACT OF THE ANTIBIOTIC AWARENESS CAMPAIGNS ON PERCEPTION
AND BEHAVIOUR
-More than a third of Europeans change their views after receiving information-
Those respondents who said they received information about antibiotics were asked
whether they had changed their mind about antibiotics as a result of that information.23
Only just over a third (36%) of those polled say that their views were changed by the
information they received. This proportion remains unchanged since 2009.
When assessing the impact of the campaigns on the views of Europeans, we should not
necessarily expect a majority of these respondents to have their views changed. Most of
the respondents who declare they have received information about antibiotics already
have some objective knowledge of these medicines (49%). Just over a fifth (22%) give
correct answers to all four questions in section 2, and over half (57%) answer two or
three questions correctly. Only one in ten (9%) of those who have received information
about antibiotics give at most one correct answer.
Base: respondents who received information about
not taking antibiotics unnecessarily (N= 8 803)
23 QE3c Did the information that you received change your views on antibiotics? ONE ANSWER ONLY. “Yes”, “No”, “Don’t know”.
SPECIAL EUROBAROMETER 407 “Antimicrobial Resistance”
62
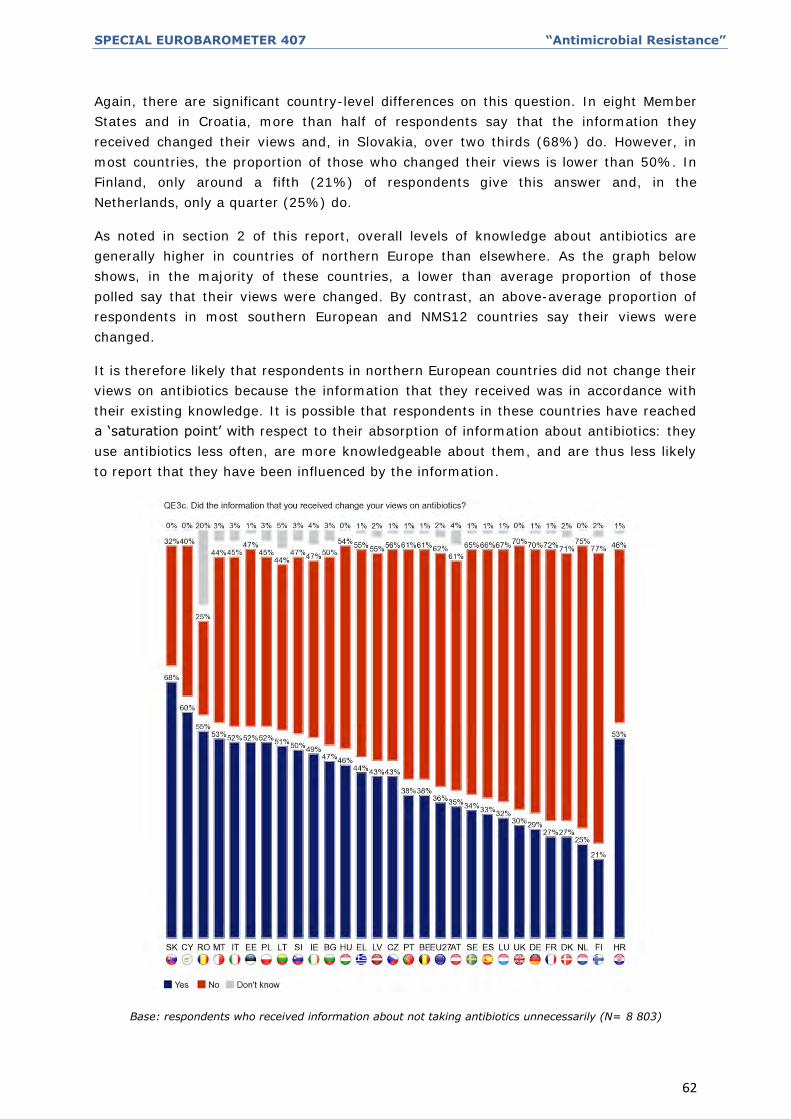
Again, there are significant country-level differences on this question. In eight Member
States and in Croatia, more than half of respondents say that the information they
received changed their views and, in Slovakia, over two thirds (68%) do. However, in
most countries, the proportion of those who changed their views is lower than 50%. In
Finland, only around a fifth (21%) of respondents give this answer and, in the
Netherlands, only a quarter (25%) do.
As noted in section 2 of this report, overall levels of knowledge about antibiotics are
generally higher in countries of northern Europe than elsewhere. As the graph below
shows, in the majority of these countries, a lower than average proportion of those
polled say that their views were changed. By contrast, an above-average proportion of
respondents in most southern European and NMS12 countries say their views were
changed.
It is therefore likely that respondents in northern European countries did not change their
views on antibiotics because the information that they received was in accordance with
their existing knowledge. It is possible that respondents in these countries have reached
a ‘saturation point’ with respect to their absorption of information about antibiotics: they
use antibiotics less often, are more knowledgeable about them, and are thus less likely
to report that they have been influenced by the information.
Base: respondents who received information about not taking antibiotics unnecessarily (N= 8 803)
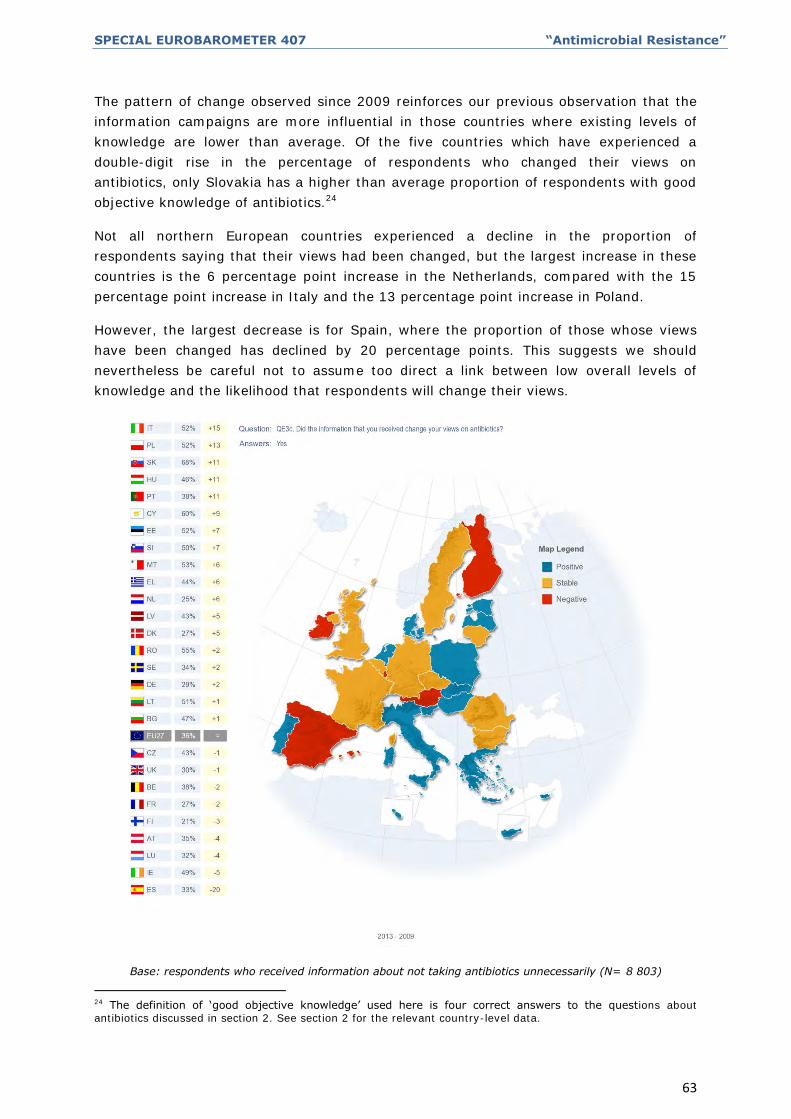
SPECIAL EUROBAROMETER 407 “Antimicrobial Resistance”
63
The pattern of change observed since 2009 reinforces our previous observation that the
information campaigns are more influential in those countries where existing levels of
knowledge are lower than average. Of the five countries which have experienced a
double-digit rise in the percentage of respondents who changed their views on
antibiotics, only Slovakia has a higher than average proportion of respondents with good
objective knowledge of antibiotics.24
Not all northern European countries experienced a decline in the proportion of
respondents saying that their views had been changed, but the largest increase in these
countries is the 6 percentage point increase in the Netherlands, compared with the 15
percentage point increase in Italy and the 13 percentage point increase in Poland.
However, the largest decrease is for Spain, where the proportion of those whose views
have been changed has declined by 20 percentage points. This suggests we should
nevertheless be careful not to assume too direct a link between low overall levels of
knowledge and the likelihood that respondents will change their views.
Base: respondents who received information about not taking antibiotics unnecessarily (N= 8 803)
24 The definition of ‘good objective knowledge’ used here is four correct answers to the questions about antibiotics discussed in section 2. See section 2 for the relevant country-level data.

SPECIAL EUROBAROMETER 407 “Antimicrobial Resistance”
64
The analysis of socio-demographic differences supports the general observation that
those with lower levels of objective knowledge are more likely to have their views
changed by the information they receive:
- Respondents in the 15-24 year and 25-39 year age cohorts (both 39%) are more
likely to change their views than those in the 40–54 year and 55 years or above
age cohorts (both 34%).
- Those who ended education at the age of 15 or earlier (39%) or those who are
still studying (43%) are more likely to change their views than those who ended
education at the age of 20 or later (32%).
- Those who have trouble paying their bills at least from time to time (43%) are
more likely to change their views than those who almost never have trouble
paying bills (33%).
Lastly, breaking down respondents by levels of objective knowledge confirms the overall
observation: those with poor knowledge of antibiotics are more likely to have their views
changed (41%, compared with 30% of those with a good level of knowledge). However,
those who have had their views changed still remain in the minority regardless of their
level of knowledge.
Base: respondents who received information
about not taking antibiotics unnecessarily (N= 8 803)

SPECIAL EUROBAROMETER 407 “Antimicrobial Resistance”
65
Having established whose views were changed by the information received, we now turn
to the question of how those views were changed. It should be noted that this involves
drawing on a small subset of the overall survey sample. As a result, it is more difficult to
draw conclusions about further subsets at the level of countries or socio-demographic
categories, as they may be based on sample sizes which are too small to generate
statistically significant results.
Those respondents who said they had changed their views on antibiotics as a result of
the information they had received were asked to indicate how their behaviour would
change as a result. The interviewer read out several options, from which respondents
could choose as many as were relevant.25
Around three quarters (74%) of respondents whose views were changed by information
on antibiotics say that as a result they will always consult a doctor about the need to
take antibiotics. A quarter (25%) of respondents say they will no longer take antibiotics
without a prescription from a doctor. This is a higher proportion compared to 2009, when
less than two in 10 respondents (19%) reported they would be influenced in this way,
showing therefore a positive impact of the information received. Just under a fifth (17%)
say they will no longer self-medicate, while slightly fewer (14%) say they will no longer
use left-over antibiotics. Very few respondents (3%) gave alternative answers.
Base: respondents whose views on antibiotics changed following
information received about not taking antibiotics unnecessarily (N= 3 163)
(MULTIPLE ANSWERS POSSIBLE)
25 QE3d In what way did this information change your views on antibiotics? MULTIPLE ANSWERS POSSIBLE. “You will always consult a doctor in situations when you think you need an antibiotic”, “You will no longer self-medicate with antibiotics”, “You will no longer take antibiotics without a prescription from a doctor”, “You will no longer keep left over antibiotics for next time you are ill”, “Other (SPONTANEOUS)”, “None (SPONTANEOUS)”, “Don’t know”.
SPECIAL EUROBAROMETER 407 “Antimicrobial Resistance”
66
Given the small sample sizes, many of the changes identified in the following table are
not statistically significant. However, some are of sufficient magnitude to be worth of
being mentioned.26
- In most cases, a large majority of respondents in almost all countries say they will
consult a doctor to determine whether they need an antibiotic. The two exceptions
are Finland (46%), where the proportion has declined by 29 percentage points
since 2009, and the Netherlands (43%), where there is no statistically significant
change. In Malta, the proportion of those who say they will consult a doctor has
declined by 21 percentage points, but still a majority of respondents say they will
(67%).
- There is greater country-level variance among those who say they will no longer
take antibiotics without a doctor’s prescription. In Denmark, over half of
respondents (53%) give this answer, while in Portugal only one in ten (10%)
does. The most significant changes are observed in Greece, where the proportion
has increased by 24 percentage points, and in Austria, where it has increased by
21 percentage points. Other significant evolutions can be noticed in France (+15
percentage points) and Germany (+11), as well as in Cyprus (-13) and Bulgaria (-
10).
- There is also a notable degree of variance on the question of whether respondents
will continue to self-medicate with antibiotics. In Romania, over a third (35%) of
respondents say that they will no longer self-medicate, closely followed by
Lithuania and Slovenia (30%). However, in Portugal, only around one in twenty
respondents (4%) makes this claim. The most significant changes since 2009 (a
difference of 10 or more percentage points) have taken place in Lithuania (+12)
and Finland (+11), as well as in Cyprus (-12), Bulgaria (-14) and Portugal (-18).
- The situation is similar when keeping left-over antibiotics is considered. A third of
respondents in Denmark (32%) and Slovenia (31%) said that they will no longer
do this, compared with only 3% of respondents in Italy. Increases of more than
10 percentage points are noticed in Greece (+15), Hungary (+12), Austria (+11)
and Ireland (+11).
26 Results for Bulgaria (N=115), Czech Republic (N=114), Denmark (N=113), Germany (N=148), Estonia (N=115), Greece (N=122), Spain (N=68), Italy (N=148), Cyprus (N=82), Latvia (N=98), Luxembourg (N=95), Hungary (N=78), Malta (N=82), the Netherlands (N=56), Austria (N=81), Poland (N=120), Portugal (N=47), Finland (N=91) and the United Kingdom (N=123) should be considered as indicative due to low sample size.

SPECIAL EUROBAROMETER 407 “Antimicrobial Resistance”
67
Base: respondents whose views on antibiotics changed following information
received about not taking antibiotics unnecessarily (N= 3 163)
(MULTIPLE ANSWERS POSSIBLE)
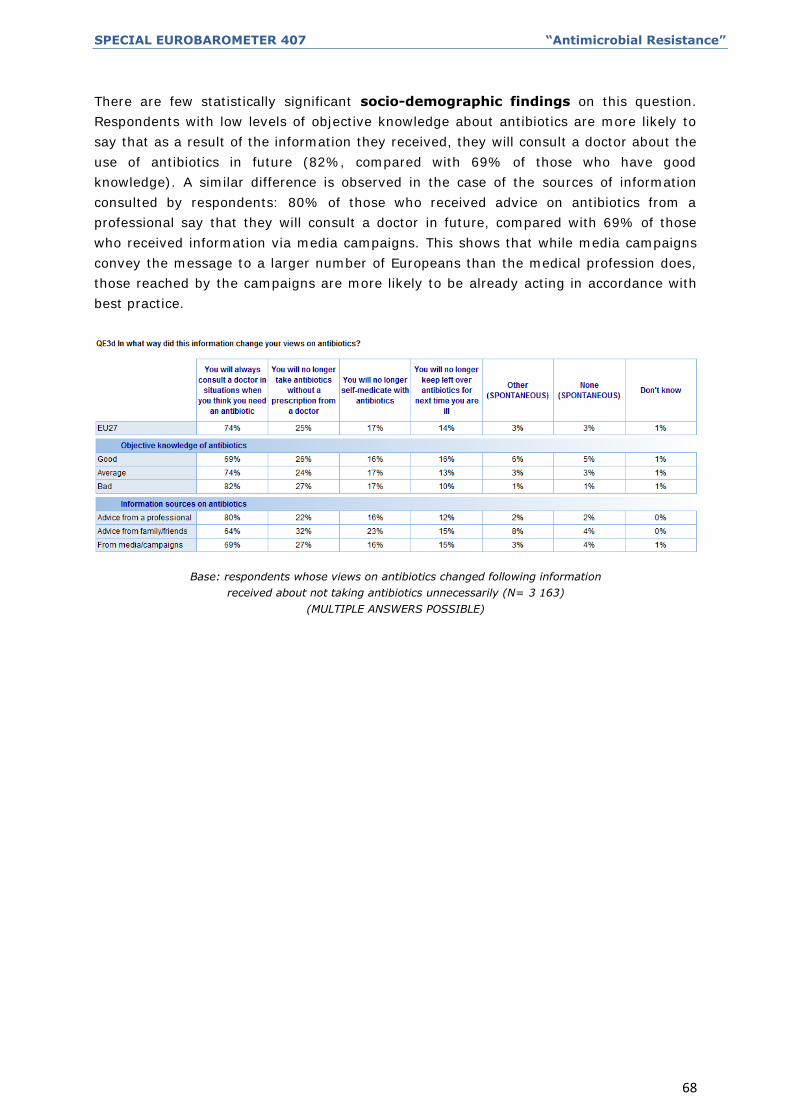
SPECIAL EUROBAROMETER 407 “Antimicrobial Resistance”
68
There are few statistically significant socio-demographic findings on this question.
Respondents with low levels of objective knowledge about antibiotics are more likely to
say that as a result of the information they received, they will consult a doctor about the
use of antibiotics in future (82%, compared with 69% of those who have good
knowledge). A similar difference is observed in the case of the sources of information
consulted by respondents: 80% of those who received advice on antibiotics from a
professional say that they will consult a doctor in future, compared with 69% of those
who received information via media campaigns. This shows that while media campaigns
convey the message to a larger number of Europeans than the medical profession does,
those reached by the campaigns are more likely to be already acting in accordance with
best practice.
Base: respondents whose views on antibiotics changed following information
received about not taking antibiotics unnecessarily (N= 3 163)
(MULTIPLE ANSWERS POSSIBLE)
SPECIAL EUROBAROMETER 407 “Antimicrobial Resistance”
69
4. THE MOST TRUSTWORTHY SOURCES OF INFORMATION
-The vast majority of respondents see doctors as a trustworthy source of
information on antibiotics-
Respondents were asked to give their opinion on which sources of information about
antibiotics are the most trustworthy. The interviewer showed the respondent a card with
a number of options, from which the respondent could select a maximum of three.27
As in 2009, almost all (94%) respondents see medical professionals or health care
facilities as the most trustworthy sources of information. Just under nine in ten (88%)
respondents identify doctors as important sources of information, while just under half
(47%) say that pharmacies are. Few respondents opt for non-health-related sources
such as family and friends or newspapers and magazines: in total, only 7% see these as
important. Lastly, 16% of those polled see health-related internet sites as good sources
of information.
27 QE4 Which of the following sources of information would you use in order to get trustworthy information on antibiotics? MAXIMUM 3 ANSWERS. “A doctor”, “A nurse”, “A pharmacy”, “A hospital”, “Another health care facility”, “Family or friends”, “The Internet site from the National Government\the Ministry of Health”, “The Internet site from the (NATIONAL PUBLIC HEALTH INSTITUTE – USE APPROPRIATE NAMING IN EACH COUNTRY)”, “The Internet site on Public Health from the European Union”, “Another health related Internet site”, “A Health Medical Encyclopedia”, “A national, independent public health body or organisation”, “A newspaper or magazine”, “A health related magazine”, “Other (SPONTANEOUS)”, “I am not looking for information on antibiotics (SPONTANEOUS)”, “Don’t know”.
The results for the answers “A doctor”, “A nurse”, “A pharmacy”, “A hospital”, “Another health care facility” and “A national, independent public health body or organisation” are regrouped into the answer “Professional or health care facility”.
The results for the answers “Family or friends” and “A newspaper or magazine” are regrouped into the answer “Non-health related sources: family or friends / newspapers or magazines”.
The results for the answers “The Internet site from the National Government\the Ministry of Health”, “The Internet site from the (NATIONAL PUBLIC HEALTH INSTITUTE – USE APPROPRIATE NAMING IN EACH COUNTRY)”, “The Internet site on Public Health from the European Union” and “Another health related Internet site” are regrouped into the answer “Health related Internet site”.
The results for the answers “A Health Medical Encyclopedia” and “A health related magazine” are regrouped into the answer “Health related offline source”.
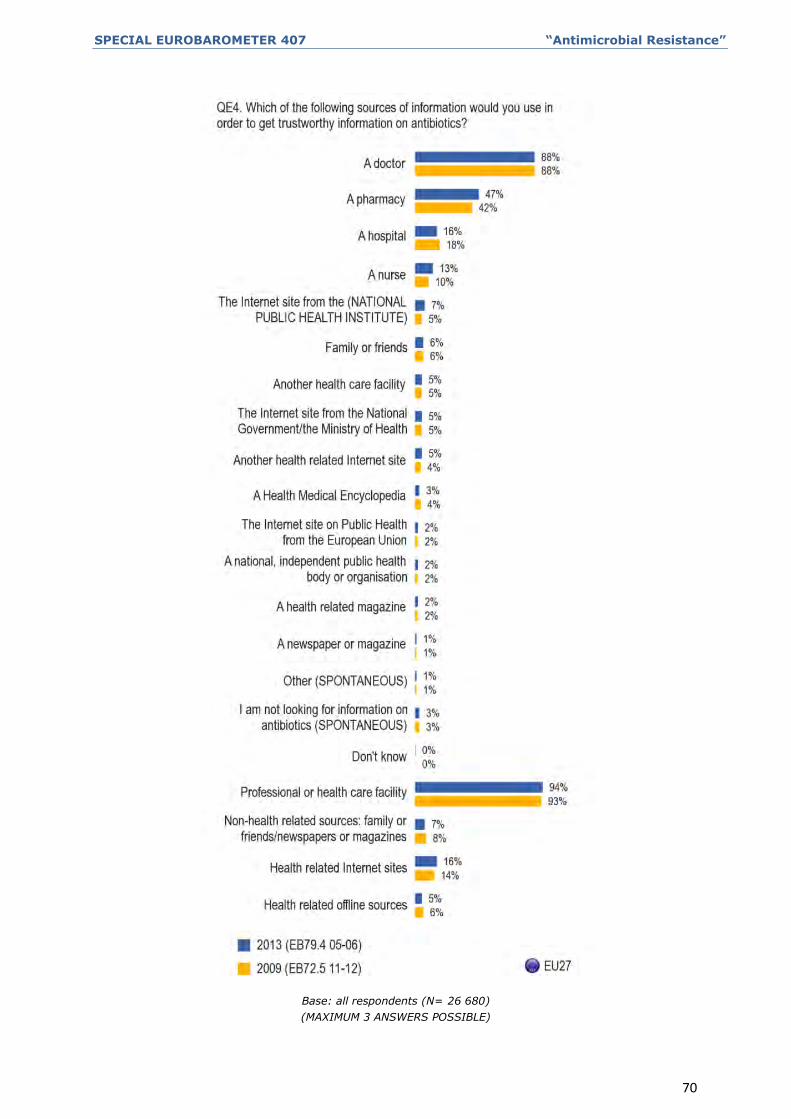
SPECIAL EUROBAROMETER 407 “Antimicrobial Resistance”
70
Base: all respondents (N= 26 680)
(MAXIMUM 3 ANSWERS POSSIBLE)

SPECIAL EUROBAROMETER 407 “Antimicrobial Resistance”
71
In all countries, a large majority of respondents see doctors as a source of trustworthy
information on antibiotics. However, in two countries, the proportion is noticeably lower
than the average: in Sweden (76%) and Finland (78%) only just over three quarters of
respondents hold this view. Changes since 2009 are of less than 10 percentage points;
the largest increase being in Poland (+7 percentage points), and the largest decrease in
the Czech Republic (-6 percentage points).
There is more variation in the case of attitudes to pharmacies as sources of reliable
information. Around two thirds of respondents in the Netherlands (66%), Austria (64%)
and Finland (63%) said that pharmacies are trustworthy sources, while only a third held
this view in Italy (30%), Spain (32%) and Poland (33%). More people than in 2009
would use pharmacies as a trustworthy source of information in all but three countries
(Sweden, Lithuania and Ireland). This is especially the case in Malta, Luxembourg,
Belgium, Greece, Finland and Slovenia (an increase of more than +10 percentage
points).
As for hospitals being a source of trustworthy information, proportions are distinctly
higher than average in three Member States. In Greece, around one third (34%) of
respondents identify hospitals as sources of trustworthy information, as do over a
quarter in Cyprus (28%) and Malta (26%). However, this tendency does not hold across
all southern European countries: in Spain (13%, down by 13 percentage points since
2009) and Italy (15%) the figure is lower than the EU27 average of 16%. The lowest
figures are found in Germany (8%) and Estonia (9%), where under one in ten
respondents gives this answer.
Lastly, there is also substantial variation between countries where nurses are concerned.
In Sweden, a third (33%) of respondents saw nurses as sources of trustworthy
information, as do over a quarter of respondents in Romania (29%, +19 percentage
points) and Finland (28%). However, this opinion is shared by a mere 2% of those polled
in Lithuania, 3% of respondents in Greece, and 5% in Germany. Significant evolutions
compared to 2009 have also taken place in Portugal (+10) and Ireland (-10).
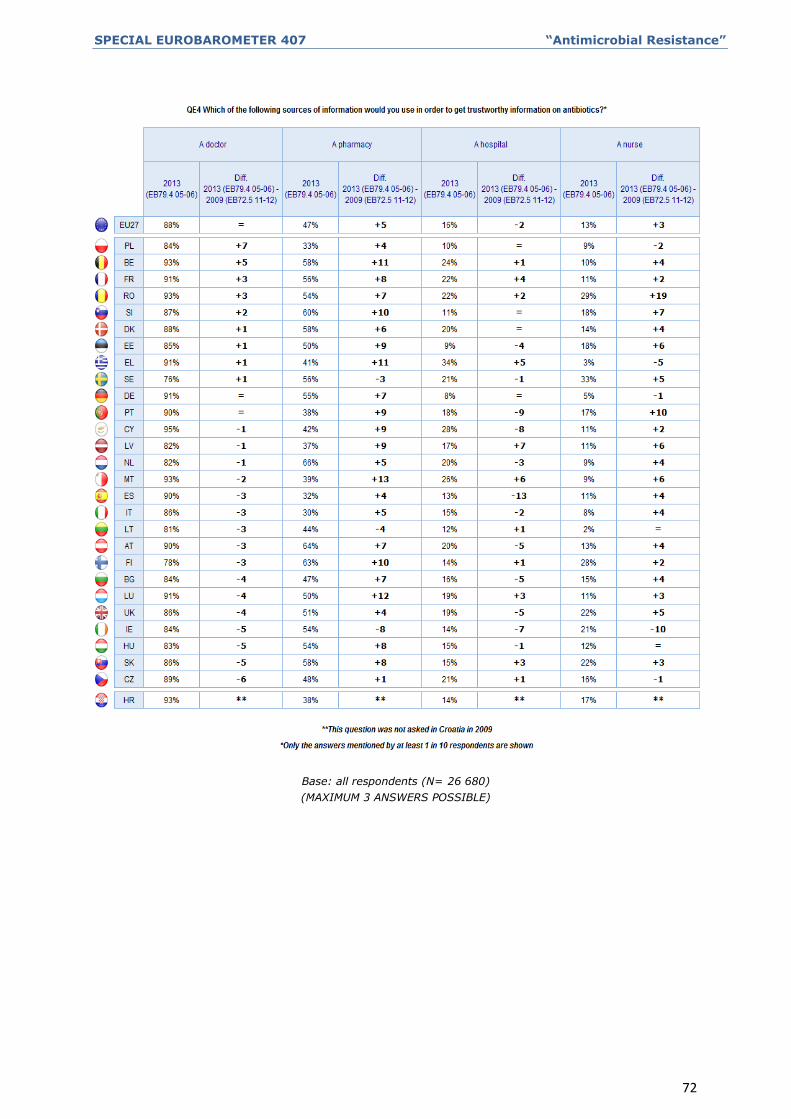
SPECIAL EUROBAROMETER 407 “Antimicrobial Resistance”
72
Base: all respondents (N= 26 680)
(MAXIMUM 3 ANSWERS POSSIBLE)
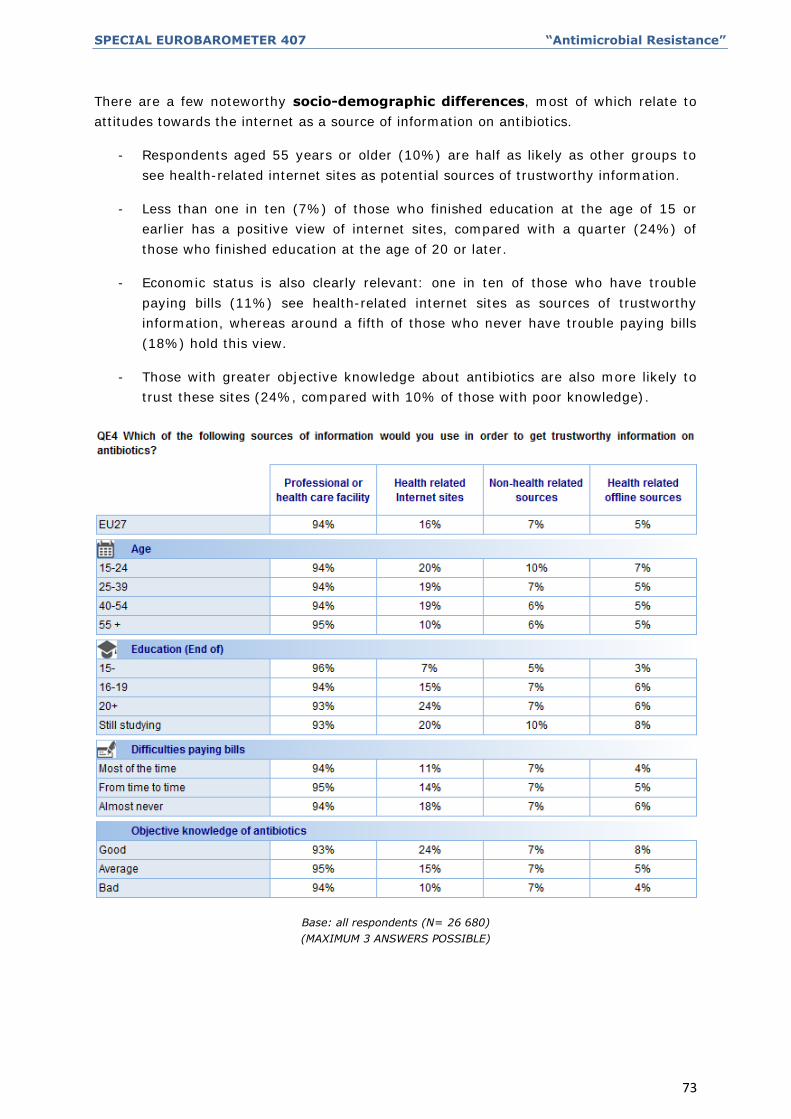
SPECIAL EUROBAROMETER 407 “Antimicrobial Resistance”
73
There are a few noteworthy socio-demographic differences, most of which relate to
attitudes towards the internet as a source of information on antibiotics.
- Respondents aged 55 years or older (10%) are half as likely as other groups to
see health-related internet sites as potential sources of trustworthy information.
- Less than one in ten (7%) of those who finished education at the age of 15 or
earlier has a positive view of internet sites, compared with a quarter (24%) of
those who finished education at the age of 20 or later.
- Economic status is also clearly relevant: one in ten of those who have trouble
paying bills (11%) see health-related internet sites as sources of trustworthy
information, whereas around a fifth of those who never have trouble paying bills
(18%) hold this view.
- Those with greater objective knowledge about antibiotics are also more likely to
trust these sites (24%, compared with 10% of those with poor knowledge).
Base: all respondents (N= 26 680)
(MAXIMUM 3 ANSWERS POSSIBLE)
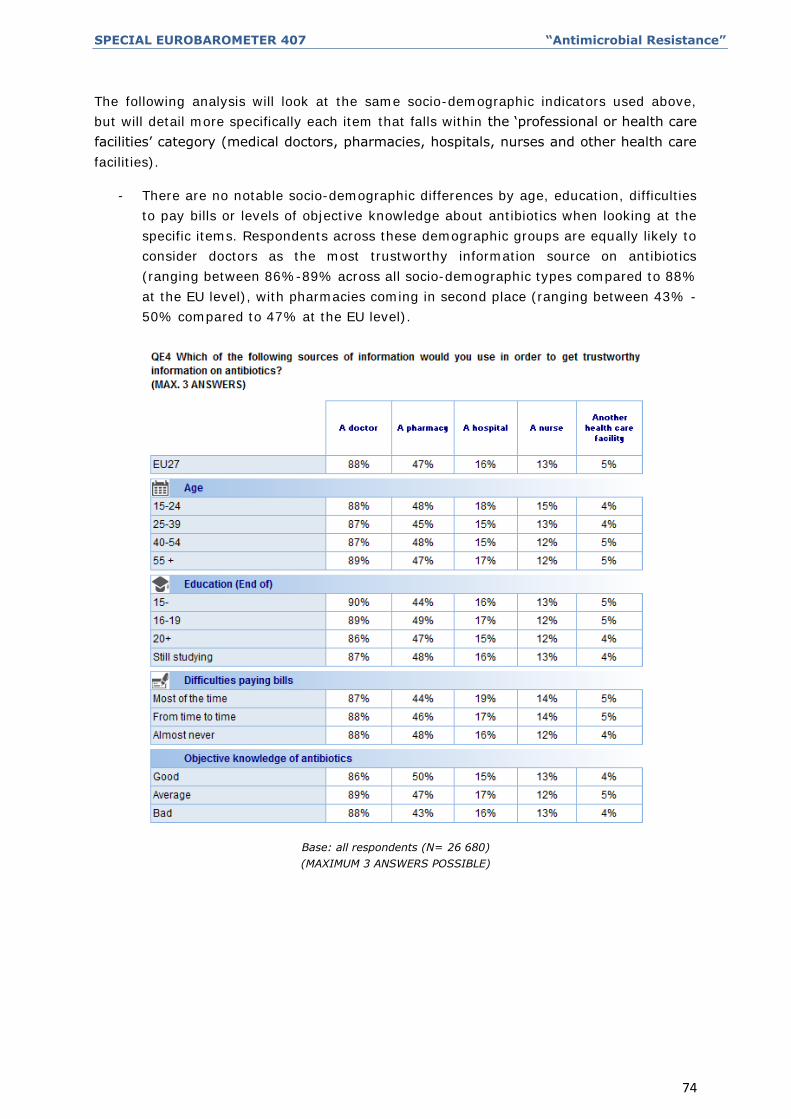
SPECIAL EUROBAROMETER 407 “Antimicrobial Resistance”
74
The following analysis will look at the same socio-demographic indicators used above,
but will detail more specifically each item that falls within the ‘professional or health care
facilities’ category (medical doctors, pharmacies, hospitals, nurses and other health care
facilities).
- There are no notable socio-demographic differences by age, education, difficulties
to pay bills or levels of objective knowledge about antibiotics when looking at the
specific items. Respondents across these demographic groups are equally likely to
consider doctors as the most trustworthy information source on antibiotics
(ranging between 86%-89% across all socio-demographic types compared to 88%
at the EU level), with pharmacies coming in second place (ranging between 43% -
50% compared to 47% at the EU level).
Base: all respondents (N= 26 680)
(MAXIMUM 3 ANSWERS POSSIBLE)
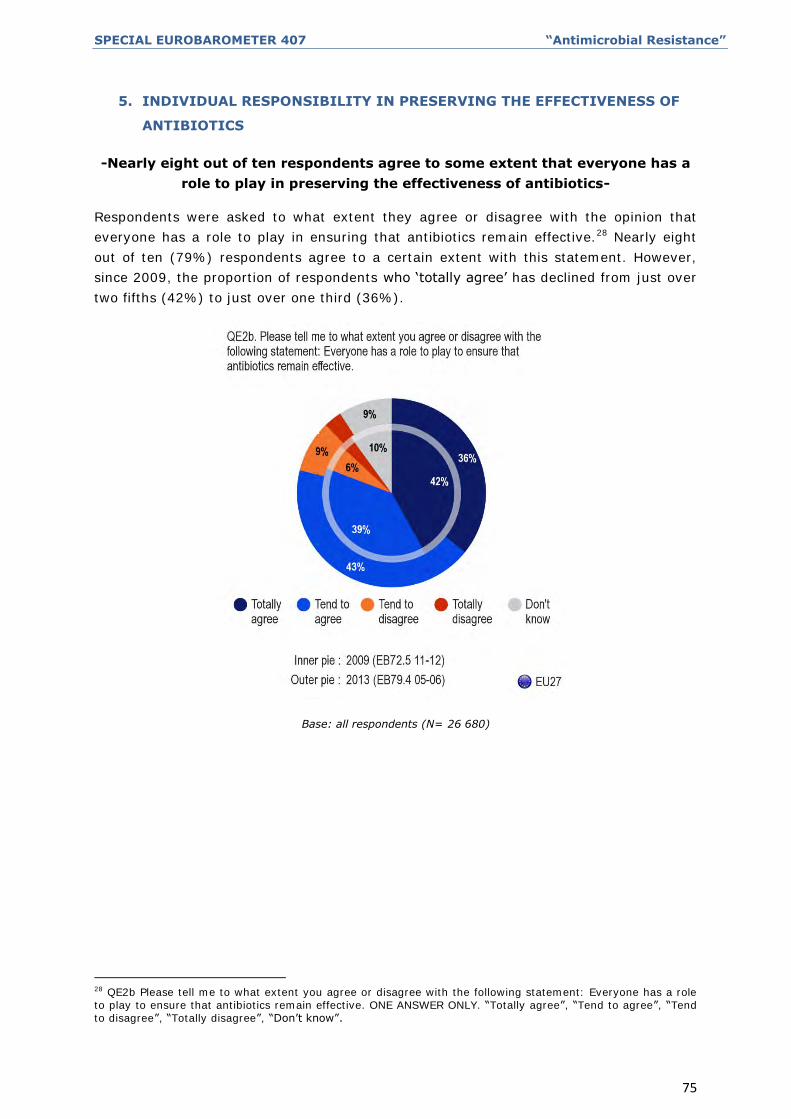
SPECIAL EUROBAROMETER 407 “Antimicrobial Resistance”
75
5. INDIVIDUAL RESPONSIBILITY IN PRESERVING THE EFFECTIVENESS OF
ANTIBIOTICS
-Nearly eight out of ten respondents agree to some extent that everyone has a
role to play in preserving the effectiveness of antibiotics-
Respondents were asked to what extent they agree or disagree with the opinion that
everyone has a role to play in ensuring that antibiotics remain effective.28 Nearly eight
out of ten (79%) respondents agree to a certain extent with this statement. However,
since 2009, the proportion of respondents who ‘totally agree’ has declined from just over
two fifths (42%) to just over one third (36%).
Base: all respondents (N= 26 680)
28 QE2b Please tell me to what extent you agree or disagree with the following statement: Everyone has a role to play to ensure that antibiotics remain effective. ONE ANSWER ONLY. “Totally agree”, “Tend to agree”, “Tend to disagree”, “Totally disagree”, “Don’t know”.
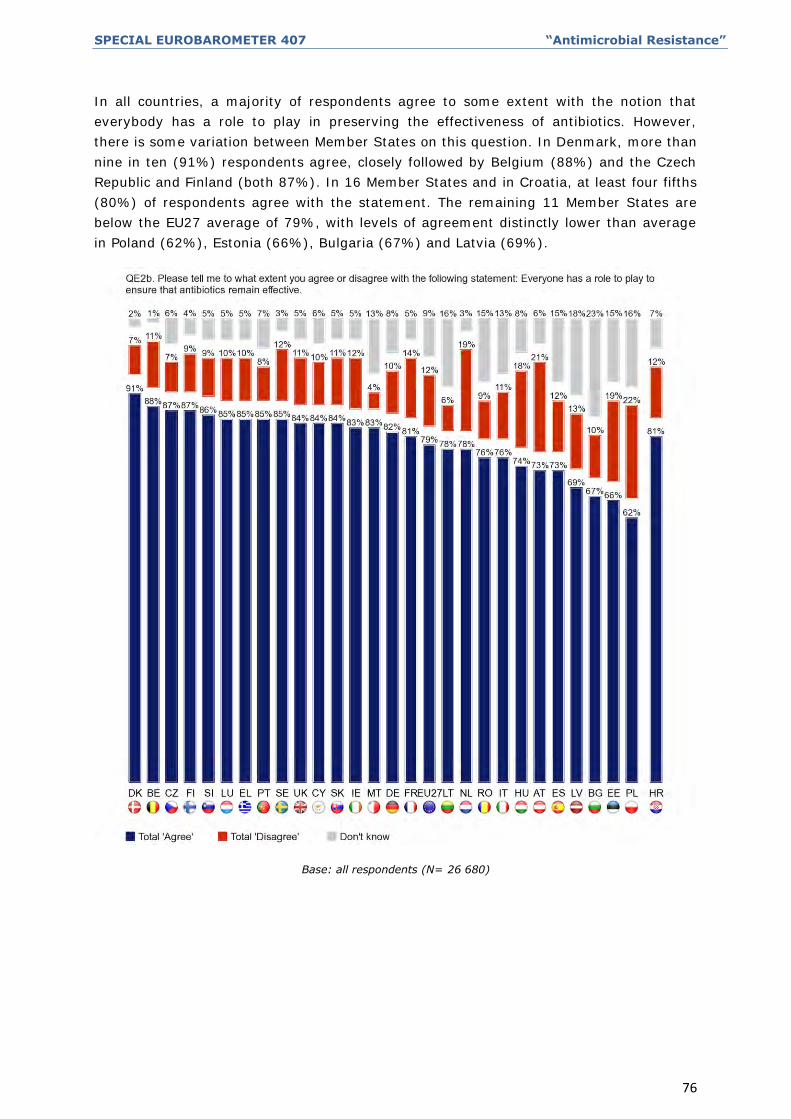
SPECIAL EUROBAROMETER 407 “Antimicrobial Resistance”
76
In all countries, a majority of respondents agree to some extent with the notion that
everybody has a role to play in preserving the effectiveness of antibiotics. However,
there is some variation between Member States on this question. In Denmark, more than
nine in ten (91%) respondents agree, closely followed by Belgium (88%) and the Czech
Republic and Finland (both 87%). In 16 Member States and in Croatia, at least four fifths
(80%) of respondents agree with the statement. The remaining 11 Member States are
below the EU27 average of 79%, with levels of agreement distinctly lower than average
in Poland (62%), Estonia (66%), Bulgaria (67%) and Latvia (69%).
Base: all respondents (N= 26 680)
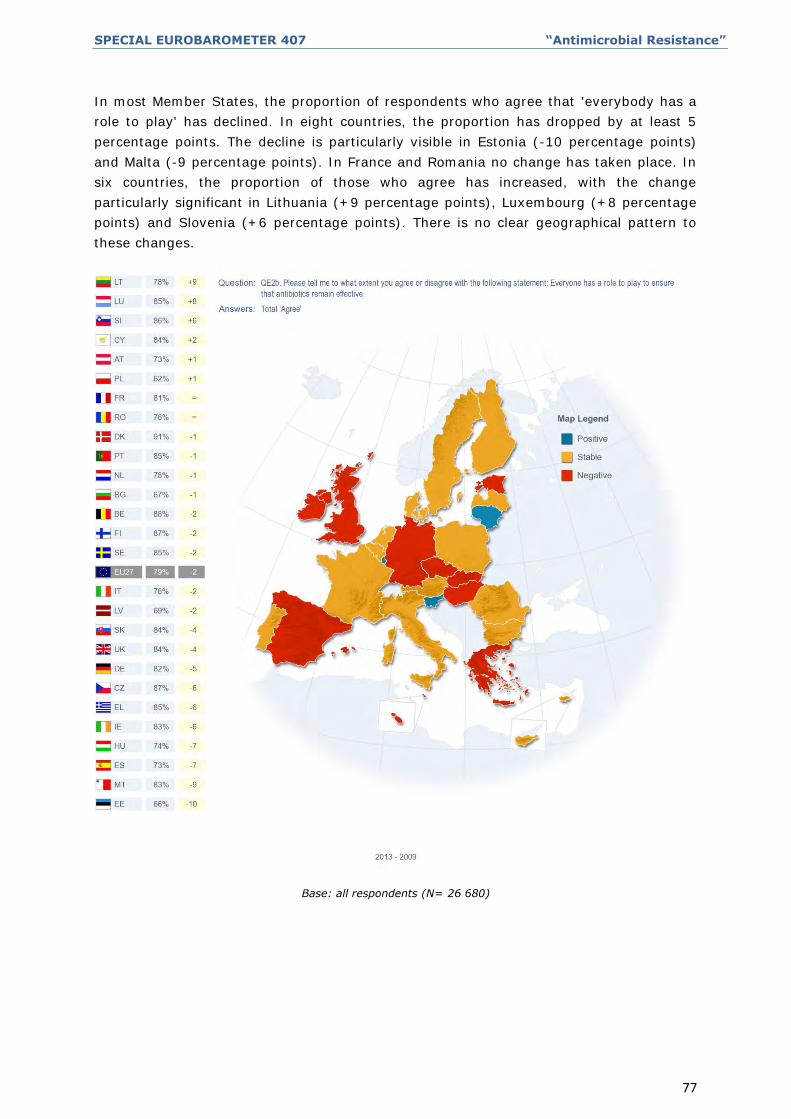
SPECIAL EUROBAROMETER 407 “Antimicrobial Resistance”
77
In most Member States, the proportion of respondents who agree that 'everybody has a
role to play' has declined. In eight countries, the proportion has dropped by at least 5
percentage points. The decline is particularly visible in Estonia (-10 percentage points)
and Malta (-9 percentage points). In France and Romania no change has taken place. In
six countries, the proportion of those who agree has increased, with the change
particularly significant in Lithuania (+9 percentage points), Luxembourg (+8 percentage
points) and Slovenia (+6 percentage points). There is no clear geographical pattern to
these changes.
Base: all respondents (N= 26 680)
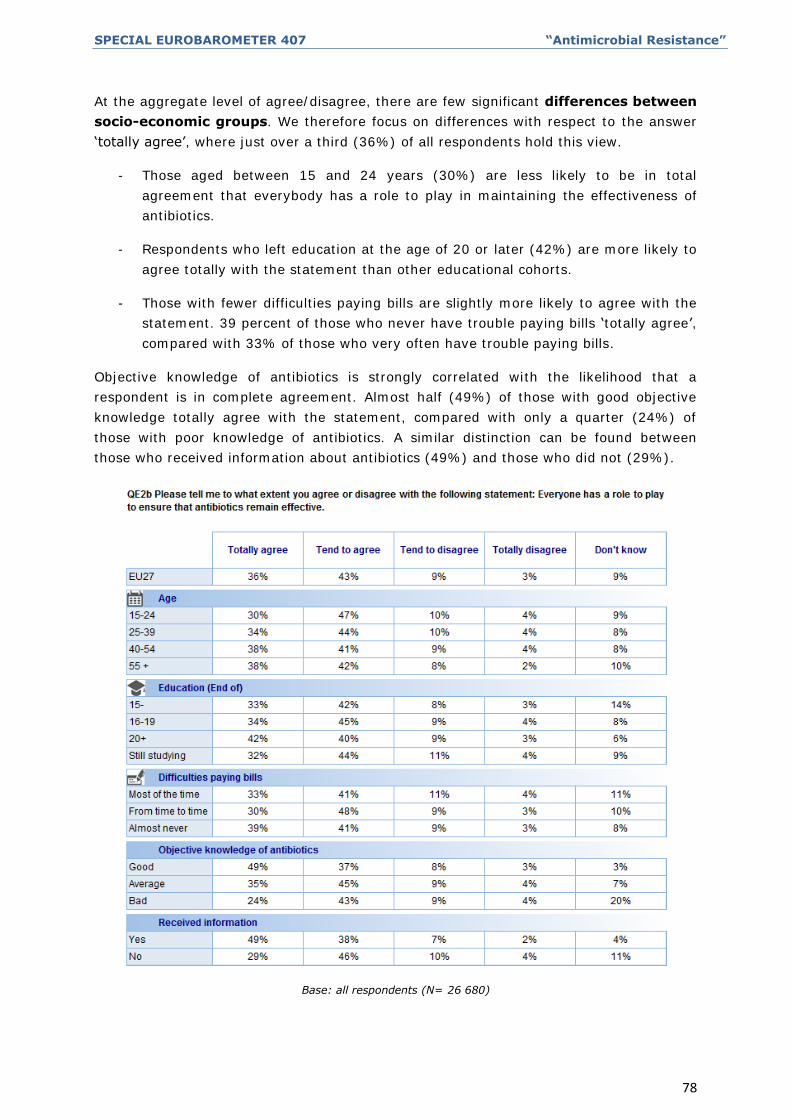
SPECIAL EUROBAROMETER 407 “Antimicrobial Resistance”
78
At the aggregate level of agree/disagree, there are few significant differences between
socio-economic groups. We therefore focus on differences with respect to the answer
‘totally agree’, where just over a third (36%) of all respondents hold this view.
- Those aged between 15 and 24 years (30%) are less likely to be in total
agreement that everybody has a role to play in maintaining the effectiveness of
antibiotics.
- Respondents who left education at the age of 20 or later (42%) are more likely to
agree totally with the statement than other educational cohorts.
- Those with fewer difficulties paying bills are slightly more likely to agree with the
statement. 39 percent of those who never have trouble paying bills ‘totally agree’,
compared with 33% of those who very often have trouble paying bills.
Objective knowledge of antibiotics is strongly correlated with the likelihood that a
respondent is in complete agreement. Almost half (49%) of those with good objective
knowledge totally agree with the statement, compared with only a quarter (24%) of
those with poor knowledge of antibiotics. A similar distinction can be found between
those who received information about antibiotics (49%) and those who did not (29%).
Base: all respondents (N= 26 680)

SPECIAL EUROBAROMETER 407 “Antimicrobial Resistance”
79
CONCLUSIONS
This study of the attitudes, knowledge and behaviour of Europeans concerning the use of
antibiotics shows persistent wide differences between countries and between different
socio-demographic groups. Nevertheless, the following broad conclusions can be drawn
about the effectiveness of antibiotic awareness campaigns in Europe in the wider context
of how Europeans obtain medical knowledge: firstly, media campaigns are efficient as
sources of information and need to be targeted more effectively. Secondly, doctors and
pharmacies are trusted sources of information and considered as being influential
authorities who have an important role to play in correcting views and behaviours
regarding the appropriate use of antibiotics.
There has been a significant decline in the use of antibiotics among Europeans, with the
proportion of respondents who have taken antibiotics during the last 12 months
decreasing from two fifths (40%) in 2009 to just over a third (35%) in 2013. Country-
group differences are less substantial than in 2009, when southern European countries
stood out with a higher rate of antibiotic use. Both Italy and Spain have seen a
substantial decline in the proportion of respondents using antibiotics in general.29
The overwhelming majority of respondents obtain antibiotics from their health care
provider, but there remains a persistent minority (3% of those taking antibiotics) who
use antibiotics without prescription, contrary to the legal requirement that all antibiotics
in the EU be dispensed on prescription only. This is particularly high in Romania (18%),
Greece (15%) and Cyprus (10%).
Overall knowledge of antibiotics remains rather low: as in 2009, only less than a fifth
(22%) of Europeans are able to give the correct answer to four questions on this topic,
although there are considerable country variations. In Luxembourg, the proportion of
those giving correct answers to all the questions increased by 15 percentage points (pp),
followed by 8pp in the Czech Republic and 7pp in Hungary. Although the vast majority
(84%) are aware that overuse of antibiotics makes them ineffective, this simply
illustrates the problem confronting those who are trying to persuade Europeans to
change their habits for the better: persistently low levels of knowledge about what
antibiotics are for are reflected in a widespread misuse of these medicines. Half (49%) of
Europeans erroneously believe that antibiotics can be used to treat viruses, while two
fifths (41%) make the same mistake regarding colds and flu. Indeed, flu remains one of
the most commonly cited reasons for taking antibiotics, with nearly a fifth (18%) of
respondents doing so. However, the proportion who responded correctly has increased
for both these two questions.
29 The question on whether or not the economic crisis has influenced behaviour as to antibiotic use is not within the remit of this report to analyse, however, it should be highlighted that it cannot be excluded.
SPECIAL EUROBAROMETER 407 “Antimicrobial Resistance”
80
It appears that the media and communications campaigns have been successful in
raising awareness, albeit rather unevenly across the Member States. Those who have
been exposed to information of any kind are generally more likely to have better
knowledge about antibiotics than those who have not been, but those who received
information from media campaigns are more likely to be better informed than those who
received advice from medical professionals.
The picture is more mixed when it comes to the impact these campaigns have had on
actual behaviour. As in 2009, only just over a third (36%) of those Europeans who have
received information say that the information they received – from whichever source –
has led them to reconsider their use of antibiotics, and there are wide variations between
Member States.
Nevertheless, there are signs that media campaigns could have more substantial effects
if targeted more effectively. At present, it seems the campaigns reach more of those
Europeans who are in any case more likely to act responsibly anyway. Those with lower
levels of objective knowledge about antibiotics and those in socio-demographic cohorts
associated with greater use of antibiotics - respondents with low levels of education,
those in difficult economic circumstances, and students – are more likely to have their
views changed by the information they receive.
On current evidence, the on-going campaigns to improve Europeans’ knowledge about
and the appropriate use of antibiotics could benefit from being targeted more clearly at
those countries and socio-demographic groups whose knowledge about and use of
antibiotics still leaves much to be desired. As the findings in section 3 suggest, use of the
more traditional sources of information dissemination such as broadcast (TV or radio)
and print media should be used.
However, the strategy to raise awareness of antibiotics among low-knowledge groups
cannot rely only on better targeting the media campaigns. It also needs to involve the
medical professionals and pharmacies which, as this report shows, have a significant role
to play. While the media is efficient at conveying information, doctors and pharmacists
are most likely to be able to influence the people who are less well-informed about
antibiotics in order to correct their way of using these medicines.

ANNEXES

TECHNICAL SPECIFICATIONS
SPECIAL EUROBAROMETER 407 “Antimicrobial Resistance”
SPECIAL EUROBAROMETER 407
Antimicrobial resistance
TECHNICAL SPECIFICATIONS
Between the 24 May and 9 June 2013, TNS opinion & social, a consortium created between TNS plc and TNS
opinion, carried out the wave 79.4 of the EUROBAROMETER survey, on request of the EUROPEAN COMMISSION,
Directorate-General for Communication, “Research and Speechwriting”.
The SPECIAL EUROBAROMETER 407 survey is part of wave 79.4 and covers the population of the respective
nationalities of the European Union Member States, resident in each of the Member States and aged 15 years and
over.
The SPECIAL EUROBAROMETER 407 survey has also been conducted in Croatia where the survey covers the
national population of citizens and the population of citizens of all the European Union Member States that are
residents in this country and have a sufficient command of the national languages to answer the questionnaire.
The basic sample design applied in all states is a multi-stage, random (probability) one. In each country, a
number of sampling points was drawn with probability proportional to population size (for a total coverage of the
country) and to population density.
In order to do so, the sampling points were drawn systematically from each of the "administrative regional units",
after stratification by individual unit and type of area. They thus represent the whole territory of the countries
surveyed according to the EUROSTAT NUTS II (or equivalent) and according to the distribution of the resident
population of the respective nationalities in terms of metropolitan, urban and rural areas. In each of the selected
sampling points, a starting address was drawn, at random. Further addresses (every Nth address) were selected
by standard "random route" procedures, from the initial address. In each household, the respondent was drawn,
at random (following the "closest birthday rule"). All interviews were conducted face-to-face in people's homes
and in the appropriate national language. As far as the data capture is concerned, CAPI (Computer Assisted
Personal Interview) was used in those countries where this technique was available.
For each country a comparison between the sample and the universe was carried out. The Universe description
was derived from Eurostat population data or from national statistics offices. For all countries surveyed, a national
weighting procedure, using marginal and intercellular weighting, was carried out based on this Universe
description. In all countries, gender, age, region and size of locality were introduced in the iteration procedure.
For international weighting (i.e. EU averages), TNS Opinion & Social applies the official population figures as
provided by EUROSTAT or national statistic offices. The total population figures for input in this post-weighting
procedure are listed below.
TS1
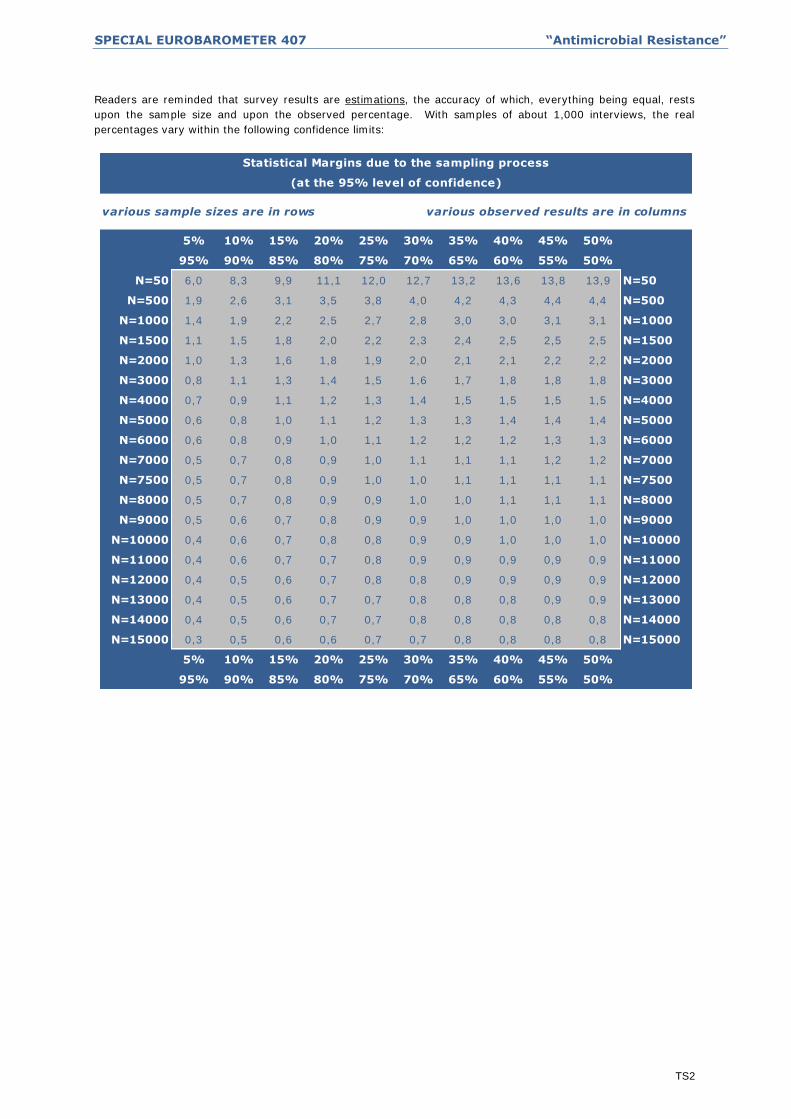
SPECIAL EUROBAROMETER 407 “Antimicrobial Resistance”
Readers are reminded that survey results are estimations, the accuracy of which, everything being equal, rests
upon the sample size and upon the observed percentage. With samples of about 1,000 interviews, the real
percentages vary within the following confidence limits:
various sample sizes are in rows various observed results are in columns
5% 10% 15% 20% 25% 30% 35% 40% 45% 50%
95% 90% 85% 80% 75% 70% 65% 60% 55% 50%
N=50 6,0 8,3 9,9 11,1 12,0 12,7 13,2 13,6 13,8 13,9 N=50
N=500 1,9 2,6 3,1 3,5 3,8 4,0 4,2 4,3 4,4 4,4 N=500
N=1000 1,4 1,9 2,2 2,5 2,7 2,8 3,0 3,0 3,1 3,1 N=1000
N=1500 1,1 1,5 1,8 2,0 2,2 2,3 2,4 2,5 2,5 2,5 N=1500
N=2000 1,0 1,3 1,6 1,8 1,9 2,0 2,1 2,1 2,2 2,2 N=2000
N=3000 0,8 1,1 1,3 1,4 1,5 1,6 1,7 1,8 1,8 1,8 N=3000
N=4000 0,7 0,9 1,1 1,2 1,3 1,4 1,5 1,5 1,5 1,5 N=4000
N=5000 0,6 0,8 1,0 1,1 1,2 1,3 1,3 1,4 1,4 1,4 N=5000
N=6000 0,6 0,8 0,9 1,0 1,1 1,2 1,2 1,2 1,3 1,3 N=6000
N=7000 0,5 0,7 0,8 0,9 1,0 1,1 1,1 1,1 1,2 1,2 N=7000
N=7500 0,5 0,7 0,8 0,9 1,0 1,0 1,1 1,1 1,1 1,1 N=7500
N=8000 0,5 0,7 0,8 0,9 0,9 1,0 1,0 1,1 1,1 1,1 N=8000
N=9000 0,5 0,6 0,7 0,8 0,9 0,9 1,0 1,0 1,0 1,0 N=9000
N=10000 0,4 0,6 0,7 0,8 0,8 0,9 0,9 1,0 1,0 1,0 N=10000
N=11000 0,4 0,6 0,7 0,7 0,8 0,9 0,9 0,9 0,9 0,9 N=11000
N=12000 0,4 0,5 0,6 0,7 0,8 0,8 0,9 0,9 0,9 0,9 N=12000
N=13000 0,4 0,5 0,6 0,7 0,7 0,8 0,8 0,8 0,9 0,9 N=13000
N=14000 0,4 0,5 0,6 0,7 0,7 0,8 0,8 0,8 0,8 0,8 N=14000
N=15000 0,3 0,5 0,6 0,6 0,7 0,7 0,8 0,8 0,8 0,8 N=15000
5% 10% 15% 20% 25% 30% 35% 40% 45% 50%
95% 90% 85% 80% 75% 70% 65% 60% 55% 50%
Statistical Margins due to the sampling process
(at the 95% level of confidence)
TS2
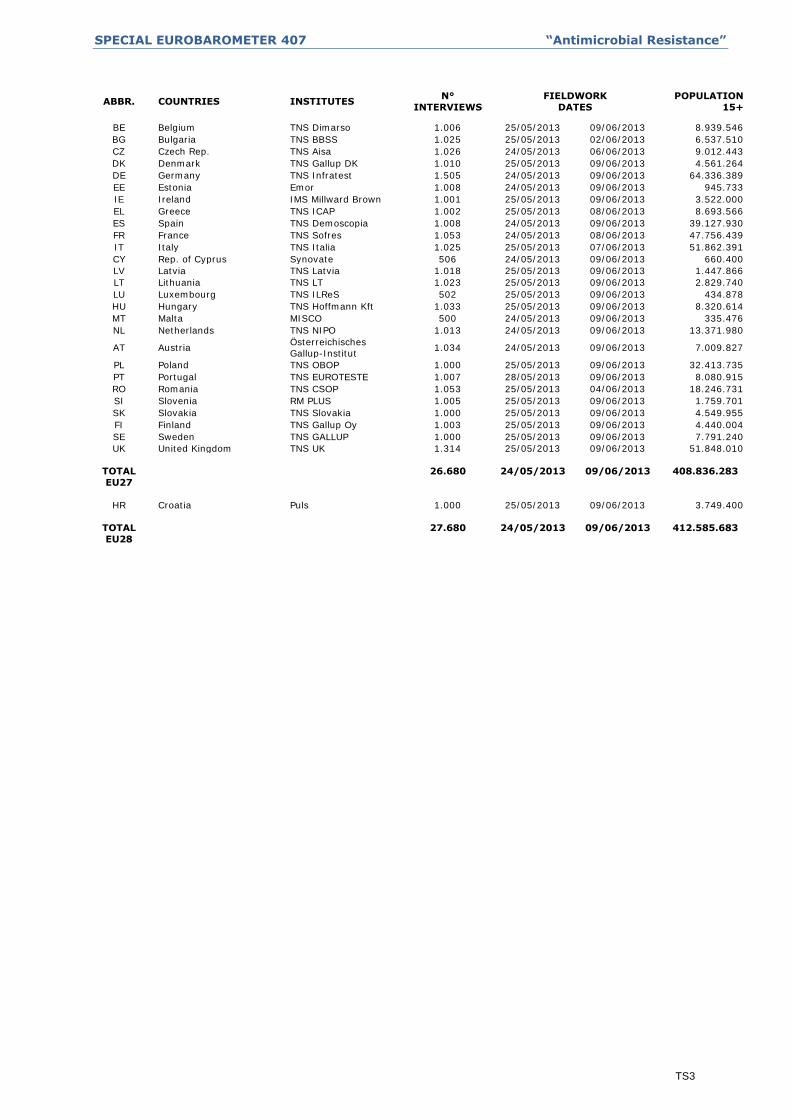
SPECIAL EUROBAROMETER 407 “Antimicrobial Resistance”
ABBR. COUNTRIES INSTITUTES N°
INTERVIEWS
FIELDWORK
DATES
POPULATION
15+
BE Belgium TNS Dimarso 1.006 25/05/2013 09/06/2013 8.939.546
BG Bulgaria TNS BBSS 1.025 25/05/2013 02/06/2013 6.537.510
CZ Czech Rep. TNS Aisa 1.026 24/05/2013 06/06/2013 9.012.443
DK Denmark TNS Gallup DK 1.010 25/05/2013 09/06/2013 4.561.264
DE Germany TNS Infratest 1.505 24/05/2013 09/06/2013 64.336.389
EE Estonia Emor 1.008 24/05/2013 09/06/2013 945.733
IE Ireland IMS Millward Brown 1.001 25/05/2013 09/06/2013 3.522.000
EL Greece TNS ICAP 1.002 25/05/2013 08/06/2013 8.693.566
ES Spain TNS Demoscopia 1.008 24/05/2013 09/06/2013 39.127.930
FR France TNS Sofres 1.053 24/05/2013 08/06/2013 47.756.439
IT Italy TNS Italia 1.025 25/05/2013 07/06/2013 51.862.391
CY Rep. of Cyprus Synovate 506 24/05/2013 09/06/2013 660.400
LV Latvia TNS Latvia 1.018 25/05/2013 09/06/2013 1.447.866
LT Lithuania TNS LT 1.023 25/05/2013 09/06/2013 2.829.740
LU Luxembourg TNS ILReS 502 25/05/2013 09/06/2013 434.878
HU Hungary TNS Hoffmann Kft 1.033 25/05/2013 09/06/2013 8.320.614
MT Malta MISCO 500 24/05/2013 09/06/2013 335.476
NL Netherlands TNS NIPO 1.013 24/05/2013 09/06/2013 13.371.980
AT Austria Österreichisches
Gallup-Institut 1.034 24/05/2013 09/06/2013 7.009.827
PL Poland TNS OBOP 1.000 25/05/2013 09/06/2013 32.413.735
PT Portugal TNS EUROTESTE 1.007 28/05/2013 09/06/2013 8.080.915
RO Romania TNS CSOP 1.053 25/05/2013 04/06/2013 18.246.731
SI Slovenia RM PLUS 1.005 25/05/2013 09/06/2013 1.759.701
SK Slovakia TNS Slovakia 1.000 25/05/2013 09/06/2013 4.549.955
FI Finland TNS Gallup Oy 1.003 25/05/2013 09/06/2013 4.440.004
SE Sweden TNS GALLUP 1.000 25/05/2013 09/06/2013 7.791.240
UK United Kingdom TNS UK 1.314 25/05/2013 09/06/2013 51.848.010
TOTAL
EU27
26.680 24/05/2013 09/06/2013 408.836.283
HR
Croatia
Puls
1.000
25/05/2013
09/06/2013
3.749.400
TOTAL
EU28
27.680 24/05/2013 09/06/2013 412.585.683
TS3

QUESTIONNAIRE
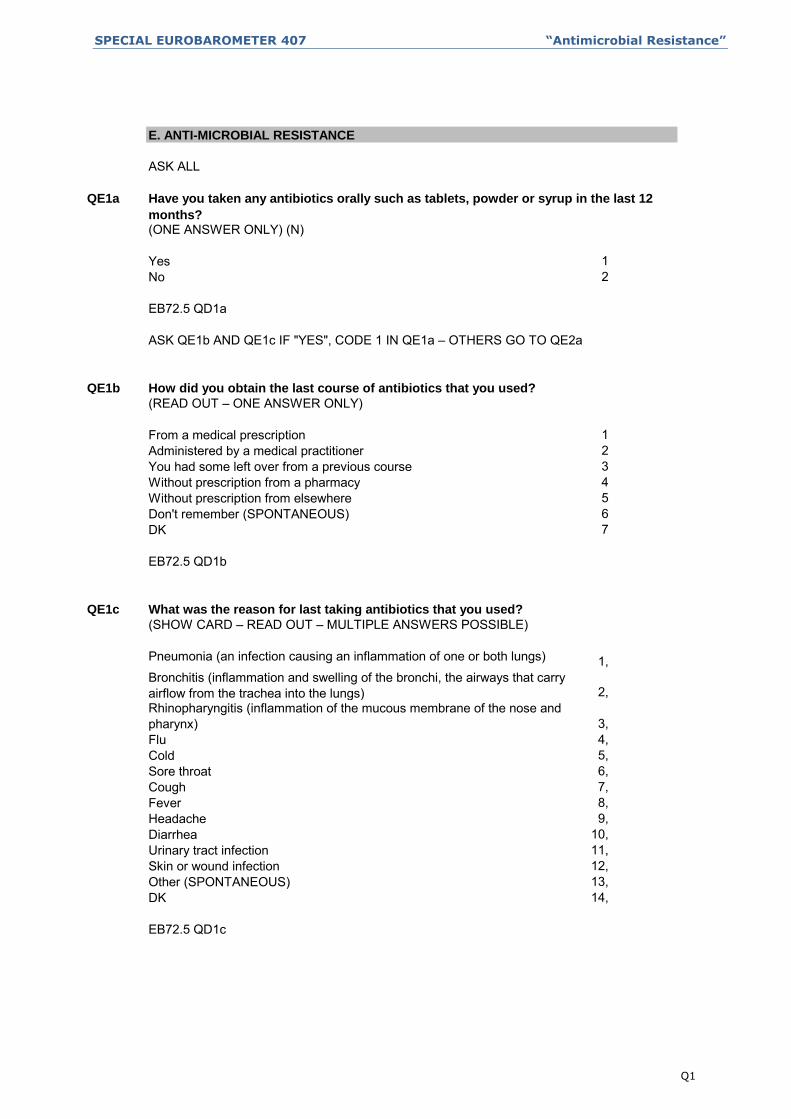
SPECIAL EUROBAROMETER 407 “Antimicrobial Resistance”
QE1a
12
QE1b
1234567
QE1c
1,
2,
3,4,5,6,7,8,9,
10,11,12,13,14,DK
EB72.5 QD1c
CoughFeverHeadacheDiarrheaUrinary tract infection
(SHOW CARD – READ OUT – MULTIPLE ANSWERS POSSIBLE)
Pneumonia (an infection causing an inflammation of one or both lungs)
What was the reason for last taking antibiotics that you used?
Skin or wound infectionOther (SPONTANEOUS)
Bronchitis (inflammation and swelling of the bronchi, the airways that carry airflow from the trachea into the lungs)Rhinopharyngitis (inflammation of the mucous membrane of the nose and pharynx)FluColdSore throat
You had some left over from a previous courseWithout prescription from a pharmacyWithout prescription from elsewhereDon't remember (SPONTANEOUS)
EB72.5 QD1b
DK
EB72.5 QD1a
ASK QE1b AND QE1c IF "YES", CODE 1 IN QE1a – OTHERS GO TO QE2a
How did you obtain the last course of antibiotics that you used?
(READ OUT – ONE ANSWER ONLY)
From a medical prescriptionAdministered by a medical practitioner
E. ANTI-MICROBIAL RESISTANCE
ASK ALL
Have you taken any antibiotics orally such as tablets, powder or syrup in the last 12
months?(ONE ANSWER ONLY) (N)
Yes No
Q1
SPECIAL EUROBAROMETER 407 “Antimicrobial Resistance”
QE2a
123
4
QE2b
12345
QE3a
12No
EB72.5 QD3a
Totally disagreeDK
EB72.5 QD2b
In the last 12 months, do you remember getting any information about not taking any
antibiotics unnecessarily, for example, messages about not taking antibiotics in case
of cold or flu?
(ONE ANSWER ONLY) (N)
Yes
Please tell me to what extent you agree or disagree with the following statement:
Everyone has a role to play to ensure that antibiotics remain effective.
(READ OUT – ONE ANSWER ONLY)
EB72.5 QD2a
Totally agreeTend to agreeTend to disagree
Unnecessary use of antibiotics make them become ineffective
1 2 3
Taking antibiotics often has side-effects such as diarrhea
1 2 3
Antibiotics kill viruses 1 2 3Antibiotics are effective against cold and flu 1 2 3
For each of the following statements, please tell me whether you think it is true or
false.(ONE ANSWER PER LINE)
(READ OUT) True False DK
ASK ALL
Q2
SPECIAL EUROBAROMETER 407 “Antimicrobial Resistance”
QE3b
123456789
1011
QE3c
123
QE3d
1,2,3,4,5,6,7,
EB72.5 QD3d
DK
Other (SPONTANEOUS)None (SPONTANEOUS)
(READ OUT – MULTIPLE ANSWERS POSSIBLE)
You will always consult a doctor in situations when you think you need an antibioticYou will no longer self-medicate with antibioticsYou will no longer take antibiotics without a prescription from a doctor
EB72.5 QD3c
(ONE ANSWER ONLY) (N)
Yes
ASK QE3d IF "YES", CODE 1 IN QE3c – OTHERS GO TO QE4
In what way did this information change your views on antibiotics?
You will no longer keep left over antibiotics for next time you are ill
I heard it on the radioI saw it on the InternetOther
NoDK
Did the information that you received change your views on antibiotics?
EB72.5 QD3b
DK
A pharmacist told meAnother health professional (e.g. nurse, physical therapist) told meA family member or friend told meI saw it on a TV advertisementI saw it in a leaflet or on a posterI read it in a newspaper or I saw it on the TV news
ASK QE3b TO QE3d IF "YES", CODE 1 IN QE3a – OTHERS GO TO QE4
Where did you first get this information about not taking any antibiotics
unnecessarily?(DO NOT READ OUT – DO NOT SHOW CARD – USE THE PRE-CODED LIST – ONE ANSWER ONLY)
A doctor told me
Q3
SPECIAL EUROBAROMETER 407 “Antimicrobial Resistance”
QE4
1,2,3,4,5,6,7,
8,9,
10,11,12,13,14,15,16,17,
A health related magazineOther (SPONTANEOUS)I am not looking for information on antibiotics (SPONTANEOUS)DK
EB72.5 QD4
The Internet site from the (NATIONAL PUBLIC HEALTH INSTITUTE - USE APPROPRIATE NAMING IN EACH COUNTRY) The Internet site on Public Health from the European Union Another health related Internet siteA Health Medical Encyclopedia A national, independent public health body or organisation A newspaper or magazine
A nurse A pharmacyA hospitalAnother health care facility Family or friendsThe Internet site from the National Government\the Ministry of Health
ASK ALL
Which of the following sources of information would you use in order to get
trustworthy information on antibiotics?(SHOW CARD – READ OUT - MAX. 3 ANSWERS)
A doctor
Q4

TABLES
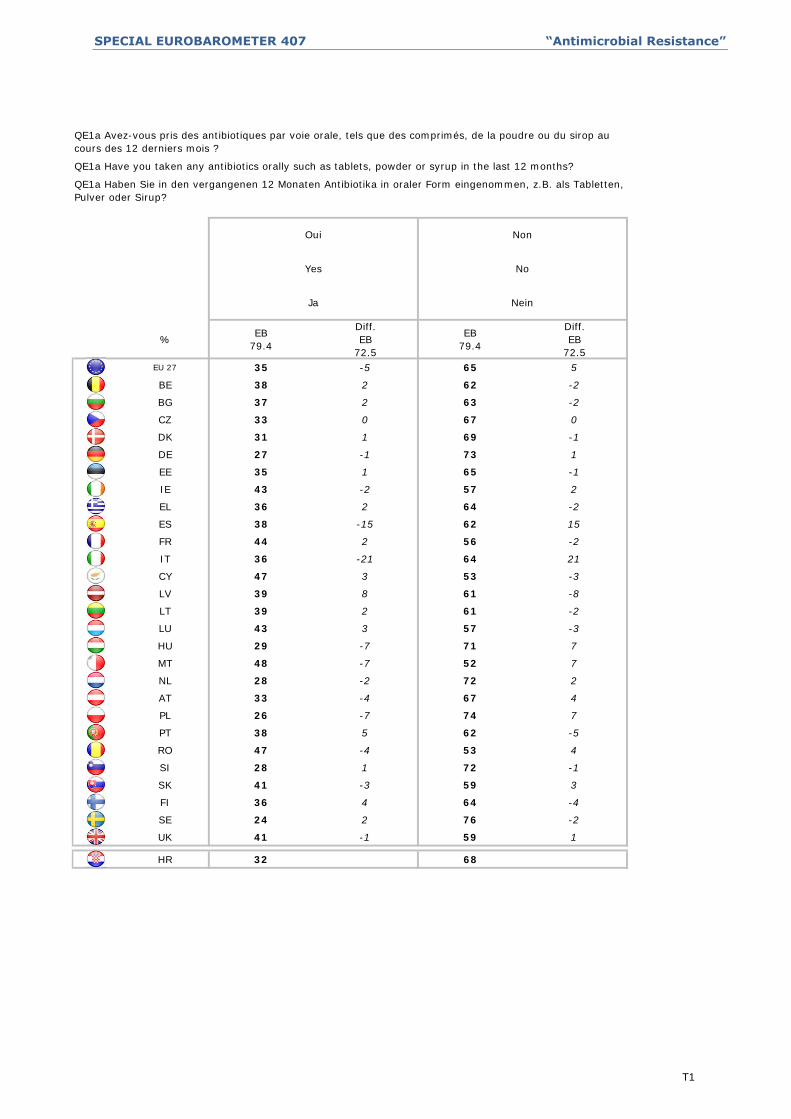
SPECIAL EUROBAROMETER 407 “Antimicrobial Resistance”
%EB
79.4
Diff.
EB
72.5
EB
79.4
Diff.
EB
72.5
EU 27 35 -5 65 5
BE 38 2 62 -2
BG 37 2 63 -2
CZ 33 0 67 0
DK 31 1 69 -1
DE 27 -1 73 1
EE 35 1 65 -1
IE 43 -2 57 2
EL 36 2 64 -2
ES 38 -15 62 15
FR 44 2 56 -2
IT 36 -21 64 21
CY 47 3 53 -3
LV 39 8 61 -8
LT 39 2 61 -2
LU 43 3 57 -3
HU 29 -7 71 7
MT 48 -7 52 7
NL 28 -2 72 2
AT 33 -4 67 4
PL 26 -7 74 7
PT 38 5 62 -5
RO 47 -4 53 4
SI 28 1 72 -1
SK 41 -3 59 3
FI 36 4 64 -4
SE 24 2 76 -2
UK 41 -1 59 1
HR 32 68
Ja
Non
No
Nein
QE1a Avez-vous pris des antibiotiques par voie orale, tels que des comprimés, de la poudre ou du sirop au
cours des 12 derniers mois ?
QE1a Have you taken any antibiotics orally such as tablets, powder or syrup in the last 12 months?
QE1a Haben Sie in den vergangenen 12 Monaten Antibiotika in oraler Form eingenommen, z.B. als Tabletten,
Pulver oder Sirup?
Oui
Yes
T1
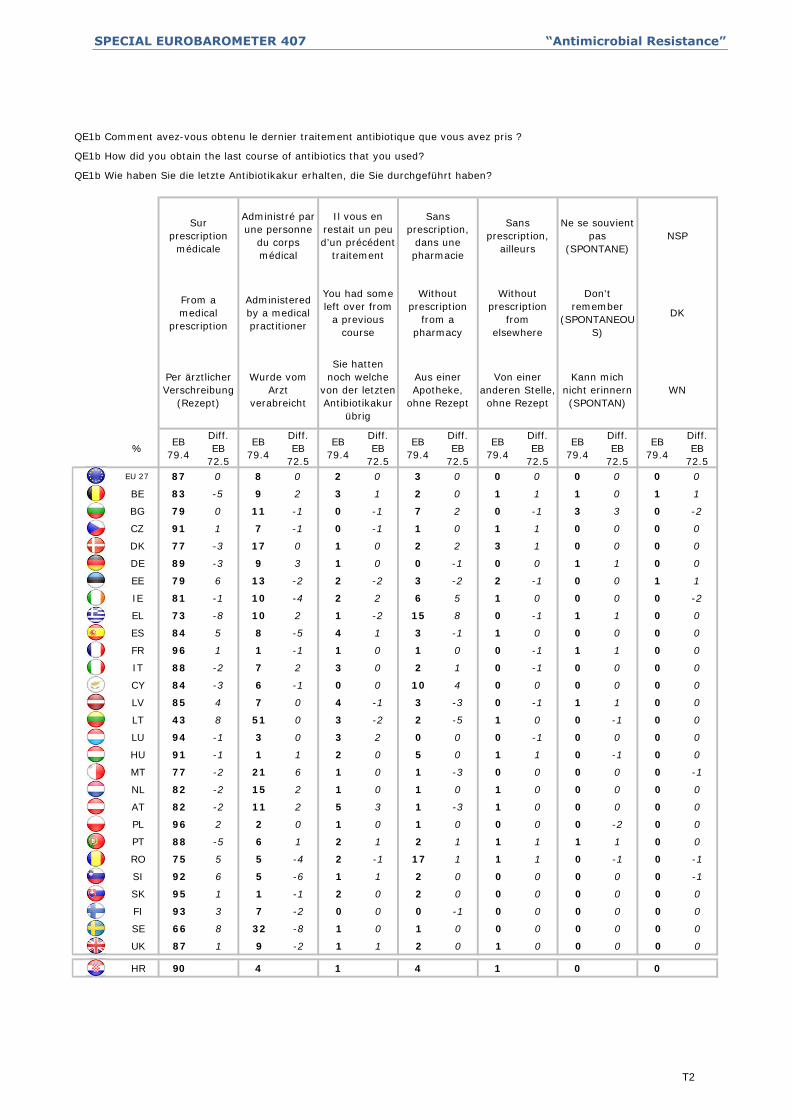
SPECIAL EUROBAROMETER 407 “Antimicrobial Resistance”
%EB
79.4
Diff.
EB
72.5
EB
79.4
Diff.
EB
72.5
EB
79.4
Diff.
EB
72.5
EB
79.4
Diff.
EB
72.5
EB
79.4
Diff.
EB
72.5
EB
79.4
Diff.
EB
72.5
EB
79.4
Diff.
EB
72.5
EU 27 87 0 8 0 2 0 3 0 0 0 0 0 0 0
BE 83 -5 9 2 3 1 2 0 1 1 1 0 1 1
BG 79 0 11 -1 0 -1 7 2 0 -1 3 3 0 -2
CZ 91 1 7 -1 0 -1 1 0 1 1 0 0 0 0
DK 77 -3 17 0 1 0 2 2 3 1 0 0 0 0
DE 89 -3 9 3 1 0 0 -1 0 0 1 1 0 0
EE 79 6 13 -2 2 -2 3 -2 2 -1 0 0 1 1
IE 81 -1 10 -4 2 2 6 5 1 0 0 0 0 -2
EL 73 -8 10 2 1 -2 15 8 0 -1 1 1 0 0
ES 84 5 8 -5 4 1 3 -1 1 0 0 0 0 0
FR 96 1 1 -1 1 0 1 0 0 -1 1 1 0 0
IT 88 -2 7 2 3 0 2 1 0 -1 0 0 0 0
CY 84 -3 6 -1 0 0 10 4 0 0 0 0 0 0
LV 85 4 7 0 4 -1 3 -3 0 -1 1 1 0 0
LT 43 8 51 0 3 -2 2 -5 1 0 0 -1 0 0
LU 94 -1 3 0 3 2 0 0 0 -1 0 0 0 0
HU 91 -1 1 1 2 0 5 0 1 1 0 -1 0 0
MT 77 -2 21 6 1 0 1 -3 0 0 0 0 0 -1
NL 82 -2 15 2 1 0 1 0 1 0 0 0 0 0
AT 82 -2 11 2 5 3 1 -3 1 0 0 0 0 0
PL 96 2 2 0 1 0 1 0 0 0 0 -2 0 0
PT 88 -5 6 1 2 1 2 1 1 1 1 1 0 0
RO 75 5 5 -4 2 -1 17 1 1 1 0 -1 0 -1
SI 92 6 5 -6 1 1 2 0 0 0 0 0 0 -1
SK 95 1 1 -1 2 0 2 0 0 0 0 0 0 0
FI 93 3 7 -2 0 0 0 -1 0 0 0 0 0 0
SE 66 8 32 -8 1 0 1 0 0 0 0 0 0 0
UK 87 1 9 -2 1 1 2 0 1 0 0 0 0 0
HR 90 4 1 4 1 0 0
Aus einer
Apotheke,
ohne Rezept
NSP
DK
WN
Sans
prescription,
ailleurs
Without
prescription
from
elsewhere
Von einer
anderen Stelle,
ohne Rezept
Ne se souvient
pas
(SPONTANE)
Don't
remember
(SPONTANEOU
S)
Kann mich
nicht erinnern
(SPONTAN)
Per ärztlicher
Verschreibung
(Rezept)
Administré par
une personne
du corps
médical
Administered
by a medical
practitioner
Wurde vom
Arzt
verabreicht
Il vous en
restait un peu
d’un précédent
traitement
You had some
left over from
a previous
course
Sie hatten
noch welche
von der letzten
Antibiotikakur
übrig
QE1b Comment avez-vous obtenu le dernier traitement antibiotique que vous avez pris ?
QE1b How did you obtain the last course of antibiotics that you used?
QE1b Wie haben Sie die letzte Antibiotikakur erhalten, die Sie durchgeführt haben?
Sur
prescription
médicale
From a
medical
prescription
Sans
prescription,
dans une
pharmacie
Without
prescription
from a
pharmacy
T2
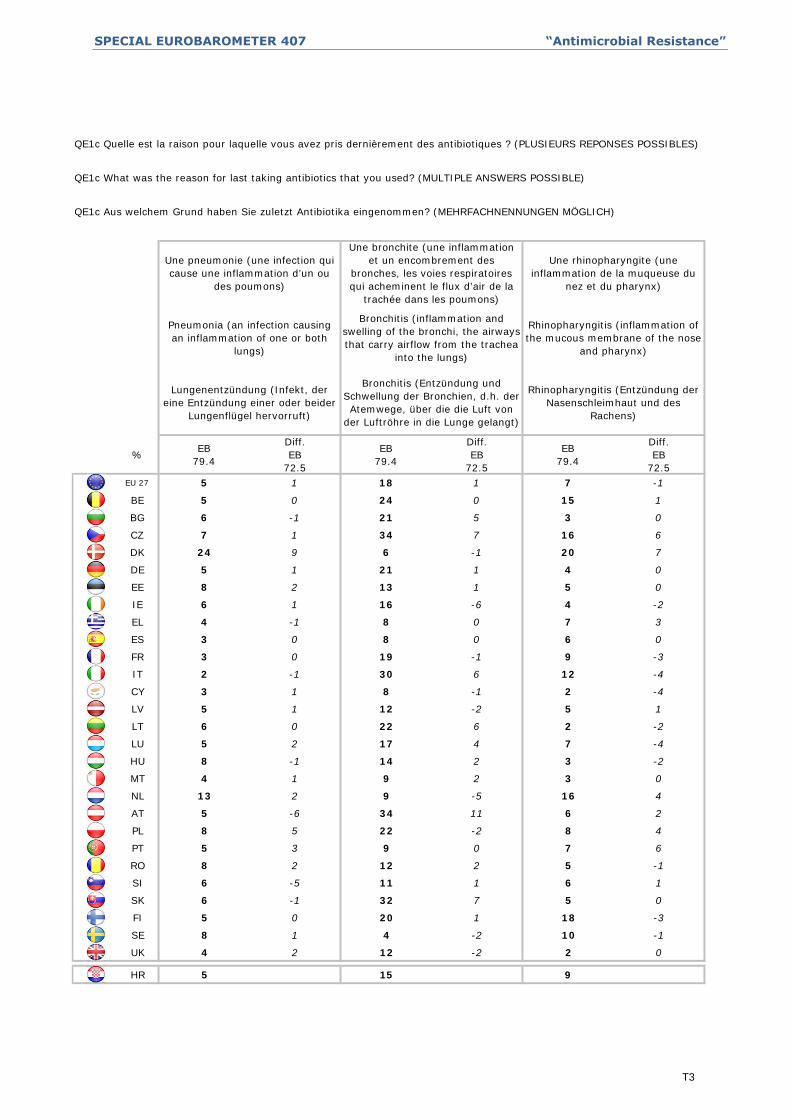
SPECIAL EUROBAROMETER 407 “Antimicrobial Resistance”
%EB
79.4
Diff.
EB
72.5
EB
79.4
Diff.
EB
72.5
EB
79.4
Diff.
EB
72.5
EU 27 5 1 18 1 7 -1
BE 5 0 24 0 15 1
BG 6 -1 21 5 3 0
CZ 7 1 34 7 16 6
DK 24 9 6 -1 20 7
DE 5 1 21 1 4 0
EE 8 2 13 1 5 0
IE 6 1 16 -6 4 -2
EL 4 -1 8 0 7 3
ES 3 0 8 0 6 0
FR 3 0 19 -1 9 -3
IT 2 -1 30 6 12 -4
CY 3 1 8 -1 2 -4
LV 5 1 12 -2 5 1
LT 6 0 22 6 2 -2
LU 5 2 17 4 7 -4
HU 8 -1 14 2 3 -2
MT 4 1 9 2 3 0
NL 13 2 9 -5 16 4
AT 5 -6 34 11 6 2
PL 8 5 22 -2 8 4
PT 5 3 9 0 7 6
RO 8 2 12 2 5 -1
SI 6 -5 11 1 6 1
SK 6 -1 32 7 5 0
FI 5 0 20 1 18 -3
SE 8 1 4 -2 10 -1
UK 4 2 12 -2 2 0
HR 5 15 9
QE1c Quelle est la raison pour laquelle vous avez pris dernièrement des antibiotiques ? (PLUSIEURS REPONSES POSSIBLES)
QE1c What was the reason for last taking antibiotics that you used? (MULTIPLE ANSWERS POSSIBLE)
QE1c Aus welchem Grund haben Sie zuletzt Antibiotika eingenommen? (MEHRFACHNENNUNGEN MÖGLICH)
Lungenentzündung (Infekt, der
eine Entzündung einer oder beider
Lungenflügel hervorruft)
Une bronchite (une inflammation
et un encombrement des
bronches, les voies respiratoires
qui acheminent le flux d’air de la
trachée dans les poumons)
Bronchitis (inflammation and
swelling of the bronchi, the airways
that carry airflow from the trachea
into the lungs)
Bronchitis (Entzündung und
Schwellung der Bronchien, d.h. der
Atemwege, über die die Luft von
der Luftröhre in die Lunge gelangt)
Une rhinopharyngite (une
inflammation de la muqueuse du
nez et du pharynx)
Rhinopharyngitis (inflammation of
the mucous membrane of the nose
and pharynx)
Rhinopharyngitis (Entzündung der
Nasenschleimhaut und des
Rachens)
Une pneumonie (une infection qui
cause une inflammation d’un ou
des poumons)
Pneumonia (an infection causing
an inflammation of one or both
lungs)
T3

SPECIAL EUROBAROMETER 407 “Antimicrobial Resistance”
%EB
79.4
Diff.
EB
72.5
EB
79.4
Diff.
EB
72.5
EB
79.4
Diff.
EB
72.5
EB
79.4
Diff.
EB
72.5
EB
79.4
Diff.
EB
72.5
EB
79.4
Diff.
EB
72.5
EU 27 18 -2 13 -1 11 -4 7 -2 7 -2 5 0
BE 17 -1 9 -3 10 -4 7 1 4 0 4 -1
BG 34 8 23 -9 17 -1 18 3 16 2 6 0
CZ 16 -3 5 -3 12 -2 6 -1 10 -2 4 -2
DK 8 -2 3 0 9 -1 2 0 1 -2 5 4
DE 17 -6 17 6 7 -1 5 0 7 3 2 -1
EE 14 1 16 1 9 2 9 3 6 -2 6 -3
IE 20 5 12 7 16 1 5 2 3 1 3 1
EL 22 -3 23 -4 14 -3 13 0 12 2 7 1
ES 20 -12 17 -7 13 -12 4 -13 7 -11 5 -7
FR 16 8 10 3 11 -3 5 0 7 1 8 4
IT 17 -6 4 -3 16 -3 12 4 11 1 1 0
CY 31 3 24 -3 9 0 7 0 7 3 5 -3
LV 18 7 26 -4 11 -2 7 1 4 2 4 0
LT 21 2 19 0 13 3 6 -2 8 0 3 0
LU 24 5 8 4 6 -2 5 4 7 6 6 6
HU 24 2 19 -4 27 -4 16 1 16 -3 6 -3
MT 30 4 11 -6 30 -1 11 4 11 2 3 0
NL 6 2 4 0 6 2 5 1 1 -1 2 0
AT 29 -2 24 1 11 -12 14 -6 19 -2 6 -4
PL 22 3 18 -4 9 -5 5 0 7 0 5 2
PT 22 0 11 3 15 -6 5 1 6 -1 3 1
RO 26 6 35 -5 6 -4 9 -4 9 -5 11 0
SI 10 5 7 0 23 3 8 3 8 0 4 -3
SK 20 -4 5 -2 25 -2 21 3 23 1 12 2
FI 7 0 4 3 7 4 3 2 3 1 1 0
SE 6 0 3 0 9 1 3 2 2 -1 3 1
UK 13 1 7 0 8 -2 6 0 3 0 3 0
HR 11 15 30 8 1 4
Husten Fieber KopfschmerzenGrippe Erkältung Halsschmerzen
Fever HeadacheFlu Cold Sore throat Cough
Un mal de têteLa grippe Un rhume Un mal de gorge De la toux De la fièvre
QE1c Quelle est la raison pour laquelle vous avez pris dernièrement des antibiotiques ? (PLUSIEURS REPONSES POSSIBLES)
QE1c What was the reason for last taking antibiotics that you used? (MULTIPLE ANSWERS POSSIBLE)
QE1c Aus welchem Grund haben Sie zuletzt Antibiotika eingenommen? (MEHRFACHNENNUNGEN MÖGLICH)
T4
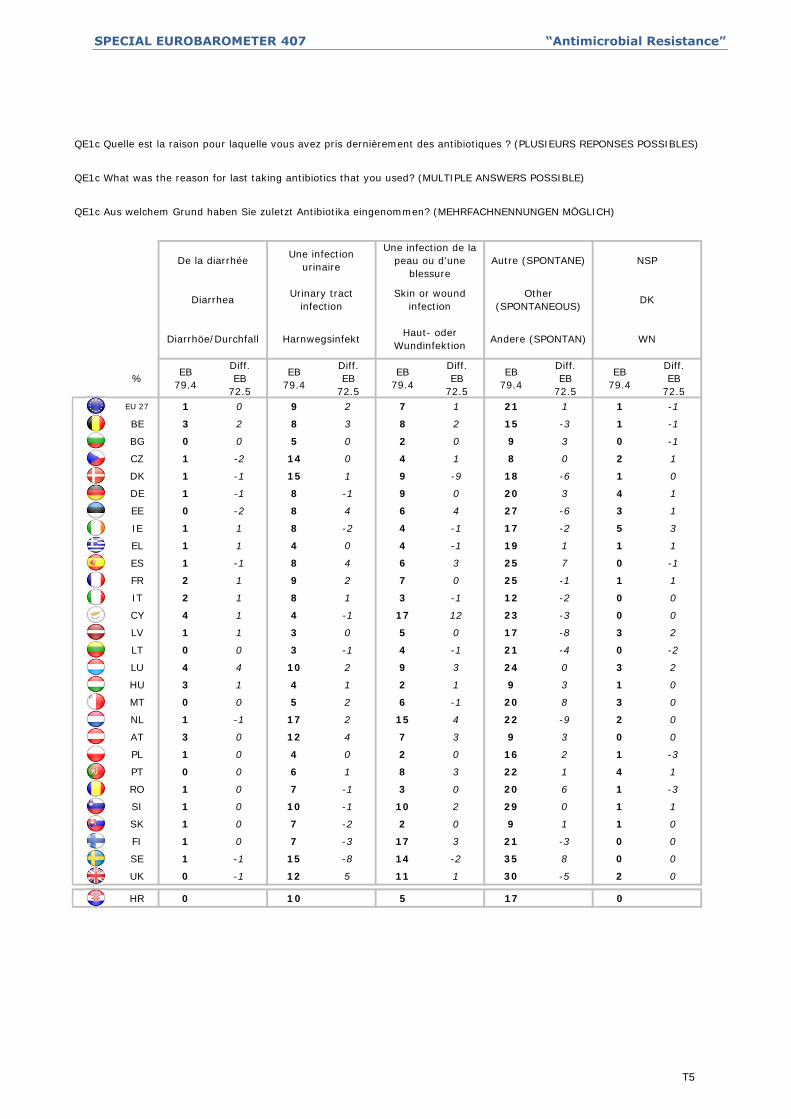
SPECIAL EUROBAROMETER 407 “Antimicrobial Resistance”
%EB
79.4
Diff.
EB
72.5
EB
79.4
Diff.
EB
72.5
EB
79.4
Diff.
EB
72.5
EB
79.4
Diff.
EB
72.5
EB
79.4
Diff.
EB
72.5
EU 27 1 0 9 2 7 1 21 1 1 -1
BE 3 2 8 3 8 2 15 -3 1 -1
BG 0 0 5 0 2 0 9 3 0 -1
CZ 1 -2 14 0 4 1 8 0 2 1
DK 1 -1 15 1 9 -9 18 -6 1 0
DE 1 -1 8 -1 9 0 20 3 4 1
EE 0 -2 8 4 6 4 27 -6 3 1
IE 1 1 8 -2 4 -1 17 -2 5 3
EL 1 1 4 0 4 -1 19 1 1 1
ES 1 -1 8 4 6 3 25 7 0 -1
FR 2 1 9 2 7 0 25 -1 1 1
IT 2 1 8 1 3 -1 12 -2 0 0
CY 4 1 4 -1 17 12 23 -3 0 0
LV 1 1 3 0 5 0 17 -8 3 2
LT 0 0 3 -1 4 -1 21 -4 0 -2
LU 4 4 10 2 9 3 24 0 3 2
HU 3 1 4 1 2 1 9 3 1 0
MT 0 0 5 2 6 -1 20 8 3 0
NL 1 -1 17 2 15 4 22 -9 2 0
AT 3 0 12 4 7 3 9 3 0 0
PL 1 0 4 0 2 0 16 2 1 -3
PT 0 0 6 1 8 3 22 1 4 1
RO 1 0 7 -1 3 0 20 6 1 -3
SI 1 0 10 -1 10 2 29 0 1 1
SK 1 0 7 -2 2 0 9 1 1 0
FI 1 0 7 -3 17 3 21 -3 0 0
SE 1 -1 15 -8 14 -2 35 8 0 0
UK 0 -1 12 5 11 1 30 -5 2 0
HR 0 10 5 17 0
Andere (SPONTAN) WNDiarrhöe/Durchfall HarnwegsinfektHaut- oder
Wundinfektion
DKDiarrheaUrinary tract
infection
Skin or wound
infection
Other
(SPONTANEOUS)
De la diarrhéeUne infection
urinaire
Une infection de la
peau ou d’une
blessure
Autre (SPONTANE) NSP
QE1c Quelle est la raison pour laquelle vous avez pris dernièrement des antibiotiques ? (PLUSIEURS REPONSES POSSIBLES)
QE1c What was the reason for last taking antibiotics that you used? (MULTIPLE ANSWERS POSSIBLE)
QE1c Aus welchem Grund haben Sie zuletzt Antibiotika eingenommen? (MEHRFACHNENNUNGEN MÖGLICH)
T5
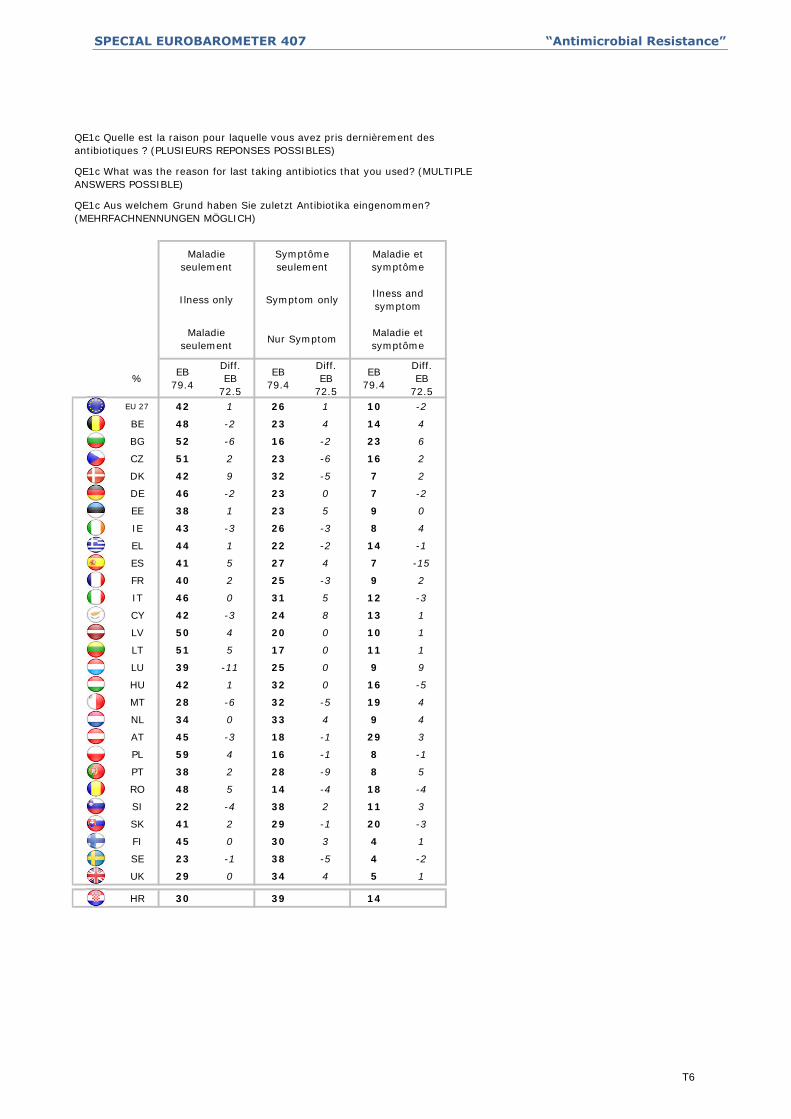
SPECIAL EUROBAROMETER 407 “Antimicrobial Resistance”
%EB
79.4
Diff.
EB
72.5
EB
79.4
Diff.
EB
72.5
EB
79.4
Diff.
EB
72.5
EU 27 42 1 26 1 10 -2
BE 48 -2 23 4 14 4
BG 52 -6 16 -2 23 6
CZ 51 2 23 -6 16 2
DK 42 9 32 -5 7 2
DE 46 -2 23 0 7 -2
EE 38 1 23 5 9 0
IE 43 -3 26 -3 8 4
EL 44 1 22 -2 14 -1
ES 41 5 27 4 7 -15
FR 40 2 25 -3 9 2
IT 46 0 31 5 12 -3
CY 42 -3 24 8 13 1
LV 50 4 20 0 10 1
LT 51 5 17 0 11 1
LU 39 -11 25 0 9 9
HU 42 1 32 0 16 -5
MT 28 -6 32 -5 19 4
NL 34 0 33 4 9 4
AT 45 -3 18 -1 29 3
PL 59 4 16 -1 8 -1
PT 38 2 28 -9 8 5
RO 48 5 14 -4 18 -4
SI 22 -4 38 2 11 3
SK 41 2 29 -1 20 -3
FI 45 0 30 3 4 1
SE 23 -1 38 -5 4 -2
UK 29 0 34 4 5 1
HR 30 39 14
Symptom onlyIlness and
symptom
Maladie
seulementNur Symptom
Maladie et
symptôme
Ilness only
Maladie
seulement
Symptôme
seulement
Maladie et
symptôme
QE1c Quelle est la raison pour laquelle vous avez pris dernièrement des
antibiotiques ? (PLUSIEURS REPONSES POSSIBLES)
QE1c What was the reason for last taking antibiotics that you used? (MULTIPLE
ANSWERS POSSIBLE)
QE1c Aus welchem Grund haben Sie zuletzt Antibiotika eingenommen?
(MEHRFACHNENNUNGEN MÖGLICH)
T6

SPECIAL EUROBAROMETER 407 “Antimicrobial Resistance”
%EB
79.4
Diff.
EB
72.5
EB
79.4
Diff.
EB
72.5
EB
79.4
Diff.
EB
72.5
EU 27 49 -4 40 4 11 0
BE 44 5 52 -4 4 -1
BG 64 2 21 -1 15 -1
CZ 58 -11 36 10 6 1
DK 38 -5 57 5 5 0
DE 48 -5 36 5 16 0
EE 54 -3 36 4 10 -1
IE 40 -6 51 6 9 0
EL 70 -3 25 1 5 2
ES 57 -6 29 6 14 0
FR 29 -2 59 1 12 1
IT 58 -4 33 4 9 0
CY 67 4 21 0 12 -4
LV 58 -2 27 1 15 1
LT 58 -9 27 7 15 2
LU 31 -13 58 12 11 1
HU 52 -13 38 11 10 2
MT 67 -8 23 5 10 3
NL 38 -5 56 4 6 1
AT 62 -11 29 12 9 -1
PL 54 -1 32 -1 14 2
PT 69 -9 19 5 12 4
RO 70 -1 15 1 15 0
SI 45 1 45 -2 10 1
SK 64 -2 31 2 5 0
FI 39 3 55 -3 6 0
SE 23 -1 74 1 3 0
UK 41 -1 52 2 7 -1
HR 44 48 8
QE2a.1 Sagen Sie mir bitte für jede der folgenden Aussagen, ob sie Ihrer Meinung nach richtig oder falsch ist.
Antibiotika zerstören Viren
QE2a.1 Pour chacune des propositions suivantes, veuillez me dire si vous pensez qu’elle est vraie ou fausse.
Les antibiotiques tuent les virus
QE2a.1 For each of the following statements, please tell me whether you think it is true or false.
Antibiotics kill viruses
DK
WN
TRUE
Richtig.
Fausse.
FALSE
Falsch.
Vraie. NSP
T7
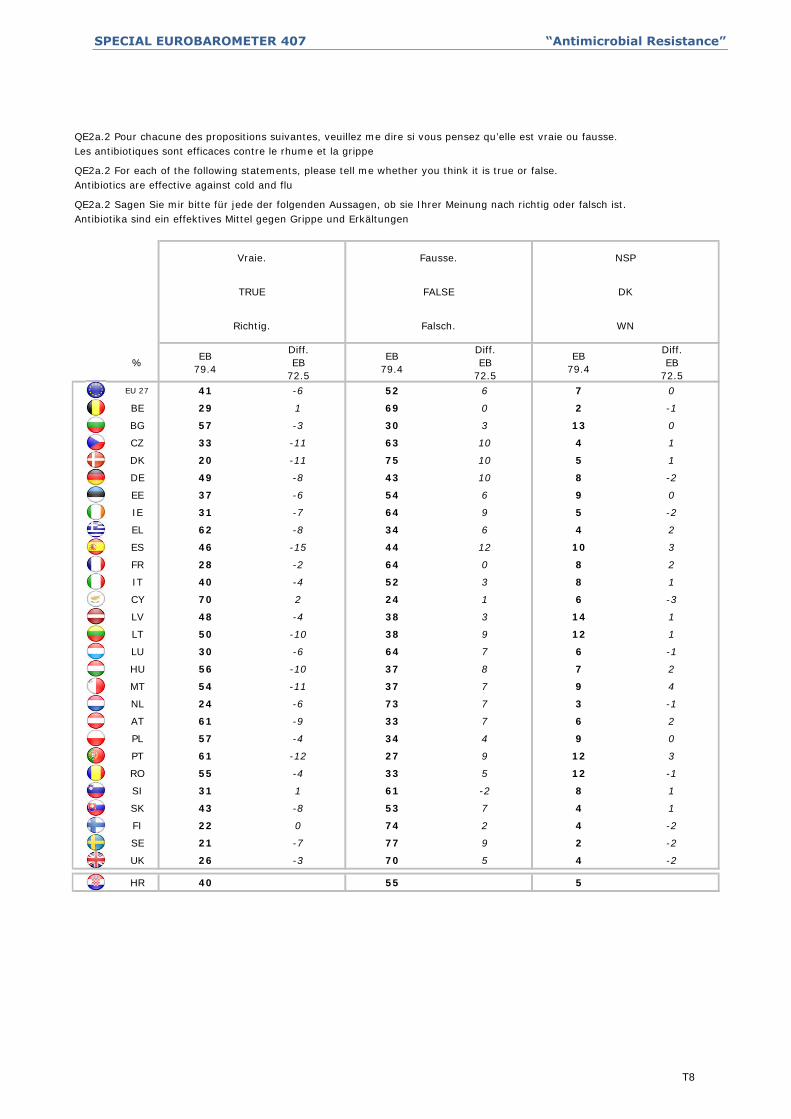
SPECIAL EUROBAROMETER 407 “Antimicrobial Resistance”
%EB
79.4
Diff.
EB
72.5
EB
79.4
Diff.
EB
72.5
EB
79.4
Diff.
EB
72.5
EU 27 41 -6 52 6 7 0
BE 29 1 69 0 2 -1
BG 57 -3 30 3 13 0
CZ 33 -11 63 10 4 1
DK 20 -11 75 10 5 1
DE 49 -8 43 10 8 -2
EE 37 -6 54 6 9 0
IE 31 -7 64 9 5 -2
EL 62 -8 34 6 4 2
ES 46 -15 44 12 10 3
FR 28 -2 64 0 8 2
IT 40 -4 52 3 8 1
CY 70 2 24 1 6 -3
LV 48 -4 38 3 14 1
LT 50 -10 38 9 12 1
LU 30 -6 64 7 6 -1
HU 56 -10 37 8 7 2
MT 54 -11 37 7 9 4
NL 24 -6 73 7 3 -1
AT 61 -9 33 7 6 2
PL 57 -4 34 4 9 0
PT 61 -12 27 9 12 3
RO 55 -4 33 5 12 -1
SI 31 1 61 -2 8 1
SK 43 -8 53 7 4 1
FI 22 0 74 2 4 -2
SE 21 -7 77 9 2 -2
UK 26 -3 70 5 4 -2
HR 40 55 5
QE2a.2 Sagen Sie mir bitte für jede der folgenden Aussagen, ob sie Ihrer Meinung nach richtig oder falsch ist.
Antibiotika sind ein effektives Mittel gegen Grippe und Erkältungen
QE2a.2 Pour chacune des propositions suivantes, veuillez me dire si vous pensez qu’elle est vraie ou fausse.
Les antibiotiques sont efficaces contre le rhume et la grippe
QE2a.2 For each of the following statements, please tell me whether you think it is true or false.
Antibiotics are effective against cold and flu
DK
WN
TRUE
Richtig.
Fausse.
FALSE
Falsch.
Vraie. NSP
T8

SPECIAL EUROBAROMETER 407 “Antimicrobial Resistance”
%EB
79.4
Diff.
EB
72.5
EB
79.4
Diff.
EB
72.5
EB
79.4
Diff.
EB
72.5
EU 27 84 1 8 0 8 -1
BE 88 1 10 0 2 -1
BG 78 -3 5 1 17 2
CZ 90 -1 5 -1 5 2
DK 97 1 1 -1 2 0
DE 87 3 4 -2 9 -1
EE 80 2 9 -1 11 -1
IE 85 -4 10 5 5 -1
EL 93 1 4 -1 3 0
ES 87 -1 5 1 8 0
FR 92 5 4 -2 4 -3
IT 68 3 18 -1 14 -2
CY 92 -2 3 2 5 0
LV 79 -2 8 1 13 1
LT 84 2 6 -2 10 0
LU 89 4 9 0 2 -4
HU 76 1 14 1 10 -2
MT 90 -4 4 2 6 2
NL 94 1 3 -1 3 0
AT 83 3 8 -1 9 -2
PL 85 0 8 2 7 -2
PT 79 -5 7 1 14 4
RO 58 1 15 1 27 -2
SI 95 1 2 -1 3 0
SK 88 -2 9 1 3 1
FI 90 -2 6 2 4 0
SE 98 1 2 -1 0 0
UK 89 0 7 1 4 -1
HR 87 8 5
QE2a.3 Sagen Sie mir bitte für jede der folgenden Aussagen, ob sie Ihrer Meinung nach richtig oder falsch ist.
Die unnötige Einnahme von Antibiotika verringert deren Wirksamkeit
QE2a.3 Pour chacune des propositions suivantes, veuillez me dire si vous pensez qu’elle est vraie ou fausse.
La surconsommation d’antibiotiques les rend inefficaces
QE2a.3 For each of the following statements, please tell me whether you think it is true or false.
Unnecessary use of antibiotics make them become ineffective
DK
WN
TRUE
Richtig.
Fausse.
FALSE
Falsch.
Vraie. NSP
T9
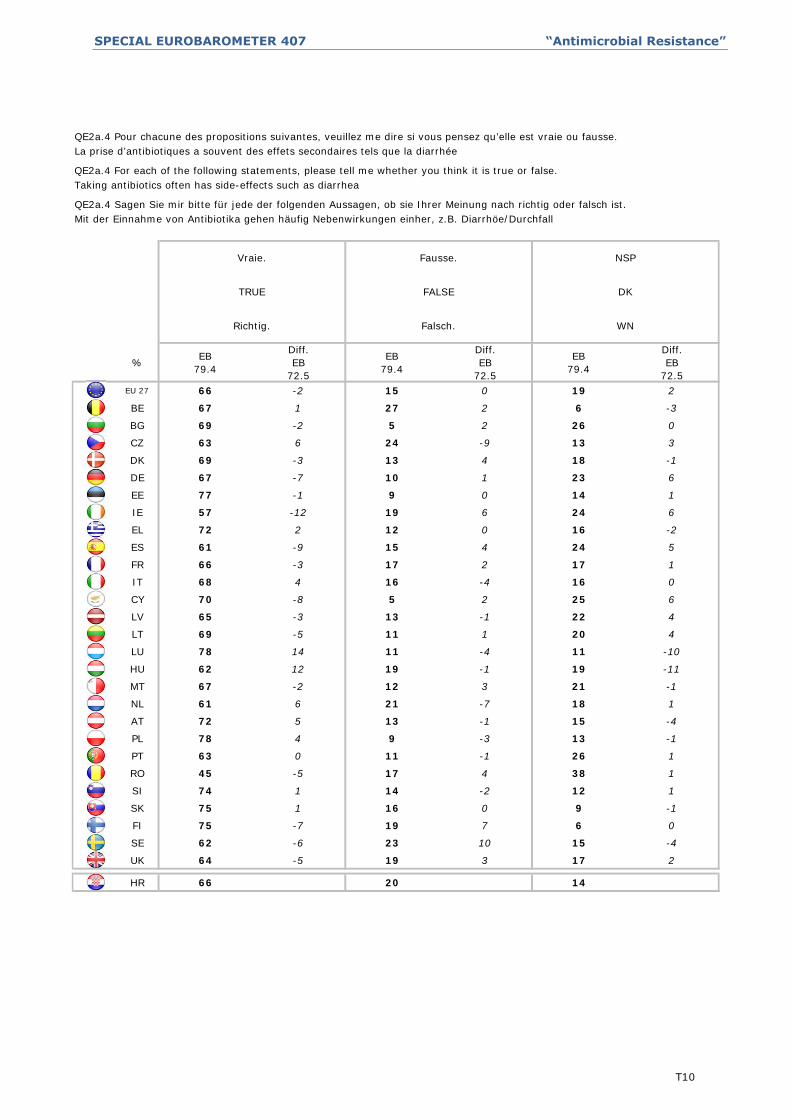
SPECIAL EUROBAROMETER 407 “Antimicrobial Resistance”
%EB
79.4
Diff.
EB
72.5
EB
79.4
Diff.
EB
72.5
EB
79.4
Diff.
EB
72.5
EU 27 66 -2 15 0 19 2
BE 67 1 27 2 6 -3
BG 69 -2 5 2 26 0
CZ 63 6 24 -9 13 3
DK 69 -3 13 4 18 -1
DE 67 -7 10 1 23 6
EE 77 -1 9 0 14 1
IE 57 -12 19 6 24 6
EL 72 2 12 0 16 -2
ES 61 -9 15 4 24 5
FR 66 -3 17 2 17 1
IT 68 4 16 -4 16 0
CY 70 -8 5 2 25 6
LV 65 -3 13 -1 22 4
LT 69 -5 11 1 20 4
LU 78 14 11 -4 11 -10
HU 62 12 19 -1 19 -11
MT 67 -2 12 3 21 -1
NL 61 6 21 -7 18 1
AT 72 5 13 -1 15 -4
PL 78 4 9 -3 13 -1
PT 63 0 11 -1 26 1
RO 45 -5 17 4 38 1
SI 74 1 14 -2 12 1
SK 75 1 16 0 9 -1
FI 75 -7 19 7 6 0
SE 62 -6 23 10 15 -4
UK 64 -5 19 3 17 2
HR 66 20 14
QE2a.4 Sagen Sie mir bitte für jede der folgenden Aussagen, ob sie Ihrer Meinung nach richtig oder falsch ist.
Mit der Einnahme von Antibiotika gehen häufig Nebenwirkungen einher, z.B. Diarrhöe/Durchfall
QE2a.4 Pour chacune des propositions suivantes, veuillez me dire si vous pensez qu’elle est vraie ou fausse.
La prise d’antibiotiques a souvent des effets secondaires tels que la diarrhée
QE2a.4 For each of the following statements, please tell me whether you think it is true or false.
Taking antibiotics often has side-effects such as diarrhea
DK
WN
TRUE
Richtig.
Fausse.
FALSE
Falsch.
Vraie. NSP
T10

SPECIAL EUROBAROMETER 407 “Antimicrobial Resistance”
%EB
79.4
Diff.
EB
72.5
EB
79.4
Diff.
EB
72.5
EB
79.4
Diff.
EB
72.5
EB
79.4
Diff.
EB
72.5
EB
79.4
Diff.
EB
72.5
EB
79.4
Diff.
EB
72.5
EU 27 94 1 6 -1 15 -1 32 -2 25 2 22 2
BE 97 0 3 0 11 0 24 0 31 2 31 -2
BG 86 -2 14 2 16 1 41 -4 16 2 13 0
CZ 96 -1 4 1 11 -8 34 -3 31 2 20 8
DK 99 1 1 -1 8 -2 19 -6 33 7 38 1
DE 93 0 7 0 18 0 31 -5 25 1 20 5
EE 93 1 7 -1 10 -3 32 -1 31 3 20 2
IE 96 1 4 -1 13 3 28 -3 31 3 23 -2
EL 96 0 4 0 17 -2 45 -4 20 4 14 1
ES 93 -2 7 2 19 0 36 -10 22 4 16 4
FR 97 0 3 0 11 0 22 -2 30 0 34 1
IT 92 4 8 -4 17 -2 36 4 25 2 14 0
CY 95 -1 5 1 19 4 50 -2 15 -4 11 1
LV 89 -2 11 2 19 1 34 -6 24 4 13 0
LT 92 0 8 0 16 -2 39 -6 21 3 15 4
LU 99 4 1 -4 11 -3 24 -4 26 -4 38 15
HU 91 4 9 -4 22 -5 32 -4 20 5 16 7
MT 95 -2 5 2 21 0 41 -6 19 0 14 4
NL 99 1 1 -1 9 -4 26 -2 33 3 31 4
AT 93 3 7 -3 15 -6 45 -2 21 7 13 5
PL 94 1 6 -1 12 -5 45 5 20 0 17 1
PT 87 -4 13 4 21 -2 41 -12 16 5 9 4
RO 78 3 22 -3 26 4 33 -5 14 3 4 0
SI 98 0 2 0 10 0 28 -1 31 6 29 -4
SK 95 0 5 0 14 0 35 -3 23 0 24 4
FI 95 -3 5 3 6 1 19 -3 31 4 39 -5
SE 99 -1 1 1 6 0 18 -3 31 -3 43 4
UK 96 0 4 0 11 1 24 -2 30 0 32 1
HR 64 28 8
QE2a.5 Pour chacune des propositions suivantes, veuillez me dire si vous pensez qu’elle est vraie ou fausse.
Moyenne
QE2a.5 For each of the following statements, please tell me whether you think it is true or false.
Average
3 correct
answers
3 richtige
Antworten
4 bonnes
réponses
4 correct
answers
4 richtige
Antworten
1 correct
answer
1 richtige
Antwort
2 bonnes
réponses
2 correct
answers
2 richtige
Antworten
At least one
correct answer
Mindestens ein
richtige
Antwort
0 bonne
réponse
0 correct
answer
0 bonne
réponse
Au moins une
bonne réponse
1 bonne
réponse
3 bonnes
réponses
QE2a.5 Sagen Sie mir bitte für jede der folgenden Aussagen, ob sie Ihrer Meinung nach richtig oder falsch ist.
Durchschnitt
T11
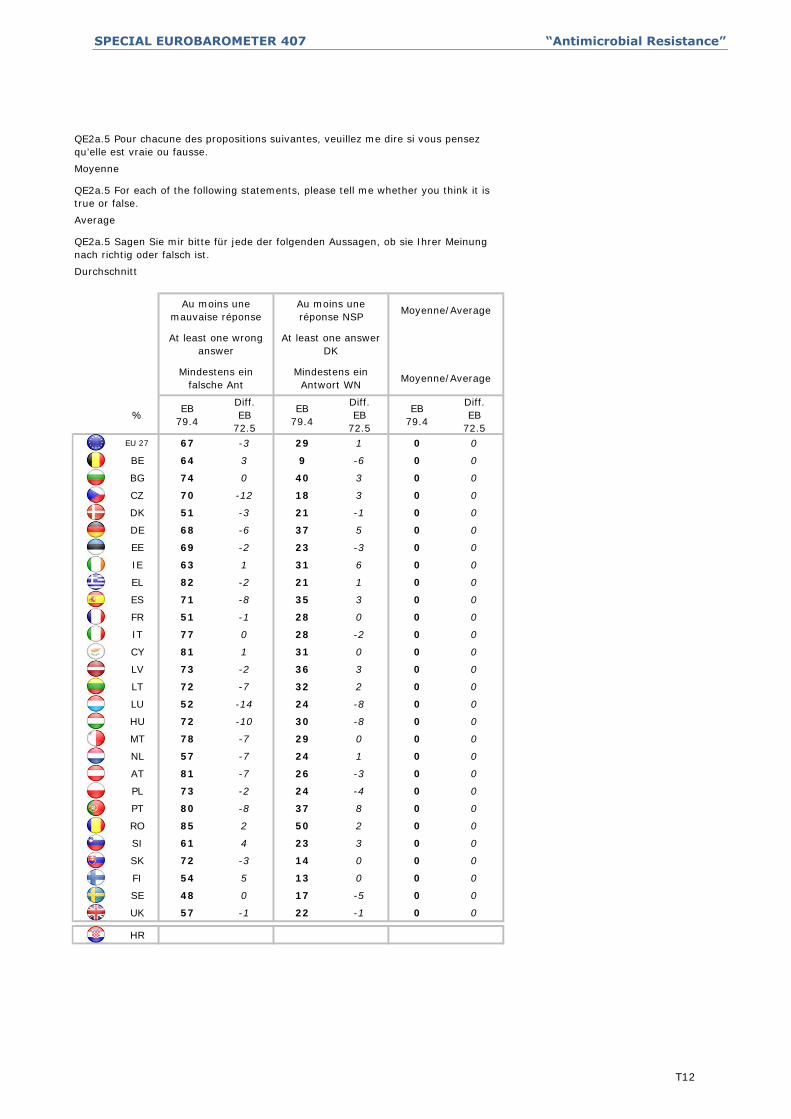
SPECIAL EUROBAROMETER 407 “Antimicrobial Resistance”
%EB
79.4
Diff.
EB
72.5
EB
79.4
Diff.
EB
72.5
EB
79.4
Diff.
EB
72.5
EU 27 67 -3 29 1 0 0
BE 64 3 9 -6 0 0
BG 74 0 40 3 0 0
CZ 70 -12 18 3 0 0
DK 51 -3 21 -1 0 0
DE 68 -6 37 5 0 0
EE 69 -2 23 -3 0 0
IE 63 1 31 6 0 0
EL 82 -2 21 1 0 0
ES 71 -8 35 3 0 0
FR 51 -1 28 0 0 0
IT 77 0 28 -2 0 0
CY 81 1 31 0 0 0
LV 73 -2 36 3 0 0
LT 72 -7 32 2 0 0
LU 52 -14 24 -8 0 0
HU 72 -10 30 -8 0 0
MT 78 -7 29 0 0 0
NL 57 -7 24 1 0 0
AT 81 -7 26 -3 0 0
PL 73 -2 24 -4 0 0
PT 80 -8 37 8 0 0
RO 85 2 50 2 0 0
SI 61 4 23 3 0 0
SK 72 -3 14 0 0 0
FI 54 5 13 0 0 0
SE 48 0 17 -5 0 0
UK 57 -1 22 -1 0 0
HR
Mindestens ein
Antwort WNMoyenne/Average
At least one wrong
answer
At least one answer
DK
Mindestens ein
falsche Ant
Au moins une
mauvaise réponse
Au moins une
réponse NSPMoyenne/Average
QE2a.5 Sagen Sie mir bitte für jede der folgenden Aussagen, ob sie Ihrer Meinung
nach richtig oder falsch ist.
Durchschnitt
QE2a.5 Pour chacune des propositions suivantes, veuillez me dire si vous pensez
qu’elle est vraie ou fausse.
Moyenne
QE2a.5 For each of the following statements, please tell me whether you think it is
true or false.
Average
T12
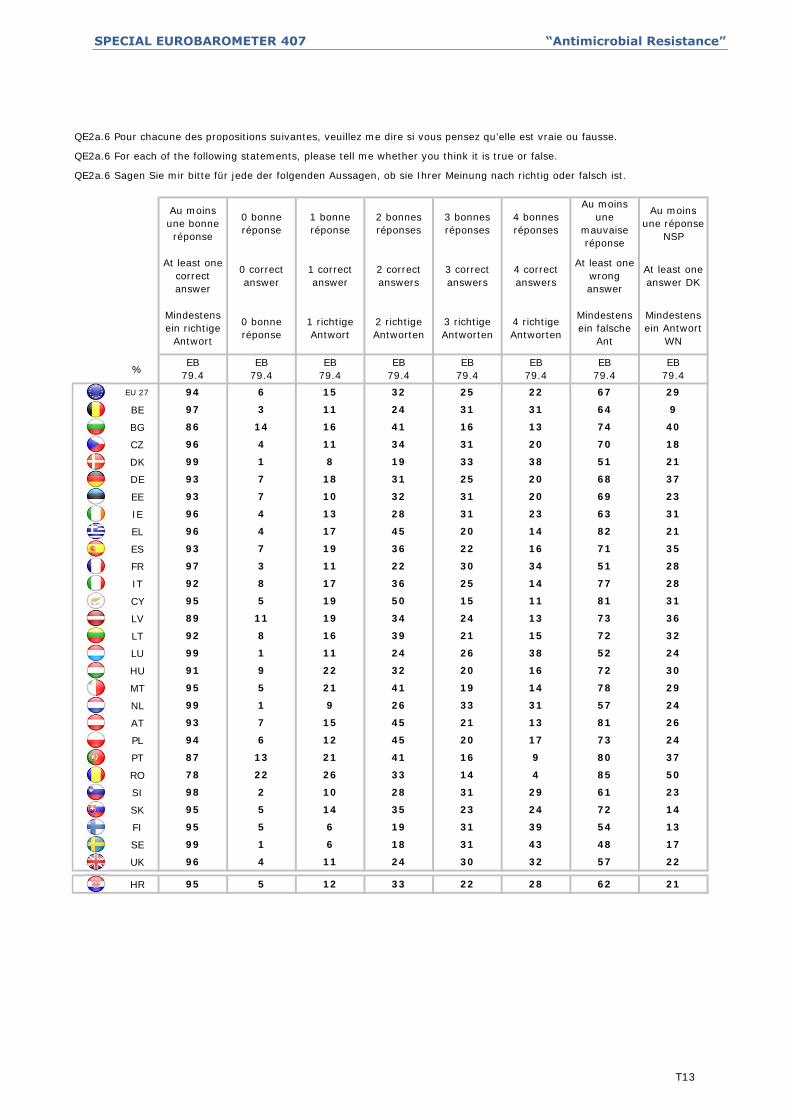
SPECIAL EUROBAROMETER 407 “Antimicrobial Resistance”
%
EU 27
BE
BG
CZ
DK
DE
EE
IE
EL
ES
FR
IT
CY
LV
LT
LU
HU
MT
NL
AT
PL
PT
RO
SI
SK
FI
SE
UK
HR
QE2a.6 Pour chacune des propositions suivantes, veuillez me dire si vous pensez qu’elle est vraie ou fausse.
QE2a.6 For each of the following statements, please tell me whether you think it is true or false.
QE2a.6 Sagen Sie mir bitte für jede der folgenden Aussagen, ob sie Ihrer Meinung nach richtig oder falsch ist.
22 28 62 2195 5 12 33
30 32 57 2296 4 11 24
31 43 48 1799 1 6 18
31 39 54 1395 5 6 19
23 24 72 1495 5 14 35
31 29 61 2398 2 10 28
14 4 85 5078 22 26 33
16 9 80 3787 13 21 41
20 17 73 2494 6 12 45
21 13 81 2693 7 15 45
33 31 57 2499 1 9 26
19 14 78 2995 5 21 41
20 16 72 3091 9 22 32
26 38 52 2499 1 11 24
21 15 72 3292 8 16 39
24 13 73 3689 11 19 34
15 11 81 3195 5 19 50
25 14 77 2892 8 17 36
30 34 51 2897 3 11 22
22 16 71 3593 7 19 36
20 14 82 2196 4 17 45
31 23 63 3196 4 13 28
31 20 69 2393 7 10 32
25 20 68 3793 7 18 31
33 38 51 2199 1 8 19
31 20 70 1896 4 11 34
16 13 74 4086 14 16 41
31 31 64 997 3 11 24
25 22 67 2994 6 15 32
Au moins
une réponse
NSP
At least one
answer DK
Mindestens
ein Antwort
WN
EB
79.4
Au moins
une
mauvaise
réponse
At least one
wrong
answer
Mindestens
ein falsche
Ant
EB
79.4
4 richtige
Antworten
EB
79.4
3 bonnes
réponses
3 correct
answers
3 richtige
Antworten
EB
79.4
2 richtige
Antworten
EB
79.4
1 bonne
réponse
1 correct
answer
1 richtige
Antwort
EB
79.4
0 bonne
réponse
EB
79.4
Au moins
une bonne
réponse
At least one
correct
answer
Mindestens
ein richtige
Antwort
EB
79.4
0 bonne
réponse
0 correct
answer
2 bonnes
réponses
2 correct
answers
4 bonnes
réponses
4 correct
answers
T13
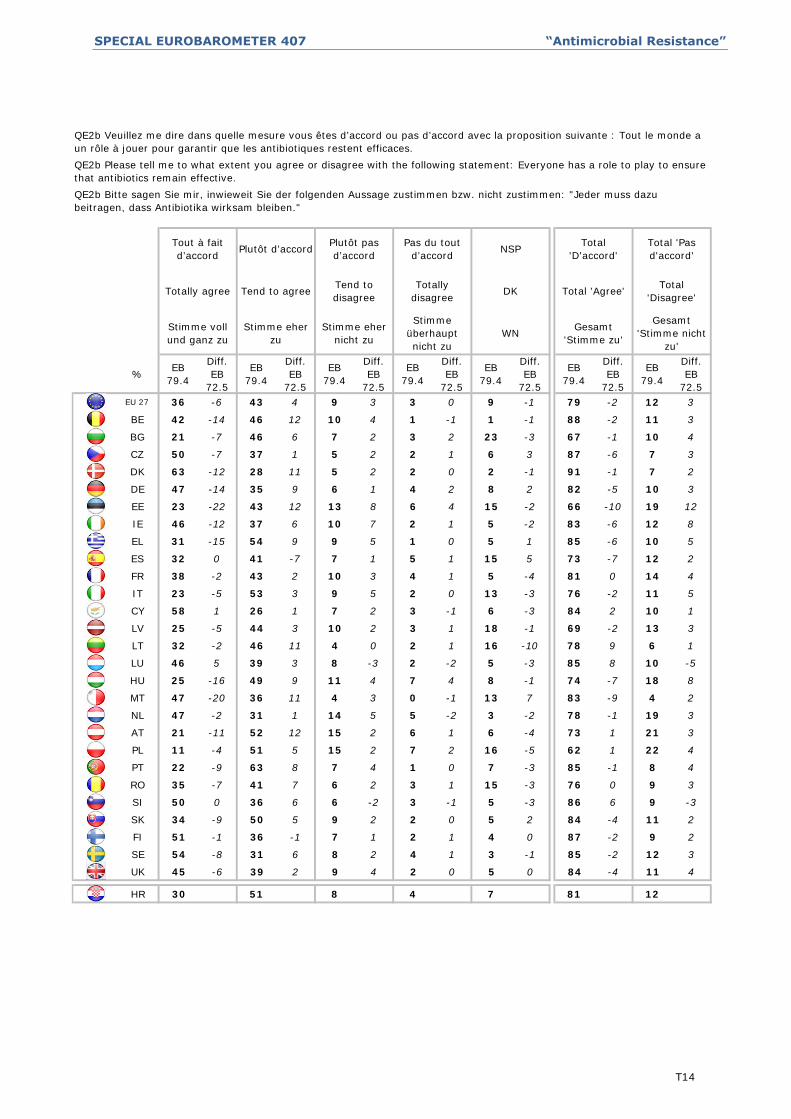
SPECIAL EUROBAROMETER 407 “Antimicrobial Resistance”
%EB
79.4
Diff.
EB
72.5
EB
79.4
Diff.
EB
72.5
EB
79.4
Diff.
EB
72.5
EB
79.4
Diff.
EB
72.5
EB
79.4
Diff.
EB
72.5
EB
79.4
Diff.
EB
72.5
EB
79.4
Diff.
EB
72.5
EU 27 36 -6 43 4 9 3 3 0 9 -1 79 -2 12 3
BE 42 -14 46 12 10 4 1 -1 1 -1 88 -2 11 3
BG 21 -7 46 6 7 2 3 2 23 -3 67 -1 10 4
CZ 50 -7 37 1 5 2 2 1 6 3 87 -6 7 3
DK 63 -12 28 11 5 2 2 0 2 -1 91 -1 7 2
DE 47 -14 35 9 6 1 4 2 8 2 82 -5 10 3
EE 23 -22 43 12 13 8 6 4 15 -2 66 -10 19 12
IE 46 -12 37 6 10 7 2 1 5 -2 83 -6 12 8
EL 31 -15 54 9 9 5 1 0 5 1 85 -6 10 5
ES 32 0 41 -7 7 1 5 1 15 5 73 -7 12 2
FR 38 -2 43 2 10 3 4 1 5 -4 81 0 14 4
IT 23 -5 53 3 9 5 2 0 13 -3 76 -2 11 5
CY 58 1 26 1 7 2 3 -1 6 -3 84 2 10 1
LV 25 -5 44 3 10 2 3 1 18 -1 69 -2 13 3
LT 32 -2 46 11 4 0 2 1 16 -10 78 9 6 1
LU 46 5 39 3 8 -3 2 -2 5 -3 85 8 10 -5
HU 25 -16 49 9 11 4 7 4 8 -1 74 -7 18 8
MT 47 -20 36 11 4 3 0 -1 13 7 83 -9 4 2
NL 47 -2 31 1 14 5 5 -2 3 -2 78 -1 19 3
AT 21 -11 52 12 15 2 6 1 6 -4 73 1 21 3
PL 11 -4 51 5 15 2 7 2 16 -5 62 1 22 4
PT 22 -9 63 8 7 4 1 0 7 -3 85 -1 8 4
RO 35 -7 41 7 6 2 3 1 15 -3 76 0 9 3
SI 50 0 36 6 6 -2 3 -1 5 -3 86 6 9 -3
SK 34 -9 50 5 9 2 2 0 5 2 84 -4 11 2
FI 51 -1 36 -1 7 1 2 1 4 0 87 -2 9 2
SE 54 -8 31 6 8 2 4 1 3 -1 85 -2 12 3
UK 45 -6 39 2 9 4 2 0 5 0 84 -4 11 4
HR 30 51 8 4 7 81 12
Stimme
überhaupt
nicht zu
Total 'Pas
d'accord'
Total
'Disagree'
Gesamt
'Stimme nicht
zu'
NSP
DK
WN
Total
'D'accord'
Total 'Agree'
Gesamt
'Stimme zu'
Stimme voll
und ganz zu
Plutôt d’accord
Tend to agree
Stimme eher
zu
Plutôt pas
d’accord
Tend to
disagree
Stimme eher
nicht zu
QE2b Veuillez me dire dans quelle mesure vous êtes d’accord ou pas d’accord avec la proposition suivante : Tout le monde a
un rôle à jouer pour garantir que les antibiotiques restent efficaces.
QE2b Please tell me to what extent you agree or disagree with the following statement: Everyone has a role to play to ensure
that antibiotics remain effective.
QE2b Bitte sagen Sie mir, inwieweit Sie der folgenden Aussage zustimmen bzw. nicht zustimmen: "Jeder muss dazu
beitragen, dass Antibiotika wirksam bleiben."
Tout à fait
d’accord
Totally agree
Pas du tout
d’accord
Totally
disagree
T14
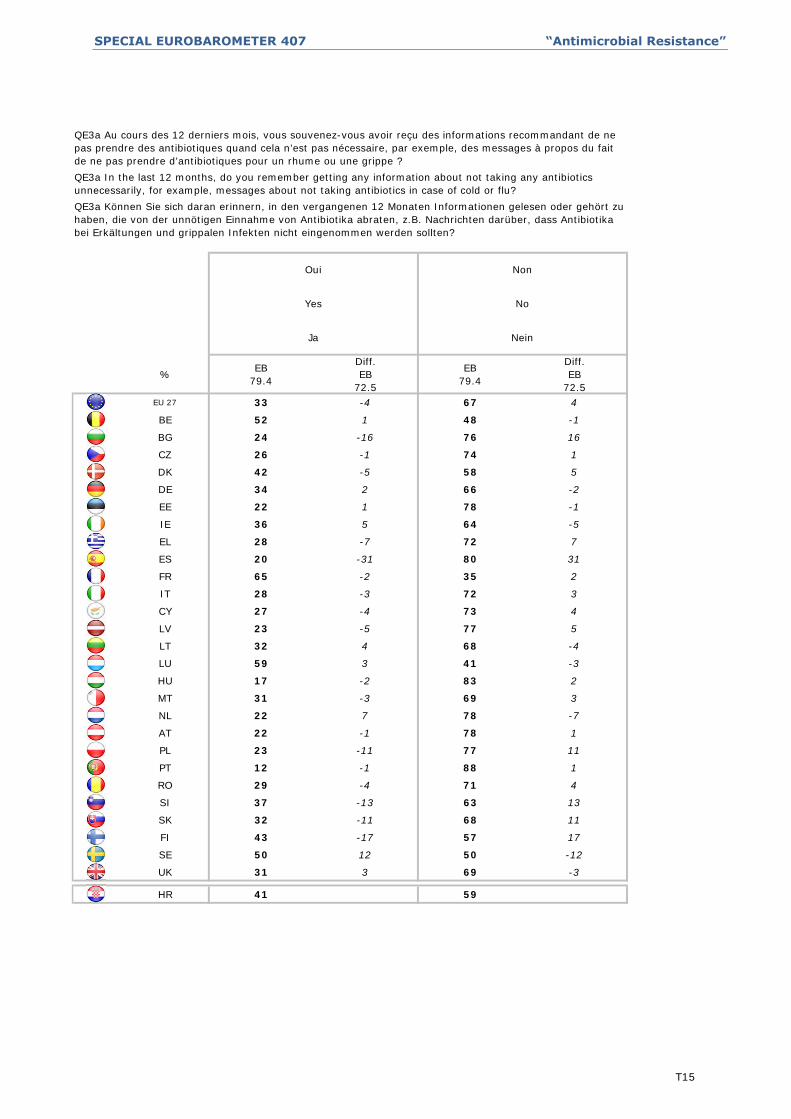
SPECIAL EUROBAROMETER 407 “Antimicrobial Resistance”
%EB
79.4
Diff.
EB
72.5
EB
79.4
Diff.
EB
72.5
EU 27 33 -4 67 4
BE 52 1 48 -1
BG 24 -16 76 16
CZ 26 -1 74 1
DK 42 -5 58 5
DE 34 2 66 -2
EE 22 1 78 -1
IE 36 5 64 -5
EL 28 -7 72 7
ES 20 -31 80 31
FR 65 -2 35 2
IT 28 -3 72 3
CY 27 -4 73 4
LV 23 -5 77 5
LT 32 4 68 -4
LU 59 3 41 -3
HU 17 -2 83 2
MT 31 -3 69 3
NL 22 7 78 -7
AT 22 -1 78 1
PL 23 -11 77 11
PT 12 -1 88 1
RO 29 -4 71 4
SI 37 -13 63 13
SK 32 -11 68 11
FI 43 -17 57 17
SE 50 12 50 -12
UK 31 3 69 -3
HR 41 59
Ja
Non
No
Nein
QE3a Au cours des 12 derniers mois, vous souvenez-vous avoir reçu des informations recommandant de ne
pas prendre des antibiotiques quand cela n’est pas nécessaire, par exemple, des messages à propos du fait
de ne pas prendre d’antibiotiques pour un rhume ou une grippe ?
QE3a In the last 12 months, do you remember getting any information about not taking any antibiotics
unnecessarily, for example, messages about not taking antibiotics in case of cold or flu?
QE3a Können Sie sich daran erinnern, in den vergangenen 12 Monaten Informationen gelesen oder gehört zu
haben, die von der unnötigen Einnahme von Antibiotika abraten, z.B. Nachrichten darüber, dass Antibiotika
bei Erkältungen und grippalen Infekten nicht eingenommen werden sollten?
Oui
Yes
T15
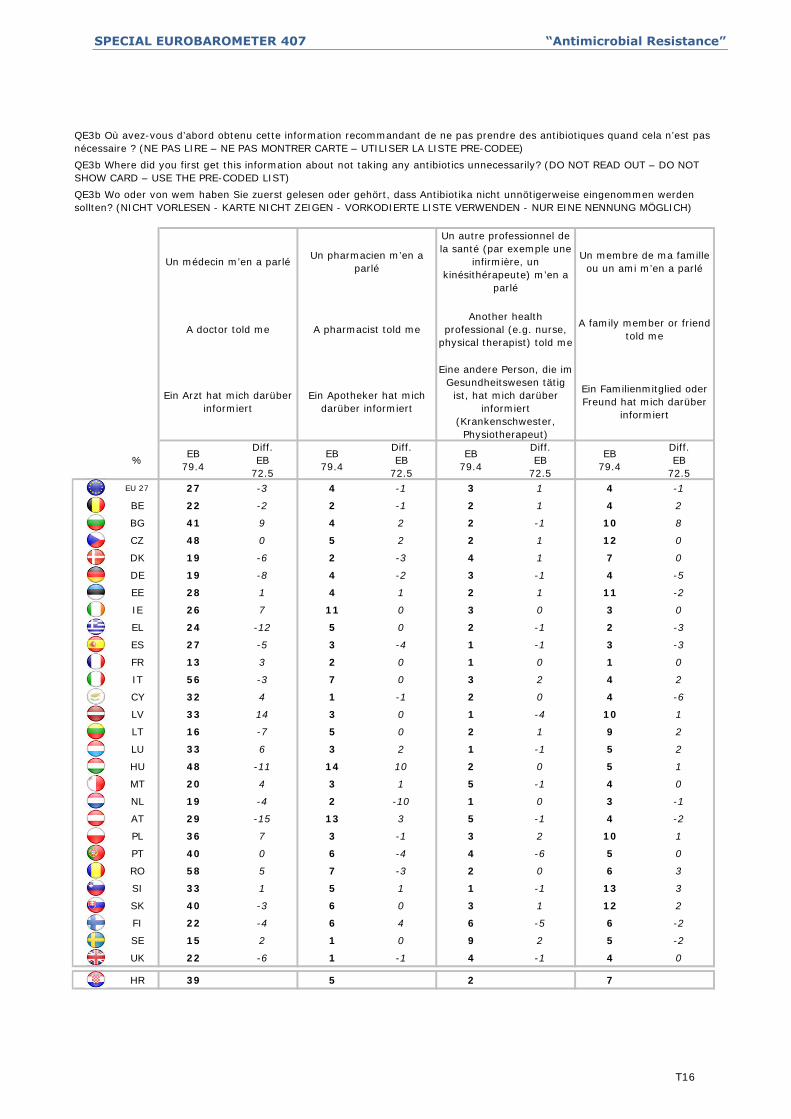
SPECIAL EUROBAROMETER 407 “Antimicrobial Resistance”
%EB
79.4
Diff.
EB
72.5
EB
79.4
Diff.
EB
72.5
EB
79.4
Diff.
EB
72.5
EB
79.4
Diff.
EB
72.5
EU 27 27 -3 4 -1 3 1 4 -1
BE 22 -2 2 -1 2 1 4 2
BG 41 9 4 2 2 -1 10 8
CZ 48 0 5 2 2 1 12 0
DK 19 -6 2 -3 4 1 7 0
DE 19 -8 4 -2 3 -1 4 -5
EE 28 1 4 1 2 1 11 -2
IE 26 7 11 0 3 0 3 0
EL 24 -12 5 0 2 -1 2 -3
ES 27 -5 3 -4 1 -1 3 -3
FR 13 3 2 0 1 0 1 0
IT 56 -3 7 0 3 2 4 2
CY 32 4 1 -1 2 0 4 -6
LV 33 14 3 0 1 -4 10 1
LT 16 -7 5 0 2 1 9 2
LU 33 6 3 2 1 -1 5 2
HU 48 -11 14 10 2 0 5 1
MT 20 4 3 1 5 -1 4 0
NL 19 -4 2 -10 1 0 3 -1
AT 29 -15 13 3 5 -1 4 -2
PL 36 7 3 -1 3 2 10 1
PT 40 0 6 -4 4 -6 5 0
RO 58 5 7 -3 2 0 6 3
SI 33 1 5 1 1 -1 13 3
SK 40 -3 6 0 3 1 12 2
FI 22 -4 6 4 6 -5 6 -2
SE 15 2 1 0 9 2 5 -2
UK 22 -6 1 -1 4 -1 4 0
HR 39 5 2 7
QE3b Où avez-vous d’abord obtenu cette information recommandant de ne pas prendre des antibiotiques quand cela n’est pas
nécessaire ? (NE PAS LIRE – NE PAS MONTRER CARTE – UTILISER LA LISTE PRE-CODEE)
QE3b Where did you first get this information about not taking any antibiotics unnecessarily? (DO NOT READ OUT – DO NOT
SHOW CARD – USE THE PRE-CODED LIST)
QE3b Wo oder von wem haben Sie zuerst gelesen oder gehört, dass Antibiotika nicht unnötigerweise eingenommen werden
sollten? (NICHT VORLESEN - KARTE NICHT ZEIGEN - VORKODIERTE LISTE VERWENDEN - NUR EINE NENNUNG MÖGLICH)
Ein Familienmitglied oder
Freund hat mich darüber
informiert
Ein Arzt hat mich darüber
informiert
Un pharmacien m’en a
parlé
A pharmacist told me
Ein Apotheker hat mich
darüber informiert
Un autre professionnel de
la santé (par exemple une
infirmière, un
kinésithérapeute) m’en a
parlé
Another health
professional (e.g. nurse,
physical therapist) told me
Eine andere Person, die im
Gesundheitswesen tätig
ist, hat mich darüber
informiert
(Krankenschwester,
Physiotherapeut)
Un médecin m’en a parlé
A doctor told me
Un membre de ma famille
ou un ami m’en a parlé
A family member or friend
told me
T16
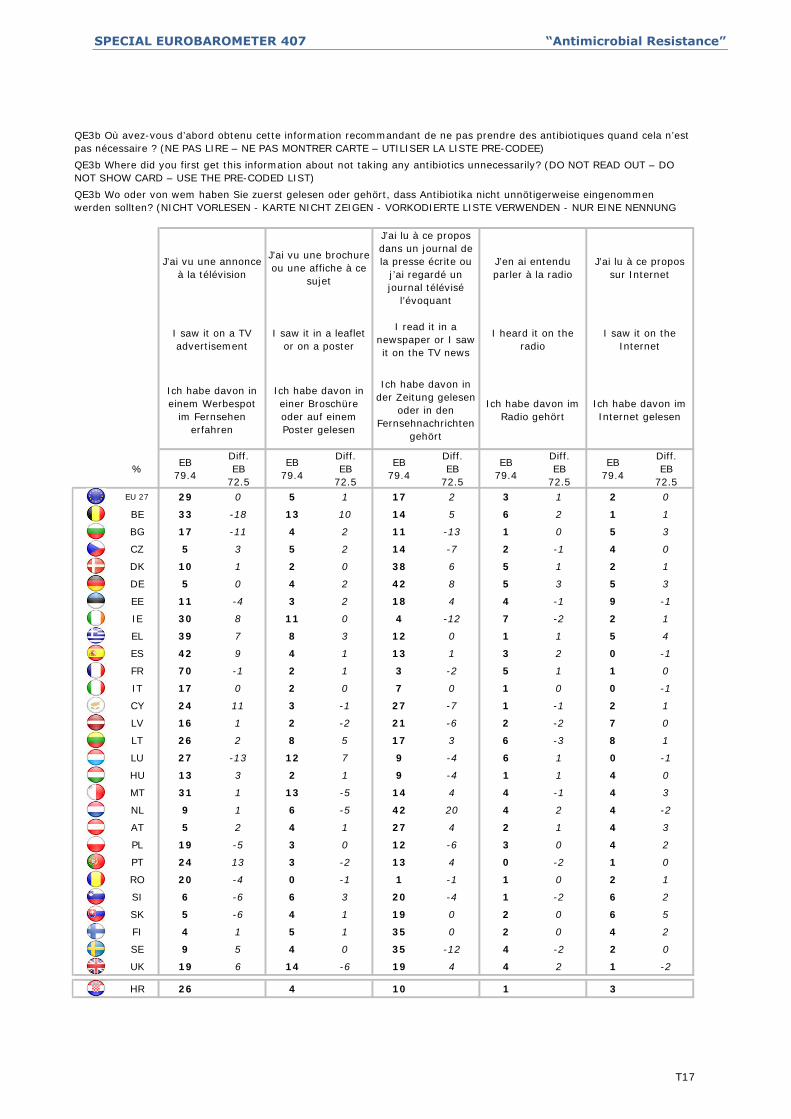
SPECIAL EUROBAROMETER 407 “Antimicrobial Resistance”
%EB
79.4
Diff.
EB
72.5
EB
79.4
Diff.
EB
72.5
EB
79.4
Diff.
EB
72.5
EB
79.4
Diff.
EB
72.5
EB
79.4
Diff.
EB
72.5
EU 27 29 0 5 1 17 2 3 1 2 0
BE 33 -18 13 10 14 5 6 2 1 1
BG 17 -11 4 2 11 -13 1 0 5 3
CZ 5 3 5 2 14 -7 2 -1 4 0
DK 10 1 2 0 38 6 5 1 2 1
DE 5 0 4 2 42 8 5 3 5 3
EE 11 -4 3 2 18 4 4 -1 9 -1
IE 30 8 11 0 4 -12 7 -2 2 1
EL 39 7 8 3 12 0 1 1 5 4
ES 42 9 4 1 13 1 3 2 0 -1
FR 70 -1 2 1 3 -2 5 1 1 0
IT 17 0 2 0 7 0 1 0 0 -1
CY 24 11 3 -1 27 -7 1 -1 2 1
LV 16 1 2 -2 21 -6 2 -2 7 0
LT 26 2 8 5 17 3 6 -3 8 1
LU 27 -13 12 7 9 -4 6 1 0 -1
HU 13 3 2 1 9 -4 1 1 4 0
MT 31 1 13 -5 14 4 4 -1 4 3
NL 9 1 6 -5 42 20 4 2 4 -2
AT 5 2 4 1 27 4 2 1 4 3
PL 19 -5 3 0 12 -6 3 0 4 2
PT 24 13 3 -2 13 4 0 -2 1 0
RO 20 -4 0 -1 1 -1 1 0 2 1
SI 6 -6 6 3 20 -4 1 -2 6 2
SK 5 -6 4 1 19 0 2 0 6 5
FI 4 1 5 1 35 0 2 0 4 2
SE 9 5 4 0 35 -12 4 -2 2 0
UK 19 6 14 -6 19 4 4 2 1 -2
HR 26 4 10 1 3
Ich habe davon im
Internet gelesen
Ich habe davon in
einem Werbespot
im Fernsehen
erfahren
Ich habe davon in
einer Broschüre
oder auf einem
Poster gelesen
Ich habe davon in
der Zeitung gelesen
oder in den
Fernsehnachrichten
gehört
Ich habe davon im
Radio gehört
I read it in a
newspaper or I saw
it on the TV news
I heard it on the
radio
I saw it on the
Internet
I saw it on a TV
advertisement
I saw it in a leaflet
or on a poster
J’ai lu à ce propos
sur Internet
J’ai vu une annonce
à la télévision
J’ai vu une brochure
ou une affiche à ce
sujet
J’ai lu à ce propos
dans un journal de
la presse écrite ou
j’ai regardé un
journal télévisé
l’évoquant
J’en ai entendu
parler à la radio
QE3b Où avez-vous d’abord obtenu cette information recommandant de ne pas prendre des antibiotiques quand cela n’est
pas nécessaire ? (NE PAS LIRE – NE PAS MONTRER CARTE – UTILISER LA LISTE PRE-CODEE)
QE3b Where did you first get this information about not taking any antibiotics unnecessarily? (DO NOT READ OUT – DO
NOT SHOW CARD – USE THE PRE-CODED LIST)
QE3b Wo oder von wem haben Sie zuerst gelesen oder gehört, dass Antibiotika nicht unnötigerweise eingenommen
werden sollten? (NICHT VORLESEN - KARTE NICHT ZEIGEN - VORKODIERTE LISTE VERWENDEN - NUR EINE NENNUNG
T17
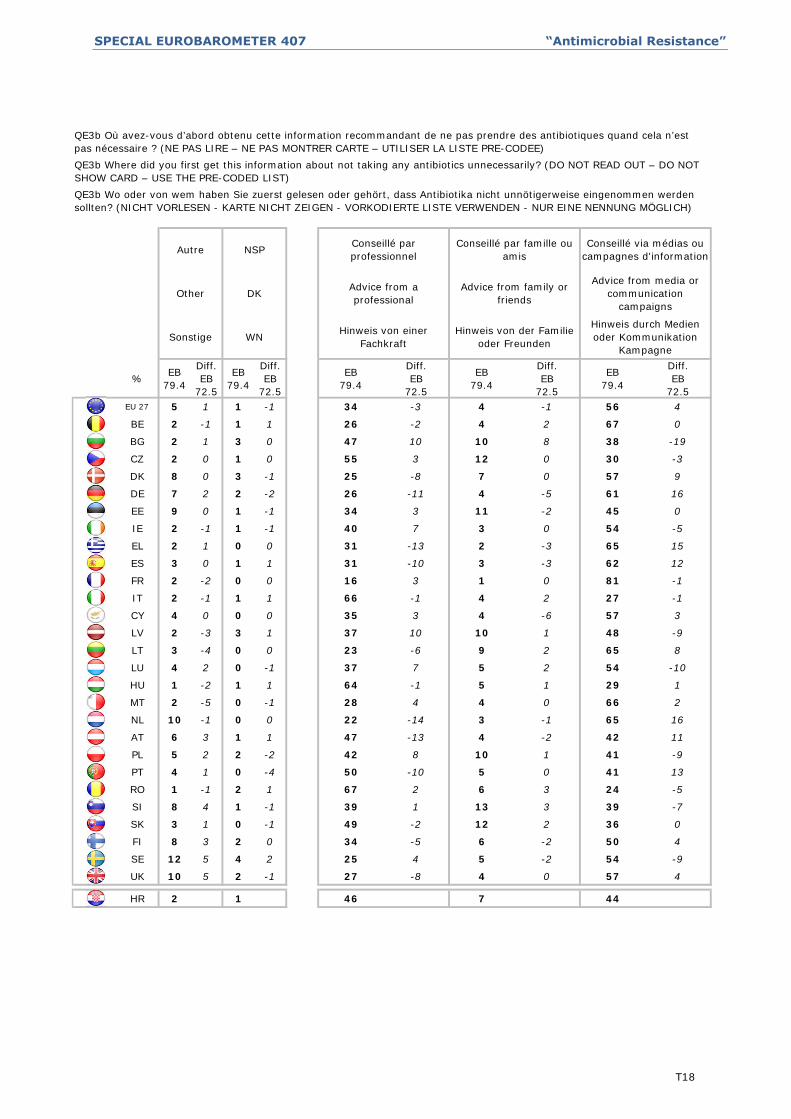
SPECIAL EUROBAROMETER 407 “Antimicrobial Resistance”
%EB
79.4
Diff.
EB
72.5
EB
79.4
Diff.
EB
72.5
EB
79.4
Diff.
EB
72.5
EB
79.4
Diff.
EB
72.5
EB
79.4
Diff.
EB
72.5
EU 27 5 1 1 -1 34 -3 4 -1 56 4
BE 2 -1 1 1 26 -2 4 2 67 0
BG 2 1 3 0 47 10 10 8 38 -19
CZ 2 0 1 0 55 3 12 0 30 -3
DK 8 0 3 -1 25 -8 7 0 57 9
DE 7 2 2 -2 26 -11 4 -5 61 16
EE 9 0 1 -1 34 3 11 -2 45 0
IE 2 -1 1 -1 40 7 3 0 54 -5
EL 2 1 0 0 31 -13 2 -3 65 15
ES 3 0 1 1 31 -10 3 -3 62 12
FR 2 -2 0 0 16 3 1 0 81 -1
IT 2 -1 1 1 66 -1 4 2 27 -1
CY 4 0 0 0 35 3 4 -6 57 3
LV 2 -3 3 1 37 10 10 1 48 -9
LT 3 -4 0 0 23 -6 9 2 65 8
LU 4 2 0 -1 37 7 5 2 54 -10
HU 1 -2 1 1 64 -1 5 1 29 1
MT 2 -5 0 -1 28 4 4 0 66 2
NL 10 -1 0 0 22 -14 3 -1 65 16
AT 6 3 1 1 47 -13 4 -2 42 11
PL 5 2 2 -2 42 8 10 1 41 -9
PT 4 1 0 -4 50 -10 5 0 41 13
RO 1 -1 2 1 67 2 6 3 24 -5
SI 8 4 1 -1 39 1 13 3 39 -7
SK 3 1 0 -1 49 -2 12 2 36 0
FI 8 3 2 0 34 -5 6 -2 50 4
SE 12 5 4 2 25 4 5 -2 54 -9
UK 10 5 2 -1 27 -8 4 0 57 4
HR 2 1 46 7 44
Hinweis von der Familie
oder Freunden
Hinweis durch Medien
oder Kommunikation
Kampagne
Advice from family or
friends
Advice from media or
communication
campaigns
Sonstige WNHinweis von einer
Fachkraft
Conseillé par famille ou
amis
Conseillé via médias ou
campagnes d'information
Other DKAdvice from a
professional
Autre NSPConseillé par
professionnel
QE3b Où avez-vous d’abord obtenu cette information recommandant de ne pas prendre des antibiotiques quand cela n’est
pas nécessaire ? (NE PAS LIRE – NE PAS MONTRER CARTE – UTILISER LA LISTE PRE-CODEE)
QE3b Where did you first get this information about not taking any antibiotics unnecessarily? (DO NOT READ OUT – DO NOT
SHOW CARD – USE THE PRE-CODED LIST)
QE3b Wo oder von wem haben Sie zuerst gelesen oder gehört, dass Antibiotika nicht unnötigerweise eingenommen werden
sollten? (NICHT VORLESEN - KARTE NICHT ZEIGEN - VORKODIERTE LISTE VERWENDEN - NUR EINE NENNUNG MÖGLICH)
T18
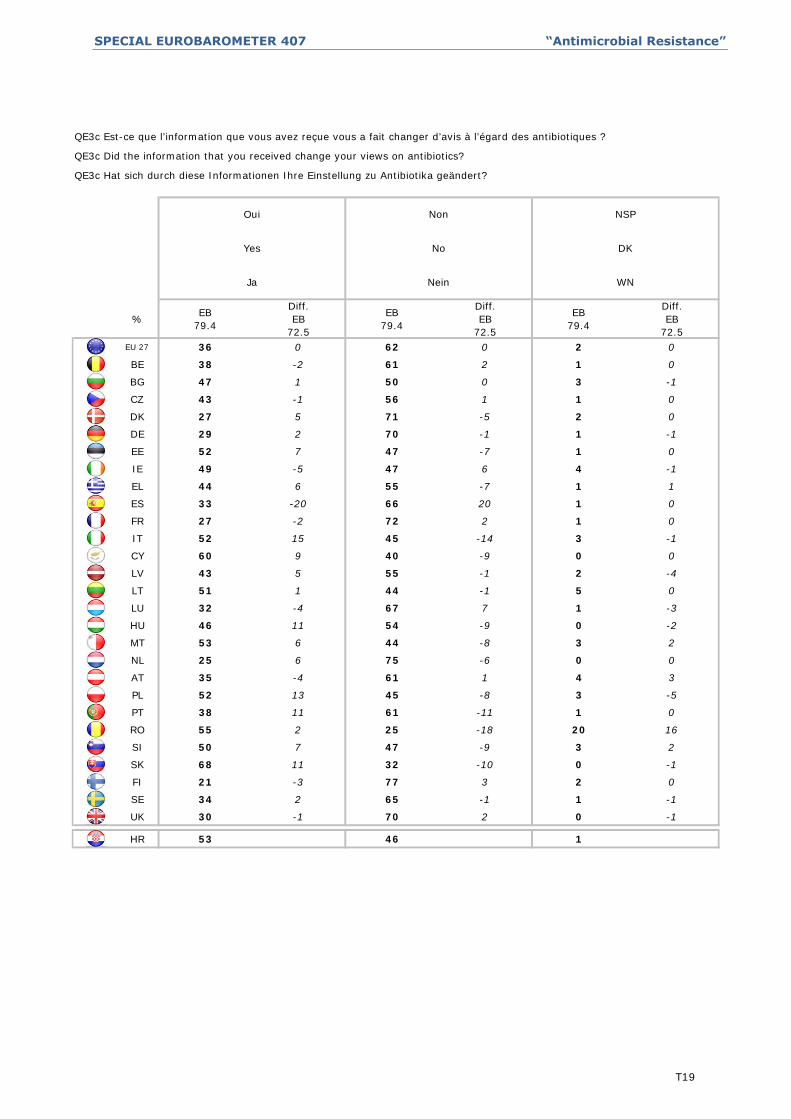
SPECIAL EUROBAROMETER 407 “Antimicrobial Resistance”
%EB
79.4
Diff.
EB
72.5
EB
79.4
Diff.
EB
72.5
EB
79.4
Diff.
EB
72.5
EU 27 36 0 62 0 2 0
BE 38 -2 61 2 1 0
BG 47 1 50 0 3 -1
CZ 43 -1 56 1 1 0
DK 27 5 71 -5 2 0
DE 29 2 70 -1 1 -1
EE 52 7 47 -7 1 0
IE 49 -5 47 6 4 -1
EL 44 6 55 -7 1 1
ES 33 -20 66 20 1 0
FR 27 -2 72 2 1 0
IT 52 15 45 -14 3 -1
CY 60 9 40 -9 0 0
LV 43 5 55 -1 2 -4
LT 51 1 44 -1 5 0
LU 32 -4 67 7 1 -3
HU 46 11 54 -9 0 -2
MT 53 6 44 -8 3 2
NL 25 6 75 -6 0 0
AT 35 -4 61 1 4 3
PL 52 13 45 -8 3 -5
PT 38 11 61 -11 1 0
RO 55 2 25 -18 20 16
SI 50 7 47 -9 3 2
SK 68 11 32 -10 0 -1
FI 21 -3 77 3 2 0
SE 34 2 65 -1 1 -1
UK 30 -1 70 2 0 -1
HR 53 46 1
QE3c Est-ce que l’information que vous avez reçue vous a fait changer d’avis à l’égard des antibiotiques ?
QE3c Did the information that you received change your views on antibiotics?
QE3c Hat sich durch diese Informationen Ihre Einstellung zu Antibiotika geändert?
WN
Oui
Yes
Ja
Non
No
Nein
NSP
DK
T19
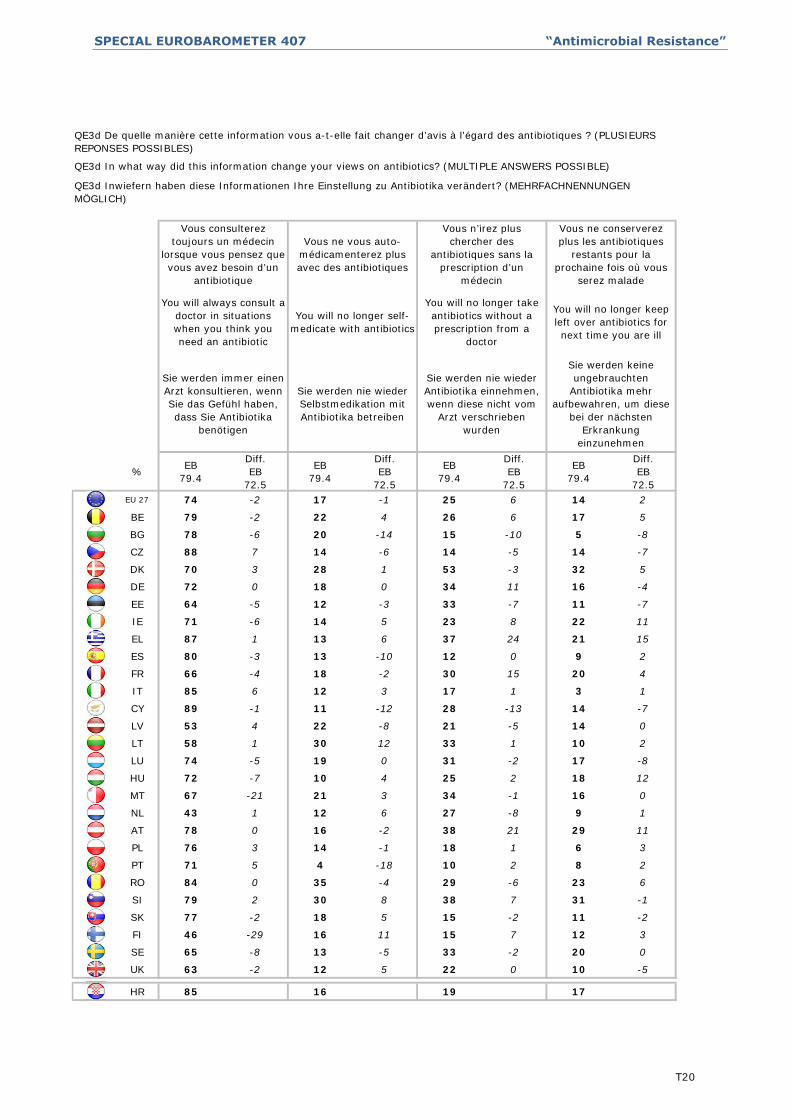
SPECIAL EUROBAROMETER 407 “Antimicrobial Resistance”
%EB
79.4
Diff.
EB
72.5
EB
79.4
Diff.
EB
72.5
EB
79.4
Diff.
EB
72.5
EB
79.4
Diff.
EB
72.5
EU 27 74 -2 17 -1 25 6 14 2
BE 79 -2 22 4 26 6 17 5
BG 78 -6 20 -14 15 -10 5 -8
CZ 88 7 14 -6 14 -5 14 -7
DK 70 3 28 1 53 -3 32 5
DE 72 0 18 0 34 11 16 -4
EE 64 -5 12 -3 33 -7 11 -7
IE 71 -6 14 5 23 8 22 11
EL 87 1 13 6 37 24 21 15
ES 80 -3 13 -10 12 0 9 2
FR 66 -4 18 -2 30 15 20 4
IT 85 6 12 3 17 1 3 1
CY 89 -1 11 -12 28 -13 14 -7
LV 53 4 22 -8 21 -5 14 0
LT 58 1 30 12 33 1 10 2
LU 74 -5 19 0 31 -2 17 -8
HU 72 -7 10 4 25 2 18 12
MT 67 -21 21 3 34 -1 16 0
NL 43 1 12 6 27 -8 9 1
AT 78 0 16 -2 38 21 29 11
PL 76 3 14 -1 18 1 6 3
PT 71 5 4 -18 10 2 8 2
RO 84 0 35 -4 29 -6 23 6
SI 79 2 30 8 38 7 31 -1
SK 77 -2 18 5 15 -2 11 -2
FI 46 -29 16 11 15 7 12 3
SE 65 -8 13 -5 33 -2 20 0
UK 63 -2 12 5 22 0 10 -5
HR 85 16 19 17
Sie werden keine
ungebrauchten
Antibiotika mehr
aufbewahren, um diese
bei der nächsten
Erkrankung
einzunehmen
Sie werden immer einen
Arzt konsultieren, wenn
Sie das Gefühl haben,
dass Sie Antibiotika
benötigen
Vous ne vous auto-
médicamenterez plus
avec des antibiotiques
You will no longer self-
medicate with antibiotics
Sie werden nie wieder
Selbstmedikation mit
Antibiotika betreiben
Vous n’irez plus
chercher des
antibiotiques sans la
prescription d’un
médecin
You will no longer take
antibiotics without a
prescription from a
doctor
Sie werden nie wieder
Antibiotika einnehmen,
wenn diese nicht vom
Arzt verschrieben
wurden
QE3d De quelle manière cette information vous a-t-elle fait changer d’avis à l’égard des antibiotiques ? (PLUSIEURS
REPONSES POSSIBLES)
QE3d In what way did this information change your views on antibiotics? (MULTIPLE ANSWERS POSSIBLE)
QE3d Inwiefern haben diese Informationen Ihre Einstellung zu Antibiotika verändert? (MEHRFACHNENNUNGEN
MÖGLICH)
Vous consulterez
toujours un médecin
lorsque vous pensez que
vous avez besoin d’un
antibiotique
You will always consult a
doctor in situations
when you think you
need an antibiotic
Vous ne conserverez
plus les antibiotiques
restants pour la
prochaine fois où vous
serez malade
You will no longer keep
left over antibiotics for
next time you are ill
T20
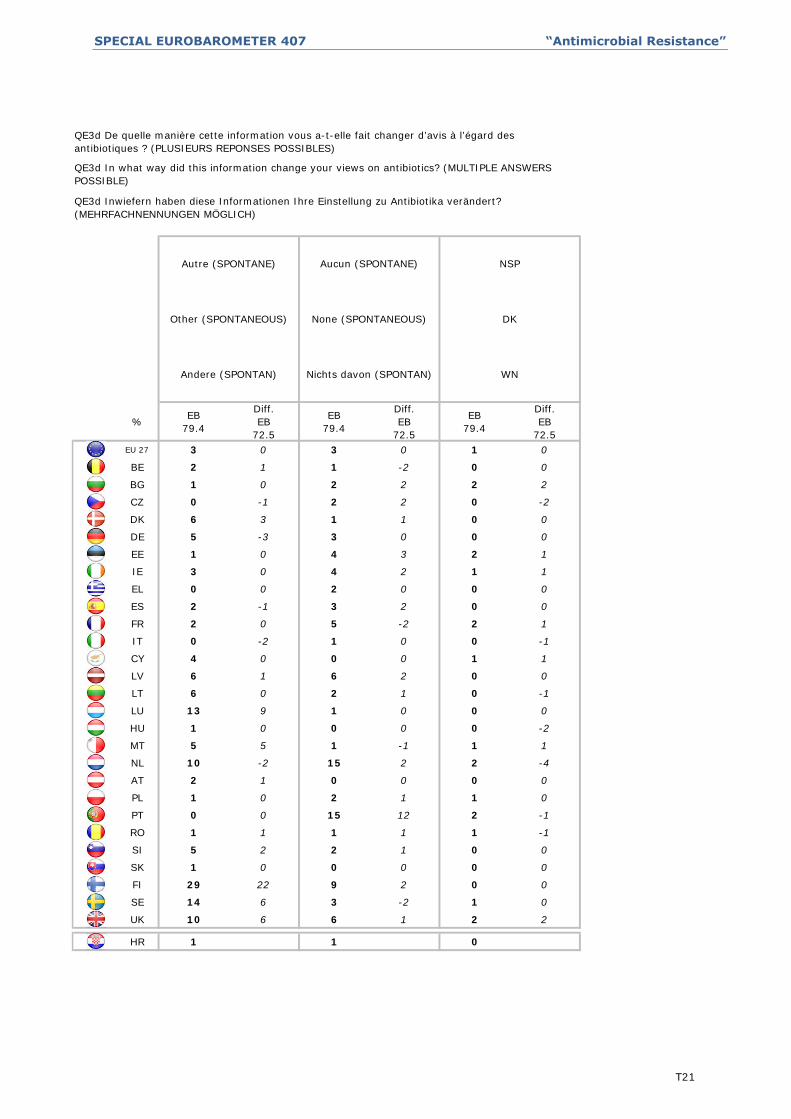
SPECIAL EUROBAROMETER 407 “Antimicrobial Resistance”
%EB
79.4
Diff.
EB
72.5
EB
79.4
Diff.
EB
72.5
EB
79.4
Diff.
EB
72.5
EU 27 3 0 3 0 1 0
BE 2 1 1 -2 0 0
BG 1 0 2 2 2 2
CZ 0 -1 2 2 0 -2
DK 6 3 1 1 0 0
DE 5 -3 3 0 0 0
EE 1 0 4 3 2 1
IE 3 0 4 2 1 1
EL 0 0 2 0 0 0
ES 2 -1 3 2 0 0
FR 2 0 5 -2 2 1
IT 0 -2 1 0 0 -1
CY 4 0 0 0 1 1
LV 6 1 6 2 0 0
LT 6 0 2 1 0 -1
LU 13 9 1 0 0 0
HU 1 0 0 0 0 -2
MT 5 5 1 -1 1 1
NL 10 -2 15 2 2 -4
AT 2 1 0 0 0 0
PL 1 0 2 1 1 0
PT 0 0 15 12 2 -1
RO 1 1 1 1 1 -1
SI 5 2 2 1 0 0
SK 1 0 0 0 0 0
FI 29 22 9 2 0 0
SE 14 6 3 -2 1 0
UK 10 6 6 1 2 2
HR 1 1 0
DK
Andere (SPONTAN) Nichts davon (SPONTAN) WN
Other (SPONTANEOUS) None (SPONTANEOUS)
Autre (SPONTANE) Aucun (SPONTANE) NSP
QE3d De quelle manière cette information vous a-t-elle fait changer d’avis à l’égard des
antibiotiques ? (PLUSIEURS REPONSES POSSIBLES)
QE3d In what way did this information change your views on antibiotics? (MULTIPLE ANSWERS
POSSIBLE)
QE3d Inwiefern haben diese Informationen Ihre Einstellung zu Antibiotika verändert?
(MEHRFACHNENNUNGEN MÖGLICH)
T21

SPECIAL EUROBAROMETER 407 “Antimicrobial Resistance”
%EB
79.4
Diff.
EB
72.5
EB
79.4
Diff.
EB
72.5
EB
79.4
Diff.
EB
72.5
EB
79.4
Diff.
EB
72.5
EB
79.4
Diff.
EB
72.5
EU 27 88 0 13 3 47 5 16 -2 5 0
BE 93 5 10 4 58 11 24 1 4 1
BG 84 -4 15 4 47 7 16 -5 3 -3
CZ 89 -6 16 -1 48 1 21 1 5 0
DK 88 1 14 4 58 6 20 0 1 0
DE 91 0 5 -1 55 7 8 0 2 -1
EE 85 1 18 6 50 9 9 -4 2 -1
IE 84 -5 21 -10 54 -8 14 -7 5 -1
EL 91 1 3 -5 41 11 34 5 7 2
ES 90 -3 11 4 32 4 13 -13 9 -7
FR 91 3 11 2 56 8 22 4 2 -1
IT 86 -3 8 4 30 5 15 -2 8 2
CY 95 -1 11 2 42 9 28 -8 9 -3
LV 82 -1 11 6 37 9 17 7 3 -1
LT 81 -3 2 0 44 -4 12 1 5 -2
LU 91 -4 11 3 50 12 19 3 2 -1
HU 83 -5 12 0 54 8 15 -1 3 -3
MT 93 -2 9 6 39 13 26 6 17 3
NL 82 -1 9 4 66 5 20 -3 4 0
AT 90 -3 13 4 64 7 20 -5 6 -2
PL 84 7 9 -2 33 4 10 0 2 -3
PT 90 0 17 10 38 9 18 -9 6 -2
RO 93 3 29 19 54 7 22 2 7 1
SI 87 2 18 7 60 10 11 0 3 0
SK 86 -5 22 3 58 8 15 3 3 -2
FI 78 -3 28 2 63 10 14 1 3 -2
SE 76 1 33 5 56 -3 21 -1 8 -1
UK 86 -4 22 5 51 4 19 -5 4 2
HR 93 17 38 14 4
Einen ArztEine
KrankenschwesterEinen Apotheker Ein Krankenhaus
Eine andere
Gesundheitseinrichtu
ng
A doctor A nurse A pharmacy A hospitalAnother health care
facility
Un médecin Un infirmier\ Une
infirmièreUne pharmacie Un hôpital
Un autre
établissement de
santé
QE4 Parmi les sources d’information suivantes, laquelle utiliseriez-vous afin d’obtenir des informations fiables sur les
antibiotiques ? ( MAX. 3 REPONSES)
QE4 Which of the following sources of information would you use in order to get trustworthy information on antibiotics? (MAX.
3 ANSWERS)
QE4 Welche der folgenden Quellen würden Sie konsultieren, um sich zuverlässige Informationen über Antibiotika einzuholen?
(MAX. 3 ANTWORTEN)
T22
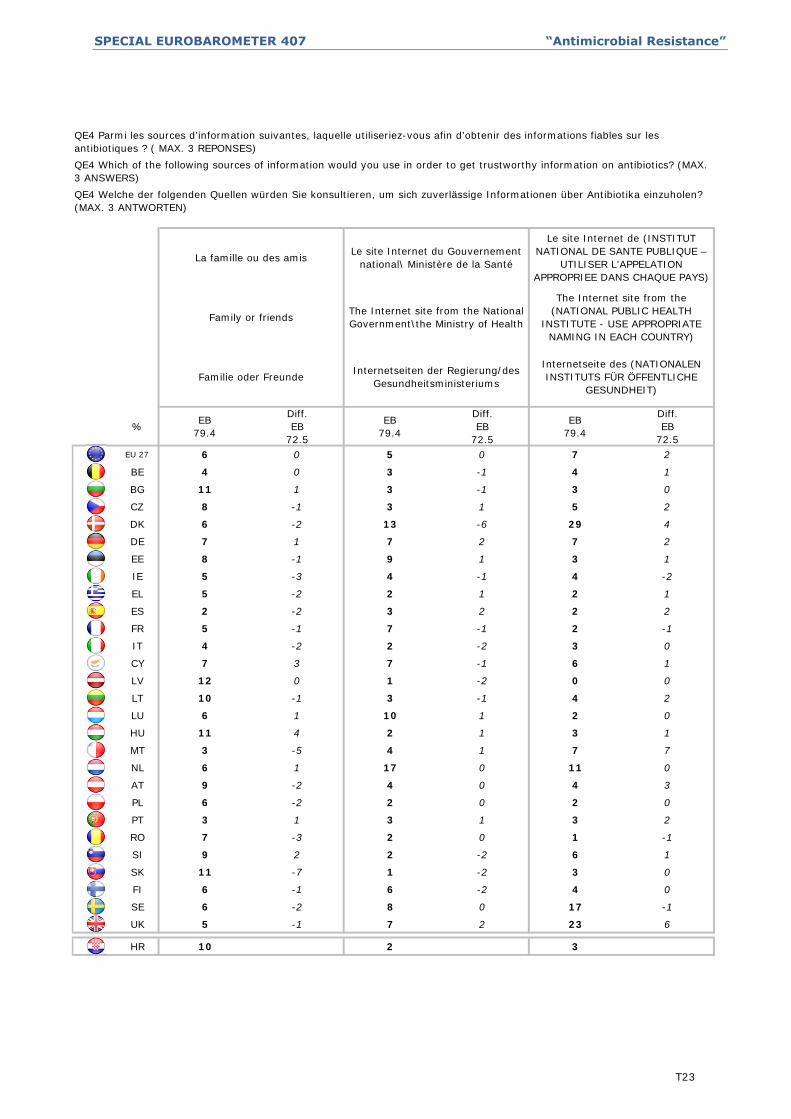
SPECIAL EUROBAROMETER 407 “Antimicrobial Resistance”
%EB
79.4
Diff.
EB
72.5
EB
79.4
Diff.
EB
72.5
EB
79.4
Diff.
EB
72.5
EU 27 6 0 5 0 7 2
BE 4 0 3 -1 4 1
BG 11 1 3 -1 3 0
CZ 8 -1 3 1 5 2
DK 6 -2 13 -6 29 4
DE 7 1 7 2 7 2
EE 8 -1 9 1 3 1
IE 5 -3 4 -1 4 -2
EL 5 -2 2 1 2 1
ES 2 -2 3 2 2 2
FR 5 -1 7 -1 2 -1
IT 4 -2 2 -2 3 0
CY 7 3 7 -1 6 1
LV 12 0 1 -2 0 0
LT 10 -1 3 -1 4 2
LU 6 1 10 1 2 0
HU 11 4 2 1 3 1
MT 3 -5 4 1 7 7
NL 6 1 17 0 11 0
AT 9 -2 4 0 4 3
PL 6 -2 2 0 2 0
PT 3 1 3 1 3 2
RO 7 -3 2 0 1 -1
SI 9 2 2 -2 6 1
SK 11 -7 1 -2 3 0
FI 6 -1 6 -2 4 0
SE 6 -2 8 0 17 -1
UK 5 -1 7 2 23 6
HR 10 2 3
Internetseiten der Regierung/des
Gesundheitsministeriums
Internetseite des (NATIONALEN
INSTITUTS FÜR ÖFFENTLICHE
GESUNDHEIT)
Familie oder Freunde
Family or friendsThe Internet site from the National
Government\the Ministry of Health
The Internet site from the
(NATIONAL PUBLIC HEALTH
INSTITUTE - USE APPROPRIATE
NAMING IN EACH COUNTRY)
La famille ou des amisLe site Internet du Gouvernement
national\ Ministère de la Santé
Le site Internet de (INSTITUT
NATIONAL DE SANTE PUBLIQUE –
UTILISER L’APPELATION
APPROPRIEE DANS CHAQUE PAYS)
QE4 Parmi les sources d’information suivantes, laquelle utiliseriez-vous afin d’obtenir des informations fiables sur les
antibiotiques ? ( MAX. 3 REPONSES)
QE4 Which of the following sources of information would you use in order to get trustworthy information on antibiotics? (MAX.
3 ANSWERS)
QE4 Welche der folgenden Quellen würden Sie konsultieren, um sich zuverlässige Informationen über Antibiotika einzuholen?
(MAX. 3 ANTWORTEN)
T23
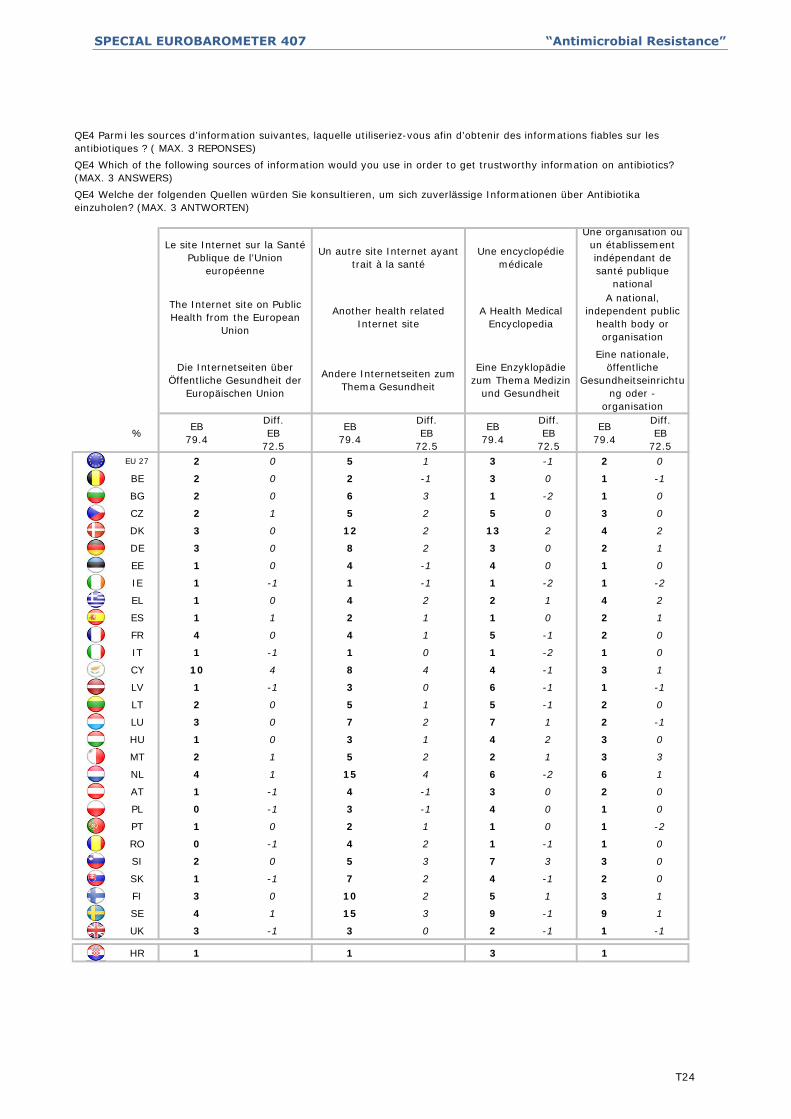
SPECIAL EUROBAROMETER 407 “Antimicrobial Resistance”
%EB
79.4
Diff.
EB
72.5
EB
79.4
Diff.
EB
72.5
EB
79.4
Diff.
EB
72.5
EB
79.4
Diff.
EB
72.5
EU 27 2 0 5 1 3 -1 2 0
BE 2 0 2 -1 3 0 1 -1
BG 2 0 6 3 1 -2 1 0
CZ 2 1 5 2 5 0 3 0
DK 3 0 12 2 13 2 4 2
DE 3 0 8 2 3 0 2 1
EE 1 0 4 -1 4 0 1 0
IE 1 -1 1 -1 1 -2 1 -2
EL 1 0 4 2 2 1 4 2
ES 1 1 2 1 1 0 2 1
FR 4 0 4 1 5 -1 2 0
IT 1 -1 1 0 1 -2 1 0
CY 10 4 8 4 4 -1 3 1
LV 1 -1 3 0 6 -1 1 -1
LT 2 0 5 1 5 -1 2 0
LU 3 0 7 2 7 1 2 -1
HU 1 0 3 1 4 2 3 0
MT 2 1 5 2 2 1 3 3
NL 4 1 15 4 6 -2 6 1
AT 1 -1 4 -1 3 0 2 0
PL 0 -1 3 -1 4 0 1 0
PT 1 0 2 1 1 0 1 -2
RO 0 -1 4 2 1 -1 1 0
SI 2 0 5 3 7 3 3 0
SK 1 -1 7 2 4 -1 2 0
FI 3 0 10 2 5 1 3 1
SE 4 1 15 3 9 -1 9 1
UK 3 -1 3 0 2 -1 1 -1
HR 1 1 3 1
Die Internetseiten über
Öffentliche Gesundheit der
Europäischen Union
Andere Internetseiten zum
Thema Gesundheit
Eine Enzyklopädie
zum Thema Medizin
und Gesundheit
Eine nationale,
öffentliche
Gesundheitseinrichtu
ng oder -
organisation
The Internet site on Public
Health from the European
Union
Another health related
Internet site
A Health Medical
Encyclopedia
A national,
independent public
health body or
organisation
Le site Internet sur la Santé
Publique de l’Union
européenne
Un autre site Internet ayant
trait à la santé
Une encyclopédie
médicale
Une organisation ou
un établissement
indépendant de
santé publique
national
QE4 Parmi les sources d’information suivantes, laquelle utiliseriez-vous afin d’obtenir des informations fiables sur les
antibiotiques ? ( MAX. 3 REPONSES)
QE4 Which of the following sources of information would you use in order to get trustworthy information on antibiotics?
(MAX. 3 ANSWERS)
QE4 Welche der folgenden Quellen würden Sie konsultieren, um sich zuverlässige Informationen über Antibiotika
einzuholen? (MAX. 3 ANTWORTEN)
T24
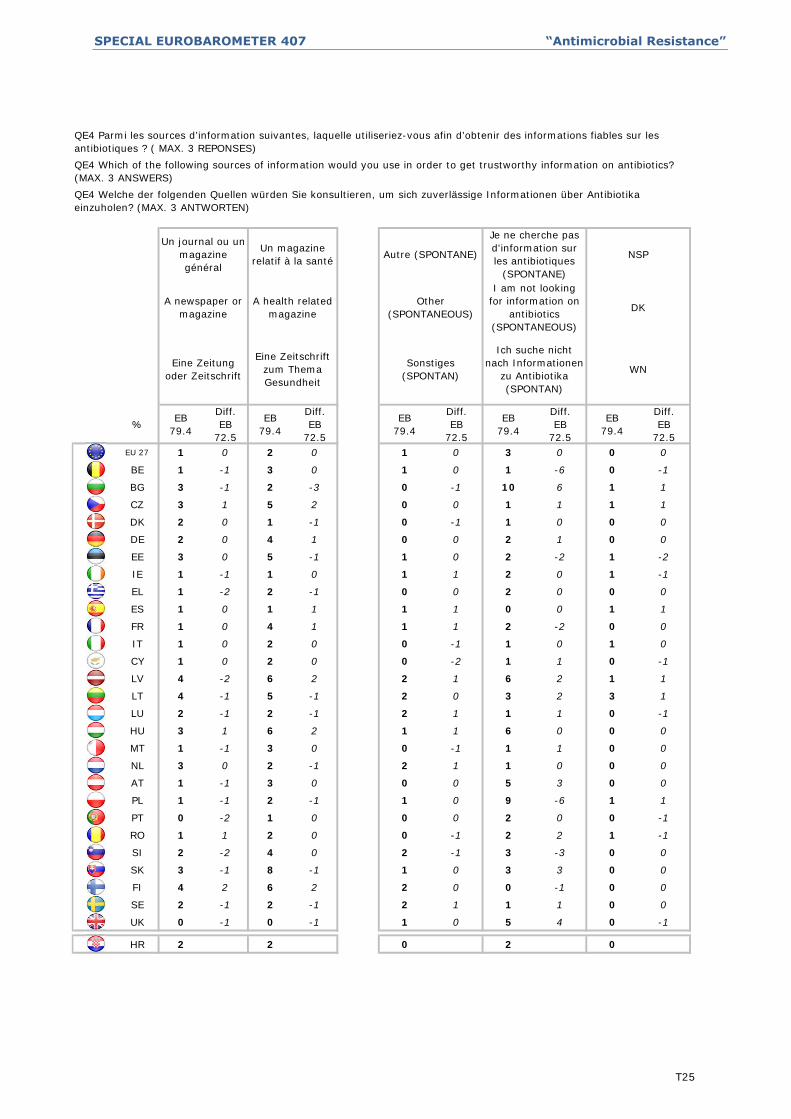
SPECIAL EUROBAROMETER 407 “Antimicrobial Resistance”
%EB
79.4
Diff.
EB
72.5
EB
79.4
Diff.
EB
72.5
EB
79.4
Diff.
EB
72.5
EB
79.4
Diff.
EB
72.5
EB
79.4
Diff.
EB
72.5
EU 27 1 0 2 0 1 0 3 0 0 0
BE 1 -1 3 0 1 0 1 -6 0 -1
BG 3 -1 2 -3 0 -1 10 6 1 1
CZ 3 1 5 2 0 0 1 1 1 1
DK 2 0 1 -1 0 -1 1 0 0 0
DE 2 0 4 1 0 0 2 1 0 0
EE 3 0 5 -1 1 0 2 -2 1 -2
IE 1 -1 1 0 1 1 2 0 1 -1
EL 1 -2 2 -1 0 0 2 0 0 0
ES 1 0 1 1 1 1 0 0 1 1
FR 1 0 4 1 1 1 2 -2 0 0
IT 1 0 2 0 0 -1 1 0 1 0
CY 1 0 2 0 0 -2 1 1 0 -1
LV 4 -2 6 2 2 1 6 2 1 1
LT 4 -1 5 -1 2 0 3 2 3 1
LU 2 -1 2 -1 2 1 1 1 0 -1
HU 3 1 6 2 1 1 6 0 0 0
MT 1 -1 3 0 0 -1 1 1 0 0
NL 3 0 2 -1 2 1 1 0 0 0
AT 1 -1 3 0 0 0 5 3 0 0
PL 1 -1 2 -1 1 0 9 -6 1 1
PT 0 -2 1 0 0 0 2 0 0 -1
RO 1 1 2 0 0 -1 2 2 1 -1
SI 2 -2 4 0 2 -1 3 -3 0 0
SK 3 -1 8 -1 1 0 3 3 0 0
FI 4 2 6 2 2 0 0 -1 0 0
SE 2 -1 2 -1 2 1 1 1 0 0
UK 0 -1 0 -1 1 0 5 4 0 -1
HR 2 2 0 2 0
WNEine Zeitung
oder Zeitschrift
Eine Zeitschrift
zum Thema
Gesundheit
Sonstiges
(SPONTAN)
Ich suche nicht
nach Informationen
zu Antibiotika
(SPONTAN)
A health related
magazine
Other
(SPONTANEOUS)
I am not looking
for information on
antibiotics
(SPONTANEOUS)
DK
NSP
A newspaper or
magazine
Un journal ou un
magazine
général
Un magazine
relatif à la santéAutre (SPONTANE)
Je ne cherche pas
d'information sur
les antibiotiques
(SPONTANE)
QE4 Parmi les sources d’information suivantes, laquelle utiliseriez-vous afin d’obtenir des informations fiables sur les
antibiotiques ? ( MAX. 3 REPONSES)
QE4 Which of the following sources of information would you use in order to get trustworthy information on antibiotics?
(MAX. 3 ANSWERS)
QE4 Welche der folgenden Quellen würden Sie konsultieren, um sich zuverlässige Informationen über Antibiotika
einzuholen? (MAX. 3 ANTWORTEN)
T25
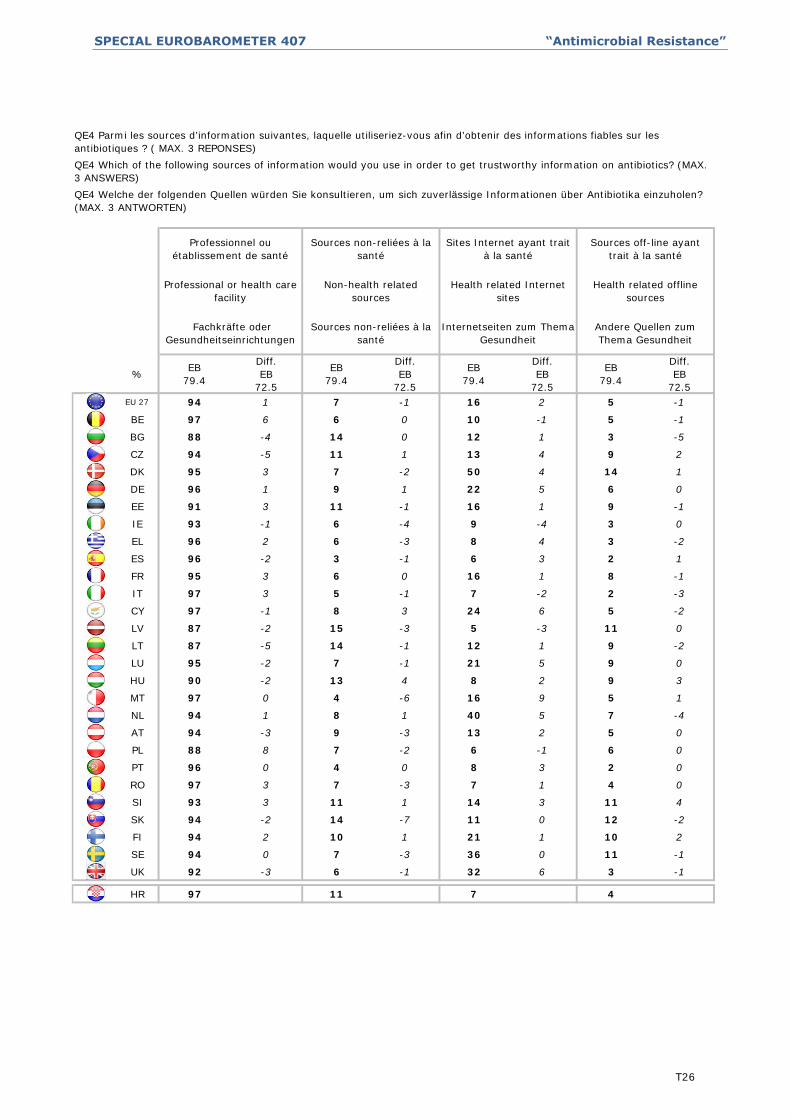
SPECIAL EUROBAROMETER 407 “Antimicrobial Resistance”
%EB
79.4
Diff.
EB
72.5
EB
79.4
Diff.
EB
72.5
EB
79.4
Diff.
EB
72.5
EB
79.4
Diff.
EB
72.5
EU 27 94 1 7 -1 16 2 5 -1
BE 97 6 6 0 10 -1 5 -1
BG 88 -4 14 0 12 1 3 -5
CZ 94 -5 11 1 13 4 9 2
DK 95 3 7 -2 50 4 14 1
DE 96 1 9 1 22 5 6 0
EE 91 3 11 -1 16 1 9 -1
IE 93 -1 6 -4 9 -4 3 0
EL 96 2 6 -3 8 4 3 -2
ES 96 -2 3 -1 6 3 2 1
FR 95 3 6 0 16 1 8 -1
IT 97 3 5 -1 7 -2 2 -3
CY 97 -1 8 3 24 6 5 -2
LV 87 -2 15 -3 5 -3 11 0
LT 87 -5 14 -1 12 1 9 -2
LU 95 -2 7 -1 21 5 9 0
HU 90 -2 13 4 8 2 9 3
MT 97 0 4 -6 16 9 5 1
NL 94 1 8 1 40 5 7 -4
AT 94 -3 9 -3 13 2 5 0
PL 88 8 7 -2 6 -1 6 0
PT 96 0 4 0 8 3 2 0
RO 97 3 7 -3 7 1 4 0
SI 93 3 11 1 14 3 11 4
SK 94 -2 14 -7 11 0 12 -2
FI 94 2 10 1 21 1 10 2
SE 94 0 7 -3 36 0 11 -1
UK 92 -3 6 -1 32 6 3 -1
HR 97 11 7 4
Sources non-reliées à la
santé
Internetseiten zum Thema
Gesundheit
Andere Quellen zum
Thema Gesundheit
Fachkräfte oder
Gesundheitseinrichtungen
Sources off-line ayant
trait à la santé
Professional or health care
facility
Non-health related
sources
Health related Internet
sites
Health related offline
sources
Professionnel ou
établissement de santé
Sources non-reliées à la
santé
Sites Internet ayant trait
à la santé
QE4 Parmi les sources d’information suivantes, laquelle utiliseriez-vous afin d’obtenir des informations fiables sur les
antibiotiques ? ( MAX. 3 REPONSES)
QE4 Which of the following sources of information would you use in order to get trustworthy information on antibiotics? (MAX.
3 ANSWERS)
QE4 Welche der folgenden Quellen würden Sie konsultieren, um sich zuverlässige Informationen über Antibiotika einzuholen?
(MAX. 3 ANTWORTEN)
T26