spea2: improving the strength pareto evolutionary algorithm · the strength pareto evolutionary...
TRANSCRIPT

SPEA2: Improving the Strength ParetoEvolutionary Algorithm
Eckart Zitzler, Marco Laumanns, and Lothar ThieleComputer Engineering and Networks Laboratory (TIK)
Department of Electrical EngineeringSwiss Federal Institute of Technology (ETH) Zurich
ETH Zentrum, Gloriastrasse 35, CH-8092 Zurich, Switzerland{zitzler,laumanns,thiele }@tik.ee.ethz.ch
TIK-Report 103
May 2001(Errata added Sept 27, 2001)
Abstract
The Strength Pareto Evolutionary Algorithm (SPEA) (Zitzler and Thiele 1999)is a relatively recent technique for finding or approximating the Pareto-optimal setfor multiobjective optimization problems. In different studies (Zitzler and Thiele1999; Zitzler, Deb, and Thiele 2000) SPEA has shown very good performance incomparison to other multiobjective evolutionary algorithms, and therefore it hasbeen a point of reference in various recent investigations, e.g., (Corne, Knowles,and Oates 2000). Furthermore, it has been used in different applications, e.g., (La-hanas, Milickovic, Baltas, and Zamboglou 2001). In this paper, an improved ver-sion, namely SPEA2, is proposed, which incorporates in contrast to its predecessora fine-grained fitness assignment strategy, a density estimation technique, and anenhanced archive truncation method. The comparison of SPEA2 with SPEA andtwo other modern elitist methods, PESA and NSGA-II, on different test problemsyields promising results.
1 Introduction
After the first studies on evolutionary multiobjective optimization (EMO) in the mid-1980s, a number of Pareto-based techniques were proposed in 1993 and 1994, e.g.,MOGA (Fonseca and Fleming 1993), NPGA (Horn, Nafpliotis, and Goldberg 1994),and NSGA (Srinivas and Deb 1994), which demonstrated the capability of EMO algo-rithms to approximate the set of optimal trade-offs in a single optimization run. Theseapproaches did not incorporate elitism explicitly, but a few years later the importance
1

of this concept in multiobjective search was recognized and supported experimentally(Parks and Miller 1998; Zitzler, Deb, and Thiele 2000). A couple of elitist multi-objective evolutionary algorithms were presented at this time, e.g., SPEA (Zitzler andThiele 1998; Zitzler and Thiele 1999) and PAES (Knowles and Corne 1999). SPEA, anacronym for Strength Pareto Evolutionary Algorithm, was among the first techniquesthat were extensively compared to several existing evolution-based methods (Zitzlerand Thiele 1999; Zitzler, Deb, and Thiele 2000). As it clearly outperformed the (non-elitist) alternative approaches under consideration, it has been used as a point of refer-ence by various researchers, e.g., (Corne, Knowles, and Oates 2000; Jaszkiewicz 2000;Tan, Lee, and Khor 2001). Meanwhile further progress has been made and recentlyproposed methods, for instance NSGA-II (Deb, Agrawal, Pratap, and Meyarivan 2000)and PESA (Corne, Knowles, and Oates 2000), were shown to outperform SPEA oncertain test problems. Furthermore, new insights into the behavior of EMO algorithmsimproved our knowledge about the basic principles and the main factors of success inEMO (Laumanns, Zitzler, and Thiele 2000; Laumanns, Zitzler, and Thiele 2001).
In this paper, SPEA2 is presented, for which we tried to eliminate the potentialweaknesses of its predecessor and to incorporate most recent results in order to de-sign a powerful and up-to-date EMO algorithm. The main differences of SPEA2 incomparison to SPEA are:
• An improved fitness assignment scheme is used, which takes for each individualinto account how many individuals it dominates and it is dominated by.
• A nearest neighbor density estimation technique is incorporated which allows amore precise guidance of the search process.
• A new archive truncation methods guarantees the preservation of boundary so-lutions.
As will be shown in this study, the proposed algorithm provides good performance interms of convergence and diversity, outperforms SPEA, and compares well to PESAand NSGA-II on various, well-known test problems.
2 Background
2.1 Issues in Evolutionary Multiobjective Optimization
The approximation of the Pareto-optimal set involves itself two (possibly conflicting)objectives: the distance to the optimal front is to be minimized and the diversity of thegenerated solutions is to be maximized (in terms of objective or parameter values). Inthis context, there are two fundamental issues when designing a multiobjective evo-lutionary algorithm: mating selection and environmental selection. The first issue isdirectly related to the question of how to guide the search towards the Pareto-optimalfront. Given a pool of individuals, fitness values have to be assigned on the basis ofwhich individuals for offspring production are selected. The procedure to fill the mat-ing pool is usually randomized. The second issue addresses the question of which
2

individuals to keep during the evolution process. Due to limited time and storage re-sources, only a certain fraction of the individuals in a specific generation can be copiedto the pool of the next generation. It is common practice to use a deterministic selectionhere.
In most modern EMO algorithms these two concepts are realized in the followingway although the details may be different:
Environmental selection: Besides the population, an archive is maintained whichcontains a representation of the nondominated front among all solutions con-sidered so far. A member of the archive is only removed if i) a solution has beenfound that dominates it or ii) the maximum archive size is exceeded and the por-tion of the front where the archive member is located is overcrowded. Usually,being copied to the archive is the only way how an individual can survive sev-eral generations in addition to pure reproduction which may occur by chance.This technique is incorporated in order not to lose certain portions of the currentnondominated front due to random effects.
Mating selection: The pool of individuals at each generation is evaluated in a twostage process. First all individuals are compared on the basis of the Pareto dom-inance relation, which defines a partial order on this multi-set. Basically, theinformation which individuals each individual dominates, is dominated by or isindifferent to is used to define a ranking on the generation pool. Afterwards,this ranking is refined by the incorporation of density information. Various den-sity estimation techniques are used to measure the size of the niche in which aspecific individual is located.
In principle, both selection schemes are completely independent from each other. Thus,the first may be Pareto-based while the second can use the weighting approach to cal-culate fitness values. However, with many evolutionary methods both concepts areimplemented similarly as will be illustrated on the basis of two recent EMO methods.
In PESA (Pareto Envelope-Based Selection Algorithm) (Corne, Knowles, and Oates2000), for instance, mating selection is only performed on the archive which stores(a subset of) the current nondominated set. A particular density measure which canbe classified as a histogram technique, allows to sample the archive members differ-ently according to the degree of crowding. The generated children, which constitutethe actual population, are then checked for inclusion into the archive (as describedabove). Those individuals which did not enter the archive are removed finally beforethe next generational cycle starts. With this approach, mating and environmental selec-tion are identical regarding the selection criteria (member of the current nondominatedfront, crowding measure) and only differ with respect to the selection process (random-ized versus deterministic). The same holds for another promising algorithm, NSGA-II(Nondominated Sorting Genetic Algorithm) (Deb, Agrawal, Pratap, and Meyarivan2000). Here, the pool of individuals is first split into different fronts according to theconcept of Pareto dominance. Individuals belonging to the first nondominated frontare assigned highest rank, those in the second nondominated front the second highestrank and so forth. Within each rank, a specific crowding measure, which represents thesum of distances to the two closest individuals along each objective, is used to define
3

an order among the individuals. On the basis of this ranking both environmental andmating selection are performed. By combining parent population (which can actuallybe regarded as the archive) and offspring population and then deleting the worst50%,the pool of individuals is truncated. Afterwards binary tournaments are carried out onthe remaining individuals (the archive members) in order to generate the next offspringpopulation. Note that the archive may not only contain nondominated individuals butalso dominated ones in contrast to PESA; with NSGA-II the archive is always filledcompletely, while with PESA it may be filled only partially.
2.2 The Strength Pareto Evolutionary Algorithm
As SPEA (Strength Pareto Evolutionary Algorithm) (Zitzler and Thiele 1999) formsthe basis for SPEA2, we give a brief summary of the algorithm here. For a moredetailed description the interested reader is referred to (Zitzler 1999).
SPEA uses a regular population and an archive (external set). Starting with aninitial population and an empty archive the following steps are performed per iteration.First, all nondominated population members are copied to the archive; any dominatedindividuals or duplicates (regarding the objective values) are removed from the archiveduring this update operation. If the size of the updated archive exceeds a predefinedlimit, further archive members are deleted by a clustering technique which preservesthe characteristics of the nondominated front. Afterwards, fitness values are assignedto both archive and population members:
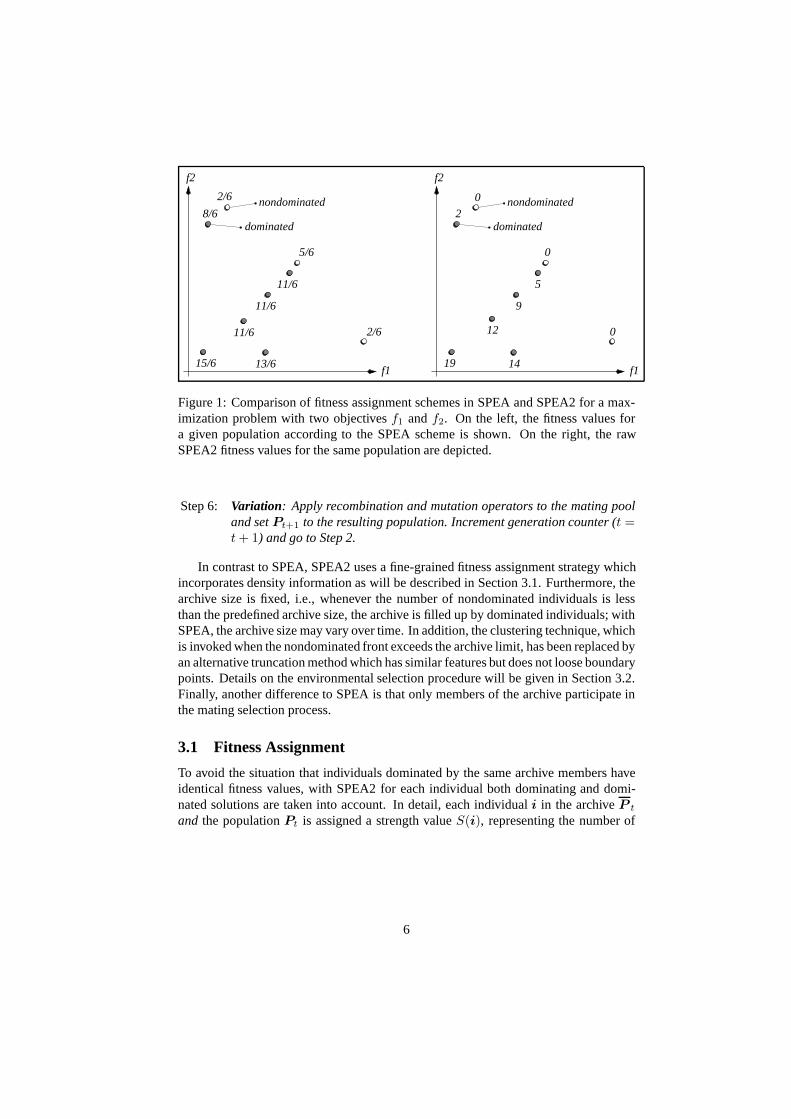
• Each individuali in the archive is assigned a strength valueS(i) ∈ [0, 1), whichat the same time represents its fitness valueF (i). S(i) is the number of popula-tion membersj that are dominated by or equal toi with respect to the objectivevalues, divided by the population size plus one.
• The fitnessF (j) of an individualj in the population is calculated by summingthe strength valuesS(i) of all archive membersi that dominate or are equal toj, and adding one at the end.
The next step represents the mating selection phase where individuals from the unionof population and archive are selected by means of binary tournaments. Please notethat fitness is to be minimized here, i.e., each individual in the archive has a higherchance to be selected than any population member. Finally, after recombination andmutation the old population is replaced by the resulting offspring population.
Although SPEA performed well in different comparative studies (Zitzler and Thiele1999; Zitzler, Deb, and Thiele 2000), there is still room for improvement as recentstudies (Corne, Knowles, and Oates 2000; Deb, Agrawal, Pratap, and Meyarivan 2000)have shown. In particular, we have identified the following issues as potential weak-nesses of SPEA:
Fitness assignment:Individuals that are dominated by the same archive membershave identical fitness values. That means in the case when the archive containsonly a single individual, all population members have the same rank independentof whether they dominate each other or not. As a consequence, the selection
4

pressure is decreased substantially and in this particular case SPEA behaves likea random search algorithm.
Density estimation: If many individuals of the current generation are indifferent, i.e.,do not dominate each other, none or very little information can be obtained onthe basis of the partial order defined by the dominance relation. In this situation,which is very likely to occur in the presence of more than two objectives, densityinformation has to be used in order to guide the search more effectively. Cluster-ing makes use of this information, but only with regard to the archive and not tothe population.
Archive truncation: Although the clustering technique used in SPEA is able to reducethe nondominated set without destroying its characteristics, it may lose outersolutions. However, these solutions should be kept in the archive in order toobtain a good spread of nondominated solutions.
In the next section we will address these issues and describe the improved algorithm,which we call SPEA2, in detail.
3 The SPEA2 Algorithm
SPEA2 was designed to overcome the aforementioned problems. The overall algorithmis as follows:
Algorithm 1 (SPEA2 Main Loop)
Input: N (population size)N (archive size)T (maximum number of generations)
Output: A (nondominated set)
Step 1: Initialization : Generate an initial populationP0 and create the empty archive(external set)P 0 = ∅. Sett = 0.
Step 2: Fitness assignment: Calculate fitness values of individuals inP t and P t
(cf. Section 3.1).
Step 3: Environmental selection: Copy all nondominated individuals inP t andP t
to P t+1. If size ofP t+1 exceedsN then reduceP t+1 by means of thetruncation operator, otherwise if size ofP t+1 is less thanN then fill P t+1
with dominated individuals inP t andP t (cf. Section 3.2).
Step 4: Termination: If t ≥ T or another stopping criterion is satisfied then setAto the set of decision vectors represented by the nondominated individuals inP t+1. Stop.
Step 5: Mating selection: Perform binary tournament selection with replacement onP t+1 in order to fill the mating pool.
5
0
0
dominated
nondominated
dominated
5/6
nondominated2/6
8/6
15/6
2/6
11/6
12
1413/6
11/6
11/6
2
9
5
0
19f1
f2
f1
f2
Figure 1: Comparison of fitness assignment schemes in SPEA and SPEA2 for a max-imization problem with two objectivesf1 andf2. On the left, the fitness values fora given population according to the SPEA scheme is shown. On the right, the rawSPEA2 fitness values for the same population are depicted.
Step 6: Variation: Apply recombination and mutation operators to the mating pooland setPt+1 to the resulting population. Increment generation counter (t =t + 1) and go to Step 2.
In contrast to SPEA, SPEA2 uses a fine-grained fitness assignment strategy whichincorporates density information as will be described in Section 3.1. Furthermore, thearchive size is fixed, i.e., whenever the number of nondominated individuals is lessthan the predefined archive size, the archive is filled up by dominated individuals; withSPEA, the archive size may vary over time. In addition, the clustering technique, whichis invoked when the nondominated front exceeds the archive limit, has been replaced byan alternative truncation method which has similar features but does not loose boundarypoints. Details on the environmental selection procedure will be given in Section 3.2.Finally, another difference to SPEA is that only members of the archive participate inthe mating selection process.
3.1 Fitness Assignment
To avoid the situation that individuals dominated by the same archive members haveidentical fitness values, with SPEA2 for each individual both dominating and domi-nated solutions are taken into account. In detail, each individuali in the archiveP t
and the populationPt is assigned a strength valueS(i), representing the number of
6

solutions it dominates:1
S(i) = |{j | j ∈ Pt + P t ∧ i � j}|
where| · | denotes the cardinality of a set,+ stands for multiset union and the symbol� corresponds to the Pareto dominance relation. On the basis of theS values, the rawfitnessR(i) of an individuali is calculated:
R(i) =∑
j∈Pt+P t,j�i
S(j)
That is the raw fitness is determined by the strengths of its dominators in both archiveand population, as opposed to SPEA where only archive members are considered inthis context. It is important to note that fitness is to be minimized here, i.e.,R(i) =0 corresponds to a nondominated individual, while a highR(i) value means thatiis dominated by many individuals (which in turn dominate many individuals). Thisscheme is illustrated in Figure 1.
Although the raw fitness assignment provides a sort of niching mechanism based onthe concept of Pareto dominance, it may fail when most individuals do not dominateeach other. Therefore, additional density information is incorporated to discriminatebetween individuals having identical raw fitness values. The density estimation tech-nique used in SPEA2 is an adaptation of thek-th nearest neighbor method (Silverman1986), where the density at any point is a (decreasing) function of the distance to thek-th nearest data point. Here, we simply take the inverse of the distance to thek-thnearest neighbor as the density estimate. To be more precise, for each individuali thedistances (in objective space) to all individualsj in archive and population are calcu-lated and stored in a list. After sorting the list in increasing order, thek-th elementgives the distance sought, denoted asσk
i . As a common setting, we usek equal to the
square root of the sample size (Silverman 1986), thus,k =√
N + N . Afterwards, thedensityD(i) corresponding toi is defined by
D(i) =1
σki + 2
In the denominator, two is added to ensure that its value is greater than zero andthatD(i) < 1. Finally, addingD(i) to the raw fitness valueR(i) of an individualiyields its fitnessF (i):
F (i) = R(i) + D(i)
The run-time of the fitness assignment procedure is dominated by the density es-timator (O(M2 log M)), while the calculation of theS andR values is of complexityO(M2), whereM = N + N .
1This (and the following) formula slightly differs from the one presented in (Bleuler, Brack, Thiele, andZitzler 2001), where also individuals which have identical objective values contribute to the strength of anindividual.
7
3.2 Environmental Selection
The archive update operation (Step 3 in Algorithm 1) in SPEA2 differs from the one inSPEA in two respects: i) the number of individuals contained in the archive is constantover time, and ii) the truncation method prevents boundary solutions being removed.
During environmental selection, the first step is to copy all nondominated individ-uals, i.e., those which have a fitness lower than one, from archive and population to thearchive of the next generation:
P t+1 = {i | i ∈ Pt + P t ∧ F (i) < 1}
If the nondominated front fits exactly into the archive (|P t+1| = N ) the environmentalselection step is completed. Otherwise, there can be two situations: Either the archiveis too small (|P t+1| < N ) or too large (|P t+1| > N ). In the first case, the bestN −|P t+1| dominated individuals in the previous archive and population are copied tothe new archive. This can be implemented by sorting the multisetPt + P t accordingto the fitness values and copy the firstN − |P t+1| individualsi with F (i) ≥ 1 fromthe resulting ordered list toP t+1. In the second case, when the size of the currentnondominated (multi)set exceedsN , an archive truncation procedure is invoked whichiteratively removes individuals fromP t+1 until |P t+1| = N . Here, at each iterationthat individuali is chosen for removal for whichi ≤d j for all j ∈ P t+1 with
i ≤d j :⇔ ∀ 0 < k < |P t+1| : σki = σk
j ∨∃ 0 < k < |P t+1| :
[(∀ 0 < l < k : σl
i = σlj
)∧ σk
i < σkj
]whereσk
i denotes the distance ofi to its k-th nearest neighbor inP t+1. In otherwords, the individual which has the minimum distance to another individual is chosenat each stage; if there are several individuals with minimum distance the tie is broken byconsidering the second smallest distances and so forth. How this truncation techniqueworks is illustrated in Figure 2.
Although, the worst run-time complexity of the truncation operator isO(M3)(M = N + N )2, on average the complexity will be lower (O(M2 log M)) as indi-viduals usually differ with regard to the second or third nearest neighbor, and thus thesorting of the distances governs the overall complexity.
4 Experimental Design
The behavior of SPEA2 is compared to SPEA, NSGA-II and PESA on a number oftest functions. The algorithms are implemented according to their description in theliterature. As the main feature under concern is the fitness assignment and the selectionprocesses, our implementation only differ in these respects, where the other operators(recombination, mutation, sampling) remain identical. For each algorithm we usedidentical population and archive sizes.
2Constructing for each individual the list of distances to all other individual takesO(M2), sorting alldistance lists is of complexityO(M2 log M), choosing an individual for removal can be done inO(M2)time, and updating the remaining distance lists after removal of an individual can be done in timeO(M) (oreven omitted with appropriate data structures).
8

3
2
1
f1
f2
f1
f2
Figure 2: Illustration of the archive truncation method used in SPEA2. On the right, anondominated set is shown. On the left, it is depicted which solutions are removed inwhich order by the truncate operator (assuming thatN = 5).
4.1 Test Problems and representation of solutions
The test functions are summarized in Tab. 1, where both combinatorial and continuousproblems were chosen.
As combinatorial problems three instances of the knapsack problem were takenfrom (Zitzler and Thiele 1999), each with750 items and2, 3, and4 objectives, respec-tively. For the random choice of the profit and weight values as well as the constrainthandling technique we refer to the original study. The individuals are represented asbit strings, where each bit corresponds to one decision variable. Recombination of twoindividuals is performed by one-point crossover. Point mutations are used where eachbit is flipped with a probability of0.006, this value is taken using the guidelines derivedin (Laumanns, Zitzler, and Thiele 2001). The population size and the archive size wereset to250 for m = 2, to 300 for m = 3, and to400 for m = 4.
In the continuous test functions different problems difficulties arise, for a discussionwe refer to (Veldhuizen 1999). Here, we enhanced the difficulty of each problem bytaking 100 decision variables in each case. For the Sphere Model (SPH-m) and forKursawe’s function (KUR) we also chose large domains in order to test the algorithms’ability to locate the Pareto-optimal set in a large objective space. For all continuousproblems, the individuals are coded as real vectors, where the SBX-20 operator is usedfor recombination and a polynomial distribution for mutation (Deb and Agrawal 1995).Furthermore, the population size and the archive size were set to100.
The function SPH-m is a multi-objective generalization of the Sphere Model, asymmetric unimodal function where the isosurfaces are given by hyperspheres. TheSphere Model has been subject to intensive theoretical and empirical investigationswith evolution strategies, especially in the context of self-adaptation. In a multi-objective environment a two-variable version of it was used for empirical evaluationof VEGA (Schaffer 1985), while in (Rudolph 1998) it was used for theoretical con-
9

n Domain Objective functionsTypeSPH-m (Schaffer 1985; Laumanns, Rudolph, and Schwefel 2001)
100 [−103, 103]n fj(x) =∑
1≤i≤n,i6=j(xi)2 + (xj − 1)2
min 1 ≤ j ≤ m, m = 2, 3
ZDT6 (Zitzler, Deb, and Thiele 2000)
100 [0, 1]n f1(x) = 1 − exp(−4x1) sin6(6πx1)min f2(x) = g(x)
[1 − (f1(x)/g(x))2
]g(x) = 1 + (n − 1) · ((
∑mi=2 xi)/(m − 1))0.25
QV (Quagliarella and Vicini 1997)
100 [−5, 5]n f1(x) = ( 1n
∑ni=1(x
2i − 10 cos(2πxi) + 10))
14
min f2(x) = ( 1n
∑ni=1((xi − 1.5)2 − 10 cos(2π(xi − 1.5)) + 10))
14
KUR (Kursawe 1991)
100 [−103, 103]n f1(x) =∑n−1
i=1 (−10e−0.2√
x2i +x2
i+1)min f2(x) =
∑ni=1(|xi|0.8 + sin3(xi)
KP-750-m (Zitzler and Thiele 1999)
750 {0, 1}n fj(x) =∑n
i=1 xi · pi,j
max s.t.gj(x) =
∑ni=1 xi · wi,j ≤ Wj
pi,j (profit values) andwi,j (weight values) randomly chosen1 ≤ j ≤ m, m = 2, 3, 4
Table 1: Test problems used in this study. The objective functions are given byfj, 1 ≤ j ≤ m, wherem denotes the number of objectives andn the number ofdecision variables. The type of the objectives is given in the left column (minimizationor maximization).
vergence analysis. Here, a two (SPH-2) and a three (SPH-3) objective instance areconsidered.
Zitzler, Deb, and Thiele’sT6 (Zitzler, Deb, and Thiele 1999), here referred to asZDT6, is also unimodal and has a non-uniformly distributed objective space, both or-
10

thogonal and lateral to the Pareto-optimal front. It has been proposed to test the algo-rithms’ ability to find a good distribution of points even in this case.
The components of the function QV are two multi-modal functions of Rastrigin’stype. Here, we employ the version of (Quagliarella and Vicini 1997), where the maindifficulty besides the multi-modality is the extreme concave Pareto-optimal front, to-gether with a diminishing density of solutions towards the extreme points.
Kursawe’s function (Kursawe 1991) finally has a multi-modal function in one com-ponent and pair-wise interactions among the variables in the other component. ThePareto-optimal front is not connected and has an isolated point as well as concave andconvex regions.
4.2 Performance assessment
For each algorithm and each problem,30 runs with different random seeds have beencarried out. For the quality or performance measure we apply a volume-based approachaccording to (Zitzler and Thiele 1999) with slight modifications. Here, a referencevolume between the origin and an utopia point – defined by the profit sums of all itemsin each objective – is taken into account. The aim is to minimize the fraction of thatspace, which is not dominated by any of the final archive members. We consider thisas the most appropriate scalar indicator since it combines both the distance of solutions(towards some utopian trade-off surface) and the spread of solutions. For each run, wemeasure the (normalized) size of the nondominated objective space over time, whichleads to a sample of30 values for each time step in each experiment.
5 Results and Discussion
5.1 Continuous Test Problems
The Multi-objective Sphere Model The problem an algorithm faces on this functionis to first locate the region of the Pareto-optimal set, which – dependent on the decisionvariable ranges – might form a tiny region in the search space. In proceeding to thisregion, a linear convergence order is desirable, as in the single-objective case. Nearthe Pareto-optimal front, the precision must be adjusted to approximate it properly,while in addition it becomes more and more difficult to proceed since the success ratedecreases very quickly (see (Laumanns, Rudolph, and Schwefel 2001)).
The results are depicted in Fig. 3. In both cases SPEA fails to converge to the vicin-ity of the Pareto-optimal front. This is certainly due to the fitness assignment strategy(see Section 2.2): Far away from the Pareto-optimal front, almost all individuals forma chain in the objective space. The archive consists of only one individual, which dom-inates all others giving all of them the same fitness value and hence the same selectionprobability.
The plots suggest that the other three algorithms indeed exhibit linear order con-vergence in the first, quasi-single-objective phase. Here, PESA is faster than the othertwo candidates in locating the Pareto-optimal set in the first part of the runs. This oc-curs probably due to a higher elitism intensity, since in this stage the archive mostly
11

1e-09
1e-08
1e-07
1e-06
1e-05
0.0001
0.001
0.01
0.1
1
0 200000 400000 600000 800000 1e+06
non-
dom
inat
ed o
bjec
tive
spac
e
objective function evaluations
"NSGA2""PESA""SPEA"
"SPEA2"
nsga2 pesa spea spea2
-9.3
-9.1
-8.9
-8.7
-8.5
1e-09
1e-08
1e-07
1e-06
1e-05
0.0001
0.001
0.01
0.1
1
0 200000 400000 600000 800000 1e+06
non-
dom
inat
ed o
bjec
tive
spac
e
objective function evaluations
"NSGA2""PESA""SPEA"
"SPEA2"
nsga2 pesa spea spea2
-8.6
-8.4
-8.2
-8.0
-7.8
Figure 3: Performance values for SPH-2 (top) and SPH-3 (bottom). The graphs showthe average values of30 runs for each algorithm over time (left), and the box-plotsrepresent the distributions of the30 values at the end of the runs (right).
consists of only a few points. Close to the Pareto-optimal front, SPEA2 and NSGA-IIovertake PESA with regard to the average performance measure. The boxplots of thefinal performance values show SPEA2 slightly ahead of NSGA-II form = 2, whileNSGA-II seems to achieve better values form = 3. This might be due to NSGA-II’semphasizing the boundary solutions of the current nondominated set, which is likelyto improve the performance indicator more. As to the visual impression, however, thedistribution of solutions is more uniform with SPEA2, especially on the three objectiveversion.
Zitzler, Deb, and Thiele’sT6 On this function the performance indicator provides avery good measure, since the first component of the function is only governed by onevariable, which all test candidates manage to cope with; the resulting fronts are mostlymutually non-overlapping.
From the plots in Fig. 4 a similar behavior as before on the Sphere Model can be
12

0.3
0.4
0.5
0.6
0.7
0.8
0.9
0 200000 400000 600000 800000 1e+06
non-
dom
inat
ed o
bjec
tive
spac
e
objective function evaluations
"NSGA2""PESA""SPEA"
"SPEA2"
nsga2 pesa spea spea2
0.320
0.325
0.330
0.335
0.340
0.345
0.7
0.75
0.8
0.85
0.9
0.95
0 200000 400000 600000 800000 1e+06
non-
dom
inat
ed o
bjec
tive
spac
e
objective function evaluations
"NSGA2""PESA""SPEA"
"SPEA2"
nsga2 pesa spea spea2
0.70
0.74
0.78
0.82
0
0.1
0.2
0.3
0.4
0.5
0.6
0.7
0.8
0.9
1
0 200000 400000 600000 800000 1e+06
non-
dom
inat
ed o
bjec
tive
spac
e
objective function evaluations
"NSGA2""PESA""SPEA"
"SPEA2"
nsga2 pesa spea spea20.0
0.1
0.2
0.3
Figure 4: Performance values for ZDT6 (top), QV (middle) and KUR (bottom). Thegraphs show the average values of30 runs for each algorithm over time (left), and thebox-plots represent the distributions of the30 values at the end of the runs (right).
13

traced: PESA converges quickly, but is overtaken by SPEA2 and NSGA-II. In compar-ison with SPEA2, NSGA-II appears to be slightly faster proceeding, but in the limit theresults are of identical quality. In contrast, many of the PESA and SPEA runs have notconverged to the Pareto-optimal set even after1000000 function evaluations, the boxplots show the corresponding spread in performance.
Multi-objective Rastrigin function On the test problem QV, Fig. 4 shows that withPESA – and later also for SPEA – the performance measure starts to stagnate very soon.This happens because of the extreme concavity of the Pareto set: The outer points ofthe nondominated set of PESA and SPEA are not guaranteed to stay in the archive, andon this type of problem, where also the density of solutions decreases at the extremesof the Pareto set, these points cannot be re-created as fast as they are lost. SPEA2 andNSGA-II, again, have almost identical performance.
Kursawe’s function On Kursawe’s function the differences in the average perfor-mance values are easily visible from Fig. 4. SPEA converges most slowly, probablydue to the same effect as on the Sphere Model. However, the volume-based measureis not very instructive here: Even with a front, which is obviously farther behind an-other one and where almost all points are dominated by the other, a better value can beachieved. Unfortunately, the exact location of the true Pareto set cannot be determined,and thus other metrics relying on the true front are also not applicable.
The resulting fronts show that for all algorithms, not every run converges to thevicinity of the true Pareto set. In this sense SPEA2 has a success frequency of18/30 incontrast to PESA with13/30 and NSGA-II with20/30. The distribution of points ofSPEA2 and NSGA-II appear equally good, which corresponds with NSGA-II havingonly an almost indiscriminative advantage of the performance value of the best run.
5.2 Combinatorial Test Problems
On the knapsack problems the results look structurally similar to the results on theSphere Model. On the two objective version, SPEA2 produces on average the broadestdistribution and hence the best performance values. On the three objective version,NSGA-II catches up, but – in contrast to the Sphere Model – does not reach the bestperformance value. Again, the distribution of solutions in higher objective space di-mension becomes notably biased with NSGA-II, and in some runs remarkable patternscan be traced (see Fig. 6), which is probably due to the component-wise density esti-mation technique and the amplification of the extreme solutions.
As the box plots in Fig. 5 show, the performance differences increase with thenumber of objectives. With four objectives, a clear distinction between NSGA-II andSPEA2 on the one hand and PESA and SPEA on the other hand can be made: BothPESA and SPEA, which do not guarantee the extreme solutions to be kept in thearchive, appear to stagnate without having reached a well spread distribution of so-lutions.
Moreover, pairwisely comparing the fronts produced by the different algorithmson the same initial populations suggests that SPEA2 has advantages over PESA and
14

0.45
0.5
0.55
0.6
0.65
0.7
0.75
0 50000 100000150000200000250000300000350000400000450000500000
non-
dom
inat
ed o
bjec
tive
spac
e
objective function evaluations
"NSGA2""PESA""SPEA"
"SPEA2"
nsga2 pesa spea spea2
0.490
0.495
0.500
0.505
0.68
0.7
0.72
0.74
0.76
0.78
0.8
0.82
0.84
0.86
0 100000 200000 300000 400000 500000 600000
non-
dom
inat
ed o
bjec
tive
spac
e
objective function evaluations
"NSGA2""PESA""SPEA"
"SPEA2"
nsga2 pesa spea spea2
0.685
0.690
0.695
0.700
0.8
0.82
0.84
0.86
0.88
0.9
0.92
0.94
0 100000 200000 300000 400000 500000 600000 700000
non-
dom
inat
ed o
bjec
tive
spac
e
objective function evaluations
"NSGA2""PESA""SPEA"
"SPEA2"
nsga2 pesa spea spea2
0.817
0.822
0.827
0.832
0.837
Figure 5: Performance values for KP-750-m with m = 2 (top), m = 3(middle) andm = 4 (bottom). The graphs show the average values of30 runs for each algorithmover time (left) and the box-plots of the distribution of all 30 samples at the end of therun (right).
15

-28000
-27500
-27000
-26500
-26000
-25500
-25000
-24500
-24000
-29500 -29000 -28500 -28000 -27500 -27000 -26500 -26000 -25500-28500
-28000
-27500
-27000
-26500
-26000
-25500
-25000
-24500
-29500 -29000 -28500 -28000 -27500 -27000 -26500 -26000 -25500
-27000
-26000
-25000
-24000
-23000
-22000
-21000
-20000
-28000 -27000 -26000 -25000 -24000 -23000 -22000 -21000-26500
-26000
-25500
-25000
-24500
-24000
-23500
-23000
-22500
-27000 -26500 -26000 -25500 -25000 -24500 -24000 -23500 -23000
Figure 6: First two objectives of the final population of a single run of NSGA-II (left)and SPEA2 (right) on KP-750-3 (top) and KP-750-4 (bottom).
NSGA-II on higher dimensional objective spaces. On average, the nondominated setachieved by SPEA2 dominates about80% of the nondominated solutions found byNSGA-II in the case of3 and4 objectives. Vice versa, the front obtained by NSGA-IIdominates less than2% of the nondominated solutions produced by SPEA2. With re-gard to PESA, a SPEA2 front dominates on average33% and54% of the correspondingPESA front with3 and4 objectives, respectively, while the nondominated set producedby PESA achieves only22% and7% dominance in comparison to SPEA2.
5.3 Summary
In all test cases, SPEA2 shows to constitute a significant improvement over its pre-decessor SPEA as it reaches better results on all considered problems. SPEA2 andNSGA-II seem to behave very similar on the different problems. In some cases NSGA-II reaches a broader spread and hence a better value of the performance measure, whileSPEA2 provides a better distribution of points, especially when the number of objec-tives increases. PESA, however, tends to have difficulties to keep the outer solutionson certain test functions.
It is very instructive, however, to see how the performance develops over time,i.e. with the number of function evaluations. For many problems, PESA appears tobe converging quicker at the beginning, which is probably due to its higher implicitelitism intensity. Both NSGA-II and SPEA2, which also allow dominated individuals
16
to maintain a minimum archive size, seem to make use of this increased diversity inthe later stage of the run where they attain a broader distribution and hence betterperformance values.
6 Conclusions
In this report we have presented SPEA2, an improved elitist multi-objective evolution-ary algorithm that employs an enhanced fitness assignment strategy compared to itspredecessor SPEA as well as new techniques for archive truncation and density-basedselection. Extensive numerical comparisons of SPEA2 with SPEA and with PESA andNSGA-II, two other recently proposed algorithms, have been carried out on variouscontinuous and combinatorial test problems.
The key results of the comparison are:
• SPEA2 performs better that its predecessor SPEA on all problems.
• PESA has fastest convergence, probably due to its higher elitism intensity, buthas difficulties on some problems because it does not always keep the boundarysolutions.
• SPEA2 and NSGA-II show the best performance overall.
• In higher dimensional objective spaces, SPEA2 seems to have advantages overPESA and NSGA-II.
The comparative study emphasizes that many differences are only revealed formore objective than two. In higher dimensional objective spaces the number of non-dominated solutions increases rapidly. This presents a much greater challenge, e.g., forthe archiving strategies and in general for the algorithms to keep the desired conver-gence properties and at the same time maintain a good distribution of solutions. Exactlythis observation was the reason why great importance was attached to accurate densityestimation with the design of SPEA2. Although PESA and NSGA-II are faster in termsof worst-case complexity, the issue of density estimation becomes the more importantthe more objectives are involved as the results on the knapsack problem suggest.
Furthermore, it became obvious that it is necessary to trace the performance overtime to keep track of the dynamic behavior of the algorithms. Specifically, algorithmsare likely to differ in convergence velocity or reveal effects such as premature conver-gence or stagnation, which cannot be seen from a static analysis after some arbitraryrunning time.
References
Bleuler, S., M. Brack, L. Thiele, and E. Zitzler (2001, May). Multiobjective geneticprogramming: Reducing bloat by using SPEA2. InCongress on EvolutionaryComputation (CEC-2001). To appear.
17

Corne, D. W., J. D. Knowles, and M. J. Oates (2000). The pareto envelope-basedselection algorithm for multiobjective optimisation. In M. S. et al. (Ed.),ParallelProblem Solving from Nature – PPSN VI, Berlin, pp. 839–848. Springer.
Deb, K. and R. B. Agrawal (1995). Simulated binary crossover for continuous searchspace.Complex Systems 9, 115–148.
Deb, K., S. Agrawal, A. Pratap, and T. Meyarivan (2000). A fast elitist non-dominated sorting genetic algorithm for multi-objective optimization: NSGA-II.In M. S. et al. (Ed.),Parallel Problem Solving from Nature – PPSN VI, Berlin,pp. 849–858. Springer.
Fonseca, C. M. and P. J. Fleming (1993). Genetic algorithms for multiobjectiveoptimization: Formulation, discussion and generalization. In S. Forrest (Ed.),Proceedings of the Fifth International Conference on Genetic Algorithms, SanMateo, California, pp. 416–423. Morgan Kaufmann.
Horn, J., N. Nafpliotis, and D. E. Goldberg (1994). A niched pareto genetic algo-rithm for multiobjective optimization. InProceedings of the First IEEE Con-ference on Evolutionary Computation, IEEE World Congress on ComputationalComputation, Volume 1, Piscataway, NJ, pp. 82–87. IEEE Press.
Jaszkiewicz, A. (2000). On the performance of multiple objective genetic localsearch on the 0/1 knapsack problem. a comparative experiment. Technical Re-port RA-002/2000, Institute of Computing Science, Pozna University of Tech-nology.
Knowles, J. D. and D. W. Corne (1999). The pareto archived evolution strategy:A new baseline algorithm for pareto multiobjective optimisation. InCongresson Evolutionary Computation (CEC99), Volume 1, Piscataway, NJ, pp. 98–105.IEEE Press.
Kursawe, F. (1991). A variant of evolution strategies for vector optimization. In H.-P.Schwefel and R. M¨anner (Eds.),Parallel Problem Solving from Nature, Berlin,pp. 193–197. Springer.
Lahanas, M., N. Milickovic, D. Baltas, and N. Zamboglou (2001). Applicationof multiobjective evolutionary algorithms for dose optimization problems inbrachytherapy. In E. Zitzler, K. Deb, L. Thiele, C. A. C. Coello, and D. Corne(Eds.),Proceedings of the First International Conference on Evolutionary Multi-Criterion Optimization (EMO 2001), Volume 1993 ofLecture Notes in Com-puter Science, Berlin, pp. 574–587. Springer-Verlag.
Laumanns, M., G. Rudolph, and H.-P. Schwefel (2001, June). Mutation controland convergence in evolutionary multi-objective optimization. InProceedings ofthe 7th International Mendel Conference on Soft Computing (MENDEL 2001),Brno, Czech Republic.
Laumanns, M., E. Zitzler, and L. Thiele (2000). A unified model for multi-objectiveevolutionary algorithms with elitism. InCongress on Evolutionary Computation(CEC-2000), Piscataway, NJ, pp. 46–53. IEEE.
Laumanns, M., E. Zitzler, and L. Thiele (2001). On the effects of archiving, elitism,and density based selection in evolutionary multi-objective optimization. In
18

E. Zitzler, K. Deb, L. Thiele, C. A. C. Coello, and D. Corne (Eds.),Proceedingsof the First International Conference on Evolutionary Multi-Criterion Optimiza-tion (EMO 2001), Volume 1993 ofLecture Notes in Computer Science, Berlin,pp. 181–196. Springer-Verlag.
Parks, G. T. and I. Miller (1998). Selective breeding in a multiobjective geneticalgorithm. In A. E. E. et al. (Ed.),Parallel Problem Solving from Nature – PPSNV, Berlin, pp. 250–259. Springer.
Quagliarella, D. and A. Vicini (1997). Coupling genetic algorithms and gradientbased optimization techniques. In D. Quagliarella, J. P´eriaux, C. Poloni, andG. Winter (Eds.),Genetic Algorithms and Evolution Strategy in Engineering andComputer Science — Recent advances and industrial applications, pp. 289–309.Wiley, Chichester.
Rudolph, G. (1998). On a multi-objective evolutionary algorithm and its conver-gence to the pareto set. Technical Report No. CI-17/98, Department of ComputerScience/XI, University of Dortmund.
Schaffer, J. D. (1985). Multiple objective optimization with vector evaluated geneticalgorithms. In J. J. Grefenstette (Ed.),Proceedings of an International Confer-ence on Genetic Algorithms and Their Applications, Pittsburgh, PA, pp. 93–100.sponsored by Texas Instruments and U.S. Navy Center for Applied Research inArtificial Intelligence (NCARAI).
Silverman, B. W. (1986).Density estimation for statistics and data analysis. Lon-don: Chapman and Hall.
Srinivas, N. and K. Deb (1994). Multiobjective optimization using nondominatedsorting in genetic algorithms.Evolutionary Computation 2(3), 221–248.
Tan, K. C., T. H. Lee, and E. F. Khor (2001). Incrementing multi-objective evolu-tionary algorithms: Performance studies and comparisons. In E. Zitzler, K. Deb,L. Thiele, C. A. C. Coello, and D. Corne (Eds.),Proceedings of the First In-ternational Conference on Evolutionary Multi-Criterion Optimization (EMO2001), Volume 1993 ofLecture Notes in Computer Science, Berlin, pp. 111–125. Springer-Verlag.
Veldhuizen, D. A. V. (1999, June).Multiobjective Evolutionary Algorithms: Clas-sifications, Analyses, and New Innovations. Ph. D. thesis, Graduate School ofEngineering of the Air Force Institute of Technology, Air University.
Zitzler, E. (1999).Evolutionary Algorithms for Multiobjective Optimization: Meth-ods and Applications. Ph. D. thesis, Swiss Federal Institute of Technology(ETH) Zurich, Switzerland. TIK-Schriftenreihe Nr. 30, Diss ETH No. 13398,Shaker Verlag, Aachen, Germany.
Zitzler, E., K. Deb, and L. Thiele (1999, December). Comparison of multiobjec-tive evolutionary algorithms: Empirical results (revised version). Technical Re-port 70, Computer Engineering and Networks Laboratory (TIK), Swiss Fed-eral Institute of Technology (ETH) Zurich, Gloriastrasse 35, CH-8092 Zurich,Switzerland.
19

Zitzler, E., K. Deb, and L. Thiele (2000). Comparison of multiobjective evolutionaryalgorithms: Empirical results.Evolutionary Computation 8(2), 173–195.
Zitzler, E. and L. Thiele (1998, May). An evolutionary algorithm for multiobjectiveoptimization: The strength pareto approach. Technical Report 43, Computer En-gineering and Networks Laboratory (TIK), Swiss Federal Institute of Technol-ogy (ETH) Zurich, Gloriastrasse 35, CH-8092 Zurich, Switzerland.
Zitzler, E. and L. Thiele (1999). Multiobjective evolutionary algorithms: A compar-ative case study and the strength pareto approach.IEEE Transactions on Evolu-tionary Computation 3(4), 257–271.
20

Errata
In Section 4.1, Table 1, the definitions of the test problems KUR and ZDT6 are mis-printed. The functions functions used for this study are slightly different and definedas follows.
ZDT6
f1(x) = 1 − exp(−4x1) sin6(6πx1)f2(x) = g(x)
[1 − (f1(x)/g(x))2
]g(x) = 1 + 9 ·
((
n∑i=2
xi)/(n − 1)
)0.25
KUR
f1(x) =n∑
i=1
(|xi|0.8 + 5 · sin3(xi) + 3.5828)
f2(x) =n−1∑i=1
(1 − e−0.2√
x2i+x2
i+1)
We would like to thank Young-Hoon Kang for pointing out the inconsistency with thesimulations results published on
http://www.tik.ee.ethz.ch/ zitzler/testdata.html .
21