spe-195257-ms first ever polymer flood field pilot - a game...
TRANSCRIPT
SPE-195257-MS
First Ever Polymer Flood Field Pilot - A Game Changer to Enhance theRecovery of Heavy Oils on Alaska’s North Slope
Abhijit Dandekar, University of Alaska Fairbanks; Baojun Bai, Missouri University of Science and Technology; JohnBarnes, Hilcorp Alaska LLC; Dave Cercone and Jared Ciferno, DOE-National Energy Technology Laboratory;Samson Ning, Reservoir Experts, LLC/Hilcorp Alaska, LLC; Randy Seright, New Mexico Institute of Mining andTechnology; Brent Sheets, University of Alaska Fairbanks; Dongmei Wang, University of North Dakota; Yin Zhang,University of Alaska Fairbanks
Copyright 2019, Society of Petroleum Engineers
This paper was prepared for presentation at the SPE Western Regional Meeting held in San Jose, California, USA, 23-26 April 2019.
This paper was selected for presentation by an SPE program committee following review of information contained in an abstract submitted by the author(s). Contentsof the paper have not been reviewed by the Society of Petroleum Engineers and are subject to correction by the author(s). The material does not necessarily reflectany position of the Society of Petroleum Engineers, its officers, or members. Electronic reproduction, distribution, or storage of any part of this paper without the writtenconsent of the Society of Petroleum Engineers is prohibited. Permission to reproduce in print is restricted to an abstract of not more than 300 words; illustrations maynot be copied. The abstract must contain conspicuous acknowledgment of SPE copyright.
AbstractThe development pace of Alaska's vast, 20-25 billion barrels, heavy oil resources has been very slow dueto high development costs and low oil recovery using conventional waterflood, and the impracticality ofdeploying thermal methods due to the presence of continuous permafrost. Although, polymer flooding hasattracted attention and has become a promising EOR technique in heavy oil reservoirs due to the extensiveapplication of horizontal wells and advancement of polymer flooding technology, no field tests have beenperformed to date in Alaska's underdeveloped heavy oil reservoirs. The overall objective of this research isto perform a field experiment to validate the use of polymer flooding for extracting heavy oil in Alaska'schallenging environment.
Two pre-existing pairs of horizontal injection and production wells in an isolated fault block of theSchrader Bluff heavy oil reservoir at the Milne Point Field are currently being used for the field experiment.Hydrolyzed polyacrylamide (HPAM) polymer injection started on August 28, 2018 at 600 ppm (4 cPviscosity) concentration ramping up to 1,800 ppm (45 cP viscosity) over a three week time period, and hasbeen maintained at an average concentration of ~1,800 ppm. Current injection rates in the two horizontalinjectors are ~2,200 and 600 bwpd. Laboratory experiments to determine the polymer retention, optimumwater salinity, synergistic effects of water salinity and polymer, and handling of produced fluids, in supportof the field experiment, are currently ongoing. Similarly, reservoir simulation of coreflood behavior andhistory match of previous waterfloods to predict polymer flood performance in the project area are alsoconducted in parallel.
The field data and scientific knowledge that have been collected since the start of the injection indicatesthat the field pilot is performing as predicted. To date, no unexpected injectivity issues or polymerbreakthrough have been encountered, and the two horizontal producers are showing positive response tothe polymer injection, resulting in incremental increase in oil production rate. Since the research is still in

2 SPE-195257-MS
its early stages, selected field, laboratory and simulation results are presented and discussed to highlight theintegrative approach adopted in this first ever polymer flood field pilot in Alaska.
IntroductionAlaska North Slope (ANS) contains vast resources of heavy oils, primarily concentrated in West Sak(also called Schrader Bluff) and Ugnu reservoirs. There are currently six fields producing heavy oil inAlaska: Orion, Polaris, Milne Point, Tabasco, Kuparuk, and Nikaitchuq. General delineation of these poolsis indicated in Figure 1. Tabasco is a Kuparuk River Unit Satellite, and the Ugnu formation overlies theWest Sak (Schrader Bluff) formation across the North Slope fields.
Figure 1—Alaska's viscous oil and heavy oil reserves (Paskvan et. al. 2016).
Figure 2 below shows the cross-section of various heavy oil formations in this heavy oil belt on ANS. Theestimated total oil in place within these reservoirs amounts to about 20-25 billion barrels, with about two-thirds of the heavy oil lying under the Kuparuk River Unit (Targac et al. 2005). The ANS oil viscosity vs.depth profile delineated in Figure 3 shows that at present, oils from "West Sak-Schrader Bluff" formationare being developed.

SPE-195257-MS 3
Figure 2—Schrader Bluff reservoir with multiple commercial horizons (Paskvan et. al. 2016).
Figure 3—Viscosity of various ANS oils vs. depth and their development trend (Paskvan et. al. 2016).
Despite the fact that viscous and heavy oil represent about a third of known ANS original oil in place(OOIP), the development pace has been very slow, with cumulative production contributing only 1% of theOOIP slope wide. High development costs, significant logistical and environmental challenges, and lowoil recovery using conventional techniques have been the major factors for under-development of thesevast resources. As seen from Figure 3, an oil viscosity of 100 – 300 cP in the West Sak-Schrader Bluffarea vs. water viscosity of 1 cP means a significant mobility contrast and thus a poor volumetric sweepefficiency for waterflood. Although thermal methods and gas injection are common techniques to enhance

4 SPE-195257-MS
heavy oil recovery and have been successfully applied in many parts of the world, they are not readilyapplicable on ANS for multiple reasons. Thermal recovery methods, such as steam injection, are impracticalon ANS because of the high cost and most important concerns of thawing the nearly 2,000 ft of continuouspermafrost, which could cause disastrous environmental damage. Note that the viscous and heavy oils lie inclose proximity to the permafrost. In miscible flooding processes, the minimum miscibility pressure (MMP)between the heavy oil and solvent (hydrocarbon-based or CO2) would be much higher than the reservoirpressure at these depths. Although there is limited application of immiscible enriched gas injection in theSchrader Bluff heavy oil reservoirs via the viscosity reduction water-alternating-gas (VRWAG) process(McGuire et. al., 2005), the expected incremental oil recovery is relatively small compared with a miscibleprocess.
On a much broader level, there are a number of motivating factors that outweigh the developmentchallenges mentioned above: (1) Decline of legacy ANS production, combined with recent growth oflower-48 production has reduced the contribution from Alaska to merely 5%; (2) Successful technologydevelopment is important to the State of Alaska economy as well as US national interests; (3) The resourcebase is too large to ignore, and is particularly attractive given that it lies within established productioninfrastructure on the ANS; and (4) Light crude is still available as a diluent for high viscosity oil transportthrough the Trans Alaska Pipeline System (TAPS). From a technology standpoint, preliminary laboratoryand simulation studies indicated that polymer flooding has great potential to enhance oil recovery from theSchrader Bluff heavy oil reservoirs (Seright 2010, 2011), but yet to be tested and proven due to lack of anyprior field tests. In fact, no large-scale polymer flood of a heavy oil and other unconventional resourceshas occurred to date in the entire United States, although it has been tested and implemented in othercountries, such as Canada and China. Initial scoping studies suggest that successful implementation ofpolymer flooding could increase heavy oil recovery by 50% on ANS. Additionally, improvements in thequality of the polymer and positive synergistic effects of low salinity water (readily available on ANS)and the polymer increase the probability of success. Similarly, the existing pairs of horizontal injectors-producers in the Milne Point Unit offer a distinct advantage of available wells to conduct the polymer floodfield test, thus eliminating the need to drill new wells.
Therefore, given the foregoing motivating factors, technical merit based on prior research and analogy,and a pre-existing favorable test site are conducive to test the efficacy of polymer flood on a field scale,representing a significant investment by the US Department of Energy and Hilcorp LLC. However, theuniqueness of every crude oil brine rock (COBR) system, logistics of polymer mixing in a remote arcticoperating environment, and the sheer scale of injection at a field level, which in itself is not trivial, also meansseveral unknowns and unresolved issues such as the type of polymer, concentration, polymer retention,injectivity, salinity of water for making the polymer solution, conformance control, and flow assurance.Herein lies the purpose of this research on which a team of multi-university experts and industry hascollectively embarked on addressing the immediate technical challenges that pertain to the design andimplementation of ANS’ first ever polymer field pilot. The subsequent sections in the manuscript logicallylay out the various important elements and results of this joint research and conclude with the main findingsto date.
Description of the Polymer Field Pilot Area and Test WellsFigure 4 below provides the overall depiction of the project area, Milne Point Unit (MPU), which is nestledbetween the Prudhoe Bay Unit (PBU) and Kuparuk River Unit (KRU) respectively. The MPU is locatedabout 30 miles to the Northwest of PBU and about 15 miles Northeast of KRU. Current working interestowners of MPU are 50% Hilcorp Alaska LLC, being the operator, and 50% BP Alaska Inc.

SPE-195257-MS 5
Figure 4—Map of the project area for the polymer field pilot.
The pilot area contains two horizontal injectors and two horizontal producers drilled into the SchraderBluff NB-sand at J-pad of MPU (Figure 5). Both well pairs are easily accessible in all seasons via an existinggravel road.

6 SPE-195257-MS
Figure 5—Location of various pads, including the pilot area J-pad, at Milne Point.
Figure 6 shows additional details of the horizontal injector-producer well patterns located in an (isolated)fault block in which the OOIP is 22 MMSTB. The lengths of the horizontal wellbores are from 4200 to 5500feet and the inter-well distance is approximately 1500 feet. These wells have been used for waterfloodingin which the OOIP is 13 MMSTB in the flood pattern, resulting in a recovery factor of only 7.6% after acumulative water injection of 1.82 MMSTB and a water cut of 65%.
Figure 6—Polymer field pilot area boundary and injector-producer well patterns.

SPE-195257-MS 7
The reservoir characteristics in the pilot area are favorable in that they are amenable to polymer injection(pilot) with formation porosity and permeability in the range of 30-35%, and 100-3000 mD respectively, lowreservoir temperature of 70°F, oil API of ~15° and in-situ oil viscosity of ~300 cP. The oil is undersaturated.
Polymer Slicing UnitThe polymer mixing and pumping facilities named Polymer Slicing Unit (PSU) were custom designed andmanufactured in Canada. As shown in Figure 7, the PSU consists of 5 modules, the pressure letdown module,the injection pump module, the polymer make-down module, the hopper and the utility module. Resultsfrom prior laboratory and simulation studies were used in the initial selection of the polymer (HPAM). Thepolymer, in powder form, is transported and stored in super sacks, each containing 750 kg (1650 lbm) ofpolymer. The super sacks are loaded onto the hopper with a forklift and the polymer is fed into the make-down unit below where it is mixed with water to make a mother solution. After 100 minutes hydrationtime in the tank, the mother solution is slipstreamed into the main water supply that feeds into the 3 triplexpositive displacement injection pumps in the pumping unit, one for each injector plus a spare.
Figure 7—Polymer injection unit on the J-pad at Milne Point.
Prior to commencing the polymer injection, an injection profile log was obtained which confirmed thatno thief zones are apparent, thus precluding the need for any profile control treatment.
Rock and Fluid Samples and Reservoir DataAlthough no cores were cut while drilling in the project reservoir, cores have been taken in nearby areasthroughout the development history. Two appraisal wells, Liviano and Pesado, were drilled on ice padsjust north of the project area in 2007, while cores and fluid samples using MDT tools were collectedfrom both wells throughout the Ugnu and Schrader Bluff Formations. Extensive routine and special coreanalyses as well as PVT analysis have been performed on these samples, which are used in the reservoirsimulation model developed for this project. All laboratory corefloods are based on representative corematerial available in the form of plugs, whole core sections as well as loose sand. Additionally, samplingof dead oil, and produced water is undertaken as and when required in the laboratory corefloods and flowassurance experiments.

8 SPE-195257-MS
Results and DiscussionIn the following sub-sections, selected results and their discussion is presented for the field pilot, laboratorycorefloods, numerical reservoir simulation and flow assurance studies.
Implementation of Polymer Field PilotSince the end of August 2018 polymer injection has continued as planned, for the most part. However, twoseparate operational events (as might be expected in a field), in late September and November respectivelycaused interruptions in the injection. One was temporary shutdown due to the presence of more hydrocarbongas found in the source water than expected, that required the modification and reclassification of the PSUto Class I Division II. The second was due to the injection pump repairs and shut-in for the Pressure Falloff(PFO) tests. Figure 8 below shows polymer solution viscosity and concentration profile vs. time in whichthe gaps indicate the stated events. In order to achieve a target viscosity of 45 cP, polymer concentrationhas varied between 1,600 to 1,800 ppm.
Figure 8—Polymer solution viscosity and concentration vs. time.
As mentioned earlier, polymer injectivity is always a matter of concern due to the high viscosity.Therefore, in order to assess the injectivity, a Hall plot (Hall, 1963) is prepared for both J-23A and J-24Ausing the data collected until the middle of January, 2019, which is shown in Figure 9. As seen in the plot, theinjectivity of J-23A stayed constant (straight line) until a cumulative of 100 mbbl of polymer was injected,then started to increase slowly as evidenced by the slightly decreasing slope. However, the slope of the Hallplot for J-24A has been increasing since the polymer startup which indicates decreasing injectivity. By themiddle of January 2019, approximately 110,000 and 54,000 lbm of polymer has been cumulatively injectedinto the target reservoir through the two injectors J-23A and J-24A, respectively.

SPE-195257-MS 9
Figure 9—Hall plot of J-23A and J-24A injectors.
The pre and post polymer injection response of the two producers, namely J-27 and J-28, is depicted inFigures 10 and 11 respectively. While the responses of both producers are somewhat self-explanatory, itshould be noted that J-27 is supported by two injectors, J-23A (South) and J-24A (North), whereas J-28,drilled close to a sealing fault to the south side, is supported by only one injector J-23A (North). The recentdecrease in total liquid production rate was caused by the decline in reservoir pressure due to lower injectionthan the production voidage. The positive effect of polymer injection was reflected mainly by the decreasein water cut from ~65% to 40-45% in both producers. The oil rate increased by 200-300 barrels/day postpolymer injection although the total liquid rate was trending down.
Figure 10—J-27 production performance.

10 SPE-195257-MS
Figure 11—J-28 production performance.
Finally, there is no indication of polymer presence in the producers to date, which has been confirmedvia both the clay flocculation and nitrogen-fluorescence water composition analyses.
Laboratory CorefloodsIf polymer retention (i.e., adsorption and/or mechanical entrapment in the rock) is greater than 50 µg/g,polymer retention can be more important to the economics of the process than polymer concentration orbank size (see Manichand and Seright 2014). Therefore, in order to assess this for the subject set of rock andfluids and the polymer, five different retention experiments have been carried out so far. All these tests areon 6 – 11 Darcy sandpacks created from representative sand from MPU; the major difference is (original)oil coated vs. cleaned sand and the packing in a metal tube vs. plastic since iron influences retention values.Results from the first three tests using old native sand (stored for years without preservation) and freshlycleaned sand, using the conservative and perhaps more accurate nitrogen analysis method, yield polymerretention values in the range of 153 – 290 µg/g which are considered very high. Ongoing experimentation isfocused on understanding the high retention and monitoring the polymer pilot that allows the determinationof field-based polymer retention values. Our most recent two tests with cleaned reservoir sand and saturatedwith fresh oil yielded polymer retention values of only 28 µg/g— a much more palatable value.
Two different sandpacks using commercial sands were created to conduct displacement experimentswith the following displacing fluids in a sequential mode; waterflood (WF) with synthetic formation brine(SFB), low salinity waterflood (LSWF), ultralow salinity waterflood (ULSWF); polymer flood (PF) andlow salinity polymer flood (LSPF). Both sandpacks are 2.54cm diameter, 20.4cm long with porosities of26% and 35.5% and absolute permeabilities of 207 and 655 mD. Prior to conducting corefloods usingdifferent displacing fluids, initial saturations (irreducible water and rest being ~300 cP dead oil from MPU)are established in the sandpacks and displacement experiments performed at ambient conditions (roughlythe same as reservoir temperature) in a sequential mode. The salinities of the synthetic formation brine,low salinity water and ultra-low salinity water are 26,673, 4,945 and 495 ppm respectively. Both polymersolutions (concentration of 1,800 ppm) are prepared using the same polymer as used in the field pilot. Theseexperiments are designed to elucidate the effect of salinity alone, and salinity in conjunction with the fieldused polymer, on oil recovery. As an example, the experimental results for one of the sandpacks (B) is

SPE-195257-MS 11
elucidated in Figure 12, which indicate that a lower-salinity polymer solution can increase oil recovery.Additional work is being performed to investigate (1) whether injection of low-salinity water (by itself)can significantly reduce the residual oil saturation (Sor) and (2) whether injection of a low-salinity polymerbank can reduce Sor below the value projected for extended waterflooding. We will also investigate whetherany reductions in Sor are consistent with previous literature (Al-Qattan et. al., 2018; Khorsandi et. al., 2017;Unsal et. al., 2018; Vermolen et. al., 2014).
Figure 12—Water cut and oil recovery factor for one of the tested sandpacks.
Numerical Reservoir SimulationReservoir modeling efforts have focused on assessing the polymer retention effects using a 1D homogenousand 2D heterogeneous models in areal plane on laboratory sandpack experiments and simulations gearedtoward field scale analyses. Capillary pressure effects on polymer retention were also simulated using theexperimentally determined polymer retention values in oil sand, which indicate that for the target heavyoil reservoir with high permeable oil zones and large pore size sand, there were no significant effects onpolymer retention or fluid saturation using the 1D sand pack model. A simulation comparison using theretention values obtained from laboratory studies demonstrated that the polymer absorption behavior agreedwith the range of delayed polymer slugs from laboratory experimental results. Large heterogeneity in theareal direction led to less apparent polymer adsorption – suggesting for the heterogeneous cases that highpolymer viscosities might be needed to overcome the heterogeneity to improve sweep efficiency.
The 3D grid system of the initial reservoir simulation model, as shown in Figure 13, has been generatedbased on the geological model which was developed by combining seismic data, well logs, core data as wellas wellbore trajectories. Further, the simulation model is populated using available reservoir data such asporosity, permeability, initial reservoir pressure, initial oil and water saturations, rock and fluid properties,and wellbore configurations. As mentioned earlier, since the injector-producer pairs have been used forwaterflooding, one of the primary objectives of reservoir simulation is to perform a waterflood history match

12 SPE-195257-MS
and continually update the reservoir model as sustained long-term production data from the polymer floodpilot becomes available.
Figure 13—The grid top diagram of the initial reservoir simulation model. Note that the boundaryconditions along the model's edge are fault surfaces that have been modeled as no flows.
Since the water injection rate and the oil production rate are used as well constraints in the reservoirsimulation model, only the water cut and gas production rate of the two production wells need to be matchedin the history matching process. An optimization module available in the simulation software packageis employed to conduct the history matching with the assistance of advanced algorithms. Basically, thepermeability and the relative permeability curves are modified step by step to match the waterfloodingproduction history. However, in order to achieve the best and realistic history match, the followingmethodology has been adopted. First, the homogeneous permeability in each layer is tuned in a layercake model. Second, the relative permeability curves are tuned in a heterogeneous model. Finally, thepermeability distribution in a strip manner is tuned with the estimated relative permeability curves. The oil-water and gas-oil system relative permeabilities are typically expressed by Corey type power law modelsas shown in Equations 1 - 4:
(1)
(2)
(3)
(4)

SPE-195257-MS 13
where krw (Sw), krow (Sw), krg(Sg) and krog(Sg) are the water, oil (in a 2 phase oil-water system), gas and oil(in a 2 phase gas-oil system) phase relative permeabilities, respectively; aw, ao, and ag are the maximum ofwater, oil and gas phase relative permeability, respectively; Sw and Swi is water saturation and irreduciblewater saturation, respectively; Sorw and Sorg is the residual oil saturation to water and gas, respectively; Sgc
is critical gas saturation; and nw, now, ng and nog are the Corey exponents that control the curvature of therespective relative permeability curves.
Based on laboratory measured core data, ao and Swi are set as 1.0 and 0.235, respectively. The othercoefficients of the power law model are directly tuned in the history matching process. The adjustment andestimate of these coefficients are shown in Table 1, which indicates that the best estimates are within therange and for the most part, close to the base case values.
Table 1—Coefficients of power law model in history matching (Equations 1 – 4).
Variable Base Range Best Estimate
Sorw 0.32 0.30-0.35 0.31
aw 0.35 0.15-0.50 0.33
nw 2.00 1.00-4.00 1.50
now 2.00 1.50-4.00 2.70
Sorg 0.20 0.10-0.30 0.20
Sgc 0.02 0.01-0.06 0.02
ag 0.30 0.10-1.00 1.00
nog 2.00 1.50-3.50 1.69
ng 2.00 1.50-4.50 2.10
A permeability strip model has been developed as shown in Figure 14 to further investigate theheterogeneity of the reservoir. Nine permeability strips are assigned in each layer, resulting in 45permeability strips in the simulation model. The permeabilities of the strips in each layer are initiallyassigned with the average permeability of the layer and then tuned between 100 and 7,600 mD during thehistory matching process. In addition, the average porosity of each layer is used and the estimated relativepermeability curves based on Equations 1-4 and the best estimate coefficients shown in Table 1.

14 SPE-195257-MS
Figure 14—Permeability strips in the simulation model.
The best history matching results in the permeability strip models are shown in Figures 15 (a) and(b) respectively for producer J-27. The humps on the water cut curves have been well reproduced inthe simulation due to the heterogeneous and strip-type permeability distribution. Therefore, the estimatedpermeability strip model is to be used for subsequent predictions.

SPE-195257-MS 15
Figure 15—History matching of the production profile of J-27 in thepermeability strip model. Note that data precede the start of polymer injection.
Treatment of Effluent Stream Containing Produced Oil, Water and PolymerThe formation of stable emulsions during polymer flooding poses significant challenges during oil/waterseparation in surface production facilities. Given the fact that emulsion breakers (EB) are time-tested andcommonly employed on ANS for oil-water separation, initial experiments have focused on testing theirefficacy for the subject set of produced fluids and the HPAM. The experimental protocol that is typicallyfollowed in this work is based on Hirasaki et. al. (2010). In order to cover a wider range, water-oil ratios of30:70 to 90:10 and polymer concentrations of 100, 250 and 500 ppm respectively have been tested. Notethat the lower concentration of the polymer is under the assumption that the spent polymer concentrationwill most likely be lower than in the 1600-1800 ppm injection stream. Additionally, it is assumed that inthe process of preparing the emulsions, the 5000 rpm mixer speed, would result in some shearing of thepolymer so as to mimic, at least to some extent, the shearing of the polymer as it flows through the injection

16 SPE-195257-MS
system, the reservoir pore spaces, and eventually in the produced stream. While this research is ongoing,we present some results of these tests to highlight the challenges in efficiently separating the oil and water.
Figure 16 shows water droplets (lighter color) distribution in the oil phase as polymer concentrationincreases. At lower polymer concentration, the existence of polymer reduces the stability of the emulsionand favor oil-water separation. However, at higher concentration, the polymer intensifies the emulsificationand increases the difficulty in separating the dispersed droplets.
Figure 16—Microscopy (×50) of 50:50 MPU oil and produced water emulsions containing HPAM (100–500 ppm).
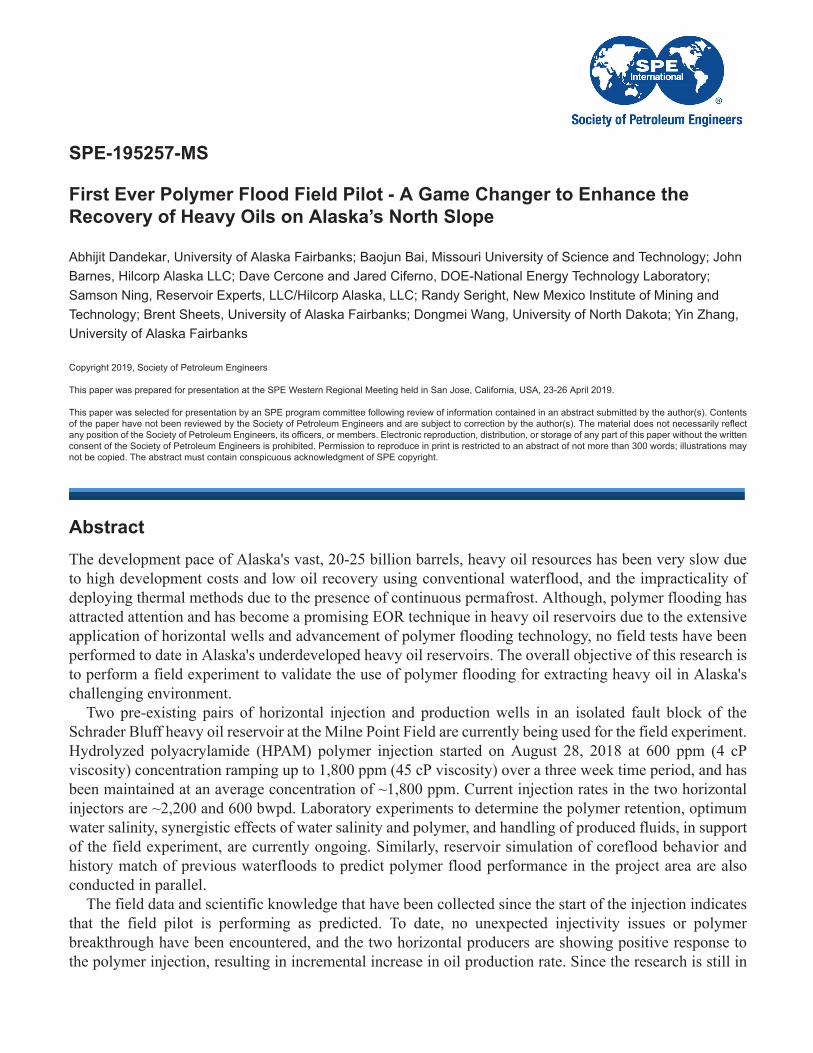
When one of the EB's is added (identified as EB1) the polymer concentration has little effect on both theseparated water volume and rate as shown in Figure 17. When the separated water quality is considered (seeFigure 18), the bottom half of the tube remains somewhat yellow stained indicating the presence of tiny oildroplets remaining in the water phase, especially at a polymer concentration of 100 ppm.
Figure 17—Separated water volume vs. time with EB and various HPAM concentrations.
SPE-195257-MS 17
Figure 18—Bottle test results after 24 hours with EB for various HPAM concentrations.
ConclusionsBased on the research conducted so far, the following main conclusions are drawn:
• For the first time, the functionality of the Polymer Slicing Unit has been successfully tested in theremote Arctic environment.
• With nearly five months of polymer injection in the two horizontal injectors, no injectivity issuesand polymer breakthrough have been encountered.
• Considering the encouraging response of both producers we are cautiously optimistic, as far as theperformance of the polymer field pilot is concerned.
• Initial polymer retention laboratory tests in sand packs indicated high values on cleaned sand.However, tests on cleaned sand that was re-saturated with fresh oil yielded moderate polymerretention values – on the order of 28 µg/g.
• Low salinity polymer flood in a tertiary mode carried out on two sandpacks have demonstrated animprovement in the oil recovery factor over a range of low to high salinity waterfloods.
• A good waterflood history match using the permeability strip model and power law estimatedrelative permeabilities has been achieved that establishes the reservoir simulation model for futureapplications.
• An acceptable separation of oil and water, and especially when spent polymers are present, inthe produced stream continues to be somewhat challenging as far as application of commerciallyavailable emulsion breakers is concerned, thus necessitating further research.
• Finally, based on the foregoing, the authors are confident that this research endeavor is trendingtoward a positive paradigm shift to enhance the recovery of heavy oils on ANS.
Acknowledgments"This material is based upon work supported by the Department of Energy, Office of Fossil Energy,administered by the National Energy Technology Laboratory, under Award Number DE-FE0031606."
Disclaimer: "This report was prepared as an account of work sponsored by an agency of the United StatesGovernment. Neither the United States Government nor any agency thereof, nor any of their employees,makes any warranty, express or implied, or assumes any legal liability or responsibility for the accuracy,completeness, or usefulness of any information, apparatus, product, or process disclosed, or represents thatits use would not infringe privately owned rights. Reference herein to any specific commercial product,process, or service by trade name, trademark, manufacturer, or otherwise does not necessarily constituteor imply its endorsement, recommendation, or favoring by the United States Government or any agencythereof. The views and opinions of authors expressed herein do not necessarily state or reflect those of theUnited States Government or any agency thereof."

18 SPE-195257-MS
The authors would also like to thank Hilcorp Alaska, LLC and BP Exploration (Alaska) Inc. forcosponsoring this project.
Nomenclature1D One Dimensional2D Two Dimensionalag Maximum of Gas Phase Relative Permeability (Equation 3)ao Maximum of Oil Phase Relative Permeability (Equation 2 and 4)aw Maximum of Water Phase Relative Permeability (Equation 1)
ANS Alaska North SlopeAPI American Petroleum Institutebbl Barrel
BOPD Barrels Oil per Daybwpd Barrels of Water Per Day
COBR Crude Oil Brine RockcP Centipoise
EB Emulsion BreakerEOR Enhanced Oil Recovery
ft FeetHPAM Hydrolyzed polyacrylamide
KRU Kuparuk River Unitkrg Relative Permeability of Gas in a Two Phase Gas-Oil System
krog Relative Permeability of Oil in a Two Phase Gas-Oil Systemkrow Relative Permeability of Oil in a Two Phase Oil-Water Systemkrw Relative Permeability of Water in a Two Phase Oil-Water System
lbm Pound-massLSPF Low Salinity Polymer Flood
LSWF Low Salinity WaterfloodMCFPD 1000 Standard Cubic Feet per Day
mD MilliDarcyMDT Modular formation Dynamic Tester
mL MilliliterMMP Minimum Miscibility Pressure
MMSTB Million Stock Tank BarrelsMPU Milne Point Unit
ng Corey Exponenet of Gasnog Corey Exponent of Oil in a Two Phase Gas-Oil Systemnow Corey Exponent of Oil in a Two Phase Water-Oil Systemnw Corey Exponenet of Water
OOIP Original Oil in PlacePF Polymer Flood
PFO Pressure FalloffPPM Parts Per MillionPBU Prudhoe Bay UnitPSU Polymer Slicing Unit
PV Pore VolumePVT Pressure Volume Temperature

SPE-195257-MS 19
SFB Synthetic Formation BrineSg Gas Saturation
Sgc Critical Gas SaturationSor Residual Oil Saturation
Sorg Residual Oil Saturation to GasSorw Residual Oil Saturation to WaterSw Water SaturationSwi Irreducible Water Saturation
TAPS Trans Alaska Pipeline Systemμg Microgram
ULSWF Ultra Low Salinity WaterfloodVRWAG Viscosity Reduction Water Alternating Gas
WAG Water Alternating GasWF Waterflood
ReferencesAl-Qattan, A., Sanaseeri, A., Al-Saleh, Z., Singh, B.B., Al-Kaaoud, H., Delshad, M., Hernandez, R., Winoto, W., Badham,
S., Bouma, C. and Brown, J. "Low Salinity Waterflood and Low Salinity Polymer Injection in the Wara Reservoir ofthe Greater Burgan Field", SPE EOR Conference at Oil and Gas West Asia, 26-28 March, Muscat, Oman.
Hall, H.N., "How to Analyze Waterflood Injection Well Performance,". World Oil, 1963(October): p. 128-130.Hirasaki, G.J., Miller, C.A., Raney, O.G., Poindexter, M.K., Nguyen, D.T. and Hera, J. "Separation of Produced Emulsions
from Surfactant Enhanced Oil Recovery Processes", Energy Fuels 2011, 25, 555–561Khorsandi, S., Qiao, C., Johns, R.T., 2017. Displacement efficiency for low salinity polymer flooding including wettability
alteration. SPE J. 22. SPE-179695-PA.Manichand, R.N. and Seright, R. "Field vs laboratory polymer retention values for a polymer flood in the Tambaredjo
field". SPE Reservoir Evaluation & Engineering, Vol. 17, No. 3, SPE 169027-PA, 2014.McGuire, P.L., Redman, R.S, Jhaveri, B.S., Yancey, K.E., and Ning, S.X. "Viscosity Reduction WAG: An Effective EOR
Process for North Slope Viscous Oils", SPE paper 93914, presented at the 2005 SPE Western Regional Meeting heldin Irvine, CA, U.S.A., 30 March – 1 April 2005.
Paskvan, F., Turak, J., Jerauld, G., Gould, T., Skinner, R. and Garg, A. Alaskan viscous oil: EOR opportunity, or waterfloodsand control first? SPE 180463, 2016.
Seright, R. Use of polymers to recover viscous oil from unconventional reservoirs. DOE report, Award No: DE-NT0006555, 2011.
Seright, R. Potential for polymer flooding reservoirs with viscous oils. SPE Reservoir Evaluation & Engineering, Vol.13, No. 4, 2010.
Targac, G.W, Redman, R.S., Davis, E.R, Rennie, S.B., McKeever, S.O. and Chambers, B.C. Unlocking value in WestSak heavy oil. SPE 97856, 2005.
Unsal, E., ten Berge, A.B.G.M. and Wever, D.A.Z., "Low salinity polymer flooding: Lower polymer retention andimproved injectivity", Journal of Petroleum Science and Engineering 163 (2018) 671–682.
Vermolen, E. C. M., Pingo Almada, M., Wassing, B.M., Lighthelm, D.J., Shehadah, M. 2014. Low-salinity polymerflooding: improving polymer flooding technical feasibility and economics by using low-salinity make-up brine,IPTC-17342-MS.