spatio-temporal variation of temperature characteristics ... · spatio-temporal variation of...
TRANSCRIPT

Spatio-temporal variation of temperature characteristics over Narmada basin – is the consistent warming trend a
possible climate change signal?
T. Thomas a, K. P. Sudheer b, N. C. Ghosh c and S. S. Gunte b
a Research Scholar, EWRE Division, Civil Engineering Department, IIT Madras, Chennai, India & Scientist-C, National Institute of Hydrology, Regional Centre, Bhopal, India
b Professor, EWRE Division, Civil Engineering Department, IIT Madras, Chennai, India c Scientist-F & Head, Groundwater Division, National Institute of Hydrology, Roorkee, Uttarakhand, India
Email: [email protected]
Abstract: The analysis of the high resolution gridded data (1° x 1°) of daily maximum, minimum and mean temperature for the 23 grids covering the Narmada basin has detected varying trends in the upper, middle and lower zones of the basin, based on the 40 years data from 1961-2008. The annual 1-day maximum temperature has been steadily increasing at the rate of 1.10°C/100 yr, but the annual 1-day minimum temperature depicted a much higher rate in increase of 3.20°C/100 yr with significant rising trend at 95% significance level (test statistic: Z = +1.989) based on the non-parametric Mann-Kendall test for detection of trend in time series. The zone-wise temperature variation has been studied for two distinct time periods, each of 20 years viz. 1969-88 and 1989-08. A divergent pattern is observed in minimum daily temperature trends in the various zones of the basin with significant rising trends in the lower zone and no significant trend in the upper zone during both time periods. Also a significant rising trend has been detected in the diurnal temperature range (DTR) in the lower zone during August (Z = +2.21), with no significant trends in other months.
Significant rising trends have been detected in the mean monthly temperatures in the upper and middle zones, with no significant trend in lower zone. Similar pattern of significant rising trend have been detected in mean monthly temperatures during the principal winter (December and January) and summer months (April and May) in upper and middle zones of the basin. However, no significant trend has been detected during the principal monsoon months (July and August) for all the zones. As the basin is located in a semi-arid region and the perennial flows result from the contribution from the soil moisture and groundwater storages, any increase in the maximum and minimum temperatures will change the water availability scenario due to increased water demands from higher consumptive use requirements. To study the water demand scenario in the various zones in the basin, the potential evapotranspiration (PET) has been computed. Significant rising trends in PET were detected in all the zones, during the 1989-08 time slot, which indicates higher crop water requirement from the agriculture sector due to the increased temperatures. The comparison of the zonal annual rainfall (AR) with the actual evapotranspiration (AET) which gives an indication of the supply-demand scenario, has found that the annual AET has been greater than AR in the middle zone on 5 occasions during 1969-88 and subsequently increased to 10 occasions during 1989-08, whereas in the lower zone the AET was greater than AR during most of the years in both time periods. This indicates increased water demands and lower rainwater availability under the changing climate scenario, in the middle and lower zones of Narmada basin, which calls for effective water resources development and management strategies.
Keywords: Climate change, Trend analysis, Evapotranspiration, Mann-Kendall, Temperature
20th International Congress on Modelling and Simulation, Adelaide, Australia, 1–6 December 2013 www.mssanz.org.au/modsim2013
2416
T. Thomas et al., Spatio-temporal variation of temperature characteristics over Narmada basin – is the consistent warming trend a possible climate change signal?
1. INTRODUCTION
The earth’s mean surface temperature has warmed by about 0.6°C over the past century based on the available temperature records and climate observations, which may be attributed to the combination of natural and anthropogenic forcing. Rapid industrialization, extensive use of fossil fuels and exploding population growth is the principal cause of the pronounced late twentieth-century warming. But the early twentieth-century warming could have been substantial due to internal climate variability (Delworth and Knutson, 2000). Many researchers (Philandras et al., 1999; Böhm et al., 2001) analyzed the temperature time series from various climate change perspectives across a wide range of temporal and spatial scales. However, the analysis of trends in the temperature time series is a challenging aspect of climatological studies and a number of studies examined trends of temperature in different parts of the world, indicating statistically significant warming (Aesawy and Hasanean 1998; Çiçek and Doğan, 2006). Magnitude and trend of warming of India during the last century over Indian continent is matching with the global condition (Pant and Rupa Kumar, 1997). The rise in global temperatures is attributed partly due to daily minimum temperature increasing at a faster rate than the daily maximum for many parts of the world. But the changes in the temperature patterns are different for different regions with the maximum temperature remaining constant and the minimum temperatures increasing at a faster rate in U.S., whereas both the maximum and minimum temperatures have increased at similar rates in alpine regions of Europe.
Kumar et al., (1994) reported that the maximum temperature has significantly increased during the period of 1901-1987; and the minimum temperature was almost stable resulting in an increase in DTR with the increase in maximum temperature being most prevalent over major parts of India during winter and post-monsoon season. Kothawale and Kumar, (2005) reported that the annual mean temperature has increased at rate of 0.05°C/10 yr while the minimum temperature showed no trend with an accelerated warming in mean temperature at the rate of 0.22°C/10-yr during recent decades. Kothawale et al. (2010) analyzed seasonal and annual trends in surface air temperature over India and seven homogeneous regions and reported a significant increasing trend in annual values of mean temperatures at the rate of 0.51°C/100 yr, maximum temperatures at the rate of 0.72°C/100 yr, and minimum temperature at the rate of 0.27°C/100 yr. Rai et al., (2011) examined the variations in the diurnal temperature range over India and reported significant increasing trends of 0.743, 0.224, 0.484, and 0.52 ͦC for maximum, minimum, mean temperatures and diurnal temperature range during 1901-03. These results which are of varying nature makes it essential to study the change in the patterns of maximum, minimum, and mean temperature at a basin scale for the Narmada basin, for which detailed studies have not been reported.
2. THE STUDY AREA
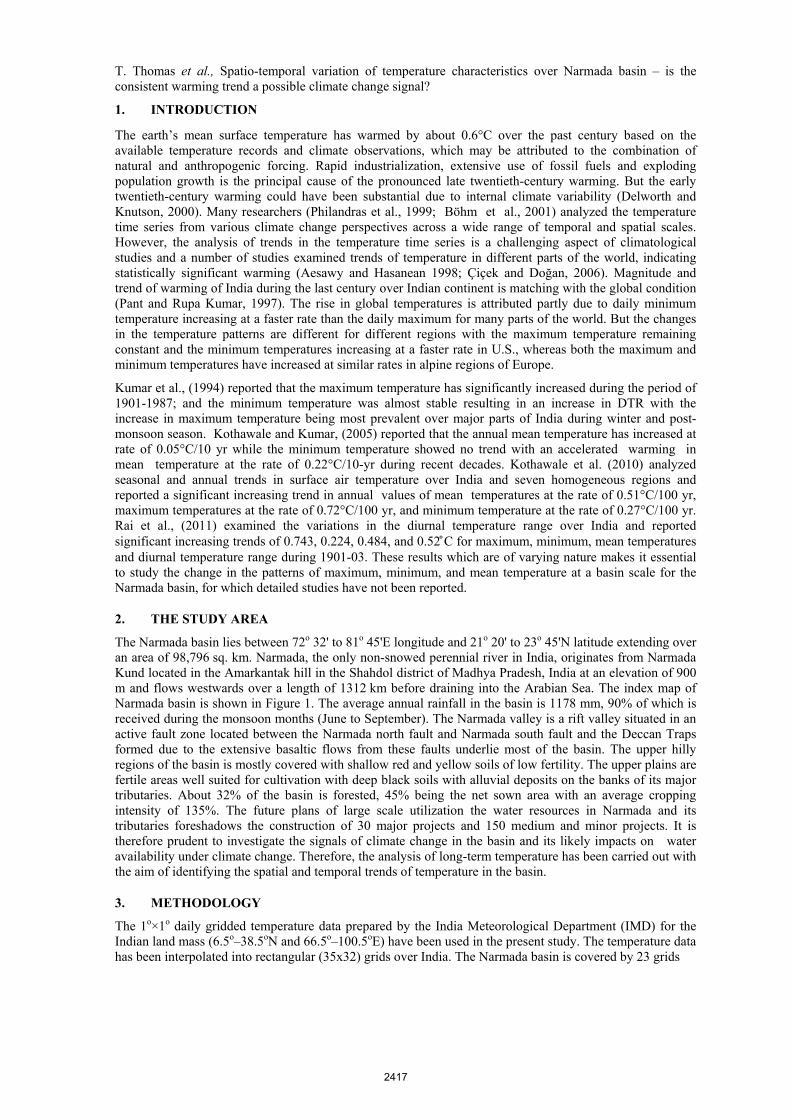
The Narmada basin lies between 72o 32' to 81o 45'E longitude and 21o 20' to 23o 45'N latitude extending over an area of 98,796 sq. km. Narmada, the only non-snowed perennial river in India, originates from Narmada Kund located in the Amarkantak hill in the Shahdol district of Madhya Pradesh, India at an elevation of 900 m and flows westwards over a length of 1312 km before draining into the Arabian Sea. The index map of Narmada basin is shown in Figure 1. The average annual rainfall in the basin is 1178 mm, 90% of which is received during the monsoon months (June to September). The Narmada valley is a rift valley situated in an active fault zone located between the Narmada north fault and Narmada south fault and the Deccan Traps formed due to the extensive basaltic flows from these faults underlie most of the basin. The upper hilly regions of the basin is mostly covered with shallow red and yellow soils of low fertility. The upper plains are fertile areas well suited for cultivation with deep black soils with alluvial deposits on the banks of its major tributaries. About 32% of the basin is forested, 45% being the net sown area with an average cropping intensity of 135%. The future plans of large scale utilization the water resources in Narmada and its tributaries foreshadows the construction of 30 major projects and 150 medium and minor projects. It is therefore prudent to investigate the signals of climate change in the basin and its likely impacts on water availability under climate change. Therefore, the analysis of long-term temperature has been carried out with the aim of identifying the spatial and temporal trends of temperature in the basin.
3. METHODOLOGY
The 1o×1o daily gridded temperature data prepared by the India Meteorological Department (IMD) for the Indian land mass (6.5o–38.5oN and 66.5o–100.5oE) have been used in the present study. The temperature data has been interpolated into rectangular (35x32) grids over India. The Narmada basin is covered by 23 grids
2417

T. Thomas et al., Spatio-temporal variation of temperature characteristics over Narmada basin – is the consistent warming trend a possible climate change signal?
Figure 1: Base map of the Narmada basin
(1o x 1o) as per the IMD interpolated information, of which the lower zone (72oE-76oE & 21oN- 24oN) constitutes 7 grids, the middle zone (76oE-79oE & 21oN-24oN) 8 grids, and the upper zone (79o-82oE & 21oN-24oN) 8 grids as shown in Figure 2. The daily gridded temperature data available from 1969 to 2008 for duration of 40 years have been examined critically to detect changes in the temperature pattern across the Narmada basin. The analysis includes the grid-wise estimation of the 1-day maximum and 1-day minimum temperature, annual mean maximum temperature, annual mean minimum temperature, mean monthly maximum temperature, mean monthly minimum temperature, diurnal temperature range (DTR) and annual temperature range (ATR). The spatial and temporal variation of these temperature characteristics has been studied in detail to detect possible climate change signals over different zones in the Narmada basin.
Figure 2: Grid information of Narmada basin
To identify trend in the climatic variables with reference to climate change, the non-parametric Mann-Kendall test employed by a number of researchers for detection of trend in temperature, precipitation and stream flow time series (Yu et al., 1993; Burn et al., 2004) has been applied to determine monotonic trends. However the data series were tested for serial correlation before the actual application of the Mann-Kendall test. Wherever the lag-1 auto-correlation (r1) was found to be non-significant at 95% confidence level, the Mann-Kendall test was directly applied to the original data series (x1, x2, …, xn), otherwise the Mann-Kendall test was applied to pre-whitened series obtained as (x2 – r1x1, x3 – r1x2, …, xn – r1xn-1). The Mann-Kendall statistic (S) is defined as given by (1).
( )−
= +=
−=1
1 1
sgnN
i
N
ijij xxS (1)
2418

T. Thomas et al., Spatio-temporal variation of temperature characteristics over Narmada basin – is the consistent warming trend a possible climate change signal?
where, sgn(xj – xi) = 1 if (xj – xi) > 1; 0 if (xj – xi) = 1; -1 if (xj – xi) < 1
N is the number of data points. For large samples (N > 10), the test is conducted using a normal distribution with the mean and the variance as given in (2) and (3).
E(S) = 0 (2)
var(S) = ( )( ) ∑ ( )( ) (3)
where n is the number of tied (zero difference between compared values) groups, and tk is the number of data points in the kth tied group. The standard normal deviate (Z statistic) is then computed by (4).
Z = ( ) if S > 0; 0 if S = 0; ( ) if S < 0 (4)
If Z > +1.96 or Z < –1.96, the null hypothesis (Ho) of no trend is rejected at 95% significance level.
4. RESULTS AND DISCUSSIONS
The Narmada basin which is an elongated basin has been divided into three distinct zones based on the physiographic conditions viz., upper zone (79o00′ to 82o00′ & 21o00′ to 24o00′); middle zone (76o00′ to 79o00′ & 21o00′ to 24o00′); and lower zone (72o00′ to 76o00′ & 21o00′ to 24o00′
) to study the variability in the temperature pattern and identify significant increasing/decreasing trends in temperature characteristics over the basin. The annual 1-day maximum temperature for the grids falling in the three zones of Narmada basin has been estimated from the data series of daily maximum temperature (Tmax). The results of the analysis indicate that the 1-day maximum temperature in Narmada basin has been increasing steadily over the last 40 years even though the trend is not significant at 95% significance level. However, the rate of increase in the 1-day maximum temperature is found to be 1.10°C/100 yr which is more than the global average rate. The annual 1-day minimum temperature in the basin also shows a significant rising trend at 95% significance level (Z = +1.989) with the rate of increase of 3.20°C/100 yr which is rather very high, about three times the rate of maximum temperature increase. The temporal variation of the annual 1-day maximum and minimum temperature in the basin is given in Figure 3. The zone-wise variation has therefore been studied to identify any change in the temperature patterns during two distinct time periods viz., a) initial 20-yr period (1969-88) and b) latest 20-yr period (1989-08). The comparison of the temporal variation in minimum temperature during the two time slots in the lower zone is given in Figure 4. An increasing trend with divergent trend pattern has been observed in the 1-day minimum temperature in various zones of Narmada basin during the two time periods, the results of which has been given in Table 1.
Figure 3: Temporal variation of 1-day maximum and minimum temperature in Narmada basin
Table 1: Mann-Kendall test statistic for minimum temperature in Narmada basin
S. No. Zones of Narmada basin Mann-Kendall test statistic & inference 1969-88 1990-2009
1. Upper zone +1.72 (rising but not significant) +1.01 (rising but not significant) 2. Middle zone +2.24 (significant rising trend) +1.29 (rising but not significant) 3. Lower zone +2.31 (significant rising trend) +2.11 (significant rising trend)
41.5
42.0
42.5
43.0
43.5
44.0
44.5
45.0
1969
1972
1975
1978
1981
1984
1987
1990
1993
1996
1999
2002
2005
20081-
day
max
imum
tem
pera
ture
(o C)
Year
3.5
4.5
5.5
6.5
7.5
8.5
9.5
1969
1972
1975
1978
1981
1984
1987
1990
1993
1996
1999
2002
2005
20081-
day
min
imum
tem
pera
ture
(o C
)
Year
2419

T. Thomas et al., Spatio-temporal variation of temperature characteristics over Narmada basin – is the consistent warming trend a possible climate change signal?
2.5
3.0
3.5
4.0
4.5
1969
1972
1975
1978
1981
1984
1987
1990
1993
1996
1999
2002
2005
2008
Ran
ge (
ºC)
Year
2.5
3.0
3.5
4.0
4.5
5.0
1969
1972
1975
1978
1981
1984
1987
1990
1993
1996
1999
2002
2005
2008
Ran
ge (
ºC)
Year
Figure 4: Temporal variation of minimum temperature in the lower zone
It can be observed that a significant rising trend in the minimum temperature exists during both time periods in the lower zone whereas there is no significant rising trend during both time periods in the upper zone. Therefore the lower zone representing the plains and coastal areas experience a higher rise in minimum temperatures since 1969 as compared to other zones in the Narmada basin.
The DTR have been computed for all the three zones in the basin. Except for a significant rising trend in the lower zone during August (+2.21) which is one of the principal months of the monsoon season, no significant trend was observed in any of the other months. The absence of any significant trend may be due to the rise in mean monthly maximum temperature as well as mean monthly minimum temperature. The annual temperature range (ATR), which is the difference between the annual maximum and annual minimum temperatures, has been computed and is shown in Figure 5. The Mann-Kendal test statistic for ATR in the various zones of the basin is given in Table 2. It has been observed that the ATR increases in the upper and middle zones. This increase is statistically significant at 95% significance level. At the same time, ATR shows a declining trend in the lower zone. The decreasing trend in ATR in the lower zone is due to the higher rate of increase in minimum temperature in comparison to the maximum temperature rise, resulting in reduced temperature differences and decreasing ATR.
Figure 5: Annual temperature range (ATR) in the upper and lower zones
Table 2: Mann-Kendall test statistic of ATR in various zones of Narmada basin (1969-2009)
S. No. Zones of Narmada basin Mann-Kendall test statistic (Z) Inference
1. Upper zone +2.28 significant rising trend 2. Middle zone +2.11 significant rising trend 3. Lower zone -0.38 no trend
5
6
7
8
9
10
11
12
1-da
y m
inim
um te
mpe
ratu
re
(°C
)
Year
5
6
7
8
9
10
11
12
1-da
y m
inim
um te
mpe
ratu
re
(°C
)
Year
1990-09 1969-88
Middle zone Upper zone
2420

T. Thomas et al., Spatio-temporal variation of temperature characteristics over Narmada basin – is the consistent warming trend a possible climate change signal?
The zone-wise analysis of mean monthly maximum temperature in the Narmada basin shows a significant rising trend in the upper and middle zones, with no significant trend in the lower zone. Similar patterns for trend are also observed during December which is another principal winter month. This suggests significant rising trends in the mean monthly maximum temperature during winter months in upper and middle zones of the basin. The analysis for the summer months (April and May) also depict a similar pattern of trend with significant rising trends in the upper and middle zones and no trend in the lower zone. However during the principal monsoon months of July and August, no significant trend is observed in the mean monthly maximum temperature in all the three zones of Narmada basin.
The Narmada basin being located in a semi-arid region, any increase in the maximum and minimum temperature will affect the water demand pattern including the evapotranspiration and water requirement for crops. The potential evapotranspiration (PET) has been computed using the Thornthwaite method. The average PET is computed based on the gridded PET for each of the three zones in the Narmada basin. The M-K test was applied to test the significance of the trend in the PET in various zones of the basin during the initial and latest 20-yr periods the results of which are given in Table 3. It is observed that, there has been no significant trend in the PET in all the three zones during the period 1969-88, whereas the period 1988-09, shows a positive trend in PET values at 95% significance level in all three zones. This is possibly due to an increase in mean temperatures.
Table 3: Mann-Kendall test statistic for PET in various zones of Narmada basin
Year Upper zone Middle zone Lower zone 1969-88 +1.91 No trend +0.75 No trend -0.42 No trend 1990-09 +2.11 +ve trend +2.10 +ve trend +2.49 +ve trend
The annual rainfall and annual actual evapotranspiration (AET) were compared for all the three zones to assess the water availability scenario. The AET is assumed to be 60% of the PET based on the literature from earlier studies and soils and crops grown in the basin. It is observed that the situation in the upper zone is favorable without any adverse impacts from climate change since the annual rainfall (AR) is greater than the annual AET in most of the years except during three occasions during 1974, 1979 and 2006. The situation is quite different in the middle zone where the annual AET is greater that AR on 5 occasions during 1969-88 increasing to 10 occasions during 1990-09. This indicates that the water availability scenario has deteriorated to every alternate year becoming a water deficit year in the middle zone. However, the scenario is more alarming in the lower zone, with the annual AET being greater than AR for most of the years during the entire period of analysis from 1969-09 as can be observed in Figure 6. This may be due to the fact that the minimum temperature and the mean temperature in the lower zone are increasing significantly leading to higher PET and AET along with the annual rainfall and its variability which is highest in lower zone. This calls for more comprehensive water resources management and conservation practices in the lower zone compared to the middle and upper zones.
Figure 6: Comparison of AR and AET in the upper and lower zones
700
900
1100
1300
1500
1700
1900
2100
1969
1972
1975
1978
1981
1984
1987
1990
1993
1996
1999
2002
2005
2008
AR
and
ann
ual A
ET
(m
m)
Year
Annual rainfallActual ET
Upper zone
500
700
900
1100
1300
1500
1700
1900
2100
1969
1972
1975
1978
1981
1984
1987
1990
1993
1996
1999
2002
2005
2008
AR
l and
ann
ual
AE
T (
mm
)
Year
Annual rainfall
Actual ETLower zone
2421

T. Thomas et al., Spatio-temporal variation of temperature characteristics over Narmada basin – is the consistent warming trend a possible climate change signal?
5. CONCLUSIONS
The analysis of temperature variability and detection of trends in the annual, winter, pre-monsoon, monsoon, post-monsoon, monthly and daily maximum and minimum temperature has been carried out at a basin scale for the three distinct zones in the Narmada basin. A consistent increasing trend has been detected in the maximum and minimum temperature for all the zones in the basin. Application of the non-parametric Mann-Kendall’s methodology also indicated that magnitudes of trend during last two decades are more intense for minimum temperature as compared to maximum temperature. This is also in agreement with the findings of decreasing difference between the day time high temperatures and night time low temperatures is in most parts of the world including India. The results of the analysis indicate that the 1-day maximum temperature in Narmada basin has been rising steadily over the last 41 years at a rate of 1.10°C/100 yr which is more than the global average, even though the trend is not significant at 95% significance level. The 1-day minimum temperature shows a significant rising trend at 95% significance level (Z = +1.989), at a rate of 3.20°C/100 yr, which is about three times the rate of 1-day maximum temperature increase. Further, a significant rising trend in the 1-day minimum temperature has been detected during both time periods in the lower zone which includes the lower plains and coastal areas. A significant rising trend in mean monthly maximum temperature has been detected in the upper and middle zones during the principal winter and summer months. No significant trend in the PET has been detected in all the three zones during 1969-88, whereas during 1988-09, but a significant positive trend at 95% significance level has been detected in all zones in the basin due to an increase in mean temperatures. The detailed basin scale analysis will be useful to identify the likely influence of temperature change on hydrologic cycle and planning future water resources development and management in Narmada basin under the changing climate scenario.
REFERENCES
Aesawy, A.M. and Hasanean, H.M. (1998). Annual and seasonal climatic analysis of surface air temperature variations at six Mediterranean stations. Theoretical and Applied Climatology, 61, 55–68.
Böhm, R., Auer, I., Brunetti, M., Maugeri, M., Nanni, T. and Schöner, W. (2001). Regional temperature variability in the European Alps: 1890 –1998 from homogenized instrumental time series. International Journal of Climatology, 21, 1779–1801.
Burn, D.H., Cunderlik, J.M. and Pietroniro, A. (2004). Hydrological trends and variability in the Liard river basin. Hydrological Sciences Journal, 49(1), 53–67.
Çiçek, İ. and Doğan, U. (2006). Detection of urban heat island in Ankara, Turkey. Nuovo Cimento Journal, 29(4), 399–409.
Delworth, T.L. and Knutson, T.R. (2000). Simulation of early 20th century global warming. Science, 287, 2246–2250.
Kothawale, D.R., Munot, A.A. and Kumar, K.K. (2010). Surface air temperature variability over India during 1901–2007 and its association with ENSO. Climate Research, 42, 89–104.
Kothawale, D.R. and Rupa Kumar K. (2005). On the recent changes in surface temperature trends over India. Geophysical Research Letters, 32, L18714.
Kumar, K.R., Kumar, K.K. and Pant, G.B. (1994). Diurnal asymmetry of surface temperature trends over India. Geophysical Research Letters, 21(8), 677–680.
Philandras, C.M., Metaxas, D.A., and Nastos, P.T. (1999). Climate variability and urbanization on Athens. Theoretical and Applied Climatology, 63, 65–72.
Pant, G.B. and Rupa Kumar, K. (1997). Climates of south Asia. John Wiley & Sons, Chichester, 320.
Rai, A., Joshi, M.K. and Pandey, A.C. (2012). Variations in diurnal temperature range over India: under global warming scenario. Geophysical Research Letters, 117, 1–12.
Yue, Y.S., Zou, S. and Whittemore, D. (1993). Non-parametric trend analysis of water quality data of rivers in Kansas, Journal of Hydrology, 150, 61–80.
2422