spatio-temporal variation and dissolved organic...
TRANSCRIPT

SPATIO-TEMPORAL VARIATION AND DISSOLVED ORGANIC CARBON PROCESSING
OF STREAMBED MICROBIAL COMMUNITY:
STABLE CARBON ISOTOPE APPROACH
by
PHILIPS OLUGBEMIGA AKINWOLE
ROBERT H. FINDLAY, COMMITTEE CHAIR AMELIA K. WARD JULIE B. OLSON
BEHZAD MORTAZAVI FRED T. ANDRUS
A DISSERTATION
Submitted in partial fulfillment of the requirements for the degree of Doctor of Philosophy
in the Department of Biological Sciences in the Graduate School of
The University of Alabama
TUSCALOOSA, ALABAMA
2013

Copyright Philips Olugbemiga Akinwole 2013 ALL RIGHTS RESERVED
ii
ABSTRACT
Sedimentary microbial communities play a critical ecological role in lotic ecosystems and are
responsible for numerous biogeochemical transformations, including dissolved organic matter
(DOM) uptake, degradation, and mineralization. The goals of this study were to elucidate the
benthic microbes responsible for utilization of humic DOM in streams and to assess overall
variability in microbial biomass and community structure over time and across multiple spatial
scales in stream networks, as DOM quality and quantity will likely change with stream order. In
Chapter 2, multiple spatial patterns of microbial biomass and community structure were
examined in stream sediments from two watersheds; the Neversink River watershed (NY; 1st, 3rd
and 5th order streams sampled) and the White Clay Creek watershed (PA; 1st through 3rd order
streams sampled). Microbial biomass and community structure were estimated by phospholipid
phosphate and phospholipid fatty acids (PLFA) analyses. Multivariate analysis showed that
sedimentary C:N ratios, percent carbon, sediment surface area and percent water content
explained 68% of the variations in total microbial biomass. Overall, the magnitude of within
stream variation in microbial biomass was small compared to the variability noted among
streams and between watersheds. Principal component analysis (PCA) of PLFA profiles showed
that microbial community structure displayed a distinct watershed-level biogeography, as well as
variation along a stream order gradient. Chapter 3 demonstrated that benthic microbial biomass
was seasonally dynamic and significantly correlated to a combination of high and low flood
pulse counts, variability in daily flow and DOC concentration in the White Clay Creek.
Additionally, the seasonal pattern of variation observed in microbial community structure was as

iii
a result of shift between the ratios of prokaryotic to eukaryotic component of the community.
This shift was significantly correlated with seasonal changes in median daily flow, high and low
flood pulse counts, DOC concentrations and water temperature. Compound-specific 13C analysis
of PLFA showed that both bacterial and microeukaryotic stable carbon isotope ratios were
heaviest in the spring and lightest in autumn or winter. Bacterial lipids were isotopically depleted
on average by 2 - 5‰ relative to δ13C of total organic carbon suggesting bacterial consumption
of allochthonous organic matter, and enriched relative to δ13C algae-derived carbon source. In
Chapter 4, heterotrophic microbes that metabolize humic DOM in a third-order stream were
identified through trace-additions of 13C-labeled tree tissue leachate (13C-DOC) into stream
sediment mesocosms. Microbial community structure was assessed using PLFA biomarkers, and
metabolically active members were identified through 13C-PLFA analysis (PLFA-SIP).
Comparison by PCA of the microbial communities in stream sediments and stream sediments
incubated in both the presence and absence of 13C-DOC showed our mesocosm-based
experimental design as sufficiently robust to investigate the utilization of 13C-DOC by sediment
microbial communities. After 48 hours of incubation, PLFA-SIP identified heterotrophic α, β,
and γ- proteobacteria and facultative anaerobic bacteria as the organisms primarily responsible
for humic DOC consumption in streams and heterotrophic microeucaryotes as their predators.
The evidence presented in this study shows a complex relationship between microbial
community structure, environmental heterogeneity and utilization of humic DOC, indicating that
humic DOC quality and quantity along with other hydro-ecological variables should be
considered among the important factors that structure benthic microbial communities in lotic
ecosystems.

iv
DEDICATION
I dedicate this piece of work to my family: Taiwo, Susan, Daniella and David for they are there for me every single day.

v
LIST OF ABBREVIATIONS AND SYMBOLS
a Anteiso
ANOVA Analysis of Variance
br Branched
12C Carbon with a mass of 12
13C Carbon with a mass of 13
C18 18 carbon chain
CO2 Carbon dioxide
cm Centimeter
cy Cyclo
df Degrees of freedom: number of values free to vary after certain restrictions have been placed on the data
DI Deionized water
DOC Dissolved organic carbon
DOM Dissolved organic matter
FAMEs Fatty acid methyl esters
FHC High flood pulse count
FIG Figure
FLC Low flood pulse count
ffw Fresh wet weight
g Gram

vi
gdw Gram dry weight
GC/C/IRMS Gas chromatography-combustion-isotope ratio mass spectrometry
GF/F Glass fiber filters
h Hour
ha Hectare
iso Iso
IHV Indicators of hydrological variation
kDa Kilodalton
km Kilometer
L Liter
ln Natural log
m Meter
m2 Meter squared
m3 Meter cubed
M Mean: the sum of a set of measurements divided by the number of measurements in the set
MBI Base flow index
MDF Mean daily flows
MQ50 Median daily flow
MVD Variability in daily
mg Milligram
min Minute
mL Milliliter
mm Millimeter

vii
n Number of sample size
14N Nitrogen with a mass of 14
ng Nanogram
nmol Nanomole
NIST National Institute of Standards and Technology
p Probability associated with the occurrence under the null hypothesis of a value as extreme as or more extreme than the observed value
pH Concentration of hydrogen ions
PCA Principle component analysis
PLFA Phospholipid fatty acids
PLP Phospholipid phosphate
ppm Parts per million
r Pearson product-moment correlation
s Second
t Computed value of t test
v Volume
v/v/v Volume to volume
V-PDB Vienna Pee Dee Belemnite standard
< Less than
> Greater than
= Equal to
α Alpha
β Beta
γ Gamma

viii
δ Delta
µ Micro
µg Microgram
µL Microliter
µm Micrometer
ω Omega
% Percent
‰ Per mille
ºC Temperature in Celsius

ix
ACKNOWLEDGMENTS
As I hit on the keyboard of my laptop while writing this section of my dissertation, I
realize that I am within a few days of completing my doctoral studies, after a long tiring process
that have presented some challenges. I got to this point because of so many gracious people that
helped nudged me ahead and made valiant efforts to keep me prepared for the next challenges.
My best conceivable advisor: Bob Findlay:
Words cannot express my heartfelt gratitude, appreciation and thanks for all the support,
guidance and time you provided for this research project and my graduate training; right from the
day you picked me up at the Atlanta International Airport to the completion of this dissertation.
You walked me though the dark moments of my academic birth pangs and believed in me; that
worked into something good. Thank you.
My Dissertation Committee- Drs. Ward, Olson, Mortazavi and Andrus:
Your dedication, guidance, consideration and insightful suggestions are greatly appreciated.
Thank you for your constructive comments every step of the way and all the little ‘extra push’ so
that I can become better. Thank you.
Department of Biological Sciences and Graduate School:
I express my thanks to the Department of Biological Sciences for the teaching assistantship that
provided much needed stipend and exposure to classroom settings. I am grateful to the Graduate
school for Dean’s Discretionary Scholarship for the Fall 2009 semester towards the successful
completion of my degree. Thank you.

x
Collaborating institute and teams:
Stroud Water Research Centre, Avondale, PA and Stable Isotope Biogeochemistry Lab,
Michigan State University. Thanks to all the people who stayed with me through all the
challenges and pitfalls of experimental work: setting up mesocosms, collecting sediment
samples, putting me through the GC/C/IRMS, including their support in several inches of snow
in Michigan and hiking the Catskill Mountain in New York: Lous Kaplan, Robert Sherman,
Michael Gentile, Peggy Ostrom and Hasand Ghandi. Thank you.
My lab mates and colleagues:
Janna Brown, Prarthana Ghosh, Jen Mosher, Thomas Branan, Joshua Mays, Edwina Clarke,
Brian Shirey, Michael Kendrick and Elise Chapman, for technical and logistic supports, and
taking time out of no time to share information and knowledge at various levels. Thank you.
My awesome family:
Special thanks to my best friend and loving wife; Taiwo and beautiful kids, Susan, Daniella and
David. With your love and support despite my little stipend and my ‘absenteeism’ at home, you
have made this adventure successful. We made it together! Finally, to my families and friends at
‘home,’ thousands of miles away for asking me to finish my studies in time because I need to
start making money. Thank you for those reminders and your understanding all the way.
To Him:
‘…But you are not dead: you lives and abides forever,
For in you we live and move and have our being’
Epimenides of Crete

xi
TABLE OF CONTENTS
ABSTRACT ................................................................................................ ii
DEDICATION ........................................................................................... iv
LIST OF ABBREVIATIONS AND SYMBOLS ........................................v
ACKNOWLEDGMENTS ......................................................................... ix
LIST OF TABLES .................................................................................... xii
LIST OF FIGURES ................................................................................. xiii
CHAPTER 1: GENERAL INTRODUCTION ............................................1
CHAPTER 2: SPATIAL PATTERNS OF MICROBIAL SIGNATURE BIOMARKERS IN STREAM NETWORKS ...........12
CHAPTER 3: SEASONALITY IN A STREAMBED MICROBIAL
COMMUNITY: VARIATION IN THE ISOTOPIC COMPOSITION OF LIPID BIOMARKERS……………………..52
CHAPTER 4: ELUCIDATING THE BACTERIA RESPONSIBLE FOR UTILIZATION OF DISSOLVED ORGANIC MATTER IN A THIRD-ORDER STREAM .....................................................96
CHAPTER 5: OVERALL CONCLUSIONS...........................................134
REFERENCES ........................................................................................140
APPENDIX ..............................................................................................147

xii
LIST OF TABLES
TABLE 1.1 Personal contribution of POA to the NSF funded project and
publications……………………………………………………………….…….…9 TABLE 2.1 Microbial biomass, water chemistry and sediment organic content of
White Clay Creek and Neversink watersheds……………………………………49 TABLE 2.2 Nested ANOVA to test the effects of watershed, streams within watershed,
and stations within streams on microbial biomass…………………………….…50 TABLE 2.3 Multiple regression analysis (best subsets) for natural log biomass as a
function of various physical and chemical stream parameters…………………..51 TABLE 3.1 Seasonal variations in total sedimentary microbial biomass, bacterial
abundance, and physico-chemical parameters of White Clay Creek…………….91 TABLE 3.2 Pearson correlation coefficient matrices between selected hydrological
indices and measured environmental variables…………………………………..92 TABLE 3.3 Multiple regression analysis (best subsets) for natural log biomass as a
function of stream physico- chemical and hydrological indices…………………93 TABLE 3.4 Multiple regression analysis (best subsets) for microbial community
(PC1) as a function of stream physico-chemical and hydrological indices………94 TABLE 3.5 Annual variations in stable carbon isotope signatures for selected
common fatty acids from White Clay Creek sediments. Values shown are mean (±SD) from all sampling sites and months…………………….95
TABLE 4.1 Experimental design of 13C-DOM uptake experiments….....................................131 TABLE 4.2 Microbial PLFA δ13C values (‰; mean ± SD) from 6 mesocosm experiments
determined using DB-1 and DB-23 chromatographic columns…………………132 TABLE 4.3 Phylogenetic affiliation of bacterial fatty acids functional groups extracted
from White Clay Creek sediment…………………………………………….....133

xiii
LIST OF FIGURES
FIG 1.1 Mesocosm setup for 13C leachate uptake measurement, including streamwater-fed bioreactors/ mesocosm chambers containing sediments and water jackets. One chamber without 13C leachate amendment served as experimental control………...…10
FIG 1.2 Close up view of mesocosm chamber showing top surface of a galvanized
sediment box contiginous with the front ramps of the Venturi flumes and associated recirculating pipes system…………………………………………………11
FIG 2.1 Sampling scheme used to examine microbial biomass and community structure across
multiple spatial scales in two watersheds. Sampling within the Neversink watershed consists of four 1st order streams; Biscuit Brook and Pigeon Creek tributaries (Biscuit Brook Tributary A and B [BBTA, BBTB], Pigeon Creek Tributary A and B [PBTA, PBTB], 1a, 1b, 1c, 1d, respectitively), two 3rd order streams (Biscuit Brook [BBR] and Pigeon Creek [PBR], 3a, 3b, respectitively) and one 5th order stream (Neversink River [NRC]). Sampling within the White Clay Creek watershed consists of four 1st order streams (Ledyards Spring Branch [LSB], Water Cress Spring [WTR], Dirty Dog Spring [DDS] and Walton Spring Branch [WSB], 1e, 1f, 1g, 1h, respectitively), two 2nd order streams (East and West Branch White Clay Creek [WCWE, WCCW], 2a, 2b, respectitively) and one 3rd order stream (White Clay Creek [WCC]). Sketches of watersheds are not drawn to scale. Each eclipse represents a reach, which contained 3 stations, each of which was sampled times………………………………………..…42
FIG 2.2 Variation in sediment (a) percent carbon, (b) percent nitrogen and (c) C:N ratio
by stream, order (1st to 3rd/5th order from left to right) and watershed. Vertical bars denote 0.95 confidence intervals. Streams not connected by a horizontal line are significantly different (p = 0.05, Tukey’s Wholly Significant Difference)…………………………………………………………..……43
FIG 2.3 Microbial biomass (mean ± SD) of White Clay Creek and Neversink watershed
sediments at three spatial scales: a; watershed, b; stream and c; station. Stream order (or average order for watershed values) are indicated as: black = 1st order, dark gray = 2nd order, light gray = 3rd order, open = 5th order…………………………………………………………………………….……44

xiv
FIG 2.4 Path diagrams describing the structure of the relationship between sediment microbial biomass and % Carbon, % water content, C:N ratio and sediment surface area. Single-headed arrows indicate casual paths; numbers on arrows are path coefficients (standardized regression coefficients) indicating the relative strength of each path leading to a given response variable. Double-headed arrows represent the correlations among the predictor variables. Arrows connecting environmental variables to the independent variable (microbial biomass) indicate direct effects, while environmental variables linked to the independent variable via other environmental variable constitute indirect effects. Path coefficients calculated by SAS Structural Equation Modeling for JMP 10. *= P <0.01, **=P <0.001………………………………………………………………45
FIG 2.5 Principle Component Analysis of stream sedimentary microbial community
structure of White Clay Creek (open circle) and Neversink (open square) watersheds. The percent variation explained by each axis is indicated on the respective component axis. Identified fatty acids had component loadings of >|0.5| with strong influence on the pattern of variation among samples along the respective component axes. Site abbreviations are as described in the legend to Fig.1…………………………………………………………………46
FIG 2.6 Relationship between Principle Component Analysis factor 1 score and the
calculated percentage that microeukaryotes contribute to total microbial biomass for all stream samples…………………………………………………….…47
FIG 2.7 Spatial variation in sedimentary bacterial community composition in WCC and
NRC watersheds by PLFA analysis after removal of fatty acids assigned a priori to the functional group microeukaryotes and those known to be common to both bacteria and microeukaryotes from the PLFA profiles. Symbols- WCC (circle), NSR (square). Site abbreviations are as described in the legend to Fig.1………………………………………………………48
FIG 3.1 Mean daily discharge at United States Geological Survey (USGS) gauging
station of the study stream during the study period from November 2009 to October 2010. Arrow represents sampling date of streambed sediment samples………………………………………………………………………86
FIG 3.2 PCA of benthic microbial community structure determined by PLFA from the
White Clay Creek seasonal sampling site. Scores are plotted by months: February, F; March, Ma; April, Ap; May, My; June, Ju; July, Jy; August, Au; September, S; October, O; December, D. Scales indicate the degree of difference among samples and influential fatty acids (factor loadings > |0.5|)] are shown along each axis. Symbols indicate mean PC scores (n=9, except Nov. and Dec. where n =3), error bars = ±S.D……………………………………………...87
FIG 3.3 Relationship between PCA factor 1 score and the calculated percentage that
microeukaryotes contribute to total microbial biomass for all samples……………….88

xv
FIG 3.4 Seasonal variability in sedimentary TOC and selected δ 13C PLFAs with
component loadings >0.5 that exerted strong influence on the pattern of variation among samples along the PC 1 (Fig 5). Bars represent standard deviation………….89
FIG 3.5 PCA of all quantified δ
13C of PLFAs of WCC benthic microbial community. Scores are plotted by months: February, FE; March, MA; April, AP; May, MY; June, JU; July, JY; September, SE; October, OC; December, DE. Influential fatty acids (factor loadings > |0.5|)] are shown along each axis. # summed feature includes 16:1ω9, 16:1ω7c, 16:1ω5c, 16:1w13t; *summed feature includes 18:2ω6, 18:3w3, 18:1ω9, 18:1ω7c, 18:1ω5…………………………………………90
FIG 4.1 Changes in a) microbial biomass, b) percent prokaryotes and c) community
structure summarized by PCA axis 1, among treatments and sampling dates for all experiments. Values are mean differences ± SD, (n = 6). T0-TM= Differences attributed to mesocosm effect, TM-T13C= Differences attributed to the effects of 13C-labeled DOM………………………………………130
1
CHAPTER 1
GENERAL INTRODUCTION
Microbes are important players in lotic ecosystems and are responsible for several
biogeochemical transformations, including liberation of essential nutrients via detrital
decomposition and dissolved organic matter uptake, degradation, and mineralization (Kaplan and
Newbold 1993; Pusch et al. 1998; Fischer and Pusch 2001; Tank et al. 2010). They have small
size, ubiquitous distribution, high surface to volume ratio, short generation intervals, high
metabolic diversity and the highest documented intraspecific genetic diversity of any type of
organism (McArthur et al. 1988; Morehead et al. 1996). Microbial processing of terrestrial
particulate organic matter (POM), dissolved organic matter (DOM) and nutrients within the lotic
ecosystems control the material flux that influence higher trophic levels (Dobbs and
Guckert 1988; Hart 1992; Poff and Ward 1992; Pusch et al. 1998; Cotner and Biddanda 2002).
The utilization of DOM in streams by heterotrophic microbial community controls important
lotic ecosystem processes and supports productivity at higher trophic levels. It is, therefore,
important not only to describe microbial community structure and function, but also, to identify
biological processes and environmental variables that influence their assemblages both
temporally and spatially.
DOM is the largest active pool of carbon in lotic ecosystems and is continuously supplied
to the system from both allochthonous (terrestrial) and autochthonous (aquatic) sources (Peduzzi
et al. 2008). Mounting evidence has shown that it plays a significant role in aquatic ecosystems

2
as carbon and energy sources for the microbial food web (Peduzzi et al. 2008; Wiegner et al.
2009; Wong and Williams 2010), and its flux from streams and rivers often dominates organic
loading to estuaries (Amon and Benner 1996). In addition, due to its dynamic role in the
interaction between hydrosphere and biogeosphere, DOM is now seen as an important driver of
ecosystem functions in freshwater environments and a major component in global carbon cycling
and climate change (Amon and Benner 1996; Batin et al. 2008; Besemer et al. 2009). The
interactions between both the quantity and quality of DOM and stream microorganisms are
important to several key ecosystem functions. Variations in the quality and quantity of DOM can
exert pronounced influence on microbial communities altering characteristic such as biomass,
enzymatic activities, and community structure (Bourguet et al. 2009; Freese et al. 2010, Mosher
and Findlay 2011). For example, experimental manipulations of organic matter concentration
and composition have shown marked changes in bacterial metabolic activities (Smith et al. 1995;
see Findlay and Sinsabaugh 1999 and reviews therein). Also, microbial processes directly
influence qualitative and quantitative transformations of DOM in the environment (Bourguet et
al. 2009). Thus, the fate of DOM is intimately associated with microorganisms that are
responsible for carrying out a wide range of processes that are fundamental to ecosystem
success. However, research efforts to understand DOM utilization through microbial processes
have been complicated by the chemical heterogeneity of the DOM pool and a lack of methods
for measuring in situ microbial activities (Kaplan et al. 2008; Bourguet et al. 2009).
In the past, our knowledge has been on bulk microbial processes, generally treating
microbial community as a “black box” (Cottrell and Kirchman 2000; Foreman and Covert 2003).
Studies linking bacterial community structure with functions, such as DOM turnover, are few
and mostly focus on the microbial processing of tracers that are not reflective of natural stream

3
DOM. Early attempts include NaH13CO3 additions in lakes (Kritzberg et al. 2004; Pace et al.
2004) and 13C-enriched sodium acetate additions in streams (Hall and Meyer 1998; Johnson and
Tank 2009; but see Kaplan et al. 2008). However, with the development of new techniques and
substrate (e.g., leachate from composted 13C-labelled tulip poplar tree-tissues; Wiegner et al.
2005a), we can examine what components of DOM are susceptible to degradation and
understand factors affecting taxon-specificity in utilization ability and improve models of carbon
and energy transformation in aquatic habitats. Thus, we can begin to elucidate which microbial
functional group utilizes a given DOM constituent and if humic DOM supports a significant
portion of stream ecosystem metabolism.
Unlike DOM, the scaling of uptake lengths of nutrients with stream size has been widely
documented (Newbold et al. 1981; Peterson et al. 2001; Hall et al. 2002; Alexander et al. 2007;
Tank et al. 2008; but see Kaplan et al. 2008). For example, uptake lengths are shorter in
headwater streams, whereas streams with greater depth and velocity (i.e., 4th order streams and
above) will have longer uptake lengths (Hall et al. 2002). Our understanding of bacterial
functional group utilization of DOM constituents will not be complete without considering the
spatial scale at which these ecological processes occur. Fortunately, the hierarchical nature of
stream networks, in which a series of successively smaller geomorphic units are nested within
each other (Lowe et al. 2006), makes it a prime candidate to test the application of scaling rules
to DOM uptake across stream orders. In effect, riffles/pools are nested within stream reaches,
which are nested within streams, which are nested within watersheds. Both theoretical models
and experimental evidence have demonstrated that the scale at which ecological processes occur
has an effect on microbial community and diversity (Durrett and Levin 1997; Kerr et al. 2002).
However, studies on systematic assessments of variability in biological aspect of DOM and

4
microbial metabolism across multiple spatial scales are rare. Such an approach, when coupled
with measurements of bio-physiochemical variables, could inform how the controls of microbial
utilization of DOM occur across temporal and spatial scales.
The stable isotope ratios of carbon (measured on isotope ratio mass spectrometers) have
the potential to serve as tracers for sources, flow paths and transformations of dissolved and
particulate organic carbon in lentic and lotic ecosystems (e.g., Hall 1995; Hall and Meyer 1998;
Cole et al. 2002). Measurements of δ13C have been used to investigate DOM dynamics in a wide
variety of streams and laboratory mesocosms (Hall and Meyer 1998; Cole et al. 2002; Wiegner et
al. 2005b). An exciting innovation in isotope ratio analysis is the development of gas
chromatography-combustion-isotope ratio mass spectrometry (GC/C/IRMS). This improved
technique can be used to link microorganisms in environmental samples to utilization of
particular growth substrates (Dumont and Murrell 2005). Presently, lipids, amino acids and
nucleic acids have been used as the biomarker molecules and for compound-specific stable
isotope analysis (Boschker et al. 1998; Radajewski et al. 2000). Phospholipid fatty acid analysis
(PLFA) and lipid profiling are well-established techniques for the identification of
microorganisms and characterization of microbial communities (White et al. 1994; Findlay et al.
1989; 2004). PLFA analysis for assessing the activity of microbial communities in the
environment is greatly augmented by the use of 13C-labelled substrates in conjunction with
GC/C/IRMS (Boschker 2004; Evershed et al. 2006). This approach has proved successful for
linking specific populations within complex microbial consortia with substrate utilization
through 13C enrichment of PLFA biomarkers in various environments and situations (Boschker et
al. 1998). Thus, combining 13C-DOM produced using the technique developed by Wiegner et al.
(2005a) with GC/C/IRMS should provide insights and important information about the dynamics

5
of DOM in aquatic ecosystems and the heterotrophic microorganisms responsible for its uptake
and utilization. The biological lability of DOM, including terrestrial derived humic substances,
and consequently, its importance to bacterial metabolism, underpins the focus of my dissertation.
This study has employed compound-specific stable isotope and PLFA techniques to elucidate the
bacteria responsible for utilization of humic DOM in streams and to assess overall variability in
microbial biomass and community structure temporally and across multiple spatial scales in
stream networks.
The first question addressed is “how similar are stream microbial communities across
multiple spatial scales within and among stream networks” (Chapter 2). Most studies have shown
horizontal variations in microbial abundance, distribution and diversity within a stream
continuum or among streams (Battin et al. 2001; Oda et al. 2003; Crump et al. 2004; Hughes-
Martiny et al. 2006; Fierer et al. 2007), but little attention has been paid to the significance of
multiple spatial scales in stream microbial ecology studies. This research effort investigates
microbial biomass and community structure from streambed sediments in 14 streams within two
forested watersheds across four spatial scales: among individual sediment cores; within reaches
within stream; among streams within watershed and between watersheds. In addition, factors or
set of factors that control the structure of microbial communities in these systems were
investigated. Although some studies have suggested environmental variables that influence
microbial communities in several habitats (Battin et al. 2001; Gao et al. 2005; Fierer et al. 2007),
how environmental heterogeneity structures microbial community composition and distribution
in streambed is not fully understood.
6
Chapter 3 examines seasonal variations in stable carbon isotope signatures of individual
microbial fatty acids of White Clay Creek, a 3rd order piedmont stream in southeastern
Pennsylvania. To the best of our knowledge, there have been no reports describing seasonal
variation in compound specific carbon isotope signatures of individual PLFA in relation to
changes in microbial community structure in stream sediments. Understanding the seasonal
variation of isotopic signatures of specific microbial biomarkers will yield valuable insights into
dynamics of the carbon isotopic composition of the biological and sedimentary substrates in
streams. Unlike studies on seasonal variations in assemblages of stream fishes and invertebrates,
(e.g., Bott and Borchardt 1999; Pires et al. 1999; Cowell et al. 2004; Cleven 2004; Taylor et al.
1996; Hatzenbeler et al. 2000; Davey and Kelly 2007), studies that have investigated the
structure and seasonal dynamics of sedimentary microbial communities are limited in number
(Kaplan and Bott 1989; Smoot and Findlay 2001; Battin et al. 2001; Sutton and Findlay 2003).
Thus, more detailed information on seasonal patterns in benthic microbial community
composition and associated carbon isotope signatures are needed to fully understand the use of
stable isotope probing in adressing the question of DOM use by stream microbiota.
Chapter 4 elucidates which heterotrophic benthic microbes within streams actively utilize
DOM and ultimately control the material flux that influences higher trophic levels. Although
viewed as biologically more recalcitrant and perhaps less energy yielding than monomers (Amon
and Benner 1994), evidence has shown that a portion of the humic substances is biologically
degradable (Moran and Hodson 1990; Carlsson et al. 1999). The research efforts in this chapter
employ bioreactors (Figure 1.1a and b) fitted with undisturbed (as much as possible) sediments
as a laboratory tool to study the incorporation of synthesized tree tissue leachate (Wiegner et al.
2005a) into microbial PLFA biomarkers. The compound-specific 13C analyses of individual

7
PLFAs will allow us to identify the microbial functional group(s) responsible for the uptake of
humic substances in streamwater. Leachate used in this study was synthesized from tulip poplar
seedlings that were earlier grown with 13CO2 at the National Phytotron located at Duke
University, Durham, North Carolina, USA (Wiegner et al. 2005a).
Chapter 5 provides a summary of the major results and conclusions from the
aforementioned chapters and directs attention to their implications in terms of future research
efforts in microbial ecology. This interdisciplinary project contributes to the understanding of the
utilization of labile and semi-labile DOM in streams and provides insight into the efficacy of
mesocosms as tools within microbial ecology. However, my dissertation extends the study of
microbial utilization of labile and semi-labile DOM by including environmental influences that
influence temporal and spatial distributions of microbial community in streams, producing a
better understanding of the importance of headwaters to river networks and important
implications for the protection of forested headwater streams.

8
CONTRIBUTION TO PUBLICATION AND MANUSCRIPTS
My doctoral dissertation was a part of a larger NSF-funded collaborative project to
address the application of scaling rules to energy flow in stream ecosystems; however, my focus
centered on investigating spatio-temporal variations in microbial community in stream networks
and elucidating the bacteria responsible for utilization of dissolved organic matter in streams.
Consequently, my PhD dissertation was interdisciplinary and completed in close collaboration
with Lou Kaplan (biogeochemistry) at Stroud Water Research Centre, Avondale, PA, where
mesocosm experiments were conducted; Peggy Ostrom (geochemistry) at Michigan State
University, East Lansing, MI, where I carried out compound specific stable isotope analysis; and
Robert Findlay (microbial and ecosystem ecology) at University of Alabama, Tuscaloosa, AL,
where I had my graduate training.
The work presented here is based on 3 manuscripts prepared by P.O. Akinwole for
submission to peer-reviewed journals; the close interdisciplinary cooperation will result in a
number of co-authorships. These are:
• Akinwole P.O., L.A. Kaplan and R. H. Findlay. (in prep). Spatial patterns of microbial
signature biomarkers in stream networks. To be submitted to Microbial Ecology
• Akinwole P.O., L.A. Kaplan and R. H. Findlay. (in prep). Seasonal variations in the carbon
isotopic composition of lipid biomarker compounds and structure of a streambed microbial
community. To be submitted to Microbial Ecology
• Akinwole P.O., L.A. Kaplan, P.H. Ostrom and R.H. Findlay. (in prep) Elucidating the
bacteria responsible for utilization of dissolved organic matter (DOM) in a third – order
stream. To be submitted to Ecosystems
9
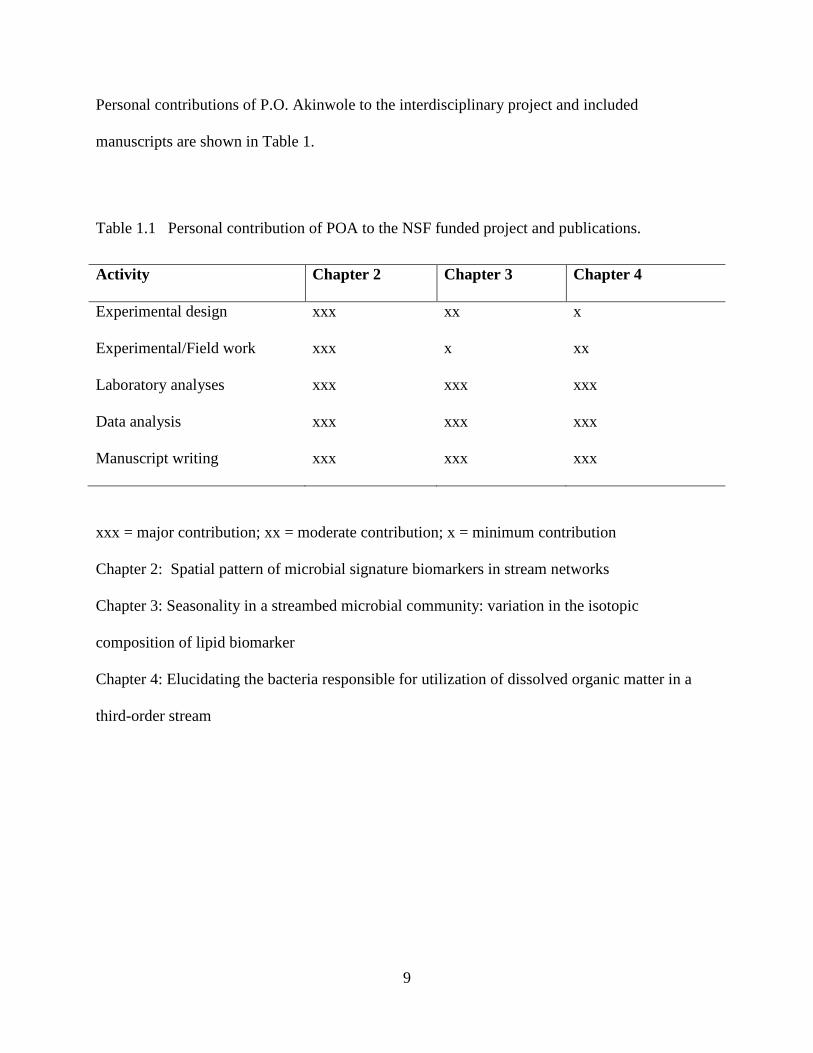
Personal contributions of P.O. Akinwole to the interdisciplinary project and included
manuscripts are shown in Table 1.
Table 1.1 Personal contribution of POA to the NSF funded project and publications.
xxx = major contribution; xx = moderate contribution; x = minimum contribution
Chapter 2: Spatial pattern of microbial signature biomarkers in stream networks
Chapter 3: Seasonality in a streambed microbial community: variation in the isotopic
composition of lipid biomarker
Chapter 4: Elucidating the bacteria responsible for utilization of dissolved organic matter in a
third-order stream
Activity Chapter 2 Chapter 3 Chapter 4
Experimental design xxx xx x
Experimental/Field work xxx x xx
Laboratory analyses xxx xxx xxx
Data analysis xxx xxx xxx
Manuscript writing xxx xxx xxx

10
Fig. 1.1 Mesocosm setup for 13C leachate uptake measurement, including streamwater-fed
bioreactors/ mesocosm chambers containing sediments and water jackets. One chamber without
13C leachate amendment served as the experimental control.

11
Fig. 1.2. Close up view of mesocosm chamber showing top surface of a galvanized sediment
box contiguous with the front ramps of the Venturi flumes and associated recirculating pipes
system.

12
CHAPTER 2
SPATIAL PATTERNS OF MICROBIAL SIGNATURE BIOMARKERS IN
STREAM NETWORKS
ABSTRACT
The large-scale spatial patterns of microbial community structure and diversity are largely
unknown compared to those of macro fauna and flora. We investigated these patterns in stream
sediments from two watersheds; the Neversink River watershed (NY; 1st, 3rd and 5th order streams
sampled) and the White Clay Creek watershed (PA; 1st through 3rd order streams sampled).
Microbial biomass and community structure were estimated by phospholipid phosphate and
phospholipid fatty acids (PLFA) analyses, respectively. Multivariate analysis showed that C:N
ratio, percent carbon, sediment surface area and percent water content explained 68% of the
variations in total microbial biomass. Overall, the variability of microbial biomass within streams
was low compared to the variability among streams and between watersheds. Principal
component analysis of PLFA profiles showed that microbial community structure displayed a
distinct watershed-level biogeography, as well as variation along a stream order gradient. This
study indicates a non-random distribution of microbial communities and that environmental
heterogeneity and geographical distance can influence microbial distribution.
Key words: benthic microbial community, microbial biomass, Neversink and White Clay Creek
watersheds, multiple spatial scales, phospholipid fatty acids

13
INTRODUCTION
Microbial taxa are the most biologically diverse and ubiquitous taxa on earth and their
metabolic activities largely control biogeochemical cycling and ecosystem processing (Curtis and
Sloan 2004; Tringe et al. 2005; Tank et al. 2010). In stream ecosystems, benthic microbial
communities mediate many of the biochemical transformations, including degradation and
transformation of recalcitrant chemical compounds into biomass or inorganic components,
exerting significant control over the mineralization and downstream exportation of terrestrially-
derived dissolved organic matter (DOM) (Kaplan and Newbold 1993; Pusch et al. 1998; Fischer
and Pusch 2001; Tank et al. 2010). In addition, microbial processing of terrestrial-DOM and
nutrients within the streambed sediments is essential to material flux to higher trophic levels (Hart
1992; Poff and Ward 1992; Pusch et al. 1998; Hall and Meyer 1998). Consequently, microbes are
best described as life’s engines driving biogeochemical processes in streams, as well as on earth
(Falkowski et al. 2008).
There has been limited progress in our understanding of how microbial diversity changes
across spatial gradients and comparable research on the microbial biogeographical patterns have
lagged behind research on plant and animal communities (Fierer and Ladau 2012). Attempts to
investigate microbial biogeography in stream sediments have shown the emergence of clear
biome-level patterns in streambed microbial communities (Findlay et al. 2008). Gao et al. (2005)
compared benthic bacterial community structure among nine streams across the southeastern and
midwestern United States and observed differences attributed to variations in chemical
characteristics of the habitats, rather than a pattern driven by spatial gradients. Other studies have

14
shown that microorganisms vary in abundance, distribution and diversity over various habitats
and that microbial composition across landscapes is nonrandom (Øvreås et al. 1997; Cho and
Tiedje 2000; Battin et al. 2001; Oda et al. 2003; Crump et al. 2004; Hughes-Martiny et al. 2006;
Fierer et al. 2007)
How microbial diversity across spatial scales is related to the physical, chemical and biotic
variables of ecosystems is a fundamental question in microbial ecology. Fierer et al. (2007) found
that a single variable, streamwater pH, could predict much of the variability in bacterial
communities inhabiting fine benthic organic matter across the Hubbard Brook watershed.
Changes in quantities and qualities of carbon availability may also alter microbial community
structure in predictable ways (Fierer et al. 2007; Nemergut et al. 2010). Other studies found that
sediment chlorophyll a (Battin et al. 2001; Gao et al. 2005), dissolved organic carbon and nitrate
concentrations (Gao et al. 2005), stream order and current regime (Molloy 1992) were other
environmental variables influencing the structure of microbial communities.
Although our understanding of microbial biogeography continues to expand, there is a
paucity of information on the spatial distribution of microbial communities attached to streambed
substrata of low-order streams and on the factors that control their distributions (Leff 1994).
Particularly, low-order streams serve as important links between terrestrial and larger aquatic
systems (Hullar et al. 2006). Understanding the ecological coherence (Philippot et al. 2011) of
benthic microbial community in headwater streams may have important implications for
ecological linkages between aquatic and terrestrial systems. Stream networks are inherently
hierarchical in nature with a series of successively smaller geomorphic units nested within each
other (reaches are nested within streams and streams within watersheds) (Tiegs et al. 2009).
Characterization of stream networks and the variation in microbial communities across these

15
networks require a sampling regime that adequately captures this complexity. This study
examined microbial biomass and community structure from streambed sediments in forested
streams within two distinct watersheds. We used a nested sampling design and sampled at four
spatial scales: within a station (individual sediment cores separated by <1m); among stations
within a stream reach (separated by >1m but ≤50m); among streams within watershed (separated
by >50m but ≤10km) and between watersheds (separated by >350km). Our study was designed to
investigate how similar stream microbial communities were across multiple spatial scales within
and among stream networks. We hypothesized that increasing spatial scale of fluvial
geomorphology units, from reaches to watersheds, increases variability in microbial communities
at each hierarchical level. We sampled streambed sediments from 1st, 2nd and 3rd - order streams in
White Clay Creek stream network (Avondale, PA, USA) and from 1st, 3rd and 5th- order streams in
the Neversink stream network (Claryville, NY, USA). We used phospholipid-based techniques to
characterize the microbial biomass and community structure of sediments from these streams. Our
data were subjected to multivariate statistical analyses to compare the patterns of microbial
community structure within and between stream networks.

16
METHODS
Study sites and experimental design
Study streams were located within two stream networks: the 3rd order, 7.3 km2 White
Clay Creek (WCC) watershed in the southern Pennsylvania Piedmont, and the 5th order, 171 km2
Neversink River (NSR) watershed within the Catskill Mountains of New York. The WCC
watershed is located within the Piedmont Province of southeastern Pennsylvania and predominant
land uses are agricultural (52%), hayed/grazed fields (22%) and wooded lands (23%) (Wiegner et
al. 2005; Newbold et al. 1997). Streamflow and streamwater chemistry have been monitored since
the 1970s with mean annual stream flow, stream water temperature, and local precipitation of 115
L/s, 10.6º C, and 105 cm, respectively. Streambed sediments consist of clay-, silt-, and sand-sized
particles in pools and runs, with gneiss- and schist-derived gravel and cobble in riffles. The
dominant tree species reported are beech (Fagus grandifolia), red oak (Quercus rubra), black oak
(Quercus velutina) and tulip poplar (Liriodendron tulipifera). Detailed description is given in
Newbold et al. (1997). The Neversink watershed is contained within a mountainous region in
northeast New York State and elevation ranges from 480 m to 1280 m. The hill slopes are steep
with several deeply incised headwater channels and the soils in the Catskills region are
predominantly acidic inceptisols (Lawrence et al., 2001). Streambed sediments consist of clay-,
silt-, and sand-sized particles and shale-, siltstone-, sandstone- and conglomerate-derived gravel
and cobble in riffles. The watershed is sparsely populated and 95% forested, primarily of mixed
northern hardwood species dominated by American beech (Fagus grandifolia), sugar maple (Acer
saccharum) and yellow birch (Betula alleghaniensis). Balsam fir (Abies balsamea) is common

17
above 1,000-m elevation, and hemlock stands grow in a few areas that have poorly drained soils
(Lawrence et al. 2001; Lovett et al. 2002).
We used a hierarchical design to evaluate spatial patterns of microbial biomass and
community structure along a stream order gradient and across four spatial scales, where stream
order refers to Strahler’s (1957) modification of Horton’s (1945) classification system (headwater
streams with no tributaries are 1st order, two first order streams join to form a 2nd order stream,
when two 2nd order streams combine, they form a 3rd order stream and so on). Our nested
sampling design consisted of four spatial scales: 1) > 350km - distance between the watersheds,
2) 50m-10km - distance between streams within a watershed, 3) 1-50m - distance between
sampling stations within a stream reach, and 4) <1m – the distance between replicate cores within
a sampling station (Fig.1). In White Clay Creek stream network, we sampled 3rd order WCC
adjacent to the Stroud Water Research Center in Avondale, Pennsylvania, two 2nd order streams;
White Clay Creek West (WCCW) and White Clay Creek East (WCCE) and four 1st order streams;
Ledyards Spring Branch (LSB), Water Cress Spring (WTR), Dirty Dog Spring (DDS) and Walton
Spring Branch (WSB). Two 1st order streams flowed into each 2nd order stream (LSB and WRT
into WCCW, DDS and WSB into WCCE). In Neversink stream network, we sampled the 5th
order Neversink River (NRC), two 3rd order streams; Biscuit Brook (BBR) and Pigeon Creek
(PBR) and four 1st order streams; Biscuit Brook Tributary A (BBTA), Biscuit Brook Tributary B
(BBTB), Pigeon Creek Tributary A (PBTA) and Pigeon Creek Tributary B (PBTB). Pigeon
Creek, Biscuit Brook and their tributaries are located within the Frost Valley, Claryville, Ulster
County, NY. Within each stream, three stations within a reach (downstream, midstream and
upstream) were established and triplicate sediment samples collected at each station. In summary,
the design consists of 2 stream networks, 7 streams per stream network, 3 stations per stream and
18
3 replicate sediment samples per station, corresponding to a total of 126 sediment samples.
Within the watershed sampled, both rivers were unregulated. All streams within a watershed were
sampled in the same week, and both watersheds were sampled within a 2-week period in July and
August 2010 to avoid seasonal differences.
Sampling procedures
Samples were delimited with a 100mm diameter Plexiglas ring that was inserted 2cm deep
into the streambed (75mm diameter ring was used for 1st order streams whenever streambeds
were dominated by large rocks, cobbles and stones). Plexiglas plates were slipped under and over
the ring to effectively trap the sediments and allow them to be lifted from the streams without
disturbance. Sediments in the top 2mm within the ring were transferred with a clean spatula to
pre-labeled Whirl-Pak sampling bags and stored on ice prior to subsampling. Within six hours of
sampling, sediments were transferred to a clean plastic weigh boat, thoroughly homogenized and
subsampled for phospholipid, surface area and elemental analyses. Subsamples for phospholipid
and elemental analyses were frozen and shipped to the appropriate laboratory for analysis.
Conductivity and water temperature readings were measured with a YSI model 32 conductance
meter.
Phospholipid analysis
Microbial biomass and community structure were determined using phospholipid
phosphate (PLP) and phospholipid fatty acid (PLFA) analyses following the methods of Findlay
(2004). Briefly, cellular lipids were extracted from the frozen sediment samples by
dichloromethane/methanol/water extraction and partitioned into aqueous and organic fractions.
The organic fraction containing the lipids was subsampled for PLP analysis (Findlay et al. 1989).
PLFA were fractionated from the remaining lipids by silica gel solid phase extraction
19
chromatography using chloroform (neutral lipids), acetone (glycolipids) and a solution of
chloroform:methanol:DI water (5:5:1, v:v:v;) as successive eluents. PLFAs were converted into
their respective methyl esters by base methanolysis and purified by octadecyl bonded silica gel
(C18) reverse-phase column chromatography. Purified fatty acid methyl esters (FAMEs) were
identified and quantified using gas chromatography. The FAMEs were analyzed by gas
chromatography in an Agilent gas chromatograph equipped with an automatic sampler, a 60 m x
0.25 mm non-polar DB-1 column and a flame ionization detector. Hydrogen was used as the
carrier gas at a flow rate of 2.3 ml/min. The initial temperature was 80º C followed by a
temperature rise of 4 ºC/min to 250 ºC which was then held at this temperature for 10 min. FAME
identification was based on relative retention times, coelution with standards, and mass spectral
analysis. The FAME nomenclature used followed Findlay and Dobbs (1993). Using polyenoic
fatty acids as indicators of microeukaryotes, total microbial biomass was partitioned between
prokaryotic and microeukaryotic organisms and the results presented as percentages (Findlay and
Dobbs 1993).
Elemental Analysis
The frozen subsamples for elemental analysis were freeze-dried, finely ground, weighed
(about 1.5 - 2g) and inorganic carbonate removed by exposure to gaseous HCl. Approximately 35
mg of sediment was analyzed on a Costech 4010 elemental analyzer for percent carbon and
nitrogen, and atomic carbon to nitrogen ratio (C:N). Stable isotope ratios (δ13C, δ15N) were
determined using a gas source isotope ratio mass spectrometer (ThermoElectron Delta V
Advantage) connected to the elemental analyzer by a ThermoElectron Conflow III. The isotope
ratios were reported in δ notation (‰) relative to Vienna Pee Dee Belemnite standard (V-PDB)
for carbon and Air-N for nitrogen according to:

20
δX [‰] = (Rsample/Rstandard – 1) x 1000 (1)
where X is 13C or 15N, and R is 13C/12C or 15N/14N. Samples were analyzed in duplicate with an
average of 0.02‰ analytical differences (mean difference between all duplicates). The IRMS was
calibrated using international NIST standards as needed and the calibration checked before and
after each run using working standards consisting of freeze-dried, ground spinach leaves and
cornhusks.
Statistical analysis
Nested analysis of variance (ANOVA; stations nested within streams, and streams within
stream networks) with Turkey’s HSD (p < 0.05) was performed on sediment organic content and
microbial biomass log transformed (n+1) data to determine differences across spatial scales (JMP
10 and MINITAB 16). We reported biomass and abundance per gram of fresh weight sediment,
instead of the customary dry weight of sediment, because the sediments varied greatly in their
percent water content, violating the assumption necessary for standardizing data to sediment dry
weight (that is, sediment dry weight only varies with sample size) (Schallenberg and Kalff 1993).
Relationships among variables were investigated using linear regression and multiple regression
analysis (MINITAB 16). We tested data for normality with the Shapiro-Wilk test and
homogeneity of variance with Bartlett test and applied appropriate transformations as needed. For
multiple linear regression analysis, predictor variables were selected using the ‘best subsets’
algorithm in MINITAB. This algorithm fits a small fraction of all possible regression models and
reports the ‘best subset’; we identified the best model based on several selection criteria including
adjusted r2 and Mallows Cp. We used the structural equations modeling (SEM), more specifically
21
path analysis, to further explore the influence of environmental variables on microbial biomass.
SEM is a multivariate statistical technique that tests the importance of pathways in hypothesized
models, and allows comparison of models to experimental data (Mitchell 1992). Standardized
regression coefficients between variables were calculated and plotted as path coefficients on path
diagrams constructed for microbial biomass. These path coefficients can be used to determine the
direct and indirect impacts of environmental variables on the dependent variable. The SEM was
performed in SAS Structural Equation Modeling for JMP 10. Natural log transformed (ln + 1)
PLFA relative abundance data subjected to principal component analysis (PCA) to identify
patterns of variation in the microbial community structure across spatial scales and stream order
gradient. PCA was performed for the combined data set of Neversink and WCC networks (SPSS
19). PLFA profiles were interpreted using a functional group approach (Findlay and Dobbs 1993).
RESULTS
Water chemistry and sediment organic content
Water temperatures, at the time of sampling, were similar for all streams (Table 1). While
conductivity was only measured for two streams in the White Clay Creek watershed, it is clear
that stream water within the Neversink watershed had significantly lower conductivity. Sediment
% C and % N showed a complex spatial pattern with sediments from the 1st order streams LSB
and WTR showing significantly greater C and N content than all other streams except the WCCW
and no significant differences among WCCW and all other streams (Fig. 2a, 2b). Sediment C:N
ratios showed several patterns. In general, C:N ratios were higher in 1st and 2nd order streams and
lower in 3rd and 5th order steam sediments. In addition, C:N ratios were generally higher in the

22
White Clay Creek watershed (range: 16.6 – 9.1) compared to the Neversink watershed (range:
12.99 – 5.62) (Fig. 2c).
Total microbial biomass
Total microbial biomass ranged from 6.77 ± 0.75 to 52.41 ± 4.87 nmol PLP g-1 fresh
weight sediment (Table 1). ANOVA showed that White Clay Creek sediments contained
significantly greater microbial biomass than Neversink River sediments (p = 0.002; Table 2,
Fig.3a) and that there were significant differences among streams within watersheds (Table 2,
Fig. 3b). Variability in sediment microbial biomass among stations within streams ranged from
moderate (~10%) to 2-fold and showed low to moderate (C.V. = 5.32% to 82.65%) within station
variability (Fig. 3c); we did not detect any consistent pattern of higher biomass by station within a
reach (upstream vs. midstream vs. downstream stations). Prokaryotes comprised between 58 and
96% of total biomass with casual observations indicating that streams with open canopies (WSB
and NRC) showed the highest contribution of eukaryotes to total microbial biomass. Bacterial
abundance ranged from 2.03 x 10⁸ to 1.68 x 10⁹ cells g-1 fresh weight of sediment. In general,
streams from the White Clay Creek watershed showed higher total microbial biomass, percent
prokaryotes and bacterial abundance than those within the Neversink watershed (Table 1).
Multiple linear regression analysis indicated that sediment percent carbon content, percent
water content, C:N ratio and sediment surface area explained approximately two-thirds of the
variation observed in sedimentary microbial biomass (Table 3, Model 7). Path analysis was used
to investigate the relationships among these variables and indicated that percent carbon content,
percent water content, and C:N ratio had significant direct effects on biomass and that sediment
surface area was correlated, to a greater or lesser extent, with carbon content, percent water

23
content, and C:N ratio (Fig. 4). Two models were investigated, one constrained and a second
unconstrained, to investigate the theoretical linkage and directionality among the variables. The
constrained model links sediment surface area indirectly to biomass via its direct effects on
sediment carbon and water content while the unconstrained model links surface area indirectly to
biomass via its correlations with sediment carbon content, water content and C:N ratio; these two
models yielded very similar results and we present only the unconstrained model. Percent carbon
content showed the greatest direct effect (r2 = 0.393) as well as substantial indirect effects via its
correlation with percent water content and C:N ratio (Fig. 4). Combined, the direct and indirect
effects of carbon accounted for ~ 61% of the variation in total sediment microbial biomass.
Similarly, percent water content and C:N ratio accounted for 56% and 37%, respectively, of the
variation in total sediment microbial biomass. Sediment surface area via indirect effects
accounted for ~12% of total sediment microbial biomass.
Microbial community structure
The major component of variation in microbial community structure of stream sediments
was related to the proportions of prokaryotes and eukaryotes within communities (Fig. 5 & 6).
The 5th order Neversink River and the 1st order stream WSB showed the greatest relative
abundance of fatty acids indicative of phototrophic and heterotrophic eukaryotic microorganisms
(18:3ω3, 20:5 ω3, 20:4ω6, 18:2ω6, 16:1ω13t); samples from these streams showed large negative
loadings along the PC1. All other streams within both systems showed greater relative abundance
of bacterial fatty acids (cy17:0, cy19:0, a17:0, i17:0, i15:0, br17:1a and 10me16:0). The
assignment of the relative contribution of bacteria and microeukaryotes to total biomass as the
major component of variation based on the high correlation (r2 = 0.88) between PC1 factor scores

24
and the percentage that microeukaryotes comprise of total microbial biomass (Fig. 6) and is likely
related to canopy cover as the NSR and WSB stations were observed to have the most open
canopies. Ignoring the two stations with open canopies, the variation in community structure
among 1st order streams, for the most part, bounds the variation within the watershed. PC 2
separated streams from Neversink watershed, except the 5th order Neversink River, from all
stations within the White Clay Creek watershed. In addition, we observed overlapping PC1 and
PC2 scores for sediments from the two Neversink 3rd order streams (Pigeon and Biscuit Brooks)
and their 1st order tributaries, indicating similar sediment microbial community structure for these
streams. In contrast, microbial community structure of sediment from several of the 1st order
streams within the White Clay Creek system showed significant differences among themselves
and with White Clay Creek sediments.
Bacterial community structure
PCA of bacterial fatty acids profiles separated the two watersheds along the PC1 with all
White Clay Creek watershed samples having positive PC1 scores and all Neversink watershed
samples having negative PC1 scores, and PC1 scores for all streams within a watershed being
similar to at least one other stream within that watershed (Fig. 7). PC 2 separated samples from
Neversink River from all other streams in its watershed and separated samples from Watercress
Spring and Dirty Dog Spring from all other streams in the White Clay Creek watershed.

25
DISCUSSION
Stream networks are highly dynamic ecosystems with inherent spatial heterogeneity. This
spatial heterogeneity has important implications on the functions, distribution and composition of
associated microbial communities. In this study, sediment microbial community structure in the
fourteen streams displayed distinct regional scale variations (hundreds of kilometers: i.e.,
watersheds) and among-stream variations at the scale of hundreds of meters within a watershed,
as well as along a stream order gradient. In addition, clear differences in bacterial community
structure among streams and between watersheds were documented. These findings extend
previous studies examining microbial community structure over regional scales indicating that
habitat and geographical distance are important in structuring microbial communities (Hullar et
al. 2006; Findlay et al. 2008).
PCA indicated that the benthic microbial and bacterial communities of the1st and 3rd order
streams in the Neversink system were relatively homogenous (Fig. 5 & 7). These streams were
fully shaded and received appreciable inputs of terrestrial organic matter that could serve as stable
carbon source for bacterial communities that comprised the largest proportion of total microbial
communities in headwater streams. The separation of Neversink River, based on microbial
community structure, from 1st and 3rd order streams within the Neversink system is related to
greater eukaryotic contribution to total microbial biomass in Neversink River. Field observations
showed active dense filamentous green algal streamers that were particularly abundant at the NSR
station, which has the most reduced canopy cover. These observations were generally consistent
with the predominance of chrysophyte and chlorophyte algal biomarkers (18:3ω3, 20:5ω3,
26
16:4ω1) in describing the variation in microbial community structure among samples from the
Neversink system (Fig. 5). This shift in community structure is indicative of increasing exposure
to greater irradiance along forested stream channels (i.e., as stream order increases, the amount of
stream surface shaded by riparian trees decreases and suggests the potential for decreased
importance of allochthonous detrital carbon and increased importance of autochthonous
production downstream; Vannote et al. 1980). Thus, headwater streams provide distinctive
habitats that shape their characteristic microbial communities in a way that is different in several
ways from larger streams. In contrast, the entire benthic microbial community as well as bacterial
community sampled in WCC network displayed high among-streams variation among 1st order
streams, while bacterial communities within sediments from the 3rd order WCC were the most
similar to those found in the two 2nd order streams. The reaches sampled in two 1st order streams,
WTR and WSB, were located in areas where the forest canopy was less dense, which allowed
local increases in light availability. The separation of these streams from all other stations in
forested WCC system is consistent with the increased contribution of phototrophic
microeukaryotes to total microbial biomass and the importance of algal lipid markers (20:4ω6,
20:5ω3, 18:2 ω6, 18:3ω3) in describing the variation in microbial community structure (Fig. 5).
This suggests that discontinuity in corridors of vegetation along streams and/or modern mosaics
of land uses may alter the degree of autotrophy or heterotrophy of a stream. Studies have
attributed greater algal biomass in forested watersheds to local increases in light availability (Hill
and Harvey 1990; Quinn et al. 1997; Kiffney et al. 2004).
At the regional scale, our data indicated nonrandom spatial variations in total microbial
and bacterial communities supporting current evidence for spatial variation in microbial
community structure (Martiny et al. 2006). This pattern was the most evident in bacterial PLFA

27
profiles of community structure, which showed that the major variation in sedimentary bacterial
community structure occurred at the watershed level and that the differences among streams with
similar general geologic features, light availability and terrestrial vegetation within a watershed
were not significant with respect to the major component of variation (Fig. 7). Our data indicated
that the composition of microbial communities were sensitive to watershed scale processes. Our
findings corroborated those of Findlay et al. (2008) who reported unique streambed communities
for each of three biomes. A major difference between our study and that of Findlay et al. (2008)
was that the two watersheds examined in this study occurred within the same biome (Eastern
Deciduous Forest). This implies that spatial variability in microbial communities occurred at a
variety of spatial scales, ranging from the diversity in an individual environmental sample to the
diversity assessed across multiple biomes.
But what processes generates these patterns? The Baas-Becking hypothesis for microbial
taxa postulates that, ‘everything is everywhere, but, the environment selects’ (Bass-Becking
1934). The claim that ‘the environment selects’ implies that contemporary environmental
variation (multiple habitats) maintain distinctive microbial composition. However, the variation in
community structure at regional scales may involve multiple causal pathways. For instance,
differences in watershed characteristics such as water chemistry, flow regime, temperature, point
source inputs, etc., may generate differences in DOM and nutrient qualities and quantities, which
in turn cause variation in microbial productivity and community structure (Battin et al. 2008).
Also, the proximal causes for the observed variation in streambed microbes between the two
watersheds quantified by PCA may be due, in part, to land-cover differences as the Neversink
watershed is 95% forested while the WCC watershed is a mixture of pasture land and forest. Also,
our data suggested significant differences in conductivity and sediment C:N ratios between the

28
two watersheds. A review of microbial biogeography studies showed that spatial distributions
over small scales often reflect local environmental heterogeneity (reviewed in Martiney et al.
2006). For example, the distribution of bacterial communities in soils (Ramette and Tiedje 2007)
and in water column and surface sediments in lakes (Kondo and Butani 2007) at meter to
kilometer scales correlated with environmental heterogeneity, whereas the distribution of
pseudomonads from undisturbed pristine soils sites (Cho and Tiedje 2000) and hotspring
archaeon Sulfolobus assemblages (Whitaker et al. 2003) in similar habitats separated by
>10,000km correlated with geographical distance. These results indicate that environmental
heterogeneity seems to influence microbial community at small spatial scales, whereas at larger
spatial scales (>10,000km), geographical distance can overwhelm effects of environmental
heterogeneity. Interestingly, studies that sampled at intermediate spatial scale (10 – 3000km)
detected the influence of both environmental heterogeneity and geographical distance on
microbial biogeography (Green et al. 2004; Yannarell and Triplett 2005). In our study, a
hierarchical pattern of overall similarity emerged with the highest similarity found among
samples collected within the same stream, especially within the same station, followed by
similarities among samples collected from different streams with similar general geologic features
and terrestrial vegetation within the same watershed, and finally similarities among samples
collected from different watersheds. This implies that the greatest variation in microbial and
bacterial community composition in streams occurs at the largest spatial scales.
Total microbial biomass and bacterial abundances for both watersheds were within the
range of published microbial biomass for temperate freshwater sediments (Bott and Kaplan 1985;
Sutton and Findlay 2003; Findlay et al. 2008) but lower than that reported for an impacted,
channelized riverine system in central Ohio (Langworthy et al. 1998). If discontinuities in stream
29
geomorphology and hydrology occur between streams of different order as predicted by the river
continuum concept (Vannote et al. 1980; Benda et al 2004), one would expect corresponding
changes in microbiota and ecosystem processes. However, in our study, microbial biomass did
not correlate with increasing stream order as might be expected by the river continuum hypothesis
and biomass levels did not differ significantly at all stations within streams for both watersheds.
Ferris et al. (2003) reported similarities in bacterial cell densities from three separate riffles in
each of three streams investigated. In contrast to reach-scale similarity in microbial biomass, our
data showed significant differences at the stream and between watersheds scales (Fig 3).
Significant differences in microbial biomass of streambed sediments among streams have been
reported in coastal plain, temperate to tropical evergreen forest headwater streams (Findlay et al.
2002; Gao et al. 2005; Findlay et al. 2008) and high alpine streams (Battin et al. 2004). Overall,
the magnitude of within stream variation was small compared to the variability noted among
streams and between watersheds and this suggests that microbial biomass within stream reaches is
relatively tightly constrained. Path analysis indicated that these environmental constraints were
percent sediment carbon content, percent water content, C:N ratio and sediment surface area.
These findings are consistent with previous studies (Bott and Kaplan 1985; Findlay et al. 2002;
Fierer et al. 2007b). The model revealed that the primary direct controls on microbial biomass in
this study were sediment organic carbon, C:N ratios and sediment water content (Fig.4).
Utilization of organic carbon by stream communities can be a measure of ecosystem
productivity, while the concentration of organic carbon reflects a combination of several
biogeochemical processes (Hedges 1992; Wang et al. 2007). As such, sediment organic carbon
may influence microbial biomass through its quantity, quality or a combination thereof. This
study revealed that sediment organic carbon influenced total microbial biomass both directly and

30
indirectly via other correlated variables. Previous studies of stream sediments and terrestrial soils
have shown that quantities of carbon can significantly influcene microbial biomass (Schallenberg
and Kalff 1993, Steenworth et al. 2002; Fierer et al. 2007; Nemergut et al. 2010). In addition,
Findlay et al. (2002) showed that variation in quality of sediment detritus, as measured by C:N
ratio, was negatively correlated with bacterial abundance, while Schallenberg and Kalff (1993)
found variable results (either negative or no correlation) in lake sediments. Our results showed
that total microbial biomass (and bacterial abundance, data not shown) was positively correlated
with both sediment organic carbon and C:N ratio. The cause of the difference between our
findings and those of previous researchers is not known, however, within our system there is a
positive correlation between sediment organic carbon and C:N ratio while there was either no
relationship between FBOM organic carbon and C:N ratio (Fierer et al. 2007) or the relationship
between carbon quantity and quality was not determined (Schallenberg and Kalff 1993; Findlay et
al. 2002).
Another important source of variation in this study was sediment percent water content,
which has been implicated by other investigators in studies of microbial communities (Doran
1987; Schallenberg and Kalff 1993). Aqueous connectivity within sediment particles allows
nutrient and substrate transfer between particles and provides microorganisms with a continuous
supply of nutrients and means to move to more favorable locations (Treves et al. 2003).
Schallenberg and Kalff (1993) showed that percent water content was the single most important
factor explaining sediment bacterial biomass in a series of lakes that differed greatly in sediment
grain sizes.
Sediment surface area indirectly affects microbial community biomass via changes in
percent organic carbon, C: N ratios and percent water content (Fig.4). Sediment grain could

31
generate different micro-habitats and increase microscale environmental heterogeneity which has
been observed to structure microbial soil biomass and community structure (Treves et al. 2003).
In addition, it has been noted that grain size, through its effects on flow rates and availability of
nutrients (Bott and Kaplan 1985; Albrechtsen and Winding 1992; Woessner 2000; Vervier et al.
1992) and quantity and quality of organic carbon (Bott and Kaplan 1985; Kaplan and Newbold
2000; Wilcox et al. 2005), can influence microbial biomass.
At the regional scale, sedimentary microbial biomass and community structure from
White Clay Creek tended to be different from those in Neversink. There are several factors that
could account for these regional effects. White Clay Creek and Neversink watersheds differ in
many aspects, including geology (Newbold et al. 1997; Lawrence et al. 2001), landcover and use
(Newbold et al. 1997; Lovett et al. 2000; 2002), anthropogenic impacts such as acid deposition
(Baldigo and Lawrence 2000), and streamwater chemistry (Newbold et al. 1997; Lawrence et al.
2001 and this study). It is reasonable that these environmental factors could influence stream
microbial biomass and community structure through a variety of mechanisms.
In conclusion, the present study indicated that local environmental factors strongly
influence sediment microbial biomass and that the magnitude of within stream variation in
microbial biomass was small compared to the variability noted among streams and between
watersheds. Our results reveal regional-level patterns in microbial community structure and
suggest that regional scale environmental factors influence the biogeography of microbes.

32
Acknowledgments
Sherman Roberts, Michael Gentile and Janna Brown assisted in sample collection and processing.
Chirstina Staudhammer provided invaluable advice on the application of path analysis; however,
the authors take full responsibility for the application and interpretation of all statistical analyses.
Funding for this project was provided by the National Science Foundation DEB-0516235.

33
LITERATURE CITED
Albrechtsen H.J, Winding A. (1992) Microbial biomass and activity in subsurface sediments from Vejen, Denmark. Microb. Ecol. 23:303–317
Baas Becking, L.G.M. (1934) Geobiologie of inleiding tot de milieukunde. The Hague, the Netherlands: W.P. Van Stockum & Zoon (in Dutch).
Baldigo B.P, Lawrence G.B. (2000) Composition of fish communities in relation to stream acidification and habitat in the Neversink River, New York: Transactions of the American Fisheries Society, 129: 60-76
Battin T.J, Wille A, Sattler B, Psenner R. (2001) Phylogenetic and functional heterogeneity of sediment bioflms along environmental gradients in a glacial stream. Appl. Environ. Microbiol. 67: 799-807
Battin T.J, Wille A, Psenner R, Richter A. (2004) Large-scale environmental controls on microbial biofilms in high-alpine streams. Biogeosciences 1, 159–171
Battin T.J, Kaplan L.A, Findlay S, Hopkinson, C.S, Marti E, Packman A.I, Newbold J.D, Sabater F. (2008) Biophysical controls on organic carbon fluxes in fluvial networks, Nat. Geosci. 1: 95 – 100
Benda L, Poff N.L, Miller D, Dunne T, Reeves G, Pess G, Pollock M. (2004) The network dynamics hypothesis: How channel networks structure riverine habitats. BioScience 54:413–427
Blume E, Bischoff M, Reichert J, Moorman T, Konopka A, Turco R. (2002) Surface and subsurface microbial biomass, community structure and metabolic activity as a function of soil depth and season. Applied Soil Ecology 592, 1–11
Bott T.L., Kaplan L.A. (1985) Bacterial biomass, metabolic state, and activity in stream sediments: relation to environmental variables and multiple assay comparisons. Appl. Environ. Microbiol. 50:508–522

34
Brugger A, Reitner B, Kolar I, Queric N, Herndl G. J. (2001) Seasonal and spatial distribution of dissolved and particulate organic carbon and bacteria in the bank of an impounding reservoir on the Enns River, Austria. Freshwater Biol. 46:997-1016
Cho J.C., Tiedje J.M. (2000) Biogeography and degree of endemicity of fluorescent Pseudomonas strains in soil. Appl. Environ. Microbiol. 66, 5448–5456
Cotner J.B., Biddanda B.A. (2002) Small players, large role: Microbial influence on biogeochemical processes in pelagic aquatic ecosystems. Ecosystems 5:105–121
Crump B.C, Hopkinson C.S, Sogin M.L, Hobbie J.E. (2004) Microbial biogeography along an estuarine salinity gradient: combined influences of bacterial growth and residence time. Appl. Environ. Microbiol. 70, 1494–1505
Curtis T.P., Sloan W.T. (2004) Prokaryotic diversity and its limits: microbial community structure in nature and implication for microbial ecology. Current opinion in microbiology 7:221-226
Dobbs F.C., Guckert J.B. (1988) Microbial food resources of the macrofaunal deposit feeder Ptychodera bahamensis (Hemichordata. Enteropneusta). Mar. Ecol. Prog. Ser. 45: 127-136
Doran J.W. (1987) Microbial biomass and mineralizable nitrogen distributions in no-tillage and plowed soils. Biology and Fertility of soils 5:68-75
Federle T.W, Huliar M.A, Livingston R.J, Meeter D.A, White D.C. (1983) Spatial distribution of biochemical parameters indicating biomass and community composition of microbial assemblies in estuarine mud flat sediments. Appi. Environ. Microbiol. 45:55-63
Ferris K.P, Ramsey P.W, Frazar C, Rillig M.C, Gannon J.E, Holben W.E. (2003) Structure and Seasonal Dynamics of Hyporheic Zone Microbial Communities in Free-Stone Rivers of the Western United States. Microb Ecol. 46:200-215
Fierer N, Morse J, Berthrong S, Bernhardt E.S, Jackson R.B. (2007) Environmental controls on the landscape-scale biogeography of stream bacterial communities. Ecology 88:2162–2173
35
Findlay R.H, King G.M, Watling L. (1989) Efficacy of phospholipid analysis in determining microbial biomass in sediments. Appl. Environ. Microbiol. 54:2888-2893
Findlay R.H., Dobbs F.C. (1993) Quantitative description of microbial communities using lipid analysis, p. 271–284. In P. F. Kemp, B. F. Sherr, E. B. Sherr, and J. J. Cole (ed.), Current methods in aquatic microbial ecology. Lewis Publishers, Boca Raton, FL.
Findlay R.H. (2004) Determination of microbial community structure using phospholipid fatty acid profiles, p. 983–1004. In G. A. Kowalchuk, F. J. De Bruijn, I. M. Head, A. D. L. Akkermans, and J. D. Van Elsas (ed.), Molecular microbial ecology manual, 2nd ed. Kluwer Academic Publishers, Dordrecht, The Netherlands
Findlay R.H, Yeates C, Hullar M.A.J, Stahl D.A, Kaplan L.A. (2008) Biome-level biogeography of streambed microbiota. Applied and Environmental Microbiology, 74, 3014–3021
Findlay S, Tank J.L, Dye S. et al., (2002) A cross-system comparison of bacterial and fungal biomass in detritus pools of headwater streams. Microbial Ecology, 43, 55– 66
Fischer H, Pusch M. (2001) Comparison of bacterial production in sediments, epiphyton, and the pelegiac zone of a lowland river. Freshwater Biol. 46:1335-1348
Frazier S.W, Nowack K.O, Goins K.M, Cannon F.S, Kaplan L.A, Hatcher P.G. (2003) Characterization of organic matter from natural waters using tetramethylamonium hydroxide thermochemolysis GC-MS. J. Anal. Appl. Pyrolysis 70:99–128
Gao X, Olapade O.A, Leff L.G. (2005) Comparison of benthic bacterial community composition in nine streams. Aquat. Microb. Ecol. 40:51–60
Gomez-Brandón M, Lores M, Domínguez J. (2010) A new combination of extraction and derivatization methods that reduces the complexity and preparation time in determining phospholipid fatty acids in solid environmental samples. Bioresour Technol 101(13):48–54
36
Green, J.L., Holmes, A.J., Westoby, M., Briscoe, D., Dangerfield, M., Gillings, M., Beattie, A.J. (2004) Spatial scaling of microbial eukaryote diversity. Nature, 432, 747– 750.
Griffiths R.I, Whiteley AS, O'Donnell A.G, Bailey M.J. (2000) Rapid method for coextraction of DNA and RNA from natural environments for analysis of ribosomal DNA- and rRNA-based microbial community composition. Appl. Environ. Microbiol. 66: 5488–5491
Hart D.D. (1992) Community Organization in Streams: The Importance of Species Interactions, Physical Factors, and Chance. Oecologia (Heidelb.) (Ger.), 91, 220-228
Hawkins C.P, Murphy M.L, Anderson N.H. (1982) Effects of canopy, substrate composition, and gradient on the structure of macroinvertebrate communities in Cascade Range streams of Oregon. Ecology, 63, 1840–1856
Hedges J.I. (1992) Global biogeochemical cycles: progress and problems. Mar. Chem., 39: 67–93
Hill W.R., Harvey B.C. (1990) Periphyton responses to higher trophic levels and light in a shaded stream. Canadian Journal of Fisheries and Aquatic Science, 47: 2307 - 2314.
Horton R.E. (1945) Erosional development of streams and their drainage basins: hydro-physical approach to quantitative morphology, Geological Society of America Bulletin 56 (3): 275–370
Hughes-Martiny J.B, Bohannan B.J.M, Brown J.H et al., (2006) Microbial biogeography: putting microorganisms on the map. Nature Reviews Microbiology 4:102–112
Hullar M.A.J, Kaplan L.A, Stahl D.A. (2006) Recurring seasonal dynamics of microbial communities in stream habitats. Applied and environmental microbiology, 72: 713–722
Kaplan L.A, Newbold J.D. (1993) Biogeochemistry of dissolved organic carbon entering streams. In T. E. Ford (ed.) Aquatic microbiology, an ecological approach. Blackwell, Boston, pp 139–166

37
Kaplan L. A., Newbold J. D. (2000) Surface and subsurface dissolved organic carbon, in Streams and Ground Waters, edited by J. A. Jones and P. J. Mulholland, pp. 237– 258, Academic, San Diego, Calif.
Kiffney P.M., Richardson J.S., Bull J.P. (2004) Establishing light as a causal mechanism structuring stream communities in response to experimental manipulation of riparian buffer width. J. N. Am. Benthol. Soc. 23:542–556
Kondo R., Butani J. (2007) Comparison of the diversity of sulfate-reducing bacterial communities in the water column and the surface sediments of a Japanese meromictic lake. Limnology 8: 131–141
Lane D. J. (1991) 16S/23S rRNA sequencing, p. 115–175. In E. Stakebrandt (ed.), Nucleic acid techniques in bacterial systematics. Wiley, New York, N.Y.
Langworthy D.E, Stapleton R.D, Sayler G.S, Findlay R.H. (1998) Genotypic and phenotypic responses of a riverine microbial community to polycyclic aromatic hydrocarbon contamination. Appl. Environ. Microbiol. 64:3422–3428
Lee W.J., Patterson D.J. (2002) Abundance and biomass of heterotrophic flagellates, and factors controlling their abundance and distribution in sediments of Botany Bay. Microb. Ecol. 43:467-481
Leff L.G. (1994) Stream bacterial ecology: A neglected field? ASM News 60: 135–138
Leigh C., Sheldon F (2009) Hydrological connectivity drives patterns of macroinvertebrate biodiversity in floodplain rivers of the Australian wet/dry tropics. Freshwater Biology 54, 549–571
Lovett G.M, Weathers KC, Sobczak W.V. (2000) Nitrogen saturation and retention in forested watersheds of the Catskill Mountains, New York. Ecological Applications, 10: 73-84

38
Lovett G.M, Weathers K.C, Arthur M.A. (2002) Control of nitrogen loss from forested watersheds by soil carbon:nitrogen ratio and tree species composition. Ecosystem 5: 712–718
Lawrence G.B, Burns D.A Baldigo B.P, Murdoch P.S, Lovett G.M. (2001) Controls of stream chemistry and fish populations in the Neversink Watershed, Catskill Mountains, New York. Troy, NY, USGS Report WRIR 00-4040
Molloy J.M. (1992) Diatom communities along stream longitudinal gradients. Freshwater Biol., 28: 59-69
Mitchell R.J. (1992) Testing evolutionary and ecological hypotheses using path analysis and structural equation modeling. Funct. Ecol. 6, 123–129
Newbold J.D, Bott T.L, Kaplan L.A, Sweeney B.W., Vannote R.L. (1997) Organic matter dynamics in White Clay Creek, Pennsylvania, USA. Journal of the North American Benthological Society 16:46-50
Nemergut D.R., Cleveland C.C., Wieder W.R., Washenberger C.L., Townsend A.R. (2010) Plot-scale manipulations of organic matter inputs to soils correlate with shifts in microbial community composition in a lowland tropical rain forest. Soil Biology and Biochemistry, 42, 2153–2160.
Oda Y, Star B, Huisman L.A, Gottschal J.C, Forney L.J. (2003) Biogeography of the purple nonsulfur bacterium Rhodopseudomonas palustris. Appl. Environ. Microbiol. 69, 5186–5191
Osborn A.M, Moore E.R.B, Timmis K.N. (2000) An evaluation of terminal-restriction fragment length polymorphism (T-RFLP) analysis for the study of microbial community structure and dynamics. Environ. Microbiol. 2, 39–50
Øvreås L, Forney L, Daae R.L., Torsvik V. (1997) Distribution of bacterioplankton in meromictic Lake Sælenvannet, as determined by denaturing gradient gel electrophoresis of PCR-amplified gene fragments coding for 16S rRNA. Appl. Environ. Microbiol. 63, 3367–3373

39
Poff N.L., Ward J.V. (1992) Heterogeneous currents and algal resources mediate in situ foraging activity of a mobile stream grazer. Oikos 65: 465-478
Pusch M.D, Fiebig I, Brettar H, Eisenmann B.K et al., (1998) The role of microorganisms in the ecological connectivity of running waters. Freshw. Biol.40:453–495
Quinn J.M., Cooper A.B., Davies-Colley R.J., Rutherford J.C and Williamson R.B. (1997) Land use effects on habitat, water quality, periphyton, and benthic invertebrates in Waikato, New Zealand hill country streams. New Zealand Journal of Marine and Freshwater Research 31: 569 - 577.
Ramette A, Tiedje J.M. (2007) Biogeography: An emerging cornerstone for understanding prokaryotic diversity, ecololgy, and evolution. Microbial Ecology 53:197–207.
Rees G.N, Baldwin D.S, Watson G.O, Perryman S, Nielsen D.L. (2004) Ordination and significance testing of microbial community composition derived from terminal restriction fragment length polymorphisms: application of multivariate statistics. Antonie van Leeuwenhoek 86:339–347.
Sambrook, J., Fritsch E. F., Maniatis T. (1989) Molecular cloning: a laboratory manual, 2nd ed. Cold Spring Harbor Laboratory Press, Cold Spring Harbor, N.Y.
Schallenberg M., Kalff J. (1993) The Ecology of Sediment Bacteria in Lakes and Comparisons with Other Aquatic Ecosystems. Ecology, 74(3), 1993, 919-934
Schwieger F., Tebbe C.C. (1998) A new approach to utilize PCR-single-strand-conformation polymorphism for 16S rRNA gene-based microbial community analysis. Appl. Environ. Microbiol. 64, 4870–4876
Strahler A.N. (1957) Quantitative analysis of watershed geomorphology, Transactions of the American Geophysical Union 8 (6): 913–920

40
Steenworth K.L., Jackson L.E., Calderon F.J., Stromberg M.R., Scow K.M. (2002) Soil microbial community composition and land use history in cultivated and grassland ecosystems of coastal California. Soil Biology & Biochemistry 34, 1599–1611.
Sobczak W.V., Findlay S. (2002) Variation in bioavailability of dissolved organic carbon among stream hyporheic flowpaths. Ecol 83:3194–3209
Sollins P, Glassman C.A, Dahm C.N. (1985) Composition and Possible Origin of Detrital Material in Streams. Ecology 66: 297-299
Sutton S.D., Findlay R.H. (2003) Sedimentary microbial community dynamics in a regulated stream: East Fork of the Little Miami River, Ohio. Environ. Microbiol. 5:256-266
Tank J.L, Rosi-Marshall E.J, Griffiths N.A, Entrekin S.A, Stephen M.L. (2010) A review of allochthonous organic matter dynamics and metabolism in streams. Journal of the North American Benthological Society 29:118-146
Tiegs S.D, Akinwole P.O., Gessner M.O. (2009) Litter decomposition across multiple spatial scales in stream networks. Oecologia, 161: 343–351
Treves, D. S., Xia, B., Zhou, J., Tiedje, J. M. (2003) A two-species test of the hypothesis that spatial isolation influences microbial diversity in soil. Microb. Ecol. 45, 20–28.
Tringe S.G, von Mering C, Kobayashi A et al., (2005) Comparative metagenomics of microbial communities. Science 308:554–557
Vannote R.L, Minshall G.W, Cummins K.W, Sedell J.R., Cushing C.E. (1980) The river continuum concept. Canadian Journal of Fisheries and Aquatic Sciences 37:130–137
Vervier P, Gibert J, Marmonier P., Dole-Olivier M.J. (1992) A perspective on the permeability of the surface freshwater-groundwater ecotone. Journal of the North American Benthological Society 11: 93-102

41
Wang Y.P., Houlton, B.Z., Field C.B. (2007) A model of biogeochemical cycles of carbon, nitrogen, and phosphorus including symbiotic nitrogen fixation and phosphatase production. Global Biogeochemical Cycles 21:GB1018.
Whitaker R. J., Grogan D.W., Taylor J. W. (2003) Geographic barriers isolate endemic populations of hyperthermophilic archaea. Science 301:976– 978.
Wiens J.A. (1989) Spatial scaling in ecology. Functional Ecol 3:385–397
Wiegner T.N, Kaplan L.A, Newbold J.D, Ostrom P.H (2005) Contribution of dissolved organic C to stream metabolism: a mesocosm study using 13C-enriched tree-tissue leachate. J. N. Am. Benthol. Soc., 2005, 24(1):48–67
Wilcox H.S, Wallace J.B, Meyer J.L, Benstead J.P (2005) Effects of labile carbon addition on a headwater stream food web. Limnol. Oceanogr. 50: 1300–1312
Woessner W.W. (2000) Stream and fluvial plain groundwater interactions: rescaling hydrogeologic thought. Ground Water 38(3): 423–429
Yannarell, A. C., Triplett E.W. (2005) Geographic and environmental sources of variation in lake bacterial community composition. Appl. Environ. Microbiol. 71: 227–239
Zhou J, Kang S, Schadt C.W, Garten Jr C.T. (2008) Spatial scaling of functional gene diversity across various microbial taxa. Proc Natl Acad Sci USA 105: 7768–7773.
Zhou J., Xia B., Treves D.S., Wu L.Y., Marsh T, L., O’Neill R.V., Palumbo A.V., Tiedje J.M. (2002) Spatial and resource factors influencing high microbial diversity in soil. Appl. Environ. Microbiol. 68: 326–334.

Figure 1. Sampling scheme used to examine microbial biomass and community structure across
multiple spatial scales in two watersheds. Sampling within the Neversink watershed consists of
four 1st order streams; Biscuit Brook and Pigeon Creek tributaries (Biscuit Brook Tributary A and
B [BBTA, BBTB], Pigeon Creek Tributary A and B [PBTA, PBTB]
respectitively), two 3rd order streams (Biscuit Brook [BBR] and Pigeon Creek [PBR]
respectitively) and one 5th order stream (Neversink River [NRC]). Sampling within the White
Clay Creek watershed consists of four 1
Cress Spring [WTR], Dirty Dog Spring [DDS] and Walton Spring Branch [WSB]
respectitively), two 2nd order streams (East and West Branch White Clay Creek [WCWE,
WCCW], 2a, 2b, respectitively) and one 3
watersheds are not drawn to scale. Each eclipse represents a
each of which was sampled 3 times.
42
Figure 1. Sampling scheme used to examine microbial biomass and community structure across
multiple spatial scales in two watersheds. Sampling within the Neversink watershed consists of
Biscuit Brook and Pigeon Creek tributaries (Biscuit Brook Tributary A and
B [BBTA, BBTB], Pigeon Creek Tributary A and B [PBTA, PBTB], 1a, 1b, 1c, 1d,
order streams (Biscuit Brook [BBR] and Pigeon Creek [PBR]
order stream (Neversink River [NRC]). Sampling within the White
Clay Creek watershed consists of four 1st order streams (Ledyards Spring Branch [LSB], Water
Cress Spring [WTR], Dirty Dog Spring [DDS] and Walton Spring Branch [WSB]
order streams (East and West Branch White Clay Creek [WCWE,
) and one 3rd order stream (White Clay Creek [WCC]). Sketches of
watersheds are not drawn to scale. Each eclipse represents a reach, which contained 3 stations,
each of which was sampled 3 times.
Figure 1. Sampling scheme used to examine microbial biomass and community structure across
multiple spatial scales in two watersheds. Sampling within the Neversink watershed consists of
Biscuit Brook and Pigeon Creek tributaries (Biscuit Brook Tributary A and
, 1a, 1b, 1c, 1d,
order streams (Biscuit Brook [BBR] and Pigeon Creek [PBR], 3a, 3b,
order stream (Neversink River [NRC]). Sampling within the White
order streams (Ledyards Spring Branch [LSB], Water
Cress Spring [WTR], Dirty Dog Spring [DDS] and Walton Spring Branch [WSB], 1e, 1f, 1g, 1h,
order streams (East and West Branch White Clay Creek [WCWE,
order stream (White Clay Creek [WCC]). Sketches of
contained 3 stations,

Figure.2 Variation in sediment (a) percent carbon, (b) percent nitrogen and (c) C:N ratio by
stream, order (1st to 3rd/5th order from left to right) and watershed.
confidence intervals. Streams not connected by a horizontal line are significantly different (p =
0.05, Tukey’s Wholly Significant Difference).
43
Figure.2 Variation in sediment (a) percent carbon, (b) percent nitrogen and (c) C:N ratio by
order from left to right) and watershed. Vertical bars denote 0.95
confidence intervals. Streams not connected by a horizontal line are significantly different (p =
0.05, Tukey’s Wholly Significant Difference).
Figure.2 Variation in sediment (a) percent carbon, (b) percent nitrogen and (c) C:N ratio by
Vertical bars denote 0.95
confidence intervals. Streams not connected by a horizontal line are significantly different (p =

Figure 3. Microbial biomass (mean ± SD) of White Clay Creek and
watershed, b; stream and c; station. Stream order (or average order for watershed values) are indicated as: black = 1
= 2nd order, light gray = 3rd order, open = 5th order.
44
iomass (mean ± SD) of White Clay Creek and Neversink watershed sediments at three spatial sca
Stream order (or average order for watershed values) are indicated as: black = 1
order.
three spatial scales: a;
Stream order (or average order for watershed values) are indicated as: black = 1st order, dark gray

Figure 4. Path diagrams describing the structure of the relationship between sediment microbial
biomass and % Carbon (%C), % water content, C:N ratio
(SSA). Single-headed arrows indicate casual paths;
(standardized regression coefficients) indicating the relative strength of each path leading to a
given response variable. Double-headed arrows represent the correlations among the predictor
variables. Arrows connecting environmental variables to the independent variable (
biomass) indicate direct effects, while environmental variables linked to the independent variable
via other environmental variable constitute indirect effects
Structural Equation Modeling for JMP 10
45
Figure 4. Path diagrams describing the structure of the relationship between sediment microbial
water content, C:N ratios (C:N) and sediment surface area
rrows indicate casual paths; numbers on arrows are path coefficients
coefficients) indicating the relative strength of each path leading to a
headed arrows represent the correlations among the predictor
ting environmental variables to the independent variable (
iomass) indicate direct effects, while environmental variables linked to the independent variable
via other environmental variable constitute indirect effects. Path coefficients calculate
Structural Equation Modeling for JMP 10. *= P <0.01, **=P <0.001
Figure 4. Path diagrams describing the structure of the relationship between sediment microbial
and sediment surface area
numbers on arrows are path coefficients
coefficients) indicating the relative strength of each path leading to a
headed arrows represent the correlations among the predictor
ting environmental variables to the independent variable (microbial
iomass) indicate direct effects, while environmental variables linked to the independent variable
Path coefficients calculated by SAS

Figure 5. Principle Component A
White Clay Creek (open circle) and Neversink (open squ
explained by each axis is indicated on the respective component axis. Identified fatty acids had
component loadings of >|0.5| with strong influence on the pattern of variation among samples
along the respective component axes. Site abbreviations
46
Analysis of stream sedimentary microbial community structure
White Clay Creek (open circle) and Neversink (open square) watersheds. The percent
explained by each axis is indicated on the respective component axis. Identified fatty acids had
component loadings of >|0.5| with strong influence on the pattern of variation among samples
along the respective component axes. Site abbreviations are as described in the legend to Fig.1
edimentary microbial community structure of
. The percent variation
explained by each axis is indicated on the respective component axis. Identified fatty acids had
component loadings of >|0.5| with strong influence on the pattern of variation among samples
are as described in the legend to Fig.1

47
Figure 6. Relationship between Principle Component Analysis factor 1 score and the calculated
percentage that microeukaryotes contribute to total microbial biomass for all stream samples.
y = -0.0792x + 1.3588R² = 0.8773
-4
-3
-2
-1
0
1
2
0 10 20 30 40 50 60 70
PC
1 S
core
% Eukaryotic Biomass

Figure 7. Spatial variation in sedimentary bacterial community composition in WCC and NRC
watersheds by PLFA analysis after removal of fatty acids assigned a priori to the functional group
microeukaryotes and those known to be common to both bacteria and m
PLFA profiles. Symbols- WCC (circle), NSR (square). Site abbreviations are as described in the
legend to Fig.1.
48
. Spatial variation in sedimentary bacterial community composition in WCC and NRC
watersheds by PLFA analysis after removal of fatty acids assigned a priori to the functional group
microeukaryotes and those known to be common to both bacteria and microeukaryotes from the
WCC (circle), NSR (square). Site abbreviations are as described in the
. Spatial variation in sedimentary bacterial community composition in WCC and NRC
watersheds by PLFA analysis after removal of fatty acids assigned a priori to the functional group
icroeukaryotes from the
WCC (circle), NSR (square). Site abbreviations are as described in the
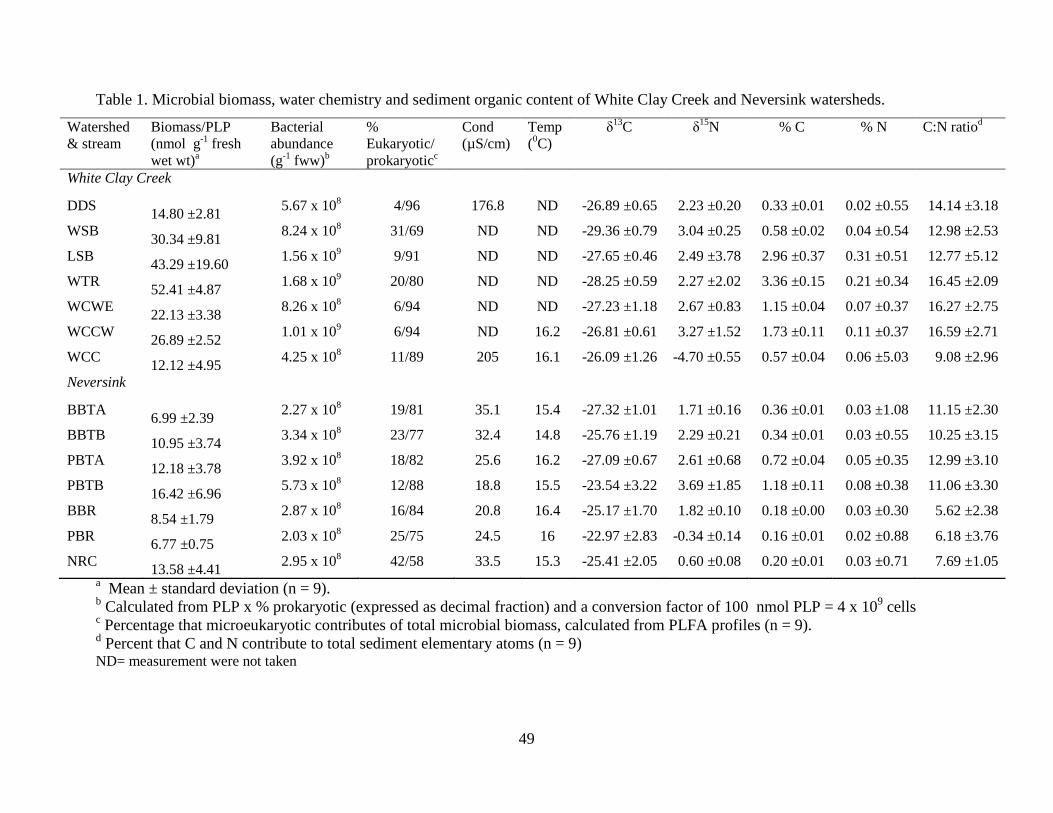
49
Table 1. Microbial biomass, water chemistry and sediment organic content of White Clay Creek and Neversink watersheds.
Watershed & stream
Biomass/PLP (nmol g-1 fresh wet wt)a
Bacterial abundance (g-1 fww)b
% Eukaryotic/ prokaryoticc
Cond (µS/cm)
Temp (0C)
δ13C δ
15N % C % N C:N ratiod
White Clay Creek
DDS 14.80 ±2.81 5.67 x 10⁸ 4/96 176.8 ND -26.89 ±0.65 2.23 ±0.20 0.33 ±0.01 0.02 ±0.55 14.14 ±3.18
WSB 30.34 ±9.81 8.24 x 10⁸ 31/69 ND ND -29.36 ±0.79 3.04 ±0.25 0.58 ±0.02 0.04 ±0.54 12.98 ±2.53
LSB 43.29 ±19.60 1.56 x 10⁹ 9/91 ND ND -27.65 ±0.46 2.49 ±3.78 2.96 ±0.37 0.31 ±0.51 12.77 ±5.12
WTR 52.41 ±4.87 1.68 x 10⁹ 20/80 ND ND -28.25 ±0.59 2.27 ±2.02 3.36 ±0.15 0.21 ±0.34 16.45 ±2.09
WCWE 22.13 ±3.38 8.26 x 10⁸ 6/94 ND ND -27.23 ±1.18 2.67 ±0.83 1.15 ±0.04 0.07 ±0.37 16.27 ±2.75
WCCW 26.89 ±2.52 1.01 x 10⁹ 6/94 ND 16.2 -26.81 ±0.61 3.27 ±1.52 1.73 ±0.11 0.11 ±0.37 16.59 ±2.71
WCC 12.12 ±4.95 4.25 x 10⁸ 11/89 205 16.1 -26.09 ±1.26 -4.70 ±0.55 0.57 ±0.04 0.06 ±5.03 9.08 ±2.96
Neversink
BBTA 6.99 ±2.39 2.27 x 10⁸ 19/81 35.1 15.4 -27.32 ±1.01 1.71 ±0.16 0.36 ±0.01 0.03 ±1.08 11.15 ±2.30
BBTB 10.95 ±3.74 3.34 x 10⁸ 23/77 32.4 14.8 -25.76 ±1.19 2.29 ±0.21 0.34 ±0.01 0.03 ±0.55 10.25 ±3.15
PBTA 12.18 ±3.78 3.92 x 10⁸ 18/82 25.6 16.2 -27.09 ±0.67 2.61 ±0.68 0.72 ±0.04 0.05 ±0.35 12.99 ±3.10
PBTB 16.42 ±6.96 5.73 x 10⁸ 12/88 18.8 15.5 -23.54 ±3.22 3.69 ±1.85 1.18 ±0.11 0.08 ±0.38 11.06 ±3.30
BBR 8.54 ±1.79 2.87 x 10⁸ 16/84 20.8 16.4 -25.17 ±1.70 1.82 ±0.10 0.18 ±0.00 0.03 ±0.30 5.62 ±2.38
PBR 6.77 ±0.75 2.03 x 10⁸ 25/75 24.5 16 -22.97 ±2.83 -0.34 ±0.14 0.16 ±0.01 0.02 ±0.88 6.18 ±3.76
NRC 13.58 ±4.41 2.95 x 10⁸ 42/58 33.5 15.3 -25.41 ±2.05 0.60 ±0.08 0.20 ±0.01 0.03 ±0.71 7.69 ±1.05
a Mean ± standard deviation (n = 9). b Calculated from PLP x % prokaryotic (expressed as decimal fraction) and a conversion factor of 100 nmol PLP = 4 x 10⁹ cells c Percentage that microeukaryotic contributes of total microbial biomass, calculated from PLFA profiles (n = 9). d Percent that C and N contribute to total sediment elementary atoms (n = 9) ND= measurement were not taken

50
Table 2. Nested ANOVA to test the effects of watershed, streams within watershed, and stations
within streams on microbial biomass.
Source DF Adj SS Adj MS F P
Watershed 1 5.119 5.119 15.18 0.002
Stream (Watershed) 12 4.047 0.337 7.38 0.000
Stations (Watershed*Stream) 28 1.280 0.046 1.46 0.095
Error 84 2.628 0.031

51
Table 3. Multiple regression analysis (best subsets) for natural log biomass as a function of
various physical and chemical stream parameters
Model Vars R-Sq R-Sq(adj) Mallows Cp SE %Water SSA %C %N C:N
1 1 60.7 60.4 30.2 0.2052 X
2 1 56.4 56.0 46.3 0.2161 X
3 2 65.0 64.4 15.9 0.1943 X X
4 2 64.6 64.0 17.6 0.1955 X X
5 3 67.6 66.7 8.4 0.1879 X X X
6 3 66.9 66.0 11.1 0.1899 X X X
7 4 69.2 68.1 4.3 0.1839 X X X X
8 4 68.1 67.0 8.5 0.1872 X X X X
9 5 69.3 68.0 6.0 0.1845 X X X X X

52
CHAPTER 3
SEASONALITY IN A STREAMBED MICROBIAL COMMUNITY: VARIATION IN THE
ISOTOPIC COMPOSITION OF LIPID BIOMARKERS
ABSTRACT
Microbial biomass and community structure can show dramatic seasonal variability in temperate
stream ecosystems and understanding links between this variability and in-stream biotic and
abiotic processes is an important goal for stream ecologists. Stable isotopic composition of
organisms and related biomolecules has increasingly become an important tool for ecologists
probing stream processes. To test if the seasonal changes in the structure of stream sediment
microbial communities altered the stable carbon isotope signatures of microbial phospholipid
fatty acids, we collected sediments from White Clay Creek from December 2009 through October
2010. Sedimentary microbial biomass, measured as total phospholipid phosphate, ranged from 10
to 29 nmol PLP g-1 dry weight sediment and was significantly correlated with high and low flood
pulse counts, variability in daily flow and dissolved organic carbon (DOC) concentrations.
Principal component analysis of phospholipid fatty acid (PLFA) profiles indicated that the
sedimentary microbial communities displayed seasonal patterns of change as a result of a shift
from dominance of prokaryotes during times of cold water to increased importance of
phototrophic microeukaryotes during times of warm water. This shift was significantly correlated
with seasonal changes in median daily flow, DOC, high and low flood pulse counts and water
temperature. Microbial carbon isotope signatures using compound-specific 13C analysis of PLFA

53
showed that both bacterial and microeukaryotic stable carbon isotope ratios were heaviest in the
spring and lightest in autumn or winter. Bacterial PLFAs were isotopically depleted on average by
2-5‰ relative to δ13C of total organic carbon suggesting bacteria consumption of terrestrial
organic matter. Most bacterial PLFAs were enriched on average by 9-12‰ compared with algal
PLFA indicating an uncoupled algal-bacteria system. However, δ13C values of bacterial PLFA of
summed feature 1 (16:1ω9, 16:1ω7c, 16:1ω5c, 16:1w13t) were enriched compared with algal
PLFA by 5.7‰ suggesting utilization of autochthonous DOC, along with allochthonous detritus
as carbon sources. Our study revealed seasonal fluctuations in microbial biomass, community
structure and their lipid isotopic signatures examined in stream sediments, and also demonstrated
the potential influences of various hydrological indices on microbial biomass and community
composition in lotic ecosystems.

54
INTRODUCTION
Stable isotope analysis, in particular those of carbon and nitrogen, is a rapidly expanding
tool used by ecologists to examine diet (Ben-David et al. 1997; Karlsson et al. 2003), foraging
ecology (Rubenstein and Hobson 2004; Cherel et al. 2007), ecophysiological processes (Gannes
et al. 1998; Cernusak and Hutley 2011), and trophic position and food-web analysis (Kwak and
Zedler 1997; McNabb et al. 2001; Post 2002), as well as evaluating the structure and dynamic of
ecological communities (Vander Zanden et al. 1999; Post et al. 2000). Also, stable isotope
analysis has been successfully used to assess spatial and seasonal variability in the isotopic
composition of organisms in various ecosystems (Riera and Richard 1997; Vizzini et al. 2002;
Finlay 2004). Moreover, advances in bulk stable isotope analysis have improved methodological
approaches (Tobias et al. 2008) and mathematical models (Logan et al. 2008; Bond and Diamond
2011), enhanced linking processes at multiple scales (Martínez del Rio et al. 2009), and addressed
more complex ecological questions, such as determining the primary controls of high variability
observed in lotic algal δ13C values (Finlay 2004; Ishikawa et al. 2012).
Although, bulk stable isotope analysis has been extensively used in ecology, compound-
specific stable isotope analysis is a more robust tool in microbial ecology that enables the
molecular specificity and isotopic signature of individual compounds to be exploited concurrently
(Boschker et al. 1998). Recent technological advances in the development of gas
chromatography-combustion-isotope ratio mass spectrometry (GC/C/IRMS) for compound
specific stable isotope analysis have increased our ability to link microorganisms in
environmental samples to utilization of particular growth substrates (Rieley et al. 1991; Dumont

55
and Murrell 2005). Presently, phospholipid fatty acid (PLFA), amino acids and nucleic acids have
been used as biomarker molecules and for compound-specific stable isotope analysis (Boschker et
al. 1998; Radajewski et al. 2000). Investigation of carbon isotope signature of individual PLFAs
allows for identification of carbon source use by microorganisms. This methodological approach
has several appealing advantages including short incubation times and use of trace-level additions
(< 5% of total carbon). These advantages arise from the high precision of GC/C/IRMS, which
allows for the detection of changes of as little as 4‰ to be considered a significant change in
stable isotope ratio. However, this sensitivity requires an understanding of the variation in
isotopic signatures of specific biomarker compounds of microbial communities, both temporally
and among the various components of the community. As the availability of this advanced
technique is relatively recent, studies investigating variations in the compound specific isotopic
composition of lipid biomarkers of organic matter and microbial composition are scarce and, to
the best of our knowledge, only conducted in estuarine sediments (Zimmerman and Canuel 2001;
Dai and Sun 2007); such studies are still lacking in stream sedimentary habitats.
Seasonal dynamics in sedimentary microbial biomass and community structure in lotic
ecosystems have been documented (Kaplan and Bott 1989; Smoot and Findlay 2001; Battin et al.
2001; Sutton and Findlay 2003; Hullar et al. 2006). In addition, several environmental variables
have been considered to influence microbial community composition in several habitats
(reviewed in Horner-Devine et al. 2003). For example, Smoot and Findlay (2001) reported that
benthic microbial communities were dynamically responsive to physico-chemical and biological
parameters that varied seasonally in a riverine-reservoir ecosystem. In addition, temperature, pH
and dissolved organic carbon (DOC) have been associated with temporal shifts in
bacterioplankton communities in lakes and streams (Crump et al. 2003; Lindström et al. 2005;

56
Hullar et al. 2006; Mueller-Spitz et al. 2009). Environmental variables such as climate,
topography, underlying geology, inorganic water chemistry and riparian vegetation are more
constrained and significantly influence stream processes. Other variables, such as streamflow
velocity, light, temperature, quantity and quality of allochthonous and autochthonous inputs (e.g.
DOC) and high frequency of storms, can vary dramatically throughout the year and play an
important role in structuring the stream communities and hydrological conditions of temperate
streams (Kaplan and Bott 1989; Autio 1998; Gremm and Kaplan 1998; Olapade and Leff 2005;
Hullar et al. 2006).
Although it is known that seasonal variation in sedimentary microbial community
structure occurs in streams (Hullar et al. 2006), there have been no reports describing seasonal
variation in carbon isotope signatures of individual PLFAs in relation to temporal changes
observed in microbial community structure in stream sediments. In this study, we aimed to
investigate if this variation in sedimentary microbial community structure contributes to any
observable variation in isotope profiles of microbial PLFAs. Our study approach was to
investigate the seasonal differences in microbial biomass, community structure and microbial
PLFA isotopic signatures in order to compare patterns in stable isotope profiles and community
structure and to assess the relationships to varying hydrological indices. We sampled replicate
microbial community within a single reach over an annual cycle in order to constrain potentially
confounding environmental variables such as climate, topography, underlying geology, inorganic
water chemistry, and riparian vegetation. Seasonal variations in benthic microbial community
structure and stable carbon isotope signatures of individual microbial fatty acids were determined
using PLFA and compound specific stable isotope analyses, respectively. Annual stream
discharge data for 5-year period were obtained from the US Geological Survey Water Resources

57
database. Our data were subjected to multivariate statistical analyses to characterize flow regime
and elucidate the dominant sources of variation and correlation of microbial community structure
with seasonal changes in hydro-ecological parameters.
MATERIALS AND METHODS
Study site
The study site was located within the 3rd order reach of 7.3 km2 White Clay Creek (WCC)
watershed directly adjacent to the Stroud Water Research Center, Avondale, PA. The WCC
stream is 2,400m long, occurs within riparian woodlands in the Piedmont Province of
southeastern Pennsylvania and northern Delaware and joins the Christina River near the
Christina's discharge to the Delaware Bay. Upstream of our sampling station, WCC has a
protected riparian zone and drains a 725 ha watershed comprised of approximately 52% of
agricultural, 22% of tilled/hayed and 23% of wooded lands (Wiegner et al. 2005; Newbold et al.
1997). Streamflow and streamwater chemistry have been monitored at regular intervals since the
1970s with mean annual stream flow, stream water temperature, and local precipitation of 115
L/s, 10.60C, and 105 cm y-1, respectively. Streambed sediments consist of clay-, silt-, and sand-
sized particles in pools and runs, with gneiss- and schist-derived gravel and cobble in riffles. The
dominant tree species reported are beech (Fagus grandifolia), red oak (Quercus rubra), black oak
(Quercus velutina) and tulip poplar (Liriodendron tulipifera). Detailed description is given in
Newbold et al. 1997.

58
Study design
At the study site, streambed sediments were collected at monthly intervals (with the
exception of January, 2010) over eleven months during December 2009 and October 2010. The
stream annual hydrograph showed higher flows during the spring of the year, lowest flows during
late summer-early fall and was punctuated by storm-driven high flow events. There were no zero-
flow days (i.e., surface water not present or present in isolated pools). Sampling was done pre-
and post- high flow events, and during average flow and low flow periods (Fig.1). Sampling
periods coincided with summer (June to August 2010), autumn (Sept and Oct 2010), winter (Dec
09, Feb and Mar 2010) and spring (April and May 2010). Samples were delimited with a 100mm
diameter Plexiglas ring that was inserted 2 cm deep into the streambed. Plexiglas plates were
slipped under and over the ring to effectively trap the sediments and allowed them to be lifted
from the streams with minimum disturbance. Sediments in the top 2mm within the ring were
transferred with a clean spatula to pre-labeled Whirl-Pak sampling bags and transported on ice to
the laboratory. In December 2009, three replicate samples were collected from left-mid-right
locations across the stream, however, from February to October 2010 nine samples, three from
each station within the reach were collected with stations separated by approximately 10m. In the
laboratory, sediments were transferred to a clean plastic weigh boat and thoroughly homogenized,
and subsampled for phospholipid and elemental analyses.
Streamflow data and hydrological indices
Daily streamflow data for WCC at Avondale, PA (Lat 39`49'42", long 75`46'52") were
acquired from the US Geological Survey Water Resources database (http://waterdata.usgs.gov).
There is little or no flow regulation and the drainage area is 11.3 m2. The flow data consisted of a

59
5-year period from 1 October 2007 to 30 September 2012. We examined 108 hydrologic indices
to identify a subset of biologically relevant indices that can best explain critical attributes of the
flow regime and variation in microbial biomass and community structure. These indices were
distributed into four categories following Richter et al. (1996) and Poff et al. (1997). These are
magnitude (n=79), frequency (n=10), duration (n=12) and rate of change (n=7). Timing of flow
such as predictability and constancy, which are known to be sensitive to the length of record used
in their calculation (Gan et al. 1991; Clausen and Biggs 2000), were excluded from analysis
because of the short period of record used in this study.
Our general approach to hydrological assessment was first to identify a series of
ecologically relevant hydrological indices that characterized dominant inter-annual variation in
flow conditions and then analyze these ‘unique’ hydrological attributes as the predictors for
variation observed in microbial biomass and community structure. The approach involved five
steps:
1- Compute values for hydrological indices. We calculated values for each 108 streamflow
variables for the WCC for each year of the five-year period. The hydrological indices were
distributed into four categories: the magnitude of flow, frequency of occurrence of flows above a
given magnitude, duration of flow for specific flow conditions and the rate of change or flashiness
of flows (see http://nj.usgs.gov/projects/2454C2R/EcoFlow/definitions.html, Olden and Poff 2003
and Clausen and Biggs 2000 for hydrologic index definitions, and supplementary data for
hydrologic index values calculated for this study).
2- Compute inter-annual statistics. We performed data ordination by using principal component
analysis (PCA) to elucidate major patterns of intercorrelation among the hydrologic variables and
identify relevant subsets of indices that structure the interannual variation. Standardized PCA
60
based on correlation matrix was obtained by centering and standardization by ‘species’ (in
CANOCO 4.5) since hydrological variables were measured in different units. We selected six
representative descriptors of the hydrograph as unique ecological relevant hydrological indices
that best characterized inter-annual variation in flow conditions; referred to as indicators of
hydrological variation (IHV).
3- Compute IHV values prior to sampling. We calculated values for each IHV for 2-week period
prior to stream sediment sampling for the sampling year (2009/2010) in order to evaluate the
sensitivity of microbial biomass and community structure to certain types of hydrological
impacts.
4- Calculate multicollinearity of the IHV. To test whether collinearity existed within the IHV we
compared the correlation matrices of the IHV calculated for 2-week period prior to stream
sediment sampling and eliminate two highly correlated indices.
5- Compute multiple regression analysis of IHV and environmental variables. Multiple regression
analysis (‘best subsets’ in MINITAB 16) was performed on uncorrelated indices of IHV and other
environmental parameters measured in this study.
The 108 hydrologic indices for 5-year period used in this study are presented in Appendix 1 of the
supplementary data. The results from the biplot of PCA are presented in Appendix 2 of the
supplementary data.
Phospholipid fatty acids analysis
Microbial biomass and community structure were determined using phospholipid analysis
following the methods of Findlay (2004). Briefly, lipids were extracted from frozen sediment
samples in the dark at 4°C in 50ml screw-cap glass tubes with 27ml of a 1:2:0.6 (v/v/v)

61
dichloromethane-methanol-50 mM phosphate buffer (pH 7.4) solution. The solution was
partitioned into organic and aqueous phases with 7.5ml dichloromethane and 7.5ml deionized
water, after which the organic phase (containing total lipid) was collected through a predried 2V
filter (Whatman, Schleicher & Schuell) into 15ml test tubes and the solvent dried under Nitrogen
at 37°C. The dried lipid was dissolved in 2ml chloroform and two 100µl subsamples were
oxidized with potassium persulfate at 100 °C overnight in sealed ampoules to release
orthophosphate. Phosphate content was determined spectrophotometrically (610nm) using a dye-
coupled reaction between ammonium molybdate and malachite green. The remainder of the
dissolved lipid was fractionated into neutral, glyco-, and phospholipid with silica gel solid phase
extraction chromatography. Phospholipid fatty acids (PLFAs) were converted into their
respectively methyl esters by base methanolysis and purified by octadecyl bonded silica gel (C18)
reverse-phase column chromatography. Fatty acid methyl esters (FAMEs) were identified and
quantified using Agilent gas chromatograph-flame ionization detection (GC-FID). FAME
identification was based on relative retention times, coelution with standards, and mass spectral
analysis. Individual fatty acids were analyzed for both absolute and relative abundance. Absolute
abundance data (µg FAME g-1 dry weight) allowed the determination of functional group biomass
within the microbial community, while relative abundance or weight percent data (gram
individual fatty acids x gram-1 total fatty acids x 100) allowed the determination of community
structure (Findlay and Dobbs 1993). The FAME nomenclature used followed Findlay and Dobbs
(1993). Standard nomenclature was used to refer to the fatty acids: the total number of carbon
atoms is followed by a colon, and the number of double bonds. The position of the first double
bond is indicated by ω and the number of carbon atoms from the aliphatic end. For example, the
fatty acid 18:2ω6, is 18 carbons long, and has two double bonds that occur at the sixth carbon
62
from the omega end of the molecule. The suffixes c and t specify the cis and trans configurations
of the double bond, respectively. Methyl branching at the iso and anteiso positions and at the 10th
carbon atom from the carboxyl end is designated by the prefixes i, a, and 10Me, respectively. The
prefix cy denotes cyclopropane fatty acids.
Isotopic Analysis of Biomarker Compounds
Isotopic analysis of individual FAMEs were determined using a Delta V Advantage
(ThermoElectron) isotope ratio mass spectrometer coupled with an Agilent 6890N gas
chromatograph via a GC/C III (ThermoElectron) combustion interface. Gas chromatographic
separation of FAMEs utilized a BPX70 column (50m x 0.32mm, 0.25µm film thickness, insert
source). The separation and combustion of fatty acids are described in detail in Abraham and
Hesse (2003). All samples were run in duplicate. Precision for isotopic measurements of
individual compounds was ± 0.6‰. Stable isotope composition was expressed in the δ notation
with V-PDB as standard:
δ13C = [(R sample / R standard) -1] x 1000 (1)
where R is 13C/12C in the samples and standard.
Derivatization of the fatty acids introduced an additional carbon to the molecule altering isotope
ratios. Therefore, calculation of the carbon isotope ratio of FAMEs included a correction for the
isotope ratio of the methyl moiety to obtain the original isotope ratio of fatty acids using the
equations taken from Abraham et al. (1998):
δ13CFA = [(Cn + 1)* δ13CFAME - δ13CMeOH]/Cn (2)
63
where δ13CFA is the δ13C of the fatty acid, Cn is the number of carbons in the fatty acid, δ13CFAME
is the δ13C of the FAME, and δ13CMeOH is the δ13C of the methanol used for the methylation
reaction, which was determined to be -43.23‰.
Elemental Analysis
The frozen subsamples for elemental analysis were freeze-dried, finely grounded to
provide a homogenous sample, weighed (about 1.5 - 2g) into glass vials, placed uncovered in a
desiccator containing 2N HCl and evacuated with a sink aspirator. Fumed samples were freeze-
dried, weighed and re-fumed until constant weight. Approximately 35mg of dried sediment
sample were weighed in tin boats and analyzed on a Costech 4010 elemental analyzer for δ13C,
δ15N, percent carbon and nitrogen, and atomic carbon to nitrogen ratio (C:N). Samples were
analyzed at least in duplicate with an average of 0.02‰ analytical differences.
Statistical analysis
One-way analysis of variance (ANOVA) with Turkey’s HSD (p < 0.05) was performed on
sediment organic content and microbial biomass log transformed (n+1) data to determine
temporal differences (QI Macros 2012 for Excel). Significant differences were assessed at an α
error level of p = 0.05. To investigate the interrelationships between the biological (microbial
biomass and community structure) and hydro-ecological variables, linear regression and multiple
linear regression analyses (MINITAB 16) were used. For multiple linear regression analysis,
predictor variables were selected using the ‘best subsets’ algorithm in MINITAB. This algorithm
fits a small fraction of all possible regression models and selects the ‘best subset’ based on several
selection criteria such as Mallow Cp and adjusted r2.

64
Natural log transformed (ln+1) PLFA relative abundance data were subjected to principal
component analysis (PCA; SPSS 21) to identify patterns of seasonal variation in the microbial
community structure. PLFA profiles were interpreted with a functional group approach (Findlay
and Dobbs, 1993). PCA biplots (CANOCO 4.5) were used to examine major patterns of
intercorrelation among the hydrologic variables and identify representative descriptors that
structure the interannual variation. Path analysis was used to investigate the relationships among
environmental variables and explore the directions of influence of these variables on microbial
biomass. The path analysis was performed in SAS Structural Equation Modeling for JMP 10.
RESULTS
Physical and chemistry stream characteristics
Mean monthly flows ranged from 0.61 – 1.22 m3 s-1 during winter and decreased gradually
in spring to an annual low in late summer (0.15 m3 s-1), before dramatically increasing in October
2010 to 0.55 m3s-1 (Fig. 1). The hydrograph was also characterized by spikes in flow, associated
with storm events, where mean daily flow can increase to as high as 52 m3 s-1. During the study
period, water temperature varied from a minimum of 2.8°C in December to a maximum of 20.3°C
in August showing clear annual trends typical of temperate streams (Table 1). DOC
concentrations varied throughout the year, with the annual low in mean monthly concentration
occurring in late winter (February 2010) and highest monthly mean concentration observed in
October 2010. There was no significant correlation between mean monthly streamflow and mean
monthly DOC concentration.

65
There was a high degree of inter-correlation (either positive or negative) among many of
the 108 calculated hydrologic indices for White Clay Creek over the 5-year period examined.
Principal component analysis was used to reduce the number of variables and to determine which
parameters best explained the differences among each year. Representative descriptors of the
hydrograph that were significantly associated with inter-annual variations were used as putative
drivers of microbial biomass; these were high flood pulse count (FHC1), mean daily flows
(MDF), low flood pulse count (FLC), median daily flow (MQ50), base flow index (MBI) and
variability in daily flow (MVD1).
Total Microbial Biomass
Total microbial biomass, measured as phospholipid phosphate, ranged from 10.05 ± 6.95
to 28.96 ± 12.13 nmol PLP g-1 dry weight sediment and increased during spring to its peak in
June before declining during summer and early fall (Table 1). Total sediment microbial biomass
was significantly greater during May and June compared to December and February. The
proportion that microeukaryotes comprised of total sediment microbial biomass was significantly
smaller (6 – 7%) during the winter (December 2009 and February 2010) compared to remaining
months (21 – 30) % (Table 1). Bacterial abundance estimates ranged from 3.78 × 10⁸ in
December 2009 to 9.19 × 10⁸ cells g–1 sediment (dry wt) in June 2010 and showed a similar
seasonal pattern as observed for total microbial biomass.
Microbial Community Structure
Principal component analysis of PLFA profiles revealed that the samples formed three
clusters that suggest a seasonal pattern in microbial community structure in WCC sediments (Fig.

66
2). Samples from December and February formed one cluster and were taken during a period of
low water temperatures (mean daily temperatures; 2.8 - 3.8 oC) and high stream flows (mean daily
flows; 0.61 – 1.14 m3 s-1) (Table 1). Samples from March and April formed a second cluster and
were taken during a period of moderate water temperatures (7.6. - 12.3 oC) and high stream flows
(0.72 – 1.22 m3 s-1). Samples from May through October formed the third cluster and were taken
during a period of moderate to high water temperatures (11.8. - 20.3 oC) and low to moderate
stream flows (0.15 – 0.55 m3 s-1). Samples from December and February showed positive PC1
component scores and were enriched in PLFAs a15, cy17:0, 10me16, cy19:0, i15:0, br17:1a and
i17:0. These fatty acids are typically considered bacterial in origin, and can be indicative of
several bacterial functional groups. Samples collected in March and April had negative PC1
component scores and were enriched in PLFAs 16:1ω13t, 20:5ω3 and 16:4ω1. These fatty acids
are consistent with the presence of phototrophic microeukaryotes. Samples collected from May
through October had positive PC2 component scores (December through April samples showed
negative PC2 scores) and were enriched with PLFAs 20:4ω6, br19:1a, 18:2w6, 18:3ω3, 15:0 and
18:1ω9. The even-chain length fatty acids in this group are consistent with the presence of
heterotrophic microeukaryotes. The importance of the seasonal variation in proportions of
prokaryotes and eukaryotes to the patterns of change within microbial community structure was
further accentuated by the high correlation (r2 = 0.54) between PC1 factor scores and the
percentage that microeukaryotes comprise of total microbial biomass (Fig. 3).
Relationships between microbial biomass, community structure and environmental variables
Analysis of Pearson correlation coefficients between indicators of hydrological variation,
temperature and DOC concentrations showed that base flow index (MBI) and mean daily flows

67
(MDF) were highly correlated (r > 0.7) with MQ50, MVD1and FLC (Table 2) and MBI and MDF
were removed prior to multiple linear regression analysis of the relationship between total
microbial biomass and environmental descriptors. Multiple linear regression analysis indicated
that high flood pulse count provided the best single variable model explaining the variation in
total sediment microbial biomass (Table 3, Model 1; adjusted R2 = 0.33). Best subset multiple
linear regression indicated that a combination of high flood pulse count, low flood pulse count
and variability in daily flow best explained the observed annual variation in sedimentary
microbial biomass in WCC sediments (Table 3, Model 5; adjusted R2 = 0.49).
A simple linear regression analysis indicated that the percentage that microeukaryotes
comprise of total microbial community explained approximately half of the variation observed in
PC1 scores (Fig. 3). The multiple component model to explained most of the variation observed
in sedimentary microbial community structure indicated that combination of temperature, DOC,
MQ50, FLC and FHC1 explained 93% of the variation (Table 4, Model 9). Path analysis showed
that temperature, median daily flow and high flood pulse count were negatively correlated with
PC1 scores while DOC concentration and low flood pulse count showed positive correlations with
this descriptor of seasonal variations in community structure.
General patterns and seasonal dynamics in PLFAs stable carbon isotopes
Phospholipid fatty acid isotope ratios ranged from a low of -43.66 ± 1.41 (20:5w3,
September) to a high of -28.23 ± 1.45 (i16:0/15:1, February) (Table 5). Total sediment organic
carbon (TOC) stable isotopic ratios averaged -26.50‰ ± 0.73‰ (although this data set is
incomplete as 4 months worth of samples were lost in transit; Table 1). Differences in isotopic
signatures between bacterial PLFA and TOC ranged between 2 - 5‰, depending on the fatty acid.

68
The phototrophic microeukaryotic marker 20:5w3 showed δ13C values of -36 to -44‰ and
differences in isotopic signatures between 20:5w3 and TOC were substantial and ranged from 9 -
17‰ (Fig. 4).
Principal component analysis of compound-specific stable carbon isotope ratios profiles of
the White Clay Creek sedimentary microbial community indicated that for much of the year
(December, March, May and June) profiles were similar (Fig. 5). However, three months (April,
July and September) showed significant variation from the majority of the samples and two
months (February and October) showed high variability among replicates. The samples collected
in April showed positive PC1 scores while sediment samples collected in summer (July and
September) showed negative PC1 scores. PC1 scores for samples collected in October spanned
those for July and September and December, March, May and June. Similarly, February samples
showed PC1 scores that spanned those from April and December, March, May and June.
DISCUSSION
Microbial biomass, community structure and PLFAs stable carbon isotope ratios were
seasonally dynamic in White Clay Creek sediments. Total microbial biomass was lowest during
winter months and peaked during May and June, a period of moderate temperatures and stream
flow. Microbial community structure was dominated by prokaryotes during winter months but
then showed an increase in the relative abundance of several PLFA (16:1w13t, 20:5w3, 16:4w1)
typically associated with phototrophic microeukaryotes during March and April. The relative
importance of microeukaryotes remained high during May through October, however, PCA of

69
PLFA profiles suggested that heterotrophic microeukaryotes gained in relative importance during
this period. Compound specific stable isotope analysis revealed that most bacterial PLFAs (e.g.
i15:0, a15:0) closely tracked δ13C values of sediment total organic carbon, and varied little over
the course of the study. The PLFA 20:5ω3 was the most depleted of all fatty acids and was one
of most variable ranging from a low of -43.89 in December to a high of -36.17 in April..
Total microbial biomass and bacterial abundance for WCC exhibited seasonal fluctuations
and closely reflected variations in stream physicochemistry, indicating a tightly coupled response
by microbial biomass to environmental variables. We found that a significant amount of the
variance (49%) in total microbial biomass was explained by a combination of high and low flood
pulse counts, variability in daily flow and DOC concentration. This suggests that flood
disturbance frequency (as depicted by high and low flood pulse counts) and flow rate (mean or
median flow) should be major factors influencing benthic microbial productivity in streams. Our
results extend to total microbial biomass the findings of Poff et al. (1990), who demonstrated that
benthic algal biomass was sigificantly impacted by current regime. For example, sediment
microbial biomass in WCC showed peak total biomass in late spring/early summer when mean
monthly flows were moderate, variability in daily flow was low and DOC was in steady supply.
These findings extend to heterotrophic microbial communities earlier reports that current regime
can structure the development of benthic communities in streams (Poff and Ward 1989; Biggs
1996; Clausen and Biggs 1997).
Total microbial biomass and bacterial abundance were within the range of published
microbial biomass for temperate freshwater sediments (Bott and Kaplan 1985; Sutton and Findlay
2003; Findlay et al. 2008) but lower than that reported for an impacted, channelized riverine
system in central Ohio (Langworthy et al. 1998; 2002) and contaminated subsurface riverine
70
sediments (Mosher et al. 2006). Total microbial biomass was low and microeukaryotic
contribution to total biomass was significantly reduced during the winter when water temperature
was below 4ºC. At this temperature, metabolisms of both (phototropic) microeukaryotes and
macrofauna are minimal (Lencioni 2004). Insufficient light to support photosynthesis could
explain the depression of phototropic biomass (6-7% of total biomass) in winter, while lack of
grazing pressure on heterotrophic prokaryotes could explain their absolute dominance of total
microbial biomass during the coldest period of the year. With the onset of spring in March, the
phototrophic eukaryotes increased in biomass, while microbial biomass reached periods of peak
total biomass in late spring and summer (Table 1). In spring water has warmed sufficiently, mean
monthly flow decreased and changes in light levels likely enhanced phototropic growth rates such
that total microeukaryotic biomass accounted for 21% to 28% of total microbial biomass.
However, increasing water temperature also increased macrofauna activities (Tande 1988) with
resultant grazing pressure on microbial biomass as evidenced by the decline in total microbial
biomass into the autumn.
Seasonal patterns in microbial community structure have previously been reported in
several lotic environments (Smoot and Findlay 2001; Sekiguchi et al. 2002; Crump et al. 2003),
and two studies described recurring seasonal patterns of microbial communities in streambed
sediments through several annual cycles (Sutton and Findlay 2003; Hullar et al. 2006). The
sediment microbial community composition of WCC displayed distinct seasonal patterns
supporting earlier findings and paralleled the annual cycle in biomass loss and accrual. Our data
showed that the seasonal pattern of variation was, in part, the result of shift between the ratios of
prokaryotic to eukaryotic component of the community. This shift, quantified as PC1 score, was
significantly correlated with seasonal changes in median daily flow, DOC concentration, high and

71
low flood pulse counts and water temperature. The correlation of variation in streamflow and
temperature with changes in community structure of sediment communities observed in our study
was consistent with other studies of temperate ecosystems that reported associated changes in
productivity and community structure (Kaplan and Bott 1989; Shiah and Ducklow 1995; Sutton
and Findlay 2003; Hullar et.al. 2006). The negative effects of low temperature on
microeukaryotic component of microbial community may be associated with decreased affinity
for substrates or inability to sequester substrates from their environment at very low temperatures
(Nedwell 1999). Also, variability in daily flow and high flood pulse count could reduce contact
time with highly bioavailable DOC, which can alter microbial community structure and function.
The positive effects of DOC on microbial community structure via changes in quantities and
qualities of carbon availability have been documented to alter microbial community structure in
predictable ways in both field and mesocosm studies (Falchini et al. 2003; Waldrop and Firestone
2004; Fierer et al. 2007; Nemergut et al. 2010).
The winter sediments (December - February) were dominated by prokaryotes; including
functional groups of fatty acids indicating the presence of gram-positive, gram-negative,
anaerobic, and sulfate-reducing bacteria. Earlier molecular assessments (Hullar et al. 2006) and a
mesocosm study (Chapter 4) of WCC sediments showed that these fatty acids are indicative of a
wide range of bacteria found in the α, β, γ and δ subclasses of proteobacteria and in several genera
of Firmicutes, Acidobacteria, Bacterroidetes and Gammatimonadetes, which is consistent for
other freshwater bacterioplankton communities (Zwart et al. 2002; Eiler and Bertilsson 2004).
Storm events in winter accounted for over 30% (Table 1) of the yearly discharge, and
consequently, a major driver that contributed to low microbial biomass through erosion and
transport of streambed particles. Reductions in sediment bacterial biomass have been reported for

72
riverine sediments following storm events (Holmes et al. 1998; Eisenmann et al. 1999). However,
benthic bacterial composition exhibited a lower disturbance threshold compared to eukaryotic
biomass, which may reflect individual differences in attachment to streambed structure.
Microeukaryotic functional groups, including diatoms and other phototrophic
microeukaryotes (as represented by 20:5w3, 18:3w3, and 16:4w1), at our site responded to the
moderate warmer conditions in the spring and helped defined microbial community structure.
Dominant vernal photoautotrophs corresponding to Haslea, seasonally varying Navicula and
cyanobacterial (Phormidium subfuscum) populations were previously determined in WCC based
on a molecular assessment (Hullar et al. 2006). Kjeldsen et al. (1996) reported benthic algal
spring development peaking in late April/mid May in a Danish lowland stream. This is in concert
with Iversen et al. (1991) who reported the same pattern in a channelized stream. In several
studies (Sand-Jensen et al. 1988; Horner et al. 1990; Kjeldsen et al. 1996), the initiation of spring
blooms has been explained by increased irradiance and decreased water velocity and light
attenuation. As streamwater continued to warm into the summer, studies of temperature-
dependent metabolic activity suggests increases in macroinvertebrate activity (Tande 1988), thus,
increased grazing pressure on phototrophs may have caused the decrease in phototrophic biomass
observed in summer months (Table 1 and Fig. 2). This finding is in agreement with other studies
showing that invertebrate grazing can regulate phototrophic biomass (Kohler 1992; Feminella and
Hawkins 1995; Lambert 1996). Functional groups of fatty acids indicating the presence of fungi,
protozoan, and bacteria progressively replaced the community and were more dominant in
summer (Fig. 2). Saprophytic fungi and terrestrial plant detritus (plant root and shoot tissue)
represented by 18:2w6 and 18:1w9 (Frostegård and Bååth, 1996 and Olsson and Johansen, 2000)

73
assumed dominance in the summer/late summer months, possibly due to an increased input of
plant detritus towards the end of the growing season.
There were no seasonal differences in stable carbon isotope ratios for most bacterial
PLFAs (e.g., i15:0, a15:0), but there were seasonal differences in summed feature 1 (16:1ω9,
16:1ω7c, 16:1ω5c, 16:1w13t) and the fatty acid 20:5ω3. The fatty acids in summed feature 1 are
all monounstaturated fatty acids and are found in a wide range of aerobic bacteria, and
heterotrophic and phototrophic eukaryotes (Findlay 2004). The fatty acid 20:5ω3 is most often
associated with phototrophic microeukaryotic (in particular, diatoms; Findlay 2004) and showed
annual range in isotopic ratios of approximately -36‰ in spring (April) to -44‰ in Autumn
(September) and Winter (December), indicating that isotopic fractionation was not constant
seasonally (Ishikawa et al. 2012). Published values of carbon isotopic signatures for freshwater
algae ranged between -47 and -12‰ (-25.7 ‰ ± 6.8, mean ± S.D.) (Finlay 2001; Zah et al. 2001;
Ishikawa et al. 2012). Studies investigating factors that influence isotopic fractionation in
phytoplankton have suggested that spatial and temporal variation in δ13C of CO2 can play a major
role in determining microalgal δ13C in streams (Finlay 2004). Since photosynthesis in spring is
high and respiration on terrestrial organic matter is low, resulting in reduced input of CO2 from
decomposing 13C-depleted terrestrial detritus, the biological carbon fixation results in less
negative δ13C for PLFA 20:5w3 (Golterman and Meyer 1985; Hellings et al. 2001 ). Moreover,
some phototrophs such as diatoms can utilize bicarbonate, which is isotopically heavier than
dissolved CO2 (Law et al. 1995; Boschker et al. 2005; Ishikawa et al. 2012), thereby explaining
the higher δ13C of 20:5w3 in spring. Overall, increased algal productivity in spring was partly due
to moderate stream temperature and flow appears to be the strongest predictor of the variability in
δ13C of PLFAs.

74
On average, the δ13C values of many bacterial PLFAs were depleted by 2-5‰ relative to
δ13C of sediment total organic carbon, which was consistent with the findings of Canuel et al.
(1997) that δ13C values of lipids are generally depleted by 3-5‰ relative to δ13C of sediment total
organic carbon. This implied that bacteria were utilizing a carbon source with a δ13C of -26 to -
28‰, which is comparable to δ13C of sediment total organic carbon in this study and a previous
determination of the δ13C of WWC DOC (-26.10; Wiegner et al, unpublished). The
correspondence among the δ13C of many bacterial PLFAs and sediment organic carbon and
streamwater DOC supports previous studies concluding that bacterial carbon in forested streams
is derived from streamwater DOC and particulate detritus (Bott et al. 1984; Hall 1995; Webster et
al.1999). These fatty acids were enriched in 13C, on average by 9-10‰ compared to 20:5w3. This
difference support the utilization of terrigenous detrital carbon and suggests minimal utilization of
autochthonous DOC. Boschker et al. (2005) reported uncoupled algal-bacterial system (also based
on PLFA) with terrestrial organic matter or sewage as subsidies supporting bacteria growth during
a spring bloom in the upper Scheldt estuarine. In contrast, δ13C values of bacterial PLFA of
summed feature 1 (16:1ω9, 16:1ω7c, 16:1ω5c, 16:1w13t) showed enrichment in δ13C by 5.77‰
relative to 20:5w3 suggesting that some heterotrophic prokaryotes within the system may utilize
autochthonous DOC, along with allochthonous detritus as carbon sources. The observed δ13C
difference among microbial taxa suggested that further studies of carbon substrate dynamics in
lotic systems are needed.
In conclusion, our results show an overall seasonality within freshwater sediment
microbial communities and their associated lipid carbon isotope ratios. Bacterial lipids were
isotopically depleted on average by 2‰ and 5‰ relative to δ13C of total organic carbon and
enriched relative to δ13C algae-derived carbon source. In winter, the lowest δ13C PLFA values

75
were observed likely due to enhanced input of CO2 from detrital decomposition. During spring
bloom, when litter input is lowest, photosynthesis is high, input of CO2 from detrital
decomposition is low resulting in less negative δ13C PLFAs. Thus, the annual variation of the
δ13C of biota is sensitive in providing indication of changes resulting from biological carbon
fixation and from degradation and respiration from aquatic biota or terrestrial detritus. As such,
isotopic measurements may serve as an early warning signal of ecological changes related to
ecological processes in natural ecosystems. Furthermore, these findings support an emerging
picture in stream ecosystem that hydro-ecological parameters are important factors that structure
streambed microbial communities. Seasonal changes in microbial community structure are largely
predictable and allow the community to take advantage of the changes in carbon and energy input
sources over an annual cycle. Several microbial biogeography studies now provide evidence for
non-random patterns in microbial distribution and show that local environmental heterogeneity
and geographical distance regulate microbial distribution (Battin et al. 2001; Oda et al. 2003;
Crump et al. 2004; Hughes-Martiny et al. 2006; Fierer et al. 2007; Findlay et al. 2008). More
studies and assessments of microbial seasonal patterns may help facilitate better monitoring
strategies for detecting immediate as well as long-term impacts of anthropogenic stressors on the
microbial communities of lotic ecosystems.
Acknowledgments
The authors wish to acknowledge Sherman Roberts for help obtaining samples, and Janna Brown
for assistance in obtaining IRMS data. This research was supported, in part, by NSF grants DEB –
DEB-0516235.

76
LITERATURE CITED
Abraham W., R. C. Hesse and O. Pelz .1998. Ratios of carbon isotopes in microbial lipids as an indicator of substrate usage. Appl. Environ. Microbiol. 64:4202–4209.
Abraham W.R. and C. Hesse. 2003. Isotope fractionations in the biosynthesis of cell components by different fungi: a basis for environmental carbon flux studies. FEMS Microbiol Ecol 46: 121–128.
Autio R. 1998. Response of seasonally cold-water bacterioplankton to temperature and substrate treatments. Estuar. Coast Shelf Sci. 46:465–474.
Battin T.J, Wille A, Sattler B. and R. Psenner. 2001. Phylogenetic and functional heterogeneity of sediment bioflms along environmental gradients in a glacial stream. Appl. Environ. Microbiol. 67: 799-807.
Ben-David M, Hanley TA, Klein DR, Schell DM. 1997. Seasonal changes in diets of coastal and
riverine mink: the role of spawning Pacific salmon. Can J Zool 75:803–811. Biggs B. J. F. 1996. Patterns in benthic algae of streams. Pages 31-56 in R. J. Stevenson, M. L.
Bothwell, and R. L. Lowe (editors). Algal ecology: freshwater benthic ecosystems. Academic Press, San Diego, California.
Bond AL and Diamond AW. 2011. Recent Bayesian stable-isotope mixing models are highly sensitive to variation in discrimination factors. Ecological Applications 21:1017–1023.
Bott T. L., L. A. Kaplan, and F. T. Kuserk. 1984. Benthic bacterial biomass supported by streamwater dissolved organic matter. Microbial Ecology 10:335–344.
Bott T.L and L. A. Kaplan. 1985. Bacterial biomass, metabolic state, and activity in stream sediments: Relation to environmental variables and multiple assay comparisons. Appl. Environ. Microbiol. 50: 508-522.

77
Boschker H.T.S., S.C. Nold, P. Wellsbury, D. Bos, W. de Graaf, R. Pel, R.J. Parkes, and T.E. Cappenberg. 1998. Direct linking of microbial populations to specific biogeochemical processes by C-13-labelling of biomarkers. Nature 392:801–805.
Canuel E.A, K.H. Freeman, S.G. Wakeham. 1997. Isotopic compositions of lipid biomarker compounds in estuarine plants and surface sediments. Limnology and Oceanography, 42: 1570–1583
Cernusak L.A and Hutley L.B. 2011. Stable isotopes reveal the contribution of corticular photosynthesis to growth in branches of Eucalyptus miniata. Plant Physiol. 155:515–23.
Chang C. C. Y., McCormick, P. V., Newman, S., and E. M. Elliott. 2009. Isotopic indicators of
environmental change in a subtropical wetland. Ecol. Indicators, 9: 825–836. Cherel Y., Hobson, K.A., Guinet, C. & Vanpe, C. 2007. Stable isotopes document seasonal
changes in trophic niches and winter foraging individual specialization in diving predators from the Southern Ocean. J. Anim. Ecol. 76: 826–836
Clausen B and B.J.F. Biggs. 1997. Relationships between benthic biota and hydrological indices
in New Zealand streams. Freshwater Biology 38: 327–342.
Clausen B and B.J.F. Biggs. 2000. Flow indices for ecological studies in temperate streams: groupings based on covariance. Journal of Hydrology 237: 184–197.
Cole J.J., S.R Carpenter, J.F Kitchen and M.L. Pace. 2002. Pathways of organic carbon utilization in small lakes: Results from a whole-lake 13C addition and coupled model. Limnol. Oceanogr. 47:1664-1675.
Crump B.C, G.W. Kling, M. Bahar, J.E. Hobbie. 2003. Bacterioplankton community shifts in an arctic lake correlate with seasonal changes in organic matter source. Appl. Environ. Microbiol. 69: 2253–2268.
Crump B.C, Hopkinson C.S, Sogin M.L, Hobbie J.E. 2004. Microbial biogeography along an estuarine salinity gradient: combined influences of bacterial growth and residence time. Appl. Environ. Microbiol. 70, 1494–1505

78
Dai J and M. Sun. 2007. Organic matter sources and their use by bacteria in the sediments of the Altamaha estuary during high and low discharge periods. Organic Geochemistry, 38: 1–15.
Dumont M and J. Murrell. 2005. Stable isotope probing-linking microbial identity to function. Nat Rev Microbiol 3: 499–504.
Eiler A. and S. Bertilsson. 2004. Composition of freshwater bacterial communities associated with cyanobacterial blooms in four Swedish lakes. Environ. Microbiol. 6:1228-1243.
Eisenmann H, Burgherr P, EI Meyer 1999. Spatial and temporal heterogeneity of an epilithic streambed community in relation to the habitat templet. Can J Fish Aquat Sci 56:1452–1460.
Falchini L, Naumova N, Kuikman PJ, Bloem J, Nannipieri P. 2003. CO2 evolution and denaturing
gradient gel electrophoresis profiles of bacterial communities in soil following addition of low molecular weight substrates to simulate root exudation. Soil Biology & Biochemistry 35: 775–782.
Febria C. M., Fulthorpe R. R. and D. D. Williams. 2010. Characterizing seasonal changes in
physicochemistry and bacterial community composition in hyporheic sediments. Hydrobiologia 647: 113–126.
Feminella J.W and C. P. Hawkins. 1995. Interactions between stream herbivores and periphyton: A quantitative analysis of past experiments. J. N. Am. Benthol. Soc. 14: 465-509.
Fierer N, Morse J, Berthrong S, Bernhardt E.S, R.B. Jackson. 2007. Environmental controls on the landscape-scale biogeography of stream bacterial communities. Ecology 88:2162–2173.
Finlay J. C. 2001. Stable carbon isotope ratios of river biota: Implications for carbon flow in lotic food webs. Ecology 82: 1052-1064.
Finlay J. C. 2004. Patterns and controls of lotic algal stable carbon isotope ratios. Limnol. Oceanogr. 49:850–61.

79
Findlay R. H. and F. C. Dobbs. 1993. Quantitative description of microbial communities using lipid analysis, p. 271–284. In P. F. Kemp, B. F. Sherr, E. B. Sherr, and J. J. Cole (ed.), Current methods in aquatic microbial ecology. Lewis Publishers, Boca Raton, FL.
Findlay R. H. 2004. Determination of microbial community structure using phospholipid fatty acid profiles, p. 983–1004. In G. A. Kowalchuk, F. J. De Bruijn, I. M. Head, A. D. L. Akkermans, and J. D. Van Elsas (ed.), Molecular microbial ecology manual, 2nd ed. Kluwer Academic Publishers, Dordrecht, The Netherlands.
Findlay R.H, Yeates C, Hullar M.A.J, Stahl D.A, L.A. Kaplan 2008. Biome-level biogeography of streambed microbiota. Applied and Environmental Microbiology, 74: 3014–3021.
Frostegard, A and Baath, E. 1996. The use of phospholipid fatty acid analysis to estimatebacterial and fungal biomass in soil. Biology and Fertility of Soils 22:59-65.
Gan K.G, McMahon T.A and B.L Finlayson. 1991. Analysis of periodicity in streamflow and rainfall data by Colwell’s indices. Journal of Hydrology 123: 105–118.
Gannes LZ, Martınez del Rio C, Koch P. 1998. Natural abundance variations in stable isotopes and their potential uses in animal physiological ecology. Comp. Biochem. Physiol. A 119:725–737
Golterman H. L. and M. L. Meyer. 1985. The geochemistry of two hard water rivers, the Rhine
and the Rhone: Part 1: Presentation and screening of data. Hydrobiologia 126: 3-10
Gremm, T. J., and L. A. Kaplan. 1998. Dissolved carbohydrate concentration, composition, and bioavailability to microbial heterotrophs in stream water. Acta Hydrochem. Hydrobol. 26:167–171.
Hall R. O. 1995. Use of a stable carbon isotope addition to trace bacterial carbon through a stream food web. Journal of the North American Benthological Society 14:269–277.
Hall R. O. and J. L. Meyer. 1998. The trophic significance of bacteria in a detritus-based stream food web. Ecology 79:1995–2012

80
Holmes, R. M., S. G. Fisher, N. B. Grimm & B. J. Harper, 1998. The impact of flash floods on microbial distribution and biogeochemistry in the parafluvial zone of a desert stream. Freshwat. Biol. 40: 641–654.
Horner, R.R, E.B. Welch, M.R. Seeley, J.M. Jacoby. 1990. Responses of periphyton to changes in current velocity, suspended sediment and phosphorus concentration. Freshwater Biol., 24: 215–232
Horner-Devine, M.C., Carney, K.M. & Bohannan, B.J.M. 2003. An ecological perspective on bacterial diversity. Proc. R. Soc. Lond. Ser. B, Biol. Sci., 271: 113–122.
Hughes-Martiny JB, Bohannan BJM, Brown JH et al. 2006. Microbial biogeography: putting microorganisms on the map. Nature Reviews Microbiology 4:102–112
Hullar M.A.J., Kaplan L.A, and Stahl D.A. 2006. Recurring seasonal dynamics of microbial communities in stream habitats. Applied and environmental microbiology, 72: 713–722
Ishikawa N.F, Doi H, Finlay J.C. 2012. Global meta-analysis for controlling factors on stable carbon isotope ratios of lotic periphyton. Oecologia 170:541−549.
Iversen M. T., J. Thorup, K. Kjeldsen and N. Thyssen. 1991. Spring bloom development of
microbenthic algae and associated invertebrates in two reaches of a small lowland stream with contrasting sediment stability. Freshwat. Biol. 26: 189-198.
Karlsson J., A. Jonsson, M. Meili, and M. Jansson. 2003. Control of zooplankton dependence on allochthonous organic carbon in humic and clear-water lakes in northern Sweden. Limnology and Oceanography 48:269–276.
Kaplan L. A. and T. L. Bott. 1989. Diel fluctuations in bacterial activity on streambed substrata
during vernal algal blooms: effects of temperature, water chemistry, and habitat. Limnol. Oceanogr. 34:718–733.
Kohler S. L. 1992. Competition and the structure of a benthic stream community. Ecological Monographs 62:165–188.
81
Kjeldsen K, Iversen, T.M, Thorup J, P Lund-Thomsen. 1996. Three-year study of benthic algal spring bloom development in a small, Danish lowland stream. Hydrobiologia 335(3):183–192
Kwak T.J. and Zedler, J.B. 1997. Food web analysis of southern California coastal wetlands using multiple stable isotopes. Oecologia, 110: 262–277.
Lamberti G.A. 1996. The role of periphyton in benthic food webs In: Algal Ecology – Freshwater
Benthic Ecosystems (Stevenson, R.J., Bothwell, M.L. and Lowe, R.L., Eds.), pp. 533–572. Academic Press, San Diego, CA.
Langworthy D.E, Stapleton R.D, Sayler G.S and R.H. Findlay. 1998. Genotypic and phenotypic responses of a riverine microbial community to polycyclic aromatic hydrocarbon contamination. Appl Environ Microbiol 64: 3422–3428.
Langworthy D.E, Stapleton R.D, Sayler G.S and R.H. Findlay. 2002. Lipid analysis of the response of a sedimentary microbial community to polycyclic aromatic hydrocarbons. Microbial Ecol 43: 189–198.
Laws E. A., B. N. Popp, R. R. Bidigare,M . C. Kennicutt, and S. A. Macko. 1995. Dependence of phytoplankton carbon iso-topic composition on growth rate and [CO2]aq: Theoretical con-siderations and experimental results. Geochim. Cosmochim. Acta 59: 1131-1138.
Lencioni V. 2004. Survival strategies of freshwater insects in cold environments. Journal of Limnology 63(Supplement 1): 45 – 55.
Lindström E.S, Kamst-Van Agterveld M.P and G. Zwart. 2005. Distribution of typical freshwater bacterial groups is associated with pH, temperature, and lake water retention time. Appl Environ Microb 71: 8201–8206.
Logan J.M, Jardine T.D, Miller T.J, Bunn S.E, Cunjak R.A, Lutcavage M.E. 2008. Lipid corrections in carbon and nitrogen stable isotope analyses: comparison of chemical extraction and modelling methods. J. Anim. Ecol. 77(4): 838-846
Lyautey E., Jackson, C.R., Cayrou, J., Rols, J.L. and F. Garabetian. 2005. Bacterial community
succession in natural river biofilm assemblages. Microb Ecol 50: 589–601.

82
Martínez del Rio, C., Wolf, N., Carleton, S. A. & Gannes, L. Z. 2009. Isotopic ecology ten years after a call for more laboratory experiments. Biological Reviews 84: 91–111. McNabb D, Halaj J, Wise D. 2001. Inferring trophic positions of generalist predators and their
linkage to the detrital food web in agroecosystems: a stable isotope analysis. Pedobiologia 45:289–297
Mook W.G., J. C. Bommerson and W. H. Staverman.1974. Carbon isotope fractionation between
dissolved bicarbonate and gaseous carbon dioxide. Earth Planet. Sci. Lett. 22: 169-176.
Mosher J.J, R.H Findlay and C.G. Johnston. 2006. Physical and chemical factors affecting microbial biomass and activity in contaminated subsurface sediment. Can J Microbiol 52:397–403
Mueller-Spitz, S.R., Goetz, G.W. and S.L. McLellan. 2009. Temporal and spatial variability in nearshore bacterioplankton communities of Lake Michigan. FEMS Microbiol Ecol 67: 511–522.
Nedwell D.B.1999. Effect of temperature on microbial growth: lowered affinity for substrates limits growth at low temperatures. FEMS Microbiol Ecol 30:101–111
Nemergut D.R, Cleveland C.C, Wieder W.R, Washenberger C.L, Townsend A.R. 2010. Plot-scale manipulations of organic matter inputs to soils correlate with shifts in microbial community composition in a lowland tropical rain forest. Soil Biology and Biochemistry, 42, 2153–2160.
Newbold, J. D., T. L. Bott, L. A. Kaplan, B. W. Sweeney and R. L. Vannote. 1997. Organic matter dynamics in White Clay Creek, Pennsylvania, USA. Journal of the North American Benthological Society 16:46-50.
Oda Y, Star B, Huisman LA, Gottschal JC, L. J. Forney. 2003. Biogeography of the purple nonsulfur bacterium Rhodopseudomonas palustris. Appl. Environ. Microbiol. 69: 5186–5191

83
Olapade O. A and L. G. Leff. 2005. Seasonal response of stream biofilm communities to dissolved organic matter and nutrient enrichments. Appl. Environ. Microbiol. 71: 2278–2287.
Olden J. D. and N. L. Poff. 2003. Redundancy and the choice of hydrologic indices for characterizing streamflow regimes. River Research and Applications 19:101–121.
Olsson, P.A and A. Johansen. 2000. Lipid and fatty acid composition of hyphae and spores of arbuscular mycorrhizal fungi at different growth stages. Mycological Research 104, 429-434.
Parnell A.C, Inger R, Bearhop S, Jackson A.L. 2010. Source partitioning using stable isotopes: coping with too much variation. PLoS One 5:e9672
Piscart C., J.M. Roussel, J.T.A. Dick, G. Grosbois and P. Marmonier. 2011. Effects of
coexistence on habitat use and trophic ecology of interacting native and invasive amphipods. Freshw. Biol. 56, 325–334
Poff, N. L and J. V. Ward. 1989. Implications of streamflow variability and predictability for lotic community structure: a regional analysis of streamflow patterns. Canadian Journal of Fisheries and Aquatic Sciences 46:1805-1818.
Poff, N. L., Voelz, N. J., Ward, J. V. and R.E. Lee. 1990. Algal colonization under four experimentally controlled current regimes in a high mountain stream. - J. North Am. Benthol. Soc. 9: 303-318.
Poff N.L, Allan J.D, Bain M.B, Karr J.R, Prestegaard K.L, Richter B.D, Sparks R.E and J.C. Stromberg. 1997. The natural flow regime. Bioscience 47: 769–784.
Post, D. M., M. L. Pace, and N. G. Hairston. 2000. Ecosystem size determines food-chain length in lakes. Nature 405:1047–1049.
Post, D.M. 2002. Using stable isotopes to estimate trophic position: models, methods, and
assumptions. Ecology 83: 703–718.

84
Radajewski S., Ineson, P., Parekh, N. R. and J. C. Murrell. 2000. Stable-isotope probing as a tool in microbial ecology. Nature 403: 646-649.
Richter B.D, J.V Baumgartner, J. Powell and D.P Braun. 1996. A method for assessing hydrologic alteration within ecosystems. Conservation Biology 10: 1163–1174.
Riera P and P. Richard. 1997. Temporal variation of d13C in particulate organic matter and oyster Crassostrea gigas in Marennes-Ole´ron Bay (France): effect of freshwater. Mar Ecol Prog Ser 147:105–115
Rieley G., R.J Collier, D.M Jones, G Eglinton, P.A Eakin and A.E Fallick. 1991. Sources of
sedimentary lipids deduced from stable carbon isotope analyses of individual compounds. Nature 352: 425-427.
Rubenstein D.R and K.A. Hobson. 2004. From birds to butterflies: animal movement patterns and stable isotopes. Trends Ecol Evol 19:256-263
Sand-Jensen K., J. Møller, and B.H. Olesen. 1988. Biomass regulation of microbenthic algae in
Danish lowland streams. Oikos. 332–340. Sekiguchi, H., M. Watanabe, T. Nakahara, B. Xu, and H. Uchiyama. 2002. Succession of
bacterial community structure along the Changjiang River determined by denaturing gradient gel electrophoresis and clone library analysis. Appl. Environ. Microbiol. 68:5142–5150.
Shiah F. K. and H. W. Ducklow. 1995. Multiscale variability in bacterio- plankton abundance,
production, and specific growth rate in a temperate salt-marsh tidal creek. Limnol. Oceanog. 40:55–66.
Smoot J.C and R.H. Findlay. 2001. Spatial and Seasonal Variation in a Reservoir Sedimentary Microbial Community as Determined by Phospholipid Analysis. Microb. EcoL, 42: 350-358.
Sutton S.D and R.H. Findlay. 2003. Sedimentary microbial community dynamics in a regulated stream: East Fork of the Little Miami River, Ohio. Environ. Microbiol. 5: 256-266

85
Tande K.S. 1988. The effects of temperature on metabolic rate of different life stages of Calanus glacialis in the Barents Sea. Polar Biol 8:457–461
Tobias H.J, Sacks G.L, Zhang Y, and J.T. Brenna. 2008. Comprehensive two-dimensional gas chromatography combustion isotope ratio mass spectrometry. Anal Chem 80:8613–8621.
Vander Zanden M. J., B. J. Shuter, N. Lester, and J. B. Rasmussen. 1999. Patterns of food chain
length in lakes: a stable isotope study. American Naturalist 154:406–416. Vizzini S, Sara` G, Michener R.H, and A. Mazzola. 2002. The role and contribution of Posidonia
oceanica (L.) Delile organic matter for secondary consumers as revealed by carbon and nitrogen stable isotope analysis. Acta Oecol 23:277–285
Waldrop M and M.K. Firestone. 2004. Microbial community utilization of recalcitrant and simple
carbon compounds: impact of oak-woodland plant communities. Oecologia 138, 275–284. Wiegner T.N, L.A Kaplan, J.D Newbold and P. H. Ostrom. 2005. Contribution of dissolved
organic C to stream metabolism: a mesocosm study using 13C-enriched tree-tissue leachate. JNAB. Soc. 24(1):48–67.
Zah R., P. Burgherr, S. M. Bernasconi, and U. Uehlinger. 2001. Stable isotope analysis of macroinvertebrates and their food sources in a glacier stream. Freshw. Biol. 46: 871-882.
Zimmerman A. R. and E. A. Canuel. 2001. Bulk organic matter and lipid biomarker composition of Chesapeake Bay surficial sediments as indicators of environmental processes. Estuar. Coast. Shelf. Sci. 53:319–341.
Zwart G., Crump, B.C., Kamst-van Agterveld, M., Hagen, F., and S.K Han. 2002. Typical freshwater bacteria: an analysis of available 16S rRNA gene sequences from plankton of lakes and rivers. Aquat Microb Ecol 28: 141–155.

86
Figure 1. Mean daily discharge at United States Geological Survey (USGS) gauging station of the
study stream during the study period from November 2009 to October 2010. Arrow represents
sampling date of streambed sediment samples.

87
Figure 2. PCA of benthic microbial community structure determined by PLFA from the White
Clay Creek seasonal sampling site. Scores are plotted by months: February, F; March, Ma; April,
Ap; May, My; June, Ju; July, Jy; August, Au; September, S; October, O; December, D.
Scales indicate the degree of difference among samples and influential fatty acids (factor loadings
> |0.5|)] are shown along each axis. Symbols indicate mean PC scores (n=9, except Nov. and Dec.
where n =3), error bars = ±S.D. Elipeses drawn by hand to emphase clusters.

88
Figure 3. Relationship between PCA factor 1 score and the calculated percentage that
microeukaryotes contribute to total microbial biomass for all samples.
y = -0.0763x + 1.5829R² = 0.543
-3
-2
-1
0
1
2
3
0 5 10 15 20 25 30 35 40
PC
Sco
re 1
% Eukaryotic Biomass

89
Figure 4. Seasonal variability in sedimentary TOC and selected δ13C PLFAs with component
loadings >0.5 that exerted strong influence on the pattern of variation among samples along the
PC 1 (Fig 5). Bars represent standard deviation.
-50
-45
-40
-35
-30
-25
-20
Feb Mar Apr May Jun Jul Sep Oct Dec
δ1
3 C
Month
i15:0 a15:0 18:2w6 20:5w3 TOC

90
Figure 5. PCA of all quantified δ13C of PLFAs of WCC benthic microbial community. Scores are
plotted by months: February, FE; March, MA; April, AP; May, MY; June, JU; July, JY;
September, SE; October, OC; December, DE. Influential fatty acids (factor loadings > |0.5|)] are
shown along each axis. # summed feature includes 16:1ω9, 16:1ω7c, 16:1ω5c, 16:1w13t;
*summed feature includes 18:2ω6, 18:3w3, 18:1ω9, 18:1ω7c, 18:1ω5

91
Table 1. Seasonal variations in total sedimentary microbial biomass, bacterial abundance, and physico-chemical parameters of White
Clay Creek
Sampling
date
Biomass/PLP
(nmol g-1dw)
Bacterial
abundance
(g-1 dry wt)
Percent
Eukaryotic/
prokaryotic
Mean daily
temperature
(°C)
Mean
Monthly
Flow (m3s-1)
Mean
DOC
(µ g/L)
Sediment
δ13C
Sediment
δ15N
Sediment
%C
Sediment
%N
C:N ratio
December 10.05 ± 6.95 3.78 x 10⁸ 6/94 2.82 1.14 1260 LIT LIT LIT LIT LIT
February 10.64 ± 3.67 3.96 x 10⁸ 7/93 3.82 0.61 956 LIT LIT LIT LIT LIT
March 18.34 ± 8.47 5.66 x 10⁸ 23/77 7.56 1.22 1632 LIT LIT LIT LIT LIT
April 16.23 ± 3.29 5.33 x 10⁸ 18/82 12.31 0.72 1199 -27.22 ± 0.70 2.87 ± 1.75 1.20 ± 0.35 0.11 ± 0.03 10.79
May 27.19 ± 9.00 7.80 x 10⁸ 28/72 16.13 0.46 1470 LIT LIT LIT LIT LIT
June 28.96 ± 12.13 9.19 x 10⁸ 21/79 16.64 0.27 1274 -26.69 ± 0.64 -0.81 ± 2.70 0.95 ± 0.52 0.06 ± 0.03 14.74
July 19.91 ± 11.95 7.10 x 10⁸ 11/89 19.83 0.32 1757 -26.09 ± 1.27 -5.45 ± 4.83 0.57 ± 0.53 0.06 ± 0.04 9.92
August 13.94 ±1.45 3.90 x10⁸ 30/70 20.33 0.16 1932 -25.27 ± 0.25 2.00 ± 1.15 0.26 ± 0.02 0.02 ± 0.00 13.02
September 13.35 ± 1.29 4.14 x 10⁸ 23/77 14.3 0.15 1357 -27.17 ± 0.85 2.77 ± 0.49 0.49 ± 0.23 0.04 ± 0.03 12.66
October 16.92 ± 6.76 4.93 x 10⁸ 27/73 11.82 0.55 2550 -26.55 ± 1.78 2.96 ± 0.77 0.43 ± 0.26 0.03 ± 0.02 12.77
LIT= Lost in transit

92
Table 2. Pearson correlation coefficient matrices between selected hydrological indices and measured environmental variables.
Biomass Tempt (°C) DOC (ug/L) MDF MQ50 MVD1 MBI FLC FHC1
Biomass 1
Temperature (C) 0.519 1
DOC (ug/L) 0.078 0.385 1
MDF -0.320 -0.702 -0.389 1
MQ50 -0.066 -0.510 -0.276 0.887 1
MVD1 -0.552 -0.465 -0.283 0.519 0.093 1
MBI 0.488 0.350 0.181 -0.527 -0.134 -0.974 1
FLC -0.192 -0.220 -0.532 0.549 0.342 0.650 -0.706 1
FHC1 -0.628 -0.534 -0.122 0.365 0.204 0.401 -0.382 0.477 1
Bold mean r statistics for variable > |0.7| Italic means variables removed prior to ‘best subset’ multiple regression analysis

93
Table 3. Multiple regression analysis (best subsets) for natural log biomass as a function of stream
physico- chemical and hydrological indices
Model Vars R-Sq R-Sq(adj) Mallow Cp SE Temp DOC MQ50 MVD1 FLC FHC1
1 1 39.4 32.7 0.8 4.9865 X
2 1 30.5 22.8 1.9 5.3405 X
3 2 50.2 37.7 1.4 4.7965 X X
4 2 44.1 30.2 2.2 5.0783 X X
5 3 64.3 49.0 1.6 4.3381 X X X
6 3 51.5 30.8 3.2 5.0561 X X X
7 4 65.7 42.8 3.4 4.5952 X X X X
8 4 64.7 41.2 3.5 4.6588 X X X X
9 5 66.2 32.5 5.3 4.9926 X X X X X
10 5 65.9 31.9 5.4 5.0151 X X X X X
11 6 68.8 22.1 7.0 5.3628 X X X X X X

94
Table 4. Multiple regression analysis (best subsets) for microbial community (PC1) as a function of stream physico-chemical and
hydrological indices
Model Vars R-Sq R-Sq (adj) Mallow Cp SE %
Eukaryotic
Temp DOC MQ50 MVD1 FLC FHC1
1 1 57.1 51.8 28.1 0.62343 X
2 1 31.0 22.4 48.8 0.79067 X
3 2 78.3 72.1 13.3 0.47435 X X
4 2 65.1 55.2 23.7 0.60108 X X
5 3 85.6 78.3 9.5 0.41777 X X X
6 3 84.3 76.4 10.5 0.43577 X X X
7 4 90.4 82.8 7.6 0.37224 X X X X
8 4 88.7 79.7 9.0 0.40484 X X X X
9 5 97.0 93.2 4.4 0.23342 X X X X X
10 5 92.8 83.7 7.8 0.36226 X X X X X
11 6 97.4 92.2 6.1 0.25024 X X X X X X
12 6 97.1 91.4 6.3 0.26313 X X X X X X
13 7 97.5 88.7 8.0 0.30210 X X X X X X X

95
Table 5. Annual variations in stable carbon isotope signatures for selected common fatty acids from White Clay Creek sediments.
Values shown are mean (±SD) from all sampling sites and months.
SF1= summed feature including 16:1ω9, 16:1ω7c, 16:1ω5c, 16:1w13t; SF2 = summed feature including 18:1ω9, 18:1ω7c, 18:1ω5. ND = not detected
FAMEs FEB MAR APR MAY JUN JUL SEP OCT DEC
14:0 -37.64 ±1.53 -37.24 ±2.75 -32.03 ±1.60 -35.69 ±0.67 -36.34 ±1.01 -34.56 ±1.97 -37.47 ±1.55 -34.50 ±1.30 -34.98 ±1.00
i15:0 -30.36 ±0.83 -30.19 ±0.51 -29.61 ±0.46 -30.53 ±0.55 -31.20 ±0.63 -31.59 ±1.41 -31.74 ±0.70 -30.69 ±0.56 -29.70 ±0.94
a15:0 -28.95 ±1.72 -29.72 ±0.86 -29.34 ±0.63 -29.20 ±0.91 -30.24 ±0.53 -30.41 ±0.72 -30.78 ±0.54 -29.97 ±0.60 -29.32 ±0.91
15:0 -30.97 ±2.71 -35.34 ±0.90 -30.66 ±2.08 -30.73 ±1.82 -32.11 ±1.50 -29.53 ±0.50 -32.86 ±1.67 -30.00 ±0.84 ND
i16:0+15:1 -28.23 ±1.45 -29.53 ±0.75 -29.10 ±0.59 -28.36 ±1.25 -30.44 ±0.51 -31.94 ±1.33 -31.14 ±0.62 -29.63 ±0.79 -28.43 ±1.00
16:0 -32.65 ±2.24 -34.32 ±1.21 -31.90 ±2.05 -34.45 ±0.57 -32.92 ±2.53 -34.28 ±1.98 -35.20 ±0.84 -34.68 ±2.24 -33.79 ±1.65
SF1 -32.58 ±1.33 -33.91 ±1.31 -31.70 ±1.71 -34.43 ±0.79 -30.99 ±2.67 -35.32 ±1.00 -35.47 ±1.17 -35.26 ±1.76 -36.08 ±1.27
cy17:0 -32.49 ±4.80 -30.04 ±0.64 -30.16 ±0.68 -31.30 ±0.80 -30.28 ±1.15 -32.56 ±1.06 -31.50 ±0.90 -32.14 ±2.39 -30.78 ±1.73
18:0 -30.82 ±0.32 -31.91 ±0.94 -30.64 ±0.29 -32.97 ±0.82 -32.28 ±2.02 -33.54 ±1.23 -33.81 ±1.14 -32.97 ±1.57 -31.27 ±0.14
SF2 -30.74 ±1.46 -32.03 ±0.69 -31.26 ±0.38 -31.85 ±0.55 -31.18 ±1.13 -32.35 ±0.45 -32.43 ±0.53 -33.00 ±1.71 -31.94 ±0.17
18:2w6 -33.43 ±3.31 -37.64 ±2.32 -32.63 ±1.44 -36.16 ±1.08 -36.05 ±3.06 -37.77 ±2.06 -38.32 ±2.70 -38.22 ±4.70 -38.94 ±1.00
18:3w3 -32.10 ±0.73 -32.37 ±0.65 -32.31 ±0.53 -33.10 ±0.36 -33.12 ±0.58 -34.62 ±0.79 -33.58 ±0.42 -34.37 ±1.71 -32.05 ±0.33
20:0 -36.60 ±1.62 -42.52 ±1.78 -38.57 ±0.95 -40.78 ±1.73 -41.68 ±1.49 -42.06 ±2.05 -42.12 ±2.42 -41.90 ±3.69 ND
20:4w6 -37.60 ±3.25 -40.32 ±1.78 -36.08 ±0.87 -38.46 ±1.33 -40.94 ±0.86 -38.92 ±1.24 -41.50 ±2.01 -39.83 ±2.24 ND
20:5w3 -41.18 ±1.75 -38.90 ±1.34 -36.17 ±2.77 -39.61 ±0.75 -42.56 ±0.88 -40.36 ±1.73 -43.66 ±1.41 -39.23 ±2.32 -43.89 ±2.03

96
CHAPTER 4
ELUCIDATING THE BACTERIA RESPONSIBLE FOR UTILIZATION OF
DISSOLVED ORGANIC MATTER IN A THIRD-ORDER STREAM
ABSTRACT
Terrigenous dissolved organic matter (DOM) has long been considered recalcitrant to bacterial
biodegradation although current research has shown its susceptibility to microbiological and
photolytic oxidations and that it contributes significantly to the energy flow in aquatic
ecosystems. To determine the microbial groups actively utilizing terrestrially derived streamwater
DOM, we characterized sediment microbial biomass and community structure using phospholipid
phosphate and phospholipid fatty acids analysis and identified metabolically active members
using phospholipid fatty acid stable isotope probing. Prokaryotes comprised 61% of the
streambed microbial community and consisted of aerobic, facultative anaerobic and anaerobic
bacteria while microeukaryotes comprised the remaining 39%. Streambed sediments were
incubated in re-circulating mesocosm chambers amended with leachate from composted 13C-
labelled tulip poplar tree-tissues (a process that yields 13C-labeled DOM with size and lability
fractions approximating streamwater DOM) and examined for 13C incorporation into microbial
phospholipid fatty acids (PLFAs). The structure of stream sediment microbial communities prior
to and after mesocosm incubation, in both the presence and absence of 13C-labeled DOM, showed
no significant differences and indicated our mesocosm-based experimental design as sufficiently

97
robust to investigate the utilization of 13C-DOM by sediment microbial communities. After 48
hours of incubation, bacterial fatty acids i15:0, a15:0, 16:0, 16:1ω9, 18:1ω9c, 18:1ω7c, 10me16
and cy19:0 showed increased abundance of 13C. This identified the aerobic, facultative anaerobic
and anaerobic bacteria as actively utilizing the 13C-labeled DOM. A single dark 48 h incubation
showed incorporation into both baterial and and microeukaryotic fatty acids (20:4ω6, 20:5ω3)
suggesting that the microeukaryotic predators consumed bacteria that utilized 13C-labeled DOM.
Our data support the hypothesis that streamwater DOM is utilized by stream bacteria, and
substantially contributes to the energy flow in aquatic ecosytems.

98
INTRODUCTION
Dissolved organic matter (DOM) plays a significant metabolic role in aquatic ecosystems as
carbon and energy sources for the microbial food web (Peduzzi et al. 2008; Wiegner et al. 2009;
Wong and Williams 2010). It influences the availability of dissolved nutrient and metals, and
modifies the optical properties of aquatic ecosystems (Findlay and Sinsabaugh 1999; Sulzberger
and Durisch-Kaiser 2009). In addition, DOM is now seen as an important driver of ecosystem
functions in freshwater environments and a major component in global carbon cycling and
climate change (Amon and Benner 1996; Batin et al. 2008; Besemer et al. 2009). Dissolved
organic carbon (DOC) is the largest pool of organic carbon in aquatic ecosystems, is
heterogeneous in nature being comprised of humic high-molecular-weight (HMW >1 kDa) and
non-humic low-molecular-weight (LMW <1 kDa) fractions (Amon and Benner 1996; Rosenstock
et al. 2005) and may contain upwards of 5500 individual organic compounds between 300 and 1
kDa Da (Mosher et al. 2010). This complex mixture is present in all natural waters and is
continuously supplied to aquatic ecosystems from both allochthonous (terrestrial) and
autochthonous (aquatic) sources (Peduzzi et al. 2008). Amon and Benner (1996) reported that
humic substances of terrestrial origin are the major constituents of the DOC pool in stream
ecosystems and comprise up to 88% of the DOC in the high molecular weight fraction in the
Amazon River water. These findings agree with other studies, which found that, in most cases,
terrigenous DOC comprised a large portion of DOM in streams and rivers (Benner and Hedges
1993; Hedges et al. 1994; Peduzzi et al. 2008). Conventionally, terrigenous DOC has been
considered recalcitrant to bacterial biodegradation and to move conservatively through aquatic
ecosystems due to the apparent biochemical refractory nature of humic substances (Mantoura and

99
Woodward 1983; Thurman 1986; Rosenstock et al. 2005). However, Volk et al. (1997) found that
humic substances account for 75% of the biodegradable fraction of DOM in White Clay Creek.
Similar studies confirm the susceptibility of terrigenous DOC to microbiological and photolytic
oxidations, as well as their value as microbial substrates and their significant contribution to
energy flow in aquatic ecosystems (Amon and Benner 1996; Bano et al. 1997; Carlsson et al.
1999; Frazier et al. 2005; Kaplan et al. 2008; Battin et al. 2008; Fagerberg et al. 2009).
Heterotrophic benthic bacteria are important organisms in lotic ecosystems and are
responsible for several biogeochemical transformations, including DOC uptake, degradation, and
mineralization (Kaplan and Newbold 1993; Pusch et al. 1998; Fischer and Pusch 2001; Tank et al.
2010). While it is clearly established that bacteria provide an important trophic linkage between
DOM and many stream fauna (Hall and Meyer 1998), their relative importance in overall stream
carbon processing remains relatively understudied (Tank et al. 2010). In particular, little is
known about which heterotrophic benthic bacteria drive these ecosystem dynamics. Moreover,
research efforts to understand DOM utilization through microbial processes have been
complicated by the chemical heterogeneity of the DOM pool (Mosher et al. 2010) and a lack of
methods for measuring in situ microbial activities (Kaplan et al. 2008; Bourguet et al. 2009). Few
studies have attempted to identify substrates that would be representative of natural molecules
providing realistic data regarding DOM utilization. Such attempts include NaH13CO3 additions in
lakes (Kritzberg et al. 2004; Pace et al. 2004) and 13C-enriched sodium acetate additions in
streams (Hall and Meyer, 1998; Johnson and Tank 2009). However, being chemically much
simpler than terrestrially derived DOM, these tracers are not reflective of natural stream water
DOM. This major drawback has been addressed by the production of a terrestrial DOC tracer;
13C-labeled tree tissue leachate from tulip poplar tree leaves, small twigs and roots with polymeric

100
and monomeric constituents and lability fractions approximating those of stream water DOC
(Wiegner et al. 2005a). Using this 13C-DOC tracer, Wiegner et al. (2005b) reported that labile
DOM is taken up quickly at or near its point of entry to the stream, whereas intermediately labile
/humic DOM is consumed more slowly and a substantial proportion is exported to downstream
reaches, thus humic DOM serves as an important energy link between upstream and downstream
systems (Kaplan et al. 2008). These results indicated that 13C-labeled tree tissues leachate is the
most representative tracer of allochtonous DOC inputs to streams that has been used to date and is
well suited to investigate the utilization of DOC by heterotrophic benthic microbes.
The goal of our study was to elucidate the heterotrophic benthic microbes within stream
sediments that actively utilize terrestrial DOC, thereby controlling C flux to higher trophic levels
and to downstream reaches. We examined incorporation of terrestrial DOC into microbial
biomass by incubating stream sediment in recirculating mesocosms with natural stream water to
which tracer-levels of 13C-labeled tree tissues leachate were added. We used phospholipid fatty
acid (PLFA) analysis to characterize the benthic microbial biomass and community structure
(Findlay 2004) and PLFA stable isotope probing (SIP) to determine the metabolically active
community members (Boschker et al. 1998; Boschker 2004). We have extended the specificity of
functional assignments of PLFA-SIP by utilizing clone libraries produced from White Clay Creek
sediments by Hullar et al. (2006) and published phenotypic descriptions of identified species (e.g.,
Hahn et al. 2010, Jin et al., 2012).

101
MATERIALS AND METHODS
Study site
Streamwater and sediments were collected from 3rd order White Clay Creek (WCC)
adjacent to the Stroud Water Research Center in Avondale, Pennsylvania, and two 2nd order
streams; the West (WCCW) and East (WCCE) branches of White Clay Creek. The White Clay
Creek watershed is agriculturally dominated with upstream riparian forests and is within the
Piedmont Province of southeastern Pennsylvania and northern Delaware (39ο53’N, 75ο47’W),
joining the Christina River near the Christina's discharge to the Delaware Bay. White Clay Creek
drains 725 ha of approximately 52% of agricultural, 22% of tilled/hayed and 23% of wooded
lands (Newbold et al. 1997; Wiegner et al. 2005b). The immediate area surrounding the three
study sites is forested and the local drainage is a patchwork of pasture lands grazed by horses and
cattle. The dominant tree species reported are tulip poplar (Liriodendron tulipefera), beech
(Fagus grandifolia), red oak (Quercus rubra), and black oak (Quercus velutina) (Wiegner et al.
2005b). Streamflow and streamwater chemistry has been monitored at regular intervals since the
1970s with mean annual stream flow, stream water temperature, and local precipitation of 115
L/s, 10.6ºC, and 105 cm y-1, respectively (Newbold et al. 1997). Streambed sediments consist of
clay-, silt-, and sand-sized particles in pools and runs, with gneiss- and schist-derived gravel and
cobble in riffles (Kaplan et al. 1980).

102
Synthesis of 13C-labeled DOM
Wiegner et al. (2005a) describes the generation of the 13C-labeled stream DOM. Briefly,
thirty-two 1-y-old tulip poplar seedlings (Liriodendron tulipefera L.) were grown with 13CO2 at
the National Phytotron located at Duke University, Durham, North Carolina, USA. 13C-tree tissue
leachate was generated by leaching approximately 4 g of dried, ground tulip poplar seedlings
tissues (60.9% leaves, 24.6% stems, 14.5% roots; % weight of new tissues) in 4 L of sterile-
filtered (0.2-µm, Gelman Supor) C-free de-ionized cold water in the dark at 4° C for 24h. The
mixture of all tree tissue types (leaf, stem, and root) was used to generate a leachate representative
of fresh tree litter inputs (organic matter inputs) from trees to streams. Tree tissue leachate was
Tyndallized in a 70 °C water bath for 0.5 h twice, separated by 24 h at room temperature to
ensure biological stability, and stored in 2-L sterile plastic containers in the dark at 4 °C (Wiegner
et al. 2005a) until the experiment began.
Mesocosms
Two 15-L recirculating plug-flow bioreactors with an empty bed contact time of 150 min
were used to elucidate the microbes responsible for utilization of DOM in streams. Bioreactors
accepted a 0.014 m2 galvanized box used to sample stream sediments such that the stream
sediments were level with the bioreactor bed. Bioreactors could be operated in either open or
recirculating mode and were contained within a 1000 L flowing stream water tank to maintain
ambient stream temperature. These tanks also served as the source of streamwater during open
mode operation. Sondes with dissolved O2 and temperature/conductivity probes (YSI Model 600
XL, Yellow Springs, Inc., Yellow Springs, Ohio) were inserted into the recirculation line of each

103
mesocosm. Mesocosms were set up in the experimental greenhouse facility of Stroud Water
Research Centre under natural photoperiod except for experiment 1 (see below).
Sediment Collection and Mesocosm Experiments
Streambed sediments were collected in 2009 and 2010; four samples were collected at
each sampling period. Sediments were collected from White Clay Creek in October 2009 (twice),
April 2010 and August 2010, and from the west and east branches in November 2009. To collect
stream sediments with a minimum of disturbance, a galvanized box (surface area 0.014 m2)
perforated by 0.32-cm diameter holes (bottom only) that allowed streamwater to escape as the box
was inserted into the sediments until the bottom just touched the sediment surface. Plexiglas
plates were slipped under and over the box trapping the sediments and allowed them to be lifted
from the stream intact. A second box, just large enough to accommodate the first, was place over
the first box, the core inverted and the inner (first) box removed. This process yielded a
rectangular core or sample of intact stream sediment that was placed into a bioreactor in the
proper vertical orientation. Two samples were processed immediately and served as a reference
for sediment and microbial community characteristics before the 13C-DOM uptake experiment
(stream control; referred to as T0). The other two boxes were placed into 15-L recirculating
bioreactors (one per bioreactor), which were operated for 24 h in open mode with a flow of 0.06
cm/s (equivalent to measured stream velocities). The chambers were switch to recirculate mode
and one of the chambers (experimental; referred to as T13C) received 13C DOM while the other
chamber (mesocosm control; referred to as TM) received no 13C DOM.

104
Addition of the tracer increased total DOM by approximately 1-5%. Sediments were incubated in
recirculation mode for 48h or 50h; 13C exposure period was based upon the effective depth of the
chambers (ratio of chamber volume to sediment tray area) and the mass transfer coefficient for the
13C tracer (estimated from a prior whole-stream injection). At the end of the incubation period, the
core was removed from the bioreactor, the upper 2 mm of sediments were removed with a clean
spatula, placed in an aluminum weigh boat, well mixed, and subsampled for total microbial
biomass, microbial community structure, δ13C of PLFAs, organic matter contents and particle-size
analyses. In total six mesocosms experiments were conducted over the two-year period.
Experiment 1 used White Clay Creek sediments and the experiment was run in the dark for 48 h;
the mesocosm chambers were covered with 2.2 cm Styrofoam sheets and black plastic sheeting to
exclude light (Table 1). Experiment 2 was a replicate of experiment 1, except sediments were
incubated uncovered (exposed to natural sunlight at natural photoperiod) and for 50 hours.
Experiments 3 and 4 were replicates of experiment 2 except sediments from west and east
branches of WCC, respectively, were used. Experiment 5 and 6 replicated experiment 2. The
concentrations of the 13C- tree tissue leachate used and exposure time are shown in Table 1. In
August 2010, sediments were also collected from White Clay Creek at the end (T72) of the
mesocosm incubations to assess natural changes in the microbial community over the period of
the mesocosm experiment.
Phospholipid fatty acids analysis
Samples for lipid analysis were stored at -80°C until lyophilized. Microbial biomass and
community structure of freeze-dried sediments (approximately 10 g dry weight) were determined
using phospholipid analyses following the methods of Findlay (2004). Briefly, stream and

105
mesocosm sediments were extracted in the dark at 4°C in 50ml screw-cap glass tubes with 27ml
of a 1:2:0.6 (v/v/v) dichloromethane-methanol-50 mM phosphate buffer (pH 7.4) solution. The
solution was partitioned into organic and aqueous phases with 7.5ml dichloromethane and 7.5ml
deionized water, after which the organic phase (containing total lipid) was collected through a dry
2V filter (Whatman, Schleicher & Schuell) into 15ml test tubes and the solvent dried under
nitrogen at 37°C. The dried lipid was dissolved in 2ml chloroform and two 100µl subsamples
were oxidized with potassium persulfate at 100 °C overnight in sealed ampoules to release
orthophosphate. Phosphate content was determined spectrophotometrically (610nm) using a dye-
coupled reaction between ammonium molybdate and malachite green. The remainder of the lipid
was fractionated into neutral, glyco-, and phospholipid with silica gel solid phase extraction
chromatography. Phospholipid fatty acids were converted into their respectively methyl esters by
base methanolysis and purified by octadecyl bonded silica gel (C18) reverse-phase column
chromatography. Purified fatty acid methyl esters (FAMEs) were identified and quantified using
Agilent gas chromatograph equipped with an automatic sampler, a 60m x 0.25 mm non polar DB-
1 column and a flame ionization detector. Hydrogen was used as the carrier gas at a flow rate of
2.3ml/min. The initial chromatograph oven temperature was 80°C followed by a temperature rise
of 4 °C/min to 250 °C which was then held at this temperature for 10min. FAME identification
was based on relative retention times, coelution with standards, and mass spectral analysis.
Standard nomenclature was used to refer to the fatty acids: the total number of carbon atoms is
followed by a colon, and the number of double bonds. The position of the first double bond is
indicated by ω and the number of carbon atoms from the aliphatic end. For example, the fatty acid
16:1ω7, is 16 carbons long, and has one double bond that occurs at the seventh carbon from the
omega end of the molecule. All double bounds are cis, unless designated as trans configuration

106
using a suffix of t. Methyl branching at the iso and anteiso positions and at the 10th carbon atom
from the carboxyl end is designated by the prefixes i, a, and 10Me, respectively. The prefix cy
denotes cyclopropane fatty acids. Individual fatty acids were analyzed for both absolute and
relative abundance. Relative abundance or weight percent data (gram individual fatty acids x
gram-1 total fatty acids x 100) was used to determine community structure (Findlay and Dobbs
1993). In addition to the standard combination of functional group and marker fatty acid
assignments (Findlay 2004), we increased the specificity of PLFA taxonomic assignments using a
previously published 16S rRNA gene library constructed from WCC sediments (Hullar et al.
2006) and the taxonomic descriptions of these OTUs or closely related species.
Microbial community utilization of 13C DOM
Stable carbon isotope ratios of individual FAMEs were determined using an Agilent 6890
GC coupled to a to a PRISM (GV Instruments, Manchester, UK) stable isotope mass
spectrometer. Analyses were conducted on two different gas chromatographic columns (DB-1
and DB-23; 60m x 0.25mm, 0.25µm film thickness) to allow the analysis of a greater number of
resolved fatty acid methyl esters. For FAMEs that were not resolved by either column during GC-
IRMS analysis, we report the δ13C of the summed feature. Stable carbon isotope ratios were
expressed as:
δ13C = [(R sample / R standard) -1] x 1000 (1)
where R is 13C/12C in the samples and standard. Data were reported relative to Vienna PeeDee-
Belemnite (VPDB). Incorporation of 13C into PLFAs was estimated using the equations (Abraham
et al. 1998):
δ13CFA = [(Cn + 1)* δ13CFAME - δ13CMeOH]/C (2)

107
where δ13CFA is the δ13C of the fatty acid, Cn is the number of carbons in the fatty acid, δ13CFAME
is the δ13C of the fatty acid methyl ester (FAME), and δ13CMeOH is the δ13C of the methanol used
for the methylation reaction, which was determined to be -43.23‰.
Statistical analysis
We used comparisons of total microbial biomass and community structure to assess the
efficacy of our mesocosm approach with a comparison of stream sediments (T0) to the control
mesocosm sediments (TM) used to assess mesocosm effects and comparison of control mesocosm
sediments to treatment mesocosm sediments (T13C) used to check for unwanted stimulation due to
tracer-level DOM additions. Potential differences in microbial biomass and percent eukaryotes vs.
prokarotes were examined with matched pairs t-tests with a α-level of 0.05 using SPSS 19. Fatty
acid profiles for the bioreactors and WCC sediments were subjected to principal component
analysis (PCA) after log transformation [ln (x + 1)] of weight percent fatty acid data and analyzed
using SPSS 19. Changes in microbial community structure were examined by comparing
principal component 1 scores as above. Increases in δ13C values of individual fatty acids, or
when necessary summed features, upon exposure to δ13C-DOM were detected using a matched
pairs t-tests of the difference in δ13C values from control and treatment mesocosm sediments.

108
RESULTS
Utilization of 13C-labeled DOM by sediment microbial community
The combined DB-1 and DB-23 columns allowed the quantification of the δ13C values of
15 features; these were either individual PLFAs, two co-eluting PLFAs or summed features (more
than 2 co-eluting PLFAs). For PLFAs that were resolved by both columns, values presented are
the mean of both analyses (Table 2). PLFA δ13C values for stream and bioreactor control
sediments (treatments T0 and TM) ranged from -37.26 to -28.53‰ and -35.92 to -28.70‰,
respectively, with the most depleted values found in the microeukaryotic biomarkers 20:4ω6 and
20:5ω3, and the most enriched values found in cy17:0 (Table 2). No significant differences were
observed between the δ13C values of PLFAs from T0 and TM treatments. The δ
13C values of
PLFAs from the 13C-labeled bioreactor (T13C) ranged from -34.75 to -24.69‰. Eight features (5
individual PLFAs, two co-eluting pairs and 1 summed feature) showed significant 13C enrichment
(p< 0.05); these were i15:0, a15:0, 16:0, 10me16:0, cy19:0, 16:0/16:1ω9, 18:1ω9/18:1ω7 and
summed feature 2 (18:2ω6, 18:3ω3, 18:1ω9, 18:1ω7c, 18:1ω5). The PLFA 18:2ω6 and 18:3ω3
were resolved by the DB-23 and did not show significant enrichments in T13C, suggesting that
significant enrichment in summed feature 2 detected using the DB-1 column was driven by
enrichment of 18:1ω9/18:1ω7. Two polyenoic fatty acids, 20:5ω3 and 20:4ω6, indicative of
microeukaryotes were significantly labeled in the dark-incubated bioreactor with a 4.15‰ and
3.45‰ differences (TM vs T13C) respectively, while labeling of these fatty acids was not detected
when incubations were conducted using the natural photoperiod. Assigning microbial identity to
the enriched PLFAs using functional group approach (Findlay 2004), bacteria actively
metabolizing stream water DOM were aerobic gram-negative bacteria (16:0/16:1ω9,

109
18:1ω9/18:1ω7), gram-positive or facultative anaerobic gram-negative bacteria (i15:0, a15:0), and
anaerobic gram-negative bacteria (10Me16:0, cy19:0).
Hullar et al. (2006) produced bacterial 16S rRNA gene clone libraries from White Clay
Creek sediment (same site as used in this study). Using the highest available taxonomic
resolution (species, genius, or phylum) and published phenotypic descriptions, we matched
bacterial taxa known to inhabit White Clay Creek to the PLFAs showing 13C enrichment during
incubation with 13C-labeled DOM (Table 3). The fatty acid i15:0 is a major fatty acid in several
described bacteria closely related to those from the White Clay Creek sediment clone libraries.
These include: Lysobacter antibioticus, (Gammaproteobacteria, aerobic, gram-negative), Bacillus
niacina, B. silvestris (Firmicutes, aerobic, gram-positive), Acidobacterium capsulatum
(Acidobacteria, facultative anaerobic, gram-negative), Flavobacterium aquatile, Dysgonomonas
gadei, Runella slithyformis (Bacteroidetes, aerobic, gram-negative), and Gemmatimonas
aurantiaca (Gemmatimonadetes, aerobic, gram-negative). The fatty acid a15:0 is a major fatty
acid in two bacteria closely related to those from the White Clay Creek sediment clone libraries -
Bacillus niacina and B. silvestris (Firmicutes, aerobic, gram-positive). The fatty acid 16:0 is
widely distributed and found in many of the described bacteria that are closely related to those
from the White Clay Creek sediment clone libraries. The fatty acids 10me16:0 is not a major
fatty acid of any described bacteria that are closely related to those identified from the White Clay
Creek sediment clone libraries. The fatty acid 16:1w9 is a major fatty acid in one bacterium
(Nitrospira cf. moscoviensis (Nitrospirae, aeorobic, gram-negative)) that is closely related to
those identified from the White Clay Creek sediment clone libraries. The fatty acid 18:1w9 is a
major fatty acid in two bacteria (Acidobacterium capsulatum, Acidobacteria, facultative
anaerobic, gram-negative; Blastopirellula marina, Planctomycetes, facultative anareobic, gram-

110
negative) that is closely related to those identified from the White Clay Creek sediment clone
libraries. The fatty acid 18:1ω7 is a major fatty acid in several described bacteria closely related
to those from the White Clay Creek sediment clone libraries. These include: Burkholderia
cepacia, Herbaspirillum rubrisubalbicans, Rhodoferax ferrireducens, Variovorax paradoxus
(Betaproteobacteria, aerobic, gram-negative), Nevskia ramosa (Gammaproteiobacteria, aerobic,
gram-negative) and Filomicrobium fusiforme (Alphaproterobacteria, areobic, gram-negative).
The fatty acid cy19:0 is a major fatty in two described bacteria (Burkholderia cepacia and
Filomicrobium fusiforme) closely related to those from the White Clay Creek sediment clone
libraries. Assigning microbial identity to the enriched PLFAs using this extended approach,
bacteria actively metabolizing stream water DOM were aerobic gram-negative bacteria including
species related to Burkholderia cepacia, Nevskia ramosa, Lysobacter antibioticus, Kofleria flava,
Filomicrobium fusiforme, Flavobacterium aquatile, Runella slithyformis, Blastoperillula marina
Gemmatimonas aurantiacca and Nitrospira cf. moscoviensis; gram-positive or facultative
anaerobic gram-negative bacteria including species related to Bacillus niacini and B. silvestris,
Rhodoferax ferrireducens, Variovorax paradoxus, Herbaspirillum rubrisubalbicans,
Dysgonomonas gadei, and Acidobacterium capsulatum; and anaerobic gram-negative bacteria.
Evaluation of mesocosm approach
Total sediment microbial biomass was increased by removal from White Clay Creek and
incubation within the mesocosms; however, this increase was not significant (Figure 1a).
Sediment microbial community structure was unchanged by incubation within the mesocosms as
neither the percentage that prokaryotes comprised of the total community nor the PC1 score from
a PCA analysis of PLFA profiles were significantly different for stream and mesocosm control

111
sediments. The addition of 13C-DOM to the natural stream water DOM did not affect either total
microbial biomass or microbial community structure. Particularly, the concentration of
phospholipid phosphate, the percentage that prokaryotes comprised of the total community and
the PC1 score from a PCA analysis of PLFA profiles were not significantly different for
mesocosm control and treatment sediments (Figure 1).
DISCUSSION
Current studies of DOM metabolism within freshwater streams acknowledge that the
structure of sediment microbial communities may modulate the degradation and use of this
important carbon and energy resource (e.g. Mineau et al. 2013). However, few, if any, studies
directly examine the bacteria that are responsible for the utilization of DOM in streams. In this
study, the 13C incorporated into the microbial phospholipid fatty acids revealed that many, but not
all, heterotrophic microorganisms present in White Clay Creek sediments assimilated components
from an allochthonous detrital source. The tracer used was designed to mimic, to a far greater
extent than any previously used DOC tracer, stream water DOM (Wiegner et al. 2005a). It
contains humic and polysaccharide components (Wiegner et al. 2005a), both labile and semi-
labile fractions (Wiegner et al. 2005b) and has been used for direct measurement of stream DOC
uptake rates coefficients (Kaplan et al. 2008). Kaplan et al. (2008) determined that uptake rate
coefficients for the labile and semi-labile fractions were 4.20 and 0.22 km-1, respectively, and
calculated labile tracer uptake was 272 mg C m-2 d-1 and semi-labile tracer uptake was 40 mg C
m-2 d-1. These rates were sufficient that all labile tracer DOC and ~25% of semi-labile fraction
were taken up during our mesocosm incubations. PLFA-SIP revealed that aerobic gram-negative
112
bacteria, gram-positive and/or facultative anaerobic gram-negative bacteria, and anaerobic gram-
negative bacteria utilized stream water DOM.
Among the microbial PLFAs that showed significant 13C enrichment, there were two
trends - those that were enriched, on average, by 3.5‰ to 5.9‰ and those that were enriched, on
average, by 0.8‰ to 1.1‰. The fatty acids showing the strongest enrichment were i15:0, a15:0,
16:1ω9, 16:0, 18:1ω7c and 18:1ω9. Coupling these PLFA-SIP findings with the results of
previously constructed 16S rRNA gene sequence clone libraries via published phenotypic species
descriptions indicated that several organisms closely related to several described species actively
utilized 13C-labeled leaf leachate (Table 3). Virtually all of these species are known for
possessing versatile metabolisms. For example, the Burkholderia cepacia complex (Vandamme
et al. 1997) is well known for its extraordinary degradative abilities, possessing broad substrate
mono- and dioxygenases (Lessie et al. 1996). Herbaspirillum rubrisubalbicans, best known as a
nitrogen-fixing, plant-growth-promoting rhizobacteria, is also a plant pathogen capable of
penetrating plant cell walls (Monteiro et al. 2012). This genus contains a number of aquatic
species (e.g. H. aquaticum) that can metabolize a wide variety of sugars and other low molecular
weight compounds (Dobritsa et al. 2010). Nevskia ramosa is considered a neuston bacterium
although related OTUs have been identified among the active bacteria present in drinking water
biofilms (Keinanen-Toivola et al. 2006). Nevskia ramosa is capable of digesting complex organic
polymers including starch and cellulose, as well as, many low molecular weight compounds
(Stu rmeyer et al. 1998). Species of genus Lysobacter are typically found in soil and water
habitats and L. antibioticus is capable of degrading a wide variety of complex substrates including
carboxymethyl cellulose, chitin, gelatin, laminarin, protein, Tween-20, Tween-80 and yeast cell
walls (Sullivan et al. 2003). 13C DNA-SIP has shown utilization of 2,4,6-trinitrotoluene by an

113
OTU related to L. taiwanensis in Norfolk Harbor sediments (Gallagher et al. 2010).
Acidobacteria are one of the most common bacterial phyla in soil and can also be among the
dominant taxa aquatic sediments (Rawat et al. 2012, Spring et al. 2000). Acidobacterium
capsulatum is known to degrade cellobiose, starch and xylan, and contains homologs to enzymes
required for pectin degradation (Rawat et al. 2012). Bacillus niacini and B. silvestris are known to
utilize a host of simple organic molecules, as well as degrade several complex organic molecules.
Flavobacterium aquatile digests casein and aesculin, and exhibits cystine arylamidase esterase,
esterase lipase, and α-glucosidase activity. Runella slithyformis is capable of growth on
glycogen, D-arabitol, dulcitol, inositol, mannitol, sorbitol, ribose and sorbose and can hydrolyze
starch (Copeland et al. 2012). Blastopirellula marina digests DNA, aesculin, gelatin and starch,
exhibits lipase activity and growth on fructose, glycerol, glutamic acid and chondroitin sulfate
(Schlesner et al. 2004). Gemmatimonas aurantiaca is capable of growth on yeast extract,
polypeptone, succinate, acetate, gelatin, benzoate, glucose, sucrose, galactose, melibiose, maltose,
formate and b-hydroxybutyrate (Zhang et al 2003). Genomic sequencing of Rhodoferax
ferrireducens indicates that this species possesses highly diverse metabolic capacities including
utilization of sugars, acetate and aromatic compounds under both aerobic and anaerobic
conditions (Risso et al. 2009). Variovorax paradoxus is capable of digesting a wide range of
complex organic compounds including (but not limited to) amino acids, polychlorinated
biphenyls, dimethylterephthalate, linuron, 2,4-dinitrotoluene, homovanillate, veratraldehyde, 2,4-
dichlorophenoxyacetic acid, anthracene, poly(3-hydroxybutyrate), chitin, cellulose, and humic
acids. Dysgonomonas gadei is known to utilize a wide range of sugars, to hydrolyze starch and
aesculin, and to exhibit a wide range of derivative enzyme activities including N-acetyl-b-
glucosaminidase, acid phosphatase and trypsin (Hofstad et al. 2000). Combined, the 13C-

114
enrichment of many of the abundant fatty acids present in these species, the recovery of gene
sequences closely related to these cultured species from clone libraries developed from White
Clay Creek and their utilization of labile organic compounds strongly suggests that bacteria
related to the species discussed above utilized the labile tracer DOC. The capacity of several
species, notably Rhodoferax ferrireducens, Variovorax paradoxus, Lysobacter antibioticus,
Burkholderia cepacia and Nevskia ramosa to digest complex organic compounds suggests that
bacteria related to these species are responsible for the utilization of the semi- labile tracer DOC.
Among the cultured relatives most closely related to recovered sequences from the sediment
community only Nitrospina moscoviensis exhibits 16:1ω9 as a dominant fatty acid. Nitrospina-
like bacteria are nitrite-oxidizing bacteria and members of the deep-branching bacterial
phylum Nitrospirae with only one class Nitrospira (Bock and Wagner 2006). The enrichment of
16:1ω9 following sediment incubation with 13C-labeled leaf leachate suggests that either species
containing 16:1ω9 but not identified from the clone libraries also utilized components of the 13C-
labeled leaf leachate or that bacteria closely related to Nitrospina moscoviensis exhibit
mixotrophic, rather than lithoautotrophic growth in White Clay Creek.
The PLFAs 10me16:0 and cy19:0 showed moderate 13C enrichment following incubation
with 13C-labeled leaf leachate. The fatty acid 10me16:0 is viewed as a marker fatty acid for
members of the genus Desulfobacter within the delta subclass of proteobacteria (Findlay 2004).
Macalady et al. (2000) analyzed fatty acid profiles for 100 strains of bacteria including 12 genera
of sulfate-reducing bacteria and several other anaerobic species. They concluded that
Desulfobacter was the major sources of 10me16:0 in environmental samples. The Macalady et al.
(2000) analysis also indicated that the PLFA cy19:0 was also strongly associated with
Desulfobacter. This suggests that sulfate-reducing bacteria, and in particular members of the

115
genus Desulfobacter, utilized some component of 13C-labeled leaf leachate, albeit at a lesser
extent compared to those bacteria represented by the strongly labeled PLFAs.
On one occasion, we incubated sediments in the dark and during this trial the δ13C of the
PLFAs 20:4ω6 and 20:5ω3 increased by 3.45‰ and 4.15‰ respectively, compared to an average
increase of 1‰ when sediments were incubated under the natural photoperiod. It is important to
note that we conducted but a single dark incubation and that 20:4ω6 and 20:5ω3 are found in both
heterotrophic and autotrophic protists. Nevertheless, the presence of label in fatty acids 20:4ω6
and 20:5ω3 in the dark suggests that protozoan grazers used bacteria that are utilizing 13C-DOM
as food source and may contribute significantly to the transfer of allochthonous carbon via the
microbial loop in stream ecosystems. As the system contains both heterotrophic and autotrophic
protists, synthesis of 20:4ω6 and 20:5ω3 by algae during incubations under the natural
photoperiod would produce a second, non-labeled source of these fatty acids, which would serve
to isotopically dilute those produced by trophic interactions within the sediment microbial
community.
Total sediment microbial biomass measured as phospholipid phosphate (nmol PLP gdw-1)
for the control and 13C-labeled bioreactors (Table 3) fall within the range (2-280nmol PLP g-1 dry
wt) of PLP concentrations quantified in freshwater sediments of eastern deciduous forest and
those previously published for White Clay Creek (Bott and Kaplan 1985; Sutton and Findlay 2003;
Findlay et al. 2008). The increase in microbial biomass in the mesocosm sediments (Figure 1a;
comparison T0-TM), though not significant, is likely a response of stream microbial communities
to placement within a mesocosm setting. While infrequently assessed and even less frequently
discussed (but see Mortazavi et al. 2013, Suárez-Suárez et al. 2011), a ‘mesocosm effect’ appears
to be an increase in sediment bacterial abundance. Sediments, in general and streams sediments in

116
particular, are dynamic and sediment microbial communities experience frequent disturbances
associated with storm flows, hydraulic turbulence, or macrofauna activities (Fisher et al., 1982;
Schwendel et al., 2011) and are best viewed as rarely, if ever, at maximum biomass. The natural
response of sediment microbial communities to disturbance is regrowth leading to increased
biomass (Findlay et al., 1990; Traunspurger et al., 1997; Langworthy et al., 2002). In this study,
sediments were obtained with the utmost care; however, obtaining a “disturbance free” microbial
sediment sample is very difficult, if not impossible. In addition, once placed in the mesocosms
sediments were protected from further in-stream disturbances, which, combined, with any
disturbance during removal from the stream, likely led to the small observed increase in biomass
(Riemann et al. 2000). Stream and mesocosm sediments (T0, TM, and T13C) showed little change
in ratios of prokaryotic to eukaryotic biomass. On average, in the bioreactors, ~60 % of the
microbial biomass was prokaryotic and the remaining 40 % was eukaryotic, which is well within
the range of estimates reported for stream sediments from several low-order forested streams
(Sutton and Findlay 2003; Mosher and Findlay 2011) and is similar to previously reported ratios
for WCC (Findlay et al. 2008). Thus, there was no change in community structure, or in microbial
biomass in these mesocosms in response to sampling procedure or mesocosm effect.
In this study, the additions of 8.73 to 17.47 µg/L of 13C-DOM did not significantly alter
the structure of the sediment microbial community during any of the mesocosm incubations. In a
study where 50 µg C g-1 soil of universally 13C labeled glucose, glutamine, oxalate or phenol were
added to samples of soil, no detectable changes in the soil PLFA profiles were found (Brant et al.
2006). Also, Griffiths et al. (1999) detected no changes in the soil PLFA profiles until rates of
additions of a model root exudate exceeded 375µg C g-1d-1 in a 14-d experiment. In other studies,
the additions of 400 µg C g-1 soil of vanillin (Waldrop and Firestone 2004) and 726 µg C g-1

117
oxalate and glutamate to grassland sandy loam soil (Falchini et al. 2003) resulted in changes in
microbial community composition or PLFA profile. The trend in these studies was that as
substrate loading increased, relative abundance of specific PLFAs increased leading to changes in
total microbial community composition. Our tracer-level substrate addition was significantly
smaller than additions used in studies where significant changes in biomass or community
composition were observed; this was intentional and designed to avoid changes in biomass and
PLFA profiles that could compromise our use of mesocosm-based experimental design.
Though mesocosm experiments have increased our understanding of community ecology,
ecosystem dynamics and provided insight into global processes (Fraser and Keddy 1997; Jessup
et al. 2004; Cardinale et al. 2006; Benton et al. 2007; Duffy 2009), mesocosms have been
criticized as being unrealistic simplifications of natural systems with restricted utility (Carpenter
1996; Schindler 1998; Haag and Matschonat 2001). However, with appropriate scaling, accurate
conclusions can be made (Spivak et al. 2011). Our analyses of microbial biomass and community
structure indicate that our mesocosm-based experimental design, particularly the comparison of
the TM mesocosm control to the T13C mesocosm treatment samples, was sufficiently robust to
warrant examination of individual fatty acids for the incorporation of 13C with the goal of
determining the role of sediment microbes in processing streamwater DOM. Also, the significant
13C-enrichment detected in microbial lipids in the T13C bioreactors clearly demonstrated the high
sensitivity of stable isotope probing of PLFA as a technique to elucidate which microbial
communities are responsible for the utilization of terrestrial DOC.
In conclusion, the present study provides direct experimental evidence that terrestrial
DOM is readily utilized by a broad range of benthic heterotrophic aerobic, facultative anaerobic
and anaerobic bacteria in forested headwater streams. We posit that terrestrially derived DOM

118
exported from forested watersheds is not entirely lost to downstream systems but rather is
assimilated and mineralized by a variety of heteroorganotrophic bacteria which, in turn, are
grazed by heterotrophic eukaryotes transferring allochthonous carbon and energy to higher
trophic levels through the microbial loop (Meyer 1994). Thus, our data have important
implications for protection of forested headwater streams where much of the DOM in transport is
derived from the surrounding terrestrial ecosystem. As terrestrial DOM is an important source of
carbon and energy for stream microbial communities, any human activity that disrupts or
accelerates the delivery of terrestrial DOM to headwater streams may need regulation, since
perturbation to ecological linkages between aquatic and terrestrial systems could have pronounced
effects on microbial community structure and function. This is particularly true where the
terrestrial and aquatic ecosystems are tightly linked by large internal fluxes of DOM in the
forested landscape (McDowell and Likens 1988; Aitkenhead-Peterson et al. 2003).
Acknowledgements
We thank Janna Brown (University of Alabama, Tuscaloosa, AL) and Sherman Roberts (Stroud
Water Research Center, Avondale, PA) for laboratory assistance. Funding for this project was
provided by the National Science Foundation (award number DEB-0516235).

119
REFERENCES
Abraham W, Hesse C, Pelz O. 1998. Ratios of carbon isotopes in microbial lipids as an indicator of substrate usage. Appl. Environ. Microbiol. 64:4202–4209.
Aitkenhead-Peterson JA, McDowell WH, Neff JC. 2003. Sources, production, and regulation of
allochthonous dissolved organic matter inputs to surface waters. In Aquatic ecosystems: interactivity of dissolved organic matter. Edited by S.E.G. Findlay and R.L. Sinsabaugh. Academic Press, Amsterdam. pp. 25–70.
Amon RMW, Benner R. 1996. Bacterial utilization of different size classes of dissolved organic
matter. Limnol. Oceanogr. 41: 41- 51. Bano N, Moran MA, Hodson RE. 1997. Bacterial utilization of dissolved humic substances from
a freshwater swamp. Aquatic Microbial Ecology, 12: 233-238. Battin TJ, Kaplan LA, Findlay S, Hopkinson CS, Marti E, Packman AI, Newbold JD, Sabater F.
2008. Biophysical controls on organic carbon fluxes in fluvial networks. Nature Geosci. 1: 95-100.
Benner R, Hedges JI. 1993. A test of the accuracy of freshwater DOC measurements by high
temperature catalytic oxidation and UV-promoted persulfate oxidation. Mar. Chem. 41: 161–165.
Benton TG, Solan M, Travis JMJ, Sait SM. 2007. Microcosm experiments can inform global
ecological problems. Trends in Ecology & Evolution, 22: 516–521. Besemer K, Luef B, Preiner S, Eichberger B, Agis M, Peduzzi P. 2009. Sources and composition
of organic matter for bacterial growth in a large European river floodplain system (Danube, Austria) Organic Geochemistry, 40 (3): 321-331.
Bock E, Wagner M. 2006. Oxidation of inorganic nitrogen compounds as an energy source. In: Dworkin M, Falkow S (eds). The Prokaryotes. Springer Verlag: New York, pp 457–495.

120
Bourguet N, Goutx M, Ghiglione JF, Pujo-Pay M, Mevel G, Momzikoff A, Mousseau L, Guigu C, Garcia N, Raimbault P, Pete R, Oriol L, Lefevre D. 2009. Lipid biomarkers and bacterial lipase activities as indicators of organic matter and bacterial dynamics in contrasted regimes at the DYFAMED site, NW Mediterranean. Deep-Sea Research II, 56: 1454-1469.
Boschker HTS, Nold SC, Wellsbury P, Bos D, de Graaf W, Pel R, Parkes RJ, Cappenberg
TE.1998. Direct linking of microbial populations to specific biogeochemical processes by C-13-labelling of biomarkers. Nature, 392:801–805.
Boschker HTS. 2004. Linking microbial community structure and functioning: stable isotope
(13C) labeling in combination with PLFA analysis, in: Kolwalchuk, G.A. et al. (Ed.) 2004). Molecular microbial ecology manual II. 1673-1688. Kluwer Academic Publishers, Dordrecht, the Netherlands.
Bott TL, Kaplan LA. 1985. Bacterial biomass, metabolic state and activity in stream sediments:
relation to environmental variables and multiple assay comparisons. Appl. Environ. Microbiol. 50: 508-522.
Brant JBE, Sulzman W, Myrold D.D. 2006. Microbial community utilization of added carbon
substrates in response to long-term carbon input manipulation. Soil Biol Biochem 38:2219–2232
Cardinale BJ, Srivastava DS, Duffy JE, Wright JP, Downing AL, Sankaran M, Jouseau C. 2006.
Effects of biodiversity on the functioning of trophic groups and ecosystems. Nature, 443: 989-992.
Carlsson P, Graneli E, Segatto AZ. 1999. Cycling of biologically available nitrogen in riverine
humic substances between marine bacteria, a hetertrophic nanoflagellate and a photosythenic dinoflagellate. Aquatic Microbial Ecology, 18:23-36.
Carpenter SR. 1996. Microcosm experiments have limited relevance for community and
ecosystem ecology. Ecology, 77: 677–680. Copeland A, Zhang X, Misra M, Lapidus A, Nolan M, Lucas S, Deshpande S, Cheng JF, Tapia R,
Goodwin LA, Pitluck S, Liolios K, Pagani I, Ivanova N, Mikhailova N, Pati A, Chen A, Palaniappan K, Land M, Hauser L, Pan C, Jeffries CD, Detter JC, et al. 2012. Complete genome sequence of the aquatic bacterium Runella slithyformis type strain (LSU 4(T)). Stand Genomic Sci 6:145–154

121
Dobritsa AP, Reddy MCS, Samadpour M. 2010. Reclassification of Herbaspirillum putei as a
later heterotypic synonym of Herbaspirillum huttiense, with the description of H. huttiense subsp. huttiense subsp. nov. and H. huttiense subsp. putei subsp. nov., comb. nov., and description of Herbaspirillum aquaticum sp. nov. Int J Syst Evol Microbiol 60:1418–1426
Duffy JE. 2009. Why biodiversity is important to the functioning of real-world ecosystems.
Frontier in Ecology and the Environment, 7: 437–444. Fagerberg T, Carlsson P, Lundgren M. 2009. A large molecular size fraction of riverine high
molecular weight dissolved organic matter (HMW DOM) stimulates growth of the harmful dinoflagellate Alexandrium minutum. Harmful Algae, 8: 823-831.
Falchini L, Naumova N, Kuikman PJ, Bloem J, Nannipieri P. 2003. CO2 evolution and denaturing
gradient gel electrophoresis profiles of bacterial communities in soil following addition of low molecular weight substrates to simulate root exudation. Soil Biology & Biochemistry 35, 775–782.
Findlay RH, Trexler MB, White DC. 1990. Response of a benthic microbial community to biotic disturbance. Mar. Ecol. Prog. Ser. 62:135-148.
Findlay RH, Dobbs FC. 1993. Quantitative description of microbial communities using lipid
analysis, p. 271–284. In P. F. Kemp, B. F. Sherr, E. B. Sherr, and J. J. Cole (ed.), Current methods in aquatic microbial ecology. Lewis Publishers, Boca Raton, FL.
Findlay RH. 2004. Determination of microbial community structure using phospholipid fatty acid
profiles, p. 983–1004. In G. A. Kowalchuk, F. J. De Bruijn, I. M. Head, A. D. L. Akkermans, and J. D. Van Elsas (ed.), Molecular microbial ecology manual, 2nd ed. Kluwer Academic Publishers, Dordrecht, The Netherlands.
Findlay RH, Yeates C, Hullar MAJ, Stahl DA, Kaplan LA. 2008. Biome-level biogeography of
streambed microbiota. Applied and Environmental Microbiology, 74, 3014–3021. Findlay S, Sinsabaugh RL. 1999. Unraveling the sources and bioavailability of dissolved organic
matter in lotic aquatic ecosystems. Mar. Freshwater Res., 50: 781-790.

122
Fisher SG, Gray LJ, Grimm NB, Busch DE. 1982. Temporal succession in a desert stream ecosystem following flash flooding. Ecological Monographs 52: 93-110.
Fischer H, Pusch M. 2001. Comparison of bacterial production in sediments, epiphyton, and the
pelegiac zone of a lowland river. Freshwater Biol. 46:1335-1348. Fraser LH, Keddy P. 1997. The rate of experimental microcosms in ecological research. Trends
in Ecology & Evolution, 12, 478–481. Frazier SW, Kaplan LA, Hatchet PG. 2005. Molecular Characterization of Biodegradable
Dissolved Organic Matter Using Bioreactors and [12C/13C] Tetramethylammonium Hydroxide Thermochemolysis GC-MS. Environ. Sci. Technol. 39: 1479-1491.
Fudou R, Jojima Y, Iizuka T, Yamanaka S. 2002. Haliangium ochraceum gen. nov., sp. nov. and
Haliangium tepidum sp. nov.: Novel moderately halophilic myxobacteria isolated from coastal saline environments J. Gen. Appl. Microbiol., 48: 109–115.
Gallagher EM, Young LY, McGuinness LM, Kerkhof LJ. 2010. Detection of 2,4,6-
trinitrotoluene-utilizing anaerobic bacteria by 15N and 13C incorporation. Appl Environ Microbiol 76:1695–1698.
Griffiths BS, Ritz K, Ebblewhite N, Dobson G. 1999. Soil microbial community structure: effects
of substrate loading rates. Soil Biology & Biochemistry 31:145–153. Haag D, Matschonat G. 2001. Limitations of controlled experimental systems as models for
natural systems: a conceptual assessment of experimental practices in biogeochemistry and soil science. Science of the Total Environment, 277, 199–216.
Hall RO, Meyer JL. 1998. The trophic significance of bacteria in a detritus-based stream food
web. Ecology 79:1995–2012. Hahn MW, Kasalický V, Jezbera J, Brandt U, Jezberová J, Šimek K. 2010. Limnohabitans curvus
gen. nov., sp. nov., a planktonic bacterium isolated from a freshwater lake. Int J Syst Evol Microbiol 60, 1358–1365.

123
Hedges JI, Cowie GL, Richey JE, Quay PD, Benner R, Strom M, Forsberg BR.1994. Origins and processing of organic matter in the Amazon River as indicated by carbohydrates and amino acids. Limnol. Oceanogr., 39: 743–761
Hofstad T, Olsen I, Eribe ER, Falsen E, Collins MD, Lawson PA. 2000. Dysgonomonas gen. nov.
to accommodate Dysgonomonas gadei sp. nov., an organism isolated from a human gall bladder, and Dysgonomonas capnocytophagoides (formerly CDC group DF-3). Int. J. Syst. Evol. Microbiol. 50:2189-2195.
Hong SW, Park JM, Kim SJ, Chung KS. 2012. Bacillus eiseniae sp. nov., a swarming, moderately
halotolerant bacterium isolated from the intestinal tract of an earthworm (Eisenia fetida L.). International journal of systematic and evolutionary microbiology, 62(Pt 9), 2077-2083.
Hullar MAJ, Kaplan LA, Stahl DA. 2006. Recurring seasonal dynamics of microbial
communities in stream habitats. Appl. Environ. Microbiol. 72: 713-722. Jessup CM, Kassen R, Forde SE, Kerr B, Buckling A, Rainey PB, Bohannan BJM. 2004. Big
questions, small worlds: microbial model systems in ecology. Trends in Ecology & Evolution, 19:189–197.
Jin L, Kim KK., Ahn CY, Oh HM. 2012. Variovorax defluvii sp. nov., isolated from sewage.
International journal of systematic and evolutionary microbiology, 62 (Pt 8), 1779-1783. Johnson LT, Tank JL. 2009. Diurnal variations in dissolved organic matter and ammonium uptake
in six open-canopy streams Journal of the North American Benthological Society 28(3):694–708
Jung SY, Lee MH, Oh TK,Yoon JH. 2007. Herbaspirillum rhizosphaerae sp. nov., isolated from
rhizosphere soil of Allium victorialis var. platyphyllum. Int J Syst Evol Microbiol 57: 2284–2288.
Kaplan LA, Larson RA, Bott TL. 1980. Patterns of dissolved organic carbon in transport.
Limnology and Oceanography 25:1034-1043. Kaplan LA, Newbold JD. 1993. Biogeochemistry of dissolved organic carbon entering streams. In
T. E. Ford (ed.) Aquatic microbiology, an ecological approach. Blackwell, Boston, pp 139–166.

124
Kaplan LA, Wiegner TN, Newbold JD, Ostrom PG, Gandhi H. 2008. Untangling the complex
issue of dissolved organic carbon uptake: a stable isotope approach. Freshwater Biology 53: 855-864.
Keinanen-Toivola MM, Revetta RP, Santo Domingo JW. 206. Identification of active bacterial
communities in a model drinking water biofilm system using 16S rRNA-based clone libraries. FEMS Microbiol. Lett., 257: 182–188.
Kritzberg ES, Cole JJ, Pace ML, Graneli W, Bade D. 2004. Autochthonous versus allochthonous
carbon sources of bacteria: results from whole-lake 13C addition experiments. Limnology and Oceanography 49:588–596.
Kulichevskaya IS, Kostina LA, Valaskova V, Rijpstra WIC, Sinninghe Damsté JS, de Boer W,
Dedysh SN. 2012. Acidicapsa borealis gen. nov., sp. nov. and Acidicapsa ligni sp. nov., subdivision 1 Acidobacteria from Sphagnum peat and decaying wood. Int J Syst Evol Microbiol 62, 1512–1520.
Langworthy DE, Stapleton RD, Sayler GS, Findlay RH. 2002. Lipid analysis of the response of a
sedimentary microbial community to polycyclic aromatic hydrocarbons. Microb Ecol 43:189–198.
Lee S, Weon HY, Han K, Ahn TY. 2012. Flavobacterium dankookense sp. nov., isolated from a
freshwater reservoir, and emended descriptions of Flavobacterium cheonanense, F. chung- namense, F. koreense and F. aquatile. Int. J. Sys. Evol. Microbiol. 62, 2378–2382.
Lessie TG, Hendrickson W, Manning BD, Devereux R.1996. Genomic complexity and plasticity
of Burkholderia cepacia. FEMS Microbiol Lett 144: 117–128. Lipski A, Spieck E, Makolla A, Altendorf K. 2001. Fatty acid profiles of nitrite-oxidizing bacteria
reflect their phylogenetic heterogeneity. Syst. Appl. Microbiol. 24:377-384. Losey NA, Stevenson BS, Verbarg S, Rudd S, Moore ER, Lawson PA. 2013. Fontimonas
thermophila gen. nov., sp. nov., a moderately thermophilic bacterium isolated from a freshwater hot spring, and proposal of Solimonadaceae fam. nov. to replace Sinobacteraceae Zhou et al. 2008. International journal of systematic and evolutionary microbiology, 63(Pt 1), 254-259.

125
Macalady JL, Mack EE, Nelson DC, Scow KM. 2000. Sediment microbial community structure and mercury methylation in mercury-polluted Clear Lake, California. Appl. Environ. Microbiol., 66, 1479-1488.
Mantoura RFC, Woodward EMS. 1983. Conservative behavior of riverine dissolved organic
carbon in the Severn Estuary: chemical and geochemical implications. Geochim. Cosmochim. Ac. 47: 1293-1309.
McDowell WH, Likens GE. 1988. Origin, composition and flux of dissolved organic carbon in
the Hubbard Brook valley New Hampshire, USA. Ecol. Monogr. 58: 177–196. Meyer JL. 1994. The microbial loop in flowing waters. Microb Ecol 28:195-9. Mineau MM, Rigsby CM, Ely DT, Fernandez IJ, Norton SA, Ohno T, ... Simon K.S. 2013.
Chronic catchment nitrogen enrichment and stoichiometric constraints on the bioavailability of dissolved organic matter from leaf leachate. Freshwater Biology, 58 (2): 248-260.
Monteiro RA, Balsanelli E, Tuleski T, Faoro H. 2012. Genomic comparison of the endophyte
Herbaspirillum seropedicae SmR1 and the phytopathogen Herbaspirillum rubrisubalbicans M1 by suppressive subtractive hybridization and partial genome sequencing. FEMS Microbiol. Ecol. 80:441–451.
Mortazavi B, Horel A, Beazley MJ, Sobecky PA. 2013. Intrinsic rates of petroleum hydrocarbon
biodegradation in Gulf of Mexico intertidal sandy sediments and its enhancement by organic substrates. Journal of Hazardous Materials. 244-245: 537-544.
Mosher JJ. 2008. Geological influences on microbial community structure and dissolved organic
matter quality in forested streams. Ph.D dissertation. University of Alabama, Tuscaloosa, AL. Mosher JJ, Findlay RH. 2011. Direct and indirect influence of parental bedrock on streambed
microbial community structure in forested streams. Appl Environ Microbiol 77: l7681–7688. Newbold JD, Bott TL, Kaplan LA, Sweeney BW, Vannote RL. 1997. Organic matter dynamics in
White Clay Creek, Pennsylvania, USA. Journal of the North American Benthological Society 16:46-50.

126
Pace ML, Cole JJ, Carpenter SR, Kitchel JF, Hodgson JR, Van de Bogert MC, Bade DL, Kritzberg ES, Bastviken D. 2004. Whole-lake carbon-13 additions reveal terrestrial support of aquatic food webs. Nature, 427, 240–243.
Rawat SR, Männistö MK, Bromberg Y, Häggblom MM. 2012. Comparative genomic and
physiological analysis provides insights into the role of Acidobacteria in organic carbon utilization in Arctic tundra soils. FEMS Microbiol Ecol 82: 341–355.
Peduzzi P, Aspetsberger F, Hein T, Huber F, Kargl-Wagner S, Luef B, Tachkova Y. 2008.
Dissolved organic matter (DOM) and bacterial growth in floodplains of the Danube River under varying hydrological connectivity. Fundamental and Applied Limnology 171: 49–61.
Pusch M, Fiebig D, Brettar I, Eisenmann H, Ellis BK, Kaplan LA, Lock MA, Naegeli MW,
Traunspurger W. 1998. The role of microorganisms in the ecological connectivity of running waters. Freshw. Biol. 40:453–49.
Reddy GSN, Uttam A, Shivaji S. 2008. Bacillus cecembensis sp. nov., isolated from the Pindari
glacier of the Indian Himalayas. Int J Syst Evol Microbiol 58:2330–2335. Riemann L, Steward GF, Azam F. 2000. Dynamics of bacterial community composition and
activity during a mesocosm diatom bloom. Appl. Environ. Microbiol. 66, 578–587. Risso C, Sun J, Zhuang K, Mahadevan R, DeBoy R, Ismail W et al. 2009. Genome-scale
comparison and constraint-based metabolic reconstruction of the facultative anaerobic Fe(III)-reducer Rhodoferax ferrireducens. BMC Genomics 10: 447.
Rosenstock B, Zwisler W, Simon M. 2005. Bacterial consumption of humic and non-humic low
and high molecular weight DOM and the effect of solar irradiation on the turnover of labile DOM in the Southern Ocean. Microb. Ecol. 50, 90–101.
Schlesner H, Rensmann C, Tindall BJ, Gade D, Rabus R, et al. 2004. Taxonomic heterogeneity
within the Planctomycetales as derived by DNA-DNA hybridization, description of Rhodopirellula baltica gen. nov., sp. nov., transfer of Pirellula marina to the genus Blastopirellula gen. nov. as Blastopirellula marina comb. nov. and emended description of the genus Pirellula. Int J Syst Evol Microbiol 54: 1567–1580.
Schindler DW. 1998. Replication versus realism: the need for ecosystem-scale experiments.
Ecosystems, 1: 323–334.

127
Schwendel AC, Death RG, Fuller IC, Joy MK. 2011. Linking disturbance and stream invertebrate communities—how best to measure bed stability. Journal of the North American Benthological Society 30: 11–24.
Spieck E, Hartwig C, McCormack I, Maixner F, Wagner M, Lipski A et al. 2006. Selective
enrichment and molecular characterization of a previously uncultured Nitrospira-like bacterium from activated sludge. Environ Microbiol 8: 405–415.
Spivak AC, Vanni MJ, Mette EM. 2011. Moving on up: can results from simple aquatic
mesocosm experiments be applied across broad spatial scales? Freshwater Biol. 56: 279-291. Spring S, Schulze R, Overmann J, Schleifer KH. 2000. Identification and characterization of
ecologically significant prokaryotes in the sediment of freshwater lakes: molecular and cultivation studies. FEMS Microbiol. Rev. 24: 573–590.
Srinivasan S, Kim MK, Sathiyaraj G, Kim HB, Kim YJ, Yang DC. 2010. Lysobacter soli sp. nov.,
isolated from soil of a ginseng field. Int J Syst Evol Microbiol 60, 1543–1547. Stackebrandt E, Kroppenstedt RM, Jahnke KD, Kemmerling C, Gurtler H. 1994. Transfer of
Streptosporangium viridogriseum (Okuda et al. 1966), Streptosporangium virido- griseum subsp. kofuense, and Streptosporangium albidum (Furumai et al. 1968) to Kutzneria gen. nov. as Kutzneria viridogrisea comb. nov., Kutzneria kofuensis comb. nov., and Kutzneria albida comb. nov., respectively, and emendation of the genus Streptosporangium. Int J Syst Bacteriol 44, 265–269.
Stead DE. 1992. Grouping of plant-pathogenic and some other Pseudomonas spp. by using
cellular fatty acid profiles. Int J Syst Bacteriol 42, 281–295. Stro mpl C, Tindall BJ, Lunsdorf H, Wong TY, Moore ERB, Hippe H. 2000. Reclassification of
Clostrid- ium quercicolum as Dendrosporobacter quercicolus gen. nov., comb. nov. Int. J. Syst. Evol. Microbiol. 50:101–106.
Stürmeyer H, Overmann J, Babenzien HD, Cypionka H. 1998. Ecophysiology and phylogenetic
studies of Nevskia ramosa in pure culture. Appl. Environ. Microbiol. 64, 1890–1894.

128
Suárez-Suárez A, López-López A, Tovar-Sánchez A, Yarza P, Orfila A, Terrados J, et al. 2011. Response of sulfate-reducing bacteria to an artificial oil-spill in a coastal marine sediment. Environ Microbiol 13: 1488–1499.
Sullivan RF, Holtman M., Zylstra GJ, White JF Jr., Kobayashi DY. 2003. Taxonomic positioning
of two biological control agents for plant diseases as Lysobacter enzymogenes based on phylogenetic analysis of 16S rDNA, fatty acid composition and phenotypic characteristics. J Appl Microbiol 94, 1079–1086.
Sulzberger B, Durisch-Kaiser E. 2009. Chemical characterization of dissolved organic matter
(DOM): A prerequisite for understanding UV-induced changes of DOM absorption properties and bioavailability. Aquatic Science: 71: 104-126.
Sutton SD, Findlay RH. 2003. Sedimentary microbial community dynamics in a regulated stream:
East Fork of the Little Miami River, Ohio. Environ. Microbiol. 5:256-266. Suriyachadkun C, Ngaemthao W, Chunhametha S, Tamura T, Sanglier JJ. 2013. Kutzneria
buriramensis sp. nov., isolated from soil, and emended description of the genus Kutzneria. International Journal of Systematic and Evolutionary Microbiology, 63(Pt 1), 47-52.
Tank JL, Rosi-Marshall EJ, Griffiths NA, Entrekin SA, Stephen ML. 2010. A review of
allochthonous organic matter dynamics and metabolism in streams. Journal of the North American Benthological Society 29:118-146.
Thurman EM. 1986. Developments in Biogeochemistry: Organic Geochemistry of Natural
Waters. Martinus Nijhoff /Dr W. Junk Publishers, the Netherlands. Traunspurger W, Bergtold M, Goedkoop W. 1997. The effects of nematodes on bacterial activity
and abundance in freshwater sediment. Oecologia, 112, 118–122. Vandamme P, Holmes B, Vancanneyt M, Coenye T, Hoste B, Coopman R, Revets H, Lauwers S.
et al. 1997. Occurrence of multiple genomovars of Burkholderia cepacia in cystic fibrosis patients and proposal of Burkholderia multivorans sp. nov. Int J Syst Bacteriol 47: 1188–1200.
Volk CJ, Volk CB, Kaplan LA. 1997. The chemical composition of biodegradable dissolved
organic matter in streamwater. Limnology and Oceanography 42:39-44.

129
Waldrop M, Firestone MK. 2004. Microbial community utilization of recalcitrant and simple carbon compounds: impact of oak-woodland plant communities. Oecologia 138, 275–284.
Wiegner TN, Kaplan LA, Newbold JD, Ostrom PH. 2005a. Synthesis of a 13C-labeled tracer for
stream DOC: labeling tulip poplar carbon with 13CO2. Ecosystems 8: 501–511. Wiegner TN, Kaplan LA, Newbold JD, Ostrom PH. 2005b. Contribution of dissolved organic C
to stream metabolism: a mesocosm study using 13C-enriched tree-tissue leachate. J. N. Am. Benthol. Soc., 2005, 24 (1):48–67.
Wiegner TN, Tubal RL, MacKenzie RA. 2009. Bioavailability and export of dissolved organic
matter from a tropical river during base- and stormflow conditions. Limnol. Oceanogr., 54(4), 1233–1242.
Wong JCY, Williams DD. 2010. Sources and seasonal patterns of dissolved organic matter
(DOM) in the hyporheic zone. Hydrobiologia. 647:99–111. Wu XL, Yu SL, Gu J, Zhao GF, Chi CQ. 2009. Filomicrobium insigne sp. nov., isolated from an
oil-polluted saline soil. International Journal of Systematic & Evolutionary Microbiology, 59: 300–305.
Zhang H, Sekiguchi Y, Hanada S, Hugenholtz P, Kim H, Kamagata Y, Nakamura K. 2003.
Gemmatimonas aurantiaca gen. nov., sp. nov., a gram-negative, aerobic, polyphosphate-accumulating micro-organism, the first cultured representative of the new bacterial phylum Gemmatimonadetes phyl. nov. Int. J. Syst. Evol. Microbiol. 53:1155-1163.

130
Figure 1. Changes in a) microbial biomass, b) percent prokaryotes and c) community structure summarized by PCA axis 1, among treatments and sampling dates for all experiments. Values are mean differences ± SD, (n = 6). T0-TM= Differences attributed to mesocosm effect, TM-T13C= Differences attributed to the effects of 13C-labeled DOM
-120
-90
-60
-30
0
30
60C
hang
e in
PL
P (n
mol
PO
4 gd
w)
-15
-10
-5
0
5
10
15
Cha
nges
in %
Pro
kary
ote
b
-0.8
-0.6
-0.3
-0.1
0.2
0.5
0.7
T0 - TM TM - T13C
Cha
nge
in P
C 1
Comparision
c
a

131
Table 1. Experimental design of 13C-DOM uptake experiments.
Experiment/ Mesocosm condition
Stream Order/ Sampling Date
13C DOM injected (µg/L)
Experiment duration (h)
1. Dark 3rd order WCC / 12-15 Oct., 2009
17.47 48
2. Natural photoperiod 3rd order WCC / 20-23 Oct., 2009
17.47 50
3. Natural photoperiod 2nd order WCCE/ 3-6 Nov., 2009
17.47 50
4. Natural photoperiod 2nd order WCCW/ 9-12 Nov., 2009
8.73 50
5. Natural photoperiod 3rd order WCC/ 20-23 April 2010
8.73 50
6. Natural photoperiod 3rd order WCC/ 9-12 August 2010
17.47 50

132
Table 2. Microbial PLFA δ13C values (‰; mean ± SD) from 6 mesocosm experiments determined using DB-1 and DB-23
chromatographic columns.
FAMEs T0 TM T13C Mean of da nb significancec
i15:0 -29.01 ± 0.75 -28.69 ± 0.84 -24.69 ± 3.30 4.00 ± 3.01 6 0.02
a15:0 -29.34 ± 0.99 -29.12 ± 0.86 -25.58 ± 3.08 3.54 ± 2.82 6 0.02
16:0 -32.35 ± 2.12 -31.89 ± 1.51 -28.12 ± 3.16 3.77 ± 2.92 6 0.02
summed feature 1* -33.16 ± 0.86 -32.50 ± 1.23 -30.20 ± 4.23 2.30 ± 4.57 6 0.23
16:0, 16:1w9 -33.17 ± 1.81 -32.84 ± 1.49 -28.73 ± 2.81 4.11 ± 2.84 6 0.01
10me16:0 -30.60 ± 1.76 -29.88 ± 0.49 -28.80 ± 0.72 1.13 ± 0.64 5 0.02
cy17:0 -28.53 ± 2.18 -28.70 ± 2.44 -27.84 ± 2.40 0.86 ± 2.10 6 0.55
summed feature 2* -31.54 ± 1.52 -31.60 ± 1.40 -27.36 ± 3.36 4.24 ± 2.88 6 0.02
18:2w6 -33.07 ± 2.11 -32.83 ± 1.32 -32.09 ± 2.00 0.24 ± 1.85 5 0.50
18:1w9c, 18:1w7c -30.35 ± 0.91 -30.56 ± 0.97 -24.70 ± 3.16 5.87 ± 3.03 6 <0.01
cy19:0 -30.46 ± 0.80 -30.84 ± 0.23 -30.03 ± 0.50 0.82 ± 0.54 6 <0.01
20:4w6, 20:5w3 -36.69 ± 1.52 -35.92 ± 1.95 -34.59 ± 1.62 1.33 ± 2.62 6 0.23
20:4w6, coelluter -35.25 ± 1.71 -33.85 ± 1.75 -32.42 ± 4.29 0.40 ± 4.73 5 0.50
20:5w3, coelluter -37.26 ± 1.44 -35.92 ± 2.01 -34.75 ± 1.38 1.17 ± 2.81 6 0.27
22:6w3 -33.85 ± 1.49 -33.40 ± 1.62 -33.29 ± 1.68 0.05 ± 2.85 4 0.92
T0 = natural sediment control, TM= experimental control, T13C= treatment sediment. * Summed feature 1 includes 16:1ω9, 16:1ω7c,
16:1ω5c, 16:1ω13t; summed feature 2 includes 18:2ω6, 18:3w3, 18:1ω9, 18:1ω7c, 18:1ω5, a=difference in δ13C values of T13C- TM,
b= number of time when peak was present in all three treatments per experiment, c=p of paired t-test

133
Table 3. Phylogenetic affiliation of bacterial fatty acids functional groups extracted from White Clay Creek sediment*
*fatty acids that showed 13C enrichment in this study are in bold type # Hullar et al., (2006) bacterial 16S rRNA gene clone libraries
Phylum or Subphylum Species # Fatty acids Morphology Metabolism Citation
Betaproteobacteria Rhodoferax ferrireducens 16:0, 16:1w7, 18:1w7 Gram -ve aerobic, facultative anaerobic Hahn et al., 2010
Variovorax paradoxus 16:0, 16:1w7, cy17:0,
18:1w7
Gram -ve aerobic, facultative anaerobic Jin et al., 2012
Herbaspirillum rubrisubalbicans 16:1w7, 16:0, 18:1w7 Gram -ve aerobic, facultative anaerobic Jung et al. 2007
Burkholderia cepacia 16:0, 16:1w7, cy19:0 Gram -ve strict aerobe Stead, 1992
Gammaproteobacteria Lysobacter antibioticus i15:0, i17:1w9 Gram -ve aerobic Srinivasan et al., 2010
Nevskia ramosa 16:1w7, 16:0, 18:1w7 Gram -ve aerobic Losey et al., 2013
Deltaproteobacteria “Polyangium vitellum” [Kofleria
flava] (Haliangium ochraceum)
i16:0,16:0 Gram -ve strict aerobe Fudou et al., 2002
Alphaproteobacteria “Pedomicrobium fusiforme”
[Filomicrobium fusiforme]
18:1w7, 16:0, cy19:0 Gram –ve aerobe Wu et al., 2009
Bacteroidetes
Flavobacterium aquatile i15:0, a15:0, 15:1w6 Gram -ve strict aerobic Lee et al., 2012
Dysgonomonas gadei i14:0, i15:0, 16:0 Gram -ve aerobe, facultative anaerobic Hofstad et al., 2000
Runella slithyformis a15:0, i15:0, 16:1w5 Gram -ve strict aerobe Copeland et al., 2012
Firmicutes Bacillus niacini a15:0, i15:0, 16:0,
16:1w11, 18:0
Gram +ve facultative anaerobe Hong et al., 2012
Bacillus silvestris i15:0, i16:1 Gram +ve aerobic Reddy et al., 2008
Dendrosporobacter quercicolus 15:1, 17:1 Gram -ve anaerobic Strompl et al., 2000
Acidobacteria Acidobacterium capsulatum i15:0, 18:1w9 Gram -ve facultative anaerobic Kulichevskaya et al., 2012
Planctomycetes Pirellula (Blastopirellula)
marina
16:0, 18:1w9 Gram -ve strict aerobe Schlesner et al., 2004
Nitrospirae Nitrospina moscoviensis 16:1w9, 16:0
(11Me16:0)
Gram -ve aerobe Lipski et al., 2001,
Spieck et al., 2006
Gemmatimonadetes Gemmatimonas aurantiaca i15:0, 16:1, 14:0 Gram -ve aerobe Zhang et al., 2003
Actinobacteria Kutzneria kofuensis i16:0 (10Me17:0) Gram +ve aerobe Stackebrandt et al., 1994,
Suriyachadkun et al., 2013

134
CHAPTER 5
OVERALL CONCLUSIONS
Microbial communities are important players in lotic ecosystems and provide a critical
link to higher trophic levels through the microbial loop (Pomeroy 1974; Hall and Meyer 1998).
They are responsible for several biogeochemical transformations, including DOC uptake,
degradation, and mineralization (Kaplan and Newbold 1993; Pusch et al. 1998; Fischer and
Pusch 2001; Tank et al. 2010). Thus, DOC is a major energy source for benthic microbial
metabolism and drives lotic ecosystem processes and maintains secondary production of
consumers. To better understand the ecology of microbial communities, it is important not only to
describe the community composition and identify environmental factors that regulate their spatial
and temporal variations, but also to elucidate which of these microbes within the community
actively participate in DOC uptake, degradation, and mineralization. Studies that have
investigated bacterial utilization of DOC have indicated its heterogeneous nature being comprised
of both labile components, which turn over rapidly, and refractory components, which turn over
more slowly (Moran and Hodson 1990). The refractory DOC pool is composed of larger
molecules, primarily humic in nature, and often assumed to be largely inert to bacterial
degradation. However, few studies have shown that a portion of the humic substances is
biologically degradable (Moran and Hodson 1990; Carlsson et al. 1999).

135
The goals of this interdisciplinary study were to elucidate the bacteria responsible for
utilization of humic DOC in streams and to assess overall variability in microbial biomass, carbon
isotope signatures and community structure over time and across multiple spatial scales in stream
networks. Moreover, I examined the role of environmental heterogeneity and hydrological indices
in structuring benthic microbial communities. This dissertation was arranged into five chapters
with chapters one and five (this chapter) providing a comprehensive introduction and summary,
respectively.
Chapter two examined spatial variations in sedimentary microbial biomass and
community structure of forested streams within two distinct watersheds. A nested sampling
design was used to sample sediments from 1st- through 3rd - order streams in White Clay Creek
watershed and from 1st, 3rd and 5th- order streams in the Neversink watershed across multiple
spatial scales. PLFA analysis was used to characterize the microbial biomass and communities
found in the samples from these streams. In general, streams from the White Clay Creek
watershed showed higher total microbial biomass, percent prokaryotes and bacterial abundance
than those within the Neversink watershed. Also, C:N ratios and conductivity were generally
higher in the White Clay Creek watershed compared to the Neversink watershed. In addition, C:N
ratios were higher in 1st and 2nd order streams and lower in 3rd and 5th order steam sediments. The
variation in microbial biomass in stream sediments correlated with C:N ratio, sediment grain size,
percent carbon and percent water content. In contrast to reach-scale similarity in microbial
biomass, there were large significant differences in biomass at stream-scale and between
watersheds. Sediment microbial community structure in the fourteen streams investigated
displayed distinct watershed-scale variations at the scale of hundreds of kilometers and among-
stream within a watershed variation at the scale of hundreds of meter. Also, the shift from

136
predominance of bacteria in lower order streams to phototrophic microeukaryotes in higher order
stream may be explained by decreased importance of terrestrial organic inputs from riparian
vegetation and increased importance of algal production downstream. Overall, the magnitude of
within stream variation in microbial biomass was small compared to the variability noted among
streams and between watersheds. Furthermore, this study and others (Oda et al. 2003; Crump et
al. 2004; Hughes-Martiny et al. 2006; Fierer et al. 2007) conducted over a range of spatial scales
implies non-random distribution of microbial community and that environmental heterogeneity
and geographical distance can structure microbial biomass and distribution.
Chapter three provided baseline information on the natural abundance and seasonal
variation in compound specific stable carbon isotope signatures of individual microbial PLFAs of
White Clay Creek. Also, seasonal variation of microbial biomass and community structure was
investigated with assessment of the effect of hydrological and environmental variables on
microbial communities in headwater stream sediments. This work demonstrated that sedimentary
microbial biomass was seasonally dynamic and significantly correlated to a combination of high
and low flood pulse counts, variability in daily flow and DOC concentrations. The seasonal
pattern of variation observed in microbial community structure was as a result of a shift between
the ratios of prokaryotic to eukaryotic component of the community. This shift was significantly
correlated with seasonal changes in median daily flow, high and low flood pulse counts, DOC
concentrations and water temperature. Stable carbon isotopes signatures of some PLFAs varied
significantly over an annual cycle. Both bacterial and microeukaryotic stable carbon isotope
signatures were heaviest in the spring and lightest in autumn or winter. Some bacterial lipids were
isotopically depleted on average by 2- 5‰ relative to δ13C of total organic carbon and enriched
relative to algae PLFAs. During spring bloom, increased algal productivity partly due to moderate

137
stream temperature and flow, and reduced input of CO2 from detrital decomposition appears to
result in a more negative δ13C PLFAs (Finlay 2004). Thus, the annual variation of the δ13C of
biota is sensitive in providing indication of changes resulting from ecological processes related to
ecosystem functions. In addition, this findings support emerging picture in microbial ecology for
non-random patterns in microbial biomass and community structure and that local environmental
heterogeneity regulate microbial distribution over annual cycles.
Chapter four elucidates which heterotrophic benthic microbes within streams actively
utilize humic DOC and ultimately control the material flux that influences higher trophic levels.
Streambed sediments were incubated in re-circulating mesocosm chambers amended with
leachate from composted 13C-labelled tulip poplar tree-tissues (a process that yields 13C-labeled
DOM with size and lability fractions approximating streamwater DOM) and examined for 13C
incorporation into microbial PLFA.Total community structure and metabolically active
community members from the mesocosm incubated sediments were elucidated through PLFA and
13C isotopic analysis of the microbial PLFAs respectively. This work demonstrated that the
mesocosm-based experimental design, particularly the comparison of the TM mesocosm control
to the T13C mesocosm treatment samples, is sufficiently robust to warrant examination of
individual fatty acids for the incorporation of 13C labeled DOC into microbial lipids. Bacterial
fatty acids i15:0, a15:0, 16:0, 16:1ω9, 18:1ω9c, 18:1ω7c, 10me16 and cy19:0 (aerobic, anaerobic
and facultative anaerobic bacteria biomarkers) and fatty acids 20:4ω6, 20:5ω3 (microeukaryotic
biomarkers) showed increased abundance of 13C.The fatty acids showing the strongest enrichment
were i15:0, a15:0, 16:1ω9, 16:0, 18:1ω7c and 18:1ω9. These are marker fatty acids for members
of major bacterial groups such as Alphaproterobacteria, Gammaproteobacteria, Firmacutes,
Acidobacteria, Bacteroidetes, Gemmatimonadetes and Nitrospirae. These species are known for

138
versatile metabolisms and PLFA-SIP findings suggest that they actively utilized 13C-labeled leaf
leachate. The PLFAs 10me16:0 and cy19:0 showed moderate 13C enrichment and are marker fatty
acids for Desulfobacter. This suggests that sulfate-reducing bacteria, in particular, members of the
genus Desulfobacter utilized some component of 13C-labeled leaf leachate. In addition, the
presence of label in fatty acids 20:4ω6 and 20:5ω3 suggests that protozoan grazers used bacteria
that are utilizing 13C-DOM as food source and may contribute significantly to the transfer of
allochthonous carbon via microbial loop in stream ecosystems. This work suggests that these
benthic microbes are important players within steam ecosystems with regards to humic DOC
uptake, degradation, respiration, and transfer to higher trophic levels.
The overall results of this study shows evidence that the sedimentary microbial
community displayed seasonal pattern of variation in structure and isotopic signatures, distinct
watershed-level biogeography, as well as variation along a headwater streams-large stream
gradient. The variation observed in sedimentary microbial community structure in time and space
was significantly correlated to local environmental heterogeneity. Further, this study provides
direct experimental evidence that benthic microbial communities in forested headwater streams
readily utilize humic DOM. In summary, this study depicts a complex relationship between
microbial community structure, environmental heterogeneity and utilization of humic DOM,
indicating that terrestrial DOM quality and quantity along with other hydro-ecological variables
should be considered among the important factors that structure benthic microbial communities in
lotic ecosystems.
For future directions, investigation should be focused on examining spatial patterns in
sedimentary microbial distribution at larger spatial scales, such as within and among watersheds
in a biome and in different biomes with samplings at different times of the year. Results from

139
such extensive studies ranging from small scales (<10km) to intermediate (10 – 3000km) and at
larger spatial scales (>10,000km) would provide addition information about the role of
environmental heterogeneity and geographical distance in structuring microbial community
structure. Also, such study can be complemented with research efforts to identify which microbial
individual populations are unique to each habitat using molecular techniques. Results from such
undertakings can provide useful insights into the long held assumption in microbiology of
“everything is everywhere, but the environment selects” (Bass-Becking, 1934).
Further investigations on the mesocosm experiment should be focused on scaling up to
whole-stream tracer- level isotope addition with sufficiently enriched 13C-DOC to examine the
incorporation of labeled 13C-DOC into stream sediment microbial lipids. Undoubtedly, this will
be a challenging task but such study would provide a strong support for the elucidation of the
metabolically active microbial communities within stream sediments involved in humic DOC
metabolism as shown in this study. Furthermore, results from such study will advance our
understanding of methods for measuring in situ microbial and stream dynamics.

140
REFERENCES
Alexander R. B., E. W. Boyer, R. A. Smith, G. E. Schwartz and R. B. Moore (2007). The role of headwater streams in downstream water quality. Journal of the American Water Resources Association 43:41–59.
Amon R. M. W and R. Benner (1994). Rapid cycling of high- molecular weight dissolved organic
matter in the ocean. Nature 369: 549-552. Amon R. M. W and R. Benner (1996). Bacterial utilization of different size classes of dissolved
organic matter. Limnol. Oceanogr. 41: 41- 51. Baas Becking L.G.M (1934). Geobiologie of inleiding tot de milieukunde. The Hague, the
Netherlands: W.P. Van Stockum & Zoon (in Dutch). Battin T.J, Wille A, Sattler B and R. Psenner (2001). Phylogenetic and functional heterogeneity of
sediment bioflms along environmental gradients in a glacial stream. Appl. Environ. Microbiol. 67: 799-807.
Battin T.J., L. A. Kaplan, S. Findlay, C. S. Hopkinson, E. Marti, A. I. Packman, J. D. Newbold
and F. Sabater (2008). Biophysical controls on organic carbon fluxes in fluvial networks. Nature Geosci. 1: 95- 100.
Bernot M. J and W. K. Dodds (2005). Nitrogen retention, removal, and saturation in lotic
ecosystems. Ecosystems 8: 442–453. Besemer K., B. Luef, S. Preiner, B. Eichberger, M. Agis and P. Peduzzi (2009). Sources and
composition of organic matter for bacterial growth in a large European river floodplain system (Danube, Austria) Organic Geochemistry, 40 (3), pp. 321-331.
Boschker H.T.S., S.C. Nold, P. Wellsbury, D. Bos, W. de Graaf, R. Pel, R.J. Parkes and T.E.
Cappenberg (1998). Direct linking of microbial populations to specific biogeochemical processes by C-13-labelling of biomarkers. Nature 392:801–805.

141
Boschker H.T.S (2004). Linking microbial community structure and functioning: stable isotope (13C) labeling in combination with PLFA analysis, in: Kolwalchuk, G.A. et al. (Ed.) 2004). Molecular microbial ecology manual II. pp. 1673-1688
Bott T. L and M. A. Borchardt (1999). Grazing of protozoa, bacteria and diatoms by meiofauna in
lotic epibenthic communities. Journal of the North American Benthological Society 18: 499–513.
Bourguet N, M. Goutx, J.F. Ghiglione, M. Pujo-Pay, G. Mevel, A. Momzikoff, L. Mousseau, C.
Guigu, N. Garcia, P. Raimbault, R. Pete, L. Oriol and D. Lefevre (2009). Lipid biomarkers and bacterial lipase activities as indicators of organic matter and bacterial dynamics in contrasted regimes at the DYFAMED site, NW Mediterranean. Deep-Sea Research II, 56: 1454-1469.
Carlsson P., E. Graneli and A. Z. Segatto (1999). Cycling of biologically available nitrogen in
riverine humic substances between marine bacteria, a hetertrophic nanoflagellate and a photosythenic dinoflagellate. Aquatic Microbial Ecology 18:23-36.
Cleven E.J (2004). Seasonal and spatial distribution of ciliates in the sandy hyporheic zone of a
lowland stream Eur. J. Protistol., 40: 71–80. Cotner J.B and B.A Biddanda (2002). Small players, large role: Microbial influence on
biogeochemical processes in pelagic aquatic ecosystems. Ecosystems 5:105–121. Cottrell M. T and S. L. Kirchman (2000). Natural Assemblages of Marine Proteobacteria and
Members of the Cytophaga-Flavobacter Cluster Consuming Low- and High- Molecular-Weight Dissolved Organic Matter. Applied and environmental microbiology 66: 1692–1697.
Cowell B. C., A. H. Remley and D. M. Lynch (2004). Seasonal changes in the distribution and
abundance of benthic invertebrates in six headwater streams in central Florida. Hydrobiologia 522: 99–115.
Crump B.C, Hopkinson C.S, Sogin M.L, Hobbie J.E (2004) Microbial biogeography along an
estuarine salinity gradient: combined influences of bacterial growth and residence time. Appl. Environ. Microbiol. 70, 1494–1505.

142
Davey A.J.H. and D.J. Kelly (2007). Fish community responses to drying disturbances in an intermittent stream: a landscape perspective. Freshwater Biology, 52: 1719–1733.
Dobbs F.C and Guckert J.B (1988) Microbial food resources of the macrofaunal deposit feeder
Ptychodera bahamensis (Hemichordata. Enteropneusta). Mar. Ecol. Prog. Ser. 45: 127-136. Dumont M.G and J.C. Murrell (2005). Stable isotope probing: Linking microbial identity to
function. Nat. Rev. Microbiol. 3:499–504. Durrett R and S. Levin (1997). Allelopathy in spatially distributed populations. J. Theor. Biol.
185: 165-171. Evershed R.P., Z.M. Crossman, I.D. Bull, H. Mottram, J.A.J. Dungait, P.J. Maxfield, and E.L.
Brennand (2006). C13-labelling of lipids to investigate microbial communities in the environment. Curr. Opin. Biotechnol. 17:72–82.
Fierer N, Morse J, Berthrong S, Bernhardt E.S and R.B Jackson (2007) Environmental controls on
the landscape-scale biogeography of stream bacterial communities. Ecology 88:2162–2173. Findlay, R. H., G. M. King and L. Watling (1989). Efficacy of phospholipid analysis in
determining microbial biomass in sediments. Appl. Environ. Microbiol. 54: 2888-2893. Findlay R. H (2004). Determination of microbial community structure using phospholipid fatty
acid profiles, p. 983–1004. In G. A. Kowalchuk, F. J. De Bruijn, I. M. Head, A. D. L. Akkermans, and J. D. Van Elsas (ed.), Molecular microbial ecology manual, 2nd ed. Kluwer Academic Publishers, Dordrecht, The Netherlands.
Findlay S and R. L Sinsabaugh (1999). Unraveling the sources and bioavailability of dissolved
organic matter in lotic aquatic ecosystems. Mar. Freshwater Res., 1999, 50, 781-790. Fischer H and M. Pusch (2001). Comparison of bacterial production in sediments, epiphyton, and
the pelegiac zone of a lowland river. Freshwater Biol. 46:1335-1348.

143
Foreman C.M and J.S. Covert (2003). Linkages between dissolved organic matter composition and bacterial community structure. p. 343-362. In S.E.G. Findlay and R.L. Sinsabaugh [eds.], Aquatic Ecosystems: Interactivity of dissolved organic matter. Aquatic Ecology Series. Academic Press.
Freese H.M, Eggert A, Garland J.L and R. Schumann (2010). Substrate Utilization Profiles of
Bacterial Strains in Plankton from the River Warnow, a Humic and Eutrophic River in North Germany. Microbial Ecology, 59:59-75.
Gao X, Olapade O.A and L.G Leff (2005) Comparison of benthic bacterial community
composition in nine streams. Aquat. Microb. Ecol. 40:51–60. Hall, R. O. and J. L. Meyer (1998). The trophic significance of bacteria in a detritus-based stream
food web. Ecology 79:1995–2012. Hall R. O (1995). Use of a stable carbon isotope addition to trace bacterial carbon through a
stream food web. Journal of the North American Benthological Society 14:269–277. Hall, R. O and J. L. Meyer (1998). The trophic significance of bacteria in a detritus-based stream
food web. Ecology 79:1995–2012. Hall Jr., R. O, Bernhardt E. S and G. E. Likens (2002). Relating Nutrient Uptake with Transient
Storage in Forested Mountain Streams. Limnology and Oceanography. 47: (1). 255-265. Hart D.D (1992). Community Organization in Streams: The Importance of Species Interactions,
Physical Factors and Chance. Oecologia 91: 220-228. Hatzenbeler, G. R., Bozek, M. A., Jennings, M. J and E. E. Emmons (2000). Seasonal variation in
fish assemblage structure, and habitat structure in the near-shore littoral zone of Wisconsin Lakes. North American Journal of Fisheries Management, 20: 360–368.
Hughes-Martiny J.B, Bohannan B.J.M, Brown J.H et al (2006). Microbial biogeography: putting
microorganisms on the map. Nature Reviews Microbiology 4:102–112.

144
Kaplan L. A and T. L. Bott (1989). Diel fluctuations in bacterial activity on streambed substrata during vernal algal blooms: effects of temperature, water chemistry, and habitat. Limnol. Oceanogr. 34: 718–733.
Kaplan L.A and J.D. Newbold (1993). Biogeochemistry of dissolved organic carbon entering
streams. In T. E. Ford (ed.) Aquatic microbiology, an ecological approach. Blackwell, Boston, pp 139–166.
Kaplan L.A, Wiegner T.N, Newbold J.D, Ostrom P.G and H. Gandhi (2008). Untangling the
complex issue of dissolved organic carbon uptake: a stable isotope approach. Freshwater Biology 53: 855-864.
Kerr, B., M.A. Riley, M. W. Feldman and B.J.M. Bohannan (2002). Local dispersal promotes
biodiversity in a real-life game of rock–paper–scissors. Nature 418: 171-174. Lowe W.H, G.E Likens and M.E Power (2006). Linking scales in stream ecology. Bioscience 56:
591–597. McArthur J.V., D.A. Kovacic and M.H. Smith (1988). Genetic diversity in natural populations of
a soil bacterium across a landscape gradient. Proceedings of the National Academy of Science 85:9621-9624.
Moran M. A and R. E. Hodson (1990). Bacterial production on humic and non-humic components
of dissolved organic carbon. Limnology and Oceanography 35 (88): 1744–1756. Morehead D. L., R. L. Sinsabaugh, A. E. Linkins and J. F. Reynolds (1996). Decomposition
processes: modeling approaches and applications. Sci. Total Environ. 183:137–149. Newbold J. D., Elwood, J. W., O'Neill, R. V and W. Van Winkle (1981). Nutrient spiralling in
streams: The concept and its field measurement. Can. J. Fish. Aquat. Sci. 38: 860-863. Oda Y, Star B, Huisman L.A, Gottschal J.C and L.J. Forney (2003) Biogeography of the purple
nonsulfur bacterium Rhodopseudomonas palustris. Appl. Environ. Microbiol. 69, 5186–5191.

145
Peduzzi P., F. Aspetsberger, T. Hein, F. Huber, S. Kargl-Wagner, B. Luef and Y. Tachkova (2008). Dissolved organic matter (DOM) and bacterial growth in floodplains of the Danube River under varying hydrological connectivity, Fundamental and Applied Limnology 171: 49–61.
Peterson B.J, Wollheim W.M, Mulholland P.J, Webster J.R, Meyer J.L, Tank J.L, Marti E,
Bowden W.B, Valett H.M, Hershey A.E, McDowell W.H, Dodds W.K, Hamilton S.K, Gregory S,Morrall D.D (2001). Control of nitrogen export from watersheds by headwater streams. Science 292:86–90.
Pires A.M, Cowx I.G and M.M. Coelho (1999). Seasonal changes in fish community structure of
intermittent streams in the middle reaches of the Guadiana basin, Portugal. Journal of Fish Biology, 54: 235–249.
Poff N.L and J.V. Ward (1992). Heterogeneous currents and algal resources mediate in situ
foraging activity of a mobile stream grazer. Oikos 65: 465-478. Pomeroy L.R (1974). The ocean's food web, a changing paradigm. BioScience 24, 499–504. Pusch M., D. Fiebig, I. Brettar, H. Eisenmann, B. K. Ellis, L.A. Kaplan, M.A. Lock, M.W.
Naegeli and W. Traunspurger (1998). The role of microorganisms in the ecological connectivity of running waters. Freshw. Biol.40:453–49.
Radajewski, S., P. Ineson, N.R. Parekh and J.C. Murrell (2000). Stable-isotope probing as a tool
in microbial ecology. Nature 403:646–649. Smith D.C, Steward G.F, Long R.A. and F. Azam (1995). Bacterial mediation of carbon fluxes
during a diatom bloom in a mesocosm. Deep-Sea Research II, 42:75-97. Smoot, J.C and R.H. Findlay (2001). Spatial and Seasonal Variation in a Reservoir Sedimentary
Microbial Community as Determined by Phospholipid Analysis. Microb. EcoL, 42: 350-358. Sutton S.D and Findlay R.H. 2003. Sedimentary microbial community dynamics in a regulated
stream: East Fork of the Little Miami River, Ohio. Environ. Microbiol. 5:256-266.
146
Tank J. L., Rosi-Marshall, E. J., Baker, M. A., and R. O. Hall Jr. (2008). Are rivers just big streams? A pulse method to quantify nitrogen demand in a large river. Ecology, 89: 2935-2945.
Tank J.L., E.J. Rosi-Marshall, N.A. Griffiths, S.A. Entrekin and M.L. Stephen (2010). A review
of allochthonous organic matter dynamics and metabolism in streams. Journal of the North American Benthological Society 29:118-146.
Taylor C.M, Winston M.R and W.J. Matthews (1996). Temporal variation in tributary and
mainstream fish assemblages in a Great Plains stream system. Copeia, 280–289. White D.C., D.B. Ringelberg, D.B. Hedrick and D.E. Nivens (1994). Rapid identification of
microbes and environmental matrices: Characterization of signature lipids. p. 8–17. In C. Fenselau (ed.) Mass spectrometry for the characterization of microorganisms. ACS Symp. Ser. 541. Am. Chem. Soc., Washington, DC.
Wiegner T.N., L.A. Kaplan, J.D. Newbold and P.H. Ostrom (2005a). Synthesis of a 13C-labeled
tracer for stream DOC: labeling tulip poplar carbon with 13CO2. Ecosystems 8: 501–511. Wiegner T.N., L.A. Kaplan, J.D. Newbold and P. H. Ostrom (2005b). Contribution of dissolved
organic C to stream metabolism: a mesocosm study using 13C-enriched tree-tissue leachate. J. N. Am. Benthol. Soc., 2005, 24(1): 48–67.
Wiegner T. N, R. L. Tubal and R. A. MacKenzie (2009). Bioavailability and export of dissolved
organic matter from a tropical river during base- and stormflow conditions. Limnol. Oceanogr., 54(4), 1233–1242.
Wong J. C. Y and D. D. Williams (2010). Sources and seasonal patterns of dissolved organic
matter (DOM) in the hyporheic zone. Hydrobiologia. 647: 99–111.
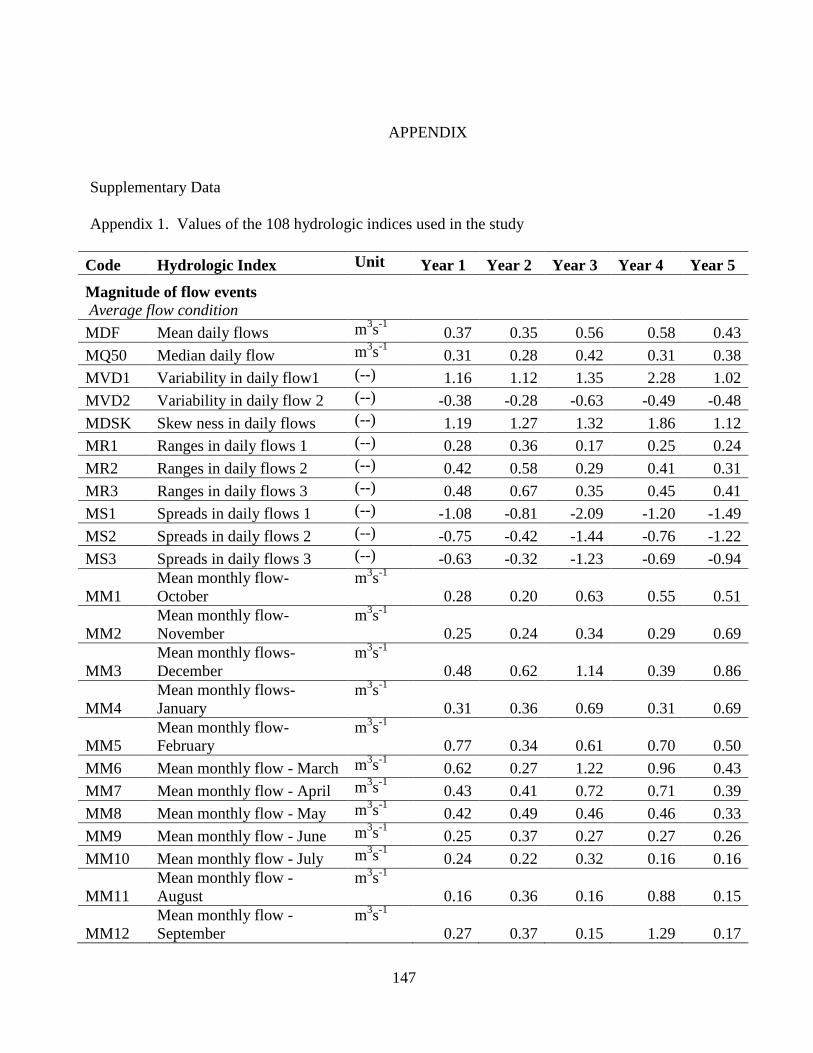
147
APPENDIX
Supplementary Data Appendix 1. Values of the 108 hydrologic indices used in the study
Code Hydrologic Index Unit Year 1 Year 2 Year 3 Year 4 Year 5
Magnitude of flow events Average flow condition
MDF Mean daily flows m3s-1 0.37 0.35 0.56 0.58 0.43
MQ50 Median daily flow m3s-1 0.31 0.28 0.42 0.31 0.38
MVD1 Variability in daily flow1 (--) 1.16 1.12 1.35 2.28 1.02
MVD2 Variability in daily flow 2 (--) -0.38 -0.28 -0.63 -0.49 -0.48
MDSK Skew ness in daily flows (--) 1.19 1.27 1.32 1.86 1.12
MR1 Ranges in daily flows 1 (--) 0.28 0.36 0.17 0.25 0.24
MR2 Ranges in daily flows 2 (--) 0.42 0.58 0.29 0.41 0.31
MR3 Ranges in daily flows 3 (--) 0.48 0.67 0.35 0.45 0.41
MS1 Spreads in daily flows 1 (--) -1.08 -0.81 -2.09 -1.20 -1.49
MS2 Spreads in daily flows 2 (--) -0.75 -0.42 -1.44 -0.76 -1.22
MS3 Spreads in daily flows 3 (--) -0.63 -0.32 -1.23 -0.69 -0.94
MM1 Mean monthly flow-October
m3s-1 0.28 0.20 0.63 0.55 0.51
MM2 Mean monthly flow-November
m3s-1 0.25 0.24 0.34 0.29 0.69
MM3 Mean monthly flows- December
m3s-1 0.48 0.62 1.14 0.39 0.86
MM4 Mean monthly flows- January
m3s-1 0.31 0.36 0.69 0.31 0.69
MM5 Mean monthly flow- February
m3s-1 0.77 0.34 0.61 0.70 0.50
MM6 Mean monthly flow - March m3s-1 0.62 0.27 1.22 0.96 0.43
MM7 Mean monthly flow - April m3s-1 0.43 0.41 0.72 0.71 0.39
MM8 Mean monthly flow - May m3s-1 0.42 0.49 0.46 0.46 0.33
MM9 Mean monthly flow - June m3s-1 0.25 0.37 0.27 0.27 0.26
MM10 Mean monthly flow - July m3s-1 0.24 0.22 0.32 0.16 0.16
MM11 Mean monthly flow - August
m3s-1 0.16 0.36 0.16 0.88 0.15
MM12 Mean monthly flow - September
m3s-1 0.27 0.37 0.15 1.29 0.17

148
MMV1 Variability in monthly flows-October
(--) 1.57 0.43 1.50 2.82 0.23
MMV2 Variability in monthly flows-November
(--) 0.27 0.51 0.25 0.48 1.25
MMV3 Variability in monthly flows-December
(--) 0.76 1.55 1.52 0.94 0.87
MMV4 Variability in monthly flows-January
(--) 0.23 0.71 0.91 0.53 0.75
MMV5 Variability in monthly flows-February
(--) 1.52 0.35 0.50 0.59 0.28
MMV6 Variability in monthly flows-March
(--) 0.63 0.09 0.83 1.40 0.28
MMV7 Variability in monthly flow - April
(--) 0.31 0.52 0.23 0.62 0.66
MMV8 Variability in monthly flows-May
(--) 0.34 1.09 0.19 0.28 0.42
MMV9 Variability in monthly flows-June
(--) 0.32 0.64 0.19 0.16 0.46
MMV10 Variability in monthly flows-July
(--) 0.52 0.23 0.98 0.18 0.17
MMV11 Variability in monthly flows-August
(--) 0.29 0.71 0.19 3.37 0.22
MMV12 Variability in monthly flows-September
(--) 1.23 1.38 1.25 2.00 0.63
MV1 Variability across monthly flows1
(--) 4.87 5.33 5.34 12.46 3.74
MV2 Variability across monthly flows2
(--) 0.29 0.32 0.37 0.38 0.21
MV3 Variability across monthly flows3
(--) 0.84 1.06 1.11 1.42 0.87
MV4 Variability across monthly flows4
(--) 75.01 79.30 82.53 145.59 62.08
MMSK Skewness in monthly flows (--) 0.23 0.31 0.35 0.61 0.23
MAR Mean annual runoff m3s-1
km-2 0.01 0.01 0.02 0.02 0.01
Low flow condition
MML1 Mean minimum monthly flow-October
m3s-1 0.12 0.14 0.19 0.21 0.40
MML2 Mean minimum monthly flow-November
m3s-1 0.19 0.17 0.26 0.21 0.37
MML3 Mean minimum monthly flow-December
m3s-1 0.24 0.22 0.34 0.24 0.51
MML4 Mean minimum monthly flow-January
m3s-1 0.22 0.25 0.45 0.22 0.48
MML5 Mean minimum monthly m3s-1 0.31 0.25 0.42 0.28 0.40

149
flow-February
MML6 Mean minimum monthly flow-March
m3s-1 0.40 0.23 0.65 0.40 0.34
MML7 Mean minimum monthly flow-April
m3s-1 0.31 0.26 0.54 0.45 0.27
MML8 Mean minimum monthly flow-May
m3s-1 0.28 0.27 0.34 0.31 0.24
MML9 Mean minimum monthly flow-June
m3s-1 0.17 0.23 0.18 0.22 0.16
MML10 Mean minimum monthly flow-July
m3s-1 0.15 0.17 0.15 0.12 0.12
MML11 Mean minimum monthly flow-August
m3s-1 0.12 0.19 0.10 0.12 0.12
MML12 Mean minimum monthly flow-September
m3s-1 0.12 0.20 0.08 0.26 0.09
MBI Base flow index (--) 0.32 0.41 0.17 0.22 0.24
MBV Variability in base flow index
(--) 3.00 2.47 5.42 2.57 9.88
MAL Specific mean annual minimum flows
m3s-1
km-2 0.00 0.00 0.00 0.00 0.00
High flow condition
MMH1 Mean maximum monthly flow-October
m3s-1 2.66 0.54 4.47 8.92 0.85
MMH2 Mean maximum monthly flow-November
m3s-1 0.51 0.76 0.68 0.96 4.98
MMH3 Mean maximum monthly flow-December
m3s-1 2.24 5.55 7.87 1.87 3.28
MMH4 Mean maximum monthly flow-January
m3s-1 0.57 1.67 3.96 1.05 3.37
MMH5 Mean maximum monthly flow-February
m3s-1 6.46 0.74 1.56 2.18 1.19
MMH6 Mean maximum monthly flow-March
m3s-1 2.44 0.31 6.03 7.73 0.99
MMH7 Mean maximum monthly flow-April
m3s-1 0.93 1.19 1.33 2.44 1.59
MMH8 Mean maximum monthly flow-May
m3s-1 0.82 3.23 0.65 0.88 1.02
MMH9 Mean maximum monthly flow-June
m3s-1 0.57 1.42 0.37 0.45 0.76
MMH10 Mean maximum monthly flow-July
m3s-1 0.85 0.40 1.87 0.23 0.23
MMH11 Mean maximum monthly flow-August
m3s-1 0.34 1.02 0.27 16.68 0.31
MMH12 Mean maximum monthly flow-September
m3s-1 1.93 2.94 1.10 13.56 0.59

150
MHF1 High flow discharge1 (--) 0.39 0.53 0.23 0.41 0.28
MHF2 High flow discharge2 (--) 0.49 0.65 0.36 0.62 0.37
MHF3 High flow discharge3 (--) 0.65 0.82 0.51 0.77 0.54
MHA Specific mean annual maximum flows
m3s-1
km-2 0.22 0.19 0.27 0.57 0.17
MHV1 High flow volume1 days 5.17 7.55 9.61 17.43 7.04
MHV2 High flow volume2 days 11.70 10.85 14.24 26.54 13.86
MHV3 High flow volume3 days 13.79 28.16 21.46 52.88 20.24
MHP1 High peak flow 1 (--) 1.82 1.99 2.10 3.08 1.65
MHP2 High peak flow 2 (--) 7.25 5.98 6.60 10.05 6.52
MHP3 High peak flow 3 (--) 10.42 14.08 12.03 20.97 9.57
MHP4 High peak flow 4 (--) 2.50 2.61 2.99 5.01 2.32
Frequency of flow events FLC Low flood pulse count year-1 78.00 88.00 87.00 77.00 91.00
FLS Frequency of low flow spell year-1 16.00 15.00 19.00 16.00 12.00
FHC1 High flood pulse count 1 year-1 78.00 78.00 91.00 80.00 76.00
FHC2 High flood pulse count 2 year-1 10.00 16.00 12.00 29.00 10.00
FHC3 High flood pulse count 3 year-1 5.00 3.00 7.00 10.00 4.00
FRE1 Flood frequency 1 year-1 164.00 136.00 192.00 174.00 183.00
FRE2 Flood frequency 2 year-1 10.00 16.00 21.00 29.00 10.00
FRE3 Flood frequency 3 year-1 5.00 3.00 7.00 10.00 4.00
FRE4 Flood frequency 4 year-1 271.00 261.00 270.00 270.00 273.00
FRE5 Flood frequency 5 year-1 78.00 102.00 91.00 80.00 76.00
Duration of flow events Average flow conditions
DLE1 Low exceedence flows 1 (--) 1.36 1.22 1.47 1.73 1.33
DLE2 Low exceedence flows 2 (--) 1.73 1.84 2.13 2.51 1.56
DL0 Number of zero-flow days year-1 0.00 0.00 0.00 0.00 0.00
DLP0 Percent of zero-flow months (--) 0.00 0.00 0.00 0.00 0.00
High flow conditions
DFD Flood duration 1 (--) 1.83 1.55 2.10 1.90 1.79
DHP High flow pulse duration days 0.78 0.72 1.27 1.56 0.89
DHPV Variability in high flow pulse duration
(--) 102.98 102.20 98.67 166.34 85.89
DHF1 High flow duration 1 days 0.57 0.55 0.89 0.96 0.63
DHF2 High flow duration 2 days 2.26 1.66 2.80 3.13 2.49
DHF3 High flow duration 3 days 3.25 3.91 5.11 6.53 3.66
DHF4 High flow duration 4 days 0.45 0.42 0.70 0.70 0.52

151
DHF5 High flow duration 5 days 0.78 0.72 1.27 1.56 0.89
Rate of change in flow events RRM Rise rate m3s-1d-1 0.14 0.13 0.24 0.34 0.14
RRV Variability in rise rate (--) 332.15 335.78 331.38 462.39 334.06
RFM Fall rate m3s-1d-1 -0.27 -0.26 -0.51 -0.62 -0.30
RFV Variability in fall rate (--) -269.79 -224.63 -249.75 -309.36 -214.31
RD0 Number of day rises (--) 0.52 0.52 0.53 0.55 0.47
RCF1 Change of flow 1 m3s-1 0.35 0.22 0.19 0.26 0.20
RCF2 Change of flow 2 m3s-1 -0.51 -0.56 -0.40 -0.55 -0.43

152
Appendix 2. Ordination from the principal component analysis of 108 streamflow variables for
the WCC. Standardized PCA based on correlation matrix was obtained by centering and
standardization by ‘species’ (in CANOCO 4.5) since ‘species’ were measured in different units.
Some of the data points were jittered (where overlapping occurred) to improve clarity.