spatio-temporal information ranking in vanet applications
TRANSCRIPT

Spatio-temporal Information Ranking inVANET Applications
PIOTR SZCZUREK, BO XU, JIE LIN, AND OURI WOLFSON
University of Illinois at Chicago
Vehicular ad-hoc networks (VANETs) is a promising approach to the dissemination of spatio-temporal information such as the current traffic condition of a road segment or the availability of
a parking space. Due to the constraint of the communication bandwidth, only a limited number
of information items may be transmitted upon a vehicle-to-vehicle communication opportunity.Ranking becomes critical in this situation, by enabling the most important information to be
transmitted under the bandwidth constraint. In this paper we propose a method for online learning
of spatio-temporal information ranking in VANETs. In this method, mobile nodes such as vehiclesjudge the relevance of incoming information items and use them as training examples for Naive
Bayesian learning. Additionally, a separate machine learning algorithm is used to estimate the
probability of a duplicate item being transmitted. The method is used in place of commonly usedheuristics, and is evaluated for travel time and parking availability dissemination applications.
Keywords: Information dissemination, machine learning, parking information systems, travel time
dissemination, VANET
1. INTRODUCTION
A vehicular ad-hoc network (VANET) is a set of vehicles that communicate witheach other via unregulated, short-range wireless technologies such as WiFi or DSRC[DSRC 2003]. The use of VANETs has allowed the creation of systems for informa-tion dissemination, many of which related to dissemination of real-time traffic data.Examples include disseminating parking availability [Caliskan et al. 2004], travelspeeds [Wischhof et al. 2003; Zhong et al. 2008], or traffic video clips [Guo et al.2005; Lee et al. 2009]. Such systems enable drivers to lower their travel times andreduce parking search times, which results in savings of fuel cost, emissions, andtime. These benefits are directly related to the quantity and quality of informationthat can be disseminated.
Due to limited transmission radius and bandwidth, the quantity of disseminatedinformation that can be disseminated using a VANET is constrained. Althoughindividual pieces of information may be small in size, in combination, they couldeasily exceed the bandwidth capacity of a VANET. For example, in a travel timedissemination application, each individual travel time report might be on order oftens of bytes, yet with thousands of road segments, exchange of such informationamong vehicles might be prohibitive. The problem is exacerbated when consideringsharing bandwidth among multiple applications. This makes it important to focus
This research was supported in part by the National Science Foundation IGERT program underGrant DGE-0549489 and also supported by NSF DGE-0549489, IIS-0957394, and IIS-0847680.
Authors’ addresses: Piotr Szczurek, Bo Xu, Ouri Wolfson, Univ. of Illinois at Chicago, Dept. of
Computer Science, 851 S. Morgan St., Chicago, IL, U.S.A.; Jie Lin, Univ. of Illinois at Chicago,Dept. of Civil and Materials Engineering, 842 W. Taylor St., Chicago, IL, U.S.A.
International Journal of Next-Generation Computing, Vol. 1, No. 1, July 2010.

Spatio-temporal Information Ranking in VANET Applications · 63
on the quality of information that is being disseminated. This can be done byranking information that needs to be sent by its relevance for the receiving vehicles.In VANET applications, the information is typically spatio-temporal in nature. Itis hence intuitive that the relevance depends on attributes such the age (i.e., howlong ago the information was generated) and distance (i.e., how far is the vehiclefrom a point to which the information pertains). These spatio-temporal attributesneed to be combined to find the relevance. Although heuristics based on intuitionmay be used for this purpose, knowing how to combine the attribute in an optimalmanner depends on knowledge of particular applications and may not be trivial.
Based on work in [Szczurek et al. 2009], this paper presents a method for rank-ing spatio-temporal information using relevance, which is found using a machinelearning method. Using this approach allows for combining several, known to berelevant attributes, into a single relevance value. The relevance value can then besubsequently used for ranking information. Vehicles can use this ranking of infor-mation to decide which information should be transmitted. They can also use itas an aid in decision making. For example, ranking parking availability reportsallows a vehicle to identify a parking location that is most likely to be availableupon arrival. The advantage of this method is that it can be applied for differentVANET applications and does not require extensive knowledge or analysis of theapplication in order to rank the information.
In our method, the VANET disseminates reports over time, where each reportrepresents a piece of sensed spatio-temporal information such as the traffic conditionof a road segment or the availability of a parking space. Vehicles which receive suchreports can use them to possibly alter their behavior. For example, they can changetheir travel route or pursue a particular parking space. We postulate that findingwhich reports are most useful and hence relevant, depends on their spatio-temporalattributes. A useful report is one that impacts the decisions of the receiving vehicle,such as changing its travel route.
To find the relevance of reports, this work uses machine learning. The machinelearning algorithm learns the probability that a report is relevant as a functionof its attributes such as its age and distance. It does so by first identifying theattributes that indicate the relevance. Second, the Naıve Bayes learning methodis used to find a mapping from the attribute values to the probability of a reportbeing relevant.
This paper presents the implementation of the machine learning method for twoVANET applications: parking availability dissemination and travel time dissemi-nation. In the parking application, we assume vehicles are searching for a parkinglocation with the highest chance of being available upon arrival to that location.The relevance is thus defined in terms of probability of availability. Using the park-ing application, we show that the machine learning algorithm successfully combinedspatio-temporal attributes of information in order to calculate the relevance. We doso by evaluating using a simple simulation model for which an analytically derivedfunction exists, which calculates the availability probability [Wolfson et al. 2005].For travel time dissemination, no such analytical functions currently exist, so mostmethods typically rely on heuristics. Simulation results for travel time dissemina-tion show that the machine learning technique achieved better performance than
International Journal of Next-Generation Computing, Vol. 1, No. 1, July 2010.

64 · PIOTR SZCZUREK et al.
the use of individual spatio-temporal attributes or a heuristic based on combinationof the attributes. In the simulated environment the vehicles were able to choosebetter routes and lower their travel times as a result of the use of the proposedtechnique for ranking reports.
2. RELEVANT WORK
Techniques for ranking of information are related to those for cache managementin mobile wireless networks. Work by Datta et al. [2004], Perich et al. [2004],and Zhang et al. [2007] used abstract utility functions which could be definedfor given applications. These can be thought of as a more general form of therelevance function, which our machine learning method instantiates. Other workfor ranking uses a weighted combination of popularity, reliability, and size [Sailhanand Issarny 2002], but authors of this work do not discuss how the weights should bedetermined. In [Zhang 2009] reports are ranked such that the number of replicas ofeach report is proportional to the square root of its access frequency. According to[Cohen and Shenker 2002], such a distribution of replicas has the optimal replicationperformance in minimizing the query cost. However, using access frequency is notalways a suitable solution because access frequency of a newly produced report isalways small but it is the newly produced report that is usually of most interest inVANET applications.
A number of approaches to parking information systems using VANETs currentlyexist. Leontiadis and Mascolo [2007] and Prinz et al. [2009] both propose a methodbased on a publish/subscribe paradigm which could be used for parking. Althoughsuch systems might filter out information which is irrelevant, they do not rank theinformation and they typically rely on the subscribers knowing which informationis relevant. A number of heuristic methods exist for estimating relevancy of parkinginformation. For example, Delot et al. [2009], used an encounter probability as arelevance function, which is estimated based on weighted average of spatio-temporalcharacteristics of the parking information. The authors did not state how theweights should be found. In [Caliskan et al. 2006], the relevance is based on anad-hoc function which is the sum of report age and distance, where the distanceis the time needed for a vehicle to arrive at the given location. The availabilityprobability has been used for relevance by Lu et al. [2009] and Wolfson et al.[2005]. In both, the arrivals of vehicles are modeled by a Poisson process which isassumed to be known by the parking information system.
Information ranking in the context of travel time dissemination has typically re-lied on heuristics. In [Zhong et al. 2008], traffic reports are ranked using a heuristiccomputed based on the sum of the age and distance of a report. The use of machinelearning for estimating relevance in travel time dissemination environments has beenintroduced in [Szczurek et al. 2009]. In this work, simulated scenarios of a traveltime dissemination system are used to generate synthetic training examples, whichare formed by input attributes of age and distance and a Boolean output, based onwhether a report with the given attributes would change a vehicle’s travel path. Itis shown that using only the incoming reports, the learned model could accuratelypredict whether a vehicle’s path would change. The learning was performed offline,after generating all of the synthetic training examples.
International Journal of Next-Generation Computing, Vol. 1, No. 1, July 2010.

Spatio-temporal Information Ranking in VANET Applications · 65
3. MODEL DEFINITIONS
The system consists of a set of mobile nodes. A node is a physical entity capable ofdata computation, storage, and short range wireless communication. A node canalso observe its environment through a sensing device. The sensing device may bea camera installed in the car, an odometer, or GPS. Examples of nodes includevehicles equipped with on-board computers and Wi-Fi.
At any point in time, a node may create a report, which contains the data derivedfrom the sensing device. The data is formed as a fixed set of attributes and theirvalues. An attribute identifies the type of the data value. An example of a reportis a speed report, whose attributes are time and current speed. Other examples ofreports include reports about traffic accidents or available parking spaces.
Every node x carries a reports database of size RRsize. The reports databasecontains reports the node has received or created over time. All the reports havethe same size, although the generalization to variable size is possible. The reportsin the report database are sorted in order, according to a value given by the rank-ing function. The ranking function, Rf, maps every possible report into a ranki.e. number between 0 and 1. It is assumed that higher ranks are given to moreimportant reports for an arbitrary recipient. When it is the case that the reportsdatabase is full, upon insertion and re-ranking, the lowest ranked reports will bediscarded, until all reports can be stored within the given capacity.
Each node n can transmit to and receive from other nodes that are within trans-mission range, denoted Tr. These nodes are called neighbors of n. Every Bi seconds,each node broadcasts Bsize reports to its neighbors. The time between broadcastsis called the inter-broadcast interval and the number of reports that are broadcastis called the broadcast size. The value of Bsize depends on the report size and theavailable bandwidth and can be computed using a bandwidth optimization methodsuch as the one introduced in [Wolfson et al. 2005]. The reports with the highestranking values are sent in each broadcast.
Certain nodes, called feedback nodes, can judge the relevance of a report theyreceive. The relevance represents the expected utility of a report to an arbitraryneighbor of the feedback node. In other words, how useful would the report be tothe recipient? This value is numeric and can be either Boolean or real valued. Incases where nodes assign numeric values, those will be assumed real valued in therange of 0 to 1. When nodes can only judge whether the report was good or bad,the report’s value is Boolean (0 for bad, 1 for good). As an example, consider areport that represents the availability of a parking space. The node (vehicle) canjudge the report as �good�if the parking space remains available when the nodereaches it. The problem in this model is thus to find a ranking function that allowsfor the most relevant reports to be disseminated during every broadcast.
4. METHOD DESCRIPTION
In general, our relevance ranking method works using received reports as an inputto a machine learning process. It is assumed that certain nodes have the abilityto make relevance judgments when they receive a report. Given this, a supervisedlearning algorithm can be used with the judged relevance as the given output. Overtime, each feedback node learns a model that can estimate the probability that a
International Journal of Next-Generation Computing, Vol. 1, No. 1, July 2010.

66 · PIOTR SZCZUREK et al.
report is relevant to an arbitrary recipient, and the model can then be used as aranking function. Feedback nodes disseminate their learned models along with thereports so their learned models are shared with non-feedback nodes.
The model used to estimate the probability that the report will be relevantconsists of two parts: duplication model and conditional relevance model. Theduplication model is used to find the novelty factor, which is the probability thata given report is not a duplicate to (i.e., has not been received by) a neighboringnode. The conditional relevance model estimates the probability that a given reportis relevant to the recipient, assuming the report is new to the recipient (i.e. it is not aduplicate). The rank value of a report R to neighboring node n is the multiplicationof the estimates from both models:
rank(R) = Prob(R is new to a neighboring node n)
× Prob(R is relevant to a neighboring node n, provided it is new to n).
(1)
Note that the separation into duplication and conditional relevance models isnot theoretically necessary, because a duplicate report is automatically not relevant.Therefore a single model could have been used, but experimental testing (not shownin this paper) revealed that using separate models allows for higher performance.
In the next subsection, we first describe the details of the duplication model andthen the conditional relevance model is described in subsection 4.2. Subsection 4.3explains the Naıve Bayes model used for the conditional relevance model and 4.4describes how the conditional relevance models are shared among nodes.
4.1 Duplication Model
The duplication model learns the probability that a sent report would be a dupli-cate. In order to learn this probability, an existing technique called MALENA isused [Xu et al. 2009]. This technique works as follows. For each report r stored ata node n, n maintains a duplication indicator vector (DIV) for r. The DIV consistsof two attributes of r : fin and broadcast age. Fin is the number of times r has beenreceived by n. Intuitively, the higher the fin, the more likely that r is a duplicate,since this means that r has already been widely disseminated by other nodes. Thebroadcast age of report r for node n is the number of broadcasts that have been sentby n since r was last broadcast by n. Intuitively, the higher the broadcast age, theless likely that r is a duplicate, since this means that n has not broadcast r sincea long time ago. When r is transmitted, its DIV is attached to r. A receiver nodem of r checks whether or not r is a duplicate, and the respective DIV becomes atraining example. Specifically, if r is a duplicate, then neg, the number of negativesfor the respective DIV is increased by one. Otherwise, pos, number of positives isincreased by one. Initially, both neg and pos start at zero for all DIVs. Given theDIV, the probability that report will not be a duplicate can be calculated simplyby dividing the number of positives by the sum of positives and negatives.
To calculate the broadcast age of r, n remembers the time of the last broadcastthat includes r. The broadcast age of r is then calculated by dividing the timepassed since the last broadcast of r by the length of the inter-broadcast interval.
International Journal of Next-Generation Computing, Vol. 1, No. 1, July 2010.

Spatio-temporal Information Ranking in VANET Applications · 67
For newly created reports that have never been broadcast, the broadcast age isinfinite. For reports that have been received but not yet broadcast, the broadcastage is defined as zero.
Training examples for the duplication model are created after a node receives aset of reports. In order to detect the duplicate reception, a node n remembers theid’s of all the reports it has ever received. A positive or negative example will becreated for the duplication model depending on whether the node has the id of thereport in its list. All duplicate reports are immediately discarded.
4.2 Conditional Relevance Model
This model assumes that the report that is received has never previously beenreceived. Then the model estimates the probability that the report is relevant to therecipient, which we call the conditional relevance. To provide the necessary trainingdata for learning the relevance model, each report is augmented with additionalattributes related to the sender of the report. Although dependent on the actualapplication, the attributes in spatio-temporal environments would generally dependon time and space. By knowing these attributes, the receiving node can learn themapping from the sender’s and report’s characteristics to the relevance of a report.The receiving node, which would later resend the report, can then estimate therelevance to a future receiver.
For the purpose of learning the conditional relevance model, we use the NaıveBayes online learning. In [Szczurek el al. 2009] the Naıve Bayesian algorithm wasshown to be performing similarly to other machine learning algorithms for relevanceprobability estimation. Additionally, simple and efficient online versions of theNaıve Bayesian algorithm exist. This means the nodes would not have to incur ahigh computational cost for maintaining the relevance model, which is importantin online learning environments.
4.3 Naıve Bayes Learning System
Let x1,x2,...,xk be the values of the X1,X2,...,Xk attributes of a report r. Accordingto the Bayes’s theorem, the probability that r is relevant to the receiver is
P (relevant|x1, x2, ..., xk) =P (relevant).P (x1, x2, ..., xk|relevant)
P (x1, x2, ..., xk)(2)
where
P (x1, x2, ..., xk) = P (relevant).P (x1, x2, ..., xk|relevant)+ P (not− relevant).P (x1, x2, ..., xk|not− relevant)
(3)
Assume that X1,X2,...,Xk are conditionally independent. We have
P (x1, x2, · · · , xk|relevant) = P (x1|relevant)· P (x2|relevant) · ... · P (xk|relevant)
(4)
International Journal of Next-Generation Computing, Vol. 1, No. 1, July 2010.

68 · PIOTR SZCZUREK et al.
P (x1, x2, ..., xk|not− relevant) = P (x1|not− relevant)· P (x2|not− relevant) · ... · P (xk|not− relevant)
(5)
Thus, in order to calculate the probability that r is relevant to its receiver,we need to compute two values: P(relevant) and P(xi|relevant). P(relevant) isestimated to be the ratio between the number of positive examples and the totalnumber of examples. P(xi|relevant) is estimated as follows. For numeric attributes,we assume that values of xi for positive examples follow a normal distribution. Wecollect the mean and variance of the normal distribution from the positive examples.P(xi|relevant) is then estimated using the probability density function of normaldistribution:
P (xi|relevant) =1
σ√
2πe−
(xi−u)2
2σ2 (6)
For nominal attributes, P(xi|relevant) is estimated as the ratio between the numberof positive examples withXi = xi and the total number of positive examples. P(not-relevant) and P(xi|not-relevant) are estimated similarly to their �relevant�counterparts.
4.4 Model Sharing
Since conditional relevance training can only be done by feedback nodes, a modelsharing procedure is used to disseminate the learned models. The procedure worksas follows. When a feedback node n broadcasts its set of reports, it includes withit the learned model Naıve Bayes model, which is based on a set of k trainingexamples. A receiving node then replaces its model with the received one if itis based on more than k training examples. Otherwise, it continues to use itsown model. Since models based on more training examples are more likely to beaccurate, the model sharing procedures allows non-feedback nodes to learn alongwith feedback nodes and for all nodes to improve their conditional relevance modelsover time.
5. APPLICATION TO DISSEMINATION OF PARKING AVAILABILITY
This section will discuss how the online machine learning method can be used ina parking availability dissemination application. The machine learning approach isapplied in order to rank reports with the learned conditional relevance and dupli-cation models. The model is also used to determine which parking spaces a vehicleshould pursue when it receives a report. We show that the method successfullylearns the relevance of reports by comparing it in simulations with a function thatwas proved to be optimal in the given simulated model.
5.1 The Application Environment
5.1.1 Vehicles. The environment consists of a set of vehicles. A subset of thesevehicles is equipped with GPS and devices capable of computation and short-rangewireless communication. The set of vehicles that are equipped we call participatingvehicles, otherwise they are labeled non-participating vehicles. Some of the vehicles
International Journal of Next-Generation Computing, Vol. 1, No. 1, July 2010.

Spatio-temporal Information Ranking in VANET Applications · 69
actively look for available parking spaces. Vehicles that actively look for parking arecalled consumers. Participating vehicles which are not looking for parking are calledbrokers. The feedback nodes in this model are the participating consumers, whilenon-feedback nodes are the brokers. We assume that consumers traverse the roadnetwork around a search path. When a consumer encounters an available parkingspace while traversing the search path, it parks there and makes the parking spaceunavailable for some time.
5.1.2 Parking Availability Reports. When a participating vehicle leaves its park-ing space, it generated a parking availability report. This report stores the followingfields: report identifier, location, and timestamp. The report identifier provides aunique number for each report and is used for duplicate detection. The location isthe coordinates of the parking space given by the GPS. The timestamp is the timeat which the report is produced. Dissemination of reports is done as described inSection 3, with the exception that participating consumers do disseminate reportsabout parking spaces they are pursuing.
All reports are stored in the reports database. Only the most recent reports fora given location are kept. Incoming reports for a location provided by an existingreport are treated as duplicates if their timestamps are the same or older than theexisting report.
5.1.3 Target Parking Space Updates. When a consumer vehicle receives a park-ing availability report, it may choose to deviate from its search path and try toobtain the parking space referenced in the report. Such parking space then be-comes the target parking space for that vehicle. When multiple reports exist, thetarget parking space is chosen according to the ranking function. Each time the ve-hicle receives new (i.e., never previously received) reports, the target parking spacedecision is reevaluated based on current values of the ranking function.
Consumer vehicles park in the first available parking space, regardless whetheror not they are pursuing their target parking space. Therefore, the target parkingspace may never be reached. When it is reached, but it is unavailable at that time,the vehicle continues to search for parking along a search path.
5.2 The Conditional Relevance Model
In this subsection we instantiate the conditional relevance model for the parkingavailability dissemination application.
5.2.1 Relevance Definition. For parking availability dissemination applications,we define being relevant as follows: a parking availability report r received by vehiclev is relevant if the parking space referred to in the report is available when v reachesit. A positive example is hence created when the vehicle parks. Otherwise, if thevehicle reaches the space and it is unavailable, it is a negative example.
Since the relevance model will also be used to decide which parking spaces willbe pursued, the learning of negative examples can be skewed. Additionally, avehicle pursuing a far away parking space will reach its intended target infrequently,because another parking space might be available along the way. This will againskew the learning of negative examples. To deal with this issue, when it is the casethat a vehicle pursuing a target parking space happens to find parking along the
International Journal of Next-Generation Computing, Vol. 1, No. 1, July 2010.

70 · PIOTR SZCZUREK et al.
way, it will generate a positive report with attribute values as if another vehicle hasjust left that space.
5.2.2 Attribute Selection. As in the travel time dissemination application, park-ing availability reports are spatio-temporal in nature. The age and distance arehence included in the conditional relevance model, where age is the time sincereport was created and distance is the time needed to reach the parking space. For-mal justifications for using these attributes for parking applications can be foundin [Wolfson et al. 2005], where the authors prove that under certain conditions, afunction of age and distance is equivalent to the probability that the parking spacewould be available if the vehicle would decide to pursue it.
5.2.3 Training Examples and Model Sharing. Training examples for the dupli-cation model are created by every participating vehicle when they receive a set ofreports. The procedure is the same as for travel time dissemination. Conditionalrelevance training examples are created when a participating consumer reaches thetarget parking space. When a consumer initially chooses its target parking space,the values of age and distance are saved. Once the target space is reached, a positiveor negative example is created depending whether the space is available or unavail-able, respectively. The created example is created using the previously saved ageand distance values and the appropriate relevancy label (i.e. positive or negative).
5.3 Evaluation
In this section we evaluated the machine learning method used in parking avail-ability dissemination. The results will demonstrate that machine learning methodis able to combine age and distance attributes in an optimal way, where optimal isgiven by the equation derived in [Wolfson et al. 2005].
5.3.1 Simulation Method. A custom simulator is used to evaluate the method.In the simulation, vehicles are randomly placed on a grid road network that is 1.2miles by 1.2 miles in area. Distance between subsequent intersections in the gridis 0.1 miles. Available parking spaces are mapped to points at intersections in thegrid. One parking space is assigned to every other intersection, for a total of 36(see figure 1). There are u broker vehicles per square mile of the grid network andc consumer vehicles. Out of the c consumers, w is the fraction of participatingvehicles.
Mobility Model. Vehicles are placed on the grid at random locations. Brokervehicles move about according to a random waypoint mobility model. They gen-erate a random location to be their destination and they traverse to that locationalong the shortest path. Once the destination is reached, another one is chosen.Consumer vehicles move around a set of road segments defined by the search square.The squared is defined such that the side length is 0.4 miles, the vehicle is on oneof the sides with equal probability, and the square is aligned with the grid networksuch that the vehicle is as close to the middle of the side as possible and has atleast one parking space in its path. A participating consumer may leave its searchsquare to pursue its target parking space. In that case, it traverses the shortestpath to the target parking space. The speed, in miles per hour, of every vehicle
International Journal of Next-Generation Computing, Vol. 1, No. 1, July 2010.

Spatio-temporal Information Ranking in VANET Applications · 71
Figure. 1: The grid network, parking spaces, search squares, brokers and consumers.
is chosen randomly from the interval [v-5, v+5], where v is the average speed ofvehicles.
When a consumer vehicle parks at an available parking space, it is removed andanother consumer is placed at the same location with the same search square. Ifthat consumer is participating, the conditional relevance model is inherited fromthe old consumer. The parking space where the old consumer parked becomesunavailable for a random length of time according to an exponential distributionwith mean q.
Simulation Parameters. All the simulation parameters and their values aresummarized in Table I.
Table I: DEFAULT SIMULATION PARAMETERS
Parameter Values
Total number of parking spaces 36
Simulated area 1.2x1.2 sq. miles
Broker density (u) 100 per square mile
Number of consumers (c) 20
Percentage of participating consumers (w) 50�
Transmission range (Tr) 250 meters
Mean vehicle speed (v) 20 mph
Mean of parking unavailability time (q) 20 minutes
Broadcast size (Bsize) 1 report
Inter-Broadcast interval (Bi) 5 seconds
Report database size (RRsize) 36 reports
Total simulation time 20 hours
Learning Model Bootstrapping. Since initially the online learning models donot contain any examples, their performance will be much lower than it potentiallycould be over time. Therefore, we chose to bootstrap the models. This was done
International Journal of Next-Generation Computing, Vol. 1, No. 1, July 2010.

72 · PIOTR SZCZUREK et al.
by running the simulation with default parameters for a total simulation time of 72hours. After this time, the learned duplication and conditional relevance modelsare saved and used as the initial models for all tests.
Ranking Methods. Five ranking methods are compared. For each one, the du-plication model is used to calculate the novelty factor, which is used as a multiplierfor a given ranking function. This is done to focus on the effects of the conditionalrelevance model. The following ranking functions are used (labels in parentheses):
(1) 1/age. (age)
(2) 1/distance. (distance)
(3) e−α.age−β.distance , where α=ϕ, β=ϕ/v, and ϕ=2 · c · v/l, and where c is thenumber of consumers, v is the mean speed of consumers and l is the length ofall road segments in the network. This function is derived in [Wolfson et al.2005] and is part of a method called Information Guided Search. (IGS)
(4) Conditional relevance probability output using the proposed machine learningmethod. (ML)
As in travel time dissemination, the first method (age) ranks solely based onage, while the second method (distance) ranks solely based on distance. The thirdmethod (IGS) is based on an equation derived by Wolfson et al. [2005]. It computesthe probability that a given space is unoccupied given its age and distance undera certain limited model. The model used for deriving the IGS equation assumesarrivals at parking spaces follow a Poisson distribution. The issue with this equationis that it depends on the knowledge of several parameters, such as the number ofconsumers or their mean speed, which would be unknown in a real environment. Ittherefore can be said to represent an ideal benchmark case. The last method (ML)is our proposed machine learning method with age and distance as attributes.
Performance Metric. To compare the different ranking methods, we measuredthe average discovery time for participating consumer vehicles. The discovery timeis the difference in time between when a consumer is created and when it finds anavailable parking space. We then compared this time with the average discoverytime in a case in which every consumer uses a blind search. This means that novehicle is participating and can only find parking spaces that are along its searchpath. The percentage decrease between the blind search time and the given rankingtime is then shown in figures as the percentage improvement in discovery time.
5.3.2 Results. In this section we show the simulation results. 25 tests wereperformed using various parameter values. In each test, a single parameter wasmodified, while keeping the rest at default values. Each ranking method was testedwith and without the use of the novelty factor, which is determined by the duplica-tion model. The average of the percentage improvement in discovery time for eachranking method was calculated and is shown in the figure below.
The figure above shows that machine learning was able to nearly match theperformance of the IGS equation, which was shown to exactly calculate the avail-ability probability. In fact, as will be later shown, in almost every individual test,the discovery time performance closely matched that of IGS. Both methods weresignificantly better than both age and distance rankings. This illustrates that the
International Journal of Next-Generation Computing, Vol. 1, No. 1, July 2010.

Spatio-temporal Information Ranking in VANET Applications · 73
Figure. 2: Average �of discovery time improvement.
proposed method can successfully learn an optimal combination of relevant at-tributes.
Although using distance outperformed using age by a wide margin on average,individual test results showed that distance is not always the best attribute to useand as will be shown later, in 2 out of 25 tests, age is actually superior. The use ofthe novelty factor shows that the duplication model effectively eliminates duplicatereports from being disseminated. The performance of all ranking methods improveswith the use of the novelty factor, although the margin is small. This is because ofthe small number of reports being disseminated. As will be shown later in the traveltime dissemination application, the effects can be much larger when the number ofreports in the system is higher.
Figure. 3(a): Broadcast size
International Journal of Next-Generation Computing, Vol. 1, No. 1, July 2010.

74 · PIOTR SZCZUREK et al.
Figure. 3(b): Number of consumers
Figure. 3(c): Parking unavailability time
Figure. 3(d): Broker density
Effects of Broadcast Size. Figure 3(a) shows the performance of the differentranking methods when varying the broadcast size. The results show that broadcast
International Journal of Next-Generation Computing, Vol. 1, No. 1, July 2010.

Spatio-temporal Information Ranking in VANET Applications · 75
Figure. 3(e): Transmission range
Figure. 3. Percentage of discovery time improvement across varying simulation parameter values.
size generally has no effect on discovery time. This means there is little to gainfrom broadcasting more than one report at a time. Throughout the broadcast sizerange, using age and distance resulted in the lowest improvement on average, with18.3�for distance and -2.7�for age. Machine learning averaged a 29.1�improvement,significantly higher than either age or distance, closely following the performanceof IGS, which averaged 29.9�.
Effects of the Number of Consumers. Figure 3(b) shows the performance ofthe different ranking methods when varying the number of consumers. As the figureshows, the performance of age ranking generally decreases as number of consumersincreases, while distance ranking performance is the opposite. The reason for thisis that with a high number of consumers, the probability of parking availabilityis decreasing throughout and therefore it may not be worth it to pursue far awayparking spaces. This effect was the reason for the general decrease in performancefor all method, with the exception of distance, as the number of consumers increases.
Effects of Parking Unavailability Time. In fig. 3(c), the impact of varyingthe mean of parking unavailability time is shown. Similarly to previous results, MLcame close to the performance of using IGS and outperformed age and distanceby a significant margin. The results show that for distance based rankings (i..e,all but age), the unavailability time does not have much effect on percentage im-provement in discovery time. Age ranking improves performance as the mean timeincreases, because there is less variability in the parking space availability. To seethis, consider an extreme example, in which mean unavailability time is close to 0.In that case, age would no longer matter, since the parking is almost guaranteed tobe available by the time the vehicle arrives. The age hence becomes an irrelevantattribute.
Effects of Broker Density. Broker density affects how quickly informationis disseminated. As a result, it affects ranking performance in two ways. Onone hand, as broker density increases, the speed of dissemination also increasesand this improves performance because vehicles are able to rank based on a greater
International Journal of Next-Generation Computing, Vol. 1, No. 1, July 2010.

76 · PIOTR SZCZUREK et al.
amount of information. On the other hand, the increased information causes greatercompetition among participating consumers, which results in lower performance.This second effect is especially evident for age ranking, as can be seen in fig. 3(d). Athigh densities, most consumers will receive a generated report in a short amount oftime, which will cause all such consumers to pursue the same parking space. Whendistance is used in the ranking method, the effect is mitigated because competitionwill be more localized. Ranking methods which use a combination of age anddistance thus do not have much variance in their performance.
Effects of the Transmission Range. Figure 3(e) shows how performancevaries across a range of transmission range values. Similar to broker density, thisparameter impacts the speed of information dissemination and therefore the twoeffects that affected performance for broker density are present in transmissionrange tests. Unlike broker density, transmission range has a much bigger impacton dissemination, because of its major impact on the communication delay (i.e.difference between generated and received time). As a result, the graphs of IGSand ML show performance follows an �S�shape: very low performance at closetransmission range (50m), high gains in performance in the 100m to 250m range,and marginal improvement at 300m. With distance ranking, the shape of theperformance curve is flatter, but still generally increasing with increased range.Note the slightly erratic behavior of the curve can be attributed to the use of thenovelty factor, which causes some randomness in the dissemination of the reports.Tests (not shown) without novelty factor, show a monotonically increasing curvefor distance ranking. For age, the effect of increased competition causes a decreasein performance after 200m range.
6. APPLICATION TO TRAVEL TIME DISSEMINATION
This section will discuss how the online machine learning method for the estimationof relevance can be used to improve dissemination of vehicle travel times on a roadnetwork. We use the STRAW vehicle simulator and show that the use of machinelearning approach for ranking allows vehicles to lower their average travel timeswhen compared against ranking using heuristics.
6.1 The Application Environment
6.1.1 Vehicles. As in the previous application, the environment consists of aset of vehicles, a subset of which is equipped with GPS and devices capable ofcomputation and short-range wireless communication. Every vehicle traverses aroad network to a predetermined destination, which it reaches along the path withthe shortest travel time, given the information it currently has in its local database.In the rest of this paper, when we say shortest path we refer to the shortest traveltime path. In this model, every participating vehicle is a feedback node.
6.1.2 Travel Time Reports. As each participating vehicle fully traverses a par-ticular road segment, it uses its GPS to record the travel time. This information isthen saved in a travel time report. This report stores the following fields: report androad segment identifiers, travel time, and timestamp. The report identifier providesa unique number for each report and is used for duplicate detection. The roadsegment identifier is used to match the report to a particular road segment. The
International Journal of Next-Generation Computing, Vol. 1, No. 1, July 2010.

Spatio-temporal Information Ranking in VANET Applications · 77
travel time is the time measured by the given vehicle’s GPS. The timestamp is thetime at which the report is produced. Reports are disseminated as described inSection 3.
6.1.3 Digital Map. Each vehicle holds a digital map used for storing informationabout road segments and their travel times. The digital map of a vehicle v is aweighted graph G=<V,E >where V is the set of vertices (intersections) and E is theset of edges (road segments), with the weight of each edge e being the travel timeestimate of e maintained by v. A number of properties are associated with eachroad segment. The properties of road segments that are of interest in this paperare: road segment identifier, road type, travel time estimate, list of k most recentreports pertaining to the segment. The road segment identifier uniquely determinesthe particular road segment in the digital map. Road type indicates the physicalcharacteristics of the particular road segment. There are several types that aredefined (e.g. highways, arterial roads) and each corresponds to a different free-flow travel time on that segment. We call any non-highway segment a city streetsegment. The travel time estimate is the estimated time required to traverse theroad segment. This estimate is calculated as the average travel-time of the k reportsthe vehicle has received or generated with the most recent timestamps.
6.1.4 Travel Time Updates. The following travel time update policy was usedfor the purposes of this paper. For each road segment s, a vehicle keeps a slidingwindow of the k youngest reports (i.e., the reports with the greatest timestamps)it has received in the digital map. In the experiments of this paper k is set to 10.When a report z regarding s is received, z is applied to update the travel time of sas follows. If the timestamp of z is smaller than the least timestamp in the slidingwindow (i.e., z is older than the oldest report in the sliding window), then z isdiscarded. Otherwise, the report in the sliding window with the least timestamp isreplaced by z; the travel time of s is updated to be the average of the reports inthe new sliding window. After the travel time of s is updated, the shortest path isrecalculated. Thus, the shortest path is recalculated for each received report.
6.2 The Conditional Relevance Model
In this subsection we instantiate the conditional relevance model introduced inSection 3.2 in the context of travel time dissemination.
6.2.1 Relevance Definition. In general, a report is relevant if it has an impacton the decisions of the recipient. For travel time dissemination applications, wedefine being relevant as follows: a report r received by vehicle v is relevant if itchanges the shortest path from v′s current location to its destination. A reportthus becomes a positive example if the report changes the shortest path of therecipient vehicle. Otherwise, it is a negative example. In the rest of this subsectionwe complete the instantiation by specifying and justifying the attributes used forlearning the conditional relevance model.
6.2.2 Attribute Selection. Due to the spatio-temporal nature of the travel timereports, the most obvious attributes to include for the conditional relevance modelrelate to time and space. To capture the temporal aspect of the reports we willdefine the age of a report. The age of a report r is the difference, in seconds,
International Journal of Next-Generation Computing, Vol. 1, No. 1, July 2010.

78 · PIOTR SZCZUREK et al.
between the current time and the time at which r was created. To capture thespatial aspect, we introduce a distance measure that will be defined as follows: thedistance of a report r contained by vehicle v with digital map DM about roadsegment rs is the shortest travel time, in seconds, from v′s current location to themid-point of the rs when the weight is the free-flow travel time for every roadsegment in DM.
Now we justify the selection of these attributes. Our justification methodologyis to show that if a report R1 is better than a report R2 on one attribute but is thesame as R2 on the other attributes, then the relevance of R1 is not lower than thatof R2, i.e. the probability that R1 changes a vehicle’s shortest path is not lowerthan that R2 does so. In order to isolate the effect of the duplication model andconcentrate on the conditional relevance model, we assume that neither R1 nor R2
has been previously received by the vehicle. Denote by R.age the age attribute ofa report R, and by R.travel-time the travel time estimate attribute of R.In the following we justify the age attribute. Intuitively, when all attributes arefixed, a younger report is more relevant than an older one. This is because an olderreport is more likely to be older than the oldest report in the sliding window of thecorresponding road segment and therefore is discarded by the travel time updatepolicy. Thus the probability that the older report changes a vehicle’s shortest pathis lower than that the younger one does so. This intuition is formalized by thefollowing theorem.
THEOREM 6.3.2. Consider a vehicle v at a vertex s at time t, and two reports R1
and R2 that pertain to the same edge e of the road network. Assume that R1.travel-time=R2.travel-time, and R1.age <R2.age, and that if v receives the single reportR2 at time t then it changes v’s shortest path. Then if at time t vehicle v receivesthe single report R1 instead of R2, it changes v’s shortest path as well.PROOF. Since R2 changes v’s shortest path, R2 must be younger than the oldestreport in the sliding window of e (otherwise R2 would have been discarded). SinceR1 is younger than R2, R1 must also be younger than the oldest report in the slidingwindow of e and changes v’s shortest path.Theorem 6.3.2 indicates that when the other conditions are fixed, a younger reportis more relevant that an older one. In other words, if a vehicle has R1 and R2 androom to transmit only a single report, then it should transmit R1 instead of R2
because it will be at least as relevant to an arbitrary vehicle v. Due to theorem 1,the ages of reports can be used to rank reports according to their probability ofbeing relevant.
Similarly, it can be shown that under certain conditions, a report with a smallerdistance is more relevant that a report with a longer distance. Intuitively, underuniformity assumptions, if a road segment e is far from a vehicle v, then the prob-ability that the destination of v is beyond e is small, and therefore the probabilitythat v’s shortest path passes e is small. Thus the probability that a report per-taining e changes v’s shortest path is small. In summary, both attributes can besaid to be useful, yet it is not obvious how to combine both attributes to achieve abetter ranking. This is where the machine learning method comes into play.
6.2.3 Training Examples and Model Sharing. Training examples are created us-ing the RelevanceTrain algorithm, given by the following pseudocode:
International Journal of Next-Generation Computing, Vol. 1, No. 1, July 2010.

Spatio-temporal Information Ranking in VANET Applications · 79
Algorithm - RelevanceTrain (Travel Times)Input - R: Set of received reports by vehicle v
Outputs -
Ed: Set of training examples for duplication modelEr: Set of training examples for conditional relevance model
1. Select and remove report r from R in any order.
2. IF r has been previously received by v,
THEN discard r, create negative example and add to Ed, GOTO step 1ELSE Create positive example and add to Ed, GOTO step 1
3. Save the current digital map state and use report r to update the digital
map of v using the previously describe travel time update policy.4. Recompute the shortest travel-time path from the current location of v to
the destination.
IF shortest path changes,THEN create positive example and add to Er
ELSE create negative example and add to Er
5. Restore the digital map state to the previous state (before the travel
time update).6. IF R is not empty, GOTO step 1
The algorithm works by first checking for duplicates. At that point either a pos-itive or negative example will be created for the duplication model. Then, if it isdetermined that the report is not a duplicate, relevance of the report is determinedbased on whether it would change the path of the vehicle. Based on this, a positiveor negative report is created for the conditional relevance model.
After all the reports in R are processed, any reports that were identified as non-duplicate in step 1 are applied to update the digital map of the vehicle. Note thatwhile the example creation procedure does temporarily update the digital map, theupdate is rolled back after the examples are created. This is done so that the orderof examining reports does not affect whether the report will create a positive ornegative example.
For travel time dissemination, it is assumed every vehicle is GPS equipped. Everyvehicle can therefore act as a feedback node. It is hence unnecessary to use modelsharing in this application.
6.3 Evaluation
The purpose of the evaluation is to establish the feasibility of the machine learningmethod. This was accomplished by determining whether the learned model allowedthe vehicles to make better route decisions.
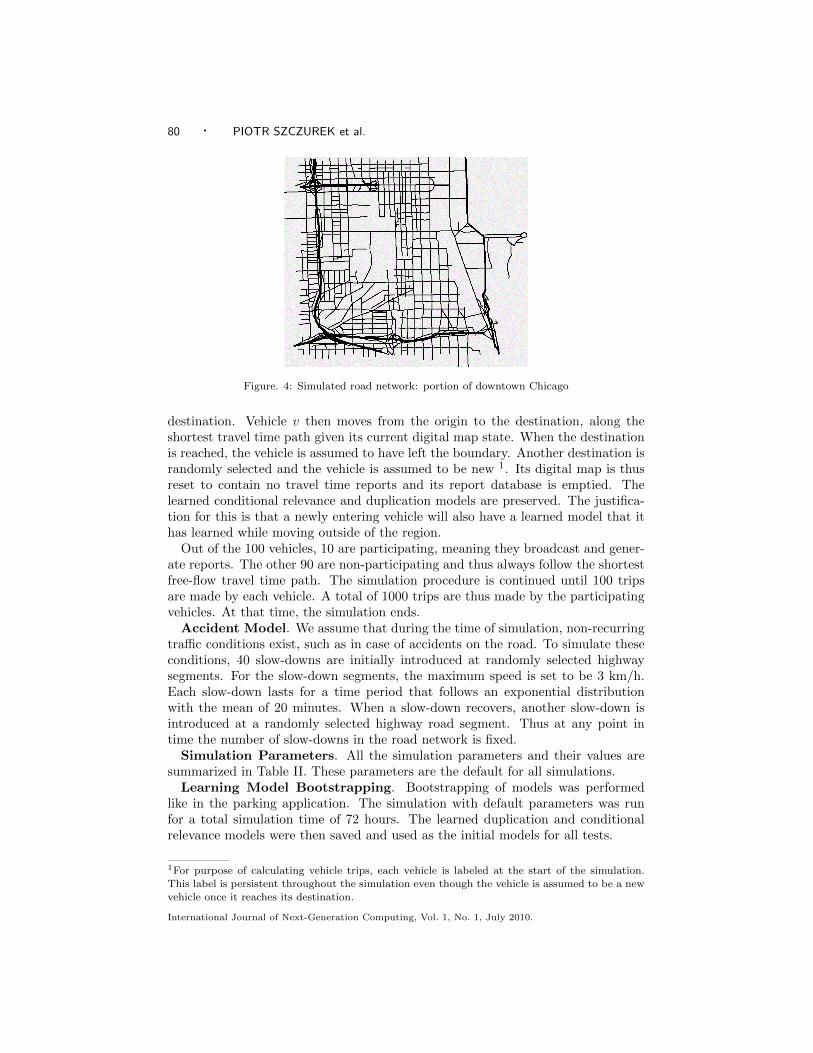
6.3.1 Simulation Method. In order to evaluate the usefulness of the learnedmodel, the STreet RAndom Waypoint (STRAW) simulator [Choffnes and Busta-mante 2005] was used to generate a scenario in which vehicles disseminate traveltime reports periodically. The road network is a 6 km by 4 km region of downtownChicago taken from the digital map published by the Geographic Data TechnologyInc. (see figure 4). 100 vehicles were deployed in the road network.
Mobility Model. An open mobility model is assumed. In this model, vehiclesare assumed to pass through the region, rather than travel within it. Thus eachvehicle v is placed at a random location on the boundary of the road network,and another random boundary location on the road network is selected to be the
International Journal of Next-Generation Computing, Vol. 1, No. 1, July 2010.
80 · PIOTR SZCZUREK et al.
Figure. 4: Simulated road network: portion of downtown Chicago
destination. Vehicle v then moves from the origin to the destination, along theshortest travel time path given its current digital map state. When the destinationis reached, the vehicle is assumed to have left the boundary. Another destination israndomly selected and the vehicle is assumed to be new 1. Its digital map is thusreset to contain no travel time reports and its report database is emptied. Thelearned conditional relevance and duplication models are preserved. The justifica-tion for this is that a newly entering vehicle will also have a learned model that ithas learned while moving outside of the region.
Out of the 100 vehicles, 10 are participating, meaning they broadcast and gener-ate reports. The other 90 are non-participating and thus always follow the shortestfree-flow travel time path. The simulation procedure is continued until 100 tripsare made by each vehicle. A total of 1000 trips are thus made by the participatingvehicles. At that time, the simulation ends.
Accident Model. We assume that during the time of simulation, non-recurringtraffic conditions exist, such as in case of accidents on the road. To simulate theseconditions, 40 slow-downs are initially introduced at randomly selected highwaysegments. For the slow-down segments, the maximum speed is set to be 3 km/h.Each slow-down lasts for a time period that follows an exponential distributionwith the mean of 20 minutes. When a slow-down recovers, another slow-down isintroduced at a randomly selected highway road segment. Thus at any point intime the number of slow-downs in the road network is fixed.
Simulation Parameters. All the simulation parameters and their values aresummarized in Table II. These parameters are the default for all simulations.
Learning Model Bootstrapping. Bootstrapping of models was performedlike in the parking application. The simulation with default parameters was runfor a total simulation time of 72 hours. The learned duplication and conditionalrelevance models were then saved and used as the initial models for all tests.
1For purpose of calculating vehicle trips, each vehicle is labeled at the start of the simulation.This label is persistent throughout the simulation even though the vehicle is assumed to be a new
vehicle once it reaches its destination.
International Journal of Next-Generation Computing, Vol. 1, No. 1, July 2010.

Spatio-temporal Information Ranking in VANET Applications · 81
Table II: DEFAULT SIMULATION PARAMETERS
Parameter Values
Total number of road segments 1562
Simulated area 6x4 sq. km (see fig. 1)
Total number of vehicles 100
Number of participating vehicles 10�
Transmission range (Tr) 250 meters
Number of slow-downs 40 slow-downs randomly among highway segments
Maximum speed at slow-down segments 3km/hour
Mean of slow-down persistence time 20 minutes
Broadcast interval (Bi) 5 seconds
Report database size (RRsize) 100 reports
Broadcast size (Bsize) 10 reports
Total number of trips 1000
Ranking Methods. We compared four different ranking methods:
(1) Ranking by age. (age)
(2) Ranking by distance. (distance)
(3) Ranking by 1/(age+distance). This method was a heuristic used in the Traf-ficInfo method [Zhong et al. 2008]. (TrafficInfo)
(4) Conditional relevance probability output using the proposed machine learningmethod with age and distance as attributes. (online-ML-age-distance)
In addition to the above ranking methods, three baselines were also tested: full-info, non-info, and unlimited-bandwidth. The baselines reflect theoretical upper andlower bound performance. Full-info is an ideal case where vehicles receive all thereports as soon as they are created and thus have the full available information; nobandwidth, memory, or transmission range limitations are considered. Non-info isa case when vehicles do not exchange any information. Unlimited-bandwidth is acase when the report database size is unlimited and the vehicles broadcast every re-port they have ever received or generated. The unlimited-bandwidth baseline showsthe best achievable performance that can be expected in the mobile peer-to-peerenvironment when transmission range and connectedness are the only limitations.The difference between the unlimited-bandwidth and the full-info baselines is thatin unlimited-bandwidth, the reports are disseminated periodically instead of in-stantly and that the dissemination is done within the transmission range of thedisseminating vehicle.
Performance Metrics. Two metrics were used for evaluation. The first is theaverage trip time, which measures the time it takes to reach a destination averagedacross all vehicles and trips. This metric shows how the prioritization scheme affectsthe decision choices of vehicles. Note that because travel times change over time,having more accurate information will not always lead to better route decisions.
To measure the fidelity of the disseminate information that a given rankingmethod will provide, we introduce the average travel-time fidelity metric. Thismetric was collected as follows. Every 10 seconds, for each vehicle, the absolutevalue of the difference between the travel time along the shortest path according to
International Journal of Next-Generation Computing, Vol. 1, No. 1, July 2010.

82 · PIOTR SZCZUREK et al.
vehicle’s current information and the path according to full information digital mapwas calculated. A full information digital map is defined as a digital map which isupdated with every report ever created, as soon as it was created. The differencevalues are then averaged at the end of the simulation.
6.3.2 Using Machine Learning for Combining Attributes. In this section weshow how the machine learning method can be used to combine two attributeswhich are known to be relevant, in order to improve performance.
Figure. 5(a): Broadcast Size
Figure. 5(b): Slow-Downs
Figure 5(a) shows the performance of the different ranking methods when varyingthe broadcast size. As would be expected, the performance of all ranking meth-ods generally improves as broadcast size increases. The machine learning methodmaintains a lead in performance across all broadcast size values. In comparison,the TrafficInfo method of combining the two attributes does not significantly im-prove performance over individual attributes, although it does offer a marginal
International Journal of Next-Generation Computing, Vol. 1, No. 1, July 2010.

Spatio-temporal Information Ranking in VANET Applications · 83
Figure. 5(c): Transmission Range
improvement at small values of broadcast size. A similar result was the case whenthe number of slow-downs and transmission range were varied (see Figures 5(b)and 5(c)). The average travel-time fidelity results were proportional to the averagetravel time results for all ranking methods. A figure showing these results was henceomitted from this paper.
6.3.3 Using Additional Attributes to Improve Performance. Aside from age anddistance, there are also additional attributes that may be used to capture the rele-vance of a report. In this section, we used two additional attributes for the machinelearning: road type and percentage of shortest paths. The road type can be eithera highway or city-street segment, depending on its free-flow travel speed. Given aroad network, RN , a vertex 2 s in RN and a road segment rs, the percentage ofshortest paths (�SP(RN,s,rs)) is the number of shortest paths starting from s toall possible vertices in RN that pass through rs, divided by the total number ofall possible vertices. Figure 4 shows the performance when all four attributes areused for the conditional relevance model. The result using all four attributes islabeled as online-ML-all attributes. As can be seen in fig. 6, the use of additionalattributes provides a significant improvement for average travel time. Additionally,for broadcast size of 40, the performance comes close to the unlimited-bandwidthbenchmark. This means that the online machine learning method provides nearoptimal ranking at that point. As with the previous tests, the average travel-timefidelity results were similar to average travel time results.
7. CONCLUSION
This paper proposed a machine learning approach to ranking of information inVANET applications. The method uses incoming reports in order to provide inputto supervised machine learning algorithms. The learned model reflects the rele-vance of information for the receiving vehicles. Ranked information can be usedto deal with bandwidth issues in VANETs and to aid vehicles in decision making.
2For this paper, we use the midpoints of road segments as possible vertices
International Journal of Next-Generation Computing, Vol. 1, No. 1, July 2010.

84 · PIOTR SZCZUREK et al.
Figure. 6: Comparison between attributes - Broadcast size vs. average travel time.
The method was evaluated using two VANET applications. In the parking avail-ability dissemination application, the method was able to match the performanceof an optimal method in terms of the parking discovery time. For the travel timedissemination application, the results showed that vehicles utilizing the machinelearning method had lower average travel times than when heuristic methods wereused. For both applications, the main advantage of using the proposed techniqueis that several, known to be useful attributes can be easily combined in a way thatimproves the dissemination performance, without extensive knowledge or analysisof the application.
REFERENCES
Caliskan, M., Graupner, D., and Mauve, M. 2006. Decentralized discovery of free parkingspaces. In Proceedings of the 3rd international Workshop on Vehicular Ad Hoc Networks (Los
Angeles, CA, USA, September 29, 2006). VANET ’06. ACM, New York, NY, 30-39.
Choffnes, D. R., and Bustamante, F. E. 2005. An integrated mobility and traffic model
for vehicular wireless networks. In Proceedings of the 2nd ACM international Workshop on
Vehicular Ad Hoc Networks (Cologne, Germany, September 2, 2005). VANET ’05. ACM, NewYork, NY, 69-78.
Cohen, E., and Shenker, S. 2002. Replication strategies in unstructured peer-to-peer networks.SIGCOMM Comput. Commun. Rev. 32, 4 (Oct. 2002), 177-190.
Datta, A., Quarteroni, S., and Aberer, K. 2004. Autonomous Gossiping: a self-organizingepidemic algorithm for selective information dissemination in wireless mobile ad-hoc networks.
In Proceedings of the First International Conference on Semantics of a Networked World.(Paris, France, June 17-19, 2004). ICSNW’04. 126-143.
Delot, T., Cenerario, N., Ilarri, S., and Lecomte, S. 2009. A cooperative reservation pro-tocol for parking spaces in vehicular ad hoc networks. In Proceedings of the 6th international
Conference on Mobile Technology, Application & Systems (Nice, France, September 2-4, 2009).
Mobility ’09. ACM, New York, NY, 1-8.
DSRC. 2003. DSRC ITS Standards Advisory. http :
International Journal of Next-Generation Computing, Vol. 1, No. 1, July 2010.

Spatio-temporal Information Ranking in VANET Applications · 85
//www.standards.its.dot.gov/Documents/advisories/dsrcadvisory.htm. Accessed on Nov.
15, 2009.
Guo, M., Ammar, M. H., and Zegura, E. W. 2005. V3: a vehicle-to-vehicle live video stream-ing architecture. In Proceedings of the Third IEEE international Conference on Pervasive
Computing and Communications (March 8-12, 2005). PERCOM. IEEE Computer Society,Washington, DC, 171-180.
Lee, U., Magistretti, E., Gerla, M., Bellavista, P., and Corradi, A. 2009. Dissemination
and harvesting of urban data using vehicular sensing platforms. IEEE Trans. on Vehicular
Technology. 58, 2 (Feb. 2009), 882-901.
Leontiadis, I., and Mascolo, C. 2007. Opportunistic spatio-temporal dissemination systemfor vehicular networks. In Proceedings of the 1st international Mobisys Workshop on Mobile
Opportunistic Networking (San Juan, Puerto Rico, June 11, 2007). MobiOpp ’07. ACM, New
York, NY, 39-46.
Lu, R., Lin, X., Zhu, H., and Shen, X. 2009. SPARK: a new VANET-based smart parking scheme
for large parking lots. In Proceedings of the 28th Conference on Computer Communications
(Rio de Janeiro, Brazil, April 19-25, 2009). INFOCOM ’09.
Perich, F., Joshi, A., Finin, T., and Yesha, Y. 2004. On data management in pervasivecomputing environments. IEEE Trans. on Knowl. and Data Eng. 16, 5 (May. 2004), 621-634.
Prinz, V., Joshi, A., Eigner, R., and Woerndl, W. 2009. Cars communicating over pub-
lish/subscribe in a peer-to-peer vehicular network. In Proceedings of the 2009 InternationalConference on Wireless Communications and Mobile Computing: Connecting the World Wire-
lessly (Leipzig, Germany, June 21 - 24, 2009). IWCMC ’09. ACM, New York, NY, 431-436.
Sailhan, F., and Issarny, V. 2002. Energy-aware web caching for mobile terminals. In Proceed-
ings of the 22nd international Conference on Distributed Computing Systems (July 02 - 05,2002). ICDCSW. IEEE Computer Society, Washington, DC, 820-825.
Szczurek, P., Xu, B., Lin, J., and Wolfson, O. 2009. Machine learning approach to report
prioritization with an application to travel time dissemination. In Proceedings of the Sec-ond international Workshop on Computational Transportation Science (Seattle, Washington,
November 3, 2009). IWCTS ’09. ACM, New York, NY, 31-36.
Wischhof, L., Ebner A., Rohling, H., Lott, M., and Hlfmann, R. 2003. SOTIS - a self-
organizing traffic information system. In Proceedings of the 57th IEEE Vehicular TechnologyConference (Jeju, South Korea, April 22-25, 2003). VTC ’03. 2442-2446.
Wolfson, O., Xu, B., Yin, H., and Rishe, N. 2005. Resource discovery using spatio-temporal
information in mobile ad-hoc networks. In Proceedings of the 5th International Workshopon Web and Wireless Geographical Information Systems (Lausanne, Switzerland, December
15-16, 2005). W2GIS ’05. 129-142.
Xu, B., Wolfson, O., and Naiman, C. 2009. Machine learning in disruption-tolerant MANETs.
ACM Trans. Auton. Adapt. Syst. 4, 4 (Nov. 2009), 1-36.
Zhang, Y., Hull, B., Balakrishnan, H, and Madden, S. 2007. ICEDB: Intermittently-connected continuous query processing. InProceedings of the 23rd International Conference
on Data Engineering (Istanbul, Turkey, April 15-20, 2007). ICDE ’07. 166-175.
Zhang, Y., Zhao, J., and, Cao, G. 2010. Roadcast: a popularity aware content sharing schemein VANETs. SIGMOBILE Mob. Comput. Commun. Rev. 13, 4 (Mar. 2010), 1-14.
Zhong, T., Xu, B., Szczurek, P., and Wolfson, O. 2008. Trafficinfo: an algorithm for VANET
dissemination of real-time traffic information. In Proceedings of the 15th World Congress on
Intelligent Transport Systems (New York City, NY, November 16-20, 2008).
International Journal of Next-Generation Computing, Vol. 1, No. 1, July 2010.

86 · PIOTR SZCZUREK et al.
Piotr Szczurek is a Ph.D. student at the University of Illinois at Chicago(UIC) in the Computer Science department. His research interests includevehicular ad-hoc networks, machine learning, and database systems. Hereceived his B.S. degree in Computer Science at the University of Illinois atChicago in 2005. In 2006, he received the Integrative Graduate Educationand Research Traineeship (IGERT) to work in the program of ComputationalTransportation Science at UIC.
Bo Xu received his B.S. degree in Computer Science from Beijing Universityof Aeronautics and Astronautics in 1991, and his M.S. and Ph.D. degreesin Computer Science from the University of Electronic Science and Tech-nology of China, in 1994 and 1997 respectively. He is currently pursing aPh.D. degree in the IGERT Computational Transportation Science programin the University of Illinois at Chicago. His research interests include mo-bile database systems and mobile/pervasive computing. He has published56 refereed journal and conference papers in these fields. His papers havereceived over 110 peer citations as of 2007. He received the best paper awardfor “Opportunistic Resource Exchange in Inter-vehicle Ad Hoc Networks”,at the 2004 5th International Mobile Data Management Conference. He isan author of the keynote paper of the Second International Workshop onDatabases, Information Systems, and Peer-to-Peer Computing, and the keynote paper of the 2004IEEE International Conference on Networking, Sensing and Control. He was a recipient of IBMAchievement in Professional Excellence in 1996. He served as a referee for IEEE Transactions onKnowledge and Data Engineering, IEEE Transactions on Parallel and Distributed Systems, GeoIn-formatica, Journal of High Speed Networking, Wireless Networks, Information Sciences, IEEETransactions on Mobile Computing, IEEE Transactions on Vehicular Technology, and IEEE Trans-actions on Intelligent Transportation Systems. He served in program committees for IWCTS’ 08,IWCTS’ 09, Mobile P2P’ 09, and Mobile P2P’10.
Dr. Jie (Jane) Lin is an associate professor in the Department of Civiland Materials Engineering at University of Illinois at Chicago. She holds ajoint appointment with the Institute for Environmental Science and Policy(IESP) at UIC. Lin is on the editorial board of Transportation Research PartA: Policy and Practice. Lins research is focused on transportation studiesof private, freight, and public transportation, ITS applications and policies.Her work has appeared in major journals such as Transportation Science,Transportation, Transportation Research series, Journal of the OperationalResearch Society, Atmospheric Environment and Journal of EnvironmentalManagement. Lin was a recipient of the University of California Trans-portation Center (UCTC) Dissertation Award in 2001 and the UIC Collegeof Engineering Faculty Research Award in 2006 and 2009. Before joiningUIC in 2003, Lin was a post-doctoral fellow with the Harvard UniversityCenter for the Environment, Cambridge, MA. She received her M.S. andPhD degrees in Civil and Environmental Engineering from University of California, Davis.
Ouri Wolfson’s main research interests are in database systems, distributedsystems, and mobile/pervasive computing. He received his B.A. degree inmathematics, and his Ph.D. degree in computer science from Courant In-stitute of Mathematical Sciences, New York University. He is currently theRichard and Loan Hill Professor of Computer Science at the University ofIllinois at Chicago, and an Affiliate Professor in the Department of ComputerScience at the University of Illinois at Urbana Champaign. He is the founderof Mobitrac, a high-tech startup that was acquired by Fluensee Co. in 2006.Most recently he founded Pirouette Software Inc., and currently serves asits President. The company specializes in Mobile Peer-to-Peer software forlocal search. He served as a consultant to Argonne National Laboratory,to the US Army Research Laboratories, to DARPA, and to the Center ofExcellence in Space Data and Information Sciences at NASA. Before joiningthe University of Illinois he has been on the computer science faculty at theTechnion and Columbia University, and he has been a Member of TechnicalStaff at Bell Laboratories.
International Journal of Next-Generation Computing, Vol. 1, No. 1, July 2010.