spatially complete global surface albedos derived from terra/modis data michael d. king, 1 eric g....
TRANSCRIPT

Spatially Complete Global Surface Albedos Spatially Complete Global Surface Albedos Derived from Terra/MODIS DataDerived from Terra/MODIS Data
Michael D. King,Michael D. King,11 Eric G. Moody, Eric G. Moody,1,21,2 Crystal B. Schaaf,Crystal B. Schaaf,33 and and Steven PlatnickSteven Platnick11
11NASA Goddard Space Flight CenterNASA Goddard Space Flight Center22L3-Communications GSIL3-Communications GSI
33Boston UniversityBoston University
Operational MODIS surface albedo data product (MOD43B3/MCD43B3)Operational MODIS surface albedo data product (MOD43B3/MCD43B3)– 0.47, 0.56, 0.67, 0.86, 1.24, 1.64, 2.1 µm , 0.3-5.0, 0.7-5.0, 0.3-0.7 µm0.47, 0.56, 0.67, 0.86, 1.24, 1.64, 2.1 µm , 0.3-5.0, 0.7-5.0, 0.3-0.7 µm– 1 km spatial resolution (sinusoidal projection stored as 10° x 10° tiles)1 km spatial resolution (sinusoidal projection stored as 10° x 10° tiles)– 16-day periodicity (001, 017, …, 353)16-day periodicity (001, 017, …, 353)
LimitationsLimitations– Spatial and temporal gaps due to cloud cover and seasonal snowSpatial and temporal gaps due to cloud cover and seasonal snow
MotivationMotivation– Ancillary input for ground-based (AERONET), airborne, and satellite remote Ancillary input for ground-based (AERONET), airborne, and satellite remote
sensingsensing– Land surface and climate modelingLand surface and climate modeling– Global change research projectsGlobal change research projects

Conditioned MOD43B3 Albedo MapsConditioned MOD43B3 Albedo Maps = 0.858 µm = 0.858 µm

IGBP Ecosystem Classification (MOD12Q1)IGBP Ecosystem Classification (MOD12Q1)
0 Water0 Water
5 Mixed Forests5 Mixed Forests
6 Closed Shrublands6 Closed Shrublands
11 Permanent Wetlands11 Permanent Wetlands
12 Croplands12 Croplands
1 Evergreen Needleleaf Forest1 Evergreen Needleleaf Forest
2 Evergreen Broadleaf Forest2 Evergreen Broadleaf Forest
3 Deciduous Needleleaf Forest3 Deciduous Needleleaf Forest
4 Deciduous Broadleaf Forest4 Deciduous Broadleaf Forest
7 Open Shrublands7 Open Shrublands
8 Woody Savannas8 Woody Savannas
9 Savannas9 Savannas
10 Grasslands10 Grasslands
13 Urban and Built-Up13 Urban and Built-Up
14 Cropland/Natural Veg. Mosaic14 Cropland/Natural Veg. Mosaic
15 Snow and Ice15 Snow and Ice
16 Barren or Sparsely Vegetated16 Barren or Sparsely Vegetated

GrasslandsGrasslands7.30%7.30%
Equal Area IGBP Ecosystem Classification Equal Area IGBP Ecosystem Classification StatisticsStatistics
Evrg. Broad ForestEvrg. Broad Forest10.38%10.38%
Evrg. Needle ForestEvrg. Needle Forest4.19%4.19%
Barren / DesertBarren / Desert13.00%13.00%
UrbanUrban0.17%0.17%
Crop MosaicCrop Mosaic3.34%3.34%
Permanent SnowPermanent Snow11.31%11.31%
CroplandCropland10.09%10.09%
WetlandsWetlands0.33%0.33%SavannaSavanna
6.63%6.63%
Woody SavannaWoody Savanna6.32%6.32%
Open ShrubsOpen Shrubs18.86%18.86%
Closed ShrubsClosed Shrubs0.63%0.63%
Other VegOther Veg13.93 %13.93 %
Mixed ForestMixed Forest4.85%4.85% Decd. Broad ForestDecd. Broad Forest
1.19%1.19%Decd. Needle ForestDecd. Needle Forest
1.40%1.40%

Compute regional ecosystem statisticsCompute regional ecosystem statistics– 0.5°, 1-5°, 10°, 10°x20°, 10°x30° box sizes0.5°, 1-5°, 10°, 10°x20°, 10°x30° box sizes
Obtain pixel-level and regional ecosystem statistical Obtain pixel-level and regional ecosystem statistical phenological trendsphenological trends– Curves will have different magnitudesCurves will have different magnitudes– Shapes will be consistentShapes will be consistent
Impose shape of curves onto pixel level dataImpose shape of curves onto pixel level data– Only 10-15% of pixels have adequate coverage to obtain phenologyOnly 10-15% of pixels have adequate coverage to obtain phenology– Maintains pixel level detail with appropriate phenologyMaintains pixel level detail with appropriate phenology
Select curve that has best representationSelect curve that has best representation– Representation of existing pixel dataRepresentation of existing pixel data– Completeness of trendCompleteness of trend– Bias towards smaller statistical box sizesBias towards smaller statistical box sizes
Fill missing values with selected curveFill missing values with selected curve
General MethodologyGeneral Methodology

Phenological Curves for Deciduous Broadleaf Phenological Curves for Deciduous Broadleaf ForestForest
Vermont, USAVermont, USAPhenological Phenological
CurvesCurves
Phenological Phenological Curves with Offset Curves with Offset
AppliedApplied

Continental United StatesContinental United StatesJuly 12-27, 2002July 12-27, 2002

Cloud and snow cover obscure full decay stateCloud and snow cover obscure full decay state Over hemisphere average of high latitudesOver hemisphere average of high latitudes
– Unique ecosystem and wavelength extrema percent changeUnique ecosystem and wavelength extrema percent change– Compute % change from pixels with adequate representationCompute % change from pixels with adequate representation
For each pixel/statistical curveFor each pixel/statistical curve– Pin winter endpoints with value computed fromPin winter endpoints with value computed from
Percent changePercent change Summer extremaSummer extrema
Then apply General MethodologyThen apply General Methodology
Seasonal Snow MethodologySeasonal Snow Methodology

Phenological Curve for Mixed ForestPhenological Curve for Mixed ForestNorthern RussiaNorthern Russia

Europe and Western AsiaEurope and Western AsiaDecember 3-18, 2002December 3-18, 2002

Clouds obscure trends over large regionsClouds obscure trends over large regions– Usually full growth stage is obscuredUsually full growth stage is obscured– Even 10°x30° boxes may not observe complete temporal trendEven 10°x30° boxes may not observe complete temporal trend
Compute 1 statistical curve per ecosystem classCompute 1 statistical curve per ecosystem class– 5°-15° Latitude belts5°-15° Latitude belts
Centered around pixel’s latitudeCentered around pixel’s latitude
– Yearly phenological behavior curvesYearly phenological behavior curves Instead of 2 half year curvesInstead of 2 half year curves
Impose shape of curve onto existing pixel dataImpose shape of curve onto existing pixel data
Persistent Cloud MethodologyPersistent Cloud Methodology

Missing SeasonMissing SeasonAsian MonsoonAsian Monsoon
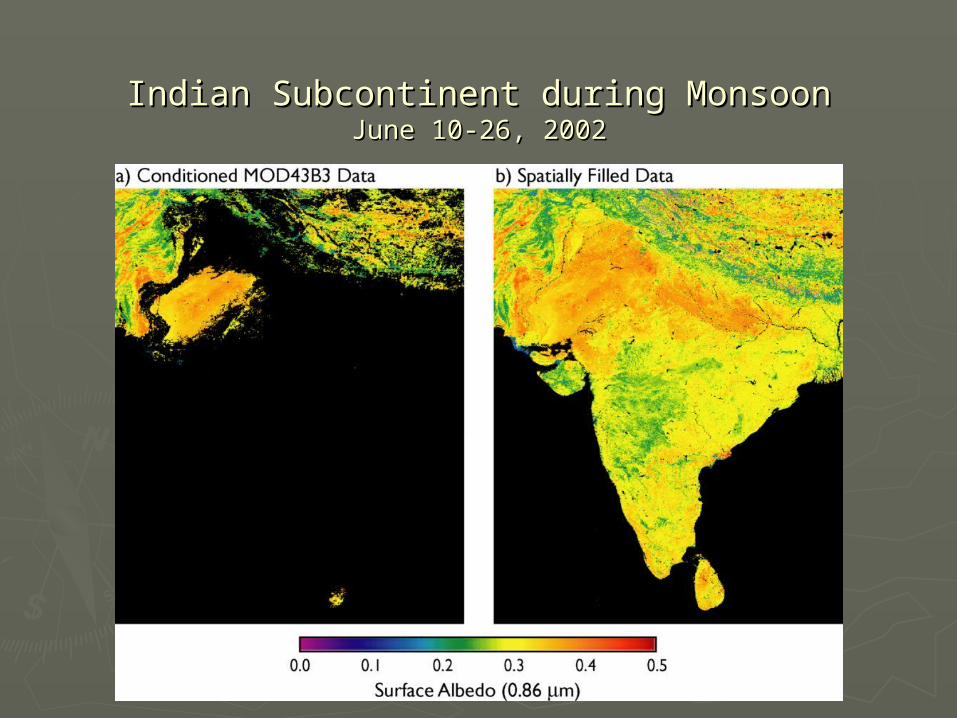
Indian Subcontinent during MonsoonIndian Subcontinent during MonsoonJune 10-26, 2002June 10-26, 2002

Limited Yearly Data Limited Yearly Data Tropical CloudinessTropical Cloudiness

South America during Rainy SeasonSouth America during Rainy SeasonJune 10-26, 2002June 10-26, 2002

Africa in the Presence of Persistent CloudsAfrica in the Presence of Persistent CloudsDecember 3-18, 2002December 3-18, 2002

Spatially Complete Albedo MapsSpatially Complete Albedo Maps = 0.858 µm = 0.858 µm

Spectral Variability by Ecosystem ClassSpectral Variability by Ecosystem ClassJune 26 - July 11, 2001June 26 - July 11, 2001

Temporal Variability by Ecosystem ClassTemporal Variability by Ecosystem ClassJanuary - July 2001January - July 2001
Cropland Cropland EcosystemEcosystem
Urban EcosystemUrban Ecosystem

2001-2005 (v4) spatially complete albedo maps2001-2005 (v4) spatially complete albedo maps– Maps and QA stored in 1-minute rectangular coordinatesMaps and QA stored in 1-minute rectangular coordinates– First seven MODIS wavelengths and 3 broadbandFirst seven MODIS wavelengths and 3 broadband– White- and black-sky albedo valuesWhite- and black-sky albedo values
2001-2005 (v4) statistics of filled albedo maps2001-2005 (v4) statistics of filled albedo maps– 0.5°, 1°, 2°, 3°, 4°, 5°, 10° box sizes0.5°, 1°, 2°, 3°, 4°, 5°, 10° box sizes– Statistics computed in boxes and by ecosystem class in boxesStatistics computed in boxes and by ecosystem class in boxes
Statistics of snow albedosStatistics of snow albedos– Hemispheric averages of MOD43B3 validated dataHemispheric averages of MOD43B3 validated data
IGBP ecosystem classification mapIGBP ecosystem classification map– Maps and QA stored in 1-minute rectangular coordinatesMaps and QA stored in 1-minute rectangular coordinates
Available ProductsAvailable Products

Land Surface Albedo Data DistributionLand Surface Albedo Data Distribution
modis-atmos.gsfc.nasa.govmodis-atmos.gsfc.nasa.gov
Acquiring dataAcquiring data– Anonymous FTPAnonymous FTP
Via websiteVia website Direct linkDirect link
– AvailableAvailable Albedo mapsAlbedo maps Albedo QA mapsAlbedo QA maps Albedo statisticsAlbedo statistics Ecosystem mapEcosystem map Snow albedo Snow albedo
statisticsstatistics NDVINDVI Images and moviesImages and movies

Used near real-time ice and snow extent (NISE) datasetUsed near real-time ice and snow extent (NISE) dataset– Distinguishes land snow and sea ice (away from coastal regions)Distinguishes land snow and sea ice (away from coastal regions)– Identifies snowIdentifies snow
Projected onto an equal-area 1’ angle gridProjected onto an equal-area 1’ angle grid
Aggregate snow albedo from MOD43B3 productAggregate snow albedo from MOD43B3 product– Surface albedo flagged as snowSurface albedo flagged as snow
Aggregate only snow pixels whose composite NISE snow type is >90% Aggregate only snow pixels whose composite NISE snow type is >90% and flagged as snow in any 16-day period and flagged as snow in any 16-day period
– Hemispherical multiyear statisticsHemispherical multiyear statistics Separate spectral albedo by ecosystem (MOD12Q1)Separate spectral albedo by ecosystem (MOD12Q1)
Results represent ‘average’ snow conditionsResults represent ‘average’ snow conditions– Additional sources of variability include snow depth, snow age, Additional sources of variability include snow depth, snow age,
grain size, contamination (soot), and, in the case of black-sky grain size, contamination (soot), and, in the case of black-sky albedo, solar zenith anglealbedo, solar zenith angle
Spectral Albedo of SnowSpectral Albedo of Snow
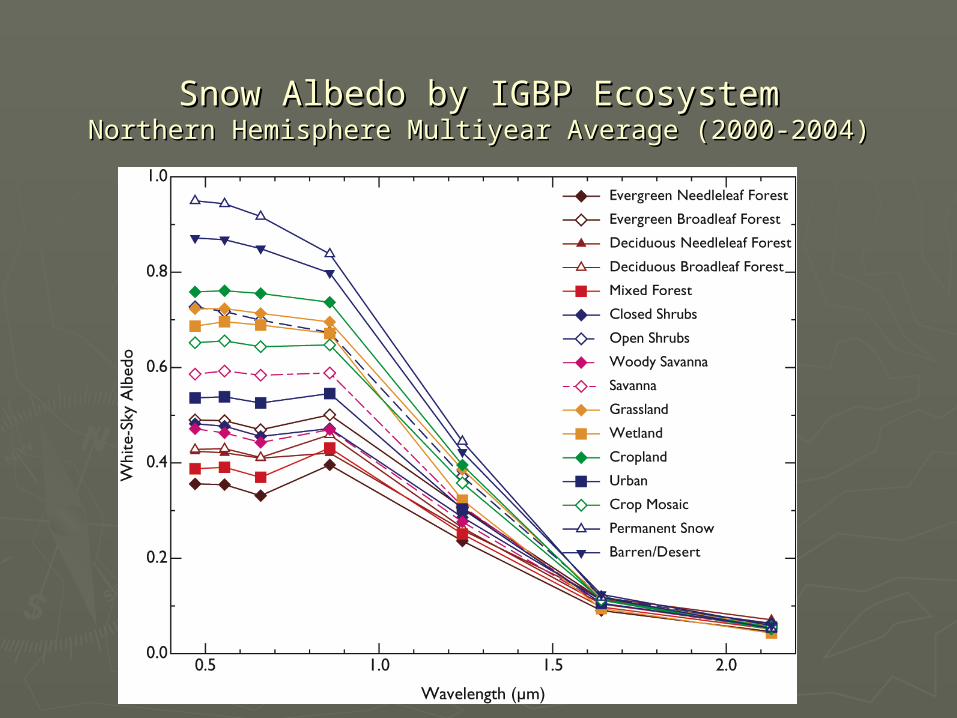
Snow Albedo by IGBP EcosystemSnow Albedo by IGBP EcosystemNorthern Hemisphere Multiyear Average (2000-2004)Northern Hemisphere Multiyear Average (2000-2004)

Spatially Complete White-Sky AlbedoSpatially Complete White-Sky AlbedoJanuary 1-16, 2002January 1-16, 2002
0.60.6
0.80.8
0.00.0
0.20.2
Su
rface
Alb
edo (
0.8
6 µ
m)
Su
rface
Alb
edo (
0.8
6 µ
m)
0.40.4
Snow-freeSnow-free
Snow-Snow-coveredcovered

Spatially complete surface albedo datasets have been generatedSpatially complete surface albedo datasets have been generated– Uses high-quality operational MODIS surface albedo datasetUses high-quality operational MODIS surface albedo dataset– Imposes phenological curve and ecosystem-dependent variability Imposes phenological curve and ecosystem-dependent variability – White- and black-sky albedos produced for 7 spectral bands and 3 White- and black-sky albedos produced for 7 spectral bands and 3
broadbandsbroadbands See See modis-atmos.gsfc.nasa.gov modis-atmos.gsfc.nasa.gov for data access and further for data access and further
descriptions, anddescriptions, and– Moody, E. G., M. D. King, S., Platnick, C. B. Schaaf, and F. Gao, 2005:
Spatially complete global spectral surface albedos: Value-added datasets derived from Terra MODIS land products. IEEE Trans. Geosci. Remote Sens., 43, 144-158.
Spectral albedo of snowSpectral albedo of snow– Hemispheric averages of MOD43B3 validated dataHemispheric averages of MOD43B3 validated data– Separated by ecosystem class and NISE classificationSeparated by ecosystem class and NISE classification– Additional variability due to snow depth, age, grain size, and Additional variability due to snow depth, age, grain size, and
contamination not accessible from MODIS data alone, and hence not contamination not accessible from MODIS data alone, and hence not incorporatedincorporated
Summary and ConclusionsSummary and Conclusions