spatial variations in micronekton distribution off eastern
TRANSCRIPT

Spatial variations in micronekton distribution off eastern Australia from nets and acoustics
Jock Young, Alistair Hobday, Tim Ryan and Brian Griffiths
CSIRO Marine Research
Acknowledgements: FRDC, National Facility Steering Committee, CSIRO Pelagic Fisheries and Ecosystems program; PFRP, Hawaii

Overview of the fishery
swordfish
yellowfin
bigeye
(striped marlin)
Bycatch ~100 spp.
May 1996
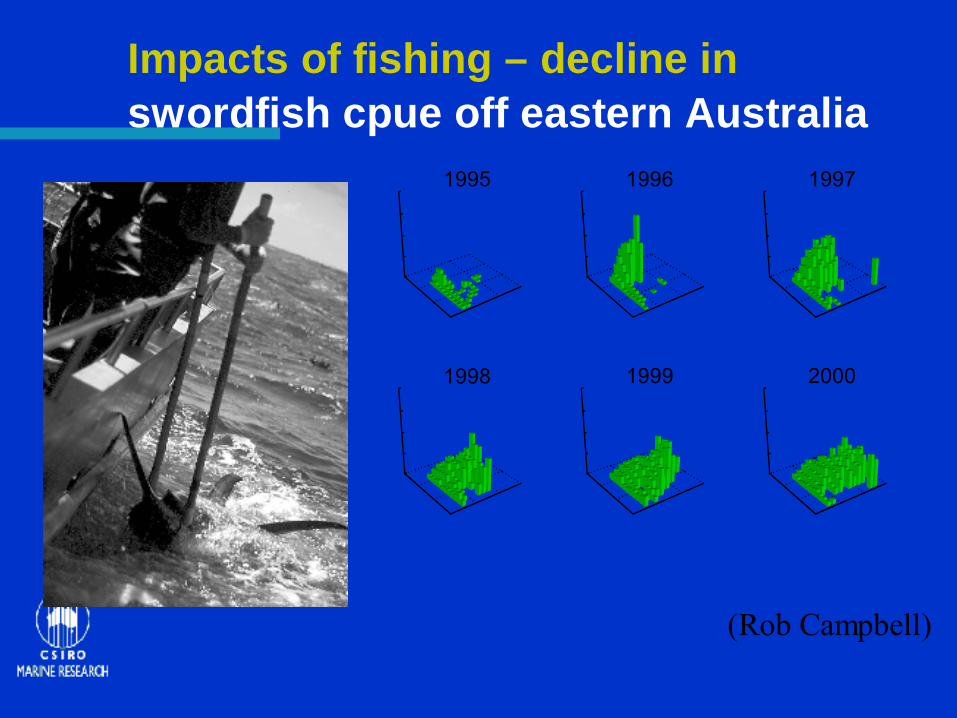
Impacts of fishing – decline in swordfish cpue off eastern Australia
1995 1996 1997
1998 1999 2000
(Rob Campbell)

Background
• Ecosystem characterization of longline fishing waters off eastern Australia (Young, Hobday, Dambacher) FRDC project
Broadbillswordfish
Yellowfin tuna Bigeye tuna Striped marlin
Fishing
Mahi mahi Escolar pomfrets
Sharks
squid mackerel Juvenile turtles sunfish
myctophids
microcrustacea
Juv. squid Jelly fish
algaephytoplankton
macrocrustacea

Objectives• Characterize the physical and biological environment
of the main fishing areas of the Eastern Tuna and Billfish fishery
– Distribution of primary and secondary production
– Distribution of top predators (ongoing)
– Trophic links (sample collection underway)
– Development of qualitative and quantitative models
– Input to management

Methods
Research voyage Sep 2004
• CTD casts
• primary productivity incubations
• acoustics (EK 500 and Fat buoy (in situ target strength))
• Replicate net sampling at discreet depths
• independent longline sampling – tagging using satellite and archival tags
• Stomach collections from AFMA observers

Area 1
Area 2 - Bri ttan ia Seamount
Voyage track showing main study areas
Inshore fishery
Britannia Seamount
Offshore fishery (LHR)

3-D plot of seabed topography off eastern Australia with voyage track overlaid

Map of study area showing main sampling areas overlaid on seabed topography
inshore
seamount
Lord Howe Rise

Temperature, salinity and fluorescence for inshore (Area 1), Britannia Seamount (Area 2) and Lord Howe Rise (Area 3) in September 2004
• West to east cooling away from EAC
• Increasingly saline
• Higher Chl
inshore
seamount
Lord Howe Rise

Water masses sampled
Webb, D.J., 2000: Journal of Physical Oceanography, 30 (4), 706-720
1 2 3

Chl a for September 2004 (Modis – accessed from SDODE)
.59.31 .91
.26*
* Net primary production (grams C m-2 d-1)
?

Fluorescence casts
Britannia Seamount Lord Howe Rise
.91.26*
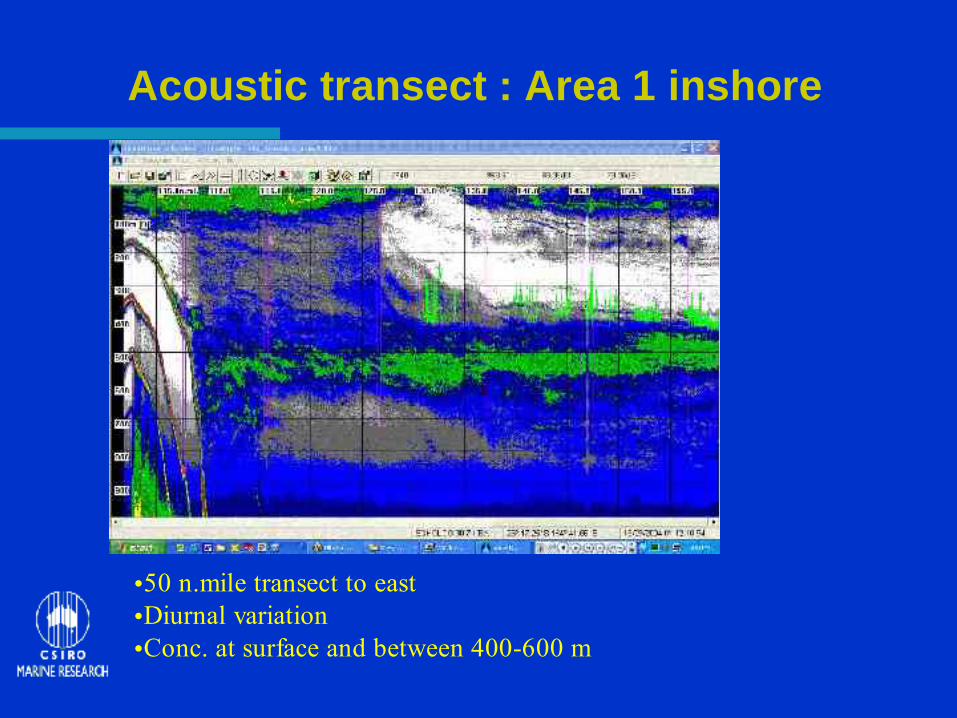
Acoustic transect : Area 1 inshore
•50 n.mile transect to east•Diurnal variation•Conc. at surface and between 400-600 m

Britannia Seamount
Concentrations at bw 400-700 m at edge of seamount

On route from Area 2 to Area 3 showing diurnal movement of DSL
duskdawn

Comparison of echograms at 38kHz recorded during midoc trawls for the three study areas (1-4, inshore; 5-9, seamount; 10-15, offshore)
inshore
seamount
Lord Howe Riseinshore
seamount
Lord Howe Rise

Area 1 (Inshore). 38kHz echogram and summary echointegration for duration of Midoc 3 with net depths and trigger times overlaid.
Ave
rage
SA
valu
es p
er
100
met
re in
tegr
atio
n la
yer Net 1
Net 2
Net 3
Net 4
Net 5
Net 6
Net 2 Net 3
Net 4 Net 5
Net 6
17th September 2004 18:26h to 21:08h (local).Screen gain is -78dB0 1000 2000

Britannia Seamount: 38kHz echogram and summary echointegration for duration of Midoc 5 with net depths and resulting catch overlaid..
Ave
rage
SA
valu
es p
er
100
met
re in
tegr
atio
n la
yer
Net 1
Net 2
Net 3
Net 4
Net 5 Net 6
19th Sept 2004 19:47h to 22:05h. (local). Screen gain is -78dB
Net 2 Net 3 Net 5 Net 6Net 4
0 1000 2000

Net 6 (shallow)
Mainly C. warmingii
Juvenile squid
Crustacea – mix of speciesOplophorus, Acanthephyra, Sergestes spp.,
Sternoptychidae

Net 2 (deep)
Sternoptychidae
Myctophidae Crustacea – mix of speciesAcanthephyra, GennadasSergestes spp.,
Juvenile squid

Trawl (midoc)net (6=shallow) %nSpecies Area 1 Area 2 Area 3Astronesthidae 0.4 0.0 0.0Bathylagidae 0.0 0.0 0.0Dalatiidae 0.0 0.0 0.0Melamphaidae 0.4 0.0 0.0Myctophidae 99.3 93.5 98.3Bolinichthus spp. 2.1 0.0 0.0Ceratoscopelus warmingii 37.2 26.5 86.4Diaphus brachycephalus 0.0 15.2 0.1Diaphus meadi 1.1 0.0 0.0Diaphus metoplocampus 7.8 0.0 0.2Diaphus fragilis 0.0 11.8 0.0Diaphus garmani 2.1 0.0 0.0Diaphus hudsoni 0.7 0.0 0.0Diaphus mollis 0.7 2.7 0.1Diaphus perspicillatus 0.0 0.0 3.2Diaphus termophilus 0.0 3.5 1.2Diaphus watersii 0.0 0.0 0.7Diaphus spp. 0.0 2.3 0.0Electrona risso 0.0 0.7 0.2H. hygomii 22.7 2.4 2.7Lampadena luminosa 1.8 0.0 0.0Lampanyctus spp 2.1 8.3 0.6Lampichthys procerus 0.0 0.9 2.5Myctophum nitidulum 0.4 0.0 0.0Myctophum phengodes 0.0 0.0 0.0Notoscopelus caudispinosus 0.0 0.0 0.0Scopelopsis multipunctatus 0.0 7.1 0.0Symbolophorus rufinus 2.8 0.4 0.0unid. Myctophids 17.7 8.1 0.0Gonorhynchus greyii 0.0 1.2 0.0STOMIIFORMES 0.0 0.0 0.0Photichthyidae 0.0 0.0 0.0Chauliodus 0.0 0.3 0.0Polymetme corythaeola 0.0 0.0 0.0Ichthyococcus spp. 0.0 0.1 0.0Diplophos rebainsi 0.0 0.1 0.0Gonostoma 0.0 0.0 0.0Polyipnus 0.0 0.1 0.0Sternoptychidae 0.0 1.6 0.0Vinciguerria attenuata 0.0 2.8 1.8Argyropelacus 0.0 0.1 0.1Howella sherbonii 0.0 0.1 0.0Persparsia kopua 0.0 0.0 0.0Leptocephalus 0.0 0.0 0.0Trachurus spp. 0.0 0.0 0.0
Species composition of inshore (1),seamount (2) and offshore (3) areas
•Dominance of C. warmingii, particularly in area 3•H. hygomii in inshore waters

Biomass of taxa from individual depth strata combined for all areas
• 0-100 m smaller size classes dominate, particularly myctophids
• 200-300 m wider mix of species
• 300-400m increase in larger sized species
• 400 m+ increasing presence of DSL in daytime tow

Variation in vertical distribution by taxa
• Myctophids, gelatinous zooplankton higher biomass in surface waters, particularly offshore
• Cephalopods poorly represented
• Stomiatoid fishes (e.g. Cyclothone spp) in deeper waters
• Crustaceans concentrated in deeper water around seamount

Acoustic “biomass”: Comparison of echo strength recorded during each midoc tow
Nautical area scattering coefficient (NASC) units are:m^2 nmi -2 , i.e. meters squared per nautical mile squared
0.00 200.00 400.00 600.00 800.00 1000.00 1200.00 1400.00 1600.00
-54
-150
-250
-350
-450
-550
-650
-750
-850
-950
Dep
th (m
)NASC Value
M1
M2
M3
M4M5
M6
M7
M8
M9M10
M11
M12
M13
M14M15
m17

Mean night time backscatter ( NASC) by 100 m depth bins (from eighteen two-hour night-time tows)
0 200 400 600 800 1000 1200 1400
-54
-150
-250
-350
-450
-550
-650
-750
-850
-950
dept
h (m
)
NASC value • Significantly higher NASC values in epipelagic zone
Nautical area scattering coefficient (NASC) units are:m^2 nmi -2 , i.e. meters squared per nautical mile squared

Mean NASC values compared between sites and depths
inshore
seamount
offshore
(ns)

Acoustic backscatter compared over seamount – new moon v full moon
0.0 500.0 1000.0 1500.0 2000.0
1
3
5
7
9
N A S C V a lu e
full moonnew moon
0
200
400
600
800
1000
1200
1400
1600
1800
1 2new moon v full moon
biom
ass
g we
t weig
ht
• difference in vertical distribution but no difference in biomass

Comparison between actual and acoustic
biomass
0 500 1000 1500 2000 2500
-50
-150
-250
-350
-450
dept
h (m
)
Biomass (+ 1 SD, gm)
0 200 400 600 800 1000 1200 1400
-54
-150
-250
-350
-450
-550
-650
-750
-850
-950
depth
(m)
NASC value

Comparison of NASC values with actual biomass of catch
y = 0.9986x + 417.96R2 = 0.9406
400
600
800
1000
1200
1400
0 200 400 600 800 1000
Biomass (g)
NA
SC v
alue
r2 = 0.94

Ongoing studies
• Calibrating echograms to actual biomass through target strength studies (fat buoy)
• Linking micronekton distributions to top predators
• Gut contents analysis (conventional and stable isotopes)
• Distribution of top predators

Movements of blue sharks tagged during SS0904
Toby Patterson, Thor Carter