spatial variation in aboriginal and torres strait islander
TRANSCRIPT

Stronger evidence,better decisions,improved health and welfare
Stronger evidence, better decisions, improved health and welfare
This report examines spatial variation in Aboriginal and Torres Strait Islander women’s access to hospitals with public birthing units and 3 other types of maternal health services. It also investigates possible high-level associations between access, maternal risk factors and birth outcomes.
aihw.gov.au
Spatial variation in Aboriginal and Torres Strait Islander women’s access to 4 types of maternal health services


Australian Institute of Health and Welfare Canberra
Cat. no. IHW 187
Spatial variation in Aboriginal and Torres Strait Islander women’s access to 4 types of maternal health services

The Australian Institute of Health and Welfare is a major national agency whose purpose is to create authoritative and accessible information and statistics that inform decisions and improve the health and welfare of all Australians.
© Australian Institute of Health and Welfare 2017
This product, excluding the AIHW logo, Commonwealth Coat of Arms and any material owned by a third party or protected by a trademark, has been released under a Creative Commons BY 3.0 (CC-BY 3.0) licence. Excluded material owned by third parties may include, for example, design and layout, images obtained under licence from third parties and signatures. We have made all reasonable efforts to identify and label material owned by third parties.
You may distribute, remix and build upon this work. However, you must attribute the AIHW as the copyright holder of the work in compliance with our attribution policy available at <www.aihw.gov.au/copyright/>. The full terms and conditions of this licence are available at <http://creativecommons.org/licenses/by/3.0/au/>.
A complete list of the Institute’s publications is available from the Institute’s website <www.aihw.gov.au>. ISBN 978-1-76054-238-2 (PDF) ISBN 978-1-76054-239-9 (Print)
Suggested citation Australian Institute of Health and Welfare 2017. Spatial variation in Aboriginal and Torres Strait Islander women’s access to 4 types of maternal health services. Cat. no. IHW 187. Canberra: AIHW.
Australian Institute of Health and Welfare Board Chair Director Mrs Louise Markus Mr Barry Sandison
Any enquiries relating to copyright or comments on this publication should be directed to: Australian Institute of Health and Welfare GPO Box 570 Canberra ACT 2601 Tel: (02) 6244 1000 Email: [email protected]
Published by the Australian Institute of Health and Welfare
This publication is printed in accordance with ISO 14001 (Environmental Management Systems) and ISO 9001 (Quality Management Systems). The paper is sourced from sustainably managed certified forests.
Please note that there is the potential for minor revisions of data in this report. Please check the online version at <www.aihw.gov.au> for any amendments.

iii
Contents Acknowledgments ................................................................................................................ v
Abbreviations ...................................................................................................................... vi Summary ............................................................................................................................. vii 1 Introduction ................................................................................................................... 1
Background ..................................................................................................................... 1
Role of services ............................................................................................................... 3
Structure of the report ...................................................................................................... 5
2 Methodology .................................................................................................................. 6
Types of services............................................................................................................. 6
Geographic level of analysis ............................................................................................ 8
Methods: spatial accessibility ........................................................................................ 13
Data sources ................................................................................................................. 14
3 Service accessibility ................................................................................................... 20
Birthing units .................................................................................................................. 20
Spatial accessibility of antenatal and postnatal services ................................................ 24
4 Associations between access to services, maternal risk factors and birth outcomes ..................................................................................................................... 35
Descriptive statistics ...................................................................................................... 35
Statistical analyses ........................................................................................................ 36
Additional analyses ........................................................................................................ 38
5 Conclusion ................................................................................................................... 42
Importance of factors in addition to access affecting the use of antenatal care .............. 42
Importance of the content of antenatal care ................................................................... 42
Limitations ..................................................................................................................... 43
Future work ................................................................................................................... 43
Appendix A: Detailed methods ......................................................................................... 44
Geocoding of service locations ...................................................................................... 44
Population centroids ...................................................................................................... 44
Manual adjustment of area centroids ............................................................................. 45
Calculating drive times from population centroid-to-service locations ............................ 45
Proportion of SA2 population within a 1 hour drive time of nearest service location ....... 46
Concordance of perinatal data to IREG/PHN ................................................................. 46
Proportion of IREG/PHN populations within a 1 hour drive time of nearest service location .......................................................................................................................... 46

iv
Appendix B: PHN results .................................................................................................. 48
Descriptive statistics ...................................................................................................... 48
Statistical analyses ........................................................................................................ 48
Glossary .............................................................................................................................. 50
References .......................................................................................................................... 52
List of tables ....................................................................................................................... 54
List of figures ..................................................................................................................... 55
Related publications .......................................................................................................... 56

v
Acknowledgments The work in this report was undertaken by staff from the Indigenous Spatial Analysis and Health Services Unit of the Indigenous and Maternal Health Group at the Australian Institute of Health and Welfare. Mark Walker, Katherine Green and Martin Edvardsson undertook the spatial and statistical analyses, and produced the maps. Deanna Pagnini prepared the report, and developed the conceptual framework to underpin the analyses. Thanks are also extended to Fadwa Al-Yaman, Michelle Gourley, Conan Liu and Leo Carroll for their helpful guidance and feedback throughout the project.
Partial funding for this project was provided by the Australian Health Ministers’ Advisory Council through the National Advisory Group on Aboriginal and Torres Strait Islander Health Information and Data (NAGATSIHID). AIHW acknowledges the valuable comments and contributions made by the members of NAGATSIHID, the Department of Health and the Department of the Prime Minister and Cabinet on previous versions, and the jurisdictional contacts who provided information and advice about birthing services.
Thanks are also extended to the perinatal data custodians from the states and territories.

vi
Abbreviations ABS Australian Bureau of Statistics
AHMC Australian Health Ministers’ Conference
AIHW Australian Institute of Health and Welfare
AMPCo Australasian Medical Publishing Company
ASGS Australian Statistical Geography Standard
FTE full-time equivalent
GIS Geographic Information System
GPs general practitioners
IARE Indigenous Area
ILOC Indigenous Location
IREG Indigenous Region
ISPHCS Indigenous-specific primary health-care service
IUGR intrauterine growth restriction
NAGATSIHID National Advisory Group on Aboriginal and Torres Strait Islander Health Information and Data
NPDC National Perinatal Data Collection
OSR Online Services Report
PHN Primary Health Network
RACGP Royal Australian College of General Practitioners
RFDS Royal Flying Doctor Service
SA statistical area
STIs sexually transmissible infections

vii
Summary This report presents the findings of a project which assessed Aboriginal and Torres Strait Islander women’s access to hospitals with public birthing services and 3 other types of maternal health services across Australia, then investigated possible high-level associations between access, maternal risk factors and birth outcomes.
Access to services The study examined the geographic access of Indigenous women of child-bearing age (15–44) to 4 types of on-the-ground maternal health services: hospitals with a public birthing unit; Indigenous-specific primary health-care services (ISPHCSs); Royal Flying Doctor Service clinics; and general practitioners (GPs). Using 1 hour drive time boundaries around these locations and population counts from the 2011 Census at a range of geographic levels (SA2, remoteness, jurisdiction), the study found:
• approximately one-fifth (25,600 or 21%) of Indigenous women of child-bearing age lived outside a 1 hour drive time from the nearest hospital with a public birthing unit
• nearly all (97%) Indigenous women of child-bearing age had access to at least 1 type of maternal health service within a 1 hour drive time. The lowest levels of access were for women in Very remote and Remote areas, where 84% and 93%, respectively, had access to at least 1 type of service.
• Indigenous women of child-bearing age in Major cities, Inner regional and Outer regional areas had more types of services available to them within a 1 hour drive time than did women in more remote areas. Thus, they had more choice in which service they use.
Association with area-level maternal risk factor and birth outcomes Examining possible associations between geographic accessibility to services, maternal risk factors and birth outcomes at the Indigenous Region level, the study found that poorer access to:
• GPs was associated with higher rates of pre-term birth and low birthweight • ISPHCSs with maternal/antenatal services was associated with higher rates of smoking
and low birthweight • hospitals with public birthing units was associated with higher rates of smoking, pre-term
birth and low birthweight • at least 1 service was associated with higher smoking rates and higher rates of pre-term
delivery and low birthweight.
An analysis at Primary Health Network (PHN) level found fewer significant associations, which is likely to be due to the PHNs’ size—particularly in jurisdictions with large Indigenous populations (such as the Northern Territory and Western Australia)—which may mask important intra-area variation.
This report was not able to take into account ISPHCSs which did not report to the Online Services Report collection, including state or territory maternal health services, outreach services, and antenatal/postnatal clinics conducted from hospitals which do not have birthing units. It also focused on spatial accessibility and did not take into account other aspects of maternal health services such as cultural competency. Future analyses could incorporate other indicators or measures of access, maternal risk factors and birth outcomes.


Spatial variation in Aboriginal and Torres Strait Islander women’s access to maternal health services 1
1 Introduction The gap between the health of Aboriginal and Torres Strait Islander children and non-Indigenous children begins before birth, with babies born to Aboriginal and Torres Strait Islander mothers significantly more likely to have been exposed to tobacco smoke in utero, to be born pre-term, and to have a low birthweight (weighing less than 2,500 grams at birth) (AIHW 2015b). These inequalities continue throughout early childhood for Aboriginal and Torres Strait Islander children, with higher mortality rates and higher rates of illness and poor health.
The factors that contribute to poor infant and child health are complex and include maternal health (maternal weight, pre-existing health conditions); maternal risk factors (smoking and alcohol consumption during pregnancy, maternal nutrition); maternal age; social determinants (socioeconomic position and education); cultural determinants; and access to health services (such as antenatal care and child health services).
While access to health services will not eliminate the health gap between Indigenous and non-Indigenous babies and young children on their own, services have an important role to play in ameliorating the effects of the other factors listed above. This report focuses on Aboriginal and Torres Strait Islander women’s geographic access to public birthing units and maternal health services, in order to identify areas with potential gaps in these services. The report then examines whether there is an association between accessibility to services, maternal risk factors during pregnancy, and birth outcomes. It builds on a series of analyses the AIHW has been undertaking which are aimed at identifying geographic areas with potential gaps in services for Aboriginal and Torres Strait Islander Australians (AIHW 2014a, 2015c).
Background Fetal health and development represents an intersection between physiological processes and the greater social context and environment. Inequalities in infant health outcomes are not randomly distributed throughout society, but are a reflection of broader social, environmental, historical, economic and cultural conditions (known as the ‘social determinants’ of health).
Figure 1.1 provides a conceptual overview of these processes, illustrating how these higher-level factors (‘distal’ determinants) affect contextual factors and individual mothers’ resources (intermediate factors)—which, in turn, affect ‘proximal’ determinants of both maternal health and maternal risk factors. These proximal determinants are those which then have a direct effect on fetal development.
Distal determinants (such as the long-term effects of colonisation and its effect on factors such as self-determination, the disruption of ties to land), and the adverse impact of racism, have all had an effect on Aboriginal and Torres Strait Islander people’s socioeconomic and psychosocial well-being (Osborne et al. 2013; Reading & Wein 2009).
Compared with non-Indigenous mothers, Aboriginal and Torres Strait Islander women have higher rates of the factors associated with poor infant health outcomes: on average, they have poorer socioeconomic status, lower levels of education, higher levels of psychosocial distress, are more likely to live in poor housing and are more likely to live in areas with fewer health services (intermediate determinants).

2 Spatial variation in Aboriginal and Torres Strait Islander women’s access to maternal health services
Intermediate determinants
Proximal determinants
Distal determinants Colonisation
Separation from land Racism
Social exclusion Repression of self-determination
Policy context
Contextual Health care system
Educational system
Community infrastructure
Environmental stewardship
Individual Socioeconomic status
Education Housing
Social support Psychosocial factors
Maternal health Pre-existing & pregnancy-
specific conditions STIs/other infections
Dental health
Age Outcomes of prior
pregnancies
Maternal risk factors during pregnancy
Smoking Nutritional intake
Alcohol or other drug use
OUTCOMES
Fetal health & development
Gestational age at birth
Availability of high-quality
antenatal care & birthing services
Figure 1.1: Distal, intermediate and proximal determinants of infant health outcomes

Spatial variation in Aboriginal and Torres Strait Islander women’s access to maternal health services 3
These intermediate determinants affect the proximal determinants of maternal health and maternal risk factors during pregnancy, which then have physiological effects on fetal health and development and increase the likelihood of pre-term birth. Available data show that Indigenous mothers have higher rates of a variety of health risks: they are 1.6 times as likely to be obese as non-Indigenous mothers and to have higher rates of pre-existing hypertension and pre-existing diabetes (which are linked with poorer birth outcomes) (AIHW 2016).
One of the strongest behavioural risk factors for poor birth outcomes and subsequent infant mortality and child mortality is smoking. Maternal smoking during pregnancy has been linked with intrauterine growth restriction (IUGR), poor lung development, stillbirth, pre-term birth, and placenta abruption. IUGR and low birthweight can increase the risk of poor perinatal outcomes such as necrotising enterocolitis and respiratory distress syndrome, and have long-term effects such as increased risks for short stature, cognitive delay, cerebral palsy, and poor cardiovascular health (Reeves & Bernstein 2008). Babies born to mothers who smoke during and after pregnancy are also more likely to die from Sudden Infant Death Syndrome.
AIHW multivariate analyses of perinatal data for the period 2012–2014 indicates that, excluding pre-term and multiple births, 51% of low birthweight births to Indigenous mothers were attributable to smoking, compared with 16% for non-Indigenous mothers (AIHW 2017). Evidence suggests that maternal exposure to second-hand smoke reduces birthweight as well.
While rates of smoking during pregnancy have decreased, data from 2013 show that 47.3% of Indigenous mothers smoked during pregnancy, compared with 10% of non-Indigenous mothers (AIHW 2016). The likelihood of smoking is not randomly distributed throughout society, but is related to the intermediate and proximal determinants shown in Figure 1.1.
Role of services Figure 1.1 positions antenatal care/birthing services as mediating factors that can ameliorate the effects of distal, intermediate and proximate determinants, by working in partnership with Aboriginal and Torres Strait Islander mothers to ensure they have the knowledge, medical care, practical support and social support they require to improve their chances of having a healthy baby.
For example, early access to care can improve infant health through promoting positive change (such as reducing or stopping smoking), and identifying physiological risk factors which may require more specialised management (AIHW 2014b). High-quality, evidence-based and culturally competent (refer to Box 1.1) maternal and child health services, working in partnership with pregnant Aboriginal and Torres women, can help improve maternal and birth outcomes.
Women’s use of antenatal care services is affected by a number of factors, however, such as the availability and the financial and cultural accessibility of services as described above, as well as maternal factors such as early recognition of pregnancy and the perceived value attached to antenatal care (Kruske 2011; Pagnini & Reichman 2000).
Previous work has shown that, while nearly all Aboriginal and Torres Strait Islander mothers access antenatal care prior to giving birth, they are less likely than non-Indigenous mothers to access care early in the pregnancy (51% of Indigenous mothers attend an antenatal visit in the first trimester, compared with 62% of non-Indigenous mothers).

4 Spatial variation in Aboriginal and Torres Strait Islander women’s access to maternal health services
Box 1.1: Culturally competent maternal and child health services Culturally competent antenatal care services are those in which woman-centred care is provided in ways that are respectful, understanding of local culture, and meet the emotional, cultural, practical and clinical needs of the women.
There are a number of aspects which characterise culturally competent maternal care services, some of which include having Indigenous-specific programs, having Aboriginal and Torres Strait Islander staff members, providing continuity of care, viewing women as partners in their care, having a welcoming physical environment, and ensuring that cultural awareness and safety is the responsibility of all staff members in the service (Kruske 2011).
The geographic supply and accessibility of birthing services is also a critical issue for Aboriginal and Torres Strait Islander women and families, and for residents of rural and remote areas in general. In rural and remote areas where no birthing facilities are available, women assessed as being at average risk are often required to relocate to an urban or regional hospital location at 36–38 weeks of pregnancy. Those at high risk—because of a prior pre-term birth, stillbirth, or baby born of low birthweight; maternal age; obesity; or identified medical conditions—may need to spend weeks away from home and family.
From a woman’s and a family’s perspectives, having to travel long distances to give birth can be costly and disruptive to life in general, as well as to continuity of care. For Aboriginal and Torres Strait Islander women, there are also additional stressors, such as being separated from land and community, and the cultural impact of not giving birth on country; language barriers; isolation; fear of asking for culturally appropriate birthing options; and the need to negotiate an unfamiliar health system (Williams 2011; Wyndow & Jackiewicz 2014).
The impact of these factors is that some women may go back to their communities prior to giving birth and require medical evacuation (Williams 2011), while others who give birth in hospitals far from where they live may be more likely to discharge themselves and their babies prematurely (Henry et al. 2007).
Challenges for the health system include ensuring that there is good communication among providers in the local community and the hospital at which the woman gives birth, and that postnatal follow-up care is available in the community where the mother and baby live.
Increased accessibility to high-quality, evidence-based and culturally competent maternity care for Indigenous mothers close to where women live is 1 of the goals of the National Maternity Services Plan (Action 2.2, AHMC 2011), which is expected to help close the demonstrated gap in infant and child health outcomes between Indigenous and non-Indigenous babies. However, even high-quality antenatal care, which takes into account the proximal and intermediate determinants affecting infant health outcomes, may not be enough to eliminate the gap on its own:
To expect prenatal care, in less than 9 months, to reverse the impacts of early life programming and cumulative allostatic load on a woman’s reproductive health may be expecting too much of prenatal care. Even preconceptional care may do too little too late if it is provided in a single visit shortly before a planned pregnancy, rather than as an integral part of women’s health care continuum for all women of reproductive age (Walford et al. 2011).

Spatial variation in Aboriginal and Torres Strait Islander women’s access to maternal health services 5
Structure of the report The rest of the report is structured as follows:
• Chapter 2 provides an overview of the methodological approach and data sources. • Chapter 3 presents Aboriginal and Torres Strait Islander women’s spatial access to
4 types of services: hospitals with public birthing units; Indigenous-specific primary health-care services (ISPHCSs) with antenatal/maternal services; general practitioners (GPs) and Royal Flying Doctor Service (RFDS) clinics.
• Chapter 4 examines whether the spatial access measures are associated with antenatal care use, smoking during pregnancy, pre-term birth and low birthweight.
• Appendix A provides a detailed overview of the methodology. • Appendix B presents Primary Health Network (PHN) level results.

6 Spatial variation in Aboriginal and Torres Strait Islander women’s access to maternal health services
2 Methodology A staged approach was used for this project:
Key decisions were required about the types of services to include, and the geographic level at which to calculate and report the results. The next sections discuss these issues before turning to the methodological approach and the data used in the analyses.
Types of services ‘Maternity care’ refers to services offered during 3 main periods:
• antenatal (during pregnancy, prior to childbirth) • intrapartum (during labour and birth) • postnatal care for mothers and babies (from birth up to 6 weeks after birth).
Pregnant women can access antenatal and postnatal care from 3 main types of health professionals, depending on their needs, preferences, resources, and location: midwives/ nurse-midwives, GPs, and specialist obstetricians. Aboriginal health workers also provide significant antenatal and postnatal support to Indigenous women.
Data show that the types of health professionals Indigenous mothers consulted for pregnancy checkups included:
• doctor/GP (61.1%) • obstetrician (16.9%) • midwife or nurse (47.9%) • Aboriginal or Torres Strait Islander Health Worker (8.8%) • other (1.6%) (AIHW 2015a).
Obtain and geocode service locations
Estimate 1 hour drive times using geospatial software
Calculate how many Indigenous women live within/outside 1 hour drive time
Examine whether there is an association between spatial access, maternal risk factors and infant health outcomes

Spatial variation in Aboriginal and Torres Strait Islander women’s access to maternal health services 7
Antenatal and postnatal care may be offered through a number of different sites and programs, such as hospitals, community health services, Indigenous-specific health services, outreach clinics, private GP surgeries, and specialist obstetric practices. A recent analysis of New Directions funding at ISPHCSs showed that the funding was used to support midwives, Aboriginal health workers, and child and family health nurses, along with GPs and visiting specialists (Kristine Battye Consulting 2013). Hospitals also offer different models of maternity care, including midwife-led care, shared care models between midwives and GPs, and specialist services.
This paper considers 4 types of on-the-ground services offering antenatal/postnatal care with particular relevance for Indigenous women:
• hospitals with a public birthing unit • ISPHCSs • RFDS clinics • GPs.
This study focuses on the spatial accessibility of the 4 types of services, not the types of practitioners who work with pregnant women or the models of maternity care offered at those locations.
Each of the 4 types of services has an important role in antenatal and postnatal care:
• Hospitals with public birthing units may provide the advantage of continuity of care throughout pregnancy, childbirth and postnatal care/discharge and may offer specific programs for Aboriginal and Torres Strait Islander women, such as Aboriginal and Torres Strait Islander midwifery group practices. They also generally provide access to specialist obstetric care when required.
• Indigenous-specific primary health-care services embed their antenatal/postnatal care within a broader framework of culturally safe services and protocols, and a number of initiatives run by ISPHCSs have led to higher rates of antenatal care attendance and improved birth outcomes for Indigenous mothers and babies (see AIHW 2014b, Chapter 3). Only ISPHCSs with antenatal/maternal services were included in this project; these include ISPHCSs with New Directions funding, as well as those who fund them through other sources.
• Although well known for its medical extraction services, the RFDS is less well known for the primary care clinics it delivers to Australians in remote and isolated communities, where many of its patients are Aboriginal and Torres Strait Islander people. These clinics include GP and nurse-midwife services, and there is a GP helpline for RFDS clients which delivers telephone-based consultations. Only those RFDS clinics offering antenatal/maternal services were included in this project.
• GP-led or GP-shared care is able to incorporate pregnancy-related care within the context of the broader primary health system, with referrals made to specialist obstetric services as needed. There is no information on how many GPs provide antenatal care; some GPs may provide initial pregnancy testing and referrals to other services, while other GPs provide full antenatal services (with some GP obstetricians attending births). The Royal College of General Practitioners (RACGP) has provided its members with specific guidelines for antenatal care for Aboriginal and Torres Strait Islander women within its National guide to a preventive health assessment for Aboriginal and Torres Strait Islander people. These guidelines emphasise the importance of understanding the local cultural context; building relationships with the mother; providing brief interventions

8 Spatial variation in Aboriginal and Torres Strait Islander women’s access to maternal health services
for smoking; and conducting psychosocial assessments—as well as medical screening (RACGP 2012).
Geographic level of analysis A major challenge for any spatial analysis is the choice of geographic framework and the unit of analysis. Choices are constrained by pre-existing spatial boundaries, the lowest available level of geographic detail available in the data, and the availability of other required information at a similar scale (such as population data).
Within Australia, spatial data can be presented at various scales, reflecting political boundaries (for example, local government); service or funding boundaries (local health districts or PHNs); or geographic boundaries drawn for the purpose of consistent reporting of statistics (ABS boundaries).
The statistical area (SA) structure of the Australian Statistical Geography Standard (ASGS), developed by the ABS for the collection and dissemination of geographic statistics, was selected as the most relevant framework for this work (Box 2.1).
Box 2.1: Hierarchical construction of SA levels from the ASGS
Mesh Block (MB) 347,627 areas
Statistical Area Level 1 (SA1)
54,805 areas with populations between 200 and 800
Statistical Area Level 2 (SA2) 2,214 areas with populations between 3000 and 25,000
Statistical Area Level 3 (SA3)
351 areas with populations between 30,000 and 130,000
Statistical Area Level 4 (SA4) 106 areas with populations between 100,000 and 500,000
State/Territory (STE)
The SA structure is hierarchical, where lower level units fit wholly into higher level units, and is based on the functional areas of major cities and towns and gazetted suburbs and localities (Figure 2.1).

Spatial variation in Aboriginal and Torres Strait Islander women’s access to maternal health services 9
Figure 2.1: Boundaries of statistical areas, levels 2, 3 and 4 (SA2, SA3 and SA4)
In addition to the SA structure, the ABS has a 3-level Indigenous Structure which provides a geographical standard for the publication of statistics about the Aboriginal and Torres Strait Islander population of Australia from 1 July 2011 (Box 2.2).
Box 2.2: Hierarchical construction of Indigenous structure levels from the ASGS Indigenous Locations (ILOCs)
1116 areas with a minimum of 90 Aboriginal and Torres Strait Islander usual residents
Indigenous Areas (IAREs)
429 areas with a minimum of 250 Aboriginal and Torres Strait Islander usual residents
Indigenous Regions (IREGs) 57 areas, made up of 1 or more IAREs
The number of areas in both the SA and Indigenous structures includes non-geographic SA1s coded as No usual address, Migratory, Offshore or Shipping. The analyses exclude those areas.
Geographic levels for spatial analyses and reporting Several different geographic levels were selected for the analyses and reporting in this paper, as described below.
Drive time analyses Drive times to services were calculated at the SA1 level.
Proportions of women of child-bearing age within/outside a 1 hour drive time to a service While it is important to calculate drive times at as low a geographic level as possible, it is not practical or reliable to report population data at the SA1 level (as there are 54,805 SA1s with populations between 200 and 800 in Australia). The SA1 results were used to calculate the proportions of the population within SA2s who were inside or outside a 1 hour drive time.
SA2 SA3 SA4

10 Spatial variation in Aboriginal and Torres Strait Islander women’s access to maternal health services
SA2 level was selected as the more appropriate reporting level for spatial access, because:
• the 2,214 SA2s are general-purpose medium-sized areas comprising multiple SA1s. They have been developed to represent a community that interacts socially and economically
• SA2s generally have a population range of between 3,000 and 25,000, with an average population of around 10,000 persons
• SA2s are generally based on officially gazetted suburbs and localities. In urban areas, SA2s largely conform to whole suburbs and combinations of whole suburbs, while in rural areas they define functional zones of social and economic links
• SA2s are aligned both with population data and with outcome data from the National Perinatal Data Collection (NPDC).
Thus, for the most part, SA2s strike a balance between being large enough to be meaningful, but small enough not to mask too much within-area variation. However, there are some regional and remote SA2s which are geographically large.
Association between spatial accessibility and outcome variables One of the objectives of this report was to investigate whether spatial access to services is associated with maternal risk factors and infant health outcomes, using data from the NPDC. The geographic level included in the individual records in the NPDC is SA2. However, for the purposes of presentation and analysis, there are too few births to Aboriginal and Torres Strait Islander mothers at the SA2 level to make reporting at this level reliable and valid.
In light of this, two other geographical levels were considered for the analysis and reporting:
• the 37 ABS Indigenous Regions (IREGs), which are large geographical units loosely based on the former Aboriginal and Torres Strait Islander Commission boundaries, which do not cross state boundaries
• the 31 PHNs.
Figures 2.2 and 2.3 illustrate the boundaries of the IREGs and PHNs, respectively, and Table 2.1 shows the number of IREGs and PHNs, by jurisdiction.
Using concordance files from the ABS, spatial-access results were aggregated up to the IREG and PHN levels to create indicators of the percentage of Aboriginal and Torres Strait Islander women of child-bearing age outside a 1 hour drive time to services. Similarly, data on birth outcomes were aggregated up to IREG and PHN levels.
As previously discussed, only the IREGs which reflect actual geographic areas were included in the analyses (that is, those coded as No usual address, Migratory, Offshore or Shipping were excluded).

Spatial variation in Aboriginal and Torres Strait Islander women’s access to maternal health services 11
Figure 2.2: Indigenous Region (IREG) names and boundaries
Table 2.1: Numbers of IREGs and PHNs, by jurisdiction State/Territory Number of IREGs Number of PHNs
New South Wales 7 10
Victoria 2 6
Queensland 8 7
Western Australia 8 3
South Australia 3 2
Tasmania 1 1
Australian Capital Territory 1 1
Northern Territory 7 1
Total 37 31

12 Spatial variation in Aboriginal and Torres Strait Islander women’s access to maternal health services
Source: Department of Health.
Figure 2.3: PHN boundaries

Spatial variation in Aboriginal and Torres Strait Islander women’s access to maternal health services 13
PHNs are important because they reflect programs and funding for primary health care. However, their size, particularly in jurisdictions with large Indigenous populations (such as the Northern Territory and Western Australia), may mask important intra-area variation and dampen the effects of the associations between spatial access, maternal risk factors and infant health outcomes. In addition, for 3 jurisdictions (Tasmania, the Australian Capital Territory and the Northern Territory) there is only a single PHN covering the entire state/territory.
Comparing Figure 2.2 with Figure 2.3 shows that there are some striking differences between the boundaries of PHNs and IREGs. For example, while there are 7 IREGs in the Northern Territory, the whole of the jurisdiction is a single PHN. Similarly, while Western Australia has 8 IREGs, it has 3 PHNs.
For these reasons, the analyses presented in the body of the paper focus on IREG-level associations. Appendix B presents results for PHNs.
Methods: spatial accessibility Spatial accessibility is defined as the percentage of Aboriginal and Torres Strait Islander women of child-bearing age in an area, who are within or outside a 1 hour drive time to a particular type of service. In this report, it measures access in terms of physical access only—even if services are physically accessible, they may not be culturally appropriate or financially accessible, or may not be able to provide services when needed, due to capacity issues.
Following methodology used in Spatial variation in Aboriginal and Torres Strait Islander people’s access to primary health care (AIHW 2015c) the percentage of the SA2 population within a 1 hour drive time was calculated using several steps (described in more detail in Appendix A):
• The addresses of each service were geocoded to point locations. • Geospatial software was used to calculate the drive time from the manually adjusted
population centroid of each SA1 (the smaller geographic areas that aggregate to an SA2).
• These results were then used to calculate the proportions of the population within SA2s that were inside or outside a 1 hour drive.
Access is measured in terms of physical access only—even if services are physically accessible, they may not be culturally appropriate or financially accessible, or may not be able to provide services when needed, due to capacity issues.
The 1 hour drive time was selected as a reasonable upper limit for a pregnant woman to be driven to a hospital after the onset of contractions/spontaneous rupture of amniotic membranes or a medical emergency such as vaginal bleeding, based on a similar study in the United States (Rayburn et al. 2012). Research in rural British Columbia has shown that the incidence of poor birth outcomes is higher for women living outside a 1 hour drive time to a birthing service, even after controlling for maternal characteristics (Grzybowski et al. 2011).
Chapter 3 includes maps showing the physical locations of the services relative to the numbers of Aboriginal and Torres Strait Islander women of child-bearing age, as well as maps of the percentage who live outside a 1 hour drive time to the services.

14 Spatial variation in Aboriginal and Torres Strait Islander women’s access to maternal health services
Examining the association between access and outcomes Figure 2.4 shows the expected high-level relationship between access to services and birth outcomes. In areas with better access to services, it would be reasonable to expect that there would be higher levels of early antenatal care use—which would, in turn, lead to lower levels of risk factors and better birth outcomes.
Figure 2.4: Theoretical relationship between service accessibility and birth outcomes
It is important to note that underpinning these relationships are the proximal, intermediate and distal determinants presented in Figure 2.1, which highlight the fact that there are a number of factors which affect antenatal care use and risk factors in addition to spatial accessibility to services.
In an ideal situation, the relationships in Figure 2.4 would be measured at the individual level. That is, an analysis would examine whether individual women who had better spatial access to services were more likely to use them, and if they did use them, whether they had lower levels of risk factors (such as smoking) and better birth outcomes.
However, because of the structure of the NPDC data and the spatial accessibility measure, only aggregate data were available for this report. The unit of analysis is thus either the IREG or the PHN, and the variables are presented at this level. The analysis then examines whether there are statistically significant correlations between IREG and PHN levels of service accessibility, antenatal care use, smoking during pregnancy, and birth outcomes (pre-term births and low birthweight).
While aggregate analyses are useful for looking at whether there are high-level associations between variables, there are inherent limitations to aggregate analyses which must be taken into consideration.
For example, analyses undertaken at the individual level may find that there is a relationship between 2 variables (such as antenatal care attendance and smoking). However, when the same analyses are redone at the aggregate level, the relationship may not be significant because aggregate analyses are unable to differentiate whether it is the women who use antenatal care less or begin it later who are the ones who are more or less likely to smoke. Additionally, aggregate analyses are unable to control for individual level confounding factors.
Aggregate analyses undertaken at the IREG or PHN level also mask variation in smaller areas within those IREGs or PHNs. This is not an easy problem to address, as spatial areas are needed which are large enough so that the rates associated with outcomes (maternal risk factors, infant health outcomes) are reliable.
Data sources This section describes the data sources for the service locations, the population data, and maternal risk factors and birth outcomes.
Service accessibility
Antenatal care use Risk factors Birth
outcomes

Spatial variation in Aboriginal and Torres Strait Islander women’s access to maternal health services 15
Service locations While data on these service locations were accurate at the time they were obtained, health service locations are dynamic. Services may cease operation or expand their locations and services, and the analysis can only reflect the situation at a particular point in time.
Birthing units There is no national list of birthing facilities. Previous work has used information on hospital locations where women gave birth. However, women may give birth in hospitals without birthing units because of unplanned circumstances.
For the purposes of this project, the AIHW compiled and geocoded a list of hospitals with birthing units in Australia, based on publicly available information on health websites; information included in state/territory ‘Mothers and babies’ reports; and communication with state and territory officials.
Hospitals were included only if they offered a dedicated birthing facility—that is, a service into which women book to give birth. The units were then categorised as public or private. Birthing units located within private hospitals that were funded to provide services to public patients were counted as ‘public birthing units’.
The birthing units themselves ranged from small birthing services for women at low risk of complications, through to tertiary centres with full services for women at high risk, including neonatal services for the babies.
ISPHCSs with antenatal/maternal services Data on the locations of ISPHCSs funded by the Australian Government which offered antenatal/maternal care were sourced from the AIHW’s Online Services Report (OSR) collection for 2015. The ISPHCSs include both community-controlled and non-community-controlled services.
It is important to note that services which do not report to the OSR collection were not able to be included in this work, which may lead to underestimates of the availability of Indigenous-specific antenatal/maternal health programs. In addition, there was no information on where outreach services may be provided.
RFDS locations Information on locations of RFDS clinics which had provided maternal and child health services at some point over the period 2013–2015 were provided by the RFDS and geocoded by the AIHW. It was not possible to include the frequency with which individual clinics were offered.
GP practice locations Health-care service addresses for GPs were sourced from the Australasian Medical Publishing Company (AMPCo). This data set provides information on registered GPs, including GP service addresses, the number of GPs working at each service, and an FTE (full-time equivalent) value for each GP. It includes GPs working at hospitals and ISPHCSs, not just those in private practice. Additional GP service locations were sourced from the RFDS.
Services deemed not to provide ‘traditional’ GP medical care—such as homeopaths, naturopaths, cosmetic services, tanning clinics and plastic surgeons—were disregarded. All GP data were for 2013. It should be noted that any changes made to these service

16 Spatial variation in Aboriginal and Torres Strait Islander women’s access to maternal health services
addresses after 2013, including the opening of new GP services, will not be captured in the analyses presented in this report. The AIHW is currently in the process of obtaining the most up-to-date list of GP service addresses for future analyses.
Services not able to be included Three types of services were unable to be included in these analyses, including:
• outreach maternal health services • antenatal/postnatal services operated through hospitals or health centres without public
birthing units, such as smaller regional hospitals which provide care for pregnant women and mothers and their babies after birth
• primary health services funded by states or territories which facilitate provision of care to people who may otherwise have low levels of access, through health centres, small hospitals and other services, particularly in rural and remote areas.
Population data Data on the distribution of the Aboriginal and Torres Strait Islander population were obtained from SA1-level census counts from the ABS’s 2011 Census of Population and Housing.
Maternal risk factors and birth outcomes Data on maternal risk factors and birth outcomes come from the NPDC—a national collection of pregnancy and childbirth data. The data are sourced from notification forms filled out for each birth by midwives and other staff, using information obtained from mothers and from hospital or other records.
This information is collated within the perinatal collection maintained in each state and territory. An extract from each jurisdictional data collection is supplied to the AIHW to form the NPDC. This extract consists of an agreed set of standardised data items, as specified in the Perinatal National Minimum Data Set, as well as additional data items.
The NPDC includes information about the Indigenous status of mothers who gave birth in the reporting period; it does not contain any information about the Indigenous status of the father. According to Australian Bureau of Statistics (ABS) data on birth registrations in 2011, at least 70% of Indigenous births (defined as births where either 1 or both parents are Indigenous) were to Indigenous mothers (ABS 2010). Five types of variables were selected for analysis:
• the percentage of Indigenous mothers who attended at least 1 antenatal visit in the first trimester (up to and including 13 completed weeks), for at least 1 live or stillborn baby, as a proportion of the total number of women who gave birth, for at least 1 live or stillborn baby (where gestation at first antenatal visit is known)
• the percentage of Indigenous mothers who attended at least 5 antenatal visits during the pregnancy (restricted to women who gave birth to a live or stillborn baby at 32 weeks or after)
• a series of smoking variables, including Ever smoked during pregnancy, Smoked during the first 20 weeks of pregnancy and Smoked after the first 20 weeks of pregnancy
• pre-term babies (defined as those who are born prior to 37 weeks completed gestation) • low-birthweight babies (defined as babies weighing less than 2500 grams at birth).

Spatial variation in Aboriginal and Torres Strait Islander women’s access to maternal health services 17
Summary of sources Table 2.2 summarises the data sources for this report.
Table 2.2: Main data sources Category Measures/ indicators Source, years included
Service locations
Hospitals with public birthing units Sourced from jurisdictions/ reports (2015)
RFDS primary health clinics Provided by RFDS to AIHW (2013–2015)
GP practice locations Medical Directory of Australia (MDA) (2013)
ISPHCSs with maternal/antenatal care services Online Services Reporting (OSR) collection (2015)
Population distribution
Number of Indigenous women of child-bearing age (SA1) Census of Population and Housing (2011)
Outcomes Antenatal visits National Perinatal Data Collection (2012 & 2013)
Smoking during pregnancy National Perinatal Data Collection (2012 & 2013)
Pre-term birth (prior to 37 weeks gestation) National Perinatal Data Collection (2012 & 2013)
Low birthweight (<2,500 grams) National Perinatal Data Collection (2012 & 2013)
Data limitations
Services included in the analyses As already noted earlier in this chapter, the analyses did not include all maternal health-care services. ISPHCSs were included if they reported to the OSR collection in 2015 and offered antenatal/maternal care. RFDS locations were sourced from the RFDS and GP practice locations were sourced from 2013 AMPCo data. In some regions, new services may have been added since those dates. Key omissions from the analyses were outreach services, and state- or territory-funded primary health and antenatal/postnatal services at hospitals without public birthing units.
Access to services The measures of ‘access to services’ used in the report are subject to 2 specific data quality issues. Firstly, not all services were included. Outreach services, antenatal services offered through state-run services and ISPHCSs which do not report to the OSR collection were not able to be included. This understates access (that is, areas which appear to have poorer access may in fact have additional services).
Secondly, there are issues with the timeframes of the various collections. Measures of access to services are for different points in time (GP locations are from 2013; RFDS clinics are from 2013–2015; public birthing units are from 2015, and ISPHCSs are from 2015).
The most recent perinatal data available are for 2012–2013, and thus pre-date some of the access measures. This has the following implications:
• Antenatal program funding may be targeted to areas with poor antenatal care use/poor outcomes. Therefore, additional services may have been deliberately placed into these areas, and it may appear as if ‘good access’ is associated with ‘poor outcomes’.
• There are inherent limitations to cross-sectional analyses. The policy question is whether adding services (and improving access) improves antenatal care use and birth outcomes in particular areas. It was not possible to directly address this question as the time lag

18 Spatial variation in Aboriginal and Torres Strait Islander women’s access to maternal health services
between provision of services, antenatal care use, and better outcomes requires longitudinal data on all these factors within areas.
Antenatal care The quality of the perinatal data used in this report is affected by the completeness of Indigenous identification, which varies over time and across jurisdictions. There are also differences between jurisdictions with respect to definitions and methods used for data collection.
For example, analysis of data over time shows that the proportion of women across Australia who gave birth who received antenatal care in the first trimester declined from 79.2% in 2008 to 61.9% in 2013. This downward trend was principally due to data from New South Wales and Victoria, as the proportion increased for most other jurisdictions over the same period. However, advice from the National Core Maternity Indicators Expert Commentary Group indicated that the apparent decline is unlikely to reflect a true change on the ground and may simply be an artefact of:
• definitional changes • changing models of care (for example, early antenatal care being provided increasingly
outside of hospitals) • changes to reporting systems (for example, changes to process of transfer of antenatal
records between GPs and hospitals or between hospitals and jurisdictional collections).
Interactions between these factors, especially the last 2, could amplify changes in the data reported by hospitals to jurisdictions, and then to the AIHW.
To determine the effect of these factors, the AIHW held bilateral meetings with each of the jurisdictions supplying data. These revealed a number of changes to jurisdictional collection practices which were likely to have contributed to the observed trends:
• For instance, in 2011, New South Wales changed its definition of an antenatal care visit. Until 2010, the question asked at data collection was Duration of pregnancy at first antenatal visit. However, from 2011 the question asked has been: Duration of pregnancy at first comprehensive booking or assessment by clinician. Because this new question more specifically defines the type of visit that is reported as ‘antenatal care’, the proportion of mothers who commenced antenatal care in 2011 is lower than in previous years. See <http://www.healthstats.nsw.gov.au/Indicator/mum_antegage/mum_antegage_lhn_snap>.
• In 2012 and 2013 data, New South Wales and Victoria used a different definition for ‘first antenatal visit’ than the other states and territories. Caution should therefore be used when comparing rates for these states and territories with those from other jurisdictions.
• Other jurisdictions also revealed changes in collection practices. The bilateral meetings revealed a number of changes to collection practice that would affect the apparent proportion of women receiving antenatal care—however, the size of these effects cannot be quantified.
These data quality issues have several potential effects:
• Because of definitional changes, the Timing of first antenatal visit variable may not adequately capture when women received their first antenatal visit, particularly for women who receive their antenatal care outside of hospital clinics. In practice, this means that the category Receiving late antenatal care (post-first trimester) includes women who did receive care in the first trimester (but not from a hospital) as well as

Spatial variation in Aboriginal and Torres Strait Islander women’s access to maternal health services 19
those who received no care in the first trimester. Thus, the statistical effect of early antenatal care use will be dampened.
• Because models of maternity care differ by geographic area, the effects of data quality issues are not randomly distributed, but are geographically bound. For example, extremely low rates of first trimester antenatal care use in particular areas of New South Wales may be due to a lack of hospitals offering hospital-based antenatal care clinics, and not by differences in the likelihood of women to use antenatal care. This would then reduce the likelihood of seeing an association between early antenatal care use and birth outcomes by geographic area.
Implications Because of these factors (aggregate analyses; data limitations), it is important that the analyses of potential associations between service accessibility, maternal risk factors and birth outcomes are considered as exploratory.

20 Spatial variation in Aboriginal and Torres Strait Islander women’s access to maternal health services
3 Service accessibility This chapter examines the spatial accessibility of hospitals with public birthing units, ISPHCSs with antenatal/maternal health programs, GP practices, and RFDS clinics
Birthing units In 2015, approximately 27% of hospitals in Australia had dedicated birthing units. The majority of these (220) were public birthing units. Public birthing units are those which accept public patients, regardless of the public or private status of the hospital. Some hospitals offer women the option of either public or private birthing services—for the purposes of this project, they are counted as public birthing units.
In addition, there were 63 private birthing units at hospitals in which there were no publicly available birthing services.
This distinction is important, because public birthing units provide services to all women, while private birthing units offer an additional option for those with the resources to access them.
There is variation in the characteristics of the birthing units themselves: they include hospitals with small birthing units for women at low risk of complications, through to tertiary centres with full services for women at high risk, including neonatal services for the babies.
Table 3.1 presents the number of hospitals with birthing units, by remoteness and by whether the birthing unit is public or private.
Table 3.1: Number of hospitals with public and private birthing units, by remoteness, 2015
Public birthing
units Private birthing
units only Total hospitals with
birthing units % of birthing units
that are public
Major cities 70 48 118 59.3
Inner regional 75 10 85 88.2
Outer regional 53 6 59 89.8
Remote 15 0 15 100.0
Very remote 7 0 7 100.0
Total 220 64 284 77.5
Nearly all (197 out of 220) hospitals with public birthing units are in Major cities or regional areas. There are 15 hospitals with public birthing units in Remote areas and 7 in Very remote areas. Hospitals with private birthing units make up 40.7% of all birthing units in Major cities, while there are no hospitals with private birthing units in Remote or Very remote areas.
Figure 3.1 shows the locations of hospitals with public birthing units, compared with the number of Indigenous women of child-bearing age at the SA2 level. This map illustrates the concentration of hospitals with public birthing units in metropolitan areas. It also shows that there are a large number of SA2s with at least 100 Indigenous women of child-bearing age who appear to be far from a hospital with a public birthing unit, particularly in the Northern Territory, Western Australia and northern Queensland. The next section builds on this map by calculating spatial accessibility to these units.

Spatial variation in Aboriginal and Torres Strait Islander women’s access to maternal health services 21
Figure 3.1: Hospitals with public birthing units and number of Indigenous women of child-bearing age, by SA2, 2015 (birthing unit locations) and 2011 (population)
Drive time to hospitals with public birthing units Figure 3.2 shows the percentage of Indigenous women of child-bearing age within each SA2 who live within a 1 hour drive time of a hospital with a public birthing unit. The darker colours on the map illustrate the areas with poorer spatial access to hospitals with public birthing units (lower percentages of women within a 1 hour drive time).
Comparing figures 3.1 and 3.2 shows that, even if there is a hospital with a public birthing unit within the SA2, spatial accessibility may be limited due to distance and road conditions.
500 to 1,750 (22 SA2s) 100 to 499 (321 SA2s) 50 to 99 (376 SA2s) 10 to 49 (853 SA2s) 1 to 9 (352 SA2s) Areas with zero estimated resident Indigenous population or no Indigenous women 15–44 (272 SA2s) Hospital with public birthing unit

22 Spatial variation in Aboriginal and Torres Strait Islander women’s access to maternal health services
Figure 3.2: Percentage of Indigenous women of child-bearing age living within a 1 hour drive time of a hospital with a public birthing unit, by SA2, 2011 (population) and 2015 (birthing unit locations)
The spatial analyses found that:
• approximately one-fifth (20.6%) of Indigenous women of child-bearing age (around 25,600) live more than a 1 hour drive time from the nearest hospital with a public birthing unit
• there are 114 SA2s where at least 80% of Indigenous women of child-bearing age live more than a 1 hour drive time from a hospital with a public birthing unit
• there are 1,727 SA2s where 100% of Indigenous women of child-bearing age live within a 1 hour drive time of a hospital with a public birthing unit.
The percentages and numbers of Indigenous women aged 15–44 living more than a 1 hour drive time from a hospital with a public birthing unit, by state and territory, are presented in Table 3.2.
0 (97 SA2s) >0 to 19.9 (17 SA2s) 20 to 39.9 (14 SA2s) 40 to 59.9 (15 SA2s) 60 to 79.9 (17 SA2s) 80 to 99.9 (37 SA2s) 100 (1,727 SA2s) Areas with zero estimated resident Indigenous population or no Indigenous women aged 15–44 (272 SA2s) Hospital with a public birthing unit

Spatial variation in Aboriginal and Torres Strait Islander women’s access to maternal health services 23
Table 3.2: Indigenous women of child-bearing age living more than a 1-hour drive time from a hospital with a public birthing unit, by state and territory, 2011 (population) and 2015 (birthing unit locations)
State/Territory
% of Indigenous women aged 15–44 living more than
1 hour drive time from a hospital with a public
birthing unit
Number of Indigenous women aged 15–44 living more than
an hour’s drive from a public birthing unit
Total number of Indigenous women
aged 15–44
New South Wales 9.1 3,475 38,252
Victoria 1.1 81 7,139
Queensland 17.0 6,079 35,687
Western Australia 30.0 4,863 16,187
South Australia 23.7 1,600 6,745
Tasmania 5.6 261 4,663
Australian Capital Territory 0.0 0 1,225
Northern Territory 64.0 9,083 14,203
Australia 20.5 25,442 124,101
Figure 3.3 shows the significant variation in spatial accessibility, by remoteness. For Indigenous women of child-bearing age in Very remote areas, 90.2% (17,185) live more than a 1 hour drive time from a public hospital with a birthing unit, compared with 46.7% (4,311) of Indigenous women in Remote areas
Figure 3.3: Number and percentage of Indigenous women of child-bearing age living more than a 1 hour drive time from a hospital with a public birthing unit, by remoteness categories, 2011 (population) and 2015 (birthing unit locations)
0
10
20
30
40
50
60
70
80
90
100
Major Cities Inner Regional Outer Regional Remote Very Remote
Per cent
Remoteness
123 744
3,122
4,311
17,185

24 Spatial variation in Aboriginal and Torres Strait Islander women’s access to maternal health services
Spatial accessibility of antenatal and postnatal services Table 3.3 shows the numbers and distributions, by remoteness, of the 4 services offering antenatal/postnatal care that were included in this analysis. It illustrates the importance of the RFDS and ISPHCSs as primary health-care providers in regional and remote areas. Table 3.3: Number of service locations providing maternal health services, by remoteness, by service type, 2015
Remoteness category Hospitals with public
birthing units(a) GP practice locations(b) ISPHCS(c) RFDS(d)
Major cities 70 5,366 24 0
Inner regional 75 1,337 45 2
Outer regional 53 709 51 39
Remote 15 129 32 50
Very remote 7 61 102 238
Total 220 7,602 254 329
(a) Only hospitals with public birthing units in 2015 were included in the analysis. The effect of not including private hospitals in the spatial access measure is negligible, as the private birthing units are generally located in close proximity to public birthing units within the metropolitan and regional areas.
(b) GP practice locations were sourced from AMPCo 2013. GPs provide antenatal and postnatal care for low-risk women and refer to more specialised services where appropriate (see AIHW 2015c for further detail on the GP data).
(c) ISPHCS data represent Australian Government-funded services which report to the OSR (Online Services Reporting) collection. Services funded only by state and territory goverments have not been included.
(d) These data were provided by the RFDS and include RFDS clinic locations which provided maternal and child-health services at some point over the period 2013–2015.
Figures 3.4 and 3.5 present the physical locations of the maternal health services included in this analysis, for western and central Australia (Western Australia, the Northern Territory and South Australia) and eastern Australia (Queensland, New South Wales, the Australian Capital Territory, Victoria and Tasmania), by the number of Indigenous women of child-bearing age.
Because it is difficult to see detail in smaller areas, maps of 3 cities (Sydney, Darwin and Perth) are presented in figures 3.6, 3.7 and 3.8, respectively.

Spatial variation in Aboriginal and Torres Strait Islander women’s access to maternal health services 25
Figure 3.4: Locations of maternal health services and number of Indigenous women of child-bearing age, by SA2, western and central Australia, 2013–15 (service locations) and 2011 (population)
500 to 1,750 (22 SA2s) 100 to 499 (321 SA2s) 50 to 99 (376 SA2s) 10 to 49 (853 SA2s) 1 to 9 (352 SA2s) Areas with no estimated resident Indigenous women aged 15–44
Areas with no estimated resident Indigenous population
Hospital with public birthing unit
RFDS service
General practitioner
ISPHCS

26 Spatial variation in Aboriginal and Torres Strait Islander women’s access to maternal health services
Figure 3.5: Locations of maternal health services and number of Indigenous women of child-bearing age, by SA2, eastern Australia, 2013–15 (service locations) and 2011 (population)
500 to 1,750 (22 SA2s) 100 to 499 (321 SA2s) 50 to 99 (376 SA2s) 10 to 49 (853 SA2s) 1 to 9 (352 SA2s) No estimated resident Indigenous women aged 15–44 No estimated resident Indigenous population
Hospital with public birthing unit
RFDS service
General practitioner ISPHCS

Spatial variation in Aboriginal and Torres Strait Islander women’s access to maternal health services 27
Figure 3.6: Locations of maternal health services and number of Indigenous women of child-bearing age, by SA2, Sydney, 2013–15 (service locations) and 2011 (population)
No estimated resident Indigenous women aged 15–44 No estimated resident Indigenous population
Indigenous women of child-bearing age
Hospitals with public birthing units
Number of GP practice locations
ISPHCS maternity health services
5,863 19 1,877 5
Hospital with public birthing unit
ISHPCS
General practitioner
500 to 1,750 100 to 499 50 to 99 10 to 49 1 to 9
28 Spatial variation in Aboriginal and Torres Strait Islander women’s access to maternal health services
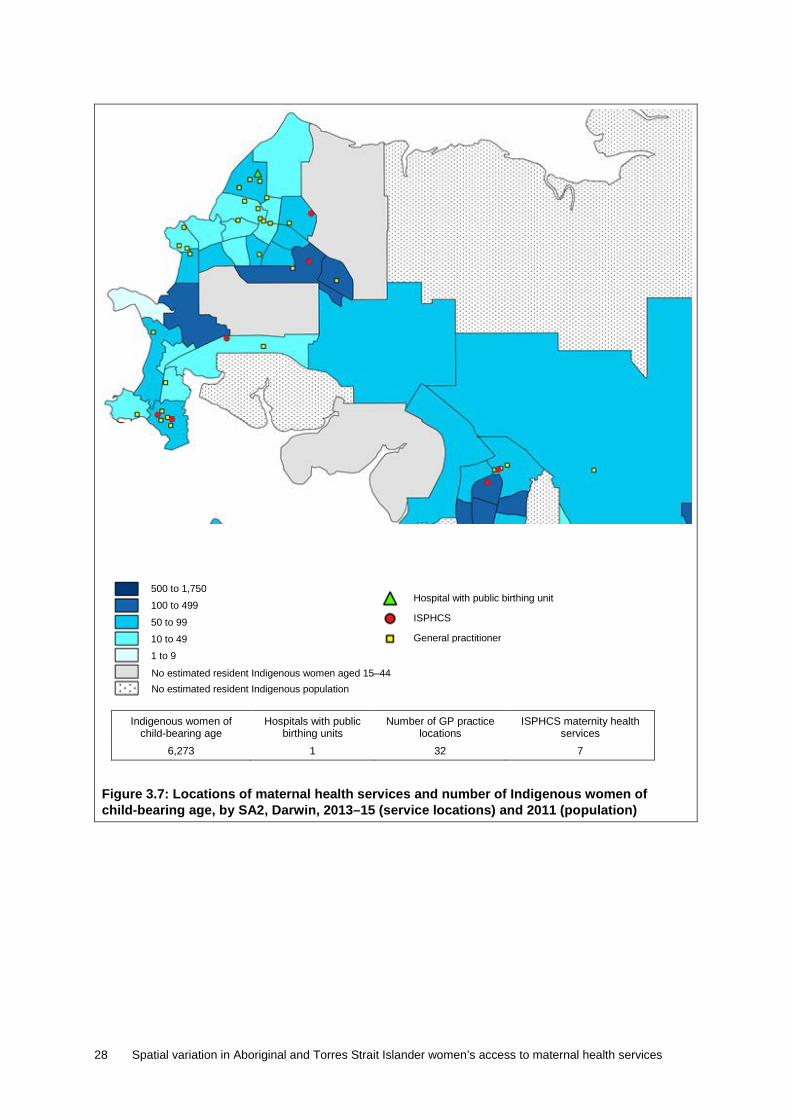
Figure 3.7: Locations of maternal health services and number of Indigenous women of child-bearing age, by SA2, Darwin, 2013–15 (service locations) and 2011 (population)
No estimated resident Indigenous women aged 15–44 No estimated resident Indigenous population
Indigenous women of child-bearing age
Hospitals with public birthing units
Number of GP practice locations
ISPHCS maternity health services
6,273 1 32 7
Hospital with public birthing unit
ISPHCS
General practitioner
500 to 1,750 100 to 499 50 to 99 10 to 49 1 to 9

Spatial variation in Aboriginal and Torres Strait Islander women’s access to maternal health services 29
Figure 3.8: Locations of maternal health services and number of Indigenous women of child-bearing age, by SA2, Perth, 2013–15 (service locations) and 2011 (population)
Indigenous women of child-bearing age
Hospitals with public birthing units
Number of GP practice locations
ISPHCS maternity health services
1,366 10 437 4
500 to 1,750 100 to 499 50 to 99 10 to 49 1 to 9 No estimated resident Indigenous women aged 15–44 No estimated resident Indigenous population
Hospital with public birthing unit
ISPHCS
General practitioner

30 Spatial variation in Aboriginal and Torres Strait Islander women’s access to maternal health services
The maps highlight several key points:
• While there is overlap between the service types in urban and some regional areas, areas in more remote parts of Australia may be covered by only 1 type of service.
• There are a number of ISPHCS and RFDS clinics in the large, remote SA2s with larger numbers of Aboriginal and Torres Strait Islander women of child-bearing age (the darker blue areas on the maps).
• Regional areas in eastern Australia appear to have a higher number of services than similar areas in western and central Australia.
• The maps for the included cities (Sydney, Perth and Darwin) show that many of the SA2s with more than 100 Indigenous women of child-bearing age have multiple services.
State and territory aggregates of this data are presented in Table 3.4.
Table 3.4: Number of Indigenous women of child-bearing age and service type locations, by state and territory, 2011 (population) and 2013–15 (service locations)
Indigenous women of child-bearing
age
Number of GP practice
locations
RFDS GP/ nurse-midwife
clinics
Hospitals with public birthing
units
ISPHCS with maternity health
services
New South Wales 38,252 2,955 39 56 52
Victoria 7,139 1,762 0 53 22
Queensland 35,687 1,432 113 43 42
Western Australia 16,187 604 80 30 47
South Australia 6,745 528 68 27 20
Tasmania 4,663 164 0 5 7
Australian Capital Territory 1,225 83 0 2 1
Northern Territory 14,203 75 29 4 62
Australia(a) 124,101 7,603 329 220 254
(a) Totals for Australia do not include other territories (Christmas Island, Cocos (Keeling) Islands and Jervis Bay).
Drive time analyses The next section presents the percentage of Indigenous women of child-bearing age in each SA2 who are within a 1 hour drive time of each type of service, as well as a measure of how many women are within a 1 hour drive time of at least 1 type of service.
The results are presented as follows:
• Table 3.5 presents the drive time results by remoteness • Table 3.6 presents the drive time results by state and territory • Figure 3.9 presents a map illustrating the accessibility to any service indicator.
It is important to acknowledge that these results measure the spatial availability of any type of service—they are not able to take into account individual women’s preference for a particular type of service.

Spatial variation in Aboriginal and Torres Strait Islander women’s access to maternal health services 31
Table 3.5: Percentage of Indigenous women of child-bearing age (15–44) living within a 1 hour drive time of a maternal health service, by remoteness, by service type, 2011 (population) and 2013–15 (service locations)
Hospital with a
public birthing unit GP ISPHCS RFDS(a) Any of the
services Number of
Indigenous women
Major cities 99.8 100.0 99.4 0.0 100.0 42,346
Inner regional 97.4 100.0 89.0 20.0 100.0 26,675
Outer regional 88.3 99.9 84.4 23.2 99.9 26,787
Remote 53.3 92.6 76.8 17.0 93.3 9,239
Very remote 9.8 62.8 50.7 44.1 83.9 19,054
Total(b) 79.5 93.7 84.7 17.4 97.1 124,101
(a) The RFDS clinics are conducted at specific locations (such as schools, roadhouses, a shed) to which patients from surrounding areas must travel in order to access the service. Thus, travel times are still applicable for RFDS clinics.
(b) Totals do not include other territories (Christmas Island, Cocos (Keeling) Islands and Jervis Bay).
The table highlights several patterns:
• Nearly all (97%) of Indigenous women of child-bearing age have access to at least 1 type of maternal health service within a 1 hour drive time. The lowest percentages are in Very remote and Remote areas, where 84% and 93%, respectively, have access to at least 1 type of service.
• Indigenous women of child-bearing age in Major cities, Inner regional and Outer regional areas have more types of services available to them within a 1 hour drive than do women in Remote and Very remote areas. Thus, they have more choice in which service they use.
• From a service-planning perspective, the ISPHCS and RFDS clinics in Remote and Very remote areas are in different locations; that is, they are not duplicating each other. However, it is important to remember that the RFDS services are planned clinics—they are not ‘on the ground’ all the time.
Table 3.6: Percentage of Indigenous women of child-bearing age (15–44) living within a 1 hour drive time of a maternal health service, by state/territory, by service type, 2011 (population) and 2013–15 (service locations)
Hospital with a
public birthing unit GP ISPHCS RFDS Any of the
services Number of
Indigenous women
New South Wales 90.9 99.9 91.2 19.8 99.9 38,252
Victoria 98.9 100.0 99.2 5.5 100.0 7,139
Queensland 83.0 97.1 78.4 20.2 98.2 35,687
Western Australia 70.0 94.6 83.4 21.0 96.6 16,187
South Australia 76.3 92.1 85.5 11.6 96.3 6,745
Tasmania 94.4 97.8 93.7 0 98.4 4,663
Australian Capital Territory
100.0 100.0 100.0 0 100.0 1,225
Northern Territory 36.0 63.4 72.2 16.0 84.7 14,203
Total(a) 79.5 93.7 84.7 17.4 97.0 124,101
(a) Totals do not include other territories (Christmas Island, Cocos (Keeling) Islands and Jervis Bay).

32 Spatial variation in Aboriginal and Torres Strait Islander women’s access to maternal health services
Figure 3.9 illustrates how the access to at least 1 of the included maternal health services varies across Australia. The dark areas highlight areas with poorer access.
Figure 3.9: Percentage of Indigenous women of child-bearing age living within a 1 hour drive time of either a hospital with a public birthing unit, an ISPHCS, an RFDS clinic or a GP, by SA2, 2011 (population) and 2013–15 (service locations)
SA2s where at least some Indigenous of women of child-bearing age live more than a 1 hour drive time from any of the 4 included services are presented in Table 3.7. The SA2s are ordered by decreasing levels of spatial access—that is, those with the poorest access (highest percentage of women living more than a 1 hour drive time from a service) are at the top. The number of Indigenous women of child-bearing age living in each SA2 is also included to show the distribution across areas (for example, there are some areas with poor access which have large numbers of Indigenous women and other areas with few Indigenous women).
0 (2 SA2s) >0 to 19.9 (2 SA2s) 20 to 39.9 (0 SA2s) 40 to 59.9 (5 SA2s) 60 to 79.9 (6 SA2s) 80 to 99.9 (17 SA2s) 100 (1,891 SA2s) Areas with zero estimated resident Indigenous population or no Indigenous women aged 15–44 (272 SA2s)

Spatial variation in Aboriginal and Torres Strait Islander women’s access to maternal health services 33
Table 3.7: SA2s where Indigenous women of child-bearing age (15–44) live more than a 1 hour drive time from either a GP, ISPHCS with maternal services, public birthing unit or RFDS clinic, 2011 (population) and 2013–15 (service locations)
State SA2
Total Indigenous
women of child-bearing
age in the SA2
Indigenous women of child-bearing age who live
more than a 1 hour drive time from a service
Percent Number
Queensland Palm Island 513 100.0 513
Northern Territory Victoria River 458 100.0 458
Tasmania West Coast (Tas) 72 94.4 68
Western Australia Exmouth 59 83.1 49
Northern Territory Gulf 863 51.2 442
Western Australia Meekatharra 274 42.7 117
South Australia APY Lands 593 42.2 250
Northern Territory East Arnhem 1,750 41.9 733
Tasmania Bruny Island - Kettering 17 41.2 7
Western Australia Ashburton (WA) 212 30.2 64
Western Australia East Pilbara 405 26.2 106
Northern Territory Sandover - Plenty 733 24.7 181
Queensland Dalrymple 26 23.1 6
Western Australia Halls Creek 678 21.4 145
Northern Territory Tanami 664 20.3 135
Northern Territory West Arnhem 1,121 15.4 173
Queensland Broadsound - Nebo 56 12.5 7
Queensland Buderim - North 36 11.1 4
Queensland Torres Strait Islands 816 11.0 90
Queensland Balonne 173 6.4 11
Western Australia Kununurra 648 4.9 32
Northern Territory Howard Springs 86 4.7 4
New South Wales Nyngan - Warren 181 4.4 8
Queensland Herberton 168 4.2 7
Northern Territory Barkly 533 4.1 22
Western Australia Leinster - Leonora 526 3.6 19
Northern Territory Tiwi Islands 554 3.4 19
Western Australia Kambalda - Coolgardie - Norseman 117 3.4 4
New South Wales Bourke - Brewarrina 383 3.4 13
Northern Territory Alligator 245 2.0 5
Northern Territory Elsey 400 1.3 5
Queensland Torres 463 1.1 5
Table 3.7 provides an overall indication of the 32 SA2s in which Indigenous women have poor access to 1 of the 4 types of included maternal services. It is important to note, however, that Indigenous women in these areas may have access to outreach services or to state- or territory-funded services which have not been included in these analyses. Also,

34 Spatial variation in Aboriginal and Torres Strait Islander women’s access to maternal health services
these values reflect access to services at a single point in time; as noted previously, services are fluid and may enter or leave areas at any point. (For example, there is a new GP clinic on Palm Island, and some additional service locations have been added in Tasmania, which will change the values for those locations.)
Whether—and how—the spatial distribution and accessibility of maternal health services is associated with maternal risk factors and infant health outcomes is a key policy issue in Indigenous health, and is addressed in Chapter 4.

Spatial variation in Aboriginal and Torres Strait Islander women’s access to maternal health services 35
4 Associations between access to services, maternal risk factors and birth outcomes
This chapter considers whether there is an association between spatial accessibility and maternal risk factors and birth outcomes at the IREG level. It begins with descriptive statistics for the spatial access and outcome measures. It then presents the results of exploratory analyses of correlations between spatial access measures, maternal risk factors and infant health outcomes. Finally, to complement the statistical analyses, it examines the potential relationship between spatial access and outcomes by identifying areas with unexpected results (areas with good access and yet poor outcomes; or poor access and yet good outcomes).
Descriptive statistics Table 4.1 presents summary measures of the IREG-level variation in the access to services measures, while Table 4.2 presents summary levels of the IREG-level variation in maternal risk factors and birth outcomes.
Table 4.1: Spatial access measures, descriptive statistics for 36 Indigenous Regions, 2011 (population) and 2013–15 (service locations)
Descriptive statistics across 36 IREGs
Percentage of Indigenous women in IREG outside a 1 hour drive time to:
GP
ISPHCS with maternal health
services
Hospital with a public birthing
unit RFDS Any of the 4
services
Mean 10.4 20.1 33.1 74.4 4.5
Median 0.4 18.1 21.7 86.8 0.1
Standard deviation 18.4 18.4 33.2 28.7 9.0
Minimum 0.0 0.0 0.0 14.6 0.0
Maximum 78.7 83.2 100.0 100.0 37.2
Note: As the analysis is based on drive time access to services, the Torres Strait IREG has been excluded from the analyses, as it consists entirely of islands and drive time is not appropriate. The islands are serviced by a combination of primary health clinics on each island supplemented by outreach and specialist services. Data on maternal risk factors and birth outcomes have been included in the appendix tables for comparison.
Table 4.1 shows that:
• the percentage of women living more than a 1 hour drive time from a GP range from 0% (everyone in the IREG is within an hour’s drive) to an IREG where 78.7% of women live more than an hour’s drive from a GP.
• this variation is echoed across services—for example, there are IREGs where no one lives more than an hour’s drive from a hospital with a public birthing unit and IREGs where everyone lives more than an hour’s drive from one.
• there is one IREG (Nhulunbuy) in which 37.2% of Aboriginal and Torres Strait Islander women of child-bearing age live more than a 1 hour drive from any of the 4 services.

36 Spatial variation in Aboriginal and Torres Strait Islander women’s access to maternal health services
Table 4.2 shows that:
• antenatal care use in the first trimester varied from a high of 82.7% to a low of 25.3% • smoking rates were high across the board, but varied from a low of 30.9% to a high of
64.0%. Smoking after 20 weeks was slightly lower, varying from a low of 22.9% to a high of 59.6%
• there is wide variation in rates of pre-term births and low birthweight. For example, IREG-level rates of pre-term births vary from a low of 8.1% to a high of 20.1%.
Table 4.2: Maternal risk factors and infant health outcomes, descriptive statistics for 37 Indigenous Regions, National Perinatal Data Collection, 2012–13
Descriptive statistics across 37 IREGs
Percentage of Indigenous mothers Percentage of babies born to
Indigenous mothers
Antenatal care in first
trimester(a)
Ever smoked during
pregnancy(b) Smoking after
first 20 weeks(c) Pre-term
births(d) Babies born low
birthweight(e)
Mean 53.9 49.6 44.2 14.6 11.3
Median 53.5 49.4 43.2 14.1 10.7
Standard deviation 11.0 7.4 7.7 2.7 2.6
Minimum 25.3 30.9 22.9 8.1 6.3
Maximum 82.7 64.0 59.6 20.0 18.9
(a) The number of Indigenous women who attended at least 1 antenatal visit in the first trimester (up to and including 13 completed weeks), for at least 1 live or stillborn baby, as a proportion of the total number of Indigenous women who gave birth, for at least 1 live or stillborn baby (where gestation at first antenatal visit is known).
(b) The percentage of Indigenous mothers who reported smoking during pregnancy. Percentages were calculated after excluding records with missing values for smoking status. Care must be taken when interpreting percentages, as the mother’s tobacco smoking status during pregnancy is self-reported.
(c) The percentage of Indigenous mothers who reported smoking after 20 weeks of pregnancy. Percentages were calculated after excluding records with missing values for smoking status. Care must be taken when interpreting percentages, as the mother’s tobacco smoking status during pregnancy is self-reported.
(d) ‘Pre-term’ babies are defined as those born prior to 37 weeks completed gestation. The denominator includes live births and stillbirths.
(e) ‘Low-birthweight’ babies are those weighing less than 2500 grams at birth, and includes only live-born singleton births.
Statistical analyses The potential associations between the spatial access measures and antenatal care use, smoking, and birth outcomes were tested using correlation analysis.
Correlation is a statistical method which measures the strength of the relationship between 2 variables—for example, if there is a high positive correlation, it means that as the value of 1 variable rises, the value of the second variable is expected to rise as well. While correlation can measure the extent of the relationship between 2 variables, it cannot assess whether 1 variable causes a change in the other variable, or whether both variables are being affected in the same way by a third, unmeasured variable.
Given the constraints of the data, however, correlation analyses between IREG-level variables are the most appropriate technique for this project. The analysis tests whether IREG-level access to maternal health services is associated with IREG-level antenatal care use, smoking during pregnancy, and birth outcomes. Each potential relationship is tested separately, and the results are presented in Table 4.3.

Spatial variation in Aboriginal and Torres Strait Islander women’s access to maternal health services 37
Table 4.3: Correlations between spatial access measures and maternal risk factors/infant health outcomes for 36 Indigenous Regions
% of women in IREG more than a 1 hour drive time(a) from a:
Correlation coefficient, by category of maternal risk factors/infant health outcomes(b)
Antenatal care in first
trimester
Ever smoked
during pregnancy
Smoking after first 20 weeks
Pre-term births
Babies born low
birthweight
GP .040 .063 .145 .514 ** .389 *
ISPHCS with maternal services
.040 .387 * .437 ** .245 .408 *
Hospital with a public birthing unit
.188 .471 * .507 ** .431 ** .507 **
RFDS –.209 –.189 –.176 .038 .041
Any of the 4 .067 .281 .338 * .518 ** .505 **
* Correlation is significant at the 0.05 level (2-tailed).
** Correlation is significant at the 0.01 level (2-tailed).
(a) Calculated using population counts from the 2011 Census and service locations from various sources between 2013 and 2015.
(b) Maternal risk factors and infant health outcomes from the National Perinatal Data Collection 2012–13.
Statistically significant correlations Table 4.3 shows that, at the aggregate IREG level:
• poorer access to GPs is associated with higher rates of pre-term deliveries and low birthweight
• poorer access to ISPHCs with maternal/antenatal services is associated with higher levels of smoking and low birthweight
• poorer access to public birthing units is associated with higher rates of smoking, pre-term deliveries and low birthweight
• access to RFDS has no significant associations with outcomes. (This finding is not surprising because the analysis was done across all IREGs, while RFDS clinics are designed to fill specific gaps in regional and remote areas only.)
• poorer access to any of the 4 services is associated with higher smoking rates and higher rates of pre-term deliveries and low birthweight.
It is important to again emphasise that correlations do not measure causality between the variables: there may be other variables related to both service access and to birth outcomes. However, both the demonstrated associations between access to ISPHCSs and maternal smoking and access to GPs and pre-term deliveries are consistent with expectations.
Non-statistically significant correlations No statistically significant association was found between the spatial access measures and antenatal care use in the first trimester. An alternative specification of antenatal care use (the percentage of women with at least 5 antenatal visits during pregnancy) was tested as well, but there was no statistically significant association.
There are a number of potential reasons why no IREG-level correlation between spatial access and antenatal care use was detected:

38 Spatial variation in Aboriginal and Torres Strait Islander women’s access to maternal health services
• As discussed in Chapter 2, there are issues regarding the quality of the data—in particular, how the first antenatal visit is defined.
• The spatial access measure is binary—within each IREG, women are divided into 2 categories (those within a 1 hour drive time, and those outside a 1 hour drive time). A spatial access measure with a larger number of gradations might yield a different result.
• The spatial access measure captures only 1 aspect of antenatal care—there may be areas within IREGs where antenatal care is geographically accessible, but it is not culturally or financially accessible. The data are also unable to measure whether the types of services match the needs and preferences of the women in that area.
• Aggregate analyses are only able to capture broad relationships between area-level indicators, which by their nature describe the characteristics of the total population of that area, rather than the characteristics of individuals living within that area.
Additional analyses The correlation analyses examined whether there was an association between the percentage of Indigenous women of child-bearing age living more than an hour’s drive from particular types of services, and rates of maternal risk factors and poor birth outcomes.
Another potential way of examining the relationship between spatial access and outcomes is to categorise each area by its level of access and by whether the outcomes are relatively good or poor—and then to compare these categories to identify areas with unexpected results.
There are different ways in which both IREG-level access and outcomes could be characterised. For example, 1 approach would be to simply use the relative distribution of the rates, whereby areas in the top 25% are categorised as ‘good’ and the bottom 25% are ‘poor’, with the rest in the middle. Two drawbacks of this approach are that there are only 36 included IREGs, and there may be little substantive difference between the categories. Another approach would be to set minimum and maximum levels as cut-offs, based on substantive knowledge or previous research. However, there is little guidance in the literature as to what constitutes ‘good’ or ‘poor’ accessibility and outcomes.
A third way to approach the categorisation process involves the ‘natural breaks’ (Jenks) methodology, which is a method that groups similar values and which maximises differences between classes (that is, it groups ‘like’ with ‘like’). In an exploratory analysis, the Jenks methodology was used to categorise the IREG values for spatial access and the 4 outcome measures (Antenatal care, Smoking after the first 20 weeks of pregnancy, Pre-term birth rates, and Low birthweight) into 3 access or outcome classes: ‘poor’, ‘medium’ and ‘good’.
Table 4.4 summarises the breaks that were used to define the 3 categories for the 5 variables considered. Note that, for some variables (for example, Antenatal care), lower percentages are defined as ‘poor’, while for others (for example, Smoking) lower percentages are defined as ‘good’. Table 4.5 presents the number of IREGs within each category.

Spatial variation in Aboriginal and Torres Strait Islander women’s access to maternal health services 39
Table 4.4: Ranges used to define ‘poor’, ‘medium’ and ‘good’ categories for spatial access and outcomes measures
Category of IREG-level descriptive statistic
% of Indigenous women of
child-bearing age living more than a 1
hour drive time from any maternal
health service
% of Indigenous mothers who had antenatal care in
first trimester
% of Indigenous mothers who
smoked after first 20 weeks of
pregnancy
% of pre-term babies born to
Indigenous mothers
% of low birthweight
babies born to Indigenous
mothers
Poor 15.01–37.20 25.32–45.14 48.01–59.62 16.34–20.03 13.25–18.87
Medium 2.30–15.00 45.15–58.14 28.29–48.00 13.53–16.33 10.41–13.24
Good 0–2.29 58.15–82.70 22.93–28.28 8.10–13.52 6.33–10.40
Table 4.5: Number of IREGs, by access/outcome category
Access/outcome category
Access to any maternal health
service(a)
First trimester antenatal care
visit
Smoking after 20 weeks
% Pre-term births
% low birthweight
Poor 2 8 10 8 7
Medium 7 16 25 13 14
Good 28 13 2 16 16
(a) This variable is based on the IREG-level measure of access to any of the 4 included types of maternal health services.
The access categories were cross-tabulated with each outcome measure separately, to identify how many areas there were with expected or unexpected relationships between access and outcomes (for example, areas with good access but poor outcomes, or poor access but good outcomes). The results of the analyses are presented below in tables 4.6 to 4.9.
Table 4.6: Cross-tabulation of access to any maternal health service, by first trimester antenatal care use, number of IREGs
Access to any maternal health service
Categorisation of first trimester antenatal care use
Good Medium Poor Total
Good 10 11 7 28
Medium 2 4 1 7
Poor 1 1 0 2
Total 13 16 8 37

40 Spatial variation in Aboriginal and Torres Strait Islander women’s access to maternal health services
Table 4.7: Cross-tabulation of access to any maternal health service, by smoking after 20 weeks of pregnancy, number of IREGs
Access to any maternal health service
Categorisation of smoking after 20 weeks ofpregnancy
Good Medium Poor Total
Good 1 23 4 28
Medium 1 2 4 7
Poor 0 0 2 2
Total 2 25 10 37
Table 4.8: Cross-tabulation of access to any maternal health service, by pre-term delivery rates, number of IREGs
Access to any maternal health service
Categorisation of pre-term birth rates
Good Medium Poor Total
Good 15 9 4 28
Medium 1 4 2 7
Poor 0 0 2 2
Total 16 13 8 37
Table 4.9: Cross-tabulation of access to any maternal health service, by percentage of babies with low birthweight, number of IREGs
Access to any maternal health service
Categorisation of percentage of babies with low birthweight
Good Medium Poor Total
Good 16 8 4 28
Medium 0 5 2 7
Poor 0 1 1 2
Total 16 14 7 37
In summary:
• the outcome with the highest number of unexpected findings is low antenatal care use in the first trimester, with 7 out of 37 IREGs appearing to have good access, but relatively low rates (that is, a poor outcome) of First trimester antenatal care use. Again, caution must be exercised around the antenatal care variable because of jurisdictional differences in the definition of what constitutes a ‘first antenatal care’ visit
• there are 4 IREGS with good access, but high smoking rates (that is, poor outcomes) • there are 4 IREGS with good access, but poor infant health outcomes (high rates of both
pre-term births and low birthweight).
These findings are presented here as an exploratory analysis, which could be expanded upon once more years of the outcome measures become available. The results are dependent upon how the areas are categorised, and future development of this method would test different ways of setting the threshold values for assigning areas into the various categories.

Spatial variation in Aboriginal and Torres Strait Islander women’s access to maternal health services 41
While spatial accessibility to services is important, it is not the only factor which affects maternal risk factors and birth outcomes. That is, on its own, it is a necessary, but not sufficient factor, in improving birth outcomes for babies born to Indigenous mothers. The services themselves need to be financially and culturally accessible, have the capacity to serve the population, and the care within them must meet the medical, social and psychological needs of the clients.

42 Spatial variation in Aboriginal and Torres Strait Islander women’s access to maternal health services
5 Conclusion Ensuring that Aboriginal and Torres Strait Islander women of child-bearing age have access to public birthing services and to high-quality, culturally competent antenatal and health care is an important policy issue and 1 of the goals of the National Maternity Services Plan (AHMC 2011).
This report has focused on spatial access to 4 key types of maternal health services, by calculating 1 hour drive time boundaries for those services. These data can be used to identify areas where women have relatively poor physical access to either a specific type of service, or poor access to any service.
This report has shown that access to services (as measured by the percentage of Indigenous women of child-bearing age in an IREG who lived outside a 1 hour drive time to a service) is associated with maternal behaviours and birth outcomes in the following ways:
• poorer access to GPs is associated with higher rates of pre-term deliveries and low birthweight
• poorer access to ISPHCs with maternal/antenatal services is associated with higher levels of smoking and low birthweight
• poorer access to hospitals with public birthing units is associated with higher rates of smoking, pre-term deliveries and low birthweight
• poorer access to any of the 4 services is associated with higher smoking rates and higher rates of pre-term deliveries and low birthweight.
Although no statistical relationship was found between aggregated area-level measures of spatial access to services and the timing of first antenatal care visit, the lack of an observed relationship is likely to be a function of both data quality issues and the nature of the aggregate-level analyses (discussed below).
Importance of factors in addition to access affecting the use of antenatal care While spatial accessibility to services is important, antenatal care use itself is a function of both supply and demand. Even if services are available in an area, women may not use them because there are service-level barriers (for example, they are not culturally or financially accessible) or for other reasons, such as women not realising they are pregnant; personal or family issues; the ‘wantedness’ of the pregnancy; low levels of recognition of the importance of antenatal care; and so on. Research has shown that the women most likely to get care early and attend all their visits are those who are more educated, healthier, and have more social and personal capital.
Importance of the content of antenatal care This report has focused on the spatial accessibility of services offering antenatal care. The analyses were unable to capture the content or quality of the antenatal care being offered, or whether it meets the needs of the women attending. (For example, there are no data on whether particular services are able to adequately address issues such as nutrition, chronic stress, infections, dental health, and so on.)

Spatial variation in Aboriginal and Torres Strait Islander women’s access to maternal health services 43
Recent research has shown that using an instrument which measures the adequacy of the content of antenatal care during the visits has a much stronger relationship with birth outcomes than does measuring attendance at antenatal care on its own (Beekman et al. 2012).
Caution must also be exercised around the impact that antenatal care, on its own, can have in overcoming the long-term effects of the distal, intermediate and proximal determinants affecting maternal and infant health. However, high-quality services that recognise and address these issues have a higher likelihood of improving outcomes for mothers and babies.
Limitations From a methodological perspective, there are inherent limitations to aggregate analyses. Aggregate analyses are only able to capture broad relationships between area-level indicators, which by their nature describe the characteristics of the total population of that area, rather than the characteristics of individuals living within that area.
As discussed in Chapter 2, the antenatal care variables had data quality issues, including differing definitions of ‘first antenatal visit’ between jurisdictions and differing models of antenatal care provision between and within jurisdictions.
The spatial access measure is a binary one—within each IREG, women are divided into 2 categories (those within a 1 hour drive time, and those outside a 1 hour drive time). A spatial access measure with a larger number of gradations might yield different results.
Additionally, data on all services that may have been operating in an area (such as outreach services) were not able to be included.
The data collections used to inform this study were collected at different points in time (GP locations are from 2013; RFDS clinics are from 2013–15; public birthing units are from 2015; ISPHCSs are from 2015; and perinatal data are from 2012–13).
The above limitations are considered acceptable for the purposes of the exploratory analyses presented in this report.
Future work Future analyses could build on this work by incorporating more finely grained service indicators, as well as more detailed measures of maternal risk factors and birth outcomes. It could also include data on outreach services; ISPHCSs which do not report to the OSR collection; and antenatal/postnatal clinics run out of hospitals which do not have birthing units.
As more years of data from the NPDC become available, it may be possible to do more longitudinal analyses where changes in service location and accessibility are able to be linked to changes in maternal risk factors and birth outcomes.

44 Spatial variation in Aboriginal and Torres Strait Islander women’s access to maternal health services
Appendix A: Detailed methods
Geocoding of service locations Latitude and longitude coordinates for each of the services were derived from address information using GPS Visualizer (Schneider 2013), an online geo-coder that converts physical address information into latitude and longitude coordinates. The resulting coordinates were loaded into MapInfo Professional (a geographic information system (GIS) software application) and plotted onto Australian Statistical Geography Standard (ASGS) digital boundary maps of Australia, obtained from the ABS website.
Address data were validated using Bing satellite maps (a web-based mapping service provided by Microsoft) to determine the service locations of GPs. A potential disadvantage of using satellite imagery to validate the locations of services is the age of the satellite maps available in the public domain. Often satellite imagery is composed of several years of data, meaning it is possible for a service to exist in a particular area even though it does not appear in the satellite map. When this issue arose, other satellite mapping applications such as Google Earth (maps and street view) were used to confirm the existence of a service. However, there were instances when these too failed, and a call to the health service in question was necessary to validate its street address.
A second issue associated with the validation of locations using satellite maps was the loss of map resolution with increased remoteness, making it difficult to verify the location of services in Remote and Very remote locations. When this occurred, validation of service locations was undertaken in the same way as described above for dealing with older satellite maps.
Population centroids MapInfo Professional’s Drivetime application was used to calculate travel distances between population centroids and service locations. A population centroid denotes the geographic centre point of an ASGS-derived boundary. Populations tend to be distributed throughout a geographic boundary. Hence, the centre point is used to represent the location of the boundary’s population in much the same way as a mean represents the average point within a data set. SA1 centroids were selected to represent the locations of populations primarily because they are the smallest geographic level at which ABS population data are available and because of their relatively small size compared with that of other geographic areas. How well the geographic midpoint represents the location of the population of an SA1 depends on the size of the SA1 and the distribution of people within its borders. The ABS determined the size of SA1s so that most had a population ranging from 200–800 people (ABS 2011).
In most instances, the dense populations in metropolitan areas ensure that SA1s are small enough to be adequately represented by a given area’s geographic midpoint (centroid). However, the size of areas is population-dependent; therefore, areas increase in size as their populations are more widely distributed with increasing remoteness. Hence, centroids—the geographic midpoints of SA1s—are less precise approximations of the actual locations of people in remote areas than in more densely populated urban and regional areas. The size of some SA1s in Very remote areas of Australia exceeds 100,000 square kilometres (an SA1 in Western Australia covers 329,000 square kilometres). However, there are also many small SA1s around towns, villages and settlements in Remote and Very remote areas. In Very remote areas, 85% of Aboriginal and Torres Strait Islander people live in SA1s that are less

Spatial variation in Aboriginal and Torres Strait Islander women’s access to maternal health services 45
than 100 square kilometres in area. In combination with the manual adjustment of centroids described in the next section, this tendency for the majority of the population to live in smaller SA1s ensures that the centroids provide a relatively accurate representation of the location of SA1 populations.
A common method used to ensure that centroids are placed where they best represent the location of people within an area is the construction of population-weighted centroids. Population data, at a smaller geographic level than that used in the analysis for this report, are used to create a centroid that represents the average location of people within the larger area. However, it was not possible to use population-weighted centroids in this study as population data from the 2011 Census have not been released at a level lower than SA1 for reasons related to confidentiality and privacy. Instead, the centroids of larger SA1s in Remote and Very remote areas were adjusted manually, based on the actual locations of communities in these areas.
Manual adjustment of area centroids The locations of area centroids in larger SA1s in Remote and Very remote areas were derived manually, using the Australian Government Indigenous Programs and Policy Locations data set, in conjunction with GIS ‘Bing’ web-based satellite maps. Once the locations of population centres were determined, area centroids were placed in such a way that the total distance to all known communities within each area was minimised. In total, 105 SA1 area centroids in Remote and Very remote areas were adjusted manually, representing less than 1% (0.19%) of all SA1s. All distances were measured using MapInfo Professional.
It should be noted that using a single population centroid to represent populations spread over large areas is a limitation of any geospatial analysis. One possible solution to this problem—and one that future studies of access to primary health care in Remote and Very remote areas of Australia may be able to use—would be to develop multiple centroids for the largest areas.
Calculating drive times from population centroid-to-service locations Coordinates for geographic centroids and service locations were entered into a rectangular matrix within Drivetime, and the travel times (by road in a motor vehicle) from each centroid to all primary health care services located within 1 hour were calculated. Drivetime determines travel times based on the quickest route between the origin (centroid) and destination (such as ISPHCSs, GPs, public hospitals). Travel times are generated according to the ambient travel speed available on a given road network. The time represents the minimum off-peak travel time for the road type (highway, suburban street and so forth), assuming the highest driving speeds available to a driver of a car on a given road network between 8.30 am and 3.30 pm and after 7.00 pm on weekdays.
A potential limitation of using geographic-based centroids when calculating population travel times to health providers is that the location of the centroid representing the population may not be on a road. MapInfo Professional’s Drivetime attempts to control for this by allowing for the adjustment of off-network travel speed at the point of origin and point of destination. Off-network travel speeds for the origin and destination were both set at 200 km/h. When an area centroid (origin point) is located some distance from a road network, Drivetime travels the distance between the origin/destination point and the nearest road at 200 km/h.

46 Spatial variation in Aboriginal and Torres Strait Islander women’s access to maternal health services
This ambient travel speed of 200 km/h was selected arbitrarily and is based on the assumption that the majority of Australian cities, towns and communities, including Indigenous communities, are accessible by road. Therefore, travel times between area centroids and the nearest road network should be set at a high speed in order to model travel times as realistically as possible. Off-network travel time is a concern only in very large SA1s where the area centroid is more likely to be located far from a road network. In this study, as well as setting the off-network travel times to 200 km/h, the locations of area centroids were adjusted manually in the larger SA1s to make travel time estimates more realistic. This method is consistent with what has been done to calculate drive times in previous AIHW reports.
One (1) hour is often considered the maximum time people should have to travel to access primary or emergency health care (Bagheri et al. 2008). Of course, the time people are prepared to travel to access health care is likely to vary between different areas and populations.
Proportion of SA2 population within a 1 hour drive time of nearest service location The whole population of each SA1 was assumed to have the same drive time to their nearest service location (SA1 centroid-to-service as described above). The proportion of the total population—the non-Indigenous population and the Aboriginal and Torres Strait Islander population of an SA2 who live within a 1 hour drive of their nearest service location—was then taken to be the proportion who live in an SA1 with a centroid within 1 hour of the nearest service.
Concordance of perinatal data to IREG/PHN Perinatal data were concorded from SA2 to PHN using the population-weighted concordance file made available by the Department of Health at <http://www.health.gov.au/internet/main/publishing.nsf/Content/PHN-Concordances>.
Proportion of IREG/PHN populations within a 1 hour drive time of nearest service location The 2011 SA1-level Census counts of the Indigenous and non-Indigenous populations were used to create a concordance from SA2s to Indigenous Regions (IREGs). Each SA1 is wholly contained within 1 SA2 and 1 IREG. Where SA2s fall within more than 1 IREG, the SA1-level census counts can therefore be used to calculate the proportions of the Indigenous and non-Indigenous SA2 populations that live within each IREG. These proportions can then be used to perform a population-weighted concordance of data from SA2 to IREG. These are done separately for each type of service.
The proportion of people with no access to any service was calculated as the proportion of an area’s population living in SA1s more than 1 hour’s drive time from all included service types. This means that:
• the proportion of people with no access to any service can never be higher than the lowest proportion with no access to any of the individual service types. For example, if 30% of people in an IREG do not have access to a GP service, then the proportion of

Spatial variation in Aboriginal and Torres Strait Islander women’s access to maternal health services 47
people with no access to any service cannot be higher than 30% (because 70% of people have access to at least a GP service)
• the proportion of people with no access to any service can be lower than the lowest proportion with no access to any of the individual service types if different SA1 populations have access to different types of services. For example, let’s assume that 30% of people in an IREG do not have access to a GP service, 25% do not have access to an ISPHCS service and 100% of people do not have access to any other type of service. The proportion of people with no access to any service in this IREG could be 0% if the 25% with no access to an ISPHCS were not included in the 30% with no access to a GP (because the 70% of people with access to a GP and the 75% of people with access to an ISPHCS could cover the whole population).

48 Spatial variation in Aboriginal and Torres Strait Islander women’s access to maternal health services
Appendix B: PHN results A similar process was used to analyse variation across PHNs as in the IREG analyses, where descriptive statistics are presented first, followed by statistical analyses.
Descriptive statistics Table B1: Spatial access measures, descriptive statistics for 31 PHNs, 2011 (population) and 2013–15 (service locations)
Descriptive statistics across 31 PHNs
Percentage of Indigenous women in PHN outside a 1 hour drive time to:
GP
ISPHCS with maternal health
services
Hospital with a public birthing
unit RFDS Any of the 4
services
Mean 2.4 9.5 11.5 88.7 1.2
Median 0.0 1.1 1.2 100.0 0.0
Standard deviation
7.1 14.0 18.2 18.9 3.1
Minimum 0.0 0.0 0.0 34.2 0.0
Maximum 36.6 52.2 64.0 100.0 15.2
Table B2: Maternal risk factors and infant health outcomes, descriptive statistics for 31 PHNs, National Perinatal Data Collection, 2012–13
Descriptive statistics across 31 PHNs
Percentage of Indigenous mothers/babies born to Indigenous mothers in PHN
Antenatal care in first trimester
Ever smoked during pregnancy
Smoking after first 20 weeks
Pre-term deliveries
Babies born with low birthweight
Mean 47.1 46.2 39.7 14.0 10.4
Median 47.9 46.6 40.9 13.8 10.4
Standard deviation
11.9 8.1 8.4 2.4 2.3
Minimum 24.9 23.2 19.4 9.0 6.5
Maximum 82.7 58.7 52.0 20.7 15.5
Note: ‘Antenatal care’ and smoking variables are for Indigenous mothers. ‘Pre-term deliveries’ and ‘low birthweight’ are for babies born to Indigenous mothers.
The tables show similar patterns to the IREG results—that is, there is wide variation across areas in the spatial accessibility measures and the maternal risk factor and infant health outcomes.
Statistical analyses The correlation coefficients for spatial accessibility to service measures, maternal risk factors and birth outcomes are presented in Table B3.

Spatial variation in Aboriginal and Torres Strait Islander women’s access to maternal health services 49
Table B3: Correlations between spatial access measures and maternal risk factors/infant health outcomes for 31 Primary Health Networks
Percentage of women in PHN outside a 1 hour drive time to:
Correlation coefficient, by category of maternal risk factors/infant health outcomes
Antenatal care in first
trimester
Ever smoked
during pregnancy
Smoking after first 20 weeks
Pre-term births
Babies born low
birthweight
GP .279 .193 .252 .294 .305
ISPHCS with maternal services .311 .404 * .471 ** –.024 .051
Hospital with a public birthing unit .483 ** .316 .408 * .170 .221
Any of the services .340 .203 .269 .318 .326
* Correlation is significant at the 0.05 level (2-tailed).
** Correlation is significant at the 0.01 level (2-tailed).
The analysis shows different patterns at the PHN level (compared with the IREG level), in that access to:
• GPs do not have a significant association with any of the outcomes • ISPHCSs is associated with smoking behaviour, but not with birth outcomes • hospitals with public birthing units is associated with antenatal care in the first trimester
and smoking after 20 weeks of pregnancy, but not with birth outcomes • the access to any service measure does not have a significant association with any of
the outcomes.

50 Spatial variation in Aboriginal and Torres Strait Islander women’s access to maternal health services
Glossary antenatal: The period covering conception up to the time of birth; synonymous with ‘prenatal’.
birth status: Status of the baby immediately after birth (stillborn or live-born).
birthing facility/service/unit: A hospital or stand-alone facility that offers a dedicated service into which women book to give birth.
birthweight: The first weight of the baby (stillborn or live-born) obtained after birth (usually measured to the nearest 5 grams and obtained within 1 hour of birth).
continuity of care: An episode of care experienced by the patient as complete, consistent or seamless—even if it is provided in a number of different consultations by different providers. cultural competency: A set of congruent behaviours, attitudes and policies that come together, in a system, agency or among professionals, to enable that system, agency or those professionals to work effectively in cross-cultural situations. (Refer, for example, to the Cultural Respect Framework 2016–2026 for Aboriginal and Torres Strait Islander Health prepared by the Australian Health Ministers’ Advisory Council’s National Aboriginal and Torres Strait Islander Health Standing Committee.)
fetal death (stillbirth): Death, before the complete expulsion or extraction from its mother, of a product of conception of 20 or more completed weeks of gestation or of 400 grams or more birthweight. Death is indicated by the fact that, after such separation, the fetus does not breathe or show any other evidence of life, such as beating of the heart, pulsation of the umbilical cord or definite movement of voluntary muscles.
fetal death rate: Number of fetal deaths per 1,000 total births (fetal deaths plus live births).
geographic or spatial accessibility: Extent to which a location is physically accessible by road within a specified travel time, under typical road and traffic conditions.
geospatial software: Geographic information system (GIS) software; for example, MapInfo, QGIS or ESRI ArcGIS.
Indigenous: A person of Aboriginal and/or Torres Strait Islander descent who identifies as an Aboriginal and/or Torres Strait Islander.
Jenks methodology: A data clustering method designed to determine the best arrangement of values into different classes. This is done by seeking to minimise each class’s average deviation from the class mean, while maximising each class’s deviation from the means of the other groups.
live birth: The complete expulsion or extraction from its mother of a product of conception, irrespective of the duration of the pregnancy, which, after such separation, breathes or shows any other evidence of life, such as beating of the heart, pulsation of the umbilical cord or definite movement of voluntary muscles, whether or not the umbilical cord has been cut or the placenta is attached; each product of such a birth is considered live-born.
low birthweight: Weight of a baby at birth that is less than 2,500 grams.
maternal age: Mother’s age in completed years at the birth of her baby.

Spatial variation in Aboriginal and Torres Strait Islander women’s access to maternal health services 51
mother’s length of stay: Number of days between admission date (during an admission resulting in a birth) and separation date (from the hospital where birth occurred). The interval is calculated by subtracting the date of admission from the date of separation.
neonatal death: Death of a live-born baby within 28 days of birth.
neonatal mortality rate: Number of neonatal deaths per 1,000 live births.
non-Indigenous: People who have indicated that they are not of Aboriginal or Torres Strait Islander descent.
perinatal death: A fetal or neonatal death of at least 20 weeks’ gestation or at least 400 grams birthweight.
perinatal mortality rate: Number of perinatal deaths per 1,000 total births (fetal deaths plus live births).
post-term birth: Birth at 42 or more completed weeks of gestation.
pre-term birth: Birth before 37 completed weeks of gestation.
private birthing unit: A birthing unit which provides only private birthing services, to those with the financial resources to access them.
public birthing unit: A birthing unit which accepts public patients. A public birthing unit can be located at either a public or private hospital.
remoteness structure: A geographical standard for the publication of statistics by relative remoteness, which forms part of the Australian Statistical Geography Standard (ASGS) used by the Australian Bureau of Statistics. The remoteness structure classifies Australia into large regions that share common characteristics of remoteness. It includes the following remoteness areas: Major cities, Inner regional, Outer regional, Remote, Very remote and Migratory.
stillbirth: See fetal death (stillbirth).

52 Spatial variation in Aboriginal and Torres Strait Islander women’s access to maternal health services
References ABS (Australian Bureau of Statistics) 2010. The health and welfare of Australia’s Aboriginal and Torres Strait Islander peoples, Oct 2010. ABS cat. no. 4704.0. Canberra: ABS.
ABS 2011. Australian Statistical Geography Standard (ASGS): Volume 1—main structure and greater capital city statistical areas, July 2011. ABS cat. no. 1270.0.55.001. Canberra: ABS.
ABS 2013. Estimates of Aboriginal and Torres Strait Islander Australians, June 2011. ABS cat. no. 3238.0.55.001. Canberra: ABS.
Australian Health Ministers’ Advisory Council’s National Aboriginal and Torres Strait Islander Health Standing Committee 2017. Cultural respect framework 2016–2026 for Aboriginal and Torres Strait Islander health. Canberra: AHMAC.
AHMC (Australian Health Ministers’ Conference) 2011. National Maternity Services Plan. Canberra: Department of Health.
AIHW (Australian Institute of Health and Welfare) 2014a. Access to primary health care relative to need for Indigenous Australians. Cat. no. IHW 128. Canberra: AIHW.
AIHW 2014b. Timing impact assessment for COAG Closing the Gap targets: child mortality. Cat. no. IHW 124. Canberra: AIHW.
AIHW 2015a. Aboriginal and Torres Strait Islander health performance framework 2014: detailed tables. Cat. No. IHW 167. Canberra: AIHW.
AIHW 2015b. Australia’s mothers and babies 2013—in brief. Perinatal statistics series no. 31. Cat. no. PER 72. Canberra: AIHW.
AIHW 2015c. Spatial variation in Aboriginal and Torres Strait Islander people’s access to primary health care. Cat. no. IHW 155. Canberra: AIHW. AIHW 2016. Australia’s mothers and babies 2014—in brief. Perinatal statistics series no. 32. Cat. no. PER 87. Canberra: AIHW.
AIHW 2017. Aboriginal and Torres Strait Islander health performance framework 2017: supplementary online tables. Cat. no. WEB 170. Canberra: AIHW.
AMPCo (Australasian Medical Publishing Company) 2013. Medical directory of Australia. Sydney: AMPCo. Viewed 13 July 2016, <http://www.ampco.com.au/mda-online>.
ANFPP (Australian Nurse-Family Partnership Program) 2015. ANFPP national annual data report 2013–2014. Viewed 25 July 2016, <https://www.anfpp.com.au/news/45-national-annual-data-report-2013-2014>.
Bagheri N, Benwell G & Holt A 2008. Modelling accessibility to primary health care using a spatial accessibility index. Hawai’i Journal of Public Health 1(1):14–27.
Beeckman K, Louckx F, Downe S & Putman K 2012. The relationship between antenatal care and preterm birth: the importance of content of care. European Journal of Public Health 23(3):366–371.
Grzybowski S, Stoll K & Kornelson J 2011. Distance matters: a population-based study examining access to maternity services for rural women. BMC Health Services Research 11:147–54.

Spatial variation in Aboriginal and Torres Strait Islander women’s access to maternal health services 53
Henry B, Dunbar T, Barclay L & Thompson R. 2007. Self-discharge against medical advice from Northern Territory hospitals: prevalence rates, experiences and suggestions, economic implications and recommended strategies for improvement. Darwin: Graduate School for Health Practice and the School for Social and Policy Research, Charles Darwin University and the Cooperative Research Centre for Aboriginal Health.
Kristine Battye Consulting 2013. Descriptive analysis of New Directions Mothers and Babies Services Program: final report. Canberra: Department of Health and Ageing.
Kruske S 2011. The characteristics of culturally competent maternity care for Aboriginal and Torres Strait Islander women. Prepared for the Maternity Services Inter-jurisdictional Committee for the Australian Health Ministers’ Advisory Council. Canberra: Standing Council on Health.
Osborne K, Baum F & Brown L 2013. What works? A review of actions addressing the social and economic determinants of Indigenous health. Issues paper no. 7. Produced for the Closing the Gap Clearinghouse. Canberra: Australian Institute of Health and Welfare and Melbourne: Australian Institute of Family Studies.
Pagnini DL & Reichman NE 2000. Psychosocial factors and the timing of prenatal care among women in New Jersey’s HealthStart program. Family Planning Perspectives 32(2):56–64.
RACGP (Royal Australian College of General Practitioners) 2012. Antenatal care. In: National guide to a preventive health assessment for Aboriginal and Torres Strait Islander people. 2nd edn. South Melbourne: RACGP.
Rayburn WF, Richards ME & Elwell EC 2012. Drive times to hospitals with perinatal care in the United States. Obstetrics and Gynecology 119(3):611–16.
Reading CL & Wien F 2009. Health inequalities and social determinants of Aboriginal peoples’ health. Prince George, British Columbia: National Collaborating Centre for Aboriginal Health.
Reeves S & Bernstein I 2008. Effects of maternal tobacco-smoke exposure on fetal growth and neonatal size. Expert Review of Obstetrics and Gynecology. Nov 1, 2008; 3(6):719–730.
Schneider A 2013. GPS Visualizer. Portland: Adam Schneider. Viewed July 13 2013, <http://www.gpsvisualizer.com/geocoder>.
Walford HH, Trinh S, Weincrot A & Lu, MC 2011. What is the role of prenatal care in reducing racial and ethnic disparities in pregnancy outcomes? In: Handler A, Kennelly J & Peacock N (eds). Reducing racial/ethnic disparities in reproductive and perinatal outcomes. New York: Springer, 151–179.
Williams D 2011. A smoother pathway to birth. Pacific Journal of Reproductive Health 2015; 1.
Wyndow P & Jackiewicz T 2014. Identifying and supporting pregnant Aboriginal women and their families during their patient journey through services and across geographical areas: a feasibility study. Telethon Kids Institute and the University of Western Australia under contract with the Department of Health, Western Australia.

54 Spatial variation in Aboriginal and Torres Strait Islander women’s access to maternal health services
List of tables Table 2.1: Numbers of IREGs and PHNs, by jurisdiction ........................................................ 11
Table 2.2: Main data sources ................................................................................................... 17
Table 3.1: Number of hospitals with public and private birthing units, by remoteness, 2015 .. 20
Table 3.2: Indigenous women of child-bearing age living more than a 1-hour drive time from a hospital with a public birthing unit, by state and territory, 2011 (population) and 2015 (birthing unit locations) ................................................................................... 23
Table 3.3: Number of service locations providing maternal health services, by remoteness, by service type, 2015 .............................................................................................. 24
Table 3.4: Number of Indigenous women of child-bearing age and service type locations, by state and territory, 2011 (population) and 2013–15 (service locations) ............. 30
Table 3.5: Percentage of Indigenous women of child-bearing age (15–44) living within a 1 hour drive time of a maternal health service, by remoteness, by service type, 2011 (population) and 2013–15 (service locations) ................................................ 31
Table 3.6: Percentage of Indigenous women of child-bearing age (15–44) living within a 1 hour drive time of a maternal health service, by state/territory, by service type, 2011 (population) and 2013–15 (service locations) ................................................ 31
Table 3.7: SA2s where Indigenous women of child-bearing age (15–44) live more than a 1 hour drive time from either a GP, ISPHCS with maternal services, public birthing unit or RFDS clinic, 2011 (population) and 2013–15 (service locations) ... 33
Table 4.1: Spatial access measures, descriptive statistics for 36 Indigenous Regions, 2011 (population) and 2013–15 (service locations) ................................................ 35
Table 4.2: Maternal risk factors and infant health outcomes, descriptive statistics for 37 Indigenous Regions, National Perinatal Data Collection, 2012–13 ................... 36
Table 4.3: Correlations between spatial access measures and maternal risk factors/infant health outcomes for 36 Indigenous Regions .......................................................... 37
Table 4.4: Ranges used to define ‘poor’, ‘medium’ and ‘good’ categories for spatial access and outcomes measures ......................................................................................... 39
Table 4.5: Number of IREGs, by access/outcome category .................................................... 39
Table 4.6: Cross-tabulation of access to any maternal health service, by first trimester antenatal care use, number of IREGs .................................................................... 39
Table 4.7: Cross-tabulation of access to any maternal health service, by smoking after 20 weeks of pregnancy, number of IREGs ............................................................. 40
Table 4.8: Cross-tabulation of access to any maternal health service, by pre-term delivery rates, number of IREGs .......................................................................................... 40
Table 4.9: Cross-tabulation of access to any maternal health service, by percentage of babies with low birthweight, number of IREGs ....................................................... 40
Table B1: Spatial access measures, descriptive statistics for 31 PHNs, 2011 (population) and 2013–15 (service locations) ............................................................................. 48
Table B2: Maternal risk factors and infant health outcomes, descriptive statistics for 31 PHNs, National Perinatal Data Collection, 2012–13 ......................................... 48
Table B3: Correlations between spatial access measures and maternal risk factors/infant health outcomes for 31 Primary Health Networks .................................................. 49

Spatial variation in Aboriginal and Torres Strait Islander women’s access to maternal health services 55
List of figures Figure 1.1: Distal, intermediate and proximal determinants of infant health outcomes .............. 2
Figure 2.1: Boundaries of statistical areas, levels 2, 3 and 4 (SA2, SA3 and SA4) .................... 9
Figure 2.2: Indigenous Region (IREG) names and boundaries ................................................ 11
Figure 2.3: PHN boundaries ...................................................................................................... 12
Figure 2.4: Theoretical relationship between service accessibility and birth outcomes ........... 14
Figure 3.1: Hospitals with public birthing units and number of Indigenous women of child-bearing age, by SA2, 2015 (birthing unit locations) and 2011 (population) ... 21
Figure 3.2: Percentage of Indigenous women of child-bearing age living within a 1 hour drive time of a hospital with a public birthing unit, by SA2, 2011 (population) and 2015 (birthing unit locations) ............................................................................ 22
Figure 3.3: Number and percentage of Indigenous women of child-bearing age living more than a 1 hour drive time from a hospital with a public birthing unit, by remoteness categories, 2011 (population) and 2015 (birthing unit locations) ........ 23
Figure 3.4: Locations of maternal health services and number of Indigenous women of child-bearing age, by SA2, western and central Australia, 2013–15 (service locations) and 2011 (population) ............................................................................. 25
Figure 3.5: Locations of maternal health services and number of Indigenous women of child-bearing age, by SA2, eastern Australia, 2013–15 (service locations) and 2011 (population) .................................................................................................... 26
Figure 3.6: Locations of maternal health services and number of Indigenous women of child-bearing age, by SA2, Sydney, 2013–15 (service locations) and 2011 (population) ............................................................................................................. 27
Figure 3.7: Locations of maternal health services and number of Indigenous women of child-bearing age, by SA2, Darwin, 2013–15 (service locations) and 2011 (population) ............................................................................................................. 28
Figure 3.8: Locations of maternal health services and number of Indigenous women of child-bearing age, by SA2, Perth, 2013–15 (service locations) and 2011 (population) ............................................................................................................. 29
Figure 3.9: Percentage of Indigenous women of child-bearing age living within a 1 hour drive time of either a hospital with a public birthing unit, an ISPHCS, an RFDS clinic or a GP, by SA2, 2011 (population) and 2013–15 (service locations) .......... 32

56 Spatial variation in Aboriginal and Torres Strait Islander women’s access to maternal health services
Related publications This report, Spatial variation in Aboriginal and Torres Strait Islander women’s access to 4 types of maternal health services, is 1 of a series of reports by the Indigenous and Maternal Health Group at the AIHW which have used geospatial analyses to investigate issues relevant to Indigenous Australians’ health and welfare. The following other reports may be of interest:
• AIHW 2014. Access to primary health care relative to need for Indigenous Australians. Cat. no. IHW 128. Canberra: AIHW.
• AIHW 2015. Spatial variation in Aboriginal and Torres Strait Islander people’s access to primary health care. Cat. no. IHW 155. Canberra: AIHW.
• AIHW 2016. Spatial distribution of the supply of the clinical health workforce 2014: relationship to the distribution of the Indigenous population. Cat. no. IHW 170. Canberra: AIHW.

Stronger evidence,better decisions,improved health and welfare
Stronger evidence, better decisions, improved health and welfare
This report examines spatial variation in Aboriginal and Torres Strait Islander women’s access to hospitals with public birthing units and 3 other types of maternal health services. It also investigates possible high-level associations between access, maternal risk factors and birth outcomes.
aihw.gov.au
Spatial variation in Aboriginal and Torres Strait Islander women’s access to 4 types of maternal health services