spatial ranking of public services and their...
TRANSCRIPT
Spatial Ranking of Public Services and their Shortage
in Cities (Case Study: Noorabad Mamsani City)
Ali Shamsoddini
Assistant Professor, Department of Human Geography, Marvdasht Branch, Islamic
Azad University, Marvdasht, Iran
Mohammad Reza Amiri Fahlyiani*
Ph.D. Student in Geography and Urban Planning, Faculty of Earth Sciences,
Shahid Chamran University, Ahwaz, Iran
Received: 2014/11/13 Accepted:2015/02/22
Abstract: One of the criteria of social justice and urban sustainable
development is considering balanced distribution of infrastructures and
urban facilities; therefore, the distribution of the services should be in
such a way that not only it creates spatial justice in the areas, but it
also prepare the ground for urban development. This research has
descriptive-analytical approach and tries to recognize and rank the
rate of existing services in 13 neighborhoods of Noorabad Mamsani
City in Fars Province using education, health, and culture, sport,
office, green space, and facility indexes. For this purpose, initially
the prosperity of services in these areas was examined by using
models of the coefficient of variation and statistical techniques and
then, the rate of prosperity of urban services in these neighborhoods
was evaluated and analyzed by using multiple criteria decision
making (MCDM) model based on TOPSIS approach. The results
show that there are significant discrepancies regarding the rate of
prosperity of services among 13 neighborhoods of Noorabad so that
central neighborhoods of the city i.e. neighborhoods 1 and 2 in
district 2, are prosperous and nomadic areas are prosper less.
Eventually, there is imbalance and inequality among different areas
in this city regarding concentration of population and access in
terms of spatial distribution of services.
Keywords: urban services, urban sustainable development, urban
management, TOPSIS model, Noorabad Mamsani
JEL classification: N95, C30, R10, Q01, G20
*Corresponding Author: [email protected]
The Scientific-Research
Quarterly Journal
ISSN: 2345-2870
Indexed in: ISC, SID,
Noormags, RICeST, Ensani,
Magiran
www.Iueam.ir
Vol. 3, No.12
Fall 2015
A Quarterly Journal of Urban Economics and Management _____________________________________ 120
1- Introduction
Currently, more than half of the
world population lives in urban areas
(United Nations, 2009) these areas are
only 4% of the earth. The world
population is growing worryingly. Its
annual growth rate is more than 8.1
percent. It is predicted that urban
population will reach to 84 percent in the
world by 2050. More than 95 percent of
this growth will occur in the developing
countries (Yar Khan et al., 2011). In this
regard, rapid growth of population has
created many problems along with
urbanization extension in different
countries particularly in the third world
countries. Exogenous urbanization has
emerged in Iran with entering oil
revenues in pre-industrial society and its
growth has surpassed on its development
(or quantity on quality) (Rafieyan &
Shali, 2012). Polarization of spatial
structure of cities has leaded to increase
poor quality of the land and create urban
deprived spaces due to management
policies in rating to a specific
environment in absorbing facilities and
services. The deprived area challenges the
concept of legibility of urban area and it
results in city’s poor interpretation. A
space that not only leads people to find
themselves in it, but it also challenges the
characteristic of urban residents (Tirbandi
& Azani, 2012). Therefore, balanced
spatial organization in cities is a kind of
urban sustainability and it will be
achieved when logical harmony and
compatibility create among population
and urban service distributions, but
distribution of services in cities which is
an obvious result of ecological
segregation has influenced on spatial
distribution of services in urban areas in
some cities in developing countries. As a
result, proper and optimal distribution of
social, economic, cultural, and sanitary
facilities among areas is one of the most
important factors avoiding inequalities
and proper spatial distribution of population
in land area (Zakeriyan et.al., 2010).
In Iran, urban centralization process
started after land reform in 1960s. It
increased with the outbreak of imposed
war and it has leaded the shortage of
facilities and urban infrastructures to be
doubled by urban increase and different
urban groups proportional to the quality
of life have different access to these
facilities (Hataminejad et.al., 2011). In
fact, the amount and the quality of
distribution of urban services can have an
influential role in spatial displacement of
population and social changes and it is
considered as one of the criteria of urban
sustainable development and urban social
justice (Taqvayi & Kiyoumarsi, 2011).
Thus, the most important criterion for the
situational analysis of spatial justice and
urban growth is the quality of distribution
of urban facilities. Also, optimal
distribution of facilities and services
required for citizens in city, in such a way
that all citizens to have appropriate access
to it, results in saving time and costs for
citizens spontaneously because of
providing citizens’ needs appropriately
and also avoiding unnecessary movement.
It will provide the necessity of urban
sustainability (Hataminejad et.al, 2008).
In this regard, In this regard, establishing
each urban element in particular spatial-
physical situation of the city follows
121 _ Structural Analysis, Measurement of Spatial Distribution Model and Classification the Construction …
special principles, rules, and mechanisms.
It will lead to success and functional
efficiency of that element in that specific
place in case of observing them;
otherwise the possibility of problems in
urban areas is very high (Zarrabi &
Mousavi, 2010). Thus, it is necessary to
have balance and coordination among
different areas of the city in the
enjoyment of the benefits and impacts of
the development along with observing
progress goals in urban society. If they
are not to be observed, accomplished
planning and investment in these centers
neither will result in development, nor
may intensify the imbalances and may
lead to uncoordinated growth of urban
spaces. Therefore, optimal distribution
of services and facilities should be
accomplished in a way that in addition to
creating spatial justice in the cities, it
would contain the interests of all social
groups in the city.
Since the center area in Mamsani
transferred from Fahliyan village to
Noorabad in 1962, the expansion of
construction in the surrounding lands and
changing them into urban land use
increased and physical dimensions of the
city have been added gradually by
presenting urban facilities and changing
Noorabad into a host city. In this regard,
the rate of population growth of the city
increased relatively so that the number
doubled in each decade compared to the
previous one (Sajjadi & Shamsoddini,
2011). In the meantime, one of the most
important problems of population growth
and development of Noorabad is
inadequacy of urban facilities for their
increasing population’s needs. Also, this
city has heterogeneous combination in
distribution of urban land uses. This has
leaded to have difficulty for residents to
obtain required facilities and services. For
this purpose, it has been tried in this
research the amount of prosperity of 13
neighborhoods of Noorabad regarding
utilities and urban services to be specified
and evaluated by using TOPSIS model
with the goal of identification and ranking
the neighborhoods based on different
economic, social, cultural, and physical
criteria. So, the questions and hypotheses
of the research are:
1- Is there any difference among
different neighborhoods in Noorabad in
terms of prosperity?
2- Is there any relation between the
population of neighborhoods and
distribution of urban services?
Hypothesis:
1- The neighborhoods in Noorabad
have different and unequal level of
services.
2- There is a direct relationship
between the population and ranking of
the neighborhoods of Noorabad in terms
of prosperity.
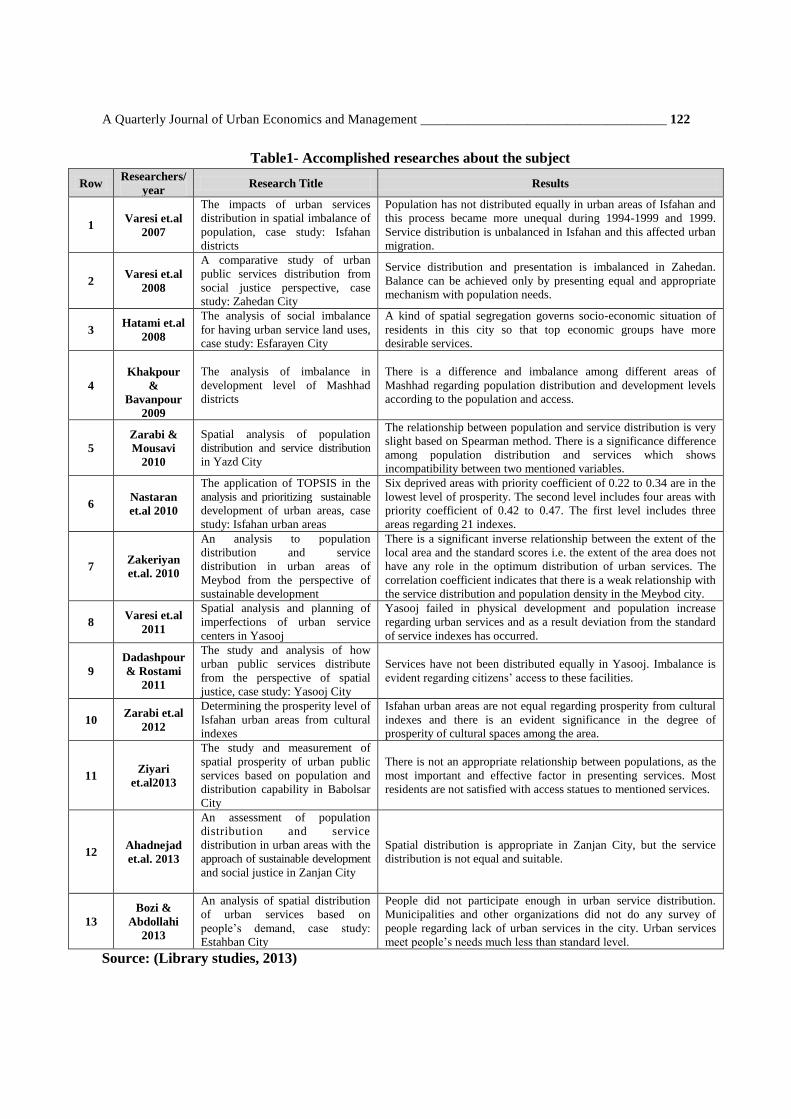
2- Literature Review
In order to investigate spatial
distribution of services in the cities in the
country, several researches have been
done that some of them are summarized
in table 1.
A Quarterly Journal of Urban Economics and Management _____________________________________ 122
Table1- Accomplished researches about the subject
Row Researchers/
year Research Title Results
1 Varesi et.al
2007
The impacts of urban services
distribution in spatial imbalance of
population, case study: Isfahan
districts
Population has not distributed equally in urban areas of Isfahan and
this process became more unequal during 1994-1999 and 1999.
Service distribution is unbalanced in Isfahan and this affected urban
migration.
2 Varesi et.al
2008
A comparative study of urban
public services distribution from
social justice perspective, case
study: Zahedan City
Service distribution and presentation is imbalanced in Zahedan.
Balance can be achieved only by presenting equal and appropriate
mechanism with population needs.
3 Hatami et.al
2008
The analysis of social imbalance
for having urban service land uses,
case study: Esfarayen City
A kind of spatial segregation governs socio-economic situation of
residents in this city so that top economic groups have more
desirable services.
4
Khakpour
&
Bavanpour
2009
The analysis of imbalance in
development level of Mashhad
districts
There is a difference and imbalance among different areas of
Mashhad regarding population distribution and development levels
according to the population and access.
5
Zarabi &
Mousavi
2010
Spatial analysis of population
distribution and service distribution
in Yazd City
The relationship between population and service distribution is very
slight based on Spearman method. There is a significance difference
among population distribution and services which shows
incompatibility between two mentioned variables.
6 Nastaran
et.al 2010
The application of TOPSIS in the
analysis and prioritizing sustainable
development of urban areas, case
study: Isfahan urban areas
Six deprived areas with priority coefficient of 0.22 to 0.34 are in the
lowest level of prosperity. The second level includes four areas with
priority coefficient of 0.42 to 0.47. The first level includes three
areas regarding 21 indexes.
7 Zakeriyan
et.al. 2010
An analysis to population
distribution and service
distribution in urban areas of
Meybod from the perspective of
sustainable development
There is a significant inverse relationship between the extent of the
local area and the standard scores i.e. the extent of the area does not
have any role in the optimum distribution of urban services. The
correlation coefficient indicates that there is a weak relationship with
the service distribution and population density in the Meybod city.
8 Varesi et.al
2011
Spatial analysis and planning of
imperfections of urban service
centers in Yasooj
Yasooj failed in physical development and population increase
regarding urban services and as a result deviation from the standard
of service indexes has occurred.
9
Dadashpour
& Rostami
2011
The study and analysis of how
urban public services distribute
from the perspective of spatial
justice, case study: Yasooj City
Services have not been distributed equally in Yasooj. Imbalance is
evident regarding citizens’ access to these facilities.
10 Zarabi et.al
2012
Determining the prosperity level of
Isfahan urban areas from cultural
indexes
Isfahan urban areas are not equal regarding prosperity from cultural
indexes and there is an evident significance in the degree of
prosperity of cultural spaces among the area.
11 Ziyari
et.al2013
The study and measurement of
spatial prosperity of urban public
services based on population and
distribution capability in Babolsar
City
There is not an appropriate relationship between populations, as the
most important and effective factor in presenting services. Most
residents are not satisfied with access statues to mentioned services.
12 Ahadnejad
et.al. 2013
An assessment of population
distribution and service
distribution in urban areas with the
approach of sustainable development
and social justice in Zanjan City
Spatial distribution is appropriate in Zanjan City, but the service
distribution is not equal and suitable.
13
Bozi &
Abdollahi
2013
An analysis of spatial distribution
of urban services based on
people’s demand, case study:
Estahban City
People did not participate enough in urban service distribution.
Municipalities and other organizations did not do any survey of
people regarding lack of urban services in the city. Urban services
meet people’s needs much less than standard level.
Source: (Library studies, 2013)
123 _ Structural Analysis, Measurement of Spatial Distribution Model and Classification the Construction …
3- Theoretical Principles
Cities are bodies with complex and
dynamic communities. As Robert Park
says; city is not only an artifact object but
it also is an organism. Its growth is
basically natural, uncontrollable, and
without design as a whole (Nam & Jun
Yu, 2007). The context and structure of
today’s cities is the result of the process
that has begun since many years ago. It
has formed under the influence of
different forces such as passage of time,
administrative and political factors, and
social force. The structure and context
have been responsible for different
historical periods. In fact, city has been
the place for the expression of residents’
needs and wills (Karam & Mohammadi,
2009). Also, city has a container and
content relationship with space, natural
environment, human being, and activity.
Yet, it is a container for human being and
its activities (Zarrabi et.al., 2012). In the
meantime, the increase in cities’
population has resulted in insufficiency
and inequality in providing facilities and
services for urban community. Also,
inequality and spatial imbalance of
facilities in the areas of a city is not a new
phenomenon in any cities in the world,
but spatial difference in the cities has
been intensified in developing countries
because of apparent socio-economic
differences, inequality and imbalance in
the distribution of urban services
(Ahadnejad et.al, 2013). Thus, social
justice should include distributive and
allocative justice because public benefits,
needs, and citizens’ rights cannot be
considered without distributive and
allocative criteria (Garoosi &
Shamsoddini Motlaq, 2013). Therefore,
any urban planning based on social
justice should be influential both in the
distribution of needs, public benefits,
rights, and also in their allocation. Hence,
the use of “social justice” in urban spaces
means maintaining different social
groups’ benefits in general, and target
groups in particular through balanced
extension of urban resources, revenues,
and costs (Grary, 2002). Appropriate
distribution of urban services and
accurate use from spaces are the factors
should be observed in implementing
social justice along with spatial justice in
urban planning, however. In this regard,
land uses and urban services are
influential factors that can establish socio-
economic and spatial justice in urban
areas by meeting population’s needs,
increasing in public benefits, and
considering people’s rights and
competency (Varesi et.al., 2008). As a
result, the process of urban development
can only be sustainable when it can
present specific and ordered solutions and
measures for favorite provide and
equalize urban residents’ facilities and
services (Khakpour et.al., 2009).
Therefore, in investigating urban
issues in the form of sustainable
development, it is assumed that if the
cost, irrespective of equality mechanisms,
spends to develop the infrastructure,
equipment and urban services, it will lead
to intensify inequality among different
groups of urban population (Blory, 2005).
Geographically, social justice in the city
is equivalent to the fair distribution of
resources among different areas of the
city and equal access of citizens to them
A Quarterly Journal of Urban Economics and Management _____________________________________ 124
since lack of equitable distribution may
result in social crisis and complex spatial
problems (Ziyari et.al, 2013). So,
conscious performance of urban
management in spatial distribution of
economic resources and social benefits of
growth and development process in city
in order to reduce spatial inequalities and
also improve citizens’ quality of life
(Mercier, 2009) requires accurate
understanding from current situation. It
tries to allocate resources to the most
favorable possible combination for
removing inequalities. In this case,
ultimate goal of spatial justice is equitable
distribution of basic needs and urban
facilities in different areas of the city so
that any neighborhoods or area does not
have spatial superiority than other areas
in terms of prosperity and the principle of
equal access should be observed, also
there should not be great difference
regarding the per capita of prosperity
considering population in each area of the
city (Harvy, 2000). Therefore, ignoring
supply and distribution of infrastructure
and urban public services will result in
occurring shortages and pressures on
available facilities. It is obvious that each
level of physical distribution of city based
on citizens’ needs requires different
services and accordingly different
services should also be distributed with
regard to the threshold population needed
in areas. This will lead to balanced
development of areas based on social
justice (Varesi et.al., 2007). Thus,
imbalanced distribution of facilities and
services would have unfavorable effect on
citizens’ life and consequently urban
sustainable development. So, capability
and simplicity of citizens’ access to urban
facilities, services, and activities or in
another words balance in the situation of
activities, facilities, and urban land uses
are fundamental principles of sustainable
development in cities (Iveson, 2011).
4- Research Method
In terms of objective, the research
method is applied and based on
descriptive-analytical approach. Data
were collected from libraries such as Data
Statistical Center of Iran (2011). In order
to determine the prosperity degree of
Noorabad neighborhoods from public
services (table 2), 7 variables and 27
indices were used in the fields of services
(educational, sanitary, sport, administrative,
green space, cultural centers and urban
facilities) (AMCO Consulting Engineers,
2000). Scientific techniques such as
TOPSIS model, Shannon Entropy
Technique, and Coefficient of Variation
Model were utilized to identify the
ranking of neighborhoods and areas based
on the access to the facilities and urban
services, and finally they were
determined in the form of consolidated
indices and the results were analyzed
(Wheeler & Muller, 1986). For this
purpose, the prosperity of the
neighborhoods from the services was
examined by using Coefficient of
Variation Model and statistical techniques
at first and then, they were evaluated by
using TOPSIS model in 2013.
125 _ Structural Analysis, Measurement of Spatial Distribution Model and Classification the Construction …
Table2 Used indexes for measuring the prosperity of areas from urban services
Educational Kindergarten, elementary school, middle school, high school, vocational
training centers, private schools in different fields
Sanitary Public bathrooms, clinics, medical centers, dentistry, pharmacy, health
centers Sport Indoor hall, soccer fields, swimming pools, sports facilities
Administrative government departments, public institutions
Green Space Parks, recreational spaces
Cultural and
Religious Centers Mosques, Hosseinieh, public libraries, other cultural sites
Municipal Facilities
and Equipment
Utilities (water, electricity, telephone, sewer, gas) and urban equipment
(including firefighting, garbage collection) Source: (researchers’ studies, 2013)
TOPSIS model
It is one of the conventional and
widely used in multi-indices decision-
making methods based on calculating the
distance of alternatives from ideal
positive or negative solution. The chosen
alternative should have the least distance
with ideal positive state (the best possible
state) and the furthest distance with ideal
negative solution (the worst possible
state) (Opricovic and Tzeng, 2004).
Today, this technique has a particular
position in ranking different concepts in
various sciences. The most important
reason is its mathematical and transparent
logic and also lack of administrative
problems. In this method, decision-
making matrix (numerical amounts of
indices for alternatives) and the weight of
indices are input data of the system and
the output ones are ranking the
alternatives (Chen & Tzeng, 2004).
Definitely, the desirability of each index
should be steadily increasing or
decreasing. In this case, the best available
value of an index shows positive ideal
state and the worst available value
specifies negative ideal one (Asqarpour,
2009).
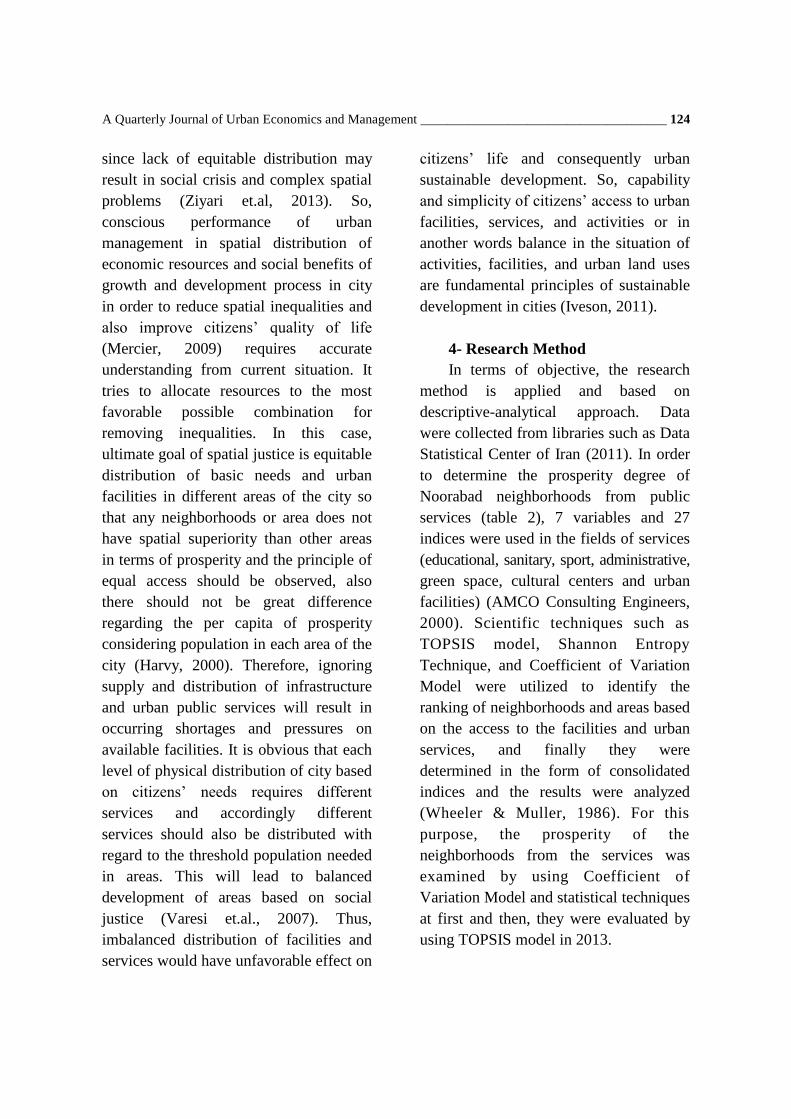
This algorithm is as follows:
Step 1: Conversion of existing decision-
making matrix to a scale-less matrix by
means of the following relationship
zm
iijr
ijr
ijn
1
2
Step2: Determining the weight of each
indicator: Shannon entropy can be used to
weight the index (Hekmatniya &
Mousavi, 2006). The method is based on
the assumption that as dispersion in the
values of an indicator is more, that index
is of great importance (Amirhajlou et.al.,
2013). The indexes with more importance
have more weight. In order to weight with
Shannon entropy, following stages should
be implemented:
Stage 1: forming decision-making matrix
Stage 2: the decision-making matrix goes
into quantitative form
Stage 3: standardizing decision-making
matrix: elements of decision-making
matrix get scale-less by the help of
equation
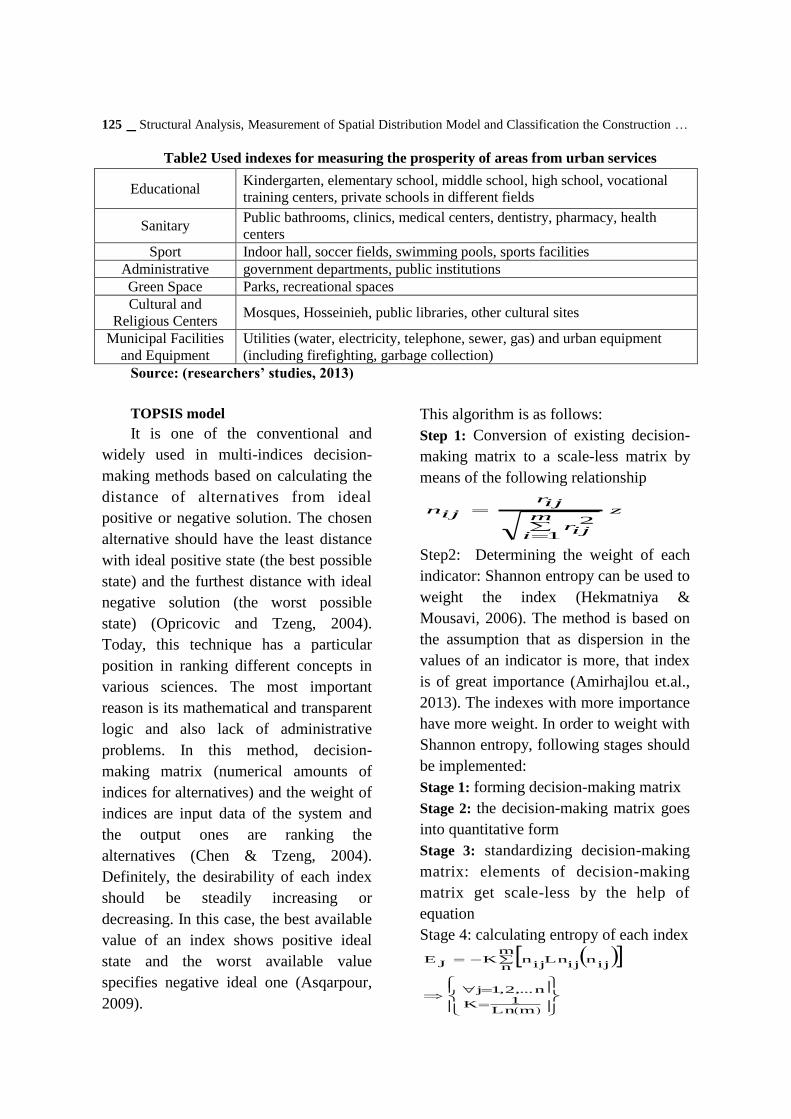
Stage 4: calculating entropy of each index
n,...2,1j
mLn1K
m
n ijn
ijLn
ijnK
JE
A Quarterly Journal of Urban Economics and Management _____________________________________ 126
The entropy of each index is a number
between zero and one.
Stage 5: calculating the degree of
deviation of available data: for each index
from the entropy of that index is
calculated by this equation (Sudhira and
Ramachandra, 2003).
Stage 6: calculating the weight of each
index: the weight of each index is
calculated in this way:
njn
jjd
jd
iw ,...2,1
1
It is noteworthy that the total of obtained
weights for intended indexes of decision-
maker should be equal to one. In other
words:
jnjn
jw ,...2,11
1
Step 3: specifying ideal positive (A+) and
negative (A-) solutions
It is obvious that two options were
defined and they show that the option
with the highest priority is (the answer of
positive ideal) and the option with the
lowest priority is the worst one.
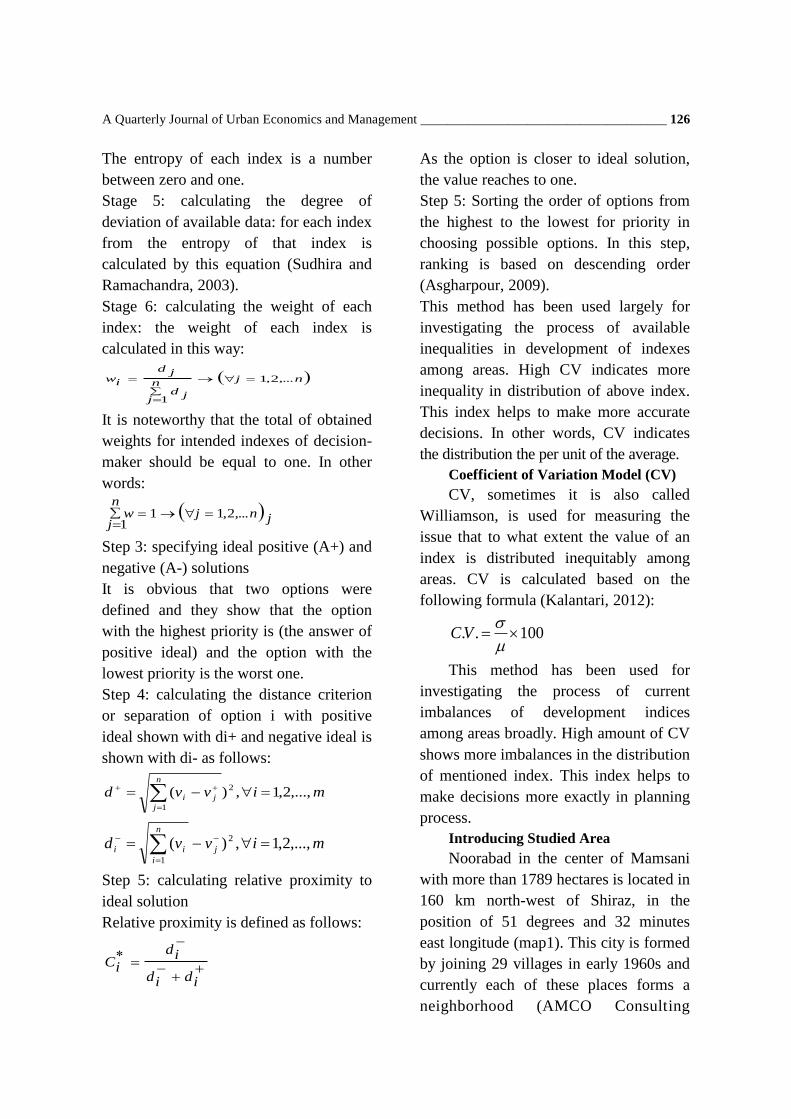
Step 4: calculating the distance criterion
or separation of option i with positive
ideal shown with di+ and negative ideal is
shown with di- as follows:
mivvdn
j
ji ,...,2,1,)( 2
1
mivvd j
n
i
ii ,...,2,1,)( 2
1
Step 5: calculating relative proximity to
ideal solution
Relative proximity is defined as follows:
idid
id
iC
As the option is closer to ideal solution,
the value reaches to one.
Step 5: Sorting the order of options from
the highest to the lowest for priority in
choosing possible options. In this step,
ranking is based on descending order
(Asgharpour, 2009).
This method has been used largely for
investigating the process of available
inequalities in development of indexes
among areas. High CV indicates more
inequality in distribution of above index.
This index helps to make more accurate
decisions. In other words, CV indicates
the distribution the per unit of the average.
Coefficient of Variation Model (CV)
CV, sometimes it is also called
Williamson, is used for measuring the
issue that to what extent the value of an
index is distributed inequitably among
areas. CV is calculated based on the
following formula (Kalantari, 2012):
100..
VC
This method has been used for
investigating the process of current
imbalances of development indices
among areas broadly. High amount of CV
shows more imbalances in the distribution
of mentioned index. This index helps to
make decisions more exactly in planning
process.
Introducing Studied Area
Noorabad in the center of Mamsani
with more than 1789 hectares is located in
160 km north-west of Shiraz, in the
position of 51 degrees and 32 minutes
east longitude (map1). This city is formed
by joining 29 villages in early 1960s and
currently each of these places forms a
neighborhood (AMCO Consulting
127 _ Structural Analysis, Measurement of Spatial Distribution Model and Classification the Construction …
Engineers 2000). The first official
statistics of population is related to 1966
with the estimated population of 5271
people. According to the censuses in
1976, 1986, 1996, and 2006 for Noorabad
population is 10984, 25333, 42243, and
52597 people respectively. This shows
that Noorabad had rapid growth of
population. The number and family’s
dimension had fluctuations in these
censuses. 1144 families lived in this city
in 1966. Family’s dimension was 4.60.
The number of households in this city
increased in 1976, 1986, 1996 into 2246,
4575, 7488, and 1227 people respectively.
In other words, the number of households
increased 10 times during 1966 to 2006
(table 3).
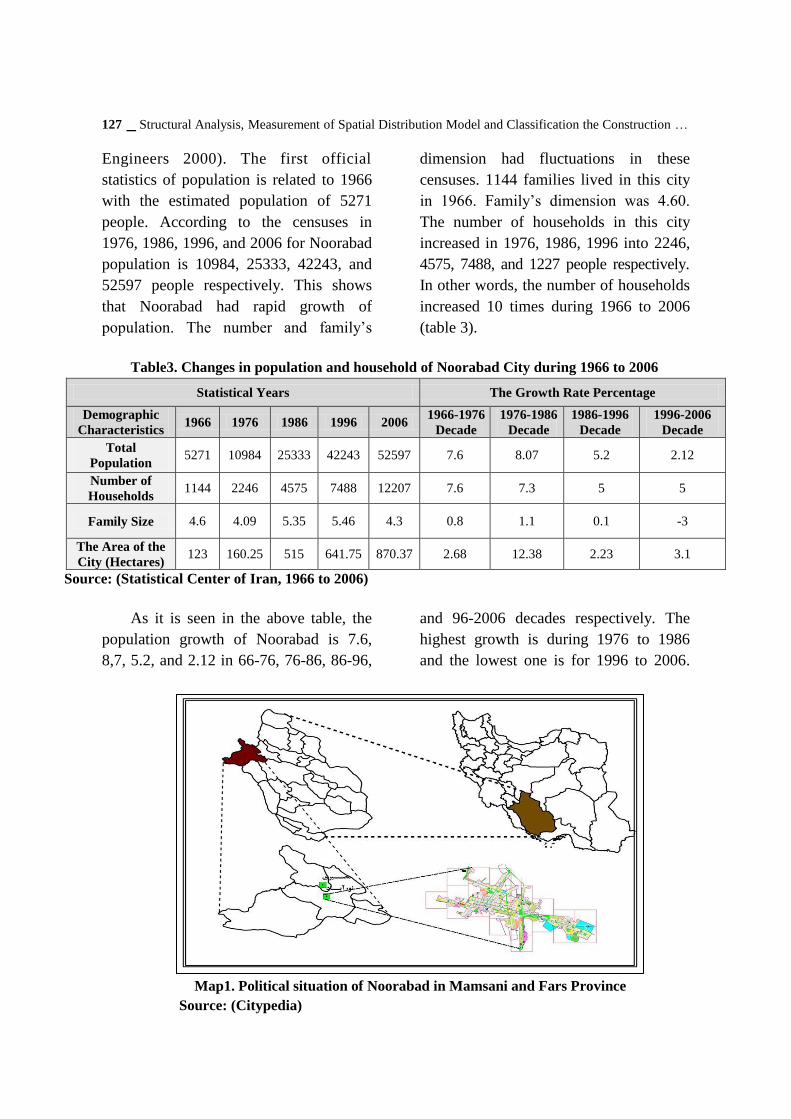
Table3. Changes in population and household of Noorabad City during 1966 to 2006
Statistical Years The Growth Rate Percentage
Demographic
Characteristics 1966 1976 1986 1996 2006 1966-1976
Decade 1976-1986
Decade 1986-1996
Decade 1996-2006
Decade Total
Population 5271 10984 25333 42243 52597 7.6 8.07 5.2 2.12
Number of
Households 1144 2246 4575 7488 12207 7.6 7.3 5 5
Family Size 4.6 4.09 5.35 5.46 4.3 0.8 1.1 0.1 -3
The Area of the
City (Hectares) 123 160.25 515 641.75 870.37 2.68 12.38 2.23 3.1
Source: (Statistical Center of Iran, 1966 to 2006)
As it is seen in the above table, the
population growth of Noorabad is 7.6,
8,7, 5.2, and 2.12 in 66-76, 76-86, 86-96,
and 96-2006 decades respectively. The
highest growth is during 1976 to 1986
and the lowest one is for 1996 to 2006.
Map1. Political situation of Noorabad in Mamsani and Fars Province
Source: (Citypedia)
A Quarterly Journal of Urban Economics and Management _____________________________________ 128
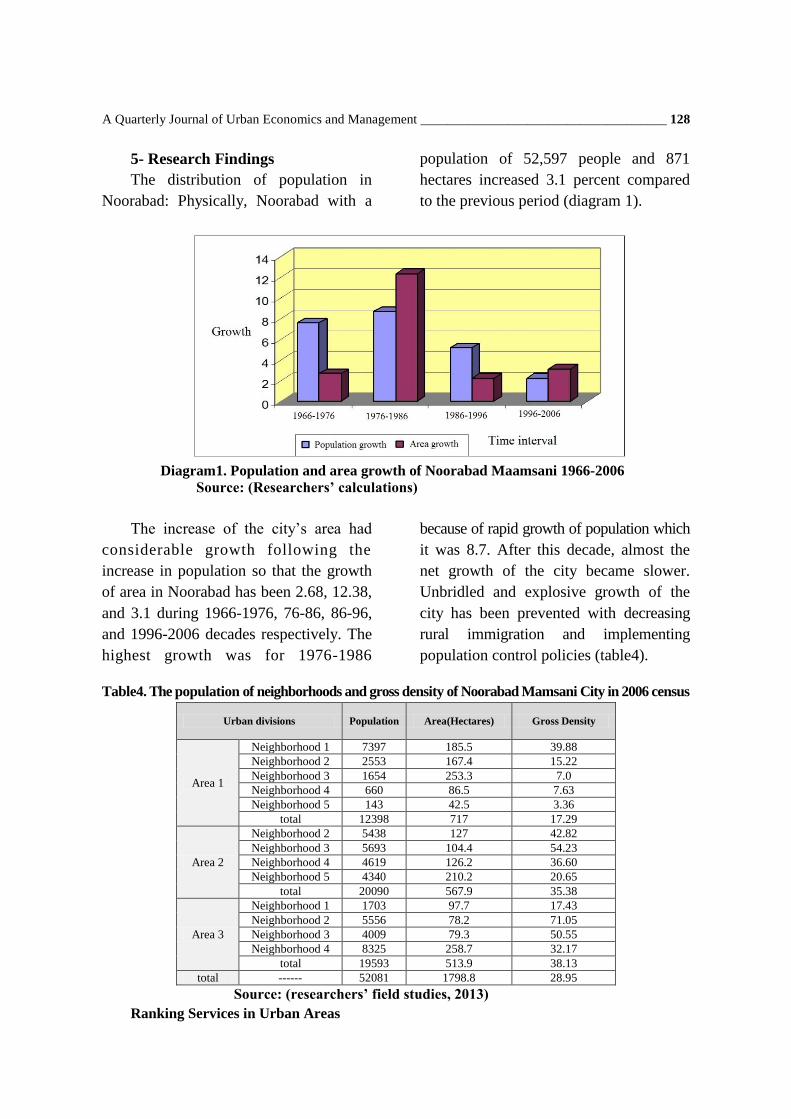
5- Research Findings
The distribution of population in
Noorabad: Physically, Noorabad with a
population of 52,597 people and 871
hectares increased 3.1 percent compared
to the previous period (diagram 1).
Diagram1. Population and area growth of Noorabad Maamsani 1966-2006
Source: (Researchers’ calculations)
The increase of the city’s area had
considerable growth following the
increase in population so that the growth
of area in Noorabad has been 2.68, 12.38,
and 3.1 during 1966-1976, 76-86, 86-96,
and 1996-2006 decades respectively. The
highest growth was for 1976-1986
because of rapid growth of population which
it was 8.7. After this decade, almost the
net growth of the city became slower.
Unbridled and explosive growth of the
city has been prevented with decreasing
rural immigration and implementing
population control policies (table4).
Table4. The population of neighborhoods and gross density of Noorabad Mamsani City in 2006 census
Urban divisions Population Area(Hectares) Gross Density
Area 1
Neighborhood 1 7397 185.5 39.88
Neighborhood 2 2553 167.4 15.22
Neighborhood 3 1654 253.3 7.0
Neighborhood 4 660 86.5 7.63
Neighborhood 5 143 42.5 3.36
total 12398 717 17.29
Area 2
Neighborhood 2 5438 127 42.82
Neighborhood 3 5693 104.4 54.23
Neighborhood 4 4619 126.2 36.60
Neighborhood 5 4340 210.2 20.65
total 20090 567.9 35.38
Area 3
Neighborhood 1 1703 97.7 17.43
Neighborhood 2 5556 78.2 71.05
Neighborhood 3 4009 79.3 50.55
Neighborhood 4 8325 258.7 32.17
total 19593 513.9 38.13
total ------ 52081 1798.8 28.95
Source: (researchers’ field studies, 2013)
Ranking Services in Urban Areas
129 _ Structural Analysis, Measurement of Spatial Distribution Model and Classification the Construction …
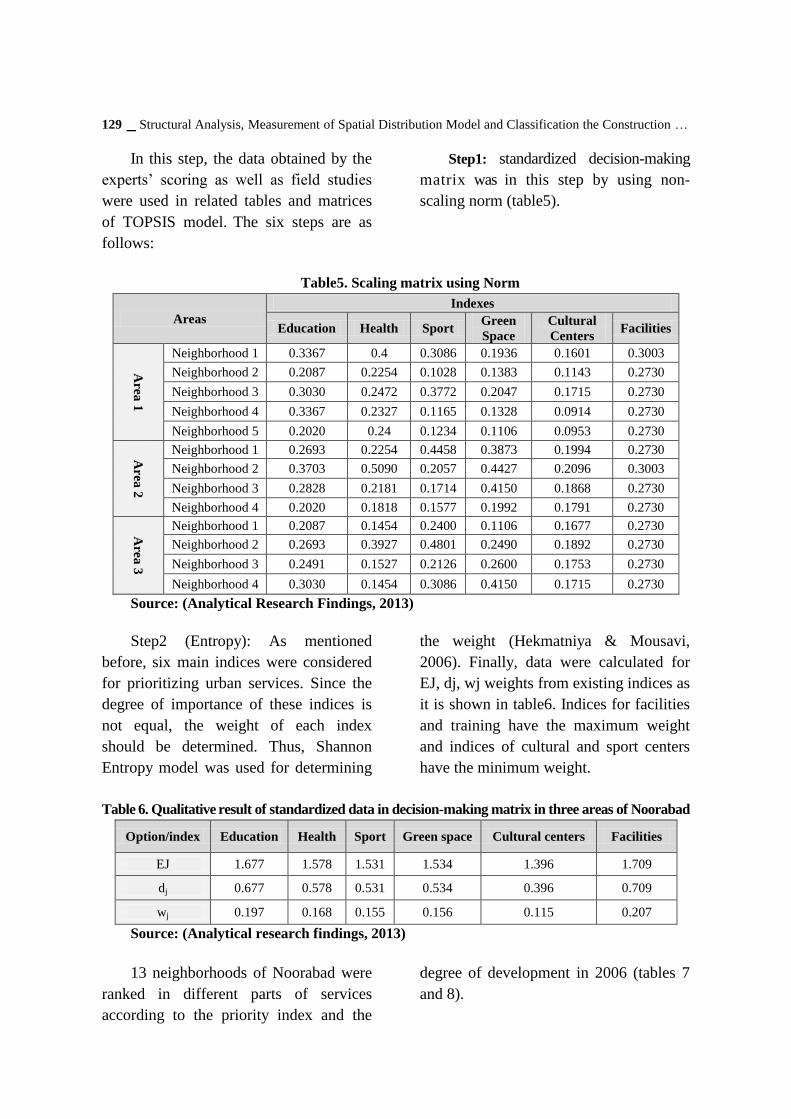
In this step, the data obtained by the
experts’ scoring as well as field studies
were used in related tables and matrices
of TOPSIS model. The six steps are as
follows:
Step1: standardized decision-making
matrix was in this step by using non-
scaling norm (table5).
Table5. Scaling matrix using Norm
Areas
Indexes
Education Health Sport Green
Space
Cultural
Centers Facilities
Are
a 1
Neighborhood 1 0.3367 0.4 0.3086 0.1936 0.1601 0.3003
Neighborhood 2 0.2087 0.2254 0.1028 0.1383 0.1143 0.2730
Neighborhood 3 0.3030 0.2472 0.3772 0.2047 0.1715 0.2730
Neighborhood 4 0.3367 0.2327 0.1165 0.1328 0.0914 0.2730
Neighborhood 5 0.2020 0.24 0.1234 0.1106 0.0953 0.2730
Are
a 2
Neighborhood 1 0.2693 0.2254 0.4458 0.3873 0.1994 0.2730
Neighborhood 2 0.3703 0.5090 0.2057 0.4427 0.2096 0.3003
Neighborhood 3 0.2828 0.2181 0.1714 0.4150 0.1868 0.2730
Neighborhood 4 0.2020 0.1818 0.1577 0.1992 0.1791 0.2730
Are
a 3
Neighborhood 1 0.2087 0.1454 0.2400 0.1106 0.1677 0.2730
Neighborhood 2 0.2693 0.3927 0.4801 0.2490 0.1892 0.2730
Neighborhood 3 0.2491 0.1527 0.2126 0.2600 0.1753 0.2730
Neighborhood 4 0.3030 0.1454 0.3086 0.4150 0.1715 0.2730
Source: (Analytical Research Findings, 2013)
Step2 (Entropy): As mentioned
before, six main indices were considered
for prioritizing urban services. Since the
degree of importance of these indices is
not equal, the weight of each index
should be determined. Thus, Shannon
Entropy model was used for determining
the weight (Hekmatniya & Mousavi,
2006). Finally, data were calculated for
EJ, dj, wj weights from existing indices as
it is shown in table6. Indices for facilities
and training have the maximum weight
and indices of cultural and sport centers
have the minimum weight.
Table 6. Qualitative result of standardized data in decision-making matrix in three areas of Noorabad
Option/index Education Health Sport Green space Cultural centers Facilities
EJ 1.677 1.578 1.531 1.534 1.396 1.709
dj 0.677 0.578 0.531 0.534 0.396 0.709
wj 0.197 0.168 0.155 0.156 0.115 0.207
Source: (Analytical research findings, 2013)
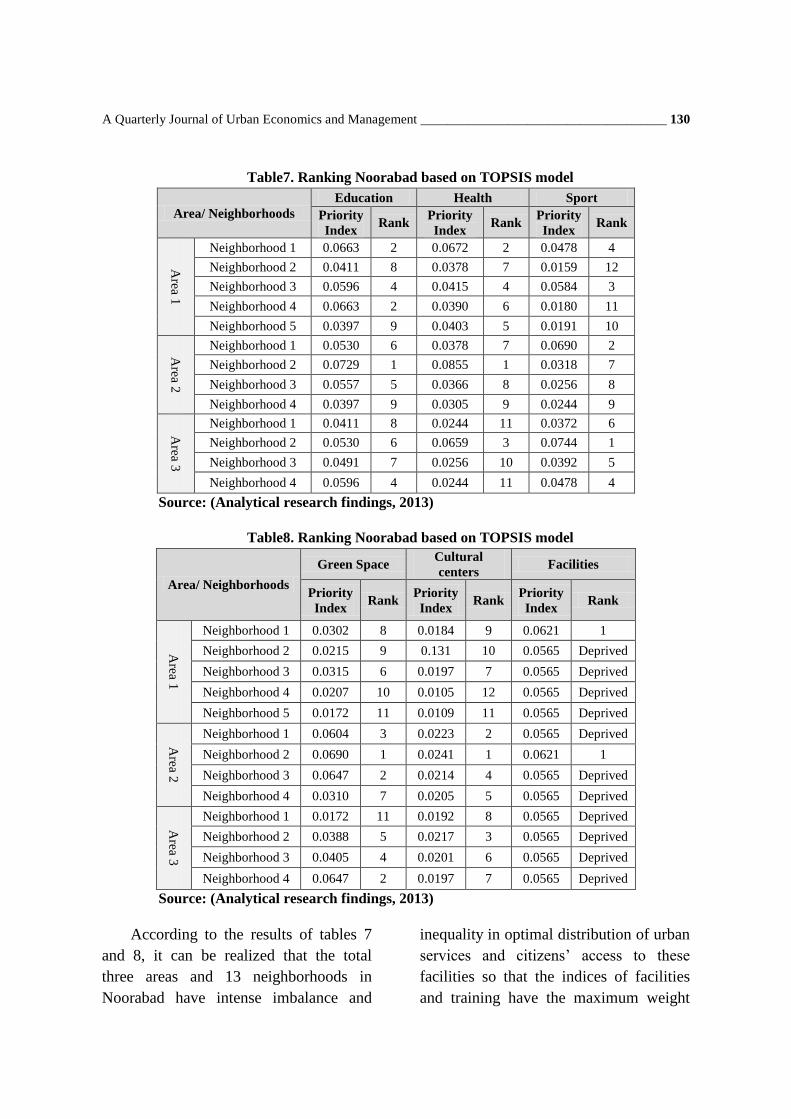
13 neighborhoods of Noorabad were
ranked in different parts of services
according to the priority index and the
degree of development in 2006 (tables 7
and 8).
A Quarterly Journal of Urban Economics and Management _____________________________________ 130
Table7. Ranking Noorabad based on TOPSIS model
Area/ Neighborhoods
Education Health Sport
Priority
Index Rank
Priority
Index Rank
Priority
Index Rank
Area 1
Neighborhood 1 0.0663 2 0.0672 2 0.0478 4
Neighborhood 2 0.0411 8 0.0378 7 0.0159 12
Neighborhood 3 0.0596 4 0.0415 4 0.0584 3
Neighborhood 4 0.0663 2 0.0390 6 0.0180 11
Neighborhood 5 0.0397 9 0.0403 5 0.0191 10
Area 2
Neighborhood 1 0.0530 6 0.0378 7 0.0690 2
Neighborhood 2 0.0729 1 0.0855 1 0.0318 7
Neighborhood 3 0.0557 5 0.0366 8 0.0256 8
Neighborhood 4 0.0397 9 0.0305 9 0.0244 9
Area 3
Neighborhood 1 0.0411 8 0.0244 11 0.0372 6
Neighborhood 2 0.0530 6 0.0659 3 0.0744 1
Neighborhood 3 0.0491 7 0.0256 10 0.0392 5
Neighborhood 4 0.0596 4 0.0244 11 0.0478 4
Source: (Analytical research findings, 2013)
Table8. Ranking Noorabad based on TOPSIS model
Area/ Neighborhoods
Green Space Cultural
centers Facilities
Priority
Index Rank
Priority
Index Rank
Priority
Index Rank
Area 1
Neighborhood 1 0.0302 8 0.0184 9 0.0621 1
Neighborhood 2 0.0215 9 0.131 10 0.0565 Deprived
Neighborhood 3 0.0315 6 0.0197 7 0.0565 Deprived
Neighborhood 4 0.0207 10 0.0105 12 0.0565 Deprived
Neighborhood 5 0.0172 11 0.0109 11 0.0565 Deprived
Area 2
Neighborhood 1 0.0604 3 0.0223 2 0.0565 Deprived
Neighborhood 2 0.0690 1 0.0241 1 0.0621 1
Neighborhood 3 0.0647 2 0.0214 4 0.0565 Deprived
Neighborhood 4 0.0310 7 0.0205 5 0.0565 Deprived
Area 3
Neighborhood 1 0.0172 11 0.0192 8 0.0565 Deprived
Neighborhood 2 0.0388 5 0.0217 3 0.0565 Deprived
Neighborhood 3 0.0405 4 0.0201 6 0.0565 Deprived
Neighborhood 4 0.0647 2 0.0197 7 0.0565 Deprived
Source: (Analytical research findings, 2013)
According to the results of tables 7
and 8, it can be realized that the total
three areas and 13 neighborhoods in
Noorabad have intense imbalance and
inequality in optimal distribution of urban
services and citizens’ access to these
facilities so that the indices of facilities
and training have the maximum weight
131 _ Structural Analysis, Measurement of Spatial Distribution Model and Classification the Construction …
and they are priority index, and the index
of cultural centers has the minimum
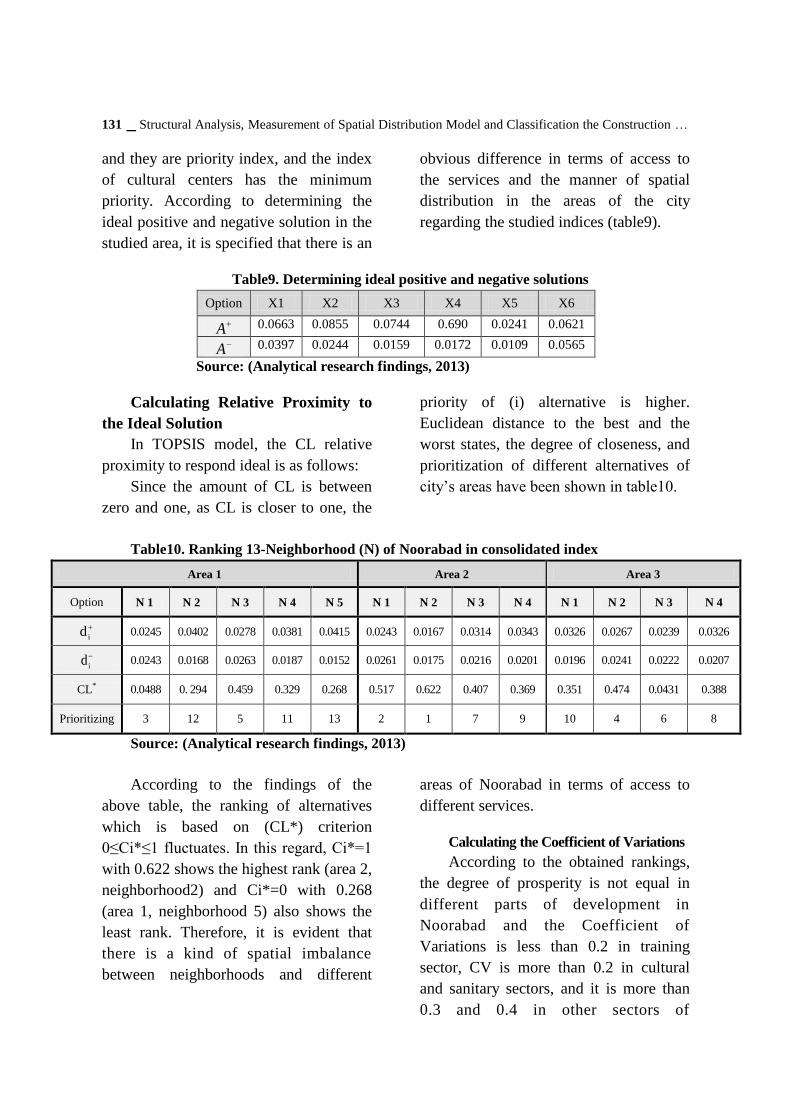
priority. According to determining the
ideal positive and negative solution in the
studied area, it is specified that there is an
obvious difference in terms of access to
the services and the manner of spatial
distribution in the areas of the city
regarding the studied indices (table9).
Table9. Determining ideal positive and negative solutions
X6 X5 X4 X3 X2 X1 Option
0.0621 0.0241 0.690 0.0744 0.0855 0.0663 A
0.0565 0.0109 0.0172 0.0159 0.0244 0.0397 A
Source: (Analytical research findings, 2013)
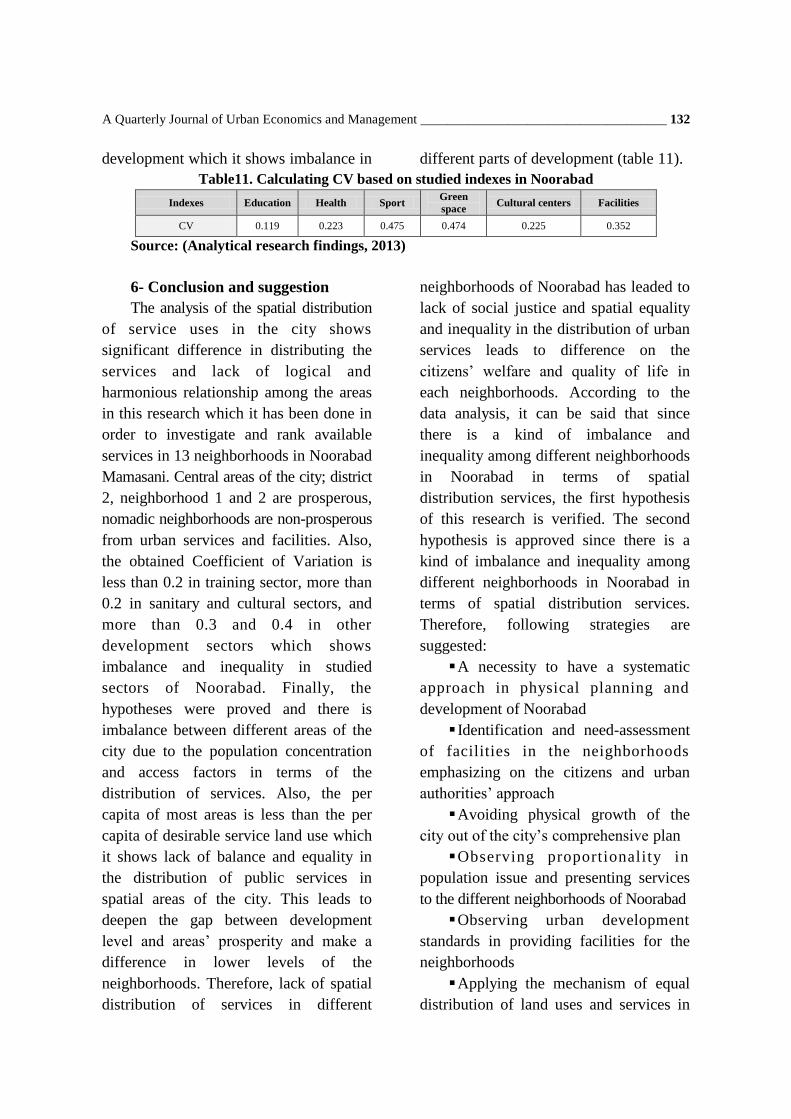
Calculating Relative Proximity to
the Ideal Solution
In TOPSIS model, the CL relative
proximity to respond ideal is as follows:
Since the amount of CL is between
zero and one, as CL is closer to one, the
priority of (i) alternative is higher.
Euclidean distance to the best and the
worst states, the degree of closeness, and
prioritization of different alternatives of
city’s areas have been shown in table10.
Table10. Ranking 13-Neighborhood (N) of Noorabad in consolidated index
Area 3 Area 2 Area 1
N 4 N 3 N 2 N 1 N 4 N 3 N 2 N 1 N 5 N 4 N 3 N 2 N 1 Option
0.0326 0.0239 0.0267 0.0326 0.0343 0.0314 0.0167 0.0243 0.0415 0.0381 0.0278 0.0402 0.0245
id
0.0207 0.0222 0.0241 0.0196 0.0201 0.0216 0.0175 0.0261 0.0152 0.0187 0.0263 0.0168 0.0243
id
0.388 0.0431 0.474 0.351 0.369 0.407 0.622 0.517 0.268 0.329 0.459 0. 294 0.0488 CL*
8 6 4 10 9 7 1 2 13 11 5 12 3 Prioritizing
Source: (Analytical research findings, 2013)
According to the findings of the
above table, the ranking of alternatives
which is based on (CL*) criterion
0≤Ci*≤1 fluctuates. In this regard, Ci*=1
with 0.622 shows the highest rank (area 2,
neighborhood2) and Ci*=0 with 0.268
(area 1, neighborhood 5) also shows the
least rank. Therefore, it is evident that
there is a kind of spatial imbalance
between neighborhoods and different
areas of Noorabad in terms of access to
different services.
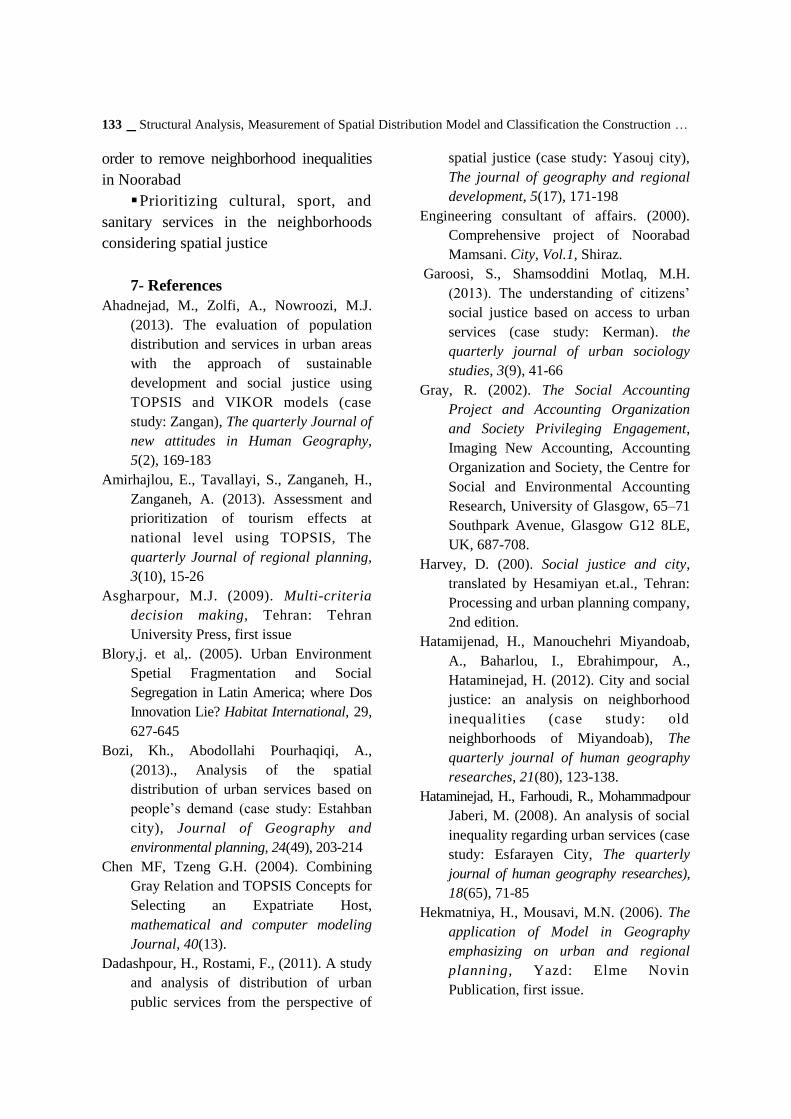
Calculating the Coefficient of Variations
According to the obtained rankings,
the degree of prosperity is not equal in
different parts of development in
Noorabad and the Coefficient of
Variations is less than 0.2 in training
sector, CV is more than 0.2 in cultural
and sanitary sectors, and it is more than
0.3 and 0.4 in other sectors of
A Quarterly Journal of Urban Economics and Management _____________________________________ 132
development which it shows imbalance in different parts of development (table 11).
Table11. Calculating CV based on studied indexes in Noorabad
Indexes Education Health Sport Green
space Cultural centers Facilities
CV 0.119 0.223 0.475 0.474 0.225 0.352
Source: (Analytical research findings, 2013)
6- Conclusion and suggestion
The analysis of the spatial distribution
of service uses in the city shows
significant difference in distributing the
services and lack of logical and
harmonious relationship among the areas
in this research which it has been done in
order to investigate and rank available
services in 13 neighborhoods in Noorabad
Mamasani. Central areas of the city; district
2, neighborhood 1 and 2 are prosperous,
nomadic neighborhoods are non-prosperous
from urban services and facilities. Also,
the obtained Coefficient of Variation is
less than 0.2 in training sector, more than
0.2 in sanitary and cultural sectors, and
more than 0.3 and 0.4 in other
development sectors which shows
imbalance and inequality in studied
sectors of Noorabad. Finally, the
hypotheses were proved and there is
imbalance between different areas of the
city due to the population concentration
and access factors in terms of the
distribution of services. Also, the per
capita of most areas is less than the per
capita of desirable service land use which
it shows lack of balance and equality in
the distribution of public services in
spatial areas of the city. This leads to
deepen the gap between development
level and areas’ prosperity and make a
difference in lower levels of the
neighborhoods. Therefore, lack of spatial
distribution of services in different
neighborhoods of Noorabad has leaded to
lack of social justice and spatial equality
and inequality in the distribution of urban
services leads to difference on the
citizens’ welfare and quality of life in
each neighborhoods. According to the
data analysis, it can be said that since
there is a kind of imbalance and
inequality among different neighborhoods
in Noorabad in terms of spatial
distribution services, the first hypothesis
of this research is verified. The second
hypothesis is approved since there is a
kind of imbalance and inequality among
different neighborhoods in Noorabad in
terms of spatial distribution services.
Therefore, following strategies are
suggested:
A necessity to have a systematic
approach in physical planning and
development of Noorabad
Identification and need-assessment
of facilities in the neighborhoods
emphasizing on the citizens and urban
authorities’ approach
Avoiding physical growth of the
city out of the city’s comprehensive plan
Observing proportionality in
population issue and presenting services
to the different neighborhoods of Noorabad
Observing urban development
standards in providing facilities for the
neighborhoods
Applying the mechanism of equal
distribution of land uses and services in
133 _ Structural Analysis, Measurement of Spatial Distribution Model and Classification the Construction …
order to remove neighborhood inequalities
in Noorabad
Prioritizing cultural, sport, and
sanitary services in the neighborhoods
considering spatial justice
7- References
Ahadnejad, M., Zolfi, A., Nowroozi, M.J.
(2013). The evaluation of population
distribution and services in urban areas
with the approach of sustainable
development and social justice using
TOPSIS and VIKOR models (case
study: Zangan), The quarterly Journal of
new attitudes in Human Geography,
5(2), 169-183
Amirhajlou, E., Tavallayi, S., Zanganeh, H.,
Zanganeh, A. (2013). Assessment and
prioritization of tourism effects at
national level using TOPSIS, The
quarterly Journal of regional planning,
3(10), 15-26
Asgharpour, M.J. (2009). Multi-criteria
decision making, Tehran: Tehran
University Press, first issue
Blory,j. et al,. (2005). Urban Environment
Spetial Fragmentation and Social
Segregation in Latin America; where Dos
Innovation Lie? Habitat International, 29,
627-645
Bozi, Kh., Abodollahi Pourhaqiqi, A.,
(2013)., Analysis of the spatial
distribution of urban services based on
people’s demand (case study: Estahban
city), Journal of Geography and
environmental planning, 24(49), 203-214
Chen MF, Tzeng G.H. (2004). Combining
Gray Relation and TOPSIS Concepts for
Selecting an Expatriate Host,
mathematical and computer modeling
Journal, 40(13).
Dadashpour, H., Rostami, F., (2011). A study
and analysis of distribution of urban
public services from the perspective of
spatial justice (case study: Yasouj city),
The journal of geography and regional
development, 5(17), 171-198
Engineering consultant of affairs. (2000).
Comprehensive project of Noorabad
Mamsani. City, Vol.1, Shiraz.
Garoosi, S., Shamsoddini Motlaq, M.H.
(2013). The understanding of citizens’
social justice based on access to urban
services (case study: Kerman). the
quarterly journal of urban sociology
studies, 3(9), 41-66
Gray, R. (2002). The Social Accounting
Project and Accounting Organization
and Society Privileging Engagement,
Imaging New Accounting, Accounting
Organization and Society, the Centre for
Social and Environmental Accounting
Research, University of Glasgow, 65–71
Southpark Avenue, Glasgow G12 8LE,
UK, 687-708.
Harvey, D. (200). Social justice and city,
translated by Hesamiyan et.al., Tehran:
Processing and urban planning company,
2nd edition.
Hatamijenad, H., Manouchehri Miyandoab,
A., Baharlou, I., Ebrahimpour, A.,
Hataminejad, H. (2012). City and social
justice: an analysis on neighborhood
inequalities (case study: old
neighborhoods of Miyandoab), The
quarterly journal of human geography
researches, 21(80), 123-138.
Hataminejad, H., Farhoudi, R., Mohammadpour
Jaberi, M. (2008). An analysis of social
inequality regarding urban services (case
study: Esfarayen City, The quarterly
journal of human geography researches),
18(65), 71-85
Hekmatniya, H., Mousavi, M.N. (2006). The
application of Model in Geography
emphasizing on urban and regional
planning, Yazd: Elme Novin
Publication, first issue.
A Quarterly Journal of Urban Economics and Management _____________________________________ 134
Iveson, K. (2011). Social or Spatial justice?.
Marcuse and Soja. On the right to the
city. City, 15(2).
Kalantari, Kh. (2012). Quantitative models in
planning (regional, urban, and rural),
Tehran: Farhange Saba Publication, 1st
issue.
Karam, A., Mohammadi, A. (2009). The
evaluation and Land suitability mapping
for physical development of Karaj and
surroundings based on natural factors
and hierarchy method, The quarterly
journal of natural geography, 1(4), 59-74
Khakpour, B., Bavanpouri, A. (2009). A
study and analysis of inequality at
development levels of Mashhahd areas,
the journal of knowledge and development,
16(27), 182-203
Khakpour, B., Maafi, E., Bavanpouri, A.
(2009). The role of social capital on
regional sustainable development (case
study: Sajjadiyeh Mashhad, The quarterly
journal of geography and regional
development, 3(12), 131-144
Mercier, J. (2009). Equity, Social Justice, and
Sustainable Urban Transportation in the
Twenty-First Century, Administrative
Theory & Praxis, 31(2), 145–163.
Nastaran, M., Abolhasani, F., Izadi, M.
(2010). The application of TOPSIS
model in analysis and prioritization of
sustainable development of urban areas
(case study: urban areas of Isfahan) the
journal of environmental planning, 21(38),
83-101
Opricovic, S., G.H., Tzeng. (2004). Compromise
Solution by MCDM Methods: A
Comparative Analysis of VIKOR and
TOPSIS, European Journal of Operational
Research, 156(2), 445- 455.
Rafieyan, M., Shaali, M. (2012). Spatial
analysis of development level of Tehran,
The quarterly journal of Humanities
teacher (planning and spatial analysis)
16(4), 65-82
Sajjadi, Zh., Shamsoddini, A. (2011). An
analysis of rural-urban migrations
emphasizing on the role of distance and
access (case study: Mamasani City), the
quarterly journal of studies and urban
and regional researches, 2(8), 74-98
Statistical Center of Iran. (2011, 2006, 1996).
Census of Housing in Mamsani,
Noorabad, Tehran.
Sudhira, H.S., Ramachandra, T.V. (2003).
Urban Growth Analysis using Spatial
Temporal data, Journal of Indian Society
of Remote Sensing, 31(4).
Taqvayi, M., Kiyoumarsi, H. (2011). Ranking
urban neighborhoods based on prosperity
level of facilities and urban services
using TOPSIS (case study: Abadeh city),
the Journal of research and urban
planning, 2(5), 23-42
Tirbandi, M., Azani, M., (2012). Distribution
of urban facilities and services based on
social justice (case study: Yasouj City),
the journal of Practical sociology,
23(46), 43-56
United Nations. (2009). World urbanization
prospects: The 2009 revision. New
York: United Nations Department of
Economic and Social Affairs/Population
Division.
Varesi, H., Beykmohammadi, H., Akbari, M.
(2011). Spatoal analysis and planning of
deficiencies in urban areas of Yasouj,
The quarterly journal of geographical
researches, 26(100), 71-89
Varesi, H., Qaed Rahmati, S., Bastanifar, I.
(2007). A study of distribution effects of
urban services in spatial imbalance of
population (case study: Isfahan urban
areas), The journal of geography and
development, 5(11), 91-106
Varesi, H., Zangabadi, A., Yaghfouri, H.
(2008). A comparative study of Public
utilities distribution from the perspective
of social justice (case study: Zahedan),
135 _ Structural Analysis, Measurement of Spatial Distribution Model and Classification the Construction …
The journal of geography and development,
3(11), 139-156
Wheeler, James O, Muller, Peter O. (1986).
Economic Geography, John Wiley &
Sons, Inc, Canada. The University of
Texas at Dallas.
Yar Khan, N., Ghafoor, N., Iftikhar, Rabia.,
Malik, Maria. (2011). Urban Annoyances
and Mental Health in the city of Lahore,
Pakistan, Journal of Urban Affairs, Vol
34, 297-315.
Yu, X.J., NG, C.N. (2007). Spatial and
temporal dynamics of urban sprawl
along two urban–rural transects: A case
study of Guangzhou, China, Landscape
urban planning, 7(1).
Zakeriyan, M., Mousavi, M.N., Baqeri
Kashkouli, A. (2000). Analysis of population
distribution and services in urban
neighborhoods of Meybod from the
perspective of sustainable development,
The journal of research and urban
planning 1(2), 61-84.
Zarrabi, A., Izadi, M., Abolhasani, F. (2012).
Determining the level of prosperity of
urban areas in Isfahan from cultural
indexes, The quarterly journal of
geographical researches, 27(106), 45-65
Zarrabi, A., Mousavi, M.N. (2000). Spatial
analysis of population and service
distribution in urban areas of Yazd, The
quarterly journal of geographical
researches, 25(97), 27-46.
Ziyari, K., Mahdiyan, M., Mahdi, A. (2013).
The study and measurement of space
utilization justice from urban public
services based on population distribution
capability and access in Babolsar City,
The quarterly journal of practical
researches of geography sciences,
13(28), 217-241.