spatial patterns and competition of tree species in a...
TRANSCRIPT

Spatial patterns and competition of tree species in a Douglas-fir
chronosequence on Vancouver Island
Stephan Getzin, Charmaine Dean, Fangliang He, John A. Trofymow, Kerstin Wiegand and Thorsten Wiegand
Getzin, S., Dean, C., He, F., Trofymow, J. A., Wiegand, K. and Wiegand, T. 2006.Spatial patterns and competition of tree species in a Douglas-fir chronosequence onVancouver Island. � Ecography 29: 671�682.
While the successional dynamics and large-scale structure of Douglas-fir forest in thePacific Northwest region is well studied, the fine-scale spatial characteristics at thestand level are still poorly understood. Here we investigated the fine-scale spatialstructure of forest on Vancouver Island, in order to understand how the threedominant species, Douglas-fir, western hemlock, and western redcedar, coexist andpartition space along a chronosequence comprised of immature, mature, and old-growth stands. We quantified the changes in spatial distribution and association of thespecies along the chronosequence using the scale-dependent point pattern analysespair-correlation function g(r) and Ripley’s L-function. Evidence on intra- and inter-specific competition was also inferred from correlations between nearest-neighbordistances and tree size. Our results show that 1) the aggregation of Douglas-fir in old-growth was primarily caused by variation in local site characteristics, 2) only survivinghemlock were more regular than their pre-mortality patterns, a result consistent withstrong intra-specific competition, 3) inter-specific competition declined rapidly withstand age due to spatial resource partitioning, and 4) tree death was spatially randomlydistributed among larger overstory trees. The study highlights the importance of spatialheterogeneity for the long-term coexistence of shade-intolerant pioneer Douglas-fir andshade-tolerant western hemlock and western redcedar.
S. Getzin ([email protected]) and K. Wiegand, Inst. of Ecology, Univ. of Jena,Dornburger Str. 159, DE-07743 Jena, Germany. � C. Dean, Dept of Statistics andActuarial Science, Simon Fraser Univ., Burnaby, BC V5A 1S6, Canada. � F. He, Dept ofRenewable Resources, Univ. of Alberta, Edmonton, AB T6G 2H1, Canada. � J. A.Trofymow, Canadian Forest Service, Pacific Forestry Centre, 506 West Burnside Road,Victoria, BC V8Z 1M5, Canada. � T. Wiegand, Dept of Ecological Modelling, UFZ-Centre for Environmental Research, PF 500136, DE-04301 Leipzig, Germany.
One challenge of plant ecology is to understand how
competition contributes to the patterning of plant
distributions and how the patterning changes over
succession. Remarkable progress has been made in using
the spatial distribution of trees to infer ecological
mechanisms (Ford 1975, Kenkel 1988, Duncan 1991,
He and Duncan 2000, Wiegand et al. 2000), to under-
stand the genesis and maintenance of biodiversity
patterns (Plotkin et al. 2000, He and Legendre 2002,
Fang 2005), and to predict stand dynamics (Mateu et al.
1998, Stoyan and Penttinen 2000, Kokkila et al. 2002).
However, the fine-scale spatial distributions of trees
remain poorly understood (Condit et al. 2000). Empiri-
cal studies have repeatedly shown that spatial and size
distributions of trees in a community bear the finger-
print of growth, competition, and habitat heterogeneity
(Ford 1975, Harms et al. 2001, Chen et al. 2004). Spatial
distribution and tree size are not independent patterns
but are commonly affected by competition. If competi-
tion is an important working mechanism in structuring
Accepted 27 May 2006
Copyright # ECOGRAPHY 2006ISSN 0906-7590
ECOGRAPHY 29: 671�682, 2006
ECOGRAPHY 29:5 (2006) 671

forest communities, two consequences should be ex-
pected: 1) there is a significantly positive correlation
between tree growth (size) and nearest-neighbor dis-
tances, and 2) due to competition-induced mortality,
spatial distributions of trees become more regular with
time (Pielou 1962, Sterner et al. 1986, Duncan 1991,
Shackleton 2002).
A simple method for detecting competition during
succession is to compare the spatial patterns of a given
species at subsequent stages of a chronosequence. Such a
snap-shot approach using static point patterns is parti-
cularly useful in forests with slow plant growth. The
pattern at late-successional series, comprising older trees
that survived competition, should be more regular than
that in early succession. If additional data on dead trees
are available, the random mortality hypothesis can be
used to detect competition. This hypothesis predicts that
second-order characteristics of the spatial patterns
would remain unchanged if individuals in a community
are equal in death probability (Sterner et al. 1986).
Opposite to this hypothesis are elevated death rates
among neighboring trees due to competition. In this
case, the post-mortality pattern of surviving trees
becomes more regular than the pre-mortality pattern.
This process is not only observed in even-aged, mono-
culture stands (Kenkel 1988, Newton and Jolliffe 1998)
but also in uneven-aged, mixed coniferous forests
(Duncan 1991, Mast and Veblen 1999, He and Duncan
2000). This method can be equally applied to infer intra-
specific and inter-specific interactions. Whether the
resulting spatial patterns are regular, aggregated, or
random depends on the life histories of the species and
on the scale at which the pattern is observed. For
example, shade-intolerant and tolerant species colonize
different habitats (gaps vs shades) and form segregated
distributions (North et al. 2004).
However, inconsistent results are observed in some
tree species (Peterson and Squiers 1995) or in more
heterogeneous and older forest stands (Dovciak et al.
2001, McDonald et al. 2003). Environmental hetero-
geneity, uneven age distributions, limited dispersal of
seeds or random germination may prevent a pattern
from becoming more regular even though competition is
present (Kenkel 1988). Moreover, sometimes competi-
tion may not be strong enough to cause substantial
mortality but just cause growth reduction. In such
situations where spatial patterns are ambiguous about
competition, the correlation between tree size and
neighborhood density provides a useful measurement
(Shackleton 2002).
In this article, we use spatial pattern analysis to infer,
from the fine-scale spatial distributions of trees, how the
dominant tree species in a forest compete and partition
space, and how their spatial interactions change during
succession. More specifically, we analyze the succes-
sional dynamics of shade-intolerant pioneer Douglas-fir
Pseudotsuga menziesii var. menziesii and of two shade-
tolerant late-successional species, western hemlock Tsuga
heterophylla and western redcedar Thuja plicata in a
chronosequence in the Pacific Northwest region on
south-eastern Vancouver Island.
To understand the change in spatial structure and
species interactions in Douglas-fir forests across spatial
and temporal scales, we first present the stand struc-
tural characteristics of the forests and infer intra-
specific and inter-specific competition from correlations
between tree size and nearest-neighbor distances before
performing detailed point pattern analyses. Positive
correlation between tree size and nearest-neighbor
distances is expected if competition reduces growth.
Evidence relating particularly to competition-induced
mortality can be obtained from uni- and bivariate
spatial patterns. More regular distribution in post-
mortality pattern of surviving trees is expected if
intra-specific competition leads to mortality. Similarly,
strong inter-specific competition between shade-intoler-
ant Douglas-fir and shade-tolerant western hemlock
and western redcedar is expected to separate Douglas-
fir from the two shade-tolerant species in space. Once
trees have reached the upper canopy layer, their
mortality should be unaffected by competition from
smaller neighbors. Thus, we also test whether tree death
among larger trees of the overstory is spatially corre-
lated, or a random process.
Methods
Study sites and data collection
The chronosequence is located in the drier coastal
temperate forest found on leeward side of south-eastern
Vancouver Island within the Greater Victoria Watershed
District (48833?N, 123838?W). All stands studied were
within the eastern variant of the Very Dry Maritime
subzone of the Coastal Western Hemlock zone
(CWHxm1), which has mild and wet winters, warm
and dry summers, a mean annual precipitation of 1425
mm, and a mean annual temperature of 9.48C (Green
and Klinka 1994). Pioneer Douglas-fir (Df) is the
dominating tree species and western hemlock (Hw) and
western redcedar (Cw) are two primary late-successional
species that usually aggregate in gaps (Fig. 1). Other
minor components include, e.g. western white pine Pinus
monticola or red alder Alnus rubra . The chronosequence
consists of an immature (IM), mature (MA) and old-
growth (OG) stand with ages varying from 39 (IM), 109
(MA) to 254 yr (OG) at the time of data collection in
1999 and 2000. The stands are located on gentle to
moderate slopes with elevations ranging from 240 to
390 m. Due to some rock outcrops, slight spatial
heterogeneity was present in the plots. The immature
stand was originally regenerated from artificial planting
672 ECOGRAPHY 29:5 (2006)

of Douglas-fir seedlings after harvesting and broadcast
burn. However, the majority of Douglas-fir individuals
in this plot are already naturally regenerated offspring
from the planted trees. All other species were naturally
regenerated. The mature stand originated naturally from
wildfire followed by some salvage logging. The old-
growth plot originated from a catastrophic wildfire.
Further information on site characteristics and plot
locations can be found in Trofymow et al. (1997),
including the descriptions pertaining to plots 2 (IM), 5
(MA), and 6 (OG). Data were collected on 0.5�1.2 ha
plots. All dead and live trees, including seedlings were
stem-mapped. Diameter at breast height (DBH) of each
live tree was measured at 1.4 m above ground, and all
individuals were identified to species.
Data analysis
1) Stand structure and composition
The mean nearest-neighbor distance for each species in
each plot was calculated using S�/SpatialStats. The
number of stems (N) and relative proportion (%) of
live and dead trees of each species were counted for the
three dominant species Df, Hw, and Cw. Cw was not
analyzed for the IM plot because its proportion was
below 3%. We also calculated the mean DBH for each
species in the plots, the species proportions within their
smallest DBH class of 0.1�10 cm, and the proportion of
dead trees of a species within this small diameter class.
Pielou’s segregation index S was calculated for these
species to quantify their relative spatial mixing (Pielou
Fig. 1. Maps of the immature(A), mature (B), and old-growth (C) plots. Open symbolsare live trees: Douglas-fir (k),western hemlock (^), westernredcedar (I), and other species(�). Respective symbols withgrey color filling are dead trees.Symbol sizes are proportionalto the DBH. Smallest dotsrepresent trees with a DBH5/ 5cm, the largest circle in old-growth (C) is a Douglas-firwith a DBH of 1.60 m.
(A) Immature
X data (m)0 20 40 60
Y d
ata
(m)
0
20
40
60
(B) Mature
X data (m)0 20 40 60 80 100
Y d
ata
(m)
(C) Old-growth
X data (m)
0
20
40
60
80
100
20 40 60 80
0
20
40
60
80
Y d
ata
(m)
ECOGRAPHY 29:5 (2006) 673
1961). The index S was computed from the properties
described in Table 1 as, S�1�MO
ME
�1 � N(b � c)
vn � wm;
where MO is the observed number of mixed nearestneighbor pairs and ME is the expected number underrandom conditions (Kint et al. 2003). Under segrega-tion, values of S range between 0 and 1, with 1 indicatinghighest spatial separation. In communities of more thantwo dominant species S was calculated by comparingone species against all other species in the plot.
2) Correlations between tree size and nearest-neighbor
distances
For each of the three species and for each successional
stage, we analyzed the correlation between the sum of
the DBH of the four nearest neighbors plus the DBH of
the focal tree and the sum of the distances of the four
nearest neighbors to that focal tree (Shackleton 2002).
The coefficient of determination r2 describes the relative
importance of competition as an agent in structuring the
forest community (Welden and Slauson 1986). Although
one cannot derive causal links from regression analyses,
r2 has been shown to be a robust index of competition,
despite the complexity of biotic and abiotic factors
influencing forest structure (Welden et al. 1988). In this
paper, ‘‘nearest neighbors’’ refers to the four nearest
neighbors of a focal tree, trees with a ‘‘conspecific
neighborhood’’ have three or four conspecific nearest
neighbors and trees with a ‘‘heterospecific neighbor-
hood’’ have none or one conspecific nearest neighbor.
The size-distance correlation was conducted for inferring
species, intra-specific, and inter-specific competition by
including only the following subset of focal trees in the
analysis: all focal trees of a given species, focal trees with
a conspecific neighborhood, and focal trees with hetero-
specific neighborhood, respectively. We then plotted the
importance of species, intra-, and inter-specific competi-
tion (measured by r2) against stand age.
To measure how well species survive intra- and inter-
specific competition during different successional stages,
we compared the proportion of dead trees for each of
the three species with a difference test, once between
their con- and heterospecific neighborhoods and once
between the species only in heterospecific neighbor-
hoods. We also compared both, mean distance and
mean DBH of the four nearest-neighbors by means of a
two-sided t-test.
3) Spatial pattern analysis
We used the pair-correlation function g(r), which is a
distance-dependent correlation function for completely
mapped point patterns (Stoyan and Stoyan 1994,
Wiegand and Moloney 2004). Based on point-to-point
distances, the g-function describes clumping and reg-
ularity at a given radius r, using a standardized density.
Consequently, g(r)�/1 under complete spatial random-
ness (CSR), g(r)�/1 indicates aggregation, while g(r)B/1
indicates regularity. The univariate pair-correlation
function g(r) is related to the derivative of the widely
used K-function (Ripley 1976), i.e. K(r)�2pfr
0g(r?)r? dr?
and can be interpreted as the expected density of points
at a given distance r of an arbitrary point, divided by the
intensity l of the pattern (Stoyan and Stoyan 1994, Dale
et al. 2002). Similar to the K-function, g(r) can also be
extended to describe point patterns with two types of
points (e.g. dead and live trees): the bivariate pair-
correlation function g12(r) is the expected density of
points of pattern 2 at distance r of an arbitrary point of
pattern 1, divided by the intensity l2 of pattern 2.
Compared with Ripley’s K-function, which has a
character comparable with that of a distribution func-
tion, g(r) has a character comparable with that of a
probability density function and is considered more
powerful in detecting spatial patterns across scales
(Wiegand and Moloney 2004). This is because g(r) has
the advantage of isolating specific distance classes and
can therefore be used to precisely determine spatial
scales at which a given null model is violated. In
contrast, K(r) is a cumulative distribution function that
calculates point densities within the entire circle of a
given radius (Ripley 1976). Therefore, it confounds the
effect at large distances with the effect of small distances
(memory effect), which can complicate its interpretation
(Condit et al. 2000, Schurr et al. 2004). However, K(r) or
its transformation L(r) is more pertinent for the con-
firmation of null models (Stoyan and Penttinen 2000).
In this study we used both g(r) to analyze the fine-
scale spatial patterns and L(r) for the confirmation (not
shown) of underlying null models (Table 2). These
functions were computed using the grid-based software
Programita for point pattern analysis (Wiegand and
Moloney 2004). Significant departure from an under-
lying null model was tested by 99 Monte Carlo simula-
tions which generates n/(n�/1)�/100%, hence 99%
confidence limits (Bailey and Gatrell 1998).
To investigate whether the basic pattern of all (dead
and live) trees of a species would become more regularly
distributed during succession, we implemented a null
model based on a heterogeneous Poisson process. A
heterogeneous Poisson process was chosen because our
plots were partly influenced by first-order heterogeneity
(Fig. 1), hence the intensity l is not approximately
constant but varies with the location (x, y). We used a
circular moving window with a fixed bandwidth R to
Table 1. Contingency table, defining the types of nearest-neighbor relationships between species A and B, for calculatingPielou’s S.
No. of nearest neighbors of
species A species B species A�/B
Species A a b mSpecies B c d nSpecies A�/B v w N
674 ECOGRAPHY 29:5 (2006)

estimate l(x, y). Hence, patterns may be interpreted up
to a radius of R�/10 m only (Wiegand and Moloney
2004; Hypothesis 1, Table 2).
For the random mortality hypothesis, we used uni-
variate random labeling as null model to investigate
whether the n1 live trees of a species (post-mortality
pattern) are a random subset of the pre-mortality
pattern, i.e. the joined pattern of dead (n2) and live
(n1) trees. The test was conducted by computing the
function g11(r) from the observed data, then randomly
re-sampling sets of dead trees from the joined pattern of
live and dead trees to generate the confidence limits. This
null model also accounts for first-order heterogeneity
(Hypothesis 2, Table 2).
To investigate the interaction between shade-intoler-
ant Df and late-successional, shade-tolerant species, we
used the toroidal shift null model (independence), in
which the second-order structure of both patterns is
preserved but shifted relative to each other. We directly
compared Df and Hw in the IM plot with each other. In
other plots where more than one shade-tolerant species
dominated, Df was compared against all other species.
These analyses were conducted once for all (live and
dead) trees and once for live trees only (Hypothesis 3,
Table 2).
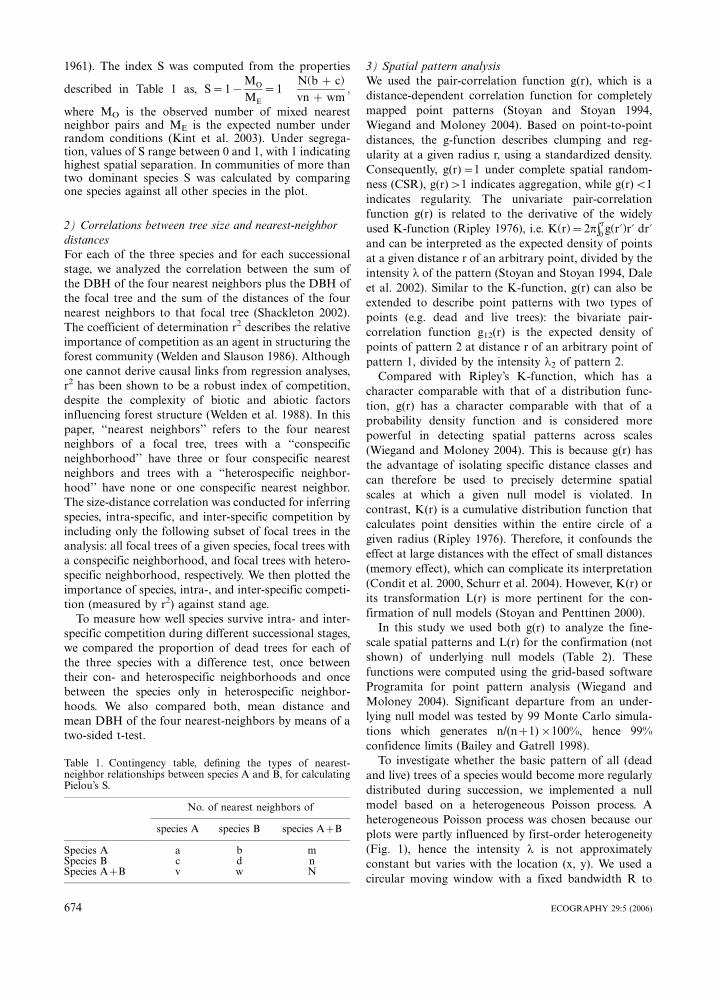
To investigate the mortality of larger trees, we used
bivariate random labeling with g21(r)-g22(r). Under
random labeling, g-functions are invariant, hence we
would expect g12(r)�/g21(r)�/g11(r)�/g22(r). Departure
from random labeling is assessed using specific combi-
nations of pairwise differences that correspond to
specific biological effects. If g21�g22B/0 at radius
r, then type 2 points (dead trees) are relatively more
frequent around type 2 points than type 1 points (live
trees) around type 2 points, hence dead trees are
positively correlated at radius r. We included all trees
with DBH�/10 cm in the IM,�/20 cm in the MA, and
�/30 cm in the OG plots (Hypothesis 4, Table 2). Both
bivariate null models (toroidal shift and random label-
ing) are very robust and produce reliable results when the
heterogeneity of the plot is slight (Diggle and Chetwynd
1991, Wiegand and Moloney 2004).
Results
1) Stand structure and composition
Douglas-fir. The relative species frequency of Df de-
clined during succession from 49.9 to 16.7% (Table 3).
Also, its mortality declined with increasing stand age
from 56.8% in the IM plot to 36.5% in the OG plot. Its
mean DBH increased with stand age from 8.2 to 52.2 cm.
Compared to other species, Df consistently had the
Table 2. Hypotheses, applied point pattern analyses, and related figures used in this study.
Hypotheses Point pattern analyses; nullhypotheses applied
Relatedfigures
1) The spatial pattern of all dead andlive Douglas-fir becomes regular duringsuccession.
Pair-correlation function g(r),heterogeneous Poisson null model; CSRonly within moving window R�/ 10 m.
Fig. 3A�H
2) Intra-specific competition leads to a moreregular post-mortality pattern of surviving trees,which is indicative of self-thinning.
Univariate random labeling with g11(r); live treesare a random subset of pre-mortality pattern (deadand live trees).
Fig. 4A�H
3) Inter-specific competition betweenshade-intolerant Douglas-fir and shade-tolerantspecies (western hemlock and western redcedar)leads to interspecific repulsion.
Bivariate analysis with g12(r) and the toroidal shiftnull model; no spatial correlation between Douglas-fir(pattern 1) and shade-tolerant species (pattern 2).
Fig. 5A�C
4) Tree death of larger overstory trees is a spatialrandom process at each succession stage.
Bivariate random labeling with g21(r)-g22(r);no spatial correlation of larger dead trees (pattern 2).
Fig. 6A�C
Table 3. Stand structure and composition of the chronosequence. ���/mean, NN�/nearest neighbor; S�/Pielou’s segregationindex.
Plot/species
�NN�distance
(m) in plot
Numberof
stems
% stems % mortalityper species
�DBH�(cm)
per species
% with DBHof 0.1�10 cm
% mortalitywithin DBH
class of 0.1�10 cm
Pielou’s S
Immature 0.63Douglas-fir 885 49.9 56.8 8.2 74.0 60.8 0.296Western hemlock 750 42.3 71.7 5.4 86.6 75.6 0.318
Mature 0.82Douglas-fir 875 28.9 50.1 33.7 6.5 95.5 0.193Western hemlock 381 12.6 19.7 10.0 65.7 23.9 0.398Western redcedar 720 23.8 5.3 7.8 80.5 5.1 0.567
Old-growth 0.93Douglas-fir 244 16.7 36.5 52.2 15.3 44.4 0.350Western hemlock 1061 72.6 40.3 11.0 59.0 57.3 0.485Western redcedar 130 8.9 24.6 19.9 36.0 21.9 0.600
ECOGRAPHY 29:5 (2006) 675

lowest segregation index in each plot and was thus
spatially least separated (Table 3).
Western hemlock. The species proportion of Hw was
intermediate in the IM plot, low in the MA plot but high
in the OG plot (Table 3). Its proportion in the smallest
DBH class of 0.1�10 cm was highest (86.6%) due to the
initial colonization in the IM plot, but lowest in the OG
plot. In each succession stage, Hw was spatially more
separated than Df but less than Cw (Table 3).
Western redcedar. This species was virtually absent
from the immature plot but started to colonize at the
mature succession stage, as indicated by both its overall
proportion (23.8%) and its high proportion in the
smallest DBH class of 0.1�10 cm (80.5%) in the MA
plot (Table 3). Its mortality was always lowest in this
small size class. Cw had the highest segregation index
within a plot, and thus was spatially more separated than
other species.
2) Correlations between tree size and nearest-
neighbor distances
Douglas-fir. The relative importance of competition for
Df as whole group as well as intra-specific competition
declined from the IM plot to the MA plot but increased
strongly in the OG plot (Fig. 2A�B). Inter-specific
competition of Df declined constantly with increasing
stand age (Fig. 2C). There was no significant difference
in mortality of Df within con- or heterospecifics, neither
in the IM nor in the MA plot, but intra-specific
mortality was significantly lower than inter-specific
mortality in the OG plot (Table 4A).
Western hemlock. The temporal pattern of competi-
tion of Hw is similar to Df. Competition of Hw as a
whole species group and intra-specific competition
within conspecifics declined from the IM plot to the
MA plot but increased in the OG plot (Fig. 2A�B).
Similar to Df, inter-specific competition of Hw
declined with increasing stand age. Inter-specific com-
petition was strong for hemlock in the IM plot, as
indicated by the high coefficient of determination
(0.59) (Fig. 2C). Unlike Df, inter-specific mortality of
Hw was significantly lower than intra-specific mortal-
ity in the IM and MA plots (Table 4A). In compar-
ison to Df, the strength of Hw as a shade-tolerant
colonizer is also reflected in the four times lower inter-
specific mortality of Hw in the MA plot, although Hw
was surrounded by significantly larger trees than Df
(Table 4B).
Western redcedar. Competition of Cw as a whole
species group and intra-specific competition declined
from the MA plot to the OG plot (Fig. 2A�B). Similar
to Df, intra-specific and inter-specific mortality was not
significantly different for Cw during its initial coloniza-
tion in the MA plot. However, it had a significantly
lower inter-specific mortality (3.3%) than Df and Hw,
although Cw was in both cases surrounded by signifi-
cantly larger trees (Table 4B).
Stand age
39 yr 109 yr 254 yr
Intr
a-sp
ecifi
c co
mpe
titio
n (r
2 )
0.0
0.1
0.2
0.3
0.4
0.5
0.6 B
Stand age
39 yr 109 yr 254 yr
Inte
r-sp
ecifi
c co
mpe
titio
n (r
2 )
0.0
0.1
0.2
0.3
0.4
0.5
0.6 C
Stand age
39 yr 109 yr 254 yr
Spe
cies
com
petit
ion
(r2 )
0.1
0.2
0.3
0.4
0.5
0.6 A
Fig. 2. The importance of competition for Douglas-fir (____),western hemlock (� � ), and western redcedar (� � �) as wholegroups (A), without distinguishing between con- and hetero-specific neighborhoods. Intra-specific (B), and inter-specific (C)competition of the species in con- and heterospecific neighbor-hoods, respectively.
676 ECOGRAPHY 29:5 (2006)

3) Spatial pattern analysis
Univariate patterns
Douglas-fir. Pre-mortality Df (dead�/live) aggregated up
to 5.5 m in the IM plot, were randomly distributed in the
MA plot, and showed a strong small-scale aggregation at
scales 5/2 m in the OG plot (Fig. 3A�C). The random
mortality hypothesis could not be rejected for Df in the
IM and MA plots (Fig. 4A�B). However, the distribu-
tion of live Df in the OG plot was aggregated at scales up
to 2.5 m (Fig. 4C).
Western hemlock. Pre-mortality patterns of Hw were
aggregated in all plots (Fig. 3D�F), with the strongest
aggregation in old-growth. In comparison to the pre-
mortality patterns, surviving Hw (post-mortality) were
partly regularly distributed in the IM and MA plots,
showing strong evidence of self-thinning, but were more
aggregated in the OG plot (Fig. 4D�F).
Western redcedar. All Cw were strongly aggregated in
the MA and OG plots (Fig. 3G�H). The post-mortality
pattern was random in the MA plot but aggregated in
the OG plot (Fig. 4G�H).
Bivariate patterns
Inter-specific competition between shade-intolerant
Douglas-fir and shade-tolerant species was not detect-
able via regular distributions from point pattern analysis.
Hw aggregated strongly at the smallest scale around Df
in the IM plot (Fig. 5A), but with the increase in stand
age, the spatial association of other species around Df
disappeared (Fig. 5A�C). Analyses with only live trees
revealed the same results (not shown).
Tree death was spatially randomly distributed among
larger overstory trees in the IM and MA plots (Fig. 6A�B). However, there was a significant positive correlation
for dead trees at distances up to 1.5 m in the OG plot
(Fig. 6C). This was probably a size class effect because
most dead trees had a DBH of 30�40 cm. To exclude
such size class effect, one would have to exclusively look
at DBH classes above 40 cm. But there were too few trees
in this large size class in the OG plot to permit a reliable
statistical analysis.
Discussion
Spatial patterns and competition
Using scale-dependent spatial statistics, small-scale ne-
gative interactions among Douglas-fir trees have been
observed on Vancouver Island (He and Duncan 2000).
In contrast, our analysis of a chronosequence of
Douglas-fir forest showed aggregation at distances
below 6 m, which indicates a positive interaction at
small spatial scales. Moreover, the degree of spatial
aggregation and the importance of competition were
positively linked in our study (cf. Fig. 3 vs Fig. 2A).
For Douglas-fir and hemlock, spatial aggregation and
Table 4. Pairwise comparison of mortality, nearest neighbor distances (NN), and surrounding tree size (DBH). (A) within the samespecies undergoing intra- and inter-specific competition and (B) between two species undergoing inter-specific competition. Therewere not enough data for redcedar in the immature plot. (*�/significant at pB/0.05; **pB/0.01; ^p�/0.052; ^^p�/0.057).
Plot/attribute Df intra Df inter Hw intra Hw inter Cw intra Cw inter
(A) Within speciesImmature
Mortality (%) 48.6 50.3 77.1 53.8**�4 NN dist.� (m) 4.85 4.87 3.45 5.36**�4 DBH� (cm) 24.8 24.3 18.4 30.9**
MatureMortality (%) 40.9 39.4 33.3 10.0** 4.2 3.3�4 NN dist.� (m) 9.44 8.25** 7.23 8.46** 5.83 8.83**�4 DBH� (cm) 112.7 43.9** 42.0 70.2** 39.1 89.8**
Old-growthMortality (%) 24.0 51.4* 53.8 62.3 17.9 41.2^
�4 NN dist.� (m) 11.39 9.47* 6.86 10.90** 9.23 11.21*�4 DBH� (cm) 166.8 65.4** 50.6 110.3** 62.3 96.4**
Plot/attribute Df inter Hw inter Df inter Cw inter Hw inter Cw inter
(B) Between speciesImmature
Mortality (%) 50.3 53.8�4 NN dist.� (m) 4.87 5.36�4 DBH� (cm) 24.3 30.9**
MatureMortality (%) 39.4 10.0** 39.4 3.3** 10.0 3.3*�4 NN dist.� (m) 8.25 8.46 8.25 8.83 8.46 8.83�4 DBH� (cm) 43.9 70.2** 43.9 89.8** 70.2 89.8**
Old-growthMortality (%) 51.4 62.3 51.4 41.2 62.3 41.2^^
�4 NN dist.� (m) 9.47 10.90* 9.47 11.21* 10.90 11.21�4 DBH� (cm) 65.4 110.3** 65.4 96.4** 110.3 96.4
ECOGRAPHY 29:5 (2006) 677

competition were highest in the immature and old-
growth plots but lowest in the mature plot. Likewise,
the pattern of redcedar was more aggregated and
competition more important in the mature plot, as
compared to old-growth. Here, we suggest that competi-
tion during the long time span of succession does not
necessarily need to result in small-scale regularity of
whole species patterns and propose three reasons for that
observation.
Firstly, a positive link between competition and
aggregation may arise when competitive thinning of
large trees leads to gaps in which clustered offspring
regenerate. This has been proposed by Pileou (1962) and
was recently supported by a forest model (Moravie and
Robert 2003). Under such circumstances, the overall
pattern of a species is only indirectly influenced by
mortality of large trees but directly determined by the
pattern of gap recruitment of small competing trees
(Simard and Sachs 2004, Wolf 2005). This did not occur
with Douglas-fir in the homogeneous old-growth plot of
He and Duncan (2000), because canopy gaps are usually
not large enough for shade-intolerant Douglas-fir to
regenerate underneath. However, with 500 mm less
precipitation per year our chronosequence was much
drier, and on dry sites gaps may reach sizes that lead to
clustered regeneration of Douglas-fir (Spies et al. 1990).
Secondly, spatial heterogeneity induced by edaphic
gaps may cause a patchy (clumped) size class distribu-
tion, thereby masking the tendency towards regular
growth patterns (Sterner et al. 1986, Dovciak et al.
2001). Such gaps often have sufficient sizes for regenera-
tion and pioneer species like Douglas-fir may re-colonize
the gap peripheries after other species have died due to
wind throw (Lertzman et al. 1996). Besides temporal
disturbances by fire (Franklin and DeBell 1988), spatial
heterogeneity may be crucial for the long-term persis-
tence of shade-intolerant pioneer Douglas-fir during
succession. This assumption is supported by the lower
mortality (36.5%) of Douglas-fir in our heterogeneous
old-growth stand, as compared to its higher mortality
(47.8%) in the homogeneous old-growth stand of He and
Duncan (2000). Whereas the spatial pattern of western
hemlock and western redcedar is typically aggregated
(Keeton and Franklin 2005), the pattern of Douglas-fir
seems to be largely dependent on the degree of spatial
variation in local dryness and edaphic heterogeneity. In
Immature Mature Old-growth
r (m)
0 5 10 15 20 25 30 35 40
g(r)
12345678
(C) Df + at 0.5-2.0m
r (m)
0 5 10 15 20 25 30
g(r)
1
2
3(A) Df + at 0.5-5.5m
r (m)
0 5 10 15 20 25 30
g(r)
1
2
3
4
5(D) Hw + at 0.5-3.0m
r (m)
0 5 10 15 20 25 30 35 40
g(r)
12345678
(E) Hw + at 0.5-2.5m
r (m)
0 5 10 15 20 25 30 35 40
g(r)
123456789
(F) Hw + at 0.5-6.0m
r (m)
0 5 10 15 20 25 30 35 40
g(r)
123456789
(G) Cw + at 0.5-5.0m
r (m)
0 5 10 15 20 25 30 35 40
g(r)
2468
1012141618
(H) Cw + at 0.5 m
r (m)
0 5 10 15 20 25 30 35 40
g(r)
1
2(B) Df random
Fig. 3. Univariate analyses of the overall (pre-mortality) patterns of dead and live Douglas-fir (A, B, C), western hemlock (D, E, F)and western redcedar (G, H), using g(r) and the heterogeneous Poisson null model with a moving window of R�/10 m. The large-scale heterogeneity was well captured by the null model at scales beyond R�/10 m, but deviation from CSR occurred within themoving window. Significant aggregation is indicated by a ‘‘�/’’. (g(r)�/black solid line; 99% upper and lower confidence limits�/greylines).
678 ECOGRAPHY 29:5 (2006)

agreement with results from other forest types (McDo-
nald et al. 2003), we highlight the importance of
variation in local site characteristics and site history
for the unexpected small-scale clumping of Douglas-fir
in our old-growth stand.
Thirdly, a reason for the lack of evidence of spatial
regularity despite finding important competition via size
correlations is that competition may not be strong
enough to cause mortality but just to reduce growth.
Only when competition leads to sufficient mortality
within a species pattern, it will cause regular distribu-
tions (Stoll and Bergius 2005). Also, species may have
differential abilities to cope with intra-and inter-specific
competition. To account for such confounding effects on
the spatial pattern of species, it is important to look at
intra- and inter-specific competition within a succession
stage.
Intra-specific competition
Previous studies have shown that post-mortality patterns
of surviving trees were more regular than expected under
random-thinning (Sterner et al. 1986, Kenkel 1988,
Duncan 1991, He and Duncan 2000). In this case,
r (m)0 5 10 15 20 25 30
1
2
3
4(A) live Df random
r (m)0 5 10 15 20 25 30 35 40
g 11
(r)
g 11
(r)
g 11
(r)
g 11
(r)
g 11
(r)
g 11
(r)
g 11
(r)
g 11
(r)
1
2
3(B) live Df random
Immature Mature Old-growth
r (m) 0 5 10 15 20 25 30 35 40
2468
10121416
(C) live Df + at 0.5-2.5m
r (m)0 5 10 15 20 25 30 35 40
12345678
(E) live Hw - at 2.0-2.5m
r (m) 0 5 10 15 20 25 30 35 40
2
4
68
10
1214 (F) live Hw + at all m
r (m)0 5 10 15 20 25 30
1
2
3
4
5
6
7(D) live Hw - at 6.0-7.0m
r (m)
0 5 10 15 20 25 30 35 40
123456789
(G) live Cw random
r (m)
0 5 10 15 20 25 30 35 40
5
10
15
20
25(H) live Cw + at 0.5m
Fig. 4. Univariate analyses of the post-mortality patterns of live Douglas-fir (A, B, C), western hemlock (D, E, F), and westernredcedar (G, H), using univariate random labeling (g11) as null model which also accounts for the heterogeneity.
Immature Mature Old-growth
r (m)0 5 10 15 20 25 30 35 40
1
2(B) Df-non Df + at 0.5-2.0m
r (m)0 5 10 15 20 25 30
g 12
(r)
Inde
pend
ence
g 12
(r)
Inde
pend
ence
g 12
(r)
Inde
pend
ence
1
2(A) Df-Hw + at 0.5m
r (m)0 5 10 15 20 25 30 35 40
1
2(C) Df-non Df random
Fig. 5. Bivariate analysis of all hemlock (pattern 2) around all Douglas-fir (pattern 1) in the immature plot (A), using g12(r) and thetoroidal shift null model. In the mature and old-growth plots (B, C) more than one shade-tolerant species was dominating.Therefore, at each time, we used all other species as pattern 2 and Douglas-fir as pattern 1.
ECOGRAPHY 29:5 (2006) 679
resource depletion leds to density-dependent self-thin-
ning and thereby to a non-random mortality of trees.
Despite the shift from aggregation to a random
distribution of all (dead and live) Douglas-fir in the
immature and mature plots, respectively, intra-specific
mortality was not significantly different from random
mortality. Of the three species, only surviving hemlock
showed a more regular post-mortality pattern in the IM
and MA plots. Self-thinning effects must have been
strong for that species but were less important for Df
and Cw in our sites. These findings were also supported
by comparing the mortalities in conspecific and hetero-
specific neighborhoods. Of the three species, only Hw
showed a significantly higher mortality rate in conspe-
cific than in heterospecific neighbourhoods (Table 4A).
Although, comparing pre- and post-mortality patterns
is a strong approach in detecting competition, a single
plot only represents a snap-shot analysis. Possibly, the
snap-shot within the immature plot does not contain
information from a sufficiently long time period to
capture the signature of self-thinning. In our old-growth
plot, mortality of Df was clustered, leading to an even
more aggregated pattern of live trees. This deviation
from random mortality is again opposite to the pattern
of the old-growth forest studied by He and Duncan
(2000), who found Df to shift towards a more regular
distribution. It is likely that in our study sites intra-
specific competition was relatively important for recruit-
ing Df in gaps of the OG plot (Fig. 2A), but that there
were also facilitating effects at the same time, leading to
an increased aggregation of surviving Df. In ecological
studies, the concept of facilitation has been often
neglected and negative interactions have been over-
emphasized but, for example, in harsh terrestrial envir-
onments high seedling densities can increase growth and
survivorship (Bruno et al. 2003). A low mortality of just
24% in conspecific Df as compared to 51% within
heterospecifics in the OG plot supports this assumption.
For shade-intolerant pioneer Douglas-fir it is almost
impossible to regenerate under the out-shading canopy
of late-successional colonizers such as hemlock and
redcedar (Franklin and DeBell 1988, Spies et al. 1990).
Since regeneration of Df in old-growth is only sufficient
under suitable gaps and under more similar and light-
transmitting crowns within conspecifics, facilitation
within Df could be important and may reduce this
thinning process.
Inter-specific competition
In temperate forests a fundamental trade-off exists for
the growth rate in high light, which is correlated with
good seed dispersal, versus the survival rate in shade
(Kobe et al. 1995, Silvertown 2004). In terms of an
expected negative spatial association between shade-
intolerant Df and shade-tolerant species, we found that
inter-specific competition was not strong enough to lead
to sufficient tree death and hence being detectable via
spatial pattern analysis. None of the bivariate analyses
found repulsion between Df and shade-tolerant species,
not even when we did these analyses just for live trees
(not shown).
However, there was important inter-specific competi-
tion when hemlock initially colonized the immature plot,
as can be seen from correlation between tree size and
nearest-neighbor distances. But competition of Hw
within heterospecifics resulted in a significantly lower
mortality than within conspecifics (Table 4A). This
explains, why shade-tolerant Hw aggregates around Df
in the immature plot although inter-specific competition
is important. As a late-successional species, hemlock
survival appears highly adapted to competition within
heterospecifics (but not within conspecifics), thus to
replacing the pioneer Douglas-fir. In contrast, survival
of Douglas-fir within hetero- and conspecifics was not
significantly different, neither in the immature nor in the
mature plot, pointing to its strength as a pioneer that
equally withstands intra- and inter-specific competition
in the first succession phases.
Direct competitive interaction between the species
strongly declined with increasing stand age (Fig. 2C).
Here, spatial niche separation stabilized the coexistence
of species towards older succession stages as is also
indicated by the increase in spatial segregation of the
species (Pielou’s S in Table 3). The spatial niche
separation does not need to be a direct result of inter-
Immature Mature Old-growth
r (m)0 5 10 15 20 25 30 35 40
-6
-4-2
0
2
46 (B) live-dead DBH > 20cm
random
r (m)0 5 10 15 20 25 30 35 40
-3
-2
-10
1
23
4 (C) live-dead DBH > 30cm
- at 0.5-1.5m
r (m)0 5 10 15 20 25 30
g 21(r
)-g 22
(r)
Ran
dom
Lab
elin
g
g 21(r
)-g 22
(r)
Ran
dom
Lab
elin
g
g 21(r
)-g 22
(r)
Ran
dom
Lab
elin
g
(A) live-dead DBH > 10cm
-4
-2
0
2
4
random
Fig. 6. Bivariate random labeling (g21(r)-g22(r)) to investigate whether tree death (pattern 2) was a random process among largertrees in a plot. Under the null model ‘‘random labeling’’, g21(r)-g22(r)�/0 (grey broken line). Analyses included trees with a DBH�/
10 cm in the immature plot (A),�/20 cm in the mature plot (B), and�/30 cm in the old-growth plot (C).
680 ECOGRAPHY 29:5 (2006)

specific competition, because it can also be caused by
micro-habitat heterogeneity such as the variability in
forest-floor micro-relief (Duncan 1991). A recent study
on Vancouver Island has shown that redcedar has a
greater proportion of fine roots in the lower soil horizons
than hemlock and that such spatial resource partitioning
may be a mode to avoid direct inter-specific competition
(Bennett et al. 2002). Hw has usually stronger inter-
specific effects on Cw than vice versa (Weber et al. 2003,
Canham et al. 2004), but in this dry chronosequence Hw
was probably physiologically disadvantaged and Cw was
favored due to its better root penetration (Burns and
Honkala 1990).
The different mortalities of species may also reflect
different survival and dispersal strategies. Our results
suggest that western hemlock seems to follow a ‘‘seed-
flooding strategy’’ with generally high mortality during
initial colonization. This initial high mortality is pri-
marily attributed to its lower survivial within conspe-
cifics. These findings are supported by results from
interior British Columbia, where the abundance of
hemlock was always highest of all species under a
gradient from closed to fully open canopy although
overall mortalities were relatively high, too (Coates
2002). In contrast, redcedar is spatially much more
selective as indicated by the consistently highest segrega-
tion index within a plot. This favored its survival during
initial colonization of the mature plot but such a
spatially confined strategy would be at the cost of
missing favorable gaps during critical temporal changes
in the forest structure and hence at the cost of not being
dominant in older succession stages. Also, the best place
for early establishment is not necessarily the best place
for survival and growth. Coates (2002) has shown that
tree abundance and composition was rather controlled
by differentiation among growth and survival niches
than by regeneration niches. Hence, the strength of
hemlock as a successful colonizer may be attributed to a
seed-flooding strategy whereby it not only increases the
risk of mortality, primarily within conspecifics, but also
the chance of reaching suitable survival niches within
heterospecifics.
Once the trees have reached the upper canopy layer,
mortality of large trees was spatially randomly distrib-
uted. Only in old-growth there was a spatial correlation
of dead trees at very small scales, but this was only
observed in certain smaller size-classes. Hence, competi-
tion or other mortality inducing processes did not affect
the pattern of large trees of the overstory.
In summary, our study highlights the importance of
spatial resource partitioning as a mode to avoid direct
competitive interaction during succession. It emphasizes
that late-successional species may initially exhibit strong
inter-specific competition but their strength lies in a
relatively high survival rate during competition which is
mediated by micro-habitat heterogeneity.
Acknowledgements � This research was fully supported by thePacific Forestry Centre of the Canadian Forest Service. Thework was conducted during the visit of SG to the Dept ofRenewable Resources, Univ. of Alberta.
References
Bailey, T. C. and Gatrell, A. C. 1998. Interactive spatial dataanalysis. � Longman.
Bennett, J. N. et al. 2002. Vertical fine root distributionsof western redcedar, western hemlock, and salal in old-growth cedar-hemlock forests on northern VancouverIsland. � Can. J. For. Res. 32: 1208�1216.
Bruno, J. F. et al. 2003. Inclusion of facilitation into ecologicaltheory. � Trends Ecol. Evol. 18: 119�125.
Burns, R. M. and Honkala, B. H. 1990. Silvics of NorthAmerica: 1. conifers. � Agriculture Handbook 654, U.S.Dept Agricult.
Canham, C. D. et al. 2004. A neighborhood analysis of canopytree competition: effects of shading versus crowding. � Can.J. For. Res. 34: 778�787.
Chen, J. et al. 2004. Spatial relationship of biomass andspecies distribution in an old-growth Pseudotsuga -Tsugaforest. � For. Sci. 50: 364�375.
Coates, K. D. 2002. Tree recruitment in gaps of various size,clearcuts and undisturbed mixed forest of interior BritishColumbia, Canada. � For. Ecol. Manage. 155: 387�398.
Condit, R. et al. 2000. Spatial patterns in the distribution oftropical tree species. � Science 288: 1414�1418.
Dale, M. R. T. et al. 2002. Conceptual and mathematicalrelationships among methods for spatial analysis. � Eco-graphy 25: 558�577.
Diggle, P. J. and Chetwynd, A. G. 1991. Second-order ana-lysis of spatial clustering for inhomogeneous populations.� Biometrics 47: 1155�1163.
Dovciak, M. et al. 2001. Discordance in spatial patterns ofwhite pine (Pinus strobus ) size-classes in a patchy near-boreal forest. � J. Ecol. 89: 280�291.
Duncan, R. P. 1991. Competition and the coexistence of speciesin a mixed podocarp stand. � J. Ecol. 79: 1073�1084.
Fang, W. 2005. Spatial analysis of an invasion front of Acerplatanoides : dynamic inferences from static data. � Eco-graphy 28: 283�294.
Ford, E. D. 1975. Competition and stand structure in someeven-aged plant monocultures. � J. Ecol. 63: 311�333.
Franklin, J. F. and DeBell, D. S. 1988. Thirty-six years of treepopulation change in an old-growth Pseudotsuga -Tsugaforest. � Can. J. For. Res. 18: 633�639.
Green, R. N. and Klinka, K. 1994. A field guide to siteidentification and interpretation for the Vancouver ForestRegion. �Land Manage. Handbook. No. 28, B.C. Min. For.
Harms, K. E. et al. 2001. Habitat associations of trees andshrubs in a 50-ha neotropical forest plot. � J. Ecol. 89: 947�959.
He, F. and Duncan, R. P. 2000. Density-dependent effects ontree survival in an old-growth Douglas fir forest. � J. Ecol.88: 676�688.
He, F. and Legendre, P. 2002. Species diversity patterns derivedfrom species-area models. � Ecology 83: 1185�1198.
Keeton, W. S. and Franklin, J. F. 2005. Do remnant old-growthtrees accelerate rates of succession in mature Douglas-firforest? � Ecol. Monogr. 75: 103�118.
Kenkel, N. C. 1988. Patterns of self-thinning in jack pine:testing the random mortality hypothesis. � Ecology 69:1017�1024.
Kint, V. et al. 2003. Spatial methods for quantifying forest standstructure development: a comparison between nearest-neighbor indices and variogram analysis. � For. Sci. 49:36�49.
ECOGRAPHY 29:5 (2006) 681

Kobe, R. K. et al. 1995. Juvenile tree survivorship as acomponent of shade tolerance. � Ecol. Appl. 5: 517�532.
Kokkila, T. et al. 2002. A method for generating standstructures using Gibbs marked point process. � SilvaFenn. 36: 265�277.
Lertzman, K. P. et al. 1996. Canopy gaps and the landscapemosaic in a coastal temperate rain forest. � Ecology 77:1254�1270.
Mast, J. N. and Veblen, T. T. 1999. Tree spatial patterns andstand development along the pine-grassland ecotone in theColorado Front Range. � Can. J. For. Res. 29: 575�584.
Mateu, J. et al. 1998. The spatial pattern of a forest ecosystem.� Ecol. Modell. 108: 163�174.
McDonald, R. I. et al. 2003. Spatial pattern of Quercusregeneration limitation and Acer rubrum invasion in aPiedmont forest. � J. Veg. Sci. 14: 441�450.
Moravie, M.-A. and Robert, A. 2003. A model to ass-ess relationships between forest dynamics and spatialstructure. � J. Veg. Sci. 14: 823�834.
Newton, P. F. and Jolliffe, P. A. 1998. Assessing processes ofintraspecific competition within spatially heterogeneousblack spruce stands. � Can. J. For. Res. 28: 259�275.
North, M. et al. 2004. Forest stand structure and pattern of old-growth western hemlock/Douglas-fir and mixed-coniferforests. � For. Sci. 50: 299�311.
Peterson, C. J. and Squiers, E. R. 1995. An unexpected changein spatial pattern across 10 years in an aspen-white-pineforest. � J. Ecol. 83: 847�855.
Pielou, E. C. 1961. Segregation and symmetry in two-speciespopulations as studies by nearest-neighbour relationships.� J. Ecol. 49: 255�269.
Pielou, E. C. 1962. The use of plant-to-neighbour distances forthe detection of competition. � J. Ecol. 50: 357�367.
Plotkin, J. B. et al. 2000. Species-area curves, spatial aggrega-tion, and habitat specialization in tropical forest. � J. Theor.Biol. 207: 81�99.
Ripley, B. D. 1976. The second-order analysis of stationarypoint processes. � J. Appl. Prob. 13: 255�266.
Schurr, F. M. et al. 2004. Spatial pattern formation in semi-aridshrubland: a priori predicted versus observed patterncharacteristics. � Plant Ecol. 173: 271�282.
Shackleton, C. 2002. Nearest-neighbour analysis and theprevalence of woody plant competition in South Africansavannas. � Plant Ecol. 158: 65�76.
Silvertown, J. 2004. Plant coexistence and the niche. � TrendsEcol. Evol. 19: 605�611.
Simard, S. W. and Sachs, D. L. 2004. Assessment of interspecificcompetition using relative height and distance indices in anage sequence of seral interior cedar-hemlock forests inBritish Columbia. � Can. J. For. Res. 34: 1228�1240.
Spies, T. A. et al. 1990. Canopy gaps in Douglas-fir forests ofthe Cascade Mountains. � Can. J. For. Res. 20: 649�658.
Sterner, R. W. et al. 1986. Testing for life historical changes inspatial patterns of four tropical tree species. � J. Ecol. 74:621�633.
Stoll, P. and Bergius, E. 2005. Pattern and process: competitioncauses regular spacing of individuals within plant popula-tions. � J. Ecol. 93: 395�403.
Stoyan, D. and Stoyan, H. 1994. Fractals, random shapes andpoint fields. Methods of geometrical statistics. � Wiley.
Stoyan, D. and Penttinen, A. 2000. Recent applications ofpoint process methods in forestry statistics. � Stat. Sci. 15:61�78.
Trofymow, J. A. et al. 1997. Chronosequences for research intothe effects of converting coastal British Columbia old-growth forests to managed forests: an establishment report.� Can. For. Serv., BC-X- 374.
Weber, A. et al. 2003. Factors limiting the early survivorship ofThuja plicata on northern Vancouver Island, British Co-lumbia. � Can. J. For. Res. 33: 854�861.
Welden, C. W. and Slauson, W. L. 1986. The intensity ofcompetition versus its importance: an overlooked distinctionand some implications. � Q. Rev. Biol. 61: 23�44.
Welden, C. W. et al. 1988. Competition and abiotic stress amongtrees and shrubs in northwest Colorado. � Ecology 69:1566�1577.
Wiegand, K. et al. 2000. Do spatial effects play a role in thespatial distribution of desert-dwelling Acacia raddiana ? � J.Veg. Sci. 11: 473�484.
Wiegand, T. and Moloney, K. A. 2004. Rings, circles, and null-models for point pattern analysis in ecology. � Oikos 104:209�229.
Wolf, A. 2005. Fifty year record of change in tree spatialpatterns within a mixed deciduous forest. � For. Ecol.Manage. 215: 212�223.
Subject Editor: Jens-Christian Svenning.
682 ECOGRAPHY 29:5 (2006)