spatial network analysis of public transport systems: developing a
TRANSCRIPT
Spatial Network Analysis of Public Transport Systems: Developing a Strategic Planning Tool to Assess the Congruence
of Movement and Urban Structure in Australian Cities
Jan Scheurer, Carey Curtis and Sergio Porta
Australasian Centre for the Governance and Management of Urban Transport (GAMUT), The University of Melbourne, Victoria 3010, Australia (an initiative of the Volvo Research and
Educational Foundations)
1
Spatial Network Analysis of Public Transport Systems: Developing a Strategic Planning Tool to Assess the Congruence of
Movement and Urban Structure in Australian Cities
Dr Jan Scheurer (1), A/Prof Carey Curtis (2), Dr Sergio Porta (3)
(1) Australian Housing and Urban Research Institute (AHURI), RMIT University, Melbourne; Institute for Sustainability and Technology Policy (ISTP), Murdoch University, Perth; [email protected]
(2) Department of Urban and Regional Planning, Curtin University of Technology, Perth; [email protected]
(3) Dipartimento di Progettazione dell’Architettura, Politecnico di Milano (Italy); [email protected]
Introduction This paper introduces a GIS-based tool designed to assess centrality and connectivity in urban public transport networks. Despite some recent progress and supportive rhetoric by policy makers, the public transport systems of large Australian cities remain characterised by market shares significantly below those in most developed cities outside the US. Public transport users and experts have long lamented that sizeable proportions of Australian metropolitan areas have no access to high-quality public transport services and where they do these services only cover a limited range of possible destinations. Public transport thus largely fails to live up to a ‘go anywhere, anytime’ principle that would make it more competitive with car travel.
The spatial network analysis of public transport systems endeavours to identify and visualise strengths and weaknesses of geographical coverage, network connectivity, competitive speed and service levels in a coherent mapping exercise. It is closely linked to the movement and activity centre networks promoted as redevelopment corridors and nodes in recent metropolitan strategies such as Melbourne 2030 and Perth’s Network City, and can thus serve as a communicative tool for transport and land use planners, urban designers and community advocates. The model was first developed in 2006 for Melbourne’s north-eastern suburbs in a project initiated by seven local councils and convened by the Metropolitan Transport Forum. In 2007, as part of an ARC Linkage grant on Transit-Led Development in a New Rail Corridor, it is being applied to the entire Perth metropolitan area to conduct a before-and-after assessment of the impacts of the Perth to Mandurah railway opening later in the year.
Best practice public transport systems The significance of public transport for urban mobility in developed cities varies greatly. Public transport is used for just over 2% of all trips in Atlanta and Los Angeles, 4-5% of all trips in Brisbane and Perth, 7% of all trips in Melbourne and Sydney, 14-16% of all trips in Copenhagen, Hamburg and Toronto, and 26-31% of all trips in Barcelona, Vienna and Singapore (Kenworthy and Laube 2001). This variation is influenced, for example, by historic and current policy priorities for infrastructure development and the form of urban settlements, and the competitiveness of different modes in terms of speed and pricing (Newman and Kenworthy 1999; Gleeson, Curtis and Low 2003). Among many other developed cities, Melbourne and Perth now emphasise the desirability and importance of increasing the mode share of public transport in their policy documents, such as the Melbourne 2030 metropolitan strategy (DOI 2002) and Perth’s Network City strategy (WAPC 2004). Translating these goals into practical action, however, has proved a formidable political challenge and remains
2
the subject of ongoing passionate public debate, particularly in Melbourne (Scheurer et al 2005, Mees et al 2006, Bergmaier 2006, CES 2007). In this context, it has become commonplace for cities with a relatively weak role for public transport, including the Australian state capitals, to look closely at the success factors in cities with stronger public transport, particularly in Canada, Europe and wealthy Asian countries. In geographical and operational terms, the factors that are of most interest for this paper, the success factors most frequently discussed in the literature are:
• a configuration of the system in terms of network coverage and service frequencies that offers a viable alternative to the car for most, if not all, travel purposes across the urban area (Laube 1998)
• a legible network structure that is efficient to operate, easy to navigate and offers a choice of routes wherever possible (Mees 2000, Vuchic 2005)
• a speed advantage of urban rail over road traffic along a city’s main corridors (Newman 2005)
• the integration of public transport facilities with supportive urban development, in particular high-density, mixed-use, walkable nodes around rail stations and major interchanges (Bernick and Cervero 1997, Cervero 1998, Dittmar and Ohland 2004)
• an institutional framework that allows for integrated, publicly accountable capital investment and service planning (Mees 2005, Mees et al 2006, Bergmaier 2006)
To examine these geographical and configurational success factors more closely, we will, in the following section, introduce a range of measures and indicators to explain the common observation, intuitively quite obvious, that public transport tends to perform better and attract a greater share of trips in parts of the city with greater centrality. A high level of centrality in a geographical sense can be understood as spatial proximity to a high number and range of urban activities, while in a network sense it can be measured in several different ways, according to the configuration of a movement system around nodes and edges and their distribution over, and their relationship to the activities within, the urban space. Using the supplementary concept of network connectivity, we will develop a methodology to assess programs and projects of public transport system expansion or reconfiguration in Melbourne and Perth against their ability to increase levels of centrality over greater parts of the network, and against the congruence of this centrality pattern with that depicted in strategic planning documents and supported by the movement networks of other transport modes.
Understanding connectivity and centrality in complementary movement networks The analysis of movement networks to capture mobility patterns in cities, and to assess urban design qualities associated with them, has received increasing attention in recent years. The work of Hillier and Hanson (1984) and Hillier (1996) informed the development of the Space Syntax methodology, which has been applied in numerous cities world-wide. It centres on a practice of ‘axial mapping’, which is usually based on the breakdown of surface (street) networks into segments identified by line of sight or continuity across intersections in terms of road hierarchy or user legibility. Space syntax applications investigate issues as diverse as the spatial integration of network elements, pedestrian and vehicle flows, human way-finding, social and economic vitality and criminality at a micro-scale. Summarising this methodology, Porta, Crucitti and Latora (2006a) point out that axial mapping as a topological image of urban movement spaces does in fact reverse a traditional and in some respects intuitive categorisation of network elements: it defines street segments as nodes and intersections as edges connecting these nodes. Porta et al categorise this as the dual approach of analysing movement networks. While displaying an ability to compile an abstract, topological image of a network (such as calculating the number of directional changes required to move from origin to destination), the weakness of the dual approach lies
3
in a necessary detachment from spatial and sensory experience, particularly in the omission of distance, or spatial resistance, as the principal property of urban geography (see also Crucitti, Latora and Porta 2006).
In contrast, a primal approach to the analysis of movement networks (Porta, Crucitti and Latora 2006b) treats intersections as nodes and street segments as edges and is therefore capable of assigning a value of distance to these edges. This is not merely in the interest of a more realistic representation of urban geography by combining topological and metric measures of the system. The primal approach also reduces the inevitable subjectivity associated with the definition of abstracted network elements in the dual approach. The authors therefore recommend the use of the primal approach for the analysis of centrality in urban movement networks, while contending that there is no one-size-fits-all measure of centrality: rather, they call for a ‘Multiple Centrality Assessment’ involving the incorporation of four different centrality indexes, constructed upon four different concepts of centrality (see below), into a multifaceted representation.
A valid application of this technique in the context of a real-world public transport system necessitates careful consideration of the ways the analysis of public transport networks diverges, and requires different assumptions and definitions, from the analysis of movement networks for individual transport (ie. pedestrians, cyclists and motorists). This issue has been discussed in detail in an earlier paper (Scheurer and Porta 2006) and led to the following recommendations for the network assessment task:
• Out of all possible paths between two points in a network, the model needs to discriminate clearly in favour of paths that incur a minimum number of transfers between serviced public transport routes, due to the inconvenience and delay experienced by users.
• When considering transfers along a path between two points in a network, the model needs to define consistent standards of co-location and legibility of interchanges in order to classify them as network nodes, keeping in mind that some physical intersections between routes may not meet such standards.
• As a measure of spatial resistance, it is far more useful for the model to consider travel time and/or the frequency of travel opportunities as the main impediment or disutility of travel on public transport, than to resort to metric geographical distance, which is usually not on the radar of most public transport users. Travel time, in this context, should be understood not merely as in-vehicle time, but also incorporate access time, waiting time and, where applicable, transfer time.
The practical examples in this paper will thus be based on an impediment measure derived from average travel time along a route segment, divided by the frequency of the service (number of departures per hour per direction) as a proxy for edge length. Thus a higher-frequency service reduces the disutility of the trip while being subject to a principle of diminishing returns, which appears commensurate with the real-life experience (an increase in service frequency from two to four trips per hour generates a comparable need for additional input of resources as, but has a greater impact on the relative attractiveness of the service than an increase from ten to twelve services per hour).
Each transfer-free connection between any two nodes on the network is defined as a separate edge, hence the number of transfers required along a given path is always equal to the number of edges traversed less one. Paths across the network can thus be clearly measured both metrically (cumulative impediment value) as well as topologically (number of segments between transfers).
Porta, Crucitti and Latora (2006a, 2006b) suggest a range of measures to capture the properties of networks (see also Latora and Marchiori 2002). These are:
• the degree of a node, understood as the number of edges converging in it. In our example, this is a significant measure, as it expresses the number of other nodes
4

than can be reached from the node in question by way of a transfer-free public transport trip.
• the characteristic path length, understood as the average distance or impediment (metric), or degree of separation (topological), between all possible pairs of nodes within the network. This measure, as mentioned above, is best applied both metrically and topologically in public transport networks and is exquisitely suited for comparative network assessment, or scenarios for network reconfiguration, as explored in the next section.
• the global efficiency, understood as the inverse average shortest path length between any two nodes in the network. This measure is suited for fully connected as well as partially disconnected networks (the value for paths between nodes that are not connected through the network drops to 0). Global efficiency is a comparative measure, useful for the assessment of network centrality before and after alterations to the network structure or service levels, or to assess the efficiency of movement by public transport against that by car, especially in terms of travel time between nodes.
From these indicators a number of different centrality indexes are derived. Each of them is applied to individual nodes, thus containing locally relevant information:
• Degree centrality, defined as the proportion of nodes directly connected to the node in question out of the totality of nodes within the network. In our model, degree centrality is a topological index: it measures the percentage of other nodes that can be reached with a transfer-free trip. This index can be extended and applied separately to one-transfer trips, two-transfer trips, and so on.
• Closeness centrality, defined as the inverse average distance, or impediment, between the node in question and all other nodes within the network. This metric index can be adopted to public transport networks by using an impediment measure, such as travel time divided by frequency as used in this paper.
• Betweenness centrality, defined as the average proportion of paths between any two nodes within the network that traverse the node in question, out of the total number of possible paths between these two nodes. This index is critical for public transport networks, since it can capture the relative importance of transfer nodes within the system, and assist in evaluating and modelling route and interchange capacity. By extension, it can be meaningfully applied to network edges as well as nodes, to measure the relative importance of route segments (see next section).
• Efficiency or straightness centrality, defined as the ratio of the actual inverse average shortest path length between the node in question and all other directly connected nodes, to the theoretical average shortest path length within that sample. The theoretical shortest path length can be determined by comparing metric distance along the network with distance as the crow flies, thus assessing how the path relates to geographical desire lines, or by using comparative data for the road system, thus assessing the competitiveness of public transport versus the car. Efficiency centrality can also be applied very meaningfully in assessing scenarios of network reconfiguration or expansion.
• Information centrality, defined as the relative drop in network efficiency in case the node in question is removed from the network. While this property may be of interest in public transport networks to assess the system-wide impact of service disruptions or construction work, the permanent removal of particular nodes from the network is usually not a realistic scenario, particularly where these have a function as transfer points. A far more common possibility would be the removal, addition or reorganisation of entire routes or segments of routes. An index for information centrality should therefore be applied to edges rather than nodes in public transport networks. This premise brings us back to the dual approach to network analysis elaborated on above.
5

Map 1, 2: Public transport networks in Melbourne’s north-east 2006 (existing) and 2020 (proposed) with corresponding land use patterns and activity centre structure.
6
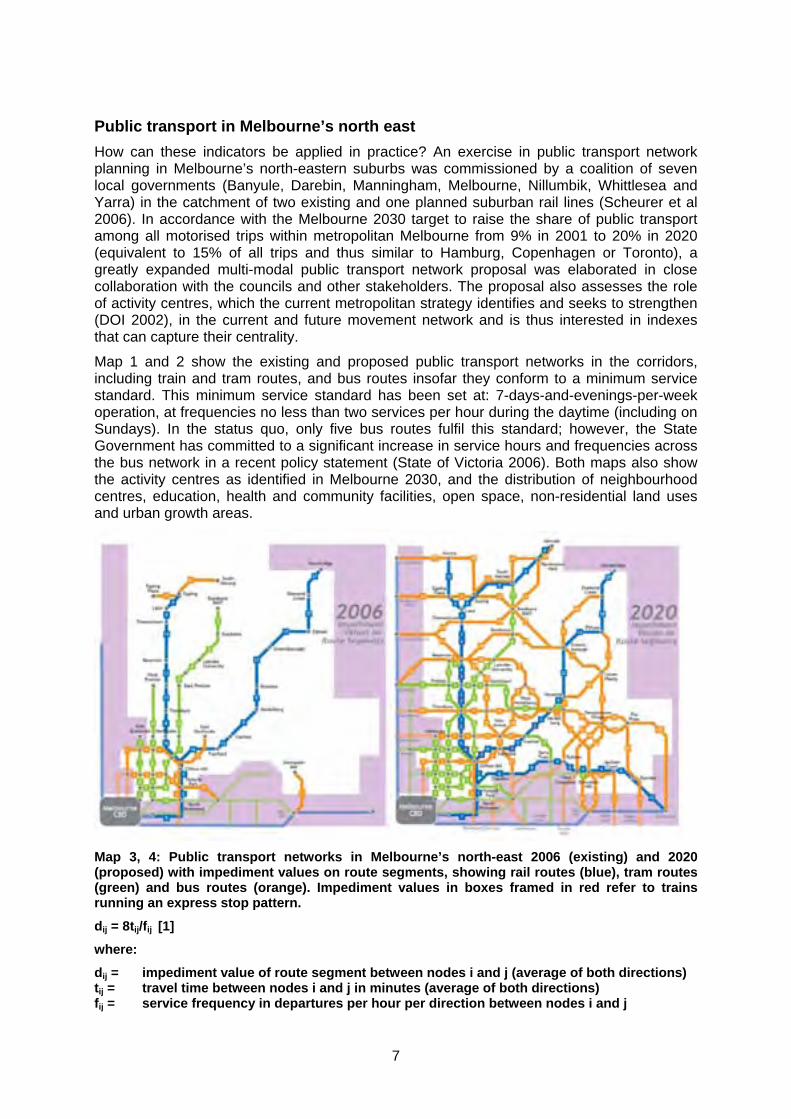
Public transport in Melbourne’s north east How can these indicators be applied in practice? An exercise in public transport network planning in Melbourne’s north-eastern suburbs was commissioned by a coalition of seven local governments (Banyule, Darebin, Manningham, Melbourne, Nillumbik, Whittlesea and Yarra) in the catchment of two existing and one planned suburban rail lines (Scheurer et al 2006). In accordance with the Melbourne 2030 target to raise the share of public transport among all motorised trips within metropolitan Melbourne from 9% in 2001 to 20% in 2020 (equivalent to 15% of all trips and thus similar to Hamburg, Copenhagen or Toronto), a greatly expanded multi-modal public transport network proposal was elaborated in close collaboration with the councils and other stakeholders. The proposal also assesses the role of activity centres, which the current metropolitan strategy identifies and seeks to strengthen (DOI 2002), in the current and future movement network and is thus interested in indexes that can capture their centrality.
Map 1 and 2 show the existing and proposed public transport networks in the corridors, including train and tram routes, and bus routes insofar they conform to a minimum service standard. This minimum service standard has been set at: 7-days-and-evenings-per-week operation, at frequencies no less than two services per hour during the daytime (including on Sundays). In the status quo, only five bus routes fulfil this standard; however, the State Government has committed to a significant increase in service hours and frequencies across the bus network in a recent policy statement (State of Victoria 2006). Both maps also show the activity centres as identified in Melbourne 2030, and the distribution of neighbourhood centres, education, health and community facilities, open space, non-residential land uses and urban growth areas.
Map 3, 4: Public transport networks in Melbourne’s north-east 2006 (existing) and 2020 (proposed) with impediment values on route segments, showing rail routes (blue), tram routes (green) and bus routes (orange). Impediment values in boxes framed in red refer to trains running an express stop pattern.
dij = 8tij/fij [1]
where:
dij = impediment value of route segment between nodes i and j (average of both directions) tij = travel time between nodes i and j in minutes (average of both directions) fij = service frequency in departures per hour per direction between nodes i and j
7

Maps 3 and 4 are a schematic representation of the network nodes and the impediment scores for the network edges. Nodes have been defined as intersections between routes with co-located and legible transfer opportunities, and intermediate stops along routes within activity centres as identified in the Melbourne 2030 metropolitan strategy. The impediment scores or proxy values for travel disutility, as discussed above, have been determined by dividing the average interpeak travel time in minutes by the average frequency of services per hour, and multiplied by a coefficient of 8 to achieve better readability. As the project covers only a section of Melbourne’s public transport network, edges that cross the boundary of the study area have been included in all counts, but nodes outside the study area are disregarded in calculating network performance as a whole.
Our first nodal index, degree centrality, has been plotted on both networks as the percentage of nodes across the system that can be reached from the node in question without a transfer. Map 5 and 6 show these indicators. It should be noted that the definition of transfer-free trips is not without ambiguity, particularly in more complex networks where a choice of routes exists between most pairs of nodes. In some of these cases, a transfer trip may result in shorter travel times and the use of modes with higher service frequency and/or higher performance and passenger comfort (such as suburban rail) for a greater portion of the trip than a transfer-free connection. It can be expected that different groups of system users will make different choices in this context: for example, a young, able-bodied person with constraints on her time budget may embrace the opportunity to transfer in return for faster movement, while an elderly or disabled person with an ample travel time budget may prefer the transfer-free connection even if it results in a longer trip. In our model, we have opted for a compromise: Wherever a pair of nodes is connected by a single edge (transfer-free trip) this option has been included regardless of the cumulative impediment value. Wherever a pair of nodes is connected by a minimum of two edges, the path with the lowest cumulative impediment value has been chosen, regardless of the number of transfers required.
Map 5, 6: Degree centrality indexes for nodes in the existing (2006) and proposed (2020) public transport networks in Melbourne’s north-east
CDi = ∑aij/(N-1) [2]
where:
CDi = Degree centrality of node i aij = transfer-free link between nodes i and j, with j∈N and i≠j N = all nodes in the network
8

The average degree centrality (percentage of nodes within the network that can be reached without a transfer) for all nodes in the 2006 network is 23%. In the 2020 network, this figure reaches 25%. While this difference appears unspectacular, the absolute figures behind these percentages highlight that the number of nodes grows from 38 (of which 12 meet the standard for legible transfer points) to 60 (of which 54 are legibile transfer points) from the 2006 to the 2020 network. The average degree centrality, again measured in absolute values, grows from 9.8 transfer-free edges per node to 18.4. Thus this index, in capturing the impact of network reconfiguration, needs to be plotted against a common benchmark to be meaningful.
To facilitate such comparison, an efficiency index has been used and displayed in Map 7. The global efficiency of the network, as explained above, can be measured by adding inverse impediment values for each nodal relation, and extracting the ratio of the results before and after a package of alterations to infrastructure and service levels. Map 7 attempts a direct comparison between the absolute efficiency counts for each network and displays by what factor the efficiency specific to each node increases or decreases through the transformation of the 2006 network into the 2020 network. Using this technique, global efficiency increases three-fold, remarkably similar in magnitude to the projected increase in system ridership and required expansion of system capacity. Local efficiency increases for practically every node, with the sole exception probably due to an ‘edge effect’ (see below).
Map 7: Factors of local efficiency gain for nodes in the 2020 network over the 2006 network. Circles without figures depict nodes that do not appear in the 2006 network.
ΔCEi = ∑(1/Lij,2020)/ ∑(1/Lij,2006) [3]
where:
CEi = Global efficiency centrality of node i Lij = cumulative impediment between nodes i and j, with j∈N20 and i≠j N20 = all nodes in the 2020 network
9
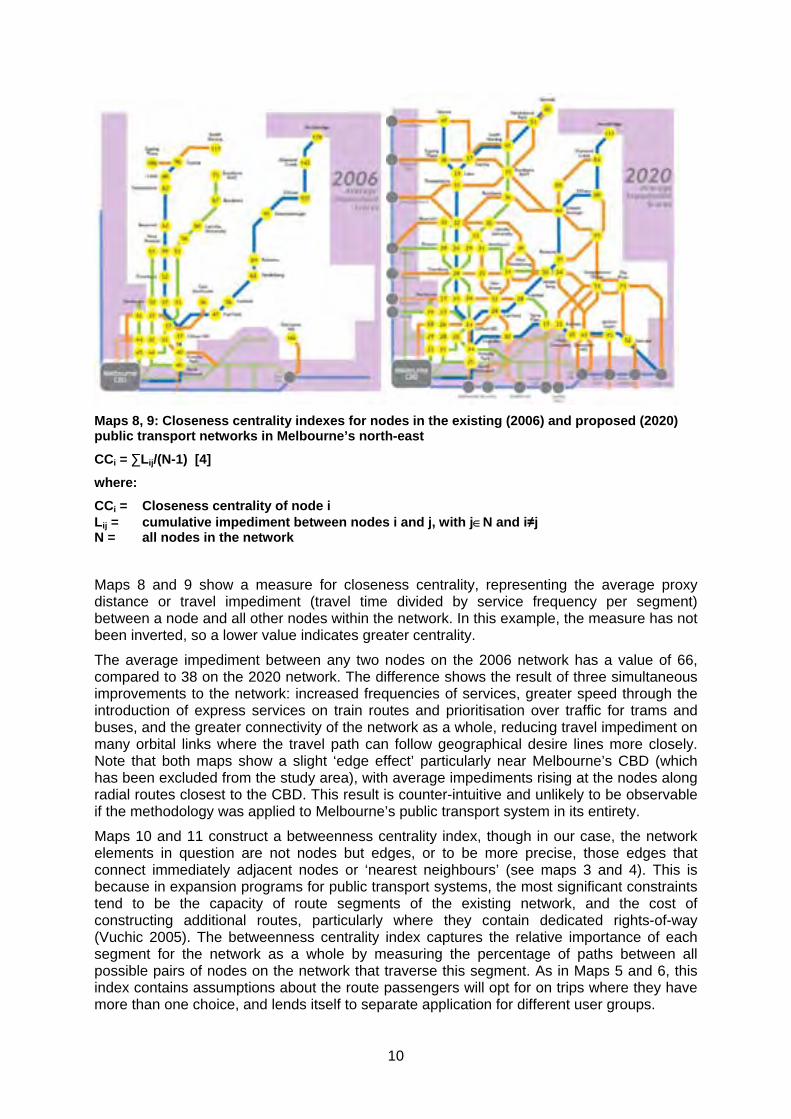
Maps 8, 9: Closeness centrality indexes for nodes in the existing (2006) and proposed (2020) public transport networks in Melbourne’s north-east
CCi = ∑Lij/(N-1) [4]
where:
CCi = Closeness centrality of node i Lij = cumulative impediment between nodes i and j, with j∈N and i≠j N = all nodes in the network
Maps 8 and 9 show a measure for closeness centrality, representing the average proxy distance or travel impediment (travel time divided by service frequency per segment) between a node and all other nodes within the network. In this example, the measure has not been inverted, so a lower value indicates greater centrality.
The average impediment between any two nodes on the 2006 network has a value of 66, compared to 38 on the 2020 network. The difference shows the result of three simultaneous improvements to the network: increased frequencies of services, greater speed through the introduction of express services on train routes and prioritisation over traffic for trams and buses, and the greater connectivity of the network as a whole, reducing travel impediment on many orbital links where the travel path can follow geographical desire lines more closely. Note that both maps show a slight ‘edge effect’ particularly near Melbourne’s CBD (which has been excluded from the study area), with average impediments rising at the nodes along radial routes closest to the CBD. This result is counter-intuitive and unlikely to be observable if the methodology was applied to Melbourne’s public transport system in its entirety.
Maps 10 and 11 construct a betweenness centrality index, though in our case, the network elements in question are not nodes but edges, or to be more precise, those edges that connect immediately adjacent nodes or ‘nearest neighbours’ (see maps 3 and 4). This is because in expansion programs for public transport systems, the most significant constraints tend to be the capacity of route segments of the existing network, and the cost of constructing additional routes, particularly where they contain dedicated rights-of-way (Vuchic 2005). The betweenness centrality index captures the relative importance of each segment for the network as a whole by measuring the percentage of paths between all possible pairs of nodes on the network that traverse this segment. As in Maps 5 and 6, this index contains assumptions about the route passengers will opt for on trips where they have more than one choice, and lends itself to separate application for different user groups.
10

Maps 10, 11: Betweenness centrality indexes for the existing (2006) and proposed public (2020) transport networks in Melbourne’s north-east, showing the percentage of all node-to-node paths fully within the network passing through the route segment in question.
CBk = ∑Pij(k)/(N-1)(N-2) [5]
where:
CBk = Betweenness centrality for route segment k Pij(k) = paths between nodes i and j that pass through segment k, for all i,j∈N and i≠j N = all nodes in the network
In this assessment, the betweenness values of edges crossing the boundaries of the study area have not been displayed (as these edges are defined not to attract paths between two nodes within the study area and thus only generate paths to or from themselves, at a constant percentage value inverse to the total number of nodes). This index shows clearly how a more complex and interconnected network is capable of diffusing some travel demand away from its trunk routes and thus of achieving more geographically balanced passenger flows with fewer squeeze points for capacity. In the 2020 network, the betweenness scores for radial train and tram routes vary little inward of Thomastown, Latrobe University, Rosanna and Bulleen, while in the 2006 network, there is a continuous crescendo all the way to Clifton Hill. A related insight from this index is the significance of the three proposed orbital tram routes (Carlton to Kew Junction, Brunswick to Clifton Hill and Coburg to Heidelberg), and the orbital bus route from Doncaster via Greensborough to Epping, for the congruence of the network, indicating a strong potential for these routes to create new connections and thus access new markets for public transport. Conversely, the bus routes proposed north of Epping and the link between Thomastown, Bundoora RMIT and Hawkstowe Park have a weaker than expected position in the network as a whole. Finally, the 2006 figures assign an extraordinary role for a relatively short segment between Clifton Hill train station and a nearby tram and bus interchange at Queens Parade. Shown on the map as a bus link, in practice this distance would likely be walked by most transferring passengers; however, the pedestrian amenity between these locations is currently so poor that it can safely be assumed that not many passengers will actually make a transfer there. Thus the role of Clifton Hill for network connectivity, even in the 2006 network, may well be significantly underutilised. In the study that informed these indicators, this circumstance has prompted a proposal for consolidating the two interchanges in one location (Scheurer et al 2006).
These three findings also help to illustrate the limitations of the betweenness centrality index as it stands now, and highlights opportunities for further refinement. In particular, the
11
treatment of each path between a pair of nodes on the network as equal disregards the varying potential of passenger flows between nodes, a weakness of tools for spatial accessibility analysis discussed in detail by Baradaran and Ramjerdi (2001). Some nodes have a greater number of residents, and/or a greater number or broader range of destinations than others, which obviously influences their propensity to generate trips. Further, it can be expected that passenger flows between any two nodes decline with growing distance, or impediment, of the trip: most people will not travel to a grocery store, or a hairdresser, or a childcare centre that requires significantly more time and effort to get to than a more accessible alternative. Hence, a more accurate betweenness centrality index would attempt to include a weighting factor for paths, for example by introducing correlations to the catchment size of the nodes in question, and to the travel time/service frequency (impediment score) of the journey between them.
The final index presented here is a more free-wheeling exercise, derived from a street connectivity indicator developed for an urban design-based context analysis of local areas (ISTP et al 2007). Connectivity is a measure for the permeability of a movement system, ie. the ease at which a user can penetrate the area serviced by the network, and the extent to which choices of routes exist for a given trip relation (see Bentley et al 1985). This indicator allocates a value to each point on the network that is equivalent to the number of connections into adjacent nodes (nearest neighbours), minus two. Thus a four-way intersection has a value of two, an intermediate point along a street has a value of zero, and a dead-end (cul-de-sac) has a negative value of one. For this index, we will depart from our earlier definition of each transfer-free connection between any two nodes as a separate edge and only consider the physical links emanating from each node (rail tracks, tram tracks or roads carrying a bus line). The resulting connectivity value has been multiplied by the number of departures per hour on each mode, and a mode-specific coefficient derived from the ratio of seat capacity per vehicle and average load factor as identified in Kenworthy and Laube (2001). In the Melbourne case, this coefficient is 1 for rail, 0.3 for tram and 0.1 for bus (meaning that a tram in Melbourne carries on average three times, and a train ten times the number of passengers a bus does). This weighting key for trains, trams and buses has been incorporated into the calculation to reflect the hierarchy of the different modes within the public transport system, both in terms of their effective capacity to convey passengers, and in terms of their perception by users. Obviously, the ratios chosen are specific to the conditions within the public transport network under consideration, and would be expected to vary between cities with different vehicle fleets and flows of travel demand, as well as over time, as vehicles are renewed and the role of each mode within the system changes.
Map 12 and 13 display these connectivity scores for each node, and further highlight the higher-order activity centres from the metropolitan strategy (DOI 2002). According to this model, the average nodal connectivity score in the existing network (2006) is 11.3, based on a total of 19 network nodes (with a cumulative score of 226). In the proposed network (2020), the average score climbs to 35.5 and is based on a total of 57 network nodes (with a cumulative score of 2,024). If the index is reliable, then, we can point to an extraordinary synergy effect from the proposed network extensions: in return for an approximate growth in the level of vehicle-km across the three modes by a factor of two to three, and the construction of 42 km of additional rail routes with 13 new stations as well as 33 km of additional tram routes, a nine-fold increase in network connectivity is achieved.
12

Maps 12, 13: Nodal connectivity indexes for the existing (2006) and proposed (2020) public transport networks in Melbourne’s north-east, showing the location of activity centres as identified in the metropolitan strategy (red circles – principal and major activity centres, blue circles – specialised activity centres (university and hospital campuses), yellow circles – growth area activity centres)
CVi = (∑(aij-2))*(fr(i)+0.3ft(i)+0.1fb(i)) [6]
where:
CVi = Connectivity index for node i aij = links converging in node i, with j∈N(i) and i≠j N(i) = nodes adjacent (nearest neighbours) to node i fr(i) = number of rail departures per hour per direction from node i ft(i) = number of tram departures per hour per direction from node i fb(i) = number of bus departures per hour per direction from node i
This efficiency, however, is to some extent the result of a network structure that does not always conform to the hierarchy of activity centres, that is to say, the public transport nodes with the highest scores are not necessarily located in the most important suburban centres. In some cases, this is a result of pragmatism: for instance, the insertion of transfer nodes with multi-modal co-location can be achieved with a much lower outlay of resources in Thornbury and Clifton Hill than in one of the activity centres elsewhere along the same corridor and is therefore more likely to occur. In other cases, the figures highlight the untapped potential of activity centres as network nodes. For example, the activity centre of Reservoir does not currently feature as a major public transport interchange in State Government plans to improve orbital links and bus services in the study area (State of Victoria 2006), even though it appears to be geographically well-placed to fulfil such a function from this assessment. Lastly, the identification of suburban activity centres within the metropolitan strategy is not necessarily unambiguous and has been criticised for a certain degree of arbitrariness (Mees 2003). For example, the centres of Northland and The Pines consist of little more than conventional ‘big-box’ shopping centres. Their potential for urban consolidation in the spirit of the metropolitan strategy, encompassing higher-density residential development, a greater range of business and social activities and reduced dependence on the car for access, may be limited in comparison to activity centres where a broader spectrum of town centre uses, and a more pedestrian- and public transport-oriented urban environment are already present. Thus the assessment of public transport network connectivity in activity centres can also assist in steering the process of consolidation in
13
these centres, accepting that different types of activity centres require different consolidation policies, with different outcomes and future roles for public transport access.
Public transport before and after the Perth-to-Mandurah railway The Melbourne case study was deliberately devised by the local governments involved and their lobby group, the Metropolitan Transport Forum (MTF), to present a medium-term vision to the public debate that contrasts in terms of pace and extent of public transport reform and network development with the more modest program pursued by State Government (State of Victoria 2006). In Perth, where a reconfiguration of the public transport system of similar magnitude to that advocated for Melbourne by the MTF and other groups is currently under way, an opportunity exists to apply the spatial network analysis tool to a real before-and-after scenario connected to the opening of the Perth to Mandurah railway in late 2007.
The 72-km Perth to Mandurah railway represents the largest item of public transport infrastructure investment ever undertaken by State Government in Western Australia, with a total investment of some $ 1.6bn. There is no direct private sector funding and, owing to the Australian Commonwealth Government’s reluctance to invest in urban public transport projects, no federal funding either. The route serves an urban growth corridor roughly following the coast to the south of Perth, and with only 10 stations in the first stage (further intermediate stations are proposed to be added later), is designed to achieve high commercial speeds of up to 90 km/h, competitive with car travel along an existing freeway parallel to the rail line. Due to these parameters and an early decision to save costs (travel time and infrastructure) by not routing the rail line through some key established activity centres along the corridor (such as the town centres of Rockingham and Mandurah), the route depends heavily on well-functioning integration of connecting bus routes. Nine of the ten new stations will incorporate purpose-designed bus and train interchanges, and the bus network across the entire southern half of the metropolitan area will be comprehensively reconfigured to optimise coordination and connectivity between the two modes. It should be mentioned that this planning effort is greatly facilitated by the mandate of Perth’s public transport regulator Transperth, a government authority charged with service and infrastructure development in the public interest. Perth’s metropolitan rail system is owned and operated by a government agency, while metropolitan bus operations are subcontracted to the private sector according to precise service specifications from Transperth. Institutional arrangements of this kind are in line with international best practice and have been promoted as a blueprint for reform in Melbourne’s public transport when the current private-sector rail and tram franchises expire in 2008 (Mees et al 2006, Bergmaier 2006).
The network upgrades related to the opening of the Perth to Mandurah railway present the authors with an opportunity to test the Spatial Network Analysis model across an entire metropolitan area, rather than just a segment as in the Melbourne example, and thus assess the impact of network improvements in one corridor on the performance of network elements elsewhere in the city. It has also been possible to acquire more detailed land use and employment data for the Perth metropolitan region than in the case of Melbourne, enabling a closer correlation of public transport network structure and performance with the activity density and profile of the nodal catchment areas.
The following presentation of the Perth data still represents a work in progress, since not all details of the public transport network after the rail opening had been finalised by Transperth at the time this paper was submitted. It is anticipated that further comparative elements of the assessment will be presented at the ATRF conference in September.
Map 14 shows the 2007 public transport network in metropolitan Perth, before opening of the Perth to Mandurah railway. The service frequencies and travel times implied in the impediment values relate to the weekday interpeak period. All rail routes are operated at a frequency of at least four services per hour (15-minute headways), while bus routes have been differentiated into routes at or above the rail standards (four or more services per hour), and routes below this standard (two to three services per hour). Bus routes with fewer than
14

two services per hour are not included in the map, except where several of them form a trunk route that meets the minimum standard.
Map 15 displays the degree centrality of the 126 nodes in the network, similar to Maps 5 and 6 in the Melbourne example. Map 16 shows the closeness centrality of each network node. As in the Melbourne example (Maps 8, 9), the cumulative impediment counts for each nodal relation have not been reversed, hence lower values indicate greater centrality. Map 17 illustrates the betweenness centrality as in Maps 10 and 11 in the Melbourne example, for each route segment between adjacent nodes. Map 18 shows the nodal connectivity index (refer to Maps 12 and 13 for an explanation of the methodology), with the transit-oriented activity centres and corridors of the Network City strategy highlighted. For the weighting of modes, it has been assumed that a train carries an average of five times the number of passengers as a bus (see Kenworthy and Laube 2001).
15

Map 14: Public transport in Perth before opening of the Perth to Mandurah railway, with modes, service levels and impediment values per route segment.
dij = 8tij/fij [1]
where:
dij = impediment value of route segment between nodes i and j (average of both directions) tij = travel time between nodes i and j in minutes (average of both directions) fij = service frequency in departures per hour per direction between nodes i and j
16
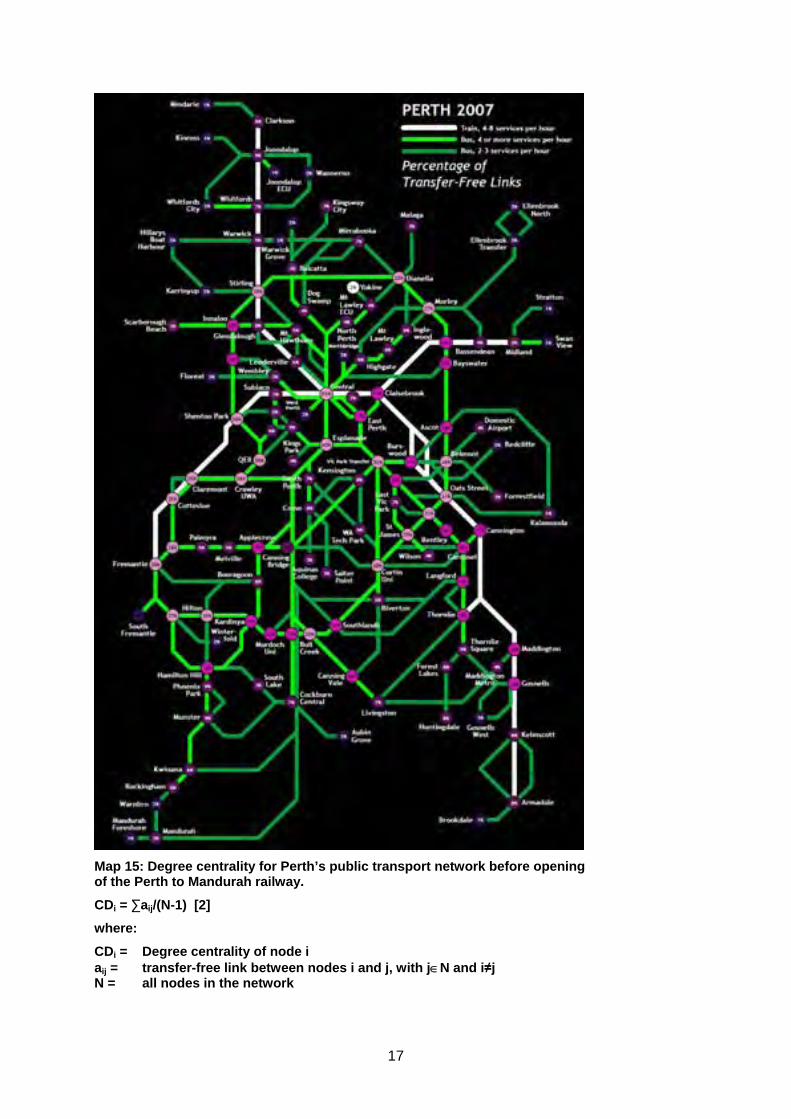
Map 15: Degree centrality for Perth’s public transport network before opening of the Perth to Mandurah railway.
CDi = ∑aij/(N-1) [2]
where:
CDi = Degree centrality of node i aij = transfer-free link between nodes i and j, with j∈N and i≠j N = all nodes in the network
17
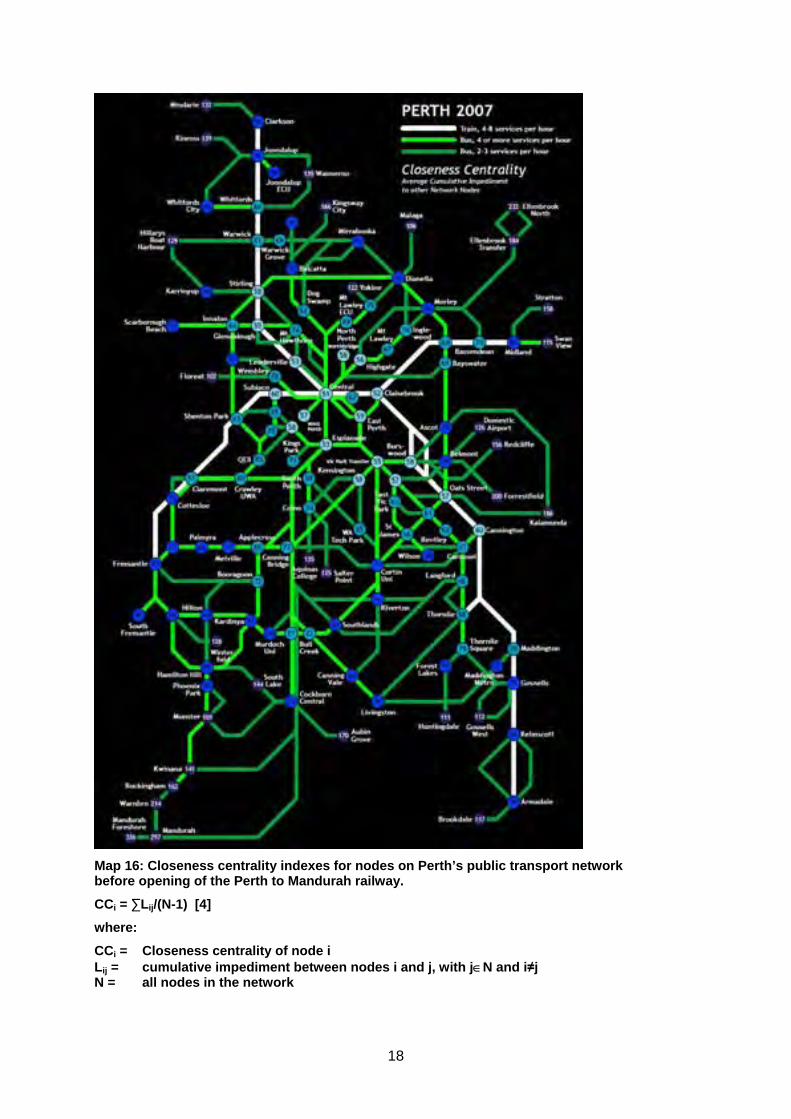
Map 16: Closeness centrality indexes for nodes on Perth’s public transport network before opening of the Perth to Mandurah railway.
CCi = ∑Lij/(N-1) [4]
where:
CCi = Closeness centrality of node i Lij = cumulative impediment between nodes i and j, with j∈N and i≠j N = all nodes in the network
18
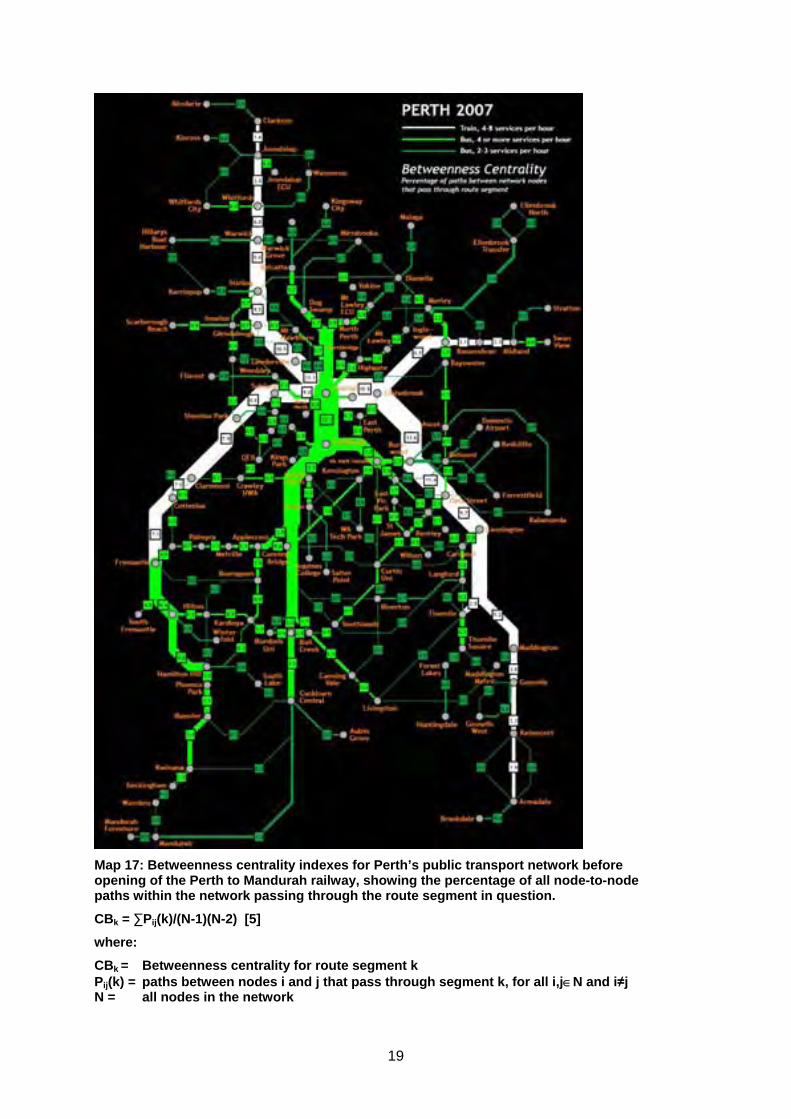
Map 17: Betweenness centrality indexes for Perth’s public transport network before opening of the Perth to Mandurah railway, showing the percentage of all node-to-node paths within the network passing through the route segment in question.
CBk = ∑Pij(k)/(N-1)(N-2) [5]
where:
CBk = Betweenness centrality for route segment k Pij(k) = paths between nodes i and j that pass through segment k, for all i,j∈N and i≠j N = all nodes in the network
19
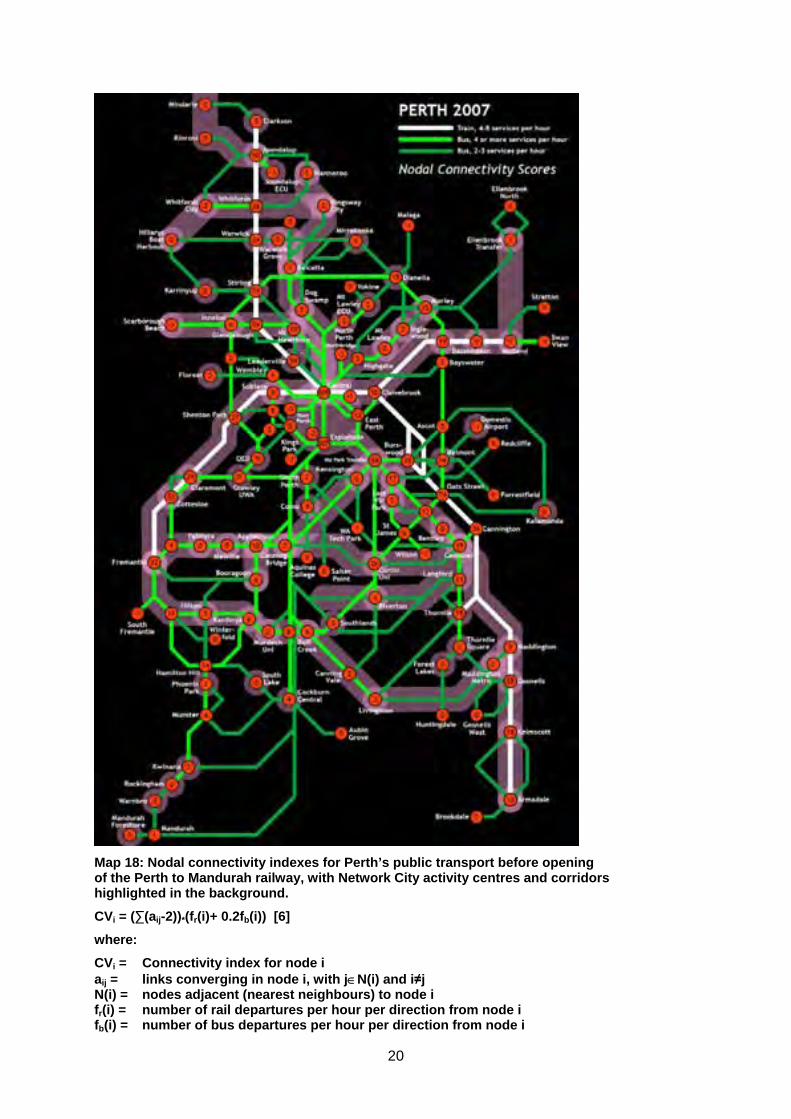
Map 18: Nodal connectivity indexes for Perth’s public transport before opening of the Perth to Mandurah railway, with Network City activity centres and corridors highlighted in the background.
CVi = (∑(aij-2))*(fr(i)+ 0.2fb(i)) [6]
where:
CVi = Connectivity index for node i aij = links converging in node i, with j∈N(i) and i≠j N(i) = nodes adjacent (nearest neighbours) to node i fr(i) = number of rail departures per hour per direction from node i fb(i) = number of bus departures per hour per direction from node i
20
Conclusions and further applications This paper has assessed the applicability of centrality and connectivity indexes developed for the analysis of urban street systems, to public transport networks. By testing a framework of Multiple Centrality Assessment developed by Porta, Crucitti and Latora (2006b) on proposals for network expansion in several public transport corridors in suburban Melbourne, it was found that these indexes can be employed in meaningful ways to inform policy choices about public transport network design, infrastructure investment and service improvements, as well as the integration of public transport routes and stations with the urban environment, particularly activity centres and corridors. This integration of public transport and land use has received widespread attention in recent years with the promotion of transit-oriented development. This is true for car-oriented cities investing in new or upgraded public transport systems and seeking to diversify travel patterns away from the car (Bernick and Cervero 1997, Dittmar and Ohland 2004), as well as for cities with strong public transport attempting to better coordinate the role of network nodes and locations of activities (Bertolini 2005).
The application of the model in a Perth context is designed to test the comprehensive adaptations to the integrated rail and bus network in the Western Australian capital following the opening of the Perth to Mandurah railway in late 2007. The relative accessibility of activity centres and network nodes can be determined by conducting a Multiple Centrality Assessment and used to inform decisions about both public transport network configuration, and about land use intensification in the catchment areas of nodes and corridors that gain in accessibility. This tool is well-suited to inform local area planning to add detail to the strategic directions spelled out in the Network City strategy, and to identify gaps in public transport service that need to be addressed to achieve the congruence of movement and land use the document aspires to. It is also well-suited to inform priorities for the future expansion of public transport infrastructure in the Perth metropolitan region.
References Baradaran S, Ramjerdi F (2001) Performance of Accessibility Measures in Europe. Journal of Transportation and Statistics, September/December 2001
Bentley I, Alcock A, Murrain P, McGlynn S, Smith G (1985) Responsive Environments: A Manual for Designers. Architectural Press, Oxford, UK
Bergmaier R (2006) Optimal Institutional Arrangements for Melbourne’s Public Transport. Metropolitan Transport Forum (MTF), Melbourne (VIC)
Bernick M, Cervero R (1997) Transit Villages in the 21st Century. McGraw Hill, New York (NY), USA
Bertolini L (2005) Cities and Transport: Exploring the Need for New Planning Approaches. Chapter 5 in Albrechts L, Mandelbaum S J (2005) The Network Society. A New Context for Planning. Routledge, Oxford, UK
Cervero R (1998) The Transit Metropolis. A Global Inquiry. Island Press, Washington (DC), USA
Commissioner for Environmental Sustainability (CES, 2007) Creating a City that Works. Opportunities and Solutions for a More Sustainable Melbourne. Melbourne (VIC), May
Crucitti P, Latora V, Porta S (2006) Centrality in Networks of Urban Streets. Chaos, Vol 16
Curtis C, James B (2004) An Institutional Model for Land Use and Transport Integration. Urban Policy and Research, Vol 22, No 3
Department of Infrastructure (DOI-VIC, 2002) Melbourne 2030. Planning for Sustainable Growth. Melbourne (VIC)
Dittmar H, Ohland G (2004) The New Transit Town. Best Practices in Transit-Oriented Development. Island Press, Washington (DC), USA
21

Gleeson B, Curtis C, Low N (2003) Barriers to Sustainable Transport in Australia. In Low N, Gleeson B (2003) Making Urban Transport Sustainable. Palgrave Macmillan, Basingstoke, UK
Hiller B, Hanson J (1984) The Social Logic of Space. Cambridge University Press, Cambridge, UK
Hillier B (1996) Space is the Machine: A Configurational Theory of Architecture. Cambridge University Press, Cambridge, UK
Institute for Sustainability and Technology Policy (ISTP), Department for Planning and Infrastructure (DPI, WA, 2007) Sustainable Urban Design – Practical Fieldwork Project. Murdoch University, Perth (WA)
Kenworthy J, Laube F (2001) The Millennium Cities Database for Sustainable Transport. International Association of Public Transport (UTIP), Bruxelles, Belgium and Institute for Sustainability and Technology Policy (ISTP), Perth (WA)
Latora V, Marchiori M (2002) Is the Boston Subway a Small-World Network? Physica A, Vol 314, No 1-4
Laube F (1998) Optimising Urban Passenger Transport. PhD Thesis, Murdoch University, Perth (WA)
Mees P (2000) A Very Public Solution. Transport in the Dispersed City. Melbourne University Press, Melbourne (VIC)
Mees P (2003) Paterson’s Curse: The Attempt to Revive Metropolitan Planning in Melbourne. Urban Policy and Research, Vol 21, No 3
Mees P (2005) Privatisation of Rail and Tram Services in Melbourne: What Went Wrong? Transport Reviews, Vol 25, No 4
Mees P, Moriarty P, Stone J, Buxton M (2006) Putting the Public Interest Back into Public Transport. A Report to the Victorian Community, Melbourne (VIC), April
Newman P, Kenworthy J (1999) Sustainability and Cities. Overcoming Automobile Dependence. Island Press, Washington (DC), USA
Newman P (2005) Transit-Oriented Development: An Australian Overview. Transit Oriented Development – Making it Happen, Fremantle (WA), 5-8 July
Porta S, Crucitti P, Latora V (2006a) The Network Analysis of Urban Streets: A Dual Approach. Physica A, Statistical Mechanics and its Applications, Vol 369, No 2
Porta S, Crucitti P, Latora V (2006b) The Network Analysis of Urban Streets: A Primal Approach. Environment and Planning B: Planning and Design, Vol 33
Scheurer J, Kenworthy J, Newman P (2005) Most Liveable and Best Connected. The Economic Benefits of Investing in Public Transport in Melbourne. Metropolitan Transport Forum (MTF), Melbourne (VIC)
Scheurer J, Porta S (2006) Centrality and Connectivity in Public Transport Networks and their Significance for Transport Sustainability in Cities. World Planning Schools Congress, Mexico (DF), 13-16 July
Scheurer J, Bergmaier R, McPherson J (2006) Keeping People Moving in Melbourne’s North-East. Metropolitan Transport Forum (MTF), Melbourne (VIC)
State of Victoria (2006) Meeting our Transport Challenges: Connecting Victorian Communities. Melbourne (VIC)
Vuchic V R (2005) Urban Transit: Operation, Planning and Economics. Wiley, Hoboken (NJ), USA
22

Western Australian Planning Commission (WAPC, 2004) Network City. A Community Planning Strategy for Perth and Peel. Perth (WA)
Software Applications The following software applications were used for the calculations, maps and illustrations in this paper:
Microsoft Excel 2003 MapInfo Professional 8.5 Adobe Illustrator CS2 12.0
23