spatial frank criteria data' - heart
TRANSCRIPT
British Heart Journal, 1977, 39, 126-138
Spatial Frank vectorcardiogram in leftposterior fascicular blockCriteria and correlation with clinical andelectrocardiographic data'CHRISTIAN R. BROHET,2 AND PIERRE ARNAUD
From the 'Research Group on the electrical activity of the heart', Institut National de la Santeet de la Recherche Medicale, U.121, Hopital Cardio-vasculaire, Lyons, France
Computer processing of spatial QRS parameters (Frank vectorcardiogram) was used to study left posteriorfascicular block. The best set of vectorcardiographic criteria was sought in order to characterise the classicpattern of left posterior fascicular block.
Using these criteria, 18 cases were selected from a group of 4600 patients and 340 healthy subjects;isolated left posterior fascicular block was seen in 10 cases, and was associated with right bundle-branch blockin 8 cases.
It is shown that some external factors can influence the aspect of the spatial QRS loop in left posteriorfascicular block: cardiomegaly tends to produce a superior displacement of the main QRS forces: rightbundle-branch block enhances the superior displacement of the initial forces and shifts the main QRS forcesmore anteriorly and to the right. The 'masquerading effect' of the left posterior fascicular block on a con-comitant inferior myocardial infarct was also shown.
The most important diagnostic feature was the opposite direction of the initialforces (left anterosuperior)and the maximal vector (right postero-inferior) : the angle between these two vectors averaged 152°. Othercriteria, such as the direction of rotation or the axis of the frontal loop, the vertical direction of the spatialloop, the presence of a Q wave in leads II, III, and aVF of the electrocardiogram, are not mandatory for thediagnosis of left posteriorfascicular block.
After the preliminary report of Pryor and Blount(1966), the concept of left fascicular block wasintroduced by Rosenbaum et al. (1968). Manypapers have been published on left anterior fasci-cular block but left posterior fascicular block hasbeen less extensively studied. The latter is muchrarer and the sensitivity and specificity of theelectrocardiographic criteria of left posterior fasci-cular block are still uncertain. For instance,rightward deviation of the mean QRS axis, generallyconsidered as a major criterion, is present inother conditions such as right ventricular overloador with a distinctly vertical position of the heart;also, criteria based on the configuration of the
Received for publication 10 June 1976'Part of this study has been presented at the 7th European Congressof Cardiology (Amsterdam, June 1976).'Current address: Cardio-Pulmonary Laboratory, Cliniques Uni-versitaires St. Pierre, Brusselsestraat, 69, B 3000 Leuven, Belgium.
initial segment of the QRS lose their validity inthe presence of myocardial infarction as this alsoaffects the early part of the QRS complex.
Consequently, there is no consensus about theelectrocardiographic criteria of left posterior fasci-cular block: rightward shift of the mean QRS axisbeyond + 900 is not required by some authors(Medrano et al., 1972), and leftward orientationof the initial part of the QRS is not mandatoryaccording to others (Fernandez et al., 1972).Indeed, the actual presence of left posteriorfascicular block in some reported cases can bequestioned.
In this study, a specific methodology has beenused in order to avoid the problems resulting fromnon-validated electrocardiographic criteria for thediagnosis of left posterior fascicular block. Thecases of left posterior fascicular block were selectedaccording to several vectorcardiographic criteria
126
on January 16, 2022 by guest. Protected by copyright.
http://heart.bmj.com
/B
r Heart J: first published as 10.1136/hrt.39.2.126 on 1 F
ebruary 1977. Dow
nloaded from
Computer study of VCG in left posterior fascicular block
and a quantitative analysis of the spatial QRSloop was performed; the results of the analysis havebeen compared with published data.
Subjects and methods
RECORDING TECHNIQUEIn addition to the conventional 12 lead electro-cardiogram the vectorcardiograms were recordedusing the corrected orthogonal lead system ofFrank. The patients were lying in a semirecumbentposition, with the thorax at 450 from the horizontallevel; the 4th intercostal space was used. The threeplanar vectorcardiographic loops were directlyinscribed on paper by means of a digital system,with a sampling rate of 500 per second (Arnaudet al., 1968). Each patient had a second recordingwhich provided the onset of the QRS with an
increased magnification and a sampling rate of1000 per second. The scalar components X, Y,and Z were simultaneously recorded on an Elema-Schonander electrocardiograph, at a speed of100 mm/s.
COMPUTER PROCESSING
For each recording, a QRS-T complex was pro-cessed by a PDP/8 computer.'The programme 'EXPV', developed in this
laboratory, computes 180 vectorcardiographic mea-
surements (Rubel et al., 1975). The spatial QRSloop is characterised in reference to the 8 octantsof the tridimensional space, and for each octantthe following parameters are computed: the area
developed by this segment of curve (absolutearea and relative area, that is its percentage of thetotal QRS area); the duration in this octant (abso-lute and relative duration); and the maximaloctantal vector: in terms of its magnitude (absoluteand relative value), its orientation, and its time ofoccurrence from the onset of QRS. Among theother measurements, the more important are: themaximal spatial and the half-area spatial QRSvectors, their magnitude, orientation, and time ofoccurrence; the QRS duration and the half-timeQRS vector; and the direction of rotation of theplanar QRS loops. Thereafter, three different curvesare derived as a function of time (sampling at 500per second): the curve of the amplitude of thespatial instantaneous vectors, the curve of the linearvelocity of the spatial QRS loop, and the curve ofthe elementary areas.
The reference frame for angular values is asfollows: the azimuth angle, that is the angle
I Digital Equipment Corporation.
between the projection of a vector on the horizontalplane and the transverse X axis is measured from0 to 360° in a clockwise direction starting from theleft extremity of the X lead. The elevation angle,that is the angle drawn by the spatial vector withthe horizontal plane-is measured from 0 to ±+900below the horizontal plane and from 00 to -90°above this plane (negative value=-superior direc-tion). The 'initial QRS segment' is defined as thevector located at the point having the maximalsuperior altitude, that is at the highest value ofthe vertical Y component in its initial deflection.
POPULATIONS STUDIED(1) A series of 4600 consecutive patients withvarious heart diseases drawn from the wards ofthe Cardiovascular Hospital of Lyons.(2) A group of 340 healthy active subjects.We excluded from this study cases presenting:
(1) right ventricular hypertrophy or overload,suggested by clinical and/or haemodynamic data;(2) chronic obstructive pulmonary disease; (3) avertical heart on chest x-ray examination.
Furthermore, we excluded all the cases wherethe diagnosis of left posterior fascicular block couldnot be found for one of the following reasons: (1)QRS duration less than 90 ms; (2) absence ofaccurate diagnostic information; (3) presence ofcomplete or incomplete left bundle-branch block;(4) presence of a pre-excitation syndrome; (5)anterior, anteroseptal, or anterolateral wall myo-cardial infarction (which could cause loss ofinitial anterior forces), or true posterior wallmyocardial infarction (because of its peculiar effecton the horizontal QRS loop). Cases of inferior wallmyocardial infarction were retained.
PRELIMINARY SELECTION OFVECTORCARD IOGRAMSA preliminary selection was made on the basis ofthe following provisional vectorcardiographic cri-teria, derived from the accepted definition ofleft posterior fascicular block (Castellanos andLemberg, 1971; Polu et al., 1972; Pryor, 1972;Varriale and Kennedy, 1972; Chou et al., 1974;Nicolai et al., 1974): (a) initial QRS segmentoriented to the left, anteriorly (left anterior quad-rant ofhorizontal plane), and superiorly (left superiorquadrant of frontal plane), or sometimes hori-zontally and to the left in the frontal plane, and(b) maximal QRS vector oriented to the right, orQRS area greater in the right than in the left halfof the electrical field, or mean QRS axis of theelectrocardiogram equal to or superior to + 900.
127
on January 16, 2022 by guest. Protected by copyright.
http://heart.bmj.com
/B
r Heart J: first published as 10.1136/hrt.39.2.126 on 1 F
ebruary 1977. Dow
nloaded from

Brohet and Arnaud
DEFINITION OF NEW SERIES OFVECTORCARDIOGRAPHIC CRITERIA OF LEFTPOSTERIOR FASCICULAR BLOCKA detailed computer analysis of the various vector-cardiographic measurements was then performedin the cases selected on the basis of these provi-sional criteria. The results of this analysis com-bined with additional information collected fromelectrocardiographic, clinical, and radiological dataallowed us to define the following criteria for theelectrocardiographic-vectorcardiographic diagnosisof left posterior fascicular block.
Criterion AThe initial deflection of the QRS loop on thevectorcardiogram must be oriented anteriorly,superiorly, and to the left. In the frontal plane, astraight horizontal direction of the early vectors(null value of the elevation angle of the 'firstsegment vector') is acceptable, provided that boththe maximal and the half-area QRS vectors arelocated in the right half of the electrical field.
Criterion BBoth the maximal and the half area QRS vectorsmust be oriented to the right, that is located in theright half of the horizontal and frontal planes. Thehalf area vector could be differently oriented,provided that the mean QRS axis of the electro-cardiogram was equal to or superior to + 90°.
CRITERIA OF AN ASSOCIATED COMPLETERIGHT BUNDLE-BRANCH BLOCKFor the diagnosis of a complete right bundle-branch block, all the following criteria must besatisfied: (1) QRS duration >115 ms in the adult(94 ms in a 7-year-old child-case 12, see below),(2) delay of the inscription of the late QRS vectors,visualised in all three planes, and (3) presence of aplateau, with or without oscillations, on the latepart (beyond 85 ms) of the linear velocity curve ofthe spatial QRS loop.'
DESCRIPTION OF CASES SELECTEDFrom the hospital population of 4600 patients, 18cases with evidence of left posterior fascicularblock (0.39%) were selected on the basis of thesecriteria. No cases were found in the group of 340normal subjects. The 18 records were furtherdivided into 2 groups: group A (10 cases) withisolated left posterior fascicular block (cases 1 to10); group B (8 cases) with left posterior fascicularblock + complete right bundle-branch block (cases11 to 18)."In normal individuals, the terminal part of this curve is lessdelayed and always decreases steeply.
There were 15 male and 3 female patients whoseages varied from 7 to 91 years. As seen in the studyof Lopes et al. (1974), the mean age was lower ingroup A (41.8) than in group B (52.9). The clinicaland pathological findings, and the electrocardio-graphic diagnoses are listed in Tables 1 and 2.Fig. 1A and B present the vectorcardiographicand electrocardiographic features of a 35-year-oldpatient (case 6) and show the typical orientation ofthe initial segment vector and the distinct rightdisplacement of the main QRS forces.
Results
The results of the vectorcardiographic and electro-cardiographic analyses are presented in Table 3(group A, isolated left posterior fascicular block;and group B, left posterior fascicular block + com-plete right bundle-branch block).
The initial segment vector of the spatial QRS loophad an azimuth angle (AZ) varying from 0 to 90°.The mean value was higher in group A than ingroup B: 57.10, as opposed to 38.90.The elevation angle varied from 00 (straight
horizontal orientation in the frontal plane) to-770 (superior orientation). The mean value waslower in group A (-17.1') than in group B (-33 5°).The angle between the initial segment vector
and the maximal QRS vector varied from 750 to176° (mean= 152.90 in group A and 151-9' ingroup B).
The maximal vector located in the left antero-superior octant, in the early part of the spatial QRSloop, had a relative magnitude (RM) varying from6 to 70 per cent of the maximal spatial QRSmagnitude. The mean value was 24-3 per cent ingroup A and 29-5 per cent in group B.
The relative area (RA), that is the area drawn bythe initial segment of the spatial QRS loop in theleft anterosuperior octant as compared with thetotal QRS loop area, averaged 3 8 per cent ingroup A and 3*5 per cent in group B. The valuewas less than 1 per cent in 4 cases.The QRS loop remained in this left antero-
superior octant during a period (absolute duration)varying from 10 to 52 ms (mean 20-6 ms in groupA and 23-4 ms in group B). This represented 6 to47 per cent of the total QRS loop duration (relativeduration; mean=20 80/ in group A and 16-6% ingroup B).
The orientation of the maximal QRS vector wasmainly toward the right posteroinferior octant ofthe space. Its azimuth angle was between 1460 and2600 (mean in group A 243.70 and in group B197.60). Its elevation angle varied from 680 (belowthe horizontal plane) to -6° (above the horizontal
128
on January 16, 2022 by guest. Protected by copyright.
http://heart.bmj.com
/B
r Heart J: first published as 10.1136/hrt.39.2.126 on 1 F
ebruary 1977. Dow
nloaded from

Computer study of VCG in left posterior fascicular block
Table 1 Clinical and pathological findings, electrocardiographic diagnosis of group A; isolated left posteriorfascicular block
Case Age Sex Clinical and pathological findings Electrocardiographic diagnosis PR Left ventricularNo. (y) (apart from left posterior fascicular block) (ms) enlargement*
(x-ray)
1 18 M Essential hypertension Left ventricular hypertrophy 110 -
2 43 M Hypertension, nephropathy Left ventricular hypertrophy 140 +3 13 M Supraventricular tachycardia-frequent bouts No WPW syndrome (His bundle recording) 140 +
transient tachycardia-dependent leftbundle-branch block
4 58 M Severe calcific aortic stenosis: normal right- Pronounced left ventricular hypertrophy 180 + + +sided pressures
5 69 M Coronary artery disease; old inferior wall Incomplete left bundle-branch block 180 -
myocardial infarction-left ventricularfailure
6 35 M Severe calcific aortic stenosis; left ventricular Left ventricular hypertrophy; after surgery 110 -
hypertrophy, aortic valve replacement- right bundle-branch block and shift ofpost-surgical syncope QRS axis +20' to + 100'
7 41 F Catheterisation and pulmonary angiography: Transient complete right bundle-branch 140 -
negative-during catheterisation junctional block (with QRS axis + 150') during(nodal superior) paroxysmal tachycardia paroxysmal tachycardia; otherwise isolated
left posterior fascicular block8 18 M Primitive cardiomyopathy; left ventricular Left ventricular hypertrophy 190 + + +
failure; normal right-sided pressures9 62 M Coronary artery disease; several coronary Incomplete right bundle-branch block with 230 + + + +
thromboses; left ventricular failure left anterior fascicular block at first;thereafter complete right bundle-branchblock with left anterior fascicular block;finally intermittent right bundle-branchblock and permanent isolated left posteriorfascicular block
10 61 M Hypertension; severe coronary artery disease Inferior wall myocardial infarction 140 + + + +(necropsy), old inferior wall myocardialinfarction, recent septal necrosis; leftventricular hypertrophy
*For key, see Table 2.
plane) averaging 18-2' in group A and 30.20 ingroup B.
The orientation of the half-area QRS vector wasclose to that of the maximal vector: the azimuthangle was in the range of 1500 to 3240 (mean= 2500in group A and 213-9' in group B); the elevationangle varied from 81° to -15° averaging 20.50 ingroup A and 43.90 in group B.As with the maximal and the half-area QRS
vectors, the half-time QRS vectors were most oftendirected to the right posteroinferior octant (14cases).
The mean QRS axis in the electrocardiogramvaried from + 90° to 1800 in 15 cases. In theremaining 3 cases it was, respectively, + 60°,+800, and -140°. Its mean value was + 112° ingroup A and + 127-5' in group B.
In adults, the relative area of the spatial QRS loopdeveloping in the left half of the electrical field isnormally greater than 75 per cent of the total QRSarea. In these patients, lower values were observed(from 4% to 53%; mean: 35-8% in group Aand 24-6% in group B), again demonstrating therightward deviation of the main QRS forces.
The rotation of the QRS loop in the frontal planewas clockwise in 15 cases, counterclockwise in 1
case, and figure-of-8 in 2 cases. In the horizontalplane, the rotation was counterclockwise in 11cases and figure-of-8 in the remaining 7 cases.
The QRS duration was 90 ms in 3 cases: webelieve that this value is compatible with thediagnosis of left posterior fascicular block. Themean value of the QRS duration was 97-1 ms ingroup A and 146-5 in group B where a rightbundle-branch block was associated with theleft posterior fascicular block.
The time of occurrence of the maximal vector, fromthe onset of the QRS loop, varied from 44 to 105 ms(mean 53 ms in group A, and 72 ms in group B).It was greater than 50 ms in 12 cases (5 of the 10cases of group A, and 7 of the 8 cases of group B),denoting a delay of the first part of the QRS looppreceding the maximal vector. This part was evenlonger than that following the maximal vector in11 of the 18 cases.
The time of occurrence of the half-area vector wassomewhat shorter: it varied from 32 to 92 ms,averaging 49 5 ms in group A and 64-9 ms ingroup B. The average time of occurrence of boththe maximal and the half-area vectors was 17 msgreater in group B than in group A.
The magnitude of the maximal spatial QRS
129
on January 16, 2022 by guest. Protected by copyright.
http://heart.bmj.com
/B
r Heart J: first published as 10.1136/hrt.39.2.126 on 1 F
ebruary 1977. Dow
nloaded from

Table 2 Clinical and pathological findings, electrocardiographic diagnosis of group B: left posterior fascicularblock + complete right bundle-branch block
Case Age Sex Clinical and pathological findings Electrocardiographic diagnosis PR Left ventricularNo. (y) (apart from left posterior fascicular block) (ms) enlargement
(x-ray)
11 70 M Hypertension; Adams-Stokes syncope Isolated complete right bundle-branch block; 220thereafter complete heart block followedby 4/1 AV block and complete rightbundle-branch block + left anteriorfascicular block; finally complete rightbundle-branch block + left posteriorfascicular block
12 7 M Mitral regurgitation since birth; normal Unusual aspect: QRS in Vl, no q in I, aVL, 150 +-right-sided pressures V5, V6
13 54 M Adams-Stokes syncope Intermittent complete AV block; complete 170 -
right bundle-branch block; later on:regression, only isolated left posteriorfascicular block
14 70 F Aortic stenosis, hypertension, angina, left Complete right bundle-branch block, axis 120 +ventricular failure deviation undetermined (-140'?)
15 41 M Rheumatic mitral regurgitation, hypertension, Complete right bundle-branch block with 150 +and glomerulonephritis right axis deviation
16 36 M No history of heart disease; Adams-Stokes Incomplete and intermittent AV block; 170 -
syncope complete right bundle-branch block withright axis deviation
17 91 F Acute inferior wall myocardial infarction Unstable AV block-permanent complete 170 + + +4 days before vectorcardiogram right bundle-branch block; transitory left
anterior fascicular block, otherwise leftposterior fascicular block with shift ofQRS axis -90' to + 120'
18 54 M Hypertension, angina, left ventricular failure, First normal QRS axis and SIQIII pattern; 230 + + +normal right-sided pressures thereafter intermittent right bundle-branch
block and shift of QRS axis to + 140'.Then complete right bundle-branch blockand QRS axis + 180'
Left ventricular enlargement: - nil; + moderate; + + + severe; + + + + very severe.
vector varied from 107 to 2-80 mV, averaging 1-80mV.As expected, the curve of the amplitude of the
spatial instantaneous vectors was delayed in itsterminal part in all cases with a right bundle-branch block. But the aspect of this curve wasalways normal, showing no irregularities, especiallyin its initial part.
The duration of the PR interval was between110 and 230 ms (mean value: 163 ms). It was180 or 190 ms in 3 cases, and 220 or 230 ms in 3cases.
Discussion
This study confirms that left posterior fascicularblock, as diagnosed from vectorcardiographiccriteria, is rare whether isolated or associatedwith right bundle-branch block; it was observedin only 0 39 per cent of the patients in a specialisedcardiac institute. Our criteria of selection, withexclusion of all cases with anterior wall myocardialinfarction, could account in part for this. Thereal incidence of left posterior fascicular block inour centre probably approaches 0A45-050 percent, which agrees with the results of others using
electrocardiographic criteria (Strickland et al., 1972;Rizzon et al., 1975). In contrast with the leftanterosuperior fascicle, which is relatively vul-nerable to anterior wall infarction (Rosenbaumet al., 1968; Bobba et al., 1972), we found thatleft posterior fascicular block was rare in inferiorwall myocardial infarction (only 3 cases in ourseries).The diagnosis of left posterior fascicular block is
difficult, mainly because the commonly usedelectrocardiographic criteria lack specificity. Inthis study, we have attempted to define more validcriteria from the Frank vectorcardiogram ratherthan from the conventional 12 lead electrocardio-gram and we have characterised the spatial QRSvector loop in left posterior fascicular block.
CRITERION A: INITIAL PART OF QRS LOOPAccording to criterion A, the initial part of theQRS loop in left posterior fascicular block mustbe oriented anteriorly, superiorly, and to the left.This orientation results from the initial depolari-sation depending only on the anterosuperiorfascicle which activates the anterosuperior part ofthe left side of the septum and the adjacent anteriorleft ventricular wall (Scher, 1960; Rosenbaum
130 Brohet and Arnaud
on January 16, 2022 by guest. Protected by copyright.
http://heart.bmj.com
/B
r Heart J: first published as 10.1136/hrt.39.2.126 on 1 F
ebruary 1977. Dow
nloaded from

Computer study of VCG in left posterior fascicular block
et al., 1968; Lemberg et al., 1971; Medrano et al.,1971). Right bundle-branch block does not affectthis sequence of septal activation (Rosenbaumet al., 1968; Cohen et al., 1968).
In this series, the initial segment of the spatialQRS loop and the maximal spatial QRS vectorwere oriented in opposite directions. In bothgroups, these two vectors formed an angle whosemean value was 1520, with a narrow range (1400 to1760, after exclusion of two extreme cases). Thepresence of complete right bundle-branch blockdid not modify this particular relation betweenthe initial and the maximal QRS vectors. In groupB as compared with group A, the mean elevationangle showed an initial segment vector moresuperiorly oriented (-33.5° in group B, -17*1 ingroup A) and a maximal QRS vector more in-
L. SAGITTAL I Y
Di D2 03 aVR aVL aVF
*::t:-':::'.g:'R ..... - fi< <; ....... "-- s s'':::.:,is<94+4'+#4'vx+--¢34...........'..
v. 'L . ..,-L2 .. :: ..
VI V2 V3 V4 Vs V-.... ..... .,::*,C
B
I %
* ._
x7 \.
,7
1,,y
z
1 A1 MILLIVOLT
FRONTAL
I
\
HORIZONTALIp/ z
Fig. 1 (A) Frank QRS vectorcardiogram (Case 6). Plot time interval of 2 milliseconds. (B) Electrocardiogram,the same patient, who sufferedfrom calcific aortic stenosis with a gradient of 170 mmHg, left ventricularhypertrophy, and poor contractility of both ventricles. After valve replacement (Bjork prosthesis), he suffered fromsyncope, and a demand pacemaker was then inserted. The electrocardiogram before surgery showed left ventricularhypertrophy with a QRS axis of +20° and no ventricular conduction abnormnalities. After surgery, rightbundle-branch block occurred with a QRS duration of 0-12 s, a shift of QRS axis to + 1000, and an SIQIII pattern.(Dl, 2, 3= leads I, II, III.)
131
on January 16, 2022 by guest. Protected by copyright.
http://heart.bmj.com
/B
r Heart J: first published as 10.1136/hrt.39.2.126 on 1 F
ebruary 1977. Dow
nloaded from

Table 3
Case Initial segment vector Left anterosuperior octant Max. vector 1/2 area vectorNo. AZ EL Angle with max. RM RA AD RD AZ EL T M AZ EL T
vector
Vectorcardiographic and electrocardiographic values of group A (isolated left posterior fascicular block)1 82 -40 163 27 5 26 25 247 58 54 2-80 279 60 482 72 -16 168 28 1 20 22 256 4 50 2-11 270 13 403 90 -33 154 16 0 13 14 257 11 50 2-32 264 28 404 39 0 161 18 1 12 13 253 4 63 2-63 261 4 505 0 -21 91 9 0 12 12 260 35 45 1-82 260 35 456 80 - 7 142 21 1 18 17 253 44 56 1-37 253 44 567 53 -15 165 17 1 20 22 248 21 48 1-51 248 21 488 67 -22 173 17 1 13 14 241 15 45 1-42 242 7 509 45 0 172 20 2 20 22 232 -4 55 1-07 228 0 5010 43 -17 140 70 26 52 47 190 -6 64 1-10 195 -7 68
Mean 57-1 -17-1 152-9 24-3 3-8 20-6 20-8 243-7 18-2 53 1-81 250 20-5 49 5
Vectorcardiographic and electrocardiographic values of group B (left posterior fascicular block + complete right bundle-branch block)11 11 -65 170 33 3 24 14 214 68 63 2.36 324 81 4912 24 -11 149 50 3 18 19 233 26 44 2-13 257 46 3213 64 -42 168 43 13 43 34 226 46 75 2-01 225 50 7014 54 - 6 158 25 1 16 11 213 13 60 1-65 198 9 7215 68 -37 75 59 7 35 23 146 0 105 1-07 191 68 6816 90 -77 154 6 0 28 16 197 55 98 2-70 186 74 9217 0 -30 176 8 0 13 10 185 34 53 2-29 180 38 4818 0 0 165 12 1 10 6 167 0 78 1-44 150 -15 88
Mean 38-9 -33-5 151-9 29-5 3-5 23-4 16-6 197-6 30-2 72 1-96 213-9 43 9 64-9
AZ =azimuth angle (°); EL =elevation angle (°); RM = relative magnitude (%,'); RA =relative area (%); AD =absolute duration (ms); RD = relativeduration (%); T =time of occurrence of this vector from onaet of QRS (ms); M =magnitude of the maximal vector (mV); 1/2 Time vector= locationof the half time QRS vector; RPI =right posteroinferior; LPI =left posteroinferior; RAI = right anteroinferior; RPS = right posterosuperior; RAS=right anterosuperior; FP =frontal plane; HP =horizontal plane; CW= clockwise; CCW = counterclockwise.
feriorly oriented (30.20 in group B, 18.20 in groupA). The mean azimuth angle showed that in groupB, the initial vectors were less anterior and moreleftwards (38.90 in group B, 57.10 in group A) andthe maximal vector was more anterior and right-wards (197.60 in group B, 243.70 in group A).
In 3 cases, the initial segment was transverselyrather than superiorly oriented (null value of theelevation angle). At the same time, the value of theelevation angle of the maximal vector was very low(40, O°, and -40, respectively). Therefore, in these3 cases, the opposite direction of the initial andmaximal vectors remained as apparent. Thus anull value for the elevation angle of the earlyQRS forces is compatible with criterion A.The importance of the initial forces developing
in the left anterosuperior octant, as determinedby the magnitude of the maximal octantal vector,as well as by the area and duration of these forces,was found to be variable. There are some externalfactors which can interfere with the magnitudeof these initial vectors in left posterior fascicularblock. First, possible interaction from an inferiorwall myocardial infarction has rarely been discussed(Castellanos et al., 1972). Isolated inferior wallmyocardial infarction generally increases the initialQRS forces located in the left anterosuperior octant.
Medrano et al. (1971) showed in dogs that theproduction of left posterior fascicular block coulddecrease or even mask the electrocardiographic-vectorcardiographic signs of a coexisting inferiorwall myocardial infarction; Bobba et al. (1972)reported 2 cases where left posterior fascicular blockduring an exercise test occurred concomitantlywith decrease of the pathological q waves in leadsII, III, and aVF.
In our series, there were 3 cases of inferior wallmyocardial infarction. The tracing of case 10 isdifficult to analyse in this respect. In 2 cases (5and 17), the usual vectorcardiographic criteria ofinferior wall myocardial infarction were not ful-filled; moreover, the duration of the initial forceswas shorter (12 and 13 ms), the area developed bythese forces was smaller (< 1 %) and their magnitudewas lower (8 and 90%) than the average for thetotal group.
This 'masquerading effect' of a left posteriorfascicular block on concomitant inferior wallmyocardial infarction can be explained by thepathophysiology of this type of intraventricularconduction defect: when the left posterior fasci-cular block develops, the initial left activation reliessolely on the anterosuperior fascicle, thereforeignoring the posteroinferior wall. If the latter is
132 Brohet and Arnaud
on January 16, 2022 by guest. Protected by copyright.
http://heart.bmj.com
/B
r Heart J: first published as 10.1136/hrt.39.2.126 on 1 F
ebruary 1977. Dow
nloaded from
Computer study of VCG in left posterior fascicular block
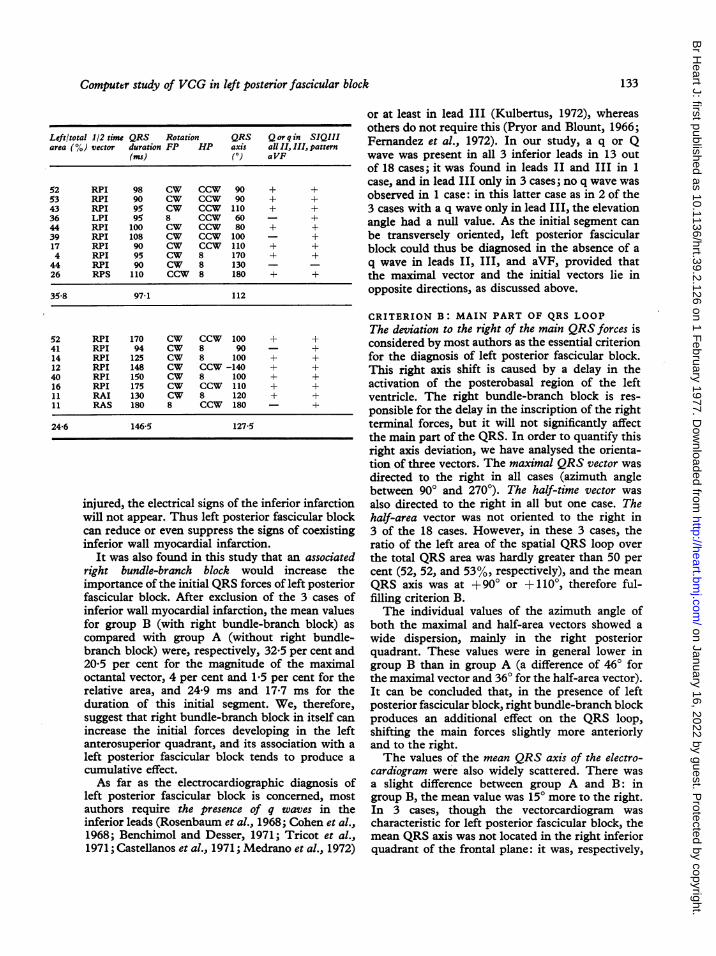
Left/total 1/2 time QRS Rotation QRS Q or q in SIQIIIarea (%) vector duration FP HP axis all II, III, pattern
(ms) (°) aVF
52 RPI 98 CW CCW 90 + +53 RPI 90 CW CCW 90 + +43 RPI 95 CW CCW 110 + +36 LPI 95 8 CCW 60 - +44 RPI 100 CW CCW 80 + +39 RPI 108 CW CCW 100 - +17 RPI 90 CW CCW 110 + +4 RPI 95 CW 8 170 + +44 RPI 90 CW 8 130 - -26 RPS 110 CCW 8 180 + +
35-8 97-1 112
52 RPI 170 CW CCW 100 + +41 RPI 94 CW 8 90 - +14 RPI 125 CW 8 100 + +12 RPI 148 CW CCW-140 + +40 RPI 150 CW 8 100 + +16 RPI 175 CW CCW i10 + +11 RAI 130 CW 8 120 + +11 RAS 180 8 CCW 180 - +
24-6 146-5 127-5
injured, the electrical signs of the inferior infarctionwill not appear. Thus left posterior fascicular blockcan reduce or even suppress the signs of coexistinginferior wall myocardial infarction.
It was also found in this study that an associatedright bundle-branch block would increase theimportance of the initial QRS forces of left posteriorfascicular block. After exclusion of the 3 cases ofinferior wall myocardial infarction, the mean valuesfor group B (with right bundle-branch block) as
compared with group A (without right bundle-branch block) were, respectively, 32-5 per cent and20-5 per cent for the magnitude of the maximaloctantal vector, 4 per cent and 1-5 per cent for therelative area, and 24-9 ms and 17-7 ms for theduration of this initial segment. We, therefore,suggest that right bundle-branch block in itself canincrease the initial forces developing in the leftanterosuperior quadrant, and its association with a
left posterior fascicular block tends to produce acumulative effect.As far as the electrocardiographic diagnosis of
left posterior fascicular block is concerned, mostauthors require the presence of q waves in theinferior leads (Rosenbaum et al., 1968; Cohen et al.,1968; Benchimol and Desser, 1971; Tricot et al.,1971; Castellanos et al., 1971; Medrano et al., 1972)
or at least in lead III (Kulbertus, 1972), whereasothers do not require this (Pryor and Blount, 1966;Fernandez et al., 1972). In our study, a q or Qwave was present in all 3 inferior leads in 13 outof 18 cases; it was found in leads II and III in 1case, and in lead III only in 3 cases; no q wave wasobserved in 1 case: in this latter case as in 2 of the3 cases with a q wave only in lead III, the elevationangle had a null value. As the initial segment canbe transversely oriented, left posterior fascicularblock could thus be diagnosed in the absence of aq wave in leads II, III, and aVF, provided thatthe maximal vector and the initial vectors lie inopposite directions, as discussed above.
CRITERION B: MAIN PART OF QRS LOOPThe deviation to the right of the main QRS forces isconsidered by most authors as the essential criterionfor the diagnosis of left posterior fascicular block.This right axis shift is caused by a delay in theactivation of the posterobasal region of the leftventricle. The right bundle-branch block is res-ponsible for the delay in the inscription of the rightterminal forces, but it will not significantly affectthe main part of the QRS. In order to quantify thisright axis deviation, we have analysed the orienta-tion of three vectors. The maximal QRS vector wasdirected to the right in all cases (azimuth anglebetween 90° and 2700). The half-time vector wasalso directed to the right in all but one case. Thehalf-area vector was not oriented to the right in3 of the 18 cases. However, in these 3 cases, theratio of the left area of the spatial QRS loop overthe total QRS area was hardly greater than 50 percent (52, 52, and 53%, respectively), and the meanQRS axis was at +900 or +1100, therefore ful-filling criterion B.The individual values of the azimuth angle of
both the maximal and half-area vectors showed awide dispersion, mainly in the right posteriorquadrant. These values were in general lower ingroup B than in group A (a difference of 460 forthe maximal vector and 360 for the half-area vector).It can be concluded that, in the presence of leftposterior fascicular block, right bundle-branch blockproduces an additional effect on the QRS loop,shifting the main forces slightly more anteriorlyand to the right.The values of the mean QRS axis of the electro-
cardiogram were also widely scattered. There wasa slight difference between group A and B: ingroup B, the mean value was 15° more to the right.In 3 cases, though the vectorcardiogram wascharacteristic for left posterior fascicular block, themean QRS axis was not located in the right inferiorquadrant of the frontal plane: it was, respectively,
133
on January 16, 2022 by guest. Protected by copyright.
http://heart.bmj.com
/B
r Heart J: first published as 10.1136/hrt.39.2.126 on 1 F
ebruary 1977. Dow
nloaded from

Brohet and Arnaud
at +600, +800, and undetermined (around -140°).This is not surprising since there is not always agood correlation between the orientation of themaximal spatial QRS vector and the angle of themaximal vector in frontal plane (Lopes et al., 1974).Moreover, since the range of normality is differentbetween the mean QRS axis of the electrocardio-gram and the angle of the maximal QRS vector inthe frontal plane, the criteria for left posteriorfascicular block based on these two values shouldnecessarily be different (Poblete et al., 1974).
Although this series is too small to permit adetailed statistical analysis, we have examinedother factors that might influence the orientationof the QRS loop in left posterior fascicular block.Five parameters were studied: the azimuth andelevation angles of both the maximal and half-areavectors, and the mean QRS axis of the electro-cardiogram. There was no apparent correlationwith left ventricular hypertrophy, inferior wall
c
0
+ 40'-
infarction, or the position of the heart within thethorax as judged from chest x-ray films. Twofactors seemed, however, to play a significant role:(1) the presence of complete right bundle-branchblock and (2) the degree of cardiomegaly. On thebasis of the cardiothoracic ratio, we have considered4 degrees of cardiomegaly: nil, moderate, severe,and very severe. The elevation and azimuth anglesrepresent the average values of both the maximaland half-area vectors.
Fig. 2A shows that cardiomegaly is associatedwith a decrease of the elevation angle and, there-fore, with a more horizontal loop. The caseswith right bundle-branch block have higher valuesof the elevation angle, corresponding to morevertical loops. But in these cases, the cardiomegalyacts in the same way: in advanced stages, it bringsthe elevation angle toward a null value.
In Fig. 2B, it can be seen that cardiomegaly is alsoassociated with a decrease of the azimuth angle
Fig. 2 Orientation of the main QRSforces as related to the degree of cardiomegaly (abscissa). Individual valuesof group A (isolated left posterior fascicular block) = A. Individual values of group B (left posterior fascicular block+ complete right bundle-branch block) = 0. Best fitting line for group A= - and for group B =------ (least
square method). (a) Ordinate: average of the individual values of the elevation angle of both the maximal and half-area vectors. (b) Ordinate: average of the individual values of the azimuth angle of both the maximal and half-area vectors. (c) Ordinate: individual values of mean QRS axis of the electrocardiogram.
2a
group B $.y = -15.3,4x+54.34
134
on January 16, 2022 by guest. Protected by copyright.
http://heart.bmj.com
/B
r Heart J: first published as 10.1136/hrt.39.2.126 on 1 F
ebruary 1977. Dow
nloaded from

Computer study of VCG in left posterior fascicular block
260-~~~~Y y-9.11x+261,434
240
220-"a
180- ~~~group B=* ^
y=-19,28x+227,44160 t1 ~~2 3 4CardioalyS * 2c~~~~~~~~~~~
iw-
group B=.150- y=14.94x+110O730.- V90-~~~~~~~~ y=12.80x +91.52,
'Cardiornegaly
135
on January 16, 2022 by guest. Protected by copyright.
http://heart.bmj.com
/B
r Heart J: first published as 10.1136/hrt.39.2.126 on 1 F
ebruary 1977. Dow
nloaded from

Brohet and Arnaud
and thus with displacement of the loop to the rightand anteriorly. The cases with right bundle-branch block already had lower values of the azi-muth angle: in these cases, the cardiomegaly addsits own effect to the anterior shift of the QRS loop.This is shown in the figure by the divergence ofthe two straight lines.
Fig. 2C shows a similar effect: cardiomegaly isresponsible for a rightward shift of the mean QRSaxis, even more obvious in cases with right bundle-branch block.The presence of cardiomegaly tends to decrease
the values of both the azimuth and the elevationangle of the main QRS forces. In 3 cases in thisseries, the latter had a negative value (loop beingsuperiorly oriented). This shows the importantinfluence of cardiomegaly which can producea superior displacement of the QRS loop in somecases of left posterior fascicular block. Therefore,one cannot retain the inferior orientation of theQRS as a valid criterion of left posterior fascicularblock. This is why our criterion B does not considerthe elevation angle, but only the azimuth angle, i.e.the rightward deviation of the QRS.Most previous publications stated that the direc-
tion of the rotation of the frontal QRS loop isusually clockwise in left posterior fascicular block.This clockwise rotation was observed in 15 casesof our series. It was counterclockwise in 1 case(case 10) and showed a figure-of-8 in 2 cases(cases 4 and 18). But in these 3 cases there wasimportant cardiomegaly, and the elevation angle waslow or even negative (between +40 and -15°).Therefore, just as the elevation angle could beinfluenced by other factors, the rotation of thefrontal QRS loop should not be considered amongthe vectorcardiographic criteria of left posteriorfascicular block.
PRESUMPTIVE CRITERIA OF LEFTPOSTERIOR FASCICULAR BLOCKIn addition to the vectorcardiographic criteria Aand B, the diagnosis of left posterior fascicularblock in this series was supported by several otherconsiderations which represent useful presumptivecriteria.
(1) Atrioventricular block (AV block)Four patients had a history of Adams-Stokessyncope. The duration of the PR interval was180 ms or more in 6 patients. In 3 others, therewas transient complete or incomplete AV block.The mean value of the PR interval was slightlygreater in group B (172 ms) as compared withgroup A (156 ms).
(2) Progressive or variable intraventricular conductiondefectsThese, which were present in 10 of our patients,appear to be of great diagnostic value. In 6 cases,there was a transient conduction defect such asright bundle-branch block, left bundle-branchblock, or AV block of various degree, which disap-peared during the follow-up period or was replacedby another type of conduction defect. In 4 cases,the conduction defect progressed and becamepermanent.The condition known as 'hebmibloc a bascule', i.e.
left anterior fascicular block evolving into leftposterior fascicular block (Rosenbaum et al.,1969a, b) was found in 3 patients (cases 9, 11, 17)who had in addition partial AV block.
(3) Paradoxical right axis deviationIn subjects with clinical conditions usually causingleft axis deviation, such as a horizontal heart orleft ventricular hypertrophy, the paradoxical findingof right axis deviation strongly suggests the exist-ence of left posterior fascicular block. This wasthe case in half of our patients who had a leftventricular overload.
OTHER CRITERIA OF LEFT POSTERIORFASCICULAR BLOCKAccording to Watt and Pruitt (1969) and Medranoet al. (1972) the QRS duration can be slightlyincreased by about 10 ms, in isolated left posteriorfascicular block. In group A of this series, the meanQRS duration was 97 ms. However, cases with aQRS duration less than 90 ms had been excludedfrom this study (see methods). On the other hand,the 4 patients in group A who displayed a QRSduration longer than 95 ms had left ventricularhypertrophy or myocardial infarction: these condi-tions could account for a slight increase in theQRS duration. Therefore isolated left posteriorfascicular block does not in itself seem significantlyto increase the QRS duration. This is also sup-ported by the fact that in group A there wasapparently no significant delay of the late portionof the QRS loop in any planar projection, nor wasthere any delay on the curve of the linear velocityof the spatial vector.
The presence of right ventricular hypertrophy oroverload makes the diagnosis of left posteriorfascicular block impossible. The most usualpattern (type c) of right ventricular hypertrophywith a QRS loop orientated posteriorly and to theright is quite similar to the left posterior fascicularblock pattern, and distinction is impossible onthe basis of electrocardiographic or vectorcardio-graphic criteria alone (Strickland et al., 1972). On
136
on January 16, 2022 by guest. Protected by copyright.
http://heart.bmj.com
/B
r Heart J: first published as 10.1136/hrt.39.2.126 on 1 F
ebruary 1977. Dow
nloaded from
Computer study of VCG in left posterior fascicular block
the other hand, in more severe cases of rightventricular hypertrophy, with a distinct rightwardand anterior displacement of the mid and lateparts of the QRS loop, the diagnosis of rightventricular hypertrophy is more obvious, thoughleft posterior fascicular block could still be asso-ciated with the right ventricular hypertrophy.The SIQIII pattern has been considered by
some authors as characteristic of left posteriorfascicular block. Rosenbaum et al. (1969b) reportedseveral cases where the SIQIII pattern occurredconcomitantly with intermittent left posteriorfascicular block. In fact, our criteria A and B, aspreviously described, correspond respectively tothe existence of a Q wave in lead III and an Swave in lead I. These electrocardiographic criteriawere present in all but one patient. However, rightventricular overload is another possible cause oSIQIII pattern (Strickland et al., 1972). Later Scott(1971) suggested that acute cor pulmonale couldlead to myocardial ischaemia, which, in turn, couldinduce transient left posterior fascicular block.
References
Arnaud, P., Martinez, Y., and Lanoue, J. C. (1968). Vecto-cardiographe a memoire a tores. Symposium d'Infor-matique Medicale, Toulouse, France.
Benchimol, A., and Desser, K. B. (1971). The Frank vector-cardiogram in left posterior hemiblock. Journal of Electro-cardiology, 4, 129-136.
Bobba, P., Salerno, J. A., and Casari, A. (1972). Transientleft posterior hemiblock. Report of four cases induced byexercise test. Circulation, 46, 931-938.
Castellanos, A., Chapunoff, E., Castillo, C. A., Arcebal,A. G., and Lemberg, L. (1972). The vectorcardiogram inleft posterior hemiblock associated with inferior wallmyocardial infarction. Chest, 61, 221-227.
Castellanos, A., Chapunoff, E., Lemberg, L., and Portillo,B. (1971). The vectorcardiogram in left posterior hemi-block. Vectorcardiography 2. In Proceedings of the XIthInternational Symposium on Vectorcardiography, NewYork, pp. 264-271. Ed. by Irwin Hoffman. North Holland,Amsterdam.
Castellanos, A., and Lemberg, L. (1971). Diagnosis of isolatedand combined block in the bundle branches and thedivisions of the left branch. Circulation, 43, 971-976.
Chou, T. C., Helm, R. A., and Kaplan, S. (1974). ClinicalVectorcardiography, p. 161. Grune and Stratton, NewYork.
Cohen, S. I., Lau, S. H., Stein, E., Young, M. W., andDamato, A. N. (1968). Variations of aberrant ventricularconduction in man: evidence of isolated and combinedblock within the specialised conduction system. Anelectrocardiographic and vectorcardiographic study. Circu-lation, 38, 899-916.
Fernandez, F., Heller, J., Trevi, G. P., Rabenou, S., Scebat,L., and Lenegre, J. (1972). The QRS loop in left antcriorand posterior hemiblocks. Vectorcardiographic studyduring selective coronary arteriography. American Journalof Cardiology, 29, 337-343.
Kulbertus, H. (1972). Contribution a l'etude des blocssegmentaires de la branche gauche du faisceau de His etde leurs associations avec le bloc de branche droit. These,Liege.
Lemberg, L., Castellanos, A., and Arcebal, A. G. (1971).Re-evaluation of septal activation in the human heart withspecial reference to the spatial orientations of the initialQRS vectors in intermittent left hemiblocks. Vectorcar-diography 2. In Proceedings of the XIth InternationalVectorcardiography Symposium, New York, p. 257. Ed. byIrwin Hoffman. North Holland, Amsterdam.
Lopes, V. M., Pereira Miguel, J., Dos Reis, D. D., Da Costa,B. C. B., and De Padua, F. (1974). Left-posterior hemiblock.Clinical and vectorcardiographic study of twenty cases.Journal of Electrocardiology, 7, 197-214.
Medrano, G. A., Brenes, C. P., De Michell, A., and Sodi-Pallares, D. (1972). Clinical electrocardiographic andvectorcardiographic diagnosis of left posterior subdivisionblock, isolated or associated with right bundle branchblock. American Heart Journal, 84, 727-737.
Medrano, G. A., Brenes, C. P., and Sodi-Pallares, D. (1971).Necrosis of the posterior aspect of the free left ventricularwall associated with block of the posterior subdivision ofthe left bundle branch of His. Journal of Electrocardiology,4, 44-49.
Nicolai, P., Delaage, M., Medvedowsky, J. L., and Barnay,C. (1974). Les hemiblocs gauches posterieurs. Donneesactuelles. Annales de Cardiologie et d'Angeiologie, 23, 307-316.
Poblete, P. F., Kini, P. M., Batchlor, C. D., and Pipberger,H. V. (1974). Evaluation of frontal plane QRS looprotation in vectorcardiographic diagnosis. J7ournal ofElectrocardiology, 7, 287-294.
Polu, J. M., Gilgenkrantz, J. M., and Faivre, G. (1972). Lediagnostic vectocardiographique des hemiblocs de branchegauche isoles et associes a un bloc de branche droit ou a uninfarctus du myocarde. Archives des Maladies du Coeur etdes Vaisseaux, 65, 1041-1068.
Pryor, R. (1972). Fascicular blocks and the bilateral bundlebranch block syndrome. Editorial. American Heart Journal,83, 441-446.
Pryor, R., and Blount, S. G. (1966). The clinical significanceof true left axis deviation. Left intraventricular blocks.American Heart Journal, 72, 391-413.
Rizzon, P., Rossi, L., Baissus, C., Demoulin, J. C., and DiBiase, M. (1975). Left posterior hemiblock in acute myo-cardial infarction. British Heart Journal, 37, 711-720.
Rosenbaum, M. B. (1970). The hemiblocks: diagnosticcriteria and clinical significance. Modern Concepts ofCardiovascular Disease, 39, 141-146.
Rosenbaum, M. B., Elizari, M. V., and Lazzari, J. 0. (1968).Los Hemibloqueos. Editorial Paidos, Buenos Aires.
Rosenbaum, M. B., Elizari, M. V., Lazzari, J. O., Nau, G. J.,Levi, R. J., and Halpern, M. S. (1969a). Intraventriculartrifascicular blocks. The syndrome of right bundle branchblock with intermittent left anterior and posterior hemi-block. American Heart J7ournal, 78, 306-317.
Rosenbaum, M. B., Elizari, M. V., Lazzari, J. O., Nau, G. J.,Levi, R. J., and Halpern, M. S. (1969b). Intraventriculartrifascicular blocks. Review of the literature and classifica-tion. American Heart Journal, 78, 450-459.
Rubel, P., Arnaud, P., and Prev6t, D. (1975). Systemed'aide a la decision. Application a l'interpretation auto-matique des vectocardiogrammes. International Journal ofBio-Medical Computing, 6, 193-211.
Scher, A. M. (1960). Electrical correlates of the cardiaccycle. In Medical Physiology and Biophysics, pp. 600-607. Ed.by T. C. Ruch and J. F. Fulton. Saunders, Philadelphia.
137
on January 16, 2022 by guest. Protected by copyright.
http://heart.bmj.com
/B
r Heart J: first published as 10.1136/hrt.39.2.126 on 1 F
ebruary 1977. Dow
nloaded from

Brohet and Arnaud
Scott, R. C. (1971). The SlQ3 (McGinn-White) pattem inacute cor pulmonale: a form of transient left posteriorhemiblock? American Heart J7ournal, 82, 135-137.
Strickland, A. W., Horan, L. G., and Flowers, N. C. (1972).Gross anatomy associated with pattems called left posteriorhemiblock. Circulation, 46, 276-282.
Tricot, R., Valere, P. E., and Guerot, Cl. (1971). Associationbloc de branche droit et hemibloc intraventriculaireposterieur gauche. Archives des Maladies du Coeur et desVaisseaux, 64, 169-189.
Varriale, P., and Kennedy, R. J. (1972). Right bundle branchblock and left posterior fascicular block. Vectorcardiogra-
phic and clinical features. American J7ournal of Cardiology,29, 459-465.
Watt, T. B., and Pruitt, R. D. (1969). Left posterior fascicularblock in canine and primate hearts. An electrocardiographicstudy. Circulation, 40, 677-685.
Requests for reprints to Dr. P. Arnaud, HopitalCardio-Vasculaire, BP Lyon Montchat, 69394Lyon Cedex 3, France.
138
on January 16, 2022 by guest. Protected by copyright.
http://heart.bmj.com
/B
r Heart J: first published as 10.1136/hrt.39.2.126 on 1 F
ebruary 1977. Dow
nloaded from