spatial fidelity of workers predicts collective response...
TRANSCRIPT
ARTICLE
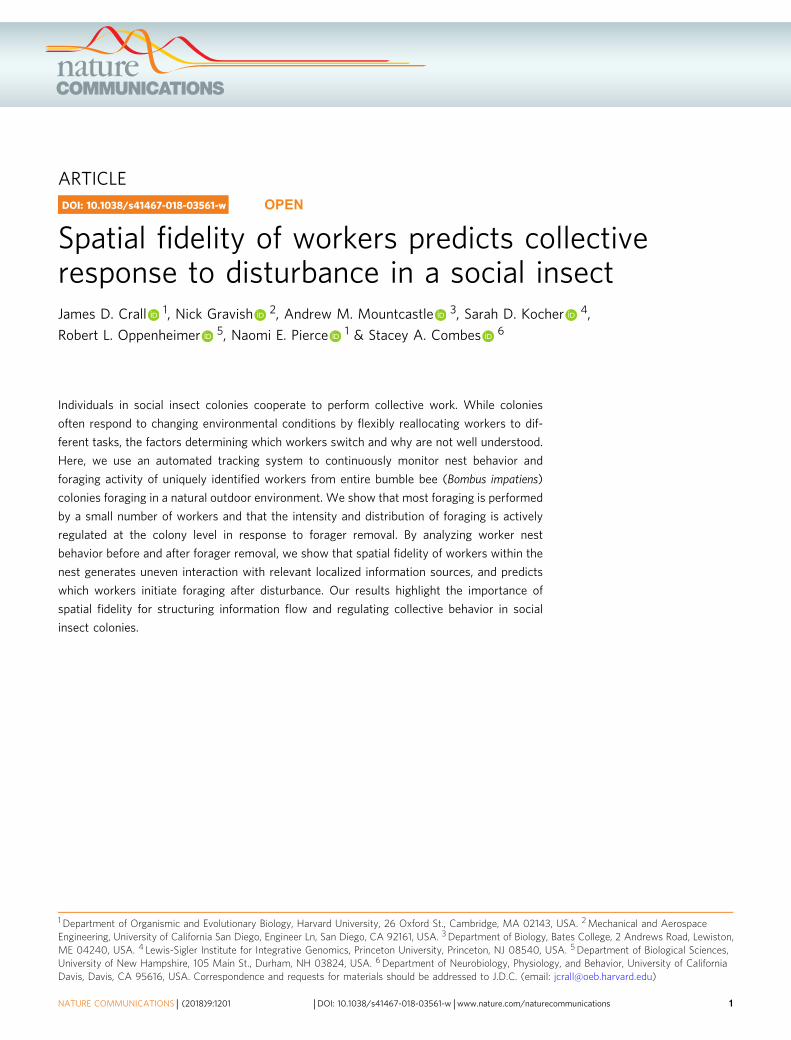
Spatial fidelity of workers predicts collectiveresponse to disturbance in a social insectJames D. Crall 1, Nick Gravish 2, Andrew M. Mountcastle 3, Sarah D. Kocher 4,
Robert L. Oppenheimer 5, Naomi E. Pierce 1 & Stacey A. Combes 6
Individuals in social insect colonies cooperate to perform collective work. While colonies
often respond to changing environmental conditions by flexibly reallocating workers to dif-
ferent tasks, the factors determining which workers switch and why are not well understood.
Here, we use an automated tracking system to continuously monitor nest behavior and
foraging activity of uniquely identified workers from entire bumble bee (Bombus impatiens)
colonies foraging in a natural outdoor environment. We show that most foraging is performed
by a small number of workers and that the intensity and distribution of foraging is actively
regulated at the colony level in response to forager removal. By analyzing worker nest
behavior before and after forager removal, we show that spatial fidelity of workers within the
nest generates uneven interaction with relevant localized information sources, and predicts
which workers initiate foraging after disturbance. Our results highlight the importance of
spatial fidelity for structuring information flow and regulating collective behavior in social
insect colonies.
DOI: 10.1038/s41467-018-03561-w OPEN
1 Department of Organismic and Evolutionary Biology, Harvard University, 26 Oxford St., Cambridge, MA 02143, USA. 2Mechanical and AerospaceEngineering, University of California San Diego, Engineer Ln, San Diego, CA 92161, USA. 3 Department of Biology, Bates College, 2 Andrews Road, Lewiston,ME 04240, USA. 4 Lewis-Sigler Institute for Integrative Genomics, Princeton University, Princeton, NJ 08540, USA. 5Department of Biological Sciences,University of New Hampshire, 105 Main St., Durham, NH 03824, USA. 6Department of Neurobiology, Physiology, and Behavior, University of CaliforniaDavis, Davis, CA 95616, USA. Correspondence and requests for materials should be addressed to J.D.C. (email: [email protected])
NATURE COMMUNICATIONS | (2018) 9:1201 | DOI: 10.1038/s41467-018-03561-w |www.nature.com/naturecommunications 1
1234
5678
90():,;
Social insects (i.e., ants, bees, wasps, and termites) are amongthe most ecologically dominant and evolutionarily suc-cessful animals on the planet. Within social insect colonies,
many individuals cooperate to perform crucial collective tasks,including foraging, caring for young, maintaining and cleaningthe nest, and defending the colony from predators and socialparasites1–3.
Division of colony labor among workers is widely consideredthe key adaptation of social insects, with the specialization ofworkers on specific tasks theorized to improve colony perfor-mance2, for example by reducing the costs of switching betweentasks4,5. However, individual workers generally show flexibility intask performance6–8, and social insect colonies are able to real-locate workers to different tasks when colony demands change6,9–13. Such flexibility is crucial for colony function, since the allo-cation of workers to tasks must change with either fluctuatingresources or colony perturbations such as the loss of foragers topredation. In honey bees, for example, removal of older foragersleads to precocious development of younger nurses to replaceforager losses14. Such flexible responses to disturbance arewidespread in social insects (although not universal15) and oftenoccur rapidly (e.g., within 2–3 min in the harvester ant Pogono-myrmex barbatus16).
Flexible reallocation of workers to tasks occurs in the absenceof central control, through local interaction rules and informationflow17,18. The sources of local information used in this distributedcontrol of task allocation are diverse, and include tactile19,visual20, chemical17,21, and acoustical22 information exchanged indirect interaction with nestmates, or indirectly (for examplethrough the nest structure18) in social insect colonies.
Although shifting colony labor demands are often filled by anon-random subset of colony workers6,11, the factors drivingparticular workers to switch tasks over others are not wellunderstood, particularly in species with less advanced socialorganization. Workers in social insect colonies show substantialinter-individual variation in many aspects of behavior, bothwithin castes, as well as in species that lack clearly distinguishableworker castes23–28. While often described using different termi-nology23, this variation is similar to what has been called animal“personality” (i.e., individually repeatable behaviors) outside ofthe social insects29,30. Individual behavioral variation can arisefrom multiple sources (reviewed for social insects in ref. 24) andhas important evolutionary and ecological consequences31,32. Insocial groups, the composition of different personalities plays akey role in determining group dynamics and collective beha-viors33–38.
One aspect of individual variation hypothesized to play acentral role in the collective behavior of social insect colonies issensitivity to task-specific stimuli (e.g., food reserves as a stimulusfor foraging, or temperature as a stimulus for thermoregulation).Sensitivity to these stimuli—also known as response thresholds—may vary among individual workers, making certain workersmore likely to perform particular tasks39. Previous theoreticalwork has shown that response thresholds can explain task spe-cialization at the colony level39,40, as well as worker flexibility inresponse to disturbance40, consistent with empiricalobservations6.
However, response threshold models have important limita-tions. First, empirical support for response thresholds is knownfor a only limited number of cases (such as nest thermoregulationbehavior in bumble bees41,42), and results often suggest morecomplex dynamics than typically captured by models43. Inaddition, although not strictly required by response thresholdmodels, a common simplifying assumption is that individuals areevenly mixed in space and time, with equal access to relevanttask-specific stimuli.
Within social insect nests, however, the distribution of indi-viduals is spatially heterogeneous21,28,44–46. Likewise, relevantinformation cues from sources such as food storage pots anddeveloping young are heterogeneously distributed in space andtime18,47–49. If individual workers vary in space-use, this is likelyto generate variation in access to key information sources withinthe nest and play a role in structuring how individual workersperform particular colony tasks48. While some models explicitlyaddress spatial fidelity within nests, these have most often treatedspatial distributions as a consequence of age-based movementswithin the nest50–52, mobility patterns53, or aggression54. Despitegrowing interest in the spatial organization of work (and workers)in social insect colonies46,48,55, the role of worker spatial fidelityin structuring access to local information sources within thecolony and the importance of this aspect of worker spatialstructure for task allocation is not well understood.
The role of individual behavioral variation in flexible taskallocation in social insect colonies in general, and the functionalrole of worker spatial fidelity patterns in particular, thus remainlargely unresolved. One challenge is that individuals vary inmultiple phenotypic axes simultaneously: in addition to responsethresholds and spatial fidelity, workers in social insect coloniescan vary in morphology56, physiology11, activity level10, aggres-sion57, and cognition58, among others, all of which may play animportant role in flexible task allocation. In addition, variationacross multiple aspects of behavior is often correlated (i.e.,behavioral syndromes30), making it difficult to parse whichcomponents play a functional role in colony dynamics.
A related challenge is that the processes giving rise to corre-lations between phenotypic traits and task performance mayinvolve complex dynamics and feedbacks not revealed by exam-ining static relationship between phenotype and task perfor-mance. For example, while in undisturbed colonies there may be acorrelation between body size and foraging, this does not neces-sarily imply that body size will predict which workers switch toforaging after a perturbation (e.g., loss of foragers to predation).Performance of a task may also have dynamic feedbacks on otheraspects of behavior. In honey bees, younger nurses generally lackthe strong circadian activity patterns present in older foragingbees, since developing brood within the nest require round-the-clock care59. Circadian rhythms appear to be a consequence offoraging activity, as foragers that are artificially forced to revert tonursing behavior subsequently lose these circadian activity pat-terns59. While potentially widespread, such behavioral feedbacksare not well understood in the context of task allocation in socialinsect colonies.
Here, we use an automated, image-based tracking system(BEEtag60) to characterize behavioral variation across entirecolonies of bumble bees (Bombus impatiens) and explore its rolein flexible colony task allocation. Bumble bees live in relativelysmall (~50–200 workers) and simple (i.e., lacking clearly distin-guishable worker castes) colonies. While there is evidence thatcertain colony tasks (such as foraging) are related to body mass56,bumble bee colonies are characterized by weak division of labor61
and do not display clear patterns of age-based polyethism62
present in honey bees and many ants. While bumble bees lack thesophisticated communication of the honey bee waggle dance,several sources of local information flow affect foraging activityamong workers, including olfactory and tactile cues gained fromnestmates63, information on colony nutritional status from foodstorage pots18, and direct hunger signals from larvae47.
We first test the hypothesis that bumble bee colonies activelyrespond to removal of foragers by flexible task reallocation amongworkers. We then examine the relationship between workerforaging activity and behavior within the nest. Specifically, weinvestigate (a) how the variation in worker nest behavior is
ARTICLE NATURE COMMUNICATIONS | DOI: 10.1038/s41467-018-03561-w
2 NATURE COMMUNICATIONS | (2018) 9:1201 | DOI: 10.1038/s41467-018-03561-w |www.nature.com/naturecommunications

organized (i.e., its correlation structure), (b) how it variesamong individuals, and (c) the relationship between foragingactivity and nest behavior in undisturbed colonies. We then testthe hypotheses that (a) spatial fidelity of nest workers drivescertain individuals to initiate foraging by biasing access tospatially localized nest information, and that (b) switching toforaging subsequently alters patterns of locomotor activity ofworkers within the nest.
ResultsCollection of worker behavioral data. We recorded 1.27 millionnest behavior sequences and 26,511 foraging transits from 1717individual Bombus impatiens workers, living in 19 colonies andforaging freely in the outdoor environment in Bedford, MAbetween July and October 2015 (Fig. 1a). For each colony, spatiallocations and body orientations of uniquely identified workerswithin the nest were tracked regularly over 5-s intervals (Sup-plementary Movie 1) ~140 times daily (or about once every 10min), 24 h per day, for up to 2 weeks, while foraging transits intoand out of the nest were recorded with a motion-activated camera(Fig. 1a, Supplementary Movie 2).
Automated classification of task performance. We combinedmovement and location information of individual workers with
spatial-mapping of key nest components (i.e., developing eggs,larvae, and pupae, wax pots for food storage, etc.; SupplementaryMovie 3) to identify task performance of individual workerswithin the nest (Fig. 1b) at each time interval using four broadtask groupings: (1) foraging, (2) nursing, (3) patrolling, or (4)inactivity. Automated classification of the three nest tasks (i.e.,nursing, patrolling, and inactivity) had strong overall agreementwith a human observer (86%, see Supplementary Table 2). Thetime each bee spent foraging was estimated by monitoring tran-sits of individuals workers through the foraging tunnel connect-ing the nest chamber to the outdoor environments (Fig. 1a, seeMethods for details). Individual bees frequently switched betweentasks (Fig. 1b), with the vast majority (95%) of workers per-forming tasks related to at least three of the four tasks on a givenday, and nearly all (99.7%) bees performing at least two differenttasks each day.
Despite high levels of task flexibility, individual workersnonetheless showed strongly repeatable patterns of task propen-sity. Specifically, the amount of time spent on each individual taskwas repeatable from day to day, even though workers performedmultiple tasks each day (Fig. 1c–f, one-way ANOVA; proportionof time nursing, df= 1132, F= 5.64, p < 10–16; proportion of timeforaging, df= 1132, F= 4.75, p < 10–16; proportion of timeinactive, df= 1132, F= 4.49, p < 10–16; proportion of timepatrolling, df= 1132, I= 5.17, p < 10–16).
Individual
Colony Dayonly
Day + Night
Individual
c
e
g h
f
a
b
To outdoor environment
Forager transittunnelNest
chamber
Nest behavior Foraging activity
00:00 06:00 12:00 18:00 00:00 06:00 12:00 18:00 00:00
Time
Day 1 Day 2
ForagingInactivePatrollingNursing
Indi
vidu
al
Individual
0.0
1.0
0.0
For
agin
g(p
ropo
rtio
n)P
atro
lling
(pro
port
ion)
Nur
sing
(pro
port
ion)
Inac
tive
(pro
port
ion)
1.0
Individual
d
0.0
1.0
0.0
1.0
Spe
cial
izat
ion
(DO
L ind)
Spe
cial
izat
ion
(DO
L ind)
Published range
0.10
0.20
0.30
0.40
0.10
0.20
0.30
0.40*
Time-10:57:18
Fig. 1 Automated behavioral tracking and task classification in bumble bee colonies. a Schematic diagram (above) and sample images from within the nest(left, orange) and the foraging tunnel (right, red), showing tracked individual BEEtags in green. b Representative traces of task performance from sevenindividual bees over 2 days from a single colony. Vertical lines indicate timesteps during which bees were foraging (F, red), inactive (I, blue), patrolling/cleaning (P, green), or nursing (N, orange). c–f Proportion of time spent engaged in different tasks by individual workers from the same representativecolony. Boxplots in c–f show values for individual workers. Individuals are ordered in each plot according to the mean proportion of time spent performingthat task. gWorker specialization (DOLind) values by colony. Filled purple markers show total estimates of each metric for each colony (i.e., combining datafrom all experimental days) and purple shaded box shows the range of published values across four colonies from the same species using manual taskclassification61. Gray boxplots show data when division of labor metrics are calculated for each experimental day separately. h Purple boxplots show totalworker specialization values for each colony when only task performance from daytime hours is considered (“Day only”), vs. when round-the-clock data areincluded (“Day+Night”). Gray lines connect values for individual colonies. Throughout, boxplots show the median and inter-quartile range (IQR), whilewhiskers depict the data range (75th and 25th ±1.5*IQR, respectively)
NATURE COMMUNICATIONS | DOI: 10.1038/s41467-018-03561-w ARTICLE
NATURE COMMUNICATIONS | (2018) 9:1201 | DOI: 10.1038/s41467-018-03561-w |www.nature.com/naturecommunications 3
We quantified the specialization of workers to colony tasks(DOLind) using Gorelick’s normalized mutual entropy method64,and compared these values to published data for B. impatiens61
(Fig. 1g, h). Worker specialization measured using dataexclusively from during daylight hours was consistent with thesepublished values61 (Fig. 1g, h). In addition to calculating totalworker specialization for each colony by pooling behavioral dataacross all experimental days, we calculated worker specializationvalues for each colony separately on each experimental day(Fig. 1g). Colonies showed variation in the degree of workerspecialization that was stable across days (Fig. 1g; DOLind, one-way ANOVA, df= 16, F= 4.50, p= 8.9 × 10⁻⁷) and not related tocolony size (DOLind vs. colony size, linear regression, df= 15, t=−0.031 p= 0.98).
To assess the importance of continuous (i.e., round-the-clock)behavioral tracking for quantifying division of labor, we alsocalculated total worker specialization scores separately for eachcolony while either excluding overnight task performance data (8 p.m.–6 a.m., Fig. 1h “Day only”), or including these data (Fig. 1h,“Day+Night”). Including overnight behavioral significantlyreduced worker specialization values across colonies (Fig. 1h).
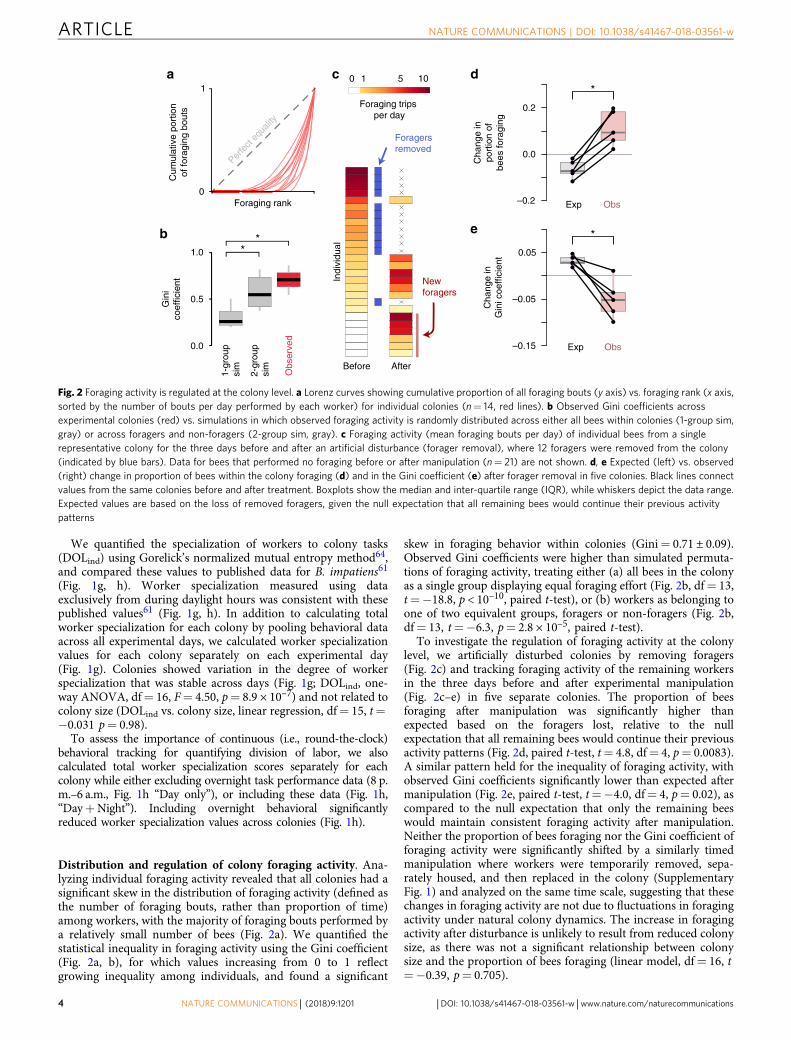
Distribution and regulation of colony foraging activity. Ana-lyzing individual foraging activity revealed that all colonies had asignificant skew in the distribution of foraging activity (defined asthe number of foraging bouts, rather than proportion of time)among workers, with the majority of foraging bouts performed bya relatively small number of bees (Fig. 2a). We quantified thestatistical inequality in foraging activity using the Gini coefficient(Fig. 2a, b), for which values increasing from 0 to 1 reflectgrowing inequality among individuals, and found a significant
skew in foraging behavior within colonies (Gini= 0.71 ± 0.09).Observed Gini coefficients were higher than simulated permuta-tions of foraging activity, treating either (a) all bees in the colonyas a single group displaying equal foraging effort (Fig. 2b, df= 13,t=−18.8, p < 10–10, paired t-test), or (b) workers as belonging toone of two equivalent groups, foragers or non-foragers (Fig. 2b,df= 13, t=−6.3, p= 2.8 × 10⁻⁵, paired t-test).
To investigate the regulation of foraging activity at the colonylevel, we artificially disturbed colonies by removing foragers(Fig. 2c) and tracking foraging activity of the remaining workersin the three days before and after experimental manipulation(Fig. 2c–e) in five separate colonies. The proportion of beesforaging after manipulation was significantly higher thanexpected based on the foragers lost, relative to the nullexpectation that all remaining bees would continue their previousactivity patterns (Fig. 2d, paired t-test, t= 4.8, df= 4, p= 0.0083).A similar pattern held for the inequality of foraging activity, withobserved Gini coefficients significantly lower than expected aftermanipulation (Fig. 2e, paired t-test, t=−4.0, df= 4, p= 0.02), ascompared to the null expectation that only the remaining beeswould maintain consistent foraging activity after manipulation.Neither the proportion of bees foraging nor the Gini coefficient offoraging activity were significantly shifted by a similarly timedmanipulation where workers were temporarily removed, sepa-rately housed, and then replaced in the colony (SupplementaryFig. 1) and analyzed on the same time scale, suggesting that thesechanges in foraging activity are not due to fluctuations in foragingactivity under natural colony dynamics. The increase in foragingactivity after disturbance is unlikely to result from reduced colonysize, as there was not a significant relationship between colonysize and the proportion of bees foraging (linear model, df= 16, t=−0.39, p= 0.705).
0
1
Foraging rank
Cum
ulat
ive
port
ion
of fo
ragi
ng b
outs
Gin
ico
effic
ient
0.0
0.5
1.0*
*2-
grou
psi
m
Obs
erve
d
1-gr
oup
sim
Cha
nge
inpo
rtio
n of
bees
fora
ging
–0.2
0.0
0.2
*
*
Cha
nge
inG
ini c
oeffi
cien
t
–0.15
–0.05
0.05
Perfe
ct eq
uality
Foragers removed
Newforagers
Indi
vidu
al
Before After
10 5 10
Foraging trips per day
a c d
eb
Exp Obs
Exp Obs
Fig. 2 Foraging activity is regulated at the colony level. a Lorenz curves showing cumulative proportion of all foraging bouts (y axis) vs. foraging rank (x axis,sorted by the number of bouts per day performed by each worker) for individual colonies (n= 14, red lines). b Observed Gini coefficients acrossexperimental colonies (red) vs. simulations in which observed foraging activity is randomly distributed across either all bees within colonies (1-group sim,gray) or across foragers and non-foragers (2-group sim, gray). c Foraging activity (mean foraging bouts per day) of individual bees from a singlerepresentative colony for the three days before and after an artificial disturbance (forager removal), where 12 foragers were removed from the colony(indicated by blue bars). Data for bees that performed no foraging before or after manipulation (n= 21) are not shown. d, e Expected (left) vs. observed(right) change in proportion of bees within the colony foraging (d) and in the Gini coefficient (e) after forager removal in five colonies. Black lines connectvalues from the same colonies before and after treatment. Boxplots show the median and inter-quartile range (IQR), while whiskers depict the data range.Expected values are based on the loss of removed foragers, given the null expectation that all remaining bees would continue their previous activitypatterns
ARTICLE NATURE COMMUNICATIONS | DOI: 10.1038/s41467-018-03561-w
4 NATURE COMMUNICATIONS | (2018) 9:1201 | DOI: 10.1038/s41467-018-03561-w |www.nature.com/naturecommunications
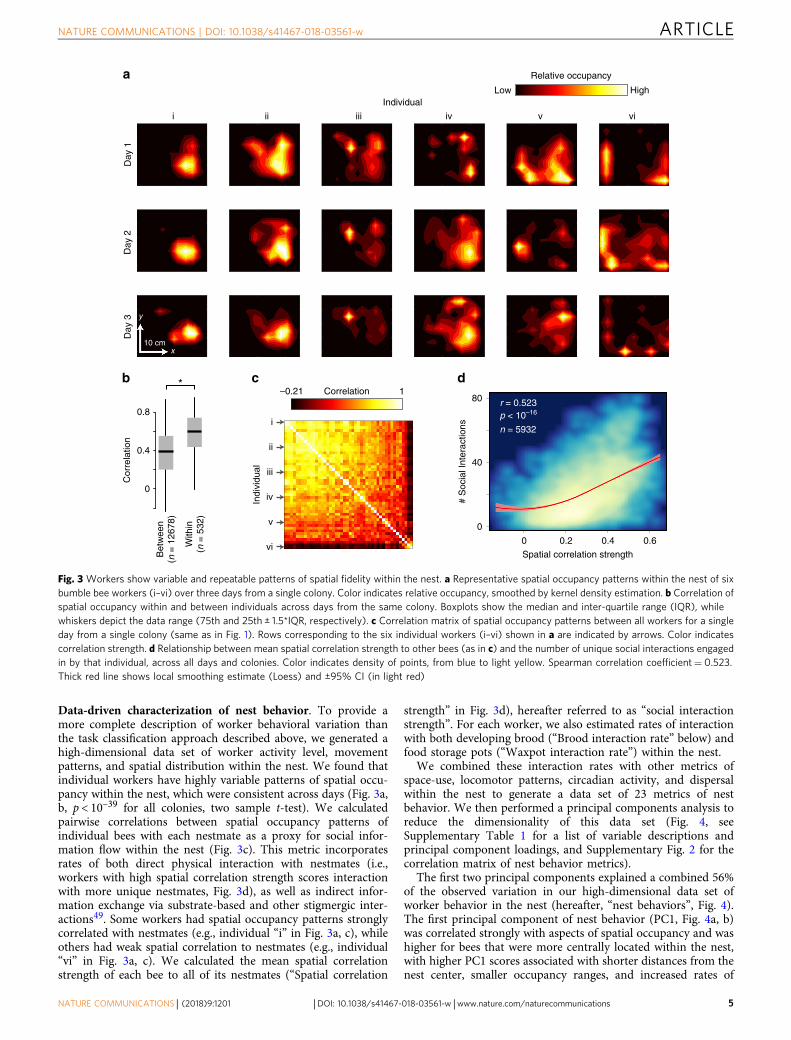
Data-driven characterization of nest behavior. To provide amore complete description of worker behavioral variation thanthe task classification approach described above, we generated ahigh-dimensional data set of worker activity level, movementpatterns, and spatial distribution within the nest. We found thatindividual workers have highly variable patterns of spatial occu-pancy within the nest, which were consistent across days (Fig. 3a,b, p < 10–39 for all colonies, two sample t-test). We calculatedpairwise correlations between spatial occupancy patterns ofindividual bees with each nestmate as a proxy for social infor-mation flow within the nest (Fig. 3c). This metric incorporatesrates of both direct physical interaction with nestmates (i.e.,workers with high spatial correlation strength scores interactionwith more unique nestmates, Fig. 3d), as well as indirect infor-mation exchange via substrate-based and other stigmergic inter-actions49. Some workers had spatial occupancy patterns stronglycorrelated with nestmates (e.g., individual “i” in Fig. 3a, c), whileothers had weak spatial correlation to nestmates (e.g., individual“vi” in Fig. 3a, c). We calculated the mean spatial correlationstrength of each bee to all of its nestmates (“Spatial correlation
strength” in Fig. 3d), hereafter referred to as “social interactionstrength”. For each worker, we also estimated rates of interactionwith both developing brood (“Brood interaction rate” below) andfood storage pots (“Waxpot interaction rate”) within the nest.
We combined these interaction rates with other metrics ofspace-use, locomotor patterns, circadian activity, and dispersalwithin the nest to generate a data set of 23 metrics of nestbehavior. We then performed a principal components analysis toreduce the dimensionality of this data set (Fig. 4, seeSupplementary Table 1 for a list of variable descriptions andprincipal component loadings, and Supplementary Fig. 2 for thecorrelation matrix of nest behavior metrics).
The first two principal components explained a combined 56%of the observed variation in our high-dimensional data set ofworker behavior in the nest (hereafter, “nest behaviors”, Fig. 4).The first principal component of nest behavior (PC1, Fig. 4a, b)was correlated strongly with aspects of spatial occupancy and washigher for bees that were more centrally located within the nest,with higher PC1 scores associated with shorter distances from thenest center, smaller occupancy ranges, and increased rates of
c d
i
ii
iii
vi
v
iv
–0.21 1Correlationb
a Relative occupancy
Low High
Spatial correlation strength
# S
ocia
l Int
erac
tions
Indi
vidu
al
i ii iii iv v viD
ay 1
Day
2D
ay 3
Individual
0
0 0.2 0.4 0.6
40
80 r = 0.523p < 10–16
n = 5932
x
y
10 cm
Cor
rela
tion
Bet
wee
n(n
= 1
2678
)
With
in(n
= 5
32)
0
0.4
0.8
*
Fig. 3 Workers show variable and repeatable patterns of spatial fidelity within the nest. a Representative spatial occupancy patterns within the nest of sixbumble bee workers (i–vi) over three days from a single colony. Color indicates relative occupancy, smoothed by kernel density estimation. b Correlation ofspatial occupancy within and between individuals across days from the same colony. Boxplots show the median and inter-quartile range (IQR), whilewhiskers depict the data range (75th and 25th ± 1.5*IQR, respectively). c Correlation matrix of spatial occupancy patterns between all workers for a singleday from a single colony (same as in Fig. 1). Rows corresponding to the six individual workers (i–vi) shown in a are indicated by arrows. Color indicatescorrelation strength. d Relationship between mean spatial correlation strength to other bees (as in c) and the number of unique social interactions engagedin by that individual, across all days and colonies. Color indicates density of points, from blue to light yellow. Spearman correlation coefficient= 0.523.Thick red line shows local smoothing estimate (Loess) and ±95% CI (in light red)
NATURE COMMUNICATIONS | DOI: 10.1038/s41467-018-03561-w ARTICLE
NATURE COMMUNICATIONS | (2018) 9:1201 | DOI: 10.1038/s41467-018-03561-w |www.nature.com/naturecommunications 5

interaction with developing brood, food storage pots, andnestmates, among others (Fig. 4a, b).
In contrast, the second principal component of nest behavior(PC2, Fig. 4) had stronger loading from metrics of mobilitypatterns (“Locomotor speed and movement patterns” and“Circadian activity” metrics in Fig. 4) and was higher in beesthat tended to be more mobile. Specifically, higher PC2 scoreswere associated with higher proportions of time spent mobile andinstantaneous movement speeds, greater long-term spatialdisplacement within the nest, and decreased circadian activityscope (i.e., smaller differences between the proportion of timespent active during the day and at night).
Both PC1 and PC2 had strong loading from a suite ofbehavioral metrics associated with social interactivity (Fig. 4a),including spatial correlation strength to nestmates, as well asproximity to and proportion of time spent on the brood, ratherthan on the waxpots. Higher PC1 scores (i.e., more physicallycentral) and higher PC2 scores (i.e., higher locomotor activitylevel) were both associated with increased interaction withnestmates and brood (Fig. 4a, Supplementary Fig. 2).
Individual workers showed significant repeatability for bothprincipal components of nest behavior across days (Fig. 4b, c,PC1, one-way ANOVA, df= 1297, F= 5.5, p < 10–16; PC2, one-way ANOVA, df= 1297, F= 2.2, p < 10–16). Hereafter, we use the
0
100
Rint,BR
DBR, nearest
PBR, day
Corspat, frgr
Corspat, all
Corspat,nfrgr
PBR, night
Rint,WP
DWP, nearest
DBR, all
DWP, all
Dcent, night
Dcent, day
RA50
RA90
Pact,day
Circstr
Pact, night
Speedmov
Devspeed
Dispbw ts
Dispnest occ
Gininest occ
–0.3 0.3
Loading
PC
1
Beh
avio
ral m
etric
PC
2
Spa
tial c
entr
ality
PC
(PC
1, 3
4 %
var
)
Spa
tial c
entr
ality
PC
Loco
mot
or a
ctiv
ity P
C(P
C2,
22
% v
ar)
Loco
mot
or a
ctiv
ity P
C
Individual
One-way ANOVAp < 10–16
One-way ANOVAp < 10–16
Individual
a b
c e g
d f
–5
0
5
–5
0
5
Body mass (mg)
Body mass (mg)
50 100 150 200 250 300
–5
0
5
10 R2 = 0.0098p = 4.5x10⁻⁸
50 100 150 200 250 300
−8
−4
0
4
R2 = 0.0051p = 8.3x10⁻⁵
Con
trib
utio
n to
spat
ial c
entr
ality
varia
nce
(% T
otal
)
Con
trib
utio
n to
loco
mot
or a
ctiv
ity P
Cva
rianc
e (%
Tot
al)
0
100
Bod
y m
ass
Indi
vidu
al
Day
Col
ony
Loca
tion
Bod
y m
ass
Indi
vidu
al
Day
Col
ony
Loca
tion
Nestmateinteractions
Spatialcentrality
Broodinteractions
Circadianactivity
Locomotorspeed and movement
0.48
82.1
0.32
16.55
0.57
0.13
62.1
11.219.6
6.91
Fig. 4 Bumble bee workers show strong individual variation in nest behavior that is stable across days and not associated with body size. a Loadings ofindividual behavioral metrics on Principal Components 1 and 2, with color indicating direction and strength of loading. Labels indicate clusters of correlatedvariables (Supplementary Fig. 3). b,c PC1 (“Spatial centrality” (b)) and PC2 (“Locomotor activity” (c)) scores across days for all individuals. Boxplots showthe median (black marker) and inter-quartile range (IQR, gray bars) for each worker’s score across days, with individuals arranged according to medianvalues. c,d Relationship between body mass and PC1 (d) and PC2 (e). Transparent filled markers show data for individual workers on different days, and R2
and p values are calculated from a linear regression (red line). f,g Relative contribution of body size (mass, mg), individual, day, colony, and experimentallocation to variance in PC1 (f) and PC2 (g) scores in undisturbed colonies. Values represent the relative contribution (% of explained variance) usinghierarchical partitioning
Mas
s (m
g)
50
150
250
Spa
tial c
entr
ality
PC
–5
0
5
*** *** **
Loco
mot
or a
ctiv
ity P
C
–4
–2
0
2
4
a b c
Non-forager
ForagerNon
-foragerForager
Non-forager
Forager
Fig. 5 Foraging is correlated with body mass and nest behavior in undisturbed colonies. Beeswarm plots of body mass (mg, a), spatial centrality score (b,PC1), and locomotor activity score (c, PC2) by foraging status (forager vs. non-forager) in undisturbed colonies. Filled points show data for individualworkers on unique days, and thick lines show median values for each group. **p < 0.005, and **p < 0.0005 in a generalized linear mixed-effects model
ARTICLE NATURE COMMUNICATIONS | DOI: 10.1038/s41467-018-03561-w
6 NATURE COMMUNICATIONS | (2018) 9:1201 | DOI: 10.1038/s41467-018-03561-w |www.nature.com/naturecommunications
terms “Spatial Centrality PC” and “Locomotor Activity PC” inplace of “PC1” and “PC2”, respectively, for simplicity. BothSpatial Centrality PC and Locomotor Activity PC scores had avery weak (while statistically significant, Fig. 4d, e) relationshipwith body size, explaining less than 1% of variance in eitherprincipal component (Fig. 4d–g). The majority of variation innest behavior in both principal components appears to resultfrom stable variation among individuals that is not stronglyrelated to body size, experimental day, colony, or experimentallocation (Fig. 4f-g).
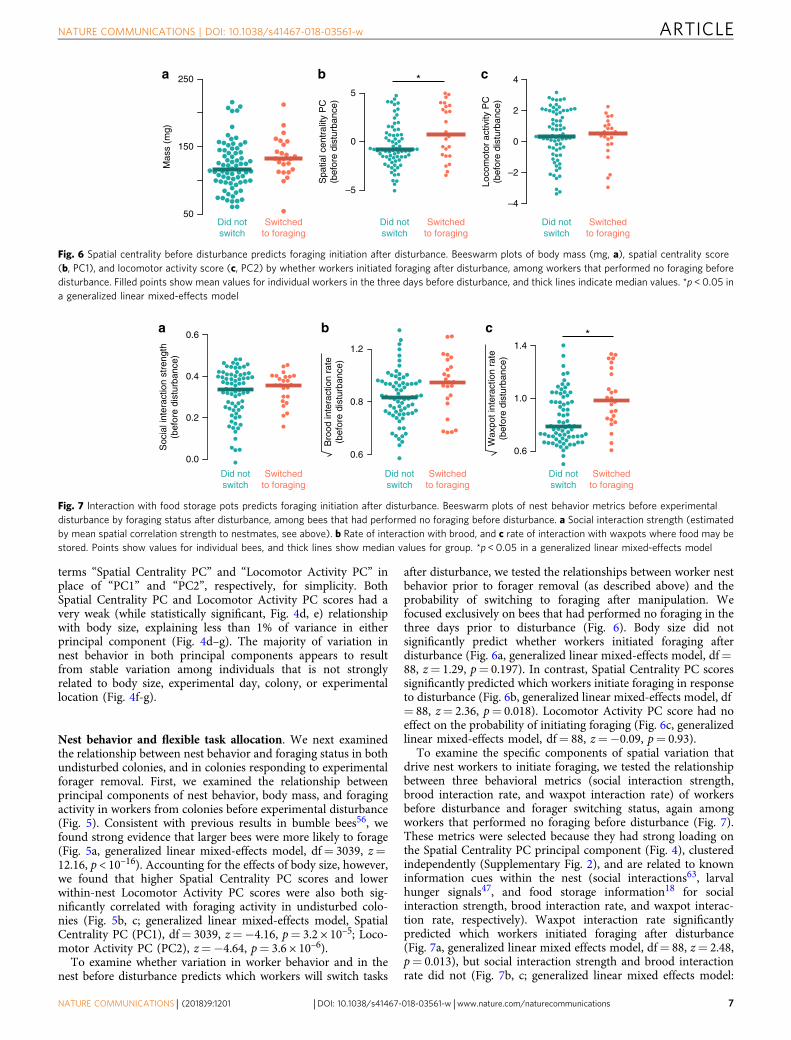
Nest behavior and flexible task allocation. We next examinedthe relationship between nest behavior and foraging status in bothundisturbed colonies, and in colonies responding to experimentalforager removal. First, we examined the relationship betweenprincipal components of nest behavior, body mass, and foragingactivity in workers from colonies before experimental disturbance(Fig. 5). Consistent with previous results in bumble bees56, wefound strong evidence that larger bees were more likely to forage(Fig. 5a, generalized linear mixed-effects model, df= 3039, z=12.16, p < 10–16). Accounting for the effects of body size, however,we found that higher Spatial Centrality PC scores and lowerwithin-nest Locomotor Activity PC scores were also both sig-nificantly correlated with foraging activity in undisturbed colo-nies (Fig. 5b, c; generalized linear mixed-effects model, SpatialCentrality PC (PC1), df= 3039, z=−4.16, p= 3.2 × 10⁻⁵; Loco-motor Activity PC (PC2), z=−4.64, p= 3.6 × 10⁻⁶).
To examine whether variation in worker behavior and in thenest before disturbance predicts which workers will switch tasks
after disturbance, we tested the relationships between worker nestbehavior prior to forager removal (as described above) and theprobability of switching to foraging after manipulation. Wefocused exclusively on bees that had performed no foraging in thethree days prior to disturbance (Fig. 6). Body size did notsignificantly predict whether workers initiated foraging afterdisturbance (Fig. 6a, generalized linear mixed-effects model, df=88, z= 1.29, p= 0.197). In contrast, Spatial Centrality PC scoressignificantly predicted which workers initiate foraging in responseto disturbance (Fig. 6b, generalized linear mixed-effects model, df= 88, z= 2.36, p= 0.018). Locomotor Activity PC score had noeffect on the probability of initiating foraging (Fig. 6c, generalizedlinear mixed-effects model, df= 88, z=−0.09, p= 0.93).
To examine the specific components of spatial variation thatdrive nest workers to initiate foraging, we tested the relationshipbetween three behavioral metrics (social interaction strength,brood interaction rate, and waxpot interaction rate) of workersbefore disturbance and forager switching status, again amongworkers that performed no foraging before disturbance (Fig. 7).These metrics were selected because they had strong loading onthe Spatial Centrality PC principal component (Fig. 4), clusteredindependently (Supplementary Fig. 2), and are related to knowninformation cues within the nest (social interactions63, larvalhunger signals47, and food storage information18 for socialinteraction strength, brood interaction rate, and waxpot interac-tion rate, respectively). Waxpot interaction rate significantlypredicted which workers initiated foraging after disturbance(Fig. 7a, generalized linear mixed effects model, df= 88, z= 2.48,p= 0.013), but social interaction strength and brood interactionrate did not (Fig. 7b, c; generalized linear mixed effects model:
Mas
s (m
g)
50
150
250
Spa
tial c
entr
ality
PC
(bef
ore
dist
urba
nce)
–5
0
5*
Loco
mot
or a
ctiv
ity P
C(b
efor
e di
stur
banc
e)
–4
–2
0
2
4a b c
Did notswitch
Switchedto foraging
Did notswitch
Switchedto foraging
Did notswitch
Switchedto foraging
Fig. 6 Spatial centrality before disturbance predicts foraging initiation after disturbance. Beeswarm plots of body mass (mg, a), spatial centrality score(b, PC1), and locomotor activity score (c, PC2) by whether workers initiated foraging after disturbance, among workers that performed no foraging beforedisturbance. Filled points show mean values for individual workers in the three days before disturbance, and thick lines indicate median values. *p < 0.05 ina generalized linear mixed-effects model
a b c
Soc
ial i
nter
actio
n st
reng
th(b
efor
e di
stur
banc
e)
0.8
0.6
1.2
0.6
1.0
1.4*
Did notswitch
Switchedto foraging
Did notswitch
Switchedto foraging
Did notswitch
Switchedto foraging
0.0
0.2
0.4
0.6B
rood
inte
ract
ion
rate
(bef
ore
dist
urba
nce)
Wax
pot i
nter
actio
n ra
te(b
efor
e di
stur
banc
e)Fig. 7 Interaction with food storage pots predicts foraging initiation after disturbance. Beeswarm plots of nest behavior metrics before experimentaldisturbance by foraging status after disturbance, among bees that had performed no foraging before disturbance. a Social interaction strength (estimatedby mean spatial correlation strength to nestmates, see above). b Rate of interaction with brood, and c rate of interaction with waxpots where food may bestored. Points show values for individual bees, and thick lines show median values for group. *p < 0.05 in a generalized linear mixed-effects model
NATURE COMMUNICATIONS | DOI: 10.1038/s41467-018-03561-w ARTICLE
NATURE COMMUNICATIONS | (2018) 9:1201 | DOI: 10.1038/s41467-018-03561-w |www.nature.com/naturecommunications 7
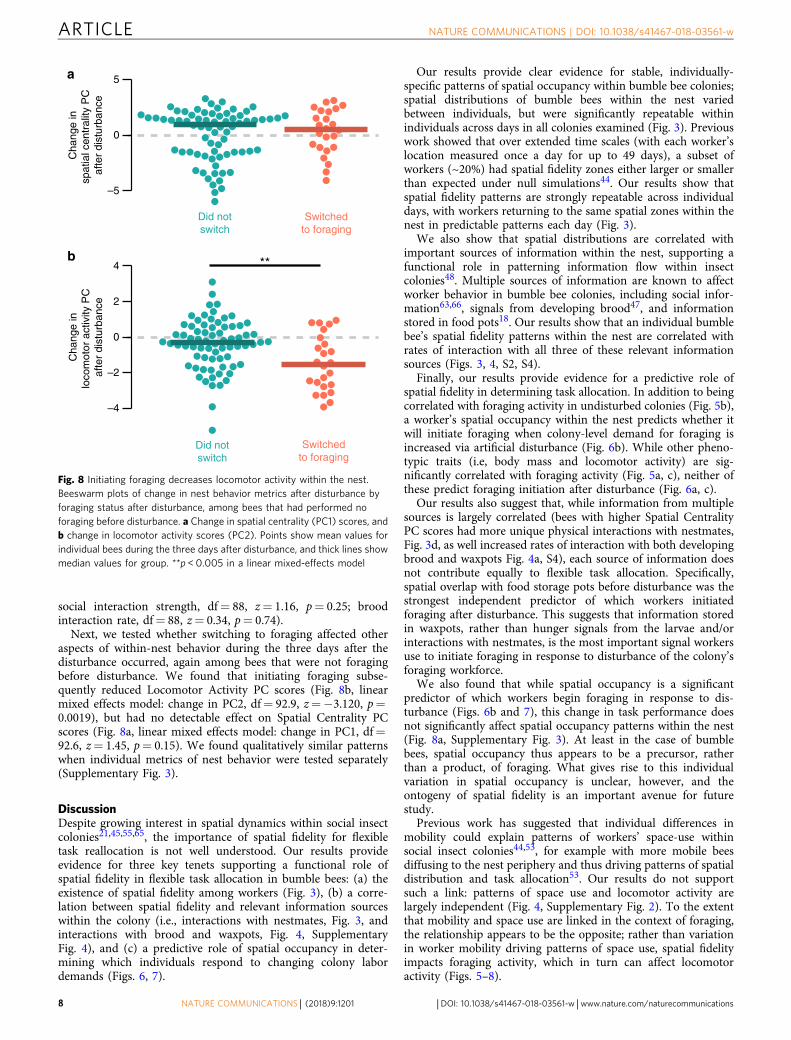
social interaction strength, df= 88, z= 1.16, p= 0.25; broodinteraction rate, df= 88, z= 0.34, p= 0.74).
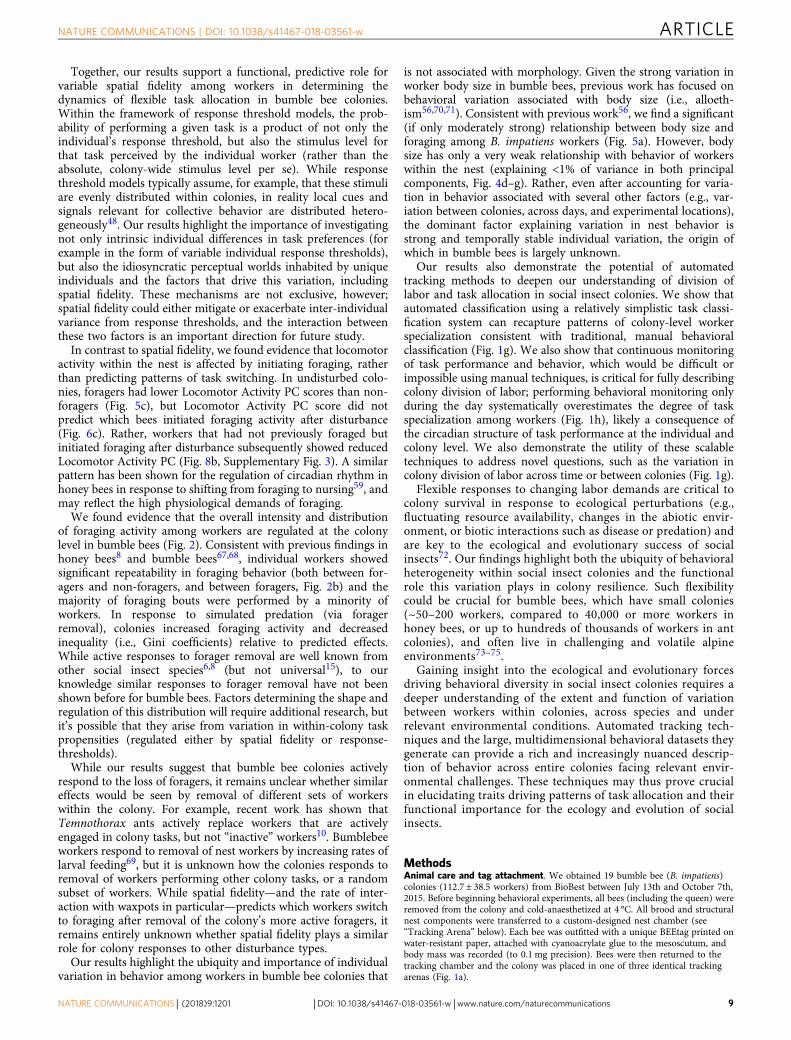
Next, we tested whether switching to foraging affected otheraspects of within-nest behavior during the three days after thedisturbance occurred, again among bees that were not foragingbefore disturbance. We found that initiating foraging subse-quently reduced Locomotor Activity PC scores (Fig. 8b, linearmixed effects model: change in PC2, df= 92.9, z=−3.120, p=0.0019), but had no detectable effect on Spatial Centrality PCscores (Fig. 8a, linear mixed effects model: change in PC1, df=92.6, z= 1.45, p= 0.15). We found qualitatively similar patternswhen individual metrics of nest behavior were tested separately(Supplementary Fig. 3).
DiscussionDespite growing interest in spatial dynamics within social insectcolonies21,45,55,65, the importance of spatial fidelity for flexibletask reallocation is not well understood. Our results provideevidence for three key tenets supporting a functional role ofspatial fidelity in flexible task allocation in bumble bees: (a) theexistence of spatial fidelity among workers (Fig. 3), (b) a corre-lation between spatial fidelity and relevant information sourceswithin the colony (i.e., interactions with nestmates, Fig. 3, andinteractions with brood and waxpots, Fig. 4, SupplementaryFig. 4), and (c) a predictive role of spatial occupancy in deter-mining which individuals respond to changing colony labordemands (Figs. 6, 7).
Our results provide clear evidence for stable, individually-specific patterns of spatial occupancy within bumble bee colonies;spatial distributions of bumble bees within the nest variedbetween individuals, but were significantly repeatable withinindividuals across days in all colonies examined (Fig. 3). Previouswork showed that over extended time scales (with each worker’slocation measured once a day for up to 49 days), a subset ofworkers (~20%) had spatial fidelity zones either larger or smallerthan expected under null simulations44. Our results show thatspatial fidelity patterns are strongly repeatable across individualdays, with workers returning to the same spatial zones within thenest in predictable patterns each day (Fig. 3).
We also show that spatial distributions are correlated withimportant sources of information within the nest, supporting afunctional role in patterning information flow within insectcolonies48. Multiple sources of information are known to affectworker behavior in bumble bee colonies, including social infor-mation63,66, signals from developing brood47, and informationstored in food pots18. Our results show that an individual bumblebee’s spatial fidelity patterns within the nest are correlated withrates of interaction with all three of these relevant informationsources (Figs. 3, 4, S2, S4).
Finally, our results provide evidence for a predictive role ofspatial fidelity in determining task allocation. In addition to beingcorrelated with foraging activity in undisturbed colonies (Fig. 5b),a worker’s spatial occupancy within the nest predicts whether itwill initiate foraging when colony-level demand for foraging isincreased via artificial disturbance (Fig. 6b). While other pheno-typic traits (i.e, body mass and locomotor activity) are sig-nificantly correlated with foraging activity (Fig. 5a, c), neither ofthese predict foraging initiation after disturbance (Fig. 6a, c).
Our results also suggest that, while information from multiplesources is largely correlated (bees with higher Spatial CentralityPC scores had more unique physical interactions with nestmates,Fig. 3d, as well increased rates of interaction with both developingbrood and waxpots Fig. 4a, S4), each source of information doesnot contribute equally to flexible task allocation. Specifically,spatial overlap with food storage pots before disturbance was thestrongest independent predictor of which workers initiatedforaging after disturbance. This suggests that information storedin waxpots, rather than hunger signals from the larvae and/orinteractions with nestmates, is the most important signal workersuse to initiate foraging in response to disturbance of the colony’sforaging workforce.
We also found that while spatial occupancy is a significantpredictor of which workers begin foraging in response to dis-turbance (Figs. 6b and 7), this change in task performance doesnot significantly affect spatial occupancy patterns within the nest(Fig. 8a, Supplementary Fig. 3). At least in the case of bumblebees, spatial occupancy thus appears to be a precursor, ratherthan a product, of foraging. What gives rise to this individualvariation in spatial occupancy is unclear, however, and theontogeny of spatial fidelity is an important avenue for futurestudy.
Previous work has suggested that individual differences inmobility could explain patterns of workers’ space-use withinsocial insect colonies44,53, for example with more mobile beesdiffusing to the nest periphery and thus driving patterns of spatialdistribution and task allocation53. Our results do not supportsuch a link: patterns of space use and locomotor activity arelargely independent (Fig. 4, Supplementary Fig. 2). To the extentthat mobility and space use are linked in the context of foraging,the relationship appears to be the opposite; rather than variationin worker mobility driving patterns of space use, spatial fidelityimpacts foraging activity, which in turn can affect locomotoractivity (Figs. 5–8).
a
b
Cha
nge
insp
atia
l cen
tral
ity P
C
afte
r di
stur
banc
e
Cha
nge
inlo
com
otor
act
ivity
PC
af
ter
dist
urba
nce
–5
0
5
–4
–2
0
2
4 **
Did notswitch
Switchedto foraging
Did notswitch
Switchedto foraging
Fig. 8 Initiating foraging decreases locomotor activity within the nest.Beeswarm plots of change in nest behavior metrics after disturbance byforaging status after disturbance, among bees that had performed noforaging before disturbance. a Change in spatial centrality (PC1) scores, andb change in locomotor activity scores (PC2). Points show mean values forindividual bees during the three days after disturbance, and thick lines showmedian values for group. **p < 0.005 in a linear mixed-effects model
ARTICLE NATURE COMMUNICATIONS | DOI: 10.1038/s41467-018-03561-w
8 NATURE COMMUNICATIONS | (2018) 9:1201 | DOI: 10.1038/s41467-018-03561-w |www.nature.com/naturecommunications
Together, our results support a functional, predictive role forvariable spatial fidelity among workers in determining thedynamics of flexible task allocation in bumble bee colonies.Within the framework of response threshold models, the prob-ability of performing a given task is a product of not only theindividual’s response threshold, but also the stimulus level forthat task perceived by the individual worker (rather than theabsolute, colony-wide stimulus level per se). While responsethreshold models typically assume, for example, that these stimuliare evenly distributed within colonies, in reality local cues andsignals relevant for collective behavior are distributed hetero-geneously48. Our results highlight the importance of investigatingnot only intrinsic individual differences in task preferences (forexample in the form of variable individual response thresholds),but also the idiosyncratic perceptual worlds inhabited by uniqueindividuals and the factors that drive this variation, includingspatial fidelity. These mechanisms are not exclusive, however;spatial fidelity could either mitigate or exacerbate inter-individualvariance from response thresholds, and the interaction betweenthese two factors is an important direction for future study.
In contrast to spatial fidelity, we found evidence that locomotoractivity within the nest is affected by initiating foraging, ratherthan predicting patterns of task switching. In undisturbed colo-nies, foragers had lower Locomotor Activity PC scores than non-foragers (Fig. 5c), but Locomotor Activity PC score did notpredict which bees initiated foraging activity after disturbance(Fig. 6c). Rather, workers that had not previously foraged butinitiated foraging after disturbance subsequently showed reducedLocomotor Activity PC (Fig. 8b, Supplementary Fig. 3). A similarpattern has been shown for the regulation of circadian rhythm inhoney bees in response to shifting from foraging to nursing59, andmay reflect the high physiological demands of foraging.
We found evidence that the overall intensity and distributionof foraging activity among workers are regulated at the colonylevel in bumble bees (Fig. 2). Consistent with previous findings inhoney bees8 and bumble bees67,68, individual workers showedsignificant repeatability in foraging behavior (both between for-agers and non-foragers, and between foragers, Fig. 2b) and themajority of foraging bouts were performed by a minority ofworkers. In response to simulated predation (via foragerremoval), colonies increased foraging activity and decreasedinequality (i.e., Gini coefficients) relative to predicted effects.While active responses to forager removal are well known fromother social insect species6,8 (but not universal15), to ourknowledge similar responses to forager removal have not beenshown before for bumble bees. Factors determining the shape andregulation of this distribution will require additional research, butit’s possible that they arise from variation in within-colony taskpropensities (regulated either by spatial fidelity or response-thresholds).
While our results suggest that bumble bee colonies activelyrespond to the loss of foragers, it remains unclear whether similareffects would be seen by removal of different sets of workerswithin the colony. For example, recent work has shown thatTemnothorax ants actively replace workers that are activelyengaged in colony tasks, but not “inactive” workers10. Bumblebeeworkers respond to removal of nest workers by increasing rates oflarval feeding69, but it is unknown how the colonies responds toremoval of workers performing other colony tasks, or a randomsubset of workers. While spatial fidelity—and the rate of inter-action with waxpots in particular—predicts which workers switchto foraging after removal of the colony’s more active foragers, itremains entirely unknown whether spatial fidelity plays a similarrole for colony responses to other disturbance types.
Our results highlight the ubiquity and importance of individualvariation in behavior among workers in bumble bee colonies that
is not associated with morphology. Given the strong variation inworker body size in bumble bees, previous work has focused onbehavioral variation associated with body size (i.e., alloeth-ism56,70,71). Consistent with previous work56, we find a significant(if only moderately strong) relationship between body size andforaging among B. impatiens workers (Fig. 5a). However, bodysize has only a very weak relationship with behavior of workerswithin the nest (explaining <1% of variance in both principalcomponents, Fig. 4d–g). Rather, even after accounting for varia-tion in behavior associated with several other factors (e.g., var-iation between colonies, across days, and experimental locations),the dominant factor explaining variation in nest behavior isstrong and temporally stable individual variation, the origin ofwhich in bumble bees is largely unknown.
Our results also demonstrate the potential of automatedtracking methods to deepen our understanding of division oflabor and task allocation in social insect colonies. We show thatautomated classification using a relatively simplistic task classi-fication system can recapture patterns of colony-level workerspecialization consistent with traditional, manual behavioralclassification (Fig. 1g). We also show that continuous monitoringof task performance and behavior, which would be difficult orimpossible using manual techniques, is critical for fully describingcolony division of labor; performing behavioral monitoring onlyduring the day systematically overestimates the degree of taskspecialization among workers (Fig. 1h), likely a consequence ofthe circadian structure of task performance at the individual andcolony level. We also demonstrate the utility of these scalabletechniques to address novel questions, such as the variation incolony division of labor across time or between colonies (Fig. 1g).
Flexible responses to changing labor demands are critical tocolony survival in response to ecological perturbations (e.g.,fluctuating resource availability, changes in the abiotic envir-onment, or biotic interactions such as disease or predation) andare key to the ecological and evolutionary success of socialinsects72. Our findings highlight both the ubiquity of behavioralheterogeneity within social insect colonies and the functionalrole this variation plays in colony resilience. Such flexibilitycould be crucial for bumble bees, which have small colonies(~50–200 workers, compared to 40,000 or more workers inhoney bees, or up to hundreds of thousands of workers in antcolonies), and often live in challenging and volatile alpineenvironments73–75.
Gaining insight into the ecological and evolutionary forcesdriving behavioral diversity in social insect colonies requires adeeper understanding of the extent and function of variationbetween workers within colonies, across species and underrelevant environmental conditions. Automated tracking tech-niques and the large, multidimensional behavioral datasets theygenerate can provide a rich and increasingly nuanced descrip-tion of behavior across entire colonies facing relevant envir-onmental challenges. These techniques may thus prove crucialin elucidating traits driving patterns of task allocation and theirfunctional importance for the ecology and evolution of socialinsects.
MethodsAnimal care and tag attachment. We obtained 19 bumble bee (B. impatiens)colonies (112.7 ± 38.5 workers) from BioBest between July 13th and October 7th,2015. Before beginning behavioral experiments, all bees (including the queen) wereremoved from the colony and cold-anaesthetized at 4 °C. All brood and structuralnest components were transferred to a custom-designed nest chamber (see“Tracking Arena” below). Each bee was outfitted with a unique BEEtag printed onwater-resistant paper, attached with cyanoacrylate glue to the mesoscutum, andbody mass was recorded (to 0.1 mg precision). Bees were then returned to thetracking chamber and the colony was placed in one of three identical trackingarenas (Fig. 1a).
NATURE COMMUNICATIONS | DOI: 10.1038/s41467-018-03561-w ARTICLE
NATURE COMMUNICATIONS | (2018) 9:1201 | DOI: 10.1038/s41467-018-03561-w |www.nature.com/naturecommunications 9
Tracking arena. Three custom-designed, identical tracking arenas (Fig. 1a, 0.20 ×0.19 × 0.13 m) were used. The walls and floor of the nest chamber were constructedfrom laser-cut black acrylic, with a clear acrylic top. A monochrome digital camera(DMK 24UJ003, USB 3.0, Imaging Source, 3856 × 2764 pixels) with a wide-anglelens (Fujinon, 2.8–8 mm) was mounted on aluminum construction rails (25 mm,Thorlabs) above the clear top of the nest box. The nest was illuminated with redLED panels (Knema Lighting), which caused minimal disturbance to nest behaviorsince bees have very poor sensitivity to red light. The nest box, camera, and lightingarray were covered with black cloth to exclude ambient light.
Each nest chamber was located in a temperature-controlled indoorenvironment, with direct access to the outdoors via a custom-designed foragingtunnel (Fig. 1a). The foraging tunnel was constructed from acrylic (3.1 mm thick),with opaque-white on the floor and sides of the tunnel, and clear on the top toallow for imaging. A digital camera (PointGrey Chameleon3, 1288 × 964 pixels)was mounted above the parallel middle sections of the foraging tunnel. This regionof the foraging tunnel was monitored using a single red LED array identical tothose above the nest chamber on a 16:8 h light:dark cycle.
Colony deployment and experimental treatments. Each colony was deployed toone of three locations at the Concord Field Station (Bedford, MA, all within 200 mof each other) for 14–21 days and automated tracking of nest and foraging behaviorwas initiated within 24 h of colony deployment. After tagging, each colony wassupplied with a small amount of nectar (BioGluc) and fresh pollen (Koppert), afterwhich no additional food was supplied and colonies were forced to forage in theoutdoor environments for both nectar and pollen. All colonies initiated foragingwithin 24 h.
After establishment, nest and foraging data were recorded continuously, excepton days when experimental manipulations were performed, which varied betweencolonies. Five colonies were subjected to experimental manipulations describedbelow, and data collected before and after manipulations were analyzed. Fourteencolonies were subjected to experimental manipulations not reported here (althoughsee Supplementary Fig. 1) in the analyses.
Image acquisition. In all three behavioral arenas, video data from both nest andforaging cameras were acquired directly to a PC Desktop computer using customMatlab scripts. For nest behavior, video frames were captured at 2 Hz for 5 s (10frames total), saved to an external hard drive, and immediately processed usingBEEtag60 (Supplementary Movie 1). After processing was complete (~2–5 min),data collection was again initiated. Behavioral sequences were collected from eachnest ~140 times daily (or about once every 10 min; Supplementary Movie 1), 24 hper day, for up to two weeks.
Foraging transits were recorded via motion capture by the foraging camerausing custom Matlab scripts (Supplementary Movie 2). With both channels of theforaging tunnel in view, images were recorded whenever motion was detectedwithin the camera’s field of view and written directly to an external hard drive. At22:30 each evening, after foraging had ceased for the day, motion capture imagecollection ceased and that day’s foraging images were processed using BEEtag60.Image collection began again after all images had been processed (always before 6 a.m. the following morning).
Post processing of tracking data. The BEEtag software records the location,orientation, and identity of any BEEtags located within a single frame60 from eitherthe nest or foraging cameras. To conservatively ensure that data from bees that haddied within the colony were not included in the analysis, we ignored all data afterthe last four instances of observable movement of individual tags. After this initialpass, two-dimensional spatial coordinates of each tag were scaled and corrected forlens distortion using the Camera Calibration toolbox in Matlab. Missing coordinate“holes” within each nest video sequence were filled using linear interpolation.
Spatial mapping of nest structures. We manually mapped nest elements for eachday and each colony using a custom Matlab script (Supplementary Movie 3). Thisscript allowed manual mapping of the location of all brood (eggs, larvae, andpupae) and waxpots. On days of experimental manipulations, forager removal, orwhen the nest was otherwise physically disturbed for any reason, nest elementswere not mapped and nest behavior was not analyzed.
Analysis of foraging behavior. We used tag-tracking data from the camera overthe foraging tunnel to estimate the foraging activity of individual bees (Fig. 1a),assessing the timing and movement direction of individual bees using their tagorientation output from the BEEtag tracking software (Supplementary Movie 2).
From these data on time, identity, and movement direction of tags from theforaging camera, we estimated foraging activity as the number of unique foragingtransits performed by each bee. We removed any foraging transits separated by <3min from previous transits (although including shorter trips had no qualitativeeffect on any qualitative patterns reported here, over a range of time thresholdstested). While some movements in and out of the colony could be associated withnest defense (rather than foraging), these defensive behaviors can be easilydistinguished visually by bees clustering at or near the nest entrance, and wererarely observed in this data set.
Analysis of behavior within the nest. For every bee identified, we estimatedmultiple components of task performance and nest behavior for each 5-s videosequence (or “timestep”) separately for each bee, for each day of recording. Foreach timestep, we measured movement speed as the median of instantaneousframe-to-frame speed within a single video sequence. Movement speeds below athreshold of 10–4.3 m/s per second were considered to be stationary, based on thebimodal distribution of instantaneous movement speeds, the lower mode of whichwas assumed to result from noise in digital tracking (Supplementary Fig. 5).
Task performance. We used the spatial association with nest elements, in com-bination with movement information, to group the behavior of individual workersat each timestep into one of four behavioral clusters: foraging, nursing, patrolling,or inactive. Bees were considered to be foraging for time spans between recordedexits from the colony and subsequent entrances, unless they were located withinthe nest during that period (to compensate for times when foragers may be“missed” by the foraging camera, e.g., from bees transiting the foraging tunnel onthe side wall, which occurred rarely). Bees within the nest that were physicallyassociated (i.e., within 1 cm) with eggs, larvae, pupae, or waxpots were consideredto be nursing. Bees that were not associated with any nest elements were eitherconsidered inactive (if not moving), or patrolling (if moving). Each of these threewithin-nest behaviors represents a cluster of previously identified behaviors inbumble bees61. “Nursing,” for example, incorporates brood thermoregulation, nestconstruction, larval feeding, and multiple other behaviors associated with broodcare; “Patrolling” may include hygienic activity on the nest periphery, as well aspatrolling (and potentially transiting between nest structures or out of the nest) andactively buzzing on the nest periphery; “Inactivity” incorporates guarding, resting,perching, and inactivity. We tested repeatability of task allocation proportionswithin individuals across experimental days via one-way ANOVAs, afteraccounting for the effects of body mass, colony, and experimental day with a linearmixed effects model76. We tested the accuracy of this automated behavioral clas-sification against a human observer using a set of 841 behavioral sequencesmanually classified by a human observer (Supplementary Table 2).
Division of labor metrics. We calculated the degree to which individual workersspecialized on a subset of colony tasks (DOLind) using Gorelick’s normalizedmutual entropy metrics64 (as updated in refs. 77,78) using data on the proportion oftime each worker spent on different colony tasks (Fig. 1). This metric was firstcalculated for each colony on separate days, and subsequently calculated for eachcolony pooling behavioral data across days, either including or excluding datacollected overnight (i.e., between 8 p.m. and 6 a.m.).
Distribution of colony-wide foraging activity. We quantified the inequality inforaging activity among workers within each colony by calculating the Gini coef-ficient for foraging transits across all individuals tracked within the nest on days3–5 after colony deployment. Gini coefficients were calculated in R using theLorenz curve of foraging activity (i.e., cumulative proportion of foraging activityplotted against an individual bee’s foraging activity rank, Fig. 2a). As above in thecase of spatial occupancy, the Gini coefficient is calculated by taking the area abovethe observed Lorenz curve and below the line of perfect equality, relative to thetotal area under the equality line. Higher Gini coefficients thus reflect more skewed,unequal distributions in the data set. Data from five colonies were removed fromthis analysis because of insufficient foraging data across these particular days (dueto computer or camera failure), but inclusion of partial data for these colonies didnot change any qualitative results.
To estimate whether observed values were higher than random expectation, wegenerated simulated Gini coefficients based on two scenarios for each colony. Inthe first scenario, total foraging activity was randomly distributed across allindividuals equally (1-group sim, Fig. 2c), and in the second, foraging activity wasrandomly distributed among bees that were actively foraging during this timeperiod (2-group sim, Fig. 2c). We generated 100 simulations under each colony foreach scenario, then calculated the average Gini coefficient under each simulationcondition for each colony.
Experimental disturbance of foraging. To examine colony responses to dis-turbance, we removed foragers from colonies by monitoring outside the nestentrances and collecting up to the first 15 foragers entering or exiting the nest. Thistechnique selects non-randomly for more active foragers and is likely to simulatethe effects of heavy natural predation, since foragers would be at risk in proportionto the amount of time they spend foraging8. We quantified colony-level foragingmetrics (portion of bees foraging, and Gini coefficient) for the three days beforeand after disturbance (Fig. 2). Tagged bees that were not tracked on any particularday were removed from analyses for those days to avoid bias from tag loss. We alsogenerated expectations for what these colony foraging metrics would be afterexperimental manipulations based on the loss of the particular foragers that wereremoved, given the null assumption that the remaining bees in the colony woulddisplay no change in their previous foraging behavior.
High-dimensional nest behavior data. We used the threshold in movement speed(described above) to calculate the proportion of time each bee was mobile,
ARTICLE NATURE COMMUNICATIONS | DOI: 10.1038/s41467-018-03561-w
10 NATURE COMMUNICATIONS | (2018) 9:1201 | DOI: 10.1038/s41467-018-03561-w |www.nature.com/naturecommunications
separately at night (8 p.m.–6 a.m.; Pactive,night) and during the day (6 a.m.–8 p.m.;Pactive,day). Circadian activity scope (Circstr) was calculated as the differencebetween these two metrics within a given day, yielding a larger score for bees thatwere more active during the day than at night. Mean moving speed (Speedmov) andthe standard deviation of moving speed (Devspeed) were calculated across alltimesteps when the bee was moving (combined across day and night), rather thanstationary. We also calculated longer-term movement patterns within the nest bymeasuring the mean displacement between video recordings (Dispbw,ts).
Next, we used the maps of nest components to assess spatial fidelity. For eachframe where a bee’s spatial position within the nest could be identified, we firstcalculated the instantaneous distance to each mapped nest element. Bees wereconsidered to be located on the nest element closest to their position (SupplementaryMovie 3). If no nest elements were located within 1 cm (or approximately a workerbee’s body length), bees were not considered to be physically associated with any nestelements. If these spatial associations changed for an individual bee within a video,the most common spatial association was assigned to that bee for that timestep. Wecalculated the proportion of time each bee was physically associated with brood,separately at night (PBR,night) and during the day (PBR,day).
We characterized the spatial distribution of each bee within the nest in a varietyof ways, calculating metrics separately for daylight hours (6 a.m.–8 p.m.) andnighttime hours (8 p.m.–6 a.m.). First, we estimated several metrics of spatialdistance from the nest center. We defined the “nest center” for each 24-h day, foreach colony, as the mean spatial positions of all coordinates from all bees recordedon that day (as in ref. 79). For each bee, we then measured the “instantaneous”distance as the mean of all instantaneous distances of that bee to the nest center,during the day (Dcent,day) and at night (Dcent,night). In addition we separatelymeasured the minimum (nearest) and the median distance to all brood (DBR,nearest,DBR,all) and food (wax) pots (DWP,nearest, DWP,all) within the nest.
Next, we calculated a daily spatial probability distribution for each bee bybinning all spatial coordinates for a particular bee on a given day (pooling day andnight) into a 2-cm grid, normalizing, and smoothing using kernel densityestimation (Fig. 3a). In addition, we estimated the similarity between spatialprobability distributions both (a) across individuals and (b) within individualsacross days, by calculating the correlation of occupancy across all spatial bins (fromhereon “spatial correlation”).
We used these spatial correlations to calculate pairwise social interactionstrengths among all colony members for each day, as this metric incorporates bothdirect physical interactions, as well as indirect, substrate-based (i.e., stigmergic)interactions49. To examine the relationship between spatial correlation andphysical interactions between workers, we calculated pairwise distances between allworker pairs for each video frame. Workers were considered “interacting” if theirtags were located within 1 cm (approximately a body length) of each other. Foreach worker, we calculated the number of unique nestmates this focal beephysically interacted with during a single day. We then calculated a meaninteraction strength (“Spatial Correlation Strength” in Fig. 3d) for each worker byaveraging the social interaction strengths of each worker to all other workers thatwere present in the colony that day (Fig. 3c) and had sufficient tracking data (>100individual frames tracked, a condition met for 88% of tracked bee-days). Wecalculated mean spatial correlation strengths of each bee to all other nestmates(Corspat,all, equivalent to “social interaction strength”), as well as to foragers(Corspat,frgr) and to non-foragers (Corspat,nfrgr) separately, with foragers defined asworkers detected at least twice in the foraging tunnel on that particular day.
We then calculated two metrics of the spatial distributions of individual workersfor each day: (1) a spatial dispersion index (Dispnest,occ; the variance:mean ratio,with higher values associated with a more “clumped” distribution, a commonlyused metric in spatial ecology80) and (2) the Gini coefficient of spatial occupancy(Gininest,occ). The Gini coefficient scales between 0 and 1, with higher valuesassociated with a more skewed, unequal distribution, and is calculated by taking therelative area above the Lorenz curve (see below for a generic description of theLorenz curve in the context of foraging activity). We calculated the Gini coefficientfor each bee’s spatial occupancy separately for each day.
We also calculated a nest area “home range” for each bee. Specifically, weidentified the minimum number of grid cells that accounted for 50 and 90% of eachbee’s occupancy, and then calculated the area of the minimum convex polygonencompassing these grid cells to determine the 50% (RA50) and 90% (RA90) homerange areas, respectively.
For each bee on each day, we also calculated interaction rates with waxpots(Rint,WP) and brood (Rint,BR) by multiplying spatial probability distributions by thenumber of identified nest elements in each spatial bin within the nest. Finally, wemeasured proportion of time spent on the brood vs. on waxpots (Pbrood) for eachworker on each day by calculating the proportion of total time spent on the neststructure that the worker was on the brood (rather than wax or food pots),separately for day and night periods as above.
Nine variables were log10-transformed (DBR,nearest, DBR,all, DWP,nearest, DWP,all,Dcent,day, Dcent,night, Speedmov, Devspeed, and Dispbw,ts) and four variables weresquare-root transformed (Rint,WP, Rint,BR, RA50, and RA90).
Principal components analysis. To reduce the dimensionality of nest behaviormetrics and examine the correlation structure between components of nest behavior,we performed a principal components analysis on daily averages of all estimated
metrics of nest behavior (Fig. 4, Supplementary Table 1). Data were scaled andcentered to reduce bias from metrics on different quantitative scales. We tested forsignificant repeatability of individual principal component scores across days byperforming a one-way ANOVA on residual PC1 and PC2 scores (after accounting foreffects of mass, colony, and experimental day with a Linear Mixed Effects model). Forthis and all other analyses of nest behavior, we removed data from bees on days thathad less than 40 total timesteps (20 at night and 20 during the day) to assess nestbehavior. This quality filter (which removed ~30% of bee-day observations) is unlikelyto introduce bias into our analyses, since there was only a weak relationship betweennumber of observations and components of nest behavior (Supplementary Fig. 6), andqualitative results were unchanged if all data were included.
To explicitly examine the relationship between each principal component andrelevant information cues within the nest, we separately examined the correlationbetween principal component scores and three of the above nest behavior metricsknown to correlate with information cues within bumble bee colonies; broodinteraction rate (a proxy for larval hunger signals47, waxpot interaction rate (aproxy for information transferred through food stores18, and spatial correlationstrength (a proxy for both physical63,81 and substrate-based49 social interactions).Specifically, we calculated correlation strengths between residual principalcomponent scores and residual scores for each of these information metrics, basedon Linear Mixed Effects Models including colony as a random effect and mass as afixed effect (Supplementary Fig. 4).
We examined the relative importance of several variables (body mass,individual, colony, experimental location, and day from the beginning of theexperiment) for explaining variation in the first two principal components scoresusing hierarchical partitioning82, as implemented in “hier.part” R package82,83.
Forager removal and nest behavior. To investigate the relationship between nestbehavior and foraging activity, we built a series of generalized linear mixed effectsmodels using the “lmer” function in the lme4 package79 in R84. First, we tested theeffect of nest behavior on probability of foraging in undisturbed colonies (i.e., allcolonies before any experimental manipulations, Fig. 5), with PC1, PC2, and bodymass as fixed effects, and colony and individual as random effects. Next, we tested theeffect of nest behavior during the three days before simulated foraging on theprobability of switching to foraging the day after disturbance, among bees that werepreviously not foraging (Fig. 6), again with PC1, PC2, and body mass as fixed effects,and colony as a random effect. We built similar models to test the effects of inde-pendent metrics of nest behavior on initiating foraging, with Rint,WP, Rint,BR, Corspat,all,Pact,night, Dispbw,ts, and mass as fixed effects, and colony as a random effect (Fig. 7).Finally, we tested the effects of switching to foraging after forager removal on changesin nest behavior metrics with separate linear mixed effects models, with foragingactivity (binary) as a fixed effect and colony as a random effect (Fig. 8). P values offixed effects for all models were calculated using the lmerTest85 package in R.
Data availability. Data generated by and presented in this manuscript are availableon Zenodo (DOI 10.5281/zenodo.1172834). Custom scripts for behavioral trackingand analysis are available upon request from the corresponding author.
Received: 11 July 2017 Accepted: 22 February 2018
References1. Wilson, E. O. The Insect Societies (Belknap Press, Cambridge, MA, 1971).2. Oster, G. F., . & Wilson, E. O. Caste and ecology in the social insects. Monogr.
Popul. Biol. 12, 1–352 (1978).3. Hölldobler, B. & Wilson, E. O. The Superorganism (W. W. Norton &
Company, New York, 2009).4. Wilson, E. O. The ergonomics of caste in the social insects. Am. Nat. 102,
41–66 (1968).5. Leighton, G. M., Charbonneau, D. & Dornhaus, A. Task switching is
associated with temporal delays in Temnothorax rugatulus ants. Behav. Ecol.28, 319–327 (2017).
6. Gordon, D. M. Dynamics of task switching in harvester ants. Anim. Behav. 38,194–204 (1989).
7. Gordon, D. M. From division of labor to the collective behavior of socialinsects. Behav. Ecol. Sociobiol. 1–8 https://doi.org/10.1007/s00265-015-2045-3(2015).
8. Tenczar, P., Lutz, C. C., Rao, V. D., Goldenfeld, N. & Robinson, G. E.Automated monitoring reveals extreme interindividual variation and plasticityin honeybee foraging activity levels. Anim. Behav. 95, 41–48 (2014).
9. Johnson, B. R. Reallocation of labor in honeybee colonies during heat stress:the relative roles of task switching and the activation of reserve labor. Behav.Ecol. Sociobiol. 51, 188–196 (2002).
10. Charbonneau, D., Sasaki, T. & Dornhaus, A. Who needs ‘lazy’ workers?Inactive workers act as a “reserve” labor force replacing active workers, but
NATURE COMMUNICATIONS | DOI: 10.1038/s41467-018-03561-w ARTICLE
NATURE COMMUNICATIONS | (2018) 9:1201 | DOI: 10.1038/s41467-018-03561-w |www.nature.com/naturecommunications 11

inactive workers are not replaced when they are removed. PLoS ONE 12,e0184074–20 (2017).
11. Robinson, E. J. H., Feinerman, O. & Franks, N. R. Flexible task allocation andthe organization of work in ants. Proc. R. Soc. B: Biol. Sci. 276, 4373–4380(2009).
12. Gordon, D. M. Behavioral flexibility and the foraging ecology of seed-eatingants. Am. Nat. 138, 379–411 (1991).
13. Camazine, S. The regulation of pollen foraging by honey bees: how foragersassess the colony’s need for pollen. Behav. Ecol. Sociobiol. 32, 265–272 (1993).
14. Huang, Z.-Y. & Robinson, G. E. Regulation of honey bee division of labor bycolony age demography. Behav. Ecol. Sociobiol. 39, 147–158 (1996).
15. Kwapich, C. L. & Tschinkel, W. R. Demography, demand, death, and theseasonal allocation of labor in the Florida harvester ant (Pogonomyrmexbadius). Behav. Ecol. Sociobiol. 67, 2011–2027 (2013).
16. Gordon, D. M., Holmes, S. & Nacu, S. The short-term regulation of foragingin harvester ants. Behav. Ecol. 19, 217–222 (2007).
17. Greene, M. J. & Gordon, D. M. Social insects: cuticular hydrocarbons informtask decisions. Nature 423, 32–32 (2003).
18. Dornhaus, A. Bumble bees (Bombus terrestris) store both food andinformation in honeypots. Behav. Ecol. 16, 661–666 (2005).
19. Hrncir, M., Jarau, S., Zucchi, R. & Barth, F. G. Recruitment behavior instingless bees, Melipona scutellaris and M. quadrifasciata. II. Possiblemechanisms of communication. Apidologie 31, 93–113 (2000).
20. Nieh, J. C. Recruitment communication in stingless bees (Hymenoptera,Apidae, Meliponini). Apidologie 35, 159–182 (2004).
21. Heyman, Y., Shental, N., Brandis, A., Hefetz, A. & Feinerman, O. Antsregulate colony spatial organization using multiple chemical road-signs. Nat.Commun. 8, 15414 (2017).
22. Ishay, J., Motro, A., Gitter, S. & Brown, M. B. Rhythms in acousticalcommunication by the oriental hornet, Vespa orientalis. Anim. Behav. 22,741–744 (1974).
23. Jandt, J. M. et al. Behavioural syndromes and social insects: personality atmultiple levels. Biol. Rev. 89, 48–67 (2013).
24. Jeanson, R. & Weidenmüller, A. Interindividual variability in socialinsects–proximate causes and ultimate consequences. Biol. Rev. 89, 671–687 (2014).
25. Hui, A. & Pinter-Wollman, N. Individual variation in exploratory behaviourimproves speed and accuracy of collective nest selection by Argentine ants.Anim. Behav. 93, 261–266 (2014).
26. Beverly, B. D., McLendon, H., Nacu, S., Holmes, S. & Gordon, D. M. How sitefidelity leads to individual differences in the foraging activity of harvester ants.Behav. Ecol. 20, 633–638 (2009).
27. Kocher, S. D., Ayroles, J. F., Stone, E. A. & Grozinger, C. M. Individualvariation in pheromone response correlates with reproductive traits and braingene expression in worker honey bees. PLoS ONE 5, e9116–e9119 (2010).
28. Pinter-Wollman, N., Wollman, R., Guetz, A., Holmes, S. & Gordon, D. M. Theeffect of individual variation on the structure and function of interactionnetworks in harvester ants. J. R. Soc. Interface 8, 1562–1573 (2011).
29. Wolf, M. & Weissing, F. J. Animal personalities: consequences for ecology andevolution. Trends Ecol. Evol. 27, 452–461 (2012).
30. Sih, A., Bell, A. & Johnson, J. C. Behavioral syndromes: an ecological andevolutionary overview. Trends Ecol. Evol. 19, 372–378 (2004).
31. Sih, A., Bell, A. M., Johnson, J. C. & Ziemba, R. E. Behavioral syndromes: anintegrative overview. Q. Rev. Biol. 79, 241–277 (2004).
32. Sih, A., Cote, J., Evans, M., Fogarty, S. & Pruitt, J. Ecological implications ofbehavioural syndromes. Ecol. Lett. 15, 278–289 (2012).
33. Bengston, S. E. & Dornhaus, A. Be meek or be bold? A colony-levelbehavioural syndrome in ants. Proc. R. Soc. B: Biol. Sci. 281,20140518–20140518 (2014).
34. Pruitt, J. N., Grinsted, L. & Settepani, V. Linking levels of personality:personalities of the ‘average’ and “most extreme” group members predictcolony-level personality. Anim. Behav. 86, 391–399 (2013).
35. Pruitt, J. N. & Goodnight, C. J. Site-specific group selection drives locallyadapted group compositions. Nature 514, 359–362 (2014).
36. Crall, J. D. et al. Social context modulates idiosyncrasy of behaviour in thegregarious cockroach Blaberus discoidalis. Anim. Behav. 111, 297–305 (2016).
37. Jandt, J. M. & Gordon, D. M. The behavioral ecology of variation in socialinsects. Curr. Opin. Insect Sci. 15, 40–44 (2016).
38. Jolles, J. W., Boogert, N. J., Sridhar, V. H., Couzin, I. D. & Manica, A.Consistent individual differences drive collective behavior and groupfunctioning of schooling fish. Curr. Biol. 27, 2862–2868.e7 (2017).
39. Beshers, S. N. & Fewell, J. H. Models of division of labor in social insects.Annu. Rev. Entomol. 46, 413–440 (2001).
40. Bonabeau, E., Theraulaz, G. & Deneubourg, J.-L. Quantitative study of thefixed threshold model for the regulation of division of labour in insectsocieties. Proc. R. Soc. B: Biol. Sci. 263, 1565–1569 (1996).
41. O’Donnell, S. & Foster, R. L. Thresholds of response in nest thermoregulationby worker bumble bees, Bombus bifarius nearcticus (Hymenoptera: Apidae).Ethology 107, 387–399 (2001).
42. Weidenmüller, A. The control of nest climate in bumblebee (Bombusterrestris) colonies: interindividual variability and self reinforcement infanning response. Behav. Ecol. 15, 120–128 (2004).
43. Westhus, C., Kleineidam, C. J., Roces, F. & Weidenmüller, A. Behaviouralplasticity in the fanning response of bumblebee workers: impact of experienceand rate of temperature change. Anim. Behav. 85, 27–34 (2013).
44. Jandt, J. M. & Dornhaus, A. Spatial organization and division of labour in thebumblebee Bombus impatiens. Anim. Behav. 77, 641–651 (2009).
45. Mersch, D. P., Crespi, A. & Keller, L. Tracking individuals shows spatialfidelity is a key regulator of ant social organization. Science 340, 1090–1093(2013).
46. Pinter-Wollman, N. Persistent variation in spatial behavior affects thestructure and function of interaction networks. Curr. Zool. 61, 98–106 (2015).
47. Boer, S. P. A. D. & Duchateau, M. J. H. M. A larval hunger signal in thebumblebee Bombus terrestris. Insectes Soc. 53, 369–373 (2006).
48. Richardson, T. O., Christensen, K., Franks, N. R., Jensen, H. J. & Sendova-Franks, A. B. Ants in a labyrinth: a statistical mechanics approach to thedivision of labour. PLoS ONE 6, e18416–12 (2011).
49. Richardson, T. O. & Gorochowski, T. E. Beyond contact-based transmissionnetworks: the role of spatial coincidence. J. R. Soc. Interface 12,20150705–20150711 (2015).
50. Tschinkel, W. R. Sociometry and sociogenesis of colonies of the harvester ant,Pogonomyrmex badius: distribution of workers, brood and seeds within thenest in relation to colony size and season. Ecol. Entomol. 24, 222–237 (1999).
51. Tofts, C. Algorithms for task allocation in ants (a study of temporalpolyethism: theory). Bull. Math. Biol. 55, 891–918 (1993).
52. Tofts, C. & Franks, N. R. Doing the right thing: ants, honeybees and nakedmole-rats. Trends Ecol. Evol. 7, 346–349 (1992).
53. Backen, S. J., Sendova-Franks, A. B. & Franks, N. R. Testing the limits of socialresilience in ant colonies. Behav. Ecol. Sociobiol. 48, 125–131 (2000).
54. Powell, S. & Tschinkel, W. R. Ritualized conflict in Odontomachus brunneusand the generation of interaction-based task allocation: a new organizationalmechanism in ants. Anim. Behav. 58, 965–972 (1999).
55. Davidson, J. D. & Gordon, D. M. Spatial organization and interactions of harvesterants during foraging activity. J. R. Soc. Interface 14, pii:20170413 (2017).
56. Goulson, D. et al. Can alloethism in workers of the bumblebee, Bombusterrestris, be explained in terms of foraging efficiency? Anim. Behav. 64,123–130 (2002).
57. Alaux, C. et al. Honey bee aggression supports a link between gene regulationand behavioral evolution. Proc. Natl Acad. Sci. USA 106, 15400–15405 (2009).
58. Raine, N. E. & Chittka, L. The correlation of learning speed and natural foragingsuccess in bumble-bees. Proc. R. Soc. B: Biol. Sci. 275, 803–808 (2008).
59. Bloch, G. & Robinson, G. E. Chronobiology. Revers. Honeybee Behav. RhythmsNat. 410, 1048–1048 (2001).
60. Crall, J. D., Gravish, N., Mountcastle, A. M. & Combes, S. A. BEEtag: a low-cost, image-based tracking system for the study of animal behavior andlocomotion. PLoS ONE 10, e0136487 (2015).
61. Jandt, J. M., Huang, E. & Dornhaus, A. Weak specialization of workers inside abumble bee (Bombus impatiens) nest. Behav. Ecol. Sociobiol. 63, 1829–1836 (2009).
62. Cameron, S. A. Temporal patterns of division of labor among workers in theprimitively eusocial bumble bee, Bombus griseocollis (Hymenoptera: Apidae)1.Ethology 80, 137–151 (1989).
63. Renner, M. A. & Nieh, J. C. Bumble bee olfactory information flow andcontact-based foraging activation. Insectes Soc. 55, 417–424 (2008).
64. Gorelick, R., Bertram, S. M., Killeen, P. R. & Fewell, J. H. Normalized mutualentropy in biology: quantifying division of labor. Am. Nat. 164, 677–682(2004).
65. Sendova-Franks, A. B. & Franks, N. R. Social resilience in individual workerants and its role in division of labour. Proc. R. Soc. B: Biol. Sci. 256, 305–309(1994).
66. Dornhaus, A., Brockmann, A. & Chittka, L. Bumble bees alert to food withpheromone from tergal gland. J. Comp. Physiol. A Neuroethol. Sens. NeuralBehav. Physiol. 189, 47–51 (2003).
67. Russell, A. L. & Papaj, D. R. Artificial pollen dispensing flowers and feeders forbee behaviour experiments. J. Pollinat. Ecol. 18, 13–22 (2016).
68. Klein, S., Pasquaretta, C., Barron, A. B., Devaud, J.-M. & Lihoreau, M. Inter-individual variability in the foraging behaviour of traplining bumblebees. Sci.Rep. 7, 372–12 (2017).
69. Pendrel, B. A. & Plowright, R. C. Larval feeding by adult bumble bee workers(Hymenoptera: Apidae). Behav. Ecol. Sociobiol. 8, 71–76 (1981).
70. Kapustjanskij, A., Streinzer, M., Paulus, H. F. & Spaethe, J. Bigger is better:implications of body size for flight ability under different light conditions andthe evolution of alloethism in bumblebees. Funct. Ecol. 21, 1130–1136 (2007).
71. Jandt, J. M. & Dornhaus, A. Bumblebee response thresholds and body size:does worker diversity increase colony performance? Anim. Behav. 87, 97–106(2014).
72. Gordon, D. M. The rewards of restraint in the collective regulation of foragingby harvester ant colonies. Nature 498, 91–93 (2013).
ARTICLE NATURE COMMUNICATIONS | DOI: 10.1038/s41467-018-03561-w
12 NATURE COMMUNICATIONS | (2018) 9:1201 | DOI: 10.1038/s41467-018-03561-w |www.nature.com/naturecommunications
73. Dillon, M. E. & Dudley, R. Surpassing Mt. Everest: extreme flight performanceof alpine bumble-bees. Biol. Lett. 10, 20130922 (2014).
74. Goulson, D. Bumblebees: Behaviour, Ecology, and Conservation (OxfordUniversity Press, Oxford, England, UK 2010).
75. Woodard, S. H. Bumble bee ecophysiology: integrating the changingenvironment and the organism. Curr. Opin. Insect Sci. https://doi.org/10.1016/j.cois.2017.06.001 (2017).
76. Bates, D., Maechler, M., Bolker, B. & Walker, S. Fitting linear mixed-effectsusing lme4. J. Stat. Softw. 67, 1–48 (2015).
77. Dornhaus, A., Holley, J. A. & Franks, N. R. Larger colonies do not have morespecialized workers in the ant Temnothorax albipennis. Behav. Ecol. 20,922–929 (2009).
78. Gorelick, R. & Bertram, S. M. Quantifying division of labor: borrowing toolsfrom sociology, sociobiology, information theory, landscape ecology, andbiogeography. Insectes Soc. 54, 105–112 (2007).
79. Bates, D., Mächler, M., Ben Bolker & Walker, S. Fitting linear mixed-effectsmodels using lme4. J. Stat. Softw. 67, 1–48 (2015).
80. Perry, J. N. & Mead, R. On the power of the index of dispersion test to detectspatial pattern. Biometrics 35, 613 (1979).
81. Otterstatter, M. C. & Thomson, J. D. Contact networks and transmission of anintestinal pathogen in bumble bee (Bombus impatiens) colonies. Oecologia154, 411–421 (2007).
82. Chevan, A. & Sutherland, M. Hierarchical partitioning. Am. Stat. 45, 90 (1991).83. Mac Nally, R. & Walsh, C. J. Hierarchical partitioning public-domain
software. Biodivers. Conserv. 13, 659–660 (2004).84. R Development Core Team. R: A language and environment for statistical
computing. (R Foundation for Statistical Computing, Vienna, Austria, 2008).85. Kuznetsova, A., Brockhoff, P. B. & Christensen, H. B. lmerTest Package: Tests
in linear mixed effect models. J. Stat. Softw. 82, 1–26 (2017).
AcknowledgementsThis work was support by a NSF GRFP grant to J.D.C., a James S. McDonnell Fellowshipto N.G., NSF grant IOS-1253677 to S.A.C., and NSF Grant IOS-1257543 to N.E.P.
Author contributionsJ.D.C., S.D.K., N.E.P. and S.A.C. designed the study. J.D.C., A.M.M. and N.G. designedand built experimental arenas. J.D.C. and R.L.O. performed experiments. J.D.C analyzedand interpreted results. All authors discussed results and contributed to manuscriptpreparation.
Additional informationSupplementary Information accompanies this paper at https://doi.org/10.1038/s41467-018-03561-w.
Competing interests: The authors declare no competing interests.
Reprints and permission information is available online at http://npg.nature.com/reprintsandpermissions/
Publisher's note: Springer Nature remains neutral with regard to jurisdictional claims inpublished maps and institutional affiliations.
Open Access This article is licensed under a Creative CommonsAttribution 4.0 International License, which permits use, sharing,
adaptation, distribution and reproduction in any medium or format, as long as you giveappropriate credit to the original author(s) and the source, provide a link to the CreativeCommons license, and indicate if changes were made. The images or other third partymaterial in this article are included in the article’s Creative Commons license, unlessindicated otherwise in a credit line to the material. If material is not included in thearticle’s Creative Commons license and your intended use is not permitted by statutoryregulation or exceeds the permitted use, you will need to obtain permission directly fromthe copyright holder. To view a copy of this license, visit http://creativecommons.org/licenses/by/4.0/.
© The Author(s) 2018
NATURE COMMUNICATIONS | DOI: 10.1038/s41467-018-03561-w ARTICLE
NATURE COMMUNICATIONS | (2018) 9:1201 | DOI: 10.1038/s41467-018-03561-w |www.nature.com/naturecommunications 13