spatial databases: a quick tour dr. david briggs professor & researcher computer science...
TRANSCRIPT

Spatial Databases: A Quick Tour
Dr. David Briggs
Professor & ResearcherComputer Science Department
Research Computer Group & ISIS
University of Southern Maine
GeoPortal Project
Maine GeoLibrary Board

Combining Spatial and Conventional Data
• In Visual Presentations
• In a DBMS
• Across the Internet
Some Early Examples of Visual Representations
1. Dr. Snow's Map of Cholera Cases (1854)
2. Minard's Depiction of Napoleon's Russian Campaign (1869)
3. U.S. Army's Map of Ocean Currents (1943)
4. Minard's Map of Cattle Shipped to Paris (1858)

John Snow’s Map of Cholera Outbreak
Image Source:http://www.ph.ucla.edu/epi/snow/highressnowmap.html

John Snow’s Map of Cholera Outbreak

Minard’s Map of Napoleon’s Russian Campaign
Image Source:http://upload.wikimedia.org/wikipedia/commons/2/29/Minard.png

Berezina River Crossing

Ocean Currents of the World
Image Source:http://upload.wikimedia.org/wikipedia/commons/6/67/Ocean_currents_1943_(borderless)3.png
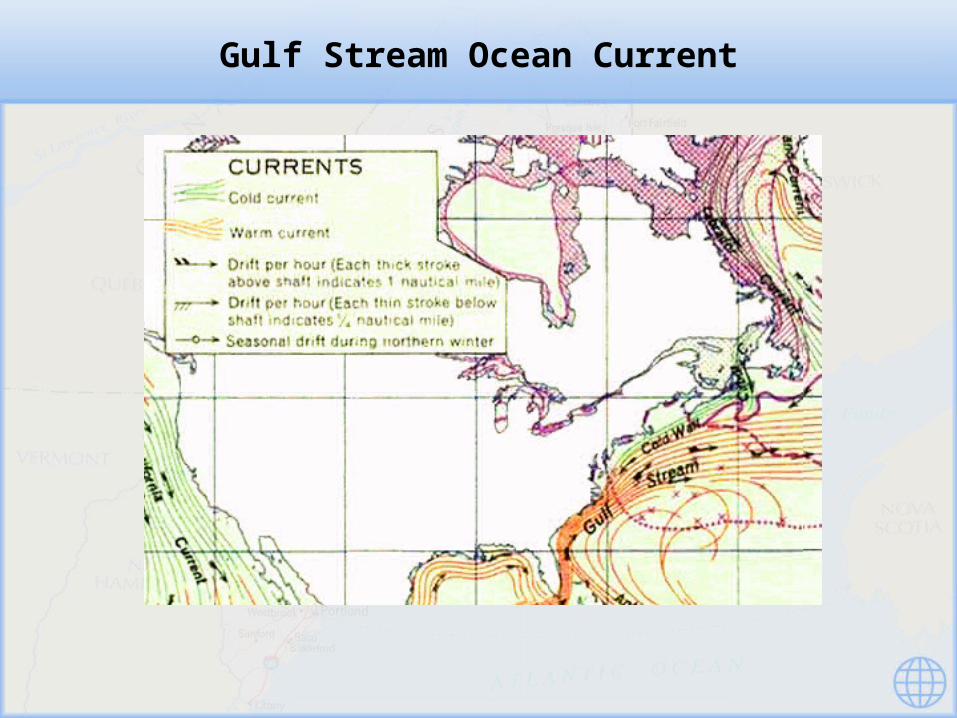
Gulf Stream Ocean Current

Minard’s Map of Cattle Shipments to Paris
Image Source:http://upload.wikimedia.org/wikipedia/commons/1/1c/Minard-carte-viande-1858.png

Imaginative Visual Representations of Data Embedded in Maps
• Can convey information in a striking and compelling manner
• Can suggest connections that the same data in a tabular format would not

Animation of Images
Annual Cycle of Temperatures
• Map cold to blue hot to red in a color ramp
• Temperatures at noon over a uniformly tesselated region of the country for each day of the year
• Play out to see annual pattern
What might be revealed? Would different elevations show themselves? Would cloud cover show itself?
Daily Cycle of Temperatures
• Simultaneous temperatures every quarter hour over the same region for one day
• Play out to see a diurnal pattern
Conventional Databases and Spatial Information
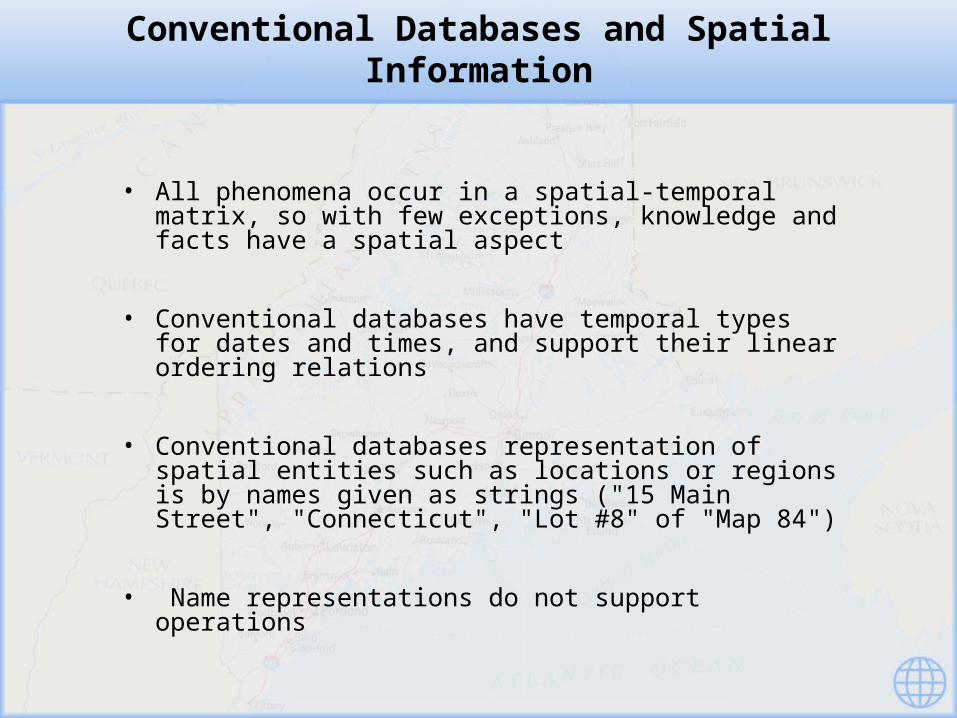
• All phenomena occur in a spatial-temporal matrix, so with few exceptions, knowledge and facts have a spatial aspect
• Conventional databases have temporal types for dates and times, and support their linear ordering relations
• Conventional databases representation of spatial entities such as locations or regions is by names given as strings ("15 Main Street", "Connecticut", "Lot #8" of "Map 84")
• Name representations do not support operations
Spatial Databases (Conceptually)
• Treat spatial data types comparably to conventional types like string, integer, or float
• Add operations and predicates appropriate for them

OGC's Simple Features UML diagram
Image Source:http://www.opengeospatial.org/standards/sfs
Operations from OGC's Simple Features SQL
• Real valued: length, area, distance, ...
• Boolean valued: disjoint, touches, within, overlaps,...
• Geometry valued: startpoint, endpoint, envelope,...
• Caveat: machine implementation of real arithmetic is not exact!

OGC’s Suggested Incorporation into Relational Model
• Feature (=Entity) Tables with Geometry valued attributes have columns containing foreign keys to where the actual values are stored.
• Within a Geometry table
• All rows/instances are the same geometric type
(so the regions will need to be multi polygons)
• All rows/instance use the same Spatial Reference System
• Example: States with capitals and regions
StName … Capital CapitalPoint … Region
Maine … Augusta alpha … beta
GID …
alpha …
GID …
beta …
CityPoints_Table
StatePolygons_Table
Geometry Tables
States_Table
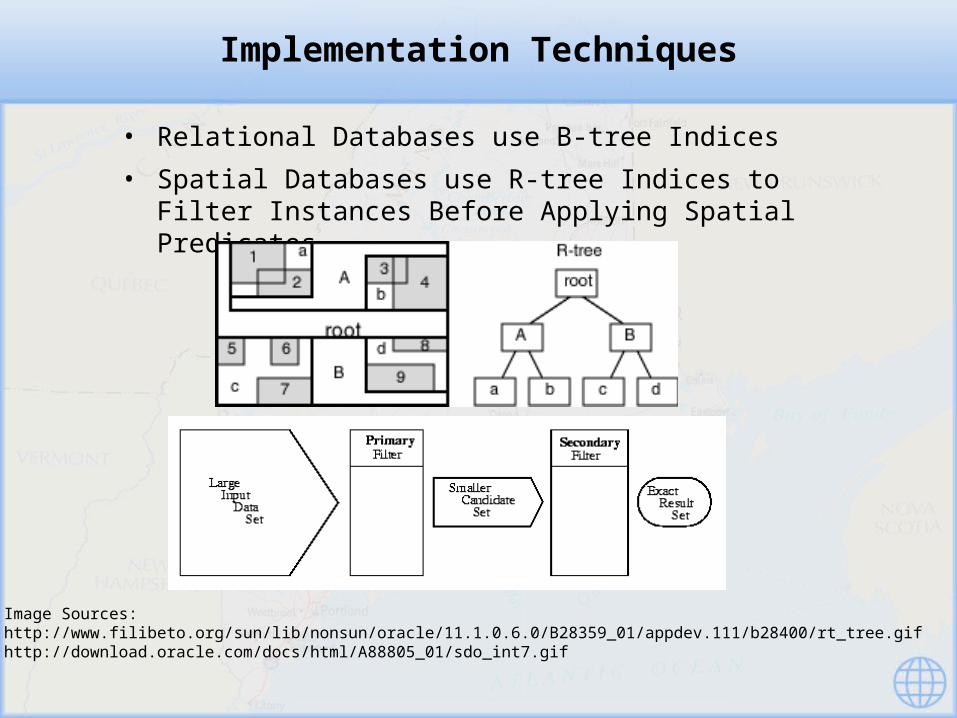
Implementation Techniques
• Relational Databases use B-tree Indices
• Spatial Databases use R-tree Indices to Filter Instances Before Applying Spatial Predicates.
Image Sources:http://www.filibeto.org/sun/lib/nonsun/oracle/11.1.0.6.0/B28359_01/appdev.111/b28400/rt_tree.gifhttp://download.oracle.com/docs/html/A88805_01/sdo_int7.gif

Sharing Spatial Data Over the Web
• Standard Interfaces
• Metadata Standards
• Data Mediation

Open Geospatial Consortium, Inc. (OGC) Standards
• Simple Features SQL– Describes extensions to the SQL data model with suggestions for
implementation
• Geography Markup Language (GML)– An XML schema for defining schemas involving spatial data
• Web Map Service (WMS)– For delivering a map image files in response to requests
• Web Feature Service (WFS)– For executing queries and updates against a spatial database
• Styled Layer Descriptor (SLD)– Augments WMS by allowing user input to control styling of map images
(colors and symbology)
• Many more! – Unfortunately, most use XML as the medium of information exchange over
the net.

Metadata Standards
• Primary Purpose
Provide potential users with enough information about the actual data to determine if it is fit for their intended use of it, among other things.
• ISO 19115 – Metadata– Some 400 elements, approximately 50 are needed for level I compliance.
• Another XML schema
• Partial List of Categories– Identification Data Information
– Data Quality Information
– Lineage Information
– Reference System Information
– Spatial Representation Information
– Feature Catalog Information
– Distribution Information
• Importance of Metadata

Data Mediation - Overcoming Differences
• Common "Ontology“ (really a schema integration problem)
• Central Data Warehouse vs. Federated Database– Central Data Warehouse brings all data into one site.

Federated Database System
Image Source:http://www-128.ibm.com/developerworks/db2/library/techarticle/0203haas/images/federated.gif