spatial characterization of leachate plume using electrical resistivity
TRANSCRIPT

Engineering Geology 211 (2016) 61–73
Contents lists available at ScienceDirect
Engineering Geology
j ourna l homepage: www.e lsev ie r .com/ locate /enggeo
Spatial characterization of leachate plume using electrical resistivitytomography in a landfill composed of old and new cells (Belfort, France)
Vincent Bichet a, Elise Grisey b, Lotfi Aleya a,⁎a Laboratoire de Chrono-Environnement, UMR CNRS 6249, Université de Bourgogne, Franche-Comté, Franceb Atelier d'Écologie Urbaine, 9 avenue Philippe Auguste, 75011 Paris, France
⁎ Corresponding author.E-mail address: [email protected] (L. Aleya).
http://dx.doi.org/10.1016/j.enggeo.2016.06.0260013-7952/© 2016 Elsevier B.V. All rights reserved.
a b s t r a c t
a r t i c l e i n f oArticle history:Received 1 December 2015Received in revised form 20 June 2016Accepted 29 June 2016Available online xxxx
Located near Belfort (France), the Etueffont landfill was in operation from 1976 to 2002 for the disposal and stor-age of domesticwaste produced by 47,650 inhabitants. The site is comprised of the original landfill site called theold landfill (OL), in operation from1976 to 1999, and a newer section known as the newcell (NC)which operatedfrom 1999 to 2002. The objective of this study is to determine, using electrical resistivity tomography (ERT), theextent of the leachate plume from the OL and tomonitor the efficiency of the liner of the NC. The entire Etueffontsitewas crisscrossedwith 21 electrical profile lineswhichwere traced in summer between 2009 and 2011duringa period of dry weather. This investigation allowed visualization of the flow and saturation phenomena withinthe waste without destructive on-site intervention, and also of leachate infiltration into the substratum. Theanomalies of low resistivity extending beneath the base of the OL represent a leachate plume that migrateswith-in the substratum. As the water table ceiling is found at nearly the same level as the base of the waste, leachateinfiltration is a source of groundwater pollution. A rising gradient in resistivity values is observed at depth indi-cating progressive vertical dilution in leachatemineralization. Pollution plume extension is limited both at depthand laterally as it is no longer visible a few dozen meters from the storage zone.
© 2016 Elsevier B.V. All rights reserved.
Keywords:LandfillPollution plumeLeachatesElectrical resistivity tomography
1. Introduction
The diagnosis and monitoring of polluted sites is currently a majorconcern. Landfills contain a variable quantity of toxic materials andcomprise a risk for human beings and their environment (Bernard etal., 1997; Ben Salem et al., 2014a, 2014b). Former landfills, establishedat a time when the knowledge of the risks involved in waste storagewas nearly non-existent, do not possess the geological or artificial bar-riers that isolate wastes from the natural environment (Kallis andBuder, 2001; Aleya et al., 2007; Gibbons et al., 2014). Leachate seepagefound at the base of landfill sites is a source of soil and groundwater con-tamination (Grisey et al., 2010;Weber et al., 2011). In addition, not all ofthese landfills have been inspected; storage zone limits and the typeand volume of wastes sometimes remain unknown (Butt et al., 2014).Even in well-monitored landfills, geometry and depth may differ fromthe information appearing in the plans submitted for inspection of clas-sified siteswhen the operation permit application is initially filed (Meju,2006). However, in recent landfills respecting updated rules for techni-cal security (Decree of September 9, 1997, amended) risks have beenminimized (Grisey and Aleya, 2016a).
Conventional methods for evaluating landfill-related groundwatercontamination bring together such topics as reconnaissance drilling,
water sampling and chemical analysis (Frid et al., 2008). Thoughwater samples furnish precise information as to the type of contami-nants present (Vaudelet et al., 2011), drilling remains costly and inva-sive (Radulescu et al., 2007) and may sometimes miss thecontaminated zone due to poor deployment (Vaudelet et al., 2011).Less costly and non-invasive geophysical prospecting techniques havebeen developed to study subsoil structures without disturbing them.They are now frequent tools for site investigation and can be used to de-tect pollution, to describe geological features, to diagnose engineeringstructures and also for hydrogeological studies (Chambers et al., 2006;Giusti, 2009). Electrical resistivity tomography (ERT), which is basedon the measure of the electrical resistivity ρ of subsurface materials,provides information on the properties of the underground environ-ment such as thickness of a layer and its saturation, depth of the substra-tum, localization and distribution of conducting fluids (leachates), andlocalization and orientation of fractures and faults (Soupios et al.,2007). Electrical resistivity or inversely, electrical conductivity ofwastes, depend on several of the waste mass properties such as porosi-ty, connectivity of pores, water content, the ionic force of leachates andtemperature (Imhoff et al., 2007). Thus, ground not saturated withwater will be less conductive than if saturated; electrical resistivity di-minishes as water mineralization increases. ERT is particularly welladapted to the study of landfills in order to determine their geometryand internal structure (Depountis et al., 2005; Chambers et al., 2006;Meju, 2006; Soupios et al., 2007; Wilkinson et al., 2010), and to detect
62 V. Bichet et al. / Engineering Geology 211 (2016) 61–73
leachate contamination of the substratum (Acworth and Jorstad, 2006;Park et al., 2008; Abdullahi et al., 2010). This technique has some draw-backs that make its features difficult to interpret. One such drawback isthat the reduction in resolution as depth increases generates impreci-sion at deeper levels. In addition, due to the preferential circulation ofcurrent in conductive zones, the presence of a non-conductive liningat the bottom of a landfill cell may obstruct flow toward the zone situ-ated below.
In a previous investigation via electrical resistivity tomography atthe Etueffont site, Belle (2008) brought to light a vertical seepage leach-ate zone at the base of the OL and a leachate plume migration towardthewest, in the directionN325–335. The same author also hypothesizedthe existence of a leachate leak in the new water-proof cell. For thisstudy, investigation was pursued beyond the limits of the storage zoneso as to determine the extent of the leachate plume from the formerlandfill and to monitor the efficiency of the NC lining. Several profileshave also been traced over the storage zone to verify whether electricalresistivity tomography can appreciate the internal structure of the twocells.
2. Materials and methods
2.1. Study site
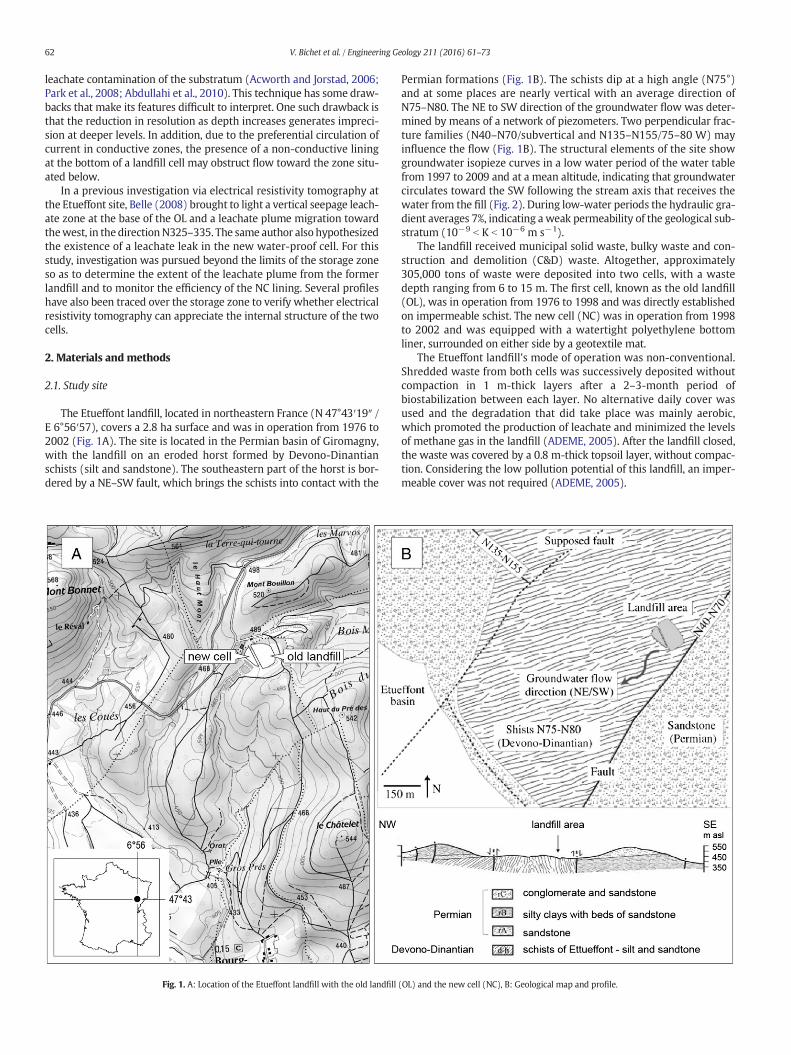
The Etueffont landfill, located in northeastern France (N 47°43′19″ /E 6°56′57), covers a 2.8 ha surface and was in operation from 1976 to2002 (Fig. 1A). The site is located in the Permian basin of Giromagny,with the landfill on an eroded horst formed by Devono-Dinantianschists (silt and sandstone). The southeastern part of the horst is bor-dered by a NE–SW fault, which brings the schists into contact with the
Fig. 1. A: Location of the Etueffont landfill with the old landfill
Permian formations (Fig. 1B). The schists dip at a high angle (N75°)and at some places are nearly vertical with an average direction ofN75–N80. The NE to SW direction of the groundwater flow was deter-mined by means of a network of piezometers. Two perpendicular frac-ture families (N40–N70/subvertical and N135–N155/75–80 W) mayinfluence the flow (Fig. 1B). The structural elements of the site showgroundwater isopieze curves in a low water period of the water tablefrom 1997 to 2009 and at a mean altitude, indicating that groundwatercirculates toward the SW following the stream axis that receives thewater from the fill (Fig. 2). During low-water periods the hydraulic gra-dient averages 7%, indicating a weak permeability of the geological sub-stratum (10−9 b K b 10−6 m s−1).
The landfill received municipal solid waste, bulky waste and con-struction and demolition (C&D) waste. Altogether, approximately305,000 tons of waste were deposited into two cells, with a wastedepth ranging from 6 to 15 m. The first cell, known as the old landfill(OL), was in operation from 1976 to 1998 and was directly establishedon impermeable schist. The new cell (NC) was in operation from 1998to 2002 and was equipped with a watertight polyethylene bottomliner, surrounded on either side by a geotextile mat.
The Etueffont landfill's mode of operation was non-conventional.Shredded waste from both cells was successively deposited withoutcompaction in 1 m-thick layers after a 2–3-month period ofbiostabilization between each layer. No alternative daily cover wasused and the degradation that did take place was mainly aerobic,which promoted the production of leachate and minimized the levelsof methane gas in the landfill (ADEME, 2005). After the landfill closed,the waste was covered by a 0.8 m-thick topsoil layer, without compac-tion. Considering the low pollution potential of this landfill, an imper-meable cover was not required (ADEME, 2005).
(OL) and the new cell (NC), B: Geological map and profile.

Fig. 2. Structural elements of the site showing groundwater isopieze curves in low water period, at a mean altitude in the water table over 1997–2009.
63V. Bichet et al. / Engineering Geology 211 (2016) 61–73
Leachate that was generated in each cell drained back into a sharedleachate collection system, which was then discharged into a naturallagooning treatment system (Khattabi and Aleya, 2007; Ben Salem etal., 2014a, 2014b) (Fig. 2). Inflow was generally adjusted to59.4 m3 day−1, with a theoretical retention time of approximately19 days. At the lagooning system's outlet, the treated leachate was re-leased into a brook, the “Gros Près”. The Etueffont site is in the methan-ogenic phase (Kjeldsen et al., 2002; Claret et al., 2011) as demonstratedby Aleya et al. (2007) and Grisey and Aleya (2016a), illustrating that thesite has already achieved advanced stable conditions, i.e. with pHreaching neutral values, methane production and a decreased releaseof organic and inorganic matter.
Leachate and groundwater was chemically characterized for boththe old landfill (1989–2010) and the new cell (2000−2010), andwater electrical conductivity (EC) was measured. The main resultswere published in Grisey and Aleya (2016b). The EC values of ground-water and leachate cited below were not collected during the geophys-ical survey but correspond tomean values previously published (Griseyand Aleya, 2016b).
2.2. Geophysical survey
The entire Etueffont site was investigated using 2D electrical resis-tivity tomography (ERT). The area was crisscrossed with 21 electricalprofile lines, noted P1 to P21, whose positions are reported in Fig. 3.The Etueffont landfill is a controlled site whose structure is wellknown. To identify potential contamination beneath the cells, eight pro-files (P1 to P8, NE/SW and NW/SE) were traced. Three parallel profile
lines were traced, crossing the storage zone from the NE to the SW,thefirst along theNWflank (P1), the secondwithin the landfill environ-ment (P2) and the third along the SE flank (P3). Five profile lines orient-ed NW to SE—P4 and P5 in the OL, P6 at the interface of the two cells,and P7 and P8 in the NC—were traced nearly perpendicularly to thethree previous ones. To identify potential contamination surroundingthe site, 6 hydraulic profiles (P14 to P19) and 7 lateral profiles weretraced (Fig. 3) during a dry period (Table 1) and in sunny weather.Themeasurementswere all taken the day following a light rainy period,which allowed for a better connection between ground and electrodesand favored better propagation of the electrical current.
2.3. Acquisition of data
The geoelectrical data were collected via two systems of multi-elec-trode measurement: the ABEM Terrameter Lund Imaging system(400 V; 100 W; 1 A) and the SYSCAL R1+ Switch-72 (600 V; 200 W;2.5 A) produced by Iris Instruments. Each prospecting system wasequipped with a resistivity meter connected to a cable with multipleoutlets connected to stainless steel electrodes planted in the ground atregular intervals (4.5 m for P2 and P4 profiles; 5 m for the others).The resistivity meter automatically exploits, according to a pre-programed sequence, all possible positions of transmission and recep-tion on these electrodes in order to cover the study zone horizontallyand vertically. The electrical measurements were taken according to aWenner-Schlumberger configuration (a hybrid of the Wenner andSchlumberger device) along a rectilinear profile. This device is moder-ately sensitive to both lateral and depth variations in resistivity and is

Fig. 3. Site topography with location of electric profiles (black lines), distinguishing those in the storage zone (yellow circles) from those in the surrounding area (white circles). (Forinterpretation of the references to color in this figure legend, the reader is referred to the web version of this article.)
64 V. Bichet et al. / Engineering Geology 211 (2016) 61–73
a good compromise between theWenner device (sensitive to horizontalstructures) and the dipole-dipole (sensitive to vertical structures)(Loke, 2012). Thus, the Wenner-Schlumberger is particularly welladapted to grounds such as landfills that present both horizontal andvertical structures. The characteristics of each profile are presented inTable 1.
Concerning the acquisition set up, the injection time per cycle was500 ms and the registered value corresponded to a stack of from 3 to6 measurements with a maximum admitted error of 3%. The minimaltension requested for a valid measurement was 50 mV at the potentialdipole. At least 16 depth levels were prospected and, depending onthe length of the profiles, from 600 to 925 quadripoles were measured.Finally, topography profiles and electrode locations were measured at agiven station to provide geometric correction for apparent resistivitycalculation.
2.4. Treatment and modeling of data
Acquired data were filtered to eliminate negative values and valueswith a standard deviation N1% for both measurements at the samepoint. For each profile b10% of the values were rejected.
The apparent resistivity values calculated from measures of the po-tential difference between the electrodesM andN furnish an estimationof the geoelectrical parameters of the environment, but do not indicatethe resistivity and real form of the subsoil components (Samouëlian etal., 2005). Measurements are represented in the form of a pseudo-view of the repartition of apparent resistivity along the profile, wherethe vertical axis corresponds to a pseudo-depth. After interpretation ofthe pseudo-view by inversion using the software Res2DInv (GeotomoSoftware), a view is obtained of the repartition of the subsoil's “real” re-sistivity in function of depth. The inversion of the data is established fol-lowing an iterative process through which an attempt is made tominimize the gap between the values of the interpreted and the mea-sured apparent resistivity. The RMS error (root-mean-square error)
quantifies this gap and evaluates the quality of the inversion at each it-eration. For the set of profiles, a test of up to 6 iterations was processedto reduce the difference between measured data and the calculatedmodel. It showed that the gain on the RMS error was generally b1%after the fourth iteration (Fig. 4). Under these conditions, it was decidedto limit the number of iterations to 4 to avoid distorting real resistivityand to limit model errors (Loke, 2012).
The RMS error valueswere found to be between 9.4 and 37%, usuallyhigher in profiles crossing the OL and NC landfills (15 to 37%; mean at25.8% – Fig. 4) compared to the profiles located outside of the landfills(9.4 to 22.6%; mean at 15.8%). These high values can be assigned to lo-calized heterogeneities due to materials with a high resistivity contrast(Georgaki et al., 2008). Though expected for the landfills this is moresurprising for the profiles calculated on the periphery. However, profileswith RMS errors ranging from 20 to 37% were nevertheless exploited.
Finally, the data were interpolated with the software Surfer (GoldenSoftware) in order to obtain a 2D model of repartition of “real” resistiv-ity values in the subsoil.
3. Results and discussion
The profiles highlight the presence of contrasting materials. Theelectrical resistivity values, in Ω m, appear in a common color scale toallow a homogeneous visualization of their distribution in the storagezone and its surroundings. The layers ranging from dark to light blue(b20 Ω m) correspond to conductive zones, whereas the red to brownzones indicate zones of poor conductivity (N300 Ω m).
3.1. Structure, saturation and leachate circulations in the storage zone
Profiles P1, P2 and P3 (NE-SW profiles) are shown in Fig. 5; the NW-SE profiles (P4 to P8) are shown in Fig. 6. All these profiles illustrate thestorage zone.

Table1
Characteristicsof
electrical
profi
les.
Profi
leDate
System
used
Characteristics(len
gth(L);
Inter-electrod
ega
p(ɑ))
P107
/201
1Sy
scal
R1+
Switch
Wen
ner-Schlum
berger;L=
175m;ɑ=
5m
P208
/200
9Lu
ndW
enne
r-Schlum
berger;L=
283,5m;ɑ=
4,5m
P307
/201
1Sy
scal
R1+
Switch
Wen
ner-Schlum
berger;L=
175m;ɑ=
5m
P408
/200
9Lu
ndW
enne
r-Schlum
berger;L=
283,5m;ɑ=
4,5m
P507
/201
1Sy
scal
R1+
Switch
Wen
ner-Schlum
berger;L=
175m;ɑ=
5m
P607
/201
1Sy
scal
R1+
Switch
Wen
ner-Schlum
berger;L=
175m;ɑ=
5m
P704
/201
1Sy
scal
R1+
Switch
Wen
ner-Schlum
berger;L=
175m;ɑ=
5m
P807
/201
1Sy
scal
R1+
Switch
Wen
ner-Schlum
berger;L=
175m;ɑ=
5m
P905
/201
0Sy
scal
R1+
Switch
Wen
ner-Schlum
berger;L=
355m;ɑ=
5m
P10
07/201
0Sy
scal
R1+
Switch
Wen
ner-Schlum
berger;L=
175m;ɑ=
5m
P11
07/201
0Sy
scal
R1+
Switch
Wen
ner-Schlum
berger;L=
175m;ɑ=
5m
P12
07/201
0Sy
scal
R1+
Switch
Wen
ner-Schlum
berger;L=
175m;ɑ=
5m
P13
04/201
1Sy
scal
R1+
Switch
Wen
ner-Schlum
berger;L=
175m;ɑ=
5m
P14
07/201
0Sy
scal
R1+
Switch
Wen
ner-Schlum
berger;L=
265m;ɑ=
5m
P15
07/201
1Sy
scal
R1+
Switch
Wen
ner-Schlum
berger;L=
175m;ɑ=
5m
P16
04/201
1Sy
scal
R1+
Switch
Wen
ner-Schlum
berger;L=
175m;ɑ=
5m
P17
04/201
1Sy
scal
R1+
Switch
Wen
ner-Schlum
berger;L=
175m;ɑ=
5m
P18
04/201
1Sy
scal
R1+
Switch
Wen
ner-Schlum
berger;L=
175m;ɑ=
5m
P19
04/201
1Sy
scal
R1+
Switch
Wen
ner-Schlum
berger;L=
175m;ɑ=
5m
P20
07/201
0Sy
scal
R1+
Switch
Wen
ner-Schlum
berger;L=
175m;ɑ=
5m
P21
05/201
0Sy
scal
R1+
Switch
Wen
ner-Schlum
berger;L=
265m;ɑ=
5m
Fig. 4. Change of mean RMS error for ERT profiles versus number of iterations.
65V. Bichet et al. / Engineering Geology 211 (2016) 61–73
3.1.1. The old landfill (OL)At the beginning of P2 (0–95m) (Fig. 5B), poorly conductive ground
(ρ N 300Ωm) corresponds to the existing substratum (schists), accord-ing to views from drilling surveys (Belle, 2008) and the observationsmade while preparing the landfill area. Located from 55 to 88 m fromthe profile origin (NE), the least resistant layer observed from the sur-face (ρ ≈ 200 Ω m) is characterized by a bank of clay and shale thatlies upon a poorly conductive embankment (ρ N 760 Ω m) which isalso observed at the beginning of lines P1 and P3 (Fig. 5A and C).
The embankment is in direct contact with an extended zone of con-ductivity that corresponds to the old landfill (OL) (ρ b 30 Ω m). Theseelectrical resistivity values are in accordance with published valuesvarying from 1.5 to about 20 Ω m (Meju, 2006) and which may reachabout 40 Ω m when wastes are not saturated (Chambers et al., 2006).In the heart of the waste mass, several zones of greater conductivity(ρ b 20 Ω m) are visible, reflecting water saturation of wastes and/orthe existence of leachate circulation. Based on the landfill's exploitationphases, the real depth of the OL varies from 10 to 15 m and the wastesare in direct contact with the previously scraped and denuded substra-tum. However, along lines P2 and P3, the conductive zone associatedwith the waste mass in the landfill extends below the theoretical baseof the site along a thickness of 5–15 m. This observation is probablydue to a deep leachate migration, the saturated substratum resistivitybeing reduced under the weight of the mass. In fact, seepage of heavilyloaded leachates beneath the base of the landfill generates an intake ofions in the substratum, resulting in a decrease in electrical resistivity inthe surrounding environment (Meju, 2006). The waste/substrate inter-face does not appear clearly along lines P2 and P3, whereas it is well de-fined along P1. Hydric conditions within the waste mass being variableover time due to the wide variation in rainfall in the area, the flow of P1leachate may possibly be detected by reiterating the same measure-ments taken at other moments. An increasing resistivity gradient is ob-served beneath the landfill, indicating that leachate mineralizationdecreases with depth (at the base: ρ b 20 Ω m, and from 5 to 15 m be-neath the base: ρ N 50Ωm). In addition to leachatemigration in the su-perficial fringe of the substratum, a deep vertical seepage N20m thick isvisible along lines P1 and P2, from 75 to 85m and 188 to 215m, respec-tively. Themineralization of infiltrated leachates is heavier along line P2(ρ=5–15Ωm) than along P1 (ρ=10–20Ωm). At depth, the dilutionof P1 leachates is rapid. This heavy seepage zone may be explained bythe presence of the juxtaposed watertight NC whose protective linerforms a hydraulic barrier preventingflow toward the SWand thus caus-ing the water to infiltrate vertically. In addition, the drainage systeminstalled at the foot of the OL, along with the drains below the trench,capture the leachates and halt their progression toward the SW. LineP3 does not indicate this phenomenon since it is situated solely withinthe OL.

Fig. 5. P1, P2 and P3 electric profiles traced over the entire storage zone (orientation NE-SW).
66 V. Bichet et al. / Engineering Geology 211 (2016) 61–73
Lines P4 and P5 (Fig. 6) confirm the existence of leachate migrationbeneath the base of the OL. In the transversal part above the OL (profileP4) (Fig. 6A), the infiltration fringe progressively deepens as it movesfrom the SE to the NW where it attains a thickness of approximately10 m. The average resistivity of this zone (ρ = 20–50 Ω m) indicatesthe presence of leachates whose mineralization is weaker than that ofthe leachates collected downstream (Electrical Conductivity (EC) =2150–3220 μS cm−1). Their mineralization, however, measured in pie-zometer PZ5 situated hydraulically upstream (EC = 80–134 μS cm−1),remains higher than in the groundwater which is not influenced bythe landfill. The seepage zone observed on line P5 is of greater impor-tance, asmuch by its thickness (N15m) as by its leachatemineralization(ρ = 5–12 Ω m) (Fig. 6B).
3.1.2. Interface of the two cellsThe contact zone between the OL and the NC is covered by a layer of
inert waste used to join the landfill's two cells. This material is less con-ductive than the otherwastes and, in function of the specific profile (Fig.5A, B), is of variable thickness and area. Profile P6 (Fig. 6C), located inthe hinge area between the two cells, confirms the presence of a poorlyconductive surface layer corresponding to inert waste found on the em-bankment separating the two cells and of a thickness apparently noN8 m. This first layer covers a conductive and extended layer attributedto leachate seepage in the substratum since, at this place, no shredded
waste lies beneath the layer of inert waste. Profile 6 does not totally in-tercept the deep vertical seepage zone observed on P1 and P2 (Fig. 5)since the substratum is visible at the base of the profile or therefore con-firms the extremity of the leachate plume situated after the vertical in-filtration zone, beyond the NW front of the OL mass.
3.1.3. The new cell (NC)Along lines P1 and P2, a conductive surface zone is observed, from
105 to 150m and from about 215 to 240m, respectively. It is comprisedof the shreddedwaste in thewatertight NC. Zones of greater conductiv-ity are visible within the NC (ρ b 20 Ω m) and show saturation. On thesurface, along line P1, a less conductive ground (ρ=100–220Ωm) cor-responds to materials used for the modeling of the final cover, a layernot visible on line P2, likely due to its shallow depth. At the SW extrem-ity of the new cell, the slightly conductive zone found on the surface(ρ N 200Ωm) corresponds to bulky waste which shows a higher resis-tivity than deeperwaste; thismay be due to the high proportion of non-shredded plasticswith a strong insulatingpower. In addition to the elec-trical resistivity varying inversely with water content (Grellier et al.,2007), the high resistivity values of bulky waste may indicate a lowwater content.
On line P1, it appears that substratum contamination takes place be-neath the new cell whereas it is not visible on line P2. This will be ad-dressed again below. At the base of the cell, on line P2, resistivity

Fig. 6. P4, P5 (traced over the old landfill: orientationNW-SE), P6 (located at the interface between the old landfill and the new cell), P7 and P8 (located in thenew cell) profiles traced overthe old landfill (orientation NW-SE).
67V. Bichet et al. / Engineering Geology 211 (2016) 61–73
increases (ρ=50–100Ωm), reflecting the efficacy of the base draininglayer which progressively evacuates the leachates. The substratum isvisible a few meters below the base of the new cell. At the end of theprofile line the NC is bordered by a zone of low conductivity(ρ N 760 Ω m) corresponding to a wall of compacted schist. Line P3does not show the NC since it passes a few meters distant.
Lines P7 (Fig. 6D) and P8 (Fig. 6E)were traced perpendicularly to theprevious profiles. On the surface, a conductive zone was observed forboth profiles, whose length corresponds to that of the new cell. Humid-ity distribution within the waste was homogeneous along P7 whilemore heterogeneous along P8. This is closely related to the type ofwaste buried in these places. In fact, along line P7 thewaste is essential-ly shredded household refuse which allows good leachate circulation,whereas along line P8 a high proportion of bulky waste with a weak
capacity for water retention was discharged among the shreddedhousehold refuse that is easily saturated with water.
To the SSE (P7) and SE (P8), the conductive zone is about 8 m thickwhich corresponds to the height of the buriedwaste. In contrast, a deep-ening of this zone is observed in the NNW (P7) and NW (P8) directionswhichmay reach a depth of 20m. Given that the waste was dischargedat a nearly uniform height throughout the landfill (6–8 m) and that thewaste/substratum interface is defined by an active security barrier atthe bottom of the cell (geotextiles, Aleya et al., 2007), this extra thick-ness is abnormal. Beneath the cell there is a drainage system for its cir-culating waters, found only in the cell's western part where thissupplementary thickness is observed. A failure in the sub-cell waterdrainage must thus be considered, with seepage of these waters,drained and polluted by leachates, through a depth of several meters.
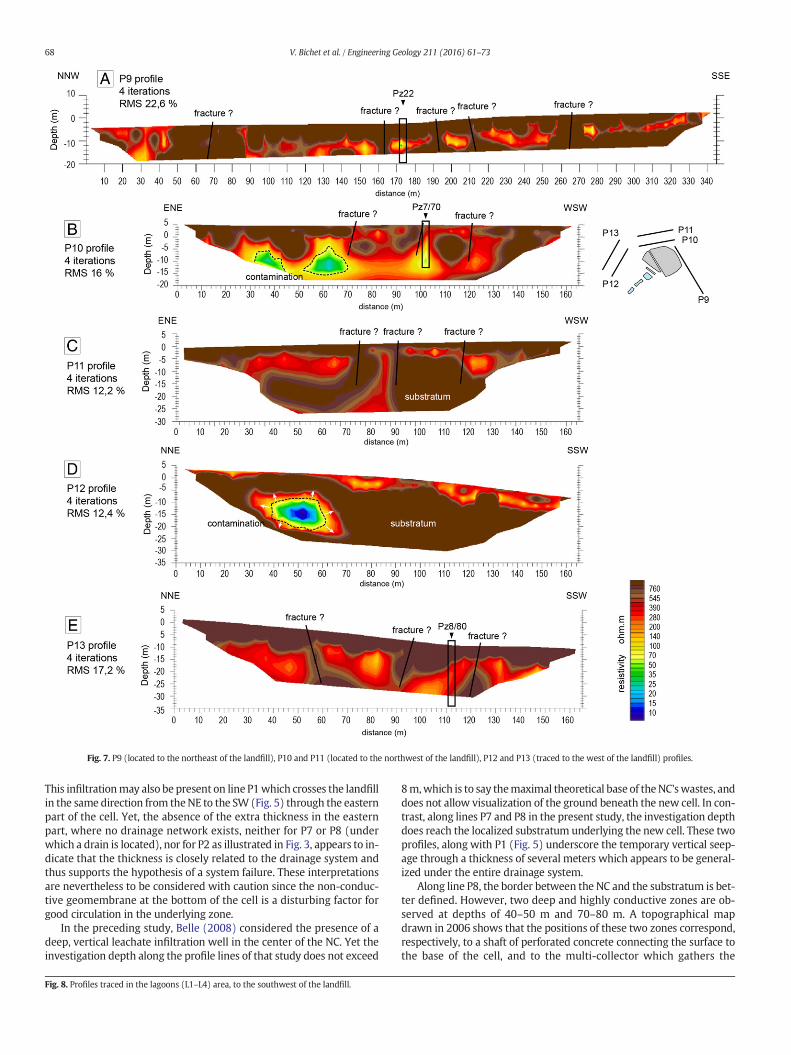
Fig. 7. P9 (located to the northeast of the landfill), P10 and P11 (located to the northwest of the landfill), P12 and P13 (traced to the west of the landfill) profiles.
68 V. Bichet et al. / Engineering Geology 211 (2016) 61–73
This infiltrationmay also be present on line P1which crosses the landfillin the same direction from theNE to the SW (Fig. 5) through the easternpart of the cell. Yet, the absence of the extra thickness in the easternpart, where no drainage network exists, neither for P7 or P8 (underwhich a drain is located), nor for P2 as illustrated in Fig. 3, appears to in-dicate that the thickness is closely related to the drainage system andthus supports the hypothesis of a system failure. These interpretationsare nevertheless to be considered with caution since the non-conduc-tive geomembrane at the bottom of the cell is a disturbing factor forgood circulation in the underlying zone.
In the preceding study, Belle (2008) considered the presence of adeep, vertical leachate infiltration well in the center of the NC. Yet theinvestigation depth along the profile lines of that study does not exceed
Fig. 8. Profiles traced in the lagoons (L1–L4) area, to the southwest of the landfill.
8m,which is to say themaximal theoretical base of theNC'swastes, anddoes not allow visualization of the ground beneath the new cell. In con-trast, along lines P7 and P8 in the present study, the investigation depthdoes reach the localized substratum underlying the new cell. These twoprofiles, along with P1 (Fig. 5) underscore the temporary vertical seep-age through a thickness of several meters which appears to be general-ized under the entire drainage system.
Along line P8, the border between the NC and the substratum is bet-ter defined. However, two deep and highly conductive zones are ob-served at depths of 40–50 m and 70–80 m. A topographical mapdrawn in 2006 shows that the positions of these two zones correspond,respectively, to a shaft of perforated concrete connecting the surface tothe base of the cell, and to the multi-collector which gathers the

69V. Bichet et al. / Engineering Geology 211 (2016) 61–73

70 V. Bichet et al. / Engineering Geology 211 (2016) 61–73
leachates from the old landfill, that is to say both the seepage from theNC and the waters circulating beneath it. Two leaks may exist at theseplaces, suggesting a failure of the geomembrane whose installation insanitary facilities is always difficult. The deficiencies of geomembraneliners placed at the bottom of landfills are frequent, with as many as17 failures per hectare (Giroud and Bonaparte, 1989). Even if the linersare of excellent quality, one or two leaks per hectare is inevitable(Katsumi et al., 2001).
3.2. Spatial follow up of leachates around the storage zone
The preceding profiles confirm the existence of a pollution plumebeneath the storage zone. To determine its extent, 13 complementaryprofiles, noted from P9 to P21 (Figs. 7, 8 and 9) were traced outside ofthe landfill influence zone: in the northeast (P9), the northwest (P10and P11), in the west (P12 and P13), the southwest (P14 to P19) andin the southeast (P20 and P21).
3.2.1. Northeastern partLine P9 (Fig. 7A) indicates the presence of discontinuous flows en-
countered from 0 to 4 m in the SE, and then beyond from 8 m for thefirst encounter toward the NW. The substratum appears to befragmented into a vast network of faults. This may produce the discon-tinuousflows that have been observed. The subvertical schistosity in theEtueffont schist (Belle, 2008) may also be at the origin of these discon-tinuous flows. Resistivity values ranging from50 to 300Ωmcorrespondto weakly mineralized waters. These results are in accordance with theconductivity values measured in piezometer PZ22 (CE = 32–150 μS cm−1, piezometric level at 4.5 m), situated a few meters down-stream from the profile line and in piezometer PZ5 placed 50 m up-stream (CE = 80–134 μS cm−1). Piezometer PZ22 alone is reported byprojection in the view because PZ5 was too far. The less conductiveground (ρ N 900Ωm−1) corresponds to substratum schist. No leachatemigration was observed NE of the site.
3.2.2. Northwestern partOn line P10 (Fig. 7B), the poorly conductive ground (ρ N 760Ωm−1)
corresponds to dry substratum.A conductive layer is visible underneath,indicating that the substratum is saturated with water which is con-firmed by its presence in piezometers PZ7 and PZ70 situated 5m down-stream from the profile. In the NE two concentric zones appear whoseresistivity diminishes toward the center, reaching a value in the areaof 14 Ω m. These zones correspond to more highly mineralized watersthan those found in PZ7 andPZ70 located 5m fromP10. Thismay reflectthe presence or lateral infiltration of diluted leachates. The zones are nolonger visible in P11 located 50 m upstream from P10. To the NW theleachate plume is of limited reach. We infer diffusion-related disconti-nuities (faults, fractures or shear zones) of the substratum as illustratedin profiles 10, 11, 12 and 13 reflecting the secondary fracture networkdirected N135–N155 (see 2.1), in addition to the main N255–N260schistosity.
3.2.3. Western partProfile P12 (Fig. 7D), approximately 50 m from the storage zone,
presents a weakly conductive substratum (ρ N 760 Ω m), covered onthe surface by a layer of more conductive soils no thicker than 7 m. Nogeological reconnaissance was carried out at this place, but other wellsdrilled in the sector may lead one to suppose that this conductive hori-zon corresponds to shear gouge mixed with schist rock or heavily frac-tured schists. In fact, altered and fractured zones present weakerresistivity than the healthy substratum due to increased porosity anda high shear gouge content (Matsui et al., 2000; Casado et al., 2015).In the eastern part of line P12, a concentric zone more highly mineral-ized than the groundwater crosses the substratum at a depth of tenme-ters. It indicates the presence of a leachate plume which generallyfollows the N270, in approximate agreement with the schistosity
direction (N255–260). The resistivity growing from the center towardthe exterior shows a radial dilution and proves that its extent is limited.This contaminated zone therefore corresponds to a diverticulation ofthe plume which is guided by foliation and the possibly fracturedzones of the substratum.
The leachate plume is not located on profile P13 (Fig. 7E) and doesnot appear to extend westward. However, the absence of plume to thewest does not mean that leachate progression is interrupted after pro-file P12. The discontinuities of the substratum may distribute a dilutedplume at a depth below the profile. The groundwater piezometry asseen in Fig. 2 indicates that the distribution of contaminant to the NWmay extend over a long distance since the local flow indicates a N-S di-rection in this sector.
3.2.4. Southwestern partThe 6 profile lines, P14 to P19, traced downstream from the storage
zone at the outlet of each of the lagooning ponds (Fig. 8), highlight thecontrast between these very different zones: groundwater circulation(ρ b 300Ω m) and the non-saturated substratum (ρ N 760Ω m).
Lagooning ponds are generally located along the axis of a thalweg.Their influences have been reported as projections along the profilelines. A zone more conductive than the sector's groundwater is visiblein the projected influences of the ponds in all the profiles. This demon-strates a surfacemigration of leachates beyond the ponds. Their zones ofinfluence present a progressively increasing resistivity from pond 1 topond 4, ρ= 25–50Ωm and ρ= 60–110 Ωm, respectively. This gradi-ent is the consequence of leachate treatment in which mineralizationdecreases from pond to pond, according to measurements of electricalconductivity taken in each pond. Yet, these filtered lagooning watersare passably less mineralized (by a factor of 5–10) than the waters un-dergoing treatment. Only a slight diffusion of highly diluted leachatesthrough the layer of compacted clay is detected. At depth the ground-water appears to drain following the thalweg axis.
Along the P14 profile line (Fig. 8A), situated between the new celland pond 1, the two small conductive zones in the site's northwesternpart probably correspond to slight pollution from the old landfill. Thisanomaly, underscored on profile line P3 130–140mdistant (Fig. 9A), in-dicates an east-to-west plume migration.
3.2.5. Southeastern partAs seen above for P3 (Fig. 9A), in the southwestern part of the stor-
age zone, leachates from the old landfill infiltrate at the base through athickness of N10m, diluting as they seep downwards. Lines P20 and P21traced in the southeastern part of the site, beyond the influence of thelandfill, are presented in Fig. 9B and C. Profile P20 (Fig. 9B), situated30 m from the landfill's influence zone, shows poorly conductive landon the surfacewhich corresponds to the schist present. A zone of under-lying conductivity is visible. The southwestern part of the zone (P21)(Fig. 9C) presents resistivity values near those of the groundwater read-ings taken nearby in PZ4 (ρzone= 100–250Ωm; ρwater PZ4 ≈ 190Ωm).This contaminationmay be from south of the OL and is not entirely con-sistentwith the piezometry. The southward spread of the contaminantsis probably limited by the NE-SW flow of regional groundwater (Fig. 2).
In the heart of the northeastern part, the zone includes a more con-ductive fringe (ρ = 20–50 Ω m), no doubt corresponding to dilutedleachates from the old landfill, that spreads horizontally through theschists. At depth, leachates stagnate and do not migrate toward thewest-southwest.Within the thirtymeters that separate the twoprofiles,leachate dilution takes place along a horizontal gradient, probably fa-vored by the flow from thewater table in thewest-east direction as em-phasized by Belle (2008).
Profile P21, 40 m distant from P20, shows a discontinuous flow ofwater at varying depths, and a resistivity comparable to that of ground-water as in the SW part of profile 20. The extent of the pollution plumeis limited to the SE part of the site since the plume is no longer visible at
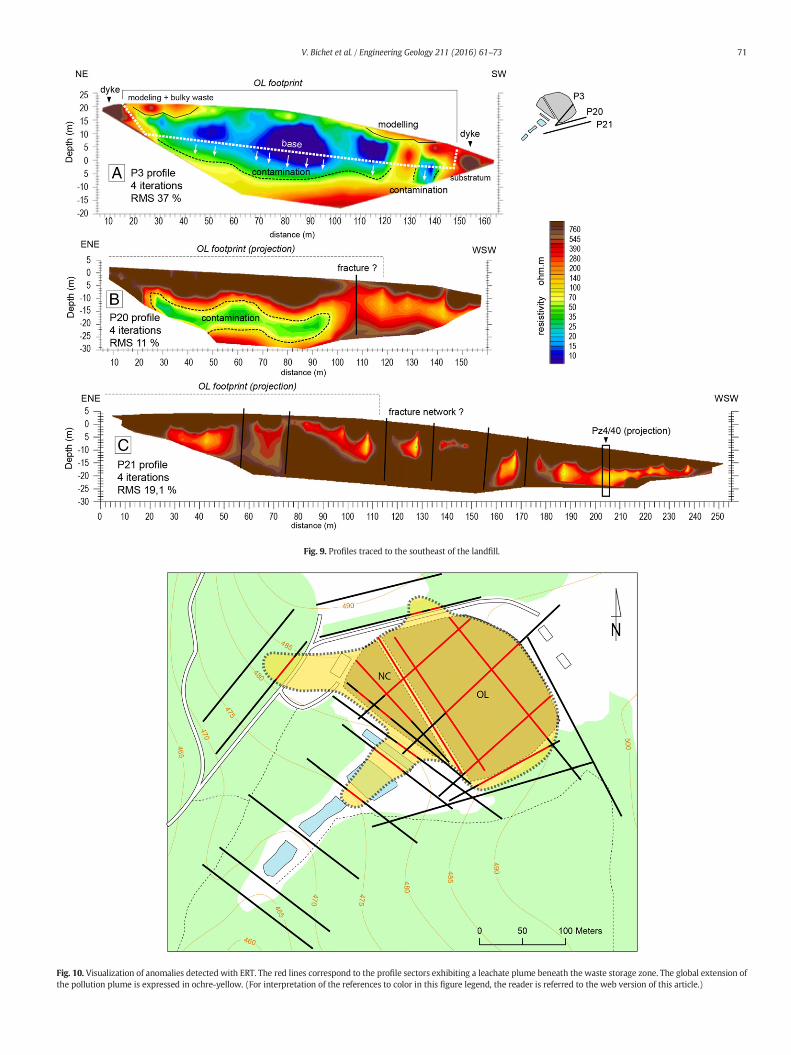
Fig. 9. Profiles traced to the southeast of the landfill.
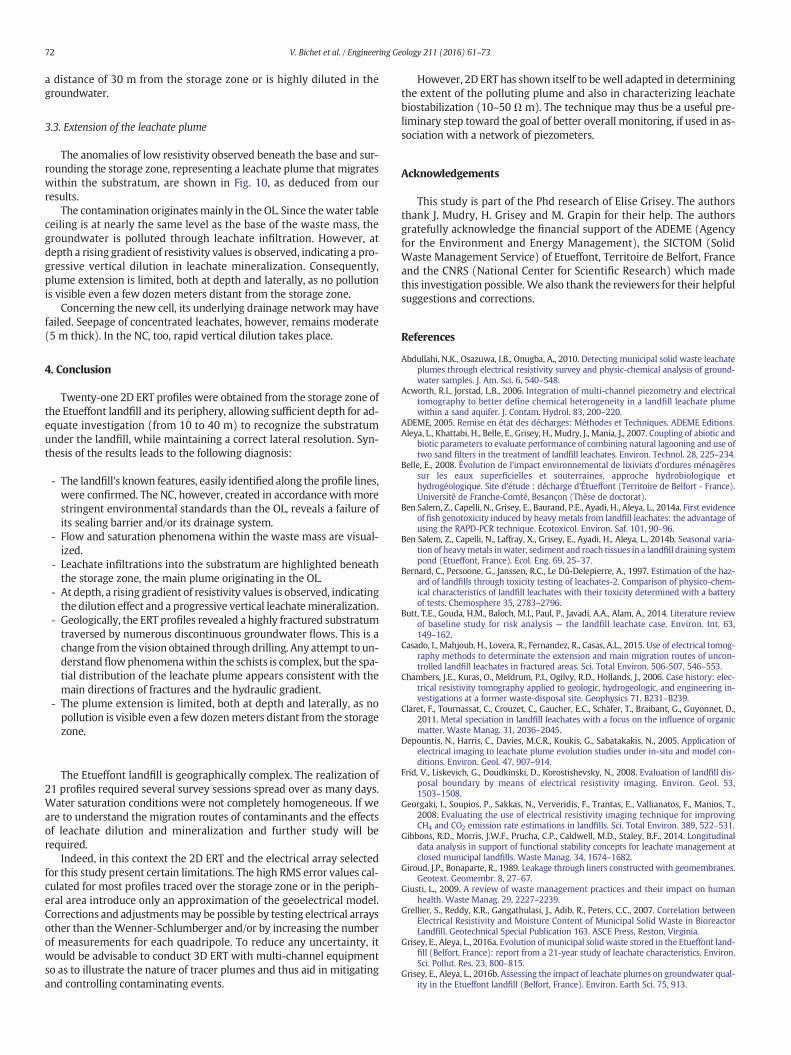
Fig. 10. Visualization of anomalies detected with ERT. The red lines correspond to the profile sectors exhibiting a leachate plume beneath the waste storage zone. The global extension ofthe pollution plume is expressed in ochre-yellow. (For interpretation of the references to color in this figure legend, the reader is referred to the web version of this article.)
71V. Bichet et al. / Engineering Geology 211 (2016) 61–73
72 V. Bichet et al. / Engineering Geology 211 (2016) 61–73
a distance of 30 m from the storage zone or is highly diluted in thegroundwater.
3.3. Extension of the leachate plume
The anomalies of low resistivity observed beneath the base and sur-rounding the storage zone, representing a leachate plume that migrateswithin the substratum, are shown in Fig. 10, as deduced from ourresults.
The contamination originatesmainly in the OL. Since thewater tableceiling is at nearly the same level as the base of the waste mass, thegroundwater is polluted through leachate infiltration. However, atdepth a rising gradient of resistivity values is observed, indicating a pro-gressive vertical dilution in leachate mineralization. Consequently,plume extension is limited, both at depth and laterally, as no pollutionis visible even a few dozen meters distant from the storage zone.
Concerning the new cell, its underlying drainage network may havefailed. Seepage of concentrated leachates, however, remains moderate(5 m thick). In the NC, too, rapid vertical dilution takes place.
4. Conclusion
Twenty-one 2D ERT profiles were obtained from the storage zone ofthe Etueffont landfill and its periphery, allowing sufficient depth for ad-equate investigation (from 10 to 40 m) to recognize the substratumunder the landfill, while maintaining a correct lateral resolution. Syn-thesis of the results leads to the following diagnosis:
- The landfill's known features, easily identified along the profile lines,were confirmed. The NC, however, created in accordance withmorestringent environmental standards than the OL, reveals a failure ofits sealing barrier and/or its drainage system.
- Flow and saturation phenomena within the waste mass are visual-ized.
- Leachate infiltrations into the substratum are highlighted beneaththe storage zone, the main plume originating in the OL.
- At depth, a rising gradient of resistivity values is observed, indicatingthe dilution effect and a progressive vertical leachatemineralization.
- Geologically, the ERT profiles revealed a highly fractured substratumtraversed by numerous discontinuous groundwater flows. This is achange from the visionobtained through drilling. Any attempt to un-derstandflowphenomenawithin the schists is complex, but the spa-tial distribution of the leachate plume appears consistent with themain directions of fractures and the hydraulic gradient.
- The plume extension is limited, both at depth and laterally, as nopollution is visible even a few dozenmeters distant from the storagezone.
The Etueffont landfill is geographically complex. The realization of21 profiles required several survey sessions spread over as many days.Water saturation conditions were not completely homogeneous. If weare to understand the migration routes of contaminants and the effectsof leachate dilution and mineralization and further study will berequired.
Indeed, in this context the 2D ERT and the electrical array selectedfor this study present certain limitations. The high RMS error values cal-culated for most profiles traced over the storage zone or in the periph-eral area introduce only an approximation of the geoelectrical model.Corrections and adjustmentsmay be possible by testing electrical arraysother than theWenner-Schlumberger and/or by increasing the numberof measurements for each quadripole. To reduce any uncertainty, itwould be advisable to conduct 3D ERT with multi-channel equipmentso as to illustrate the nature of tracer plumes and thus aid in mitigatingand controlling contaminating events.
However, 2D ERT has shown itself to bewell adapted in determiningthe extent of the polluting plume and also in characterizing leachatebiostabilization (10–50 Ω m). The technique may thus be a useful pre-liminary step toward the goal of better overall monitoring, if used in as-sociation with a network of piezometers.
Acknowledgements
This study is part of the Phd research of Elise Grisey. The authorsthank J. Mudry, H. Grisey and M. Grapin for their help. The authorsgratefully acknowledge the financial support of the ADEME (Agencyfor the Environment and Energy Management), the SICTOM (SolidWaste Management Service) of Etueffont, Territoire de Belfort, Franceand the CNRS (National Center for Scientific Research) which madethis investigation possible.We also thank the reviewers for their helpfulsuggestions and corrections.
References
Abdullahi, N.K., Osazuwa, I.B., Onugba, A., 2010. Detecting municipal solid waste leachateplumes through electrical resistivity survey and physic-chemical analysis of ground-water samples. J. Am. Sci. 6, 540–548.
Acworth, R.I., Jorstad, L.B., 2006. Integration of multi-channel piezometry and electricaltomography to better define chemical heterogeneity in a landfill leachate plumewithin a sand aquifer. J. Contam. Hydrol. 83, 200–220.
ADEME, 2005. Remise en état des décharges: Méthodes et Techniques. ADEME Editions.Aleya, L., Khattabi, H., Belle, E., Grisey, H., Mudry, J., Mania, J., 2007. Coupling of abiotic and
biotic parameters to evaluate performance of combining natural lagooning and use oftwo sand filters in the treatment of landfill leachates. Environ. Technol. 28, 225–234.
Belle, E., 2008. Évolution de l'impact environnemental de lixiviats d’ordures ménagèressur les eaux superficielles et souterraines, approche hydrobiologique ethydrogéologique. Site d'étude : décharge d'Étueffont (Territoire de Belfort - France).Université de Franche-Comté, Besançon (Thèse de doctorat).
Ben Salem, Z., Capelli, N., Grisey, E., Baurand, P.E., Ayadi, H., Aleya, L., 2014a. First evidenceof fish genotoxicity induced by heavy metals from landfill leachates: the advantage ofusing the RAPD-PCR technique. Ecotoxicol. Environ. Saf. 101, 90–96.
Ben Salem, Z., Capelli, N., Laffray, X., Grisey, E., Ayadi, H., Aleya, L., 2014b. Seasonal varia-tion of heavymetals inwater, sediment and roach tissues in a landfill draining systempond (Etueffont, France). Ecol. Eng. 69, 25–37.
Bernard, C., Persoone, G., Janssen, R.C., Le Dû-Delepierre, A., 1997. Estimation of the haz-ard of landfills through toxicity testing of leachates-2. Comparison of physico-chem-ical characteristics of landfill leachates with their toxicity determined with a batteryof tests. Chemosphere 35, 2783–2796.
Butt, T.E., Gouda, H.M., Baloch, M.I., Paul, P., Javadi, A.A., Alam, A., 2014. Literature reviewof baseline study for risk analysis — the landfill leachate case. Environ. Int. 63,149–162.
Casado, I., Mahjoub, H., Lovera, R., Fernandez, R., Casas, A.L., 2015. Use of electrical tomog-raphy methods to determinate the extension and main migration routes of uncon-trolled landfill leachates in fractured areas. Sci. Total Environ. 506-507, 546–553.
Chambers, J.E., Kuras, O., Meldrum, P.I., Ogilvy, R.D., Hollands, J., 2006. Case history: elec-trical resistivity tomography applied to geologic, hydrogeologic, and engineering in-vestigations at a former waste-disposal site. Geophysics 71, B231–B239.
Claret, F., Tournassat, C., Crouzet, C., Gaucher, E.C., Schäfer, T., Braibant, G., Guyonnet, D.,2011. Metal speciation in landfill leachates with a focus on the influence of organicmatter. Waste Manag. 31, 2036–2045.
Depountis, N., Harris, C., Davies, M.C.R., Koukis, G., Sabatakakis, N., 2005. Application ofelectrical imaging to leachate plume evolution studies under in-situ and model con-ditions. Environ. Geol. 47, 907–914.
Frid, V., Liskevich, G., Doudkinski, D., Korostishevsky, N., 2008. Evaluation of landfill dis-posal boundary by means of electrical resistivity imaging. Environ. Geol. 53,1503–1508.
Georgaki, I., Soupios, P., Sakkas, N., Ververidis, F., Trantas, E., Vallianatos, F., Manios, T.,2008. Evaluating the use of electrical resistivity imaging technique for improvingCH4 and CO2 emission rate estimations in landfills. Sci. Total Environ. 389, 522–531.
Gibbons, R.D., Morris, J.W.F., Prucha, C.P., Caldwell, M.D., Staley, B.F., 2014. Longitudinaldata analysis in support of functional stability concepts for leachate management atclosed municipal landfills. Waste Manag. 34, 1674–1682.
Giroud, J.P., Bonaparte, R., 1989. Leakage through liners constructed with geomembranes.Geotext. Geomembr. 8, 27–67.
Giusti, L., 2009. A review of waste management practices and their impact on humanhealth. Waste Manag. 29, 2227–2239.
Grellier, S., Reddy, K.R., Gangathulasi, J., Adib, R., Peters, C.C., 2007. Correlation betweenElectrical Resistivity and Moisture Content of Municipal Solid Waste in BioreactorLandfill, Geotechnical Special Publication 163. ASCE Press, Reston, Virginia.
Grisey, E., Aleya, L., 2016a. Evolution ofmunicipal solidwaste stored in the Etueffont land-fill (Belfort, France): report from a 21-year study of leachate characteristics. Environ.Sci. Pollut. Res. 23, 800–815.
Grisey, E., Aleya, L., 2016b. Assessing the impact of leachate plumes on groundwater qual-ity in the Etueffont landfill (Belfort, France). Environ. Earth Sci. 75, 913.
73V. Bichet et al. / Engineering Geology 211 (2016) 61–73
Grisey, E., Belle, E., Dat, J., Mudry, J., Aleya, L., 2010. Survival of pathogenic and indicatororganisms in groundwater and landfill leachate through coupling bacterial enumera-tion with tracer tests. Desalination 261, 162–168.
Imhoff, P.T., Reinhart, D.R., Englund, M., Guérin, R., Gawande, N., Han, B., Jonnalagadda, S.,Townsend, T.G., Yazdani, R., 2007. Review of state of the art methods for measuringwater in landfills. Waste Manag. 27, 729–745.
Kallis, G., Buder, D., 2001. The EU water framework directive: measures and implications.Water Policy 3, 125–142.
Katsumi, T., Benson, C.H., Foose, G.J., Kamon, M., 2001. Performance-based design of land-fill liners. Eng. Geol. 60, 139–148.
Khattabi, H., Aleya, L., 2007. The dynamics of macro-invertebrate assemblages in responseto environmental change in four basins of the Etueffont landfill leachate (Belfort,France). Water Air Soil Pollut. 185, 63–77.
Kjeldsen, P., Barlaz, M.A., Rooker, A.P., Baun, A., Ledin, A., Christensen, T.H., 2002. Presentand long-term composition of MSW landfill leachate: a review. Crit. Rev. Environ. Sci.Technol. 32, 297–336.
Loke, M.H., 2012. Tutorial: 2-D and 3-D Electrical Imaging Surveys. (110 pp., http://www.geotomosoft.com/downloads.php, Tutorial Notes-19th October 2012 update).
Matsui, T., Park, S.G., Park, M.K., Matsuura, S., 2000. Relationship between Electrical Resis-tivity and Physical Properties of Rocks, GeoEng2000: an International Conference onGeotechnical & Geological Engineering: 19–24 November 2000, Melbourne Exhibi-tion and Convention Centre, Melbourne, Australia. Technomic Publishing, Pennsylva-nia, pp. 987–992.
Meju, M., 2006. Geoelectrical characterization of covered landfill sites: a process-orientedmodel and investigative approach. In: Vereecken, H., Binley, A., Cassiani, G., Revil, A.(Eds.), Applied Hydrogeophysics. NATO Series X, Springer, pp. 319–339 (Chapter 11).
Park, J.-K., Lee, J.-Y., Kim, T.-D., 2008. Statistical evaluation of groundwater quality aroudan uncontrolled landfill: implication for plume migration pathways. Geosci. J. 12,265–275.
Radulescu, M., Valerian, C., Yang, J., 2007. Time-lapse electrical resistivity anomalies dueto contaminant transport around landfills. Ann. Geophys. 50, 453–468.
Samouëlian, A., Cousin, I., Tabbagh, A., Bruand, A., Richard, G., 2005. Electrical resistivitysurvey in soil science: a review. Soil Tillage Res. 83, 173–193.
Soupios, P., Papadopoulos, I., Kouli, M., Georgaki, I., Vallianatos, F., Kokkinou, E., 2007. In-vestigation of waste disposal areas using electrical methods: a case study fromChania, Crete, Greece. Environ. Geol. 51, 1249–1261.
Vaudelet, P., Schmutz, M., Pessel, M., Franceschi, M., Guérin, R., Atteia, O., Blondel, A.,Ngomseu, C., Galaup, S., Rejiba, F., Bégassat, P., 2011. Mapping of contaminant plumeswith geoelectrical methods, a case study in urban context. J. Appl. Geophys. 75,738–751.
Weber, R., Watson, A., Forter, M., Oliaei, F., 2011. Persistent organic pollutants and land-fills: a review of past experiences and future challenges. Waste Manag. Res. 29,107–121.
Wilkinson, P.B., Meldrum, P.I., Kuras, O., Chambers, J.E., Holyoake, S.J., Ogilvy, R.D., 2010.High-resolution electrical resistivity tomography monitoring of a tracer test in a con-fined aquifer. J. Appl. Geophys. http://dx.doi.org/10.1016/j.jappgeo.2009.08.001.