spatial and temporal variability of net snow accumulation over the antarctic from ecmwf re-analysis...
TRANSCRIPT

INTERNATIONAL JOURNAL OF CLIMATOLOGY
Int. J. Climatol. 19: 697–724 (1999)
SPATIAL AND TEMPORAL VARIABILITY OF NET SNOWACCUMULATION OVER THE ANTARCTIC FROM ECMWF
RE-ANALYSIS PROJECT DATAJOHN TURNER*, WILLIAM M. CONNOLLEY, STEVEN LEONARD, GARETH J. MARSHALL and DAVID
G. VAUGHANBritish Antarctic Sur6ey, Natural En6ironment Research Council, High Cross, Madingley Road, Cambridge, CB3 0ET, UK
Recei6ed 31 October 1997Re6ised 4 No6ember 1998
Accepted 6 No6ember 1998
ABSTRACT
Forecasts from the ECMWF re-analysis project (ERA) covering the period 1979–1993 are used to examine the spatialand temporal distribution of net snow accumulation (precipitation minus evaporation) over the Antarctic continent.There is generally good agreement between the spatial distribution of net accumulation in the model data, when the15 year mean annual accumulation is considered, and the equivalent maps produced in earlier studies from in situdata. One of the major differences is the westerly displacement of the accumulation maximum on the western side ofthe Antarctic Peninsula as a result of the model orography having a high degree of smoothing in the east–westdirection. The mean annual net accumulation in the ERA data for the whole of the continent is 151 mm year−1,equivalent to a total accumulation of 2106×1012 kg year−1. The mean accumulation value is in reasonableagreement with the best estimates from glaciological data, which recent studies have suggested is in the range 150–170mm year−1. The lower value from ERA is partly a result of overestimation of evaporation/sublimation from the largeice shelves during the summer and spring, and an underestimation of the precipitation in the interior of the continent.The accumulation from the ERA data is the same as that computed from the operational ECMWF forecasts. Duringthe 15 year data period, the mean accumulation varied from 129.1 mm (1987) to 171.8 mm (1984). Considering thecontinent as a whole, net accumulation was at a minimum in the summer season, although in coastal parts of WestAntarctica, the minimum occurs in spring. The ERA accumulation data for the interior of the continent show noannual cycle and are significantly smaller than the available in situ measurements. At certain coastal sites in WestAntarctica there is a clear relationship between annual precipitation and cyclone activity, although in East Antarcticasuch a relationship is only apparent in monthly data. Copyright © 1999 Royal Meteorological Society.
KEY WORDS: Antarctica; snow accumulation; precipitation; ECMWF re-analysis; climate variability
1. INTRODUCTION
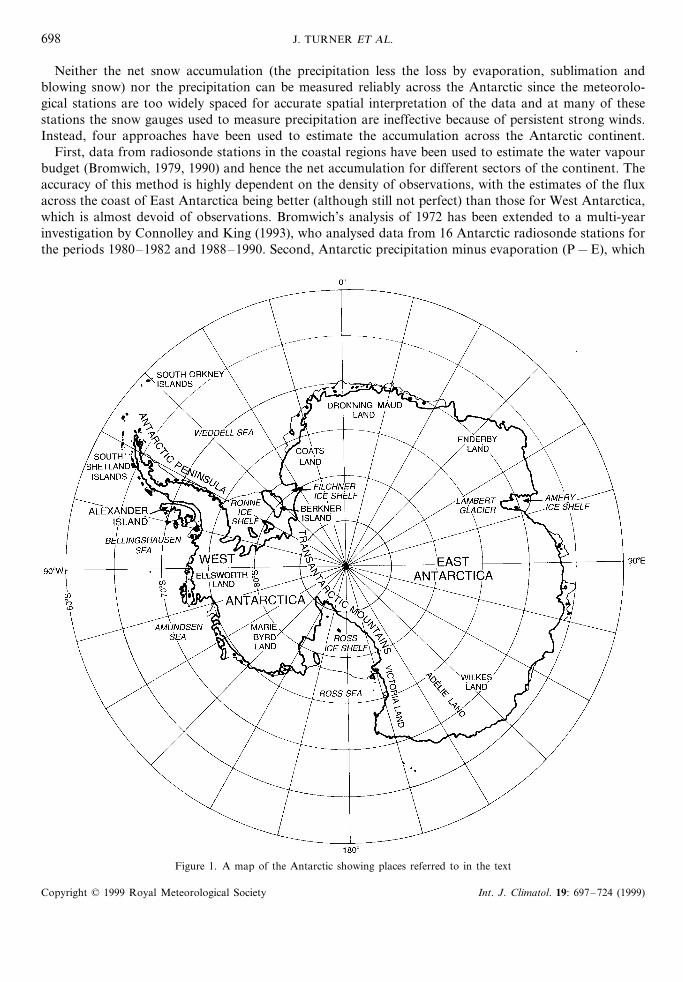
The Antarctic continent holds about 30×106 km3 of ice, which constitutes 91% of the world’s fresh waterice. This is held within a number of very large ice sheets and ice caps that vary in thickness across thecontinent, with the greatest depth being in East Antarctica, some 400 km inland of Dumont d’Urville,(Adelie Land) where it has a thickness of 4776 m (Drewry, 1983) (places referred to in the text are shownin Figure 1). If even a small percentage of this ice were to melt then there would be major environmentaland societal consequences through the attendant rise in sea level. There have, therefore, been many studiesinto the present mass balance of the Antarctic (essentially, the difference between the input of ice into thesystem via precipitation and the loss through iceberg calving and melting under the ice shelves) and howthis may change over the coming decades and centuries (e.g. Budd and Simmonds, 1991; Jacobs et al.,1992; Ohmura et al., 1996; Thompson and Pollard, 1997).
* Correspondence to: British Antarctic Survey, Natural Environment Research Council, High Cross, Madingley Road, Cambridge,CB3 0ET, UK. Tel.: +44 1223 221485; fax : +44 1223 362616; e-mail: [email protected]
CCC 0899–8418/99/070697–28$17.50Copyright © 1999 Royal Meteorological Society
J. TURNER ET AL.698
Neither the net snow accumulation (the precipitation less the loss by evaporation, sublimation andblowing snow) nor the precipitation can be measured reliably across the Antarctic since the meteorolo-gical stations are too widely spaced for accurate spatial interpretation of the data and at many of thesestations the snow gauges used to measure precipitation are ineffective because of persistent strong winds.Instead, four approaches have been used to estimate the accumulation across the Antarctic continent.
First, data from radiosonde stations in the coastal regions have been used to estimate the water vapourbudget (Bromwich, 1979, 1990) and hence the net accumulation for different sectors of the continent. Theaccuracy of this method is highly dependent on the density of observations, with the estimates of the fluxacross the coast of East Antarctica being better (although still not perfect) than those for West Antarctica,which is almost devoid of observations. Bromwich’s analysis of 1972 has been extended to a multi-yearinvestigation by Connolley and King (1993), who analysed data from 16 Antarctic radiosonde stations forthe periods 1980–1982 and 1988–1990. Second, Antarctic precipitation minus evaporation (P−E), which
Figure 1. A map of the Antarctic showing places referred to in the text
Copyright © 1999 Royal Meteorological Society Int. J. Climatol. 19: 697–724 (1999)
SNOW ACCUMULATION OVER THE ANTARCTIC 699
is approximately equal to the net accumulation, has been estimated using the atmospheric moisturebalance equation with the humidity and wind components being obtained from operational weatherforecast models. Bromwich et al. (1995) used operational output from the European Centre forMedium-range Weather Forecasts (ECMWF), US National Meteorological Center (NMC) and Aus-tralian Bureau of Meteorology (ABM) models to produce annual estimates of P−E for the years1985–1992. Third, actual fields of P−E as produced by the models are used (Genthon and Braun, 1995).This approach has the advantage that the spatial distribution of the quantity can be examined in muchmore detail, although there is the problem that none of the models produce an analysis of precipitationand the precipitation total for a period during a forecast has to be used. Finally, in situ measurements ofnet accumulation as determined from snow pits and ice cores have been used to estimate the totalaccumulation for the whole continent and particular regions (Giovinetto and Bentley, 1985; hereafterreferred to as GB).
In this paper the authors examine the temporal and spatial distribution of P−E across the Antarcticcontinent as given by the output of the ECMWF re-analysis (ERA) project (ECMWF, 1996; Gibson etal., 1996). This project undertook the considerable task of re-analysing all the atmospheric data that theCentre had collected since 1979, using the then current version of the ECMWF assimilation/forecastmodel. They produced a consistent 15 year series of analyses, which do not have the marked changes incharacteristics that are a feature of the series of operational analyses produced in near-real time. However,the data for the Antarctic that were available over the Global Telecommunications System will havechanged over the 15 years producing some, hopefully small, variations in the quality of the analyses in theseries. Nevertheless, this data set provides an excellent opportunity to examine the variability of theaccumulation over the Antarctic for a period during which a great deal is known about the atmosphericcirculation of the Southern Hemisphere and for which we have data on net accumulation from ice cores.The strength of the model lies in the opportunity to examine the spatial distribution of P−E at a highhorizontal resolution (�100 km) and the temporal variability on a range of time scales from daily eventsupwards. The data set also provides a mean field allowing us to study how the temporal variability ofP−E differs between the coastal region and the interior; it has been known for many years that theaccumulation regimes in these two areas are quite different. In the coastal areas, the vast majority of thesnowfall comes from synoptic-scale low pressure systems (Bromwich, 1988; Turner et al., 1995) that haveeither developed close to the coast or moved polewards from lower latitudes. However, in the interior,conventional weather systems are rarely found and most of the snow accumulation comes from ‘clear skyprecipitation’, also known as ‘diamond dust’ (Rusin, 1961; Radok and Lile, 1977; Sato et al., 1981).
The fields of P−E produced by the model are not exactly comparable with the measurements of netaccumulation as determined from the ice cores because of incompatability due to the model coastline usedand the effects of redistribution of snow by the wind on the ice cores. However, while in some limitedareas of the coastal region, such as in narrow valleys extending down to the coast, blowing snow can beresponsible for transporting a significant amount of snow off the coast, in the interior of the continent,the P−E is approximately equal to net snow accumulation since wind speeds are generally low and thereis little overall re-distribution of snow. Throughout this paper, the authors will therefore use the term netaccumulation to refer to the P−E predicted by the models and the accumulation measured in situ. Theywill, however, return to the question of blowing snow and consider how this parameter would affect thefigures in the discussion.
In any study of the relationship between precipitation and snow accumulation, evaporation from thesnow surface needs to be taken into account. Some studies have suggested that during the summer monthsit can remove up to 45% of the accumulation at some coastal sites (Stearns and Weidner, 1993). However,other work has shown that net evaporation from the snow surface decreases very quickly away from thecoast and that it falls almost to zero about 150 km from the coast (UNESCO, 1978). At Mizuho Station(70.7°S, 40.3°E), which is subject to strong katabatic winds, evaporation during the summer removesabout 30% of the annual precipitation (Fujii and Kusunoki, 1982). While the Stearns and Weidner (1993)figures computed from automatic weather stations (AWSs) on the Ross Ice Shelf have to be at the upperlimit of evaporation in the Antarctic, the comparable figure for Halley Station is 30% (Limbert, 1963).
Copyright © 1999 Royal Meteorological Society Int. J. Climatol. 19: 697–724 (1999)
J. TURNER ET AL.700
During the winter months, there is a net condensation of water vapour on to the ice sheet surface at mostlocations, but the quantities of water involved are small and do not contribute significantly to the surfacemass balance (King et al., 1995). In the coastal area evaporation during the winter can also be almost zero(Loewe, 1962).
The next section describes the model data used in this study and the available in situ observations. Thethird section discusses the various figures for the total snow accumulation for the Antarctic, while thesection following that examines the spatial distribution of the net accumulation and how this relates to thesynoptic-scale environment. The temporal variability is covered in the fifth section, with the intra-annualvariability, the inter-annual variability and the trend in the net accumulation over the 15 year period beingexamined. Here, the authors also discuss the relationship between accumulation at various coastal sitesand the spatial distribution of cyclone activity over the Southern Ocean. In the sixth section, theycompare the ERA accumulation amounts against those produced from radiosonde data, model fluxestimates, the operational ECMWF accumulation estimates and in situ data. Finally, conclusions aredrawn and possible future work that could be carried out with the ERA data set is discussed.
2. DATA USED
2.1. Model data
The version of the ECMWF global, spectral model used in the re-analysis project had 31 vertical levelsand a truncation of T106, giving an approximate horizontal resolution of 100 km. Since the assimilationscheme cannot analyse precipitation data, the authors have to use the precipitation and evaporation datafrom the forecasts themselves. Various options are available as to which forecast period to use, with theearlier (later) data having smaller (larger) forecast errors in the locations of precipitating weather systemsbut poorer (better) precipitation amounts because of the model spin-up. Figure 2 shows the zonallyaveraged precipitation for the 15 year ERA period for the first 12 h of the model integrations (brokenline) and the period 12–24 h (solid line). It can be seen that the model does indeed have a small spin-upwith there being about 9% more precipitation during the second 12 h period than for the first. Followingdiscussions with the staff of ECMWF it was agreed that the 12–24 h data were superior and the authorshave elected to use these data throughout this study. The precipitation for each day has therefore beencomputed from the two forecasts started at 00:00 UTC on the day and 12:00 UTC the previous day. Amean evaporation rate was available from the model for each day of the series and this was used in thecalculation of monthly, seasonal and annual P−E fields. The available data cover the period 1979–1993.
The orography of the Antarctic is particularly difficult to incorporate into numerical weather prediction(NWP) models since the elevation of the Antarctic ice cap rises very rapidly in the coastal region beforethe high, relatively flat central plateau is reached. In order to maintain numerical stability, the orographyused in the models must have relatively low gradients so a smoothed orography of the Antarctic is used.Figure 3(a) shows the orography used in the ERA project. The data set has the correct broadscale featuresof the Antarctic orography, including the rapid increase in elevation inland of the coast, the high plateauof East Antarctica and the low ice shelves. One part of the Antarctic where the actual orography isparticularly complex is the Antarctic Peninsula, a northward extension of the main mass of the Antarctic,which has an elevation of more than 2 km for much of its length. The orography for the Peninsula areathat was used in the ERA runs (Figure 3(b)) reveals that it has suffered considerable smoothing in theeast–west direction and only has a maximum height of about 1300 m. The consequences of this arediscussed in the following sections.
One significant problem that has been found with the orography used in the ERA project (and in theoperational ECMWF products) is an error in the elevations over Dronning Maud Land. As discussed byGenthon and Braun (1995), the ECMWF orography was about 1000 m too high in this area, which willhave resulted in too few maritime air masses being present in the area. As discussed below, the ERAresults will, therefore, have too little precipitation over Dronning Maud Land.
Copyright © 1999 Royal Meteorological Society Int. J. Climatol. 19: 697–724 (1999)

SNOW ACCUMULATION OVER THE ANTARCTIC 701
Figure 2. The zonally averaged precipitation for the 15 year ERA period for the first 12 h of the model integrations (broken line)and the period 12–24 h (solid line)
In all of the following, the model precipitation and P−E data are expressed as water equivalent valuesin millimetres.
2.2. In situ obser6ations
Because of the strong winds experienced in some parts of the Antarctic and the consequent redistribu-tion of snow mass it is not possible to use snow gauges to determine routinely the precipitation at themanned research stations. Instead, a number of stations use stake arrays to estimate the net accumulationof snow, although Turner et al. (1995) showed that these observations can also be affected badly byblowing snow. The main techniques for the estimation of snow accumulation are therefore, via theanalysis of snow and ice retrieved from pits and ice cores. The methods employed include visualstratigraphy, electrical conductivity measurements (ECM) and radioisotope analysis, and provide infor-mation on annual net snow accumulation, although data from deeper cores may be difficult to ascribe toa particular year. The data are also only valid for a single point, which can be a problem in an area ofcomplex terrain, such as the Antarctic Peninsula. Nevertheless, data from analysis of short ice cores hasallowed the production of a number of maps of annual accumulation or surface balance (e.g. Bull,1971; GB; these and others are reviewed in Giovinetto and Bull, 1987), which show the broadscale
Copyright © 1999 Royal Meteorological Society Int. J. Climatol. 19: 697–724 (1999)

J. TURNER ET AL.702
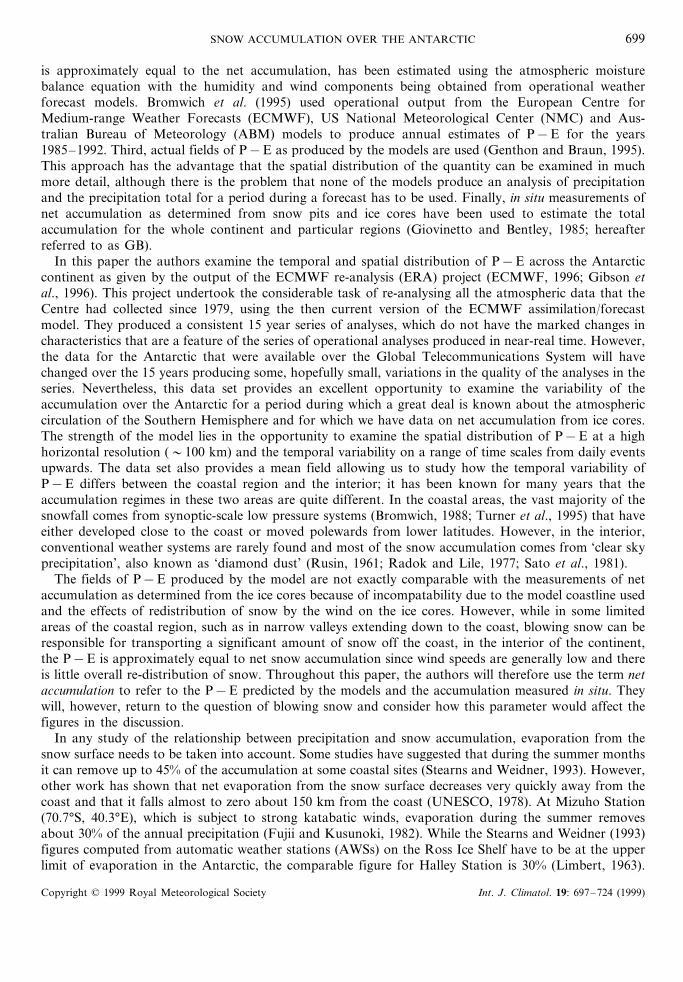
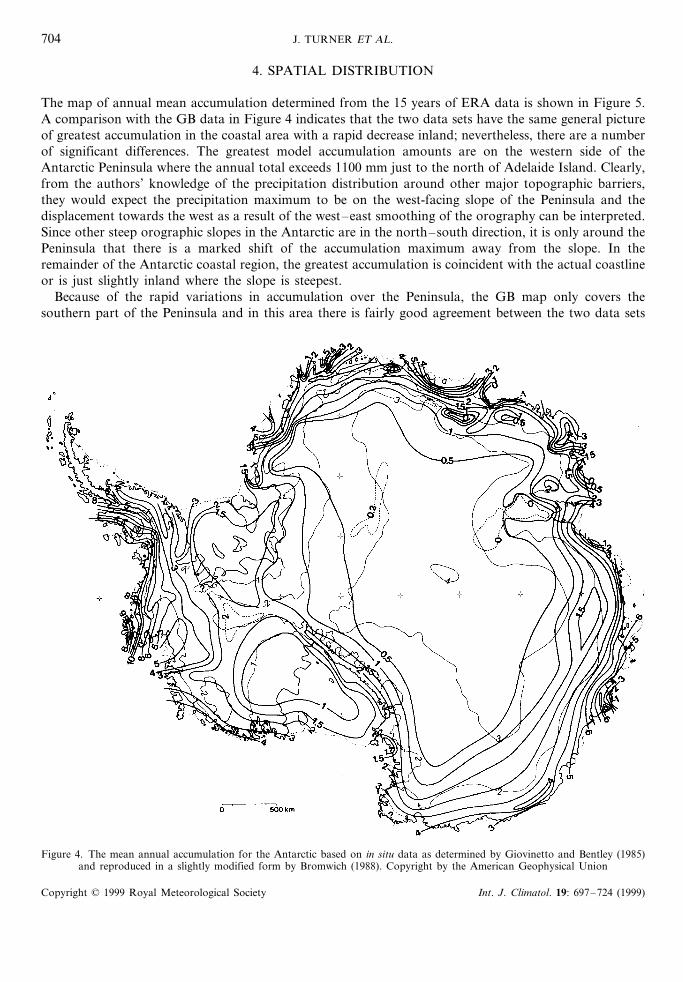
distribution of snow accumulation across the continent. The annual accumulation map for the Antarcticproduced by GB and adapted by Bromwich (1988) is shown in Figure 4. The GB data have been quotedextensively in the literature and used to compute accumulation amounts for individual basins, the wholecontinent (with and without the northern half of the Antarctic Peninsula) and the area of the coterminousgrounded ice excluding the northern Peninsula. Recently, the GB data set has been enhanced with furtherobservations, new basin delineations and improved gridding procedures, and used to re-compute theaccumulation amounts for various areas (Vaughan et al., in press). The fact that so many different areashave been used in studies of Antarctic snow accumulation, coupled with different assumptions aboutwhich parts of the continent constitute the ‘total’ area mean that the inter-comparison of the variousfigures is somewhat difficult. However, in later sections, the authors use the ERA data to compute figuresthat are essentially comparable with those determined from glaciological measurements.
3. THE TOTAL ACCUMULATION FOR THE WHOLE OF THE ANTARCTIC
The mean annual net accumulation for the whole of the continent, as computed from the ERA data, is151 mm year−1 or a total accumulation of 2106×1012 kg year−1. To calculate these figures, the authorshave taken the area of the ‘whole’ of the Antarctic to be the region of grounded ice, plus the area coveredby the floating ice shelves, ice rises and the major islands connected by fast ice (such as Alexander Island).The ERA mean accumulation rate is therefore, smaller than the estimate of 154 mm year−1 produced byFrolich (1992), who derived his figure by adding data for the northern half of the Antarctic Peninsula to
Figure 3. The orography used in the ERA project. (a) The whole Antarctic and (b) the Antarctic Peninsula area only. All heightsin metres with contour intervals of (a) 500 m and (b) 100 m
Copyright © 1999 Royal Meteorological Society Int. J. Climatol. 19: 697–724 (1999)

SNOW ACCUMULATION OVER THE ANTARCTIC 703
Figure 3 (Continued)
the GB total, which had excluded that part of the continent. More recently, Vaughan et al. (in press) haverecomputed the mass balance of the Antarctic using a data set of over 1800 in situ accumulationmeasurements, although the distribution of these measurements is far from ideal and the interpolation ofthis sparse data was achieved using a forcing field derived by Zwally from SSM/I data (Zwally andGiovinetto, 1995). They suggest that the mean accumulation rate for the whole of the Antarctic is evenlarger at 166 mm year−1. The mean accumulation for the period 1985–1995 as determined from theoperational ECMWF forecasts (Cullather et al., 1998) is exactly the same as the ERA 15 year mean valueof 151 mm year−1.
While the ERA mean accumulation figure is close to the glaciological estimates, the nature of theorography used in the NWP system would tend to result in a smaller accumulation total for the continentthan would be found in reality. This would come about because the orography is smoothed in thenorth–south direction resulting in grid points over the ocean that have a height of greater than zero. Thiswill mean that the orographic enhancement starts north of the coastline, so resulting in greaterprecipitation amounts over the ocean than would be expected and slightly smaller amounts over thecontinent. Since the land/sea mask here is based on the ‘true’ coastline, the total accumulation for thecontinent will not include the precipitation that falls north of the coastline, even though it has beenenhanced by orographic uplift. The authors would therefore expect their estimates of net accumulation forthe continent to be slightly smaller than those determined from glaciological information. Other reasonsfor the slightly smaller mean annual accumulation for the Antarctic compared with the glaciologicalobservations are discussed in later sections.
Copyright © 1999 Royal Meteorological Society Int. J. Climatol. 19: 697–724 (1999)
J. TURNER ET AL.704
4. SPATIAL DISTRIBUTION
The map of annual mean accumulation determined from the 15 years of ERA data is shown in Figure 5.A comparison with the GB data in Figure 4 indicates that the two data sets have the same general pictureof greatest accumulation in the coastal area with a rapid decrease inland; nevertheless, there are a numberof significant differences. The greatest model accumulation amounts are on the western side of theAntarctic Peninsula where the annual total exceeds 1100 mm just to the north of Adelaide Island. Clearly,from the authors’ knowledge of the precipitation distribution around other major topographic barriers,they would expect the precipitation maximum to be on the west-facing slope of the Peninsula and thedisplacement towards the west as a result of the west–east smoothing of the orography can be interpreted.Since other steep orographic slopes in the Antarctic are in the north–south direction, it is only around thePeninsula that there is a marked shift of the accumulation maximum away from the slope. In theremainder of the Antarctic coastal region, the greatest accumulation is coincident with the actual coastlineor is just slightly inland where the slope is steepest.
Because of the rapid variations in accumulation over the Peninsula, the GB map only covers thesouthern part of the Peninsula and in this area there is fairly good agreement between the two data sets
Figure 4. The mean annual accumulation for the Antarctic based on in situ data as determined by Giovinetto and Bentley (1985)and reproduced in a slightly modified form by Bromwich (1988). Copyright by the American Geophysical Union
Copyright © 1999 Royal Meteorological Society Int. J. Climatol. 19: 697–724 (1999)
SNOW ACCUMULATION OVER THE ANTARCTIC 705
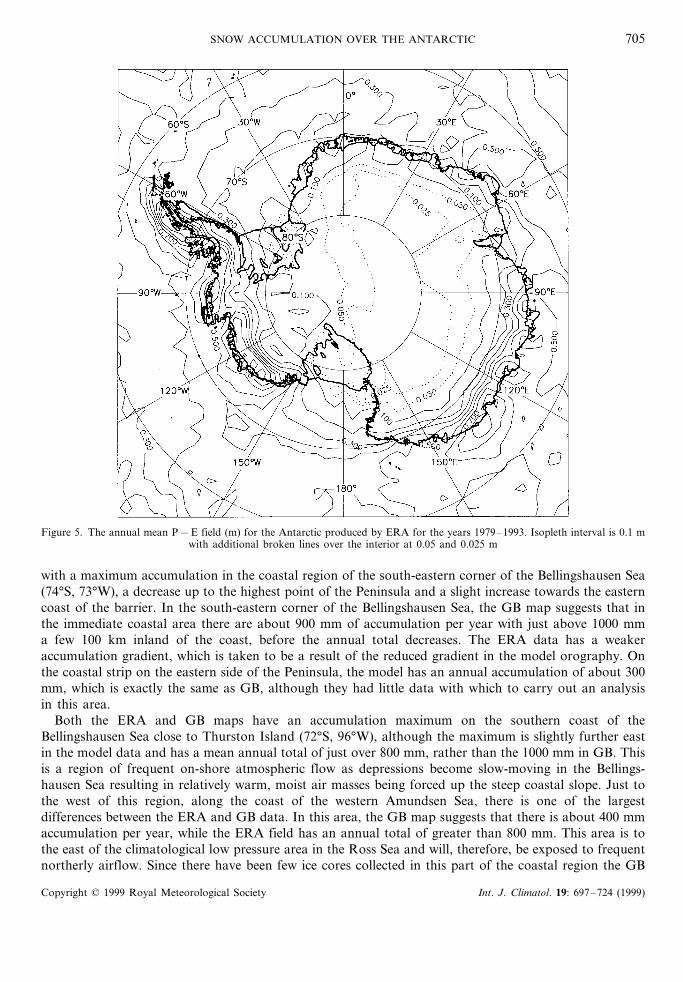
Figure 5. The annual mean P−E field (m) for the Antarctic produced by ERA for the years 1979–1993. Isopleth interval is 0.1 mwith additional broken lines over the interior at 0.05 and 0.025 m
with a maximum accumulation in the coastal region of the south-eastern corner of the Bellingshausen Sea(74°S, 73°W), a decrease up to the highest point of the Peninsula and a slight increase towards the easterncoast of the barrier. In the south-eastern corner of the Bellingshausen Sea, the GB map suggests that inthe immediate coastal area there are about 900 mm of accumulation per year with just above 1000 mma few 100 km inland of the coast, before the annual total decreases. The ERA data has a weakeraccumulation gradient, which is taken to be a result of the reduced gradient in the model orography. Onthe coastal strip on the eastern side of the Peninsula, the model has an annual accumulation of about 300mm, which is exactly the same as GB, although they had little data with which to carry out an analysisin this area.
Both the ERA and GB maps have an accumulation maximum on the southern coast of theBellingshausen Sea close to Thurston Island (72°S, 96°W), although the maximum is slightly further eastin the model data and has a mean annual total of just over 800 mm, rather than the 1000 mm in GB. Thisis a region of frequent on-shore atmospheric flow as depressions become slow-moving in the Bellings-hausen Sea resulting in relatively warm, moist air masses being forced up the steep coastal slope. Just tothe west of this region, along the coast of the western Amundsen Sea, there is one of the largestdifferences between the ERA and GB data. In this area, the GB map suggests that there is about 400 mmaccumulation per year, while the ERA field has an annual total of greater than 800 mm. This area is tothe east of the climatological low pressure area in the Ross Sea and will, therefore, be exposed to frequentnortherly airflow. Since there have been few ice cores collected in this part of the coastal region the GB
Copyright © 1999 Royal Meteorological Society Int. J. Climatol. 19: 697–724 (1999)
J. TURNER ET AL.706
figures for annual accumulation must be considered suspect and the available in situ data should bere-assessed.
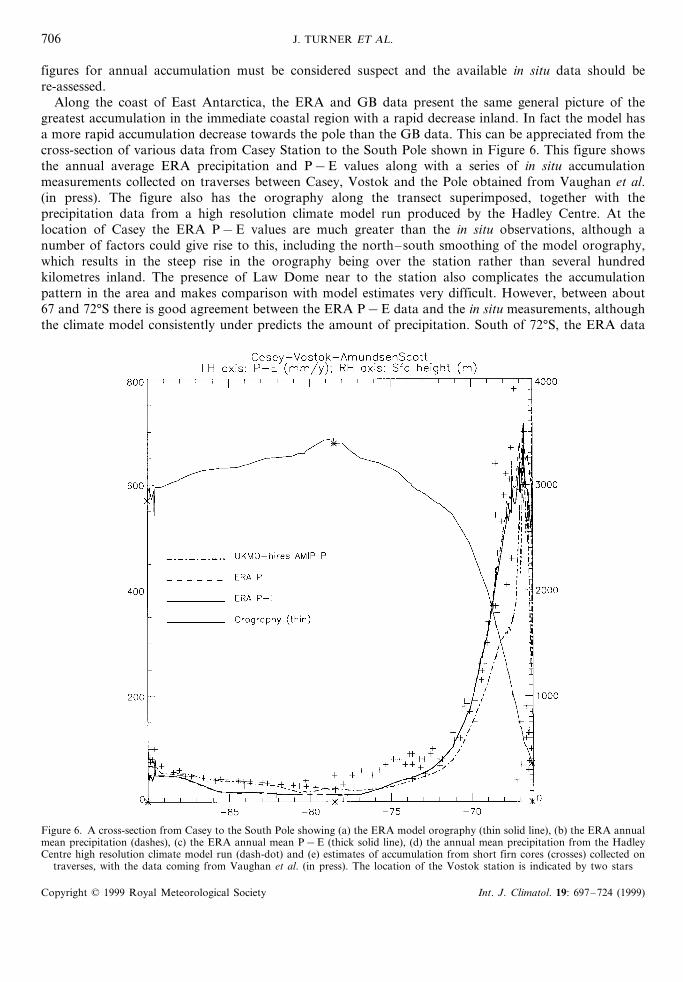
Along the coast of East Antarctica, the ERA and GB data present the same general picture of thegreatest accumulation in the immediate coastal region with a rapid decrease inland. In fact the model hasa more rapid accumulation decrease towards the pole than the GB data. This can be appreciated from thecross-section of various data from Casey Station to the South Pole shown in Figure 6. This figure showsthe annual average ERA precipitation and P−E values along with a series of in situ accumulationmeasurements collected on traverses between Casey, Vostok and the Pole obtained from Vaughan et al.(in press). The figure also has the orography along the transect superimposed, together with theprecipitation data from a high resolution climate model run produced by the Hadley Centre. At thelocation of Casey the ERA P−E values are much greater than the in situ observations, although anumber of factors could give rise to this, including the north–south smoothing of the model orography,which results in the steep rise in the orography being over the station rather than several hundredkilometres inland. The presence of Law Dome near to the station also complicates the accumulationpattern in the area and makes comparison with model estimates very difficult. However, between about67 and 72°S there is good agreement between the ERA P−E data and the in situ measurements, althoughthe climate model consistently under predicts the amount of precipitation. South of 72°S, the ERA data
Figure 6. A cross-section from Casey to the South Pole showing (a) the ERA model orography (thin solid line), (b) the ERA annualmean precipitation (dashes), (c) the ERA annual mean P−E (thick solid line), (d) the annual mean precipitation from the HadleyCentre high resolution climate model run (dash-dot) and (e) estimates of accumulation from short firn cores (crosses) collected on
traverses, with the data coming from Vaughan et al. (in press). The location of the Vostok station is indicated by two stars
Copyright © 1999 Royal Meteorological Society Int. J. Climatol. 19: 697–724 (1999)

SNOW ACCUMULATION OVER THE ANTARCTIC 707
are everywhere less than the in situ measurements, with the greatest differences being close to 75°S.This is a result of there being too little precipitation from the model since the evaporation is (cor-rectly) extremely small at these latitudes.
The accumulation peaks along the coast of East Antarctica in the ERA and GB fields are atapproximately the same locations, i.e. close to 130°E, 110°E and 30°E, although there are somedifferences in the magnitude. At 130°E, the ERA data have about twice the accumulation of GB withan annual total of almost 800 mm. At 110°E, the two forms of data are in good agreement with amaximum of about 600 mm, while at 30°E, the model has slightly less accumulation than the in situdata.
A number of studies (GB; Bromwich, 1988; Vaughan et al., in press) have noted the extensive areawith very small annual accumulation over the high interior plateau of East Antarctica and this featurewas well represented in the ECMWF data. The area enclosed by the 100 mm accumulation line in theGB data is slightly less than that given by the model, especially over Adelie Land, suggesting that themodel has too little accumulation in the centre of the continent. This is consistent with the cross-section of model and glaciological data presented above.
North of the Antarctic coast the annual totals of accumulation increase steadily with decreasinglatitude. Although recent studies of cyclonic activity across the Southern Hemisphere have shown thatthe largest number of depressions and the largest number of cyclogenesis events occur in the circum-polar trough close to 60–70°S (Jones and Simmonds, 1993), the fact that the totals of accumulation inthis zone are rather small would suggest that these cyclones are not particularly active. A further linkbetween the cyclonic activity and the accumulation can be seen in the differing accumulation eitherside of the Antarctic Peninsula. Jones and Simmonds showed that there were many slow-movingdepressions in the Bellingshausen Sea on the western side of the major topographic barrier of thePeninsula. In contrast, there were relatively few depressions in the Weddell Sea, although somesystems did move into the eastern area after passing through the Drake Passage and a number ofcyclogenesis events took place in the lee of the Peninsula. The fact that synoptic-scale lows arerelatively scarce in the Weddell Sea with few moist, mid-latitude air-masses penetrating into the regionis reflected in the model accumulation totals, which are about two thirds of those found at compara-ble latitudes in the Bellingshausen Sea.
On the large Ronne and Ross ice shelves, the ERA annual accumulation is much smaller than thosesuggested by the GB analysis. In particular, on the western side of the Ross Ice Shelf, the ERA datahas annual accumulation amounts that are slightly less than zero, suggesting greater evaporation/subli-mation over the year than precipitation. Although the measurement of latent heat fluxes in theAntarctic presents many problems, especially if information is required throughout the year, theavailability of AWSs operating year round has presented the opportunity to examine latent heat fluxesin selected areas. Stearns and Weidner (1993) used data from three AWSs on the Ross Ice Shelf withsensors at a range of heights to estimate latent heat fluxes. They concluded that the net annualsublimation and evaporation on the Ross Ice Shelf amounted to 20–80% of the annual snow accumu-lation, suggesting that the ERA P−E values are too small in this area. The ERA annual meanprecipitation field for the period 1979–1993 (not shown) indicates the Ross Ice Shelf receives between100 and 200 mm year−1 of precipitation with the amount increasing from west-to-east across the iceshelf. These figures are in good agreement with the Hadley Centre high resolution Atmospheric ModelIntercomparison Project (AMIP) climate model runs suggesting that the ERA model has excessiveevaporation/sublimation on the ice shelves. Figure 7 shows the ERA mean annual evaporation fieldshowing the rapid decrease in evaporation away from the coast. However, relatively large values ofevaporation can be seen on the Ronne and Ross Ice Shelves, which are attributed to the fact that inthe ERA model runs, the ice shelves were regarded as sea ice resulting in surface temperatures thatwere too high and giving too much evaporation.
Seasonal information on the evaporation for the whole continent is given in Table I, indicating thatit has a marked peak during the summer with negligible evaporation during the winter.
Copyright © 1999 Royal Meteorological Society Int. J. Climatol. 19: 697–724 (1999)

J. TURNER ET AL.708
Figure 7. The annual mean evaporation field (m) for the Antarctic produced by ERA for the years 1979–1993. Isopleth interval is0.05 m with additional broken lines over the interior at 0.004, 0.003, 0.002 and 0.001 m
5. TEMPORAL VARIABILITY
The series of net accumulation fields from the ERA project presents an opportunity to examine thetemporal distribution of accumulation on scales that are not possible using the in situ data. Ice cores cangive an approximate annual total of accumulation because of marked seasonality in certain chemical andbiological signals. However, the degree of uncertainty in locating where an annual cycle begins and the
Table I. The mean and S.D. of the net accumulation, precipitation and evaporation forthe whole of the Antarctic ice sheet for the four seasons and year as a whole based on
the 15 years of ERA data
Accumulation EvaporationPeriod Precipitation(mm) (mm) (mm)
S.D.Mean S.D. Mean S.D. Mean
Summer 12.5 0.524.7 5.1 37.2 4.80.36.3 2.345.9 48.2Autumn 6.2
0.6Winter 0.245.7 5.2 46.3 5.14.2 5.8 0.3Spring 34.9 4.5 40.7
10.1 21.1 1.0Year 151.2 10.2 172.4
Copyright © 1999 Royal Meteorological Society Int. J. Climatol. 19: 697–724 (1999)
SNOW ACCUMULATION OVER THE ANTARCTIC 709
implied assumption that adjacent minima (or maxima) are exactly 12 months apart requires that timeseries of annual accumulation have some form of temporal smoothing applied. In this section, the authorswill begin by examining the annual accumulation cycle before turning to look at inter-annual variability.
5.1. Seasonal 6ariability
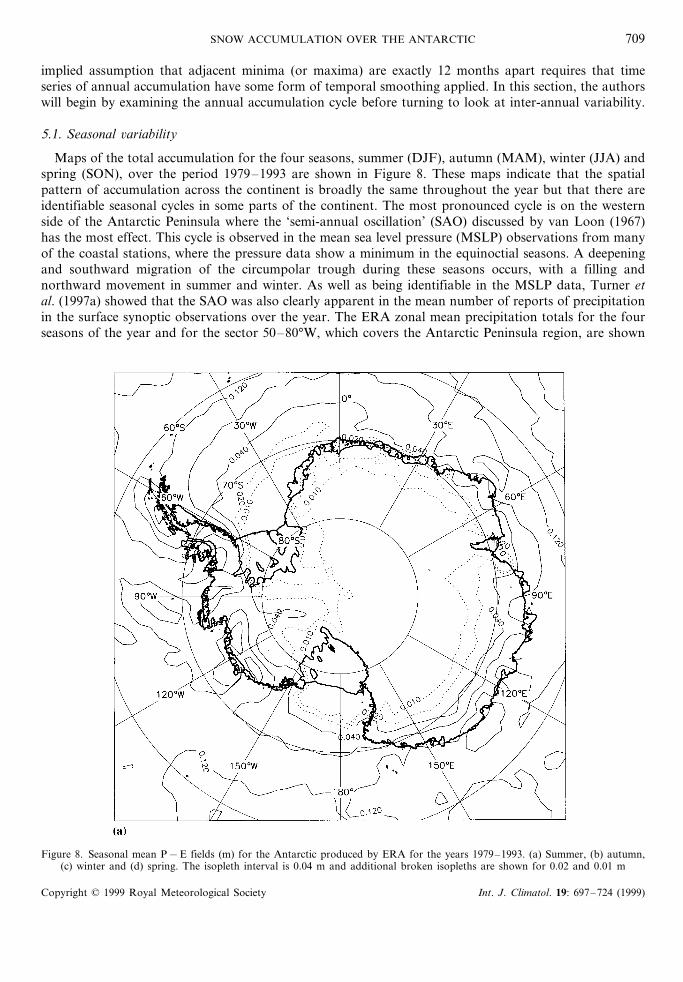
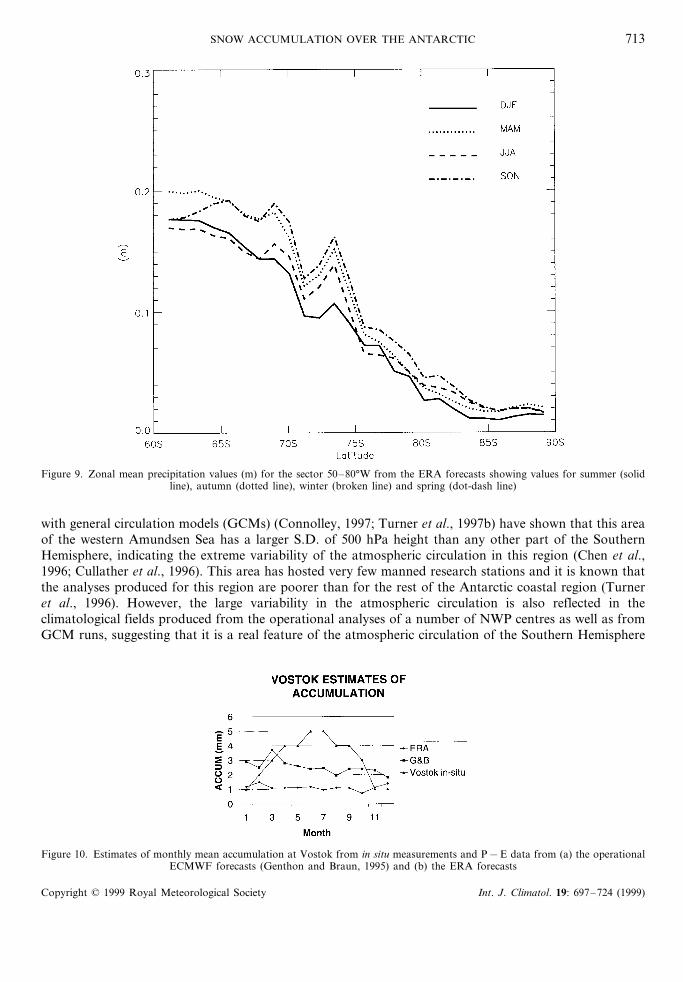
Maps of the total accumulation for the four seasons, summer (DJF), autumn (MAM), winter (JJA) andspring (SON), over the period 1979–1993 are shown in Figure 8. These maps indicate that the spatialpattern of accumulation across the continent is broadly the same throughout the year but that there areidentifiable seasonal cycles in some parts of the continent. The most pronounced cycle is on the westernside of the Antarctic Peninsula where the ‘semi-annual oscillation’ (SAO) discussed by van Loon (1967)has the most effect. This cycle is observed in the mean sea level pressure (MSLP) observations from manyof the coastal stations, where the pressure data show a minimum in the equinoctial seasons. A deepeningand southward migration of the circumpolar trough during these seasons occurs, with a filling andnorthward movement in summer and winter. As well as being identifiable in the MSLP data, Turner etal. (1997a) showed that the SAO was also clearly apparent in the mean number of reports of precipitationin the surface synoptic observations over the year. The ERA zonal mean precipitation totals for the fourseasons of the year and for the sector 50–80°W, which covers the Antarctic Peninsula region, are shown
Figure 8. Seasonal mean P−E fields (m) for the Antarctic produced by ERA for the years 1979–1993. (a) Summer, (b) autumn,(c) winter and (d) spring. The isopleth interval is 0.04 m and additional broken isopleths are shown for 0.02 and 0.01 m
Copyright © 1999 Royal Meteorological Society Int. J. Climatol. 19: 697–724 (1999)

J. TURNER ET AL.710
Figure 8(b) Autumn (Continued)
in Figure 9. These data indicate that at the latitude of the circumpolar trough (65–70°S), the totals forspring and autumn are about 25% greater than for summer and winter as a result of the influence of theSAO. The observations from stations on the western side of the Peninsula indicate that the lowest MSLPvalues and the greatest number of precipitation events occur during the spring, although this is notreflected in the ERA precipitation. On the eastern side of the Peninsula, where synoptic scale low pressuresystems are much less of a feature, the SAO is not apparent. When the model accumulation rather thanthe precipitation is considered, the SAO is a little less clear and while the accumulation minimum(maximum) in summer (autumn) is apparent, the winter and spring seasons have approximately the sameamount of accumulation. This is found because of the smaller amount of evaporation during the summercompared with the other three seasons. A minimum of evaporation in summer seems surprising since thetemperatures are at their maximum during this season, however, the amount of evaporation that takesplaces is heavily dependent on the near-surface wind speed and observations from the stations on thewestern side of the Peninsula do show a minimum in surface wind speed during the summer. The authorsattribute this to the minimum in cyclone activity during the summer (Jones and Simmonds, 1993), whichcomes about because of the SAO.
Considering that the annual mean accumulation map showed areas of net loss, it is not surprising thatthis feature is even more apparent in Figure 8, with areas having net ablation during the spring andsummer. Again, the two largest areas characterized by net loss are over the Ross Ice Shelf and anelongated area from the Ronne Ice Shelf northwards up the coast of Dronning Maud Land. Both these
Copyright © 1999 Royal Meteorological Society Int. J. Climatol. 19: 697–724 (1999)
SNOW ACCUMULATION OVER THE ANTARCTIC 711
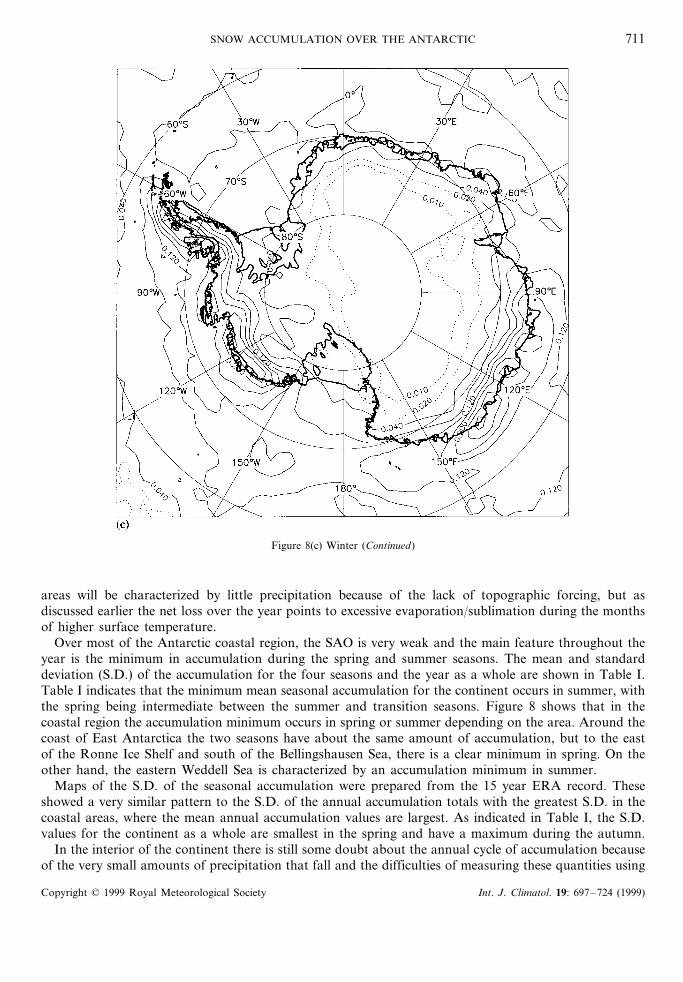
Figure 8(c) Winter (Continued)
areas will be characterized by little precipitation because of the lack of topographic forcing, but asdiscussed earlier the net loss over the year points to excessive evaporation/sublimation during the monthsof higher surface temperature.
Over most of the Antarctic coastal region, the SAO is very weak and the main feature throughout theyear is the minimum in accumulation during the spring and summer seasons. The mean and standarddeviation (S.D.) of the accumulation for the four seasons and the year as a whole are shown in Table I.Table I indicates that the minimum mean seasonal accumulation for the continent occurs in summer, withthe spring being intermediate between the summer and transition seasons. Figure 8 shows that in thecoastal region the accumulation minimum occurs in spring or summer depending on the area. Around thecoast of East Antarctica the two seasons have about the same amount of accumulation, but to the eastof the Ronne Ice Shelf and south of the Bellingshausen Sea, there is a clear minimum in spring. On theother hand, the eastern Weddell Sea is characterized by an accumulation minimum in summer.
Maps of the S.D. of the seasonal accumulation were prepared from the 15 year ERA record. Theseshowed a very similar pattern to the S.D. of the annual accumulation totals with the greatest S.D. in thecoastal areas, where the mean annual accumulation values are largest. As indicated in Table I, the S.D.values for the continent as a whole are smallest in the spring and have a maximum during the autumn.
In the interior of the continent there is still some doubt about the annual cycle of accumulation becauseof the very small amounts of precipitation that fall and the difficulties of measuring these quantities using
Copyright © 1999 Royal Meteorological Society Int. J. Climatol. 19: 697–724 (1999)

J. TURNER ET AL.712
Figure 8(d) Spring (Continued)
stakes and snow gauges. However, the available data from stations such as Vostok (Dolgina and Petrova,1977) and South Pole (Gow, 1965; Mosley-Thompson et al., 1995) does tend to suggest that there is amaximum of accumulation in the winter with a summer minimum. Genthon and Braun (1995) reportedthat the operational ECMWF fields failed to reproduce this cycle, so in Figure 10 the authors show thein situ data for Vostok, the Genthon and Braun results and the same figures computed from the ERAforecasts. It can be seen that the ERA forecasts also do not show any clear annual cycle of accumulationand in addition have a magnitude that is much smaller than either the in situ measurements or theoperational ECMWF data. If annual mean accumulation values are computed from the three differentforms of data then values of 13.5 mm (ERA), 30.2 mm (operational ECMWF forecast P−E) and 37.0mm (in situ) are obtained. The low figure for the ERA forecasts is consistent with the cross-section ofmeasurements shown in Figure 6, which indicated that the model was consistently giving accumulationvalues in the interior of the continent that were lower than the in situ observations.
5.2. Inter-annual 6ariability
Table I indicates that the S.D. of the accumulation for the whole Antarctic ice sheet is 10.2 mm. Thespatial variability of this quantity can be appreciated via the map shown in Figure 11. This figureindicates that the greatest variability is found along the coast of the western Amundsen Sea where theS.D. is greater than 200 mm in an area where the annual total of accumulation is about 800 mm. Studies
Copyright © 1999 Royal Meteorological Society Int. J. Climatol. 19: 697–724 (1999)
SNOW ACCUMULATION OVER THE ANTARCTIC 713
Figure 9. Zonal mean precipitation values (m) for the sector 50–80°W from the ERA forecasts showing values for summer (solidline), autumn (dotted line), winter (broken line) and spring (dot-dash line)
with general circulation models (GCMs) (Connolley, 1997; Turner et al., 1997b) have shown that this areaof the western Amundsen Sea has a larger S.D. of 500 hPa height than any other part of the SouthernHemisphere, indicating the extreme variability of the atmospheric circulation in this region (Chen et al.,1996; Cullather et al., 1996). This area has hosted very few manned research stations and it is known thatthe analyses produced for this region are poorer than for the rest of the Antarctic coastal region (Turneret al., 1996). However, the large variability in the atmospheric circulation is also reflected in theclimatological fields produced from the operational analyses of a number of NWP centres as well as fromGCM runs, suggesting that it is a real feature of the atmospheric circulation of the Southern Hemisphere
Figure 10. Estimates of monthly mean accumulation at Vostok from in situ measurements and P−E data from (a) the operationalECMWF forecasts (Genthon and Braun, 1995) and (b) the ERA forecasts
Copyright © 1999 Royal Meteorological Society Int. J. Climatol. 19: 697–724 (1999)

J. TURNER ET AL.714
Figure 11. The S.D. (m) of the ERA annual P−E for the period 1979–1993. The isopleth interval is 0.04 m and additional brokenisopleths are shown for 0.02 and 0.01 m
and not a result of a lack of in situ data. As would be expected, when automatic depression trackingsoftware is applied to the series of operational analyses, it is found that the region of the Bellingshausen/Amundsen Seas is characterized by a large S.D. in the number of individual cyclones (Marshall and King,1998) and, for the Bellingshausen Sea, also cyclone density, which takes account of the number and speedof the individual lows.
The other area of large inter-annual variability of precipitation is on the western side of the AntarcticPeninsula. This area is known to have a large variability in temperature (King, 1994) and sea ice extent(Harangozo, 1997), which can be ascribed to the highly variable atmospheric circulation over the oceanicareas to the west. Undoubtedly, the large accumulation variability in this area results from the majorchanges in synoptic-scale activity that take place over the Bellingshausen and Amundsen Seas as discussedin Marshall and King (1998). The effect on year-to-year changes in accumulation will be discussed later.
The relative variability of the annual accumulation, that is the S.D./annual mean, is in many ways amore useful quantity to examine than the S.D. and this field is shown in Figure 12. Over most of theocean areas this quantity is quite small and has a magnitude in the range 0.1–0.2. When it is taken intoaccount that the S.D. over the Southern Ocean is also small but that the annual accumulation total isfairly high, this indicates that there is extensive accumulation in most years as a result of the large numberof depressions in the circumpolar trough.
Over most parts of the coastal escarpment of the Antarctic, the relative variability of the annualaccumulation total is greater than over the ocean areas since, on a year-to-year basis, the cyclonic activity
Copyright © 1999 Royal Meteorological Society Int. J. Climatol. 19: 697–724 (1999)

SNOW ACCUMULATION OVER THE ANTARCTIC 715
is more variable south of the circumpolar trough. The relative variability around most of the coast isgenerally around 0.2–0.3 although in some areas it is higher. There are also areas where the annualaccumulation is very small, such as over the ice shelves, so that the S.D./mean is very large in theseregions.
During the 15 year period of the data, the mean accumulation for the continent varied from 129.1 mm(1987) to 171.8 (1984). The full series of annual mean accumulation values for the continent, WestAntarctica (taken as the sector 26.4°W westwards to 166.7°E) and East Antarctica (26.4°W eastwards to166.7°E) are shown in Figure 13. This figure shows that East Antarctica being dominated by the highplateau has only a mean accumulation of 107 mm year−1 and a low S.D. of 6.9 mm year−1. Since EastAntarctica constitutes the largest part of the continent, it dominates the data for the whole of Antarcticain Figure 13. West Antarctica, on the other hand, is much more influenced by synoptic-scale weathersystems that not only affect the coastal areas but can actually cross interior parts of the region, such asMarie Byrd Land (Bromwich et al., 1996). The influence of such systems is to give a much larger annualmean accumulation of 255 mm year−1 and a relatively larger S.D. of 27.1 mm year−1. This greaterinter-annual variability of the accumulation in West Antarctica is consistent with the high variability thathas been observed in other meteorological and oceanic parameters across the region, such as temperaturedown the western side of the Antarctic Peninsula (King, 1994), sea ice extent (Jacobs and Comiso, 1997),cyclone activity in the Amundsen/Bellingshausen Seas (Marshall and King, 1998) and the upper air heightanomalies (Connolley, 1997).
Figure 12. The S.D./mean of the ERA annual P−E for the period 1979–1993. The isopleth interval is 0.05 and values of greaterthan 0.5 are shaded
Copyright © 1999 Royal Meteorological Society Int. J. Climatol. 19: 697–724 (1999)

J. TURNER ET AL.716
Figure 13. Mean annual accumulation values for the period 1979–1993 for the whole of the Antarctic continent (circles), WestAntarctic (triangles) and East Antarctica (squares)
Because of the importance of synoptic-scale low pressure systems in modulating many aspects of theclimate of the Antarctic coastal region it was decided to examine cyclone activity during the 15 year ERAperiod in relation to the accumulation at selected sites. Indicators of cyclone activity were derived usingthe objective algorithm developed by Murray and Simmonds (1991), which essentially identifies pressureminima in a MSLP analysis and attempts to match them with minima in subsequent analyses to producetracks. Two measures of cyclonic activity were used: track density and cyclone density. Following theterminology of Sinclair (1994), track density is defined as: ‘The number of cyclones passing within acertain distance (600 km) of a given point (on the ABM polar stereographic (PS) grid to which the ERAdata were interpolated) per unit time’. Each cyclone is counted only once at each point. The value of 600km was employed because satellite imagery has revealed that this is a typical radius of the cloudsignatures associated with cyclones in the Amundsen Sea/Bellingshausen Sea region. The use of circulargeometry prevents bias associated with latitude–longitude box counts and, because the distance ofadjacent points on the PS grid is less than 600 km, helps smooth the data. Cyclone density is defined as‘The number of cyclones centres within 600 km of a given point per unit time’. Each cyclone is countedat each point for as many times as the definition criterion is satisfied: a count is undertaken for each6 h analysis and the mean monthly cyclone density is then obtained (in order to acquire convenientvalues) with units of km−2×10⁻⁸ day−1. Over a long time, track density is a measure of the probabilityof a cyclone passing close to a point, whereas cyclone density is proportional to the amount of time apoint spends under cyclonic influence.
There are problems with the cyclone tracking algorithm over the Antarctic interior associated with thereduction of surface pressure to mean sea level over the high inland plateau. This leads to a ‘fictitious’anticyclone and related cyclones over the continent, particularly between 60–90°E. Sinclair (1994)removed such systems from his climatological data set by requiring cyclones to move a minimum distance:however, Turner et al. (1998) showed that such a filter can also remove systems that can give significantprecipitation. Therefore, in this study no filtering of systems was undertaken and investigations on therelationship between cyclone activity and precipitation were limited to coastal sites.
Six sites were chosen for this part of the study: Syowa (69°00%S, 39°35%E), Casey (66°18%S, 110°32%E),McMurdo (77°51%S, 166°40%E), the Hobbs Coast (75°00%S, 130%W), the Bryan Coast (74°00%S, 85°00%W),and Halley (75°35%S, 26°22%W). Three sites (Syowa, the Bryan Coast and Halley) showed a clearrelationship between the number of cyclones to the northwest and precipitation at an annual temporalresolution. This is illustrated in Figure 14, which shows the composite track density anomalies for wet(1985) and dry (1980, 1986 and 1993) years at the Bryan Coast, where wet (dry) years have a precipitationgreater (less) than 1 S.D. above (below) the ERA mean. During the wet (dry) year(s) of 1985 (1980, 1986and 1993), the P−E anomaly at the Bryan Coast was 0.224 (−0.205) m week. Note the marked positiveanomaly (�18 systems) in the circumpolar trough (CPT) to the northwest in the wet year, which will beassociated with anomalous advection of warm moist air from lower latitudes over the Bryan Coast. Asimilar negative anomaly (�12 systems) and resultant opposite flux exists in the dry years. The fact that
Copyright © 1999 Royal Meteorological Society Int. J. Climatol. 19: 697–724 (1999)

SNOW ACCUMULATION OVER THE ANTARCTIC 717
a clear relationship between annual precipitation and cyclone activity exists at certain sites suggests thateach weather system gives similar amounts of precipitation there and/or that there is a large inter-annualvariability in the number of cyclones affecting that site.
However, at the other three sites (Casey, McMurdo and the Hobbs Coast) no such relationship isexistent. These sites were investigated further by examining the relationship between precipitation and
Figure 14. Composite cyclone track density anomalies for (a) wet (1985) and (b) dry (1980, 1986 and 1993) years at the Bryan Coast.The units are the number of depressions as defined in the text
Copyright © 1999 Royal Meteorological Society Int. J. Climatol. 19: 697–724 (1999)

J. TURNER ET AL.718
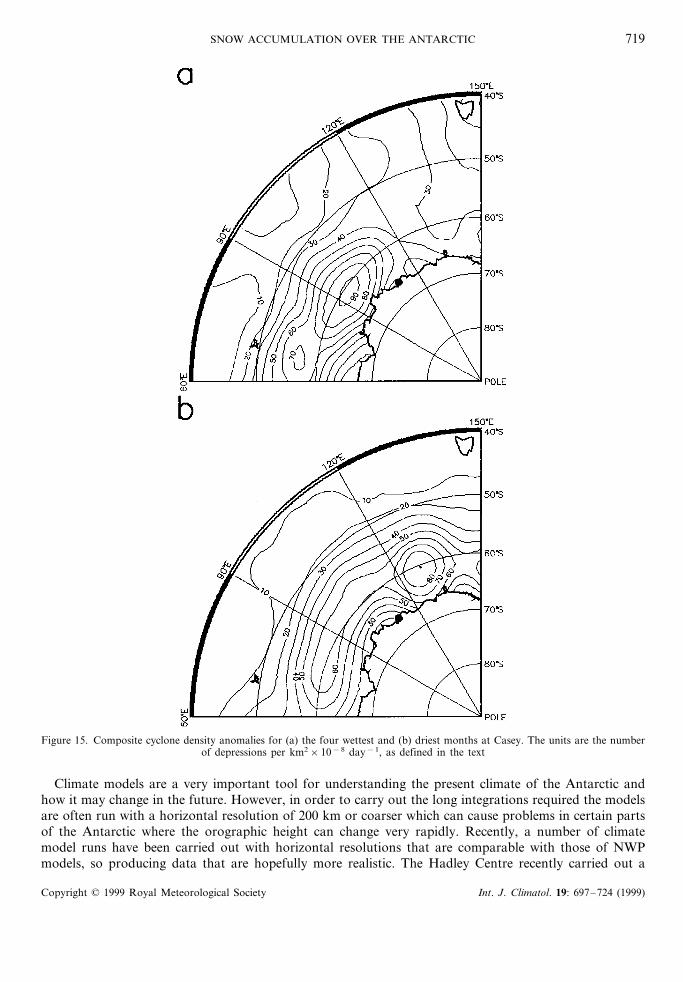
cyclonic activity at a monthly temporal resolution. In addition, cyclone density rather than track densitywas used as a measure of cyclonic activity as it is essentially proportional to the time spent under cyclonicinfluence and may, therefore, be expected to be related to precipitation. At all three sites, months of veryhigh (low) precipitation were associated with localized high cyclonic activity within the CPT to thenorthwest (northeast). These scenarios are depicted in Figure 15 for the four wettest and driest months atCasey. This pattern does not uniformly hold for months of less extreme precipitation, indicating that thereis significant variability in the precipitation associated with individual cyclones and hence no obviousrelationship exists over a longer temporal resolution.
6. A COMPARISON WITH OTHER ESTIMATES OF ACCUMULATION ANDPRECIPITATION
Although it is not possible to estimate the accumulation of snow over the Antarctic directly using in situdata, various proxy data and indirect methods have be used in previous studies, including computing thewater vapour flux convergence from model fields or radiosonde data. In this section, the authors examinehow the ERA accumulation estimates compare with these other forms of data for various parts of thecontinent.
6.1. The whole Antarctic
The moisture flux convergence derived from NWP model data is a powerful tool for the estimation ofaccumulation over the Antarctic and Bromwich et al. (1995) used such techniques over the Antarctic andSouthern Ocean in a study based on operational analyses from ECMWF, NMC and the ABM coveringthe period 1985–1992. The results of this study are shown in Table II and indicate the large differencesbetween the models, with the estimates of accumulation for the continent from the various models being157 (ECMWF), 108 (NMC) and 89 (ABM) mm year−1. The ECMWF figure was found to be closest tothe best estimate of P−E determined from accumulation data that Bromwich (1990) has put as 153mm year−1 with an approximate uncertainty of 915 mm year−1 based on the data of GB. This figureis close to the estimate of 154 mm year−1 produced by Frolich (1992), derived by combining the GB datawith additional observations from the Antarctic Peninsula. The authors’ accumulation figure of 151mm year−1 produced from the latest ERA data is therefore reasonably close to that derived from theoperational ECMWF analyses for the period 1985–1992. The figure is also identical to the valuedetermined by Cullather et al. (1998) from the operational ECMWF P−E data, again for the period1985–1992.
GB present a glaciological estimate of accumulation for the coterminous grounded ice (therefore, notincluding the floating ice shelves), but excluding the northern half of the Peninsula of 124 mm year−1.The comparable ERA figure for this area is 143 mm year−1, which is somewhat larger than theglaciological estimate. The figure of 150 mm year−1 was obtained by Vaughan et al. (in press) for thewhole of the coterminous grounded ice (including the Peninsula) but obviously excluding some highprecipitation areas not regarded as part of the coterminous ice sheet, such as Alexander Island. The ERAestimate of P−E for this area is 147 mm year−1, which agrees well with the glaciological data but whichis significantly larger than the comparable figure determined by Genthon and Braun (1995) using theoperational ECMWF P−E data of 129.1 mm year−1. As discussed earlier, the ERA mean accumulationfor the whole ice sheet is 151 mm year−1, which is only slightly larger than the figure for the coterminousgrounded ice since the ice shelves have generally small accumulation rates. The anomalously smallaccumulation rates for the ice shelves coupled with the lack of precipitation in the interior of the continentand the smoother orography, giving small but positive orographic heights over the ocean areas close tothe coast, are felt to be the main factors in explaining why the mean accumulation rate for the total icesheet is less than the latest estimates computed from the glaciological data, which have figures in the range150–170 mm year−1.
Copyright © 1999 Royal Meteorological Society Int. J. Climatol. 19: 697–724 (1999)
SNOW ACCUMULATION OVER THE ANTARCTIC 719
Figure 15. Composite cyclone density anomalies for (a) the four wettest and (b) driest months at Casey. The units are the numberof depressions per km2×10−8 day−1, as defined in the text
Climate models are a very important tool for understanding the present climate of the Antarctic andhow it may change in the future. However, in order to carry out the long integrations required the modelsare often run with a horizontal resolution of 200 km or coarser which can cause problems in certain partsof the Antarctic where the orographic height can change very rapidly. Recently, a number of climatemodel runs have been carried out with horizontal resolutions that are comparable with those of NWPmodels, so producing data that are hopefully more realistic. The Hadley Centre recently carried out a
Copyright © 1999 Royal Meteorological Society Int. J. Climatol. 19: 697–724 (1999)
J. TURNER ET AL.720
series of integrations as part of the AMIP using a model with a horizontal resolution of 90 km. Thisintegration gave an annual mean accumulation for the whole of the Antarctic of 126.3 mm year−1, afigure somewhat lower than either the ERA value or the glaciological estimates produced in recent years.As with the ERA data for the whole continent, the climate model had a peak of accumulation in theautumn, slightly less in the winter and significantly less in the summer and spring.
6.2. East Antarctica
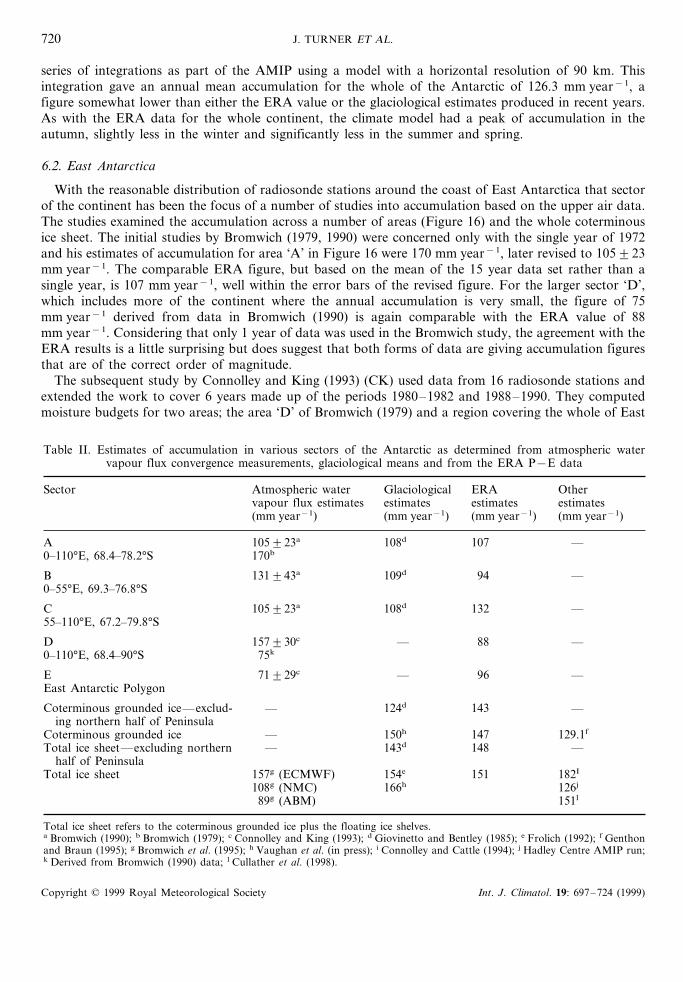
With the reasonable distribution of radiosonde stations around the coast of East Antarctica that sectorof the continent has been the focus of a number of studies into accumulation based on the upper air data.The studies examined the accumulation across a number of areas (Figure 16) and the whole coterminousice sheet. The initial studies by Bromwich (1979, 1990) were concerned only with the single year of 1972and his estimates of accumulation for area ‘A’ in Figure 16 were 170 mm year−1, later revised to 105923mm year−1. The comparable ERA figure, but based on the mean of the 15 year data set rather than asingle year, is 107 mm year−1, well within the error bars of the revised figure. For the larger sector ‘D’,which includes more of the continent where the annual accumulation is very small, the figure of 75mm year−1 derived from data in Bromwich (1990) is again comparable with the ERA value of 88mm year−1. Considering that only 1 year of data was used in the Bromwich study, the agreement with theERA results is a little surprising but does suggest that both forms of data are giving accumulation figuresthat are of the correct order of magnitude.
The subsequent study by Connolley and King (1993) (CK) used data from 16 radiosonde stations andextended the work to cover 6 years made up of the periods 1980–1982 and 1988–1990. They computedmoisture budgets for two areas; the area ‘D’ of Bromwich (1979) and a region covering the whole of East
Table II. Estimates of accumulation in various sectors of the Antarctic as determined from atmospheric watervapour flux convergence measurements, glaciological means and from the ERA P−E data
Sector Glaciological ERAAtmospheric water Otherestimatesvapour flux estimates estimates estimates
(mm year−1) (mm year−1) (mm year−1) (mm year−1)
105923a 108d 107 —A0–110°E, 68.4–78.2°S 170b
B 131943a 109d 94 —0–55°E, 69.3–76.8°S
C 105923a 108d 132 —55–110°E, 67.2–79.8°S
D 157930c — 88 —75k0–110°E, 68.4–90°S
E 71929c — 96 —East Antarctic Polygon
Coterminous grounded ice—exclud- —— 124d 143ing northern half of Peninsula
129.1f147150h—Coterminous grounded ice—148143d—Total ice sheet—excluding northern
half of Peninsula182I154eTotal ice sheet 151157g (ECMWF)
108g (NMC) 166h 126j
89g (ABM) 151l
Total ice sheet refers to the coterminous grounded ice plus the floating ice shelves.a Bromwich (1990); b Bromwich (1979); c Connolley and King (1993); d Giovinetto and Bentley (1985); e Frolich (1992); f Genthonand Braun (1995); g Bromwich et al. (1995); h Vaughan et al. (in press); i Connolley and Cattle (1994); j Hadley Centre AMIP run;k Derived from Bromwich (1990) data; l Cullather et al. (1998).
Copyright © 1999 Royal Meteorological Society Int. J. Climatol. 19: 697–724 (1999)

SNOW ACCUMULATION OVER THE ANTARCTIC 721
Figure 16. Various areas for which accumulation figures have been derived from the ERA data and in earlier studies
Antarctica indicated as ‘E’ on Figure 16. The ERA data set gives a mean accumulation of 96 mm year−1
for area ‘E’, which is comparable with the CK figure of 71929 mm year−1. However, the figures for area‘D’ are quite different, with CK estimating 157930 mm year−1 and the ERA data giving 88 mm year−1.Since areas ‘D’ and ‘E’ overlap to a large extent and it is not expected that the annual accumulation of‘D’ be vastly different from the remaining part of ‘E’, it is concluded that the CK figure for ‘D’ is toolarge. It is also much larger than the figure computed by Bromwich from his single year of data. Giventhe problems of estimating net accumulation from the radiosonde data as discussed by CK, the fact thatthe figure for area ‘D’ is quite different to that from the ERA data is not unexpected.
For the areas ‘A’, ‘B’ and ‘C’ in East Antarctica, the glaciological estimates of net accumulation asdetermined by GB are very similar at 108 or 109 mm year−1. In contrast, the ERA mean annualaccumulations range from 94 (area ‘B’) to 132 (area ‘C’) mm year−1, although the lack of data availableto GB makes a meaningful comparison difficult.
7. DISCUSSION AND CONCLUSIONS
The ERA project has clearly produced a very useful data set that will be of value in studies of many highlatitude processes. The P−E fields, since they are available for each day of the 15 year record, can beused to investigate the precipitation associated with individual synoptic-scale weather systems and toexamine their role in the interior of the continent where it is particularly difficult to conduct studiesconcerned with the synoptic climatology.
From the results presented above it can be seen that the ERA data has reproduced the correctbroad-scale distribution of snowfall across the continent, although the smoothing applied to theorography has to be taken into account when examining data for the Antarctic Peninsula and to a lesserdegree around the rest of the coastline. As when considering many meteorological parameters for remoteparts of the continent where there are no manned research stations, determining what the ‘true’precipitation or accumulation is in large sectors of the Antarctic is impossible and we must be carefulwhen comparing the ERA output against maps such as GB, which are based on little data in some areas.For example, there are large differences between the two data sets along the coast of the Amundsen Sea,
Copyright © 1999 Royal Meteorological Society Int. J. Climatol. 19: 697–724 (1999)

J. TURNER ET AL.722
yet examination of the distribution of the in situ measurements that went into the GB study shows thatvery few observations were available for this sector.
Such arguments also apply when we are comparing the mean annual accumulation values for thecontinent based on glaciological data and model data sets, such as from the ERA. However, the recentreassessment of the in situ measurements by Vaughan et al. (in press) resulted in only a modest increasein the figure for the mean annual accumulation for the continent and we can now be reasonably confidentthat this value is not too far from 160 mm year−1. The Bromwich et al. (1995) figure (157 mm year−1)determined from atmospheric water vapour flux calculations based on ECMWF operational analyses isclose to this value suggesting that the Centre’s model has the broadscale flux of moisture into theAntarctic generally correct. In the re-analysis project, the lower value for the mean accumulation is partlydue to the smooth orography, although a further factor is the excessive levels of evaporation/sublimationover the large ice shelves during the summer and spring.
One factor that is not taken into account in the ERA data but which will be reflected in theglaciological measurements is the snow that is blown off the coast. Determining the amount of snow lossby this means is extremely difficult because of its sensitivity to the wind speed and its high dependence onthe local orography. However, Giovinetto et al. (1992) suggest that snow blowing off the continent is notsignificant for the continental mass balance, although blowing snow could be large locally. Loewe (1970)calculated that the cross-coastal blowing snow mass flux was equivalent to an annual loss of 8 mm waterequivalent, when averaged over the whole of the Antarctic ice sheet. If this were the case then the ERAestimate of the mean accumulation for the whole of the ice sheet would become only 143 mm year−1,which is much smaller than the glaciological estimates. However, there are great uncertainties in theLoewe figure and more work needs to be carried out on the estimation of the cross-coast mass flux todetermine if the figure of 8 mm year−1 is correct.
This study has highlighted a number of problems with the ERA results that will require furtherinvestigation. The P−E values for the interior of the continent seem too low when compared to the insitu observations and, although there are obviously problems in measuring accumulation amounts thataverage about 1 mm each week, the number of in situ observations does seem to point to the modelhaving too little precipitation in this area. However, the precipitation in the interior is affected by manyfactors, including the flux of moisture into the Antarctic (which mostly takes place at mid-troposphericlevels), the parameterization of the cloud and precipitation processes, and the temperature structure in theboundary layer, including the strength of the surface inversion. The close coupling between many of theseprocesses and the very small amounts of precipitation that result makes it difficult to determine whichaspects of the model are in error and must await a more detailed diagnostic investigation.
Another problem that emerged was the excessive levels of evaporation/sublimation on the ice shelves.Examination of the evaporation data from ERA for the whole globe suggests that the levels ofevaporation in the tropical and mid-latitude areas are reasonable, which is to be expected since the modelwill have been tuned for these regions. In the interior of the Antarctic, the evaporation levels are rightlyvery small and it is only in the narrow coastal strip, and in particular on the ice shelves, where there isnoticeably too much evaporation. This could be a result of a temperature error at the surface or on thelowest model level, or because of the near surface winds being too strong. Alternatively, the parameteri-zation of evaporation may not be appropriate for these low-lying ice shelves. However, the most likelyexplanation for the excessive evaporation is the incorrect representation of the ice shelves as sea ice inboth the operational ECMWF and ERA forecasts.
One area where further work is required is to re-assess the annual cycle of accumulation over the highplateau. Both the ERA results and those from Genthon and Braun (1995) show no clear cycle inaccumulation over the year, yet the often quoted results of Dolgina and Petrova (1977) have a markedaccumulation peak in the winter. Considering that the temperatures are so low in the middle of the australwinter, this result is surprising and needs to be re-confirmed.
Despite the problems discussed above, the ERA data set is clearly of value in the study of Antarcticmass balance, especially if it is used in conjunction with other available data, since no one form of datais without some form of problem. Of particular importance is the relative merits of the operational
Copyright © 1999 Royal Meteorological Society Int. J. Climatol. 19: 697–724 (1999)

SNOW ACCUMULATION OVER THE ANTARCTIC 723
ECMWF analyses and the re-analysis products. The ERA data does not suffer from the sudden jumps inperformance that occurred when new analysis schemes or improved versions of the forecast model wereintroduced, which makes them especially valuable in studies of inter-annual variability of accumulation atparticular locations. This is particularly true around the edge of the continent, where the operationalproducts suffered from several changes in the land/sea mask and the orography used in the model. Thismeant that changes made to the analysis/forecast system resulted in some locations being at differentorographic heights during the period of the ECMWF operational products with consequent effects on theaccumulation. However, recent investigations of the ECMWF operational and re-analysis products(Bromwich et al., in press) suggest that the fit of observations in the two products was different, whichhad a major impact on the accumulation over West Antarctica. Therefore, at this stage, users of theECMWF data sets should be aware of the limitations in the accumulation products and the differencesthat exist when they are compared to the in situ measurements.
Although the 15 years of ERA data is excellent for many climatological and synoptic studies, it is tooshort to determine if there is any trend in the accumulation over the continent. During the period coveredby ERA there were fluctuations in the accumulation for the whole continent that were apparent in thedata for both East and West Antarctica, such as the accumulation minimum in 1987 and such eventswarrant further investigation. However, more years of data are required before any trends could beextracted and it is hoped that more recent years of data will be added beyond 1993 and that there-analysis exercise will be repeated with future versions of the ECMWF model.
ACKNOWLEDGEMENTS
The authors are grateful to ECMWF and the British Atmospheric Data Centre for providing there-analysis fields.
REFERENCES
Bromwich, D.H. 1979. Precipitation and Accumulation Estimates for East Antarctica, Deri6ed from Rawinsonde Information, Ph.DThesis, University of Wisconsin-Madison, 142 pp.
Bromwich, D.H. 1988. ‘Snowfall in high southern latitudes’, Re6. Geophys., 26(1), 149–168.Bromwich, D.H. 1990. ‘Estimates of Antarctic precipitation’, Nature, 343, 627–629.Bromwich, D.H., Robasky, F.M., Cullather, R.I. and Van Woert, M.L. 1995. ‘Atmospheric hydrologic cycle over the Southern
Ocean and Antarctica from operational numerical analyses’, Month. Weather Re6., 123, 3518–3538.Bromwich, D.H., Carrasco, J.F. and Turner, J. 1996. ‘A downward developing mesoscale cyclone over the Ross Ice Shelf during
winter’, Global Atmos. Ocean Syst., 4, 125–147.Bromwich, D.H., Rogers, A.N. and Cullather, R.I. ‘ECMWF analyses and re-analyses depiction of ENSO signal in Antarctic
precipitation’, Preprints, Fifth Conference on Polar Meteorology and Oceanography, 11–15 January 1999, Dallas, TX, in press.Budd, W.F. and Simmonds, I. 1991. ‘The impact of global warming on the Antarctic mass balance and global sea level’, in Weller,
G., Wilson, C.L. and Severin, B.A.B. (eds.), Proceedings of the International Conference on the Role of the Polar Regions in GlobalChange, June 11–15, 1990, University of Alaska, Fairbanks, Fairbanks, Geophysical Institute, University of Alaska Fairbanks,pp. 489–494.
Bull, C. 1971. ‘Snow accumulation in Antarctica’, in Quam, L.O. (ed.), Research in the Antarctic, American Association for theAdvancement of Science, Washington, DC, pp. 367–421.
Chen, B., Smith, S.R. and Bromwich, D.H. 1996. ‘Evolution of the tropospheric split jet over the South Pacific Ocean during the1986–1989 ENSO cycle’, Month. Weather Re6., 124, 1711–1731.
Connolley, W.M. 1997. ‘Variability in annual mean circulation in southern high latitudes’, Clim. Dyn., 13, 745–756.Connolley, W.M. and Cattle, H. 1994. ‘The Antarctic climate of the UKMO Unified Model’, Antarct. Science, 6, 115–122.Connolley, W.M. and King, J.C. 1993. ‘Atmospheric water vapour transport to Antarctica inferred from radiosonde data’, Q. J. R.
Meteorol. Soc., 119, 325–342.Cullather, R.I., Bromwich, D.H. and Van Woert, M.L. 1996. ‘Interannual variations in Antarctic precipitation related to El
Nino–Southern Oscillation’, J. Geophys. Res., 101(19), 109–119.Cullather, R.I., Bromwich, D.H. and Van Woert, M.L. 1998. ‘Spatial and temporal variability of Antarctic precipitation from
atmospheric methods’, J. Clim., 11, 334–367.Dolgina, I.M. and Petrova, L.S. 1977. Handbook of Antarctic Climate vol. 2 (in Russian), Hydrological Institute, 493 pp.Drewry, D.J. 1983. Antarctica: Glaciological and Geophysical Folio, Scott Polar Research Institute, Cambridge.ECMWF, 1996. The Description of the ECMWF Re-analysis Global Atmospheric Data Archi6e, ECMWF, Reading. Copies can be
obtained from ECMWF, Shinfield Park, Reading, Berks, RG2 9AX, UK.Frolich, R.M. 1992. ‘The surface mass balance of the Antarctic Peninsula ice sheet’, in Morris, E.M. (ed.), The Contribution of
Antarctic Peninsula Ice to Sea Le6el Rise, British Antarctic Survey, Cambridge, pp. 3–9.
Copyright © 1999 Royal Meteorological Society Int. J. Climatol. 19: 697–724 (1999)

J. TURNER ET AL.724
Fujii, Y. and Kusunoki, K. 1982. ‘The role of sublimation and condensation in the formation of ice sheet surface at Mizuho Station,Antarctica’, J. Geophys. Res., 87, 4293–4300.
Genthon, C. and Braun, A. 1995. ‘ECMWF analyses and predictions of the surface climate of Greenland and Antarctica’, J. Clim.,8, 2324–2332.
Gibson, J.K., Hernandez, A., Kallberg, P., Nomura, A., Serrano, E. and Uppala, S. 1996. ‘Current status of the ECMWFre-analysis project’, Proceedings of the Se6enth Conference on Global Change Studies, American Meteorological Society, Boston,pp. 112–115.
Giovinetto, M.B. and Bentley, C.R. 1985. ‘Surface balance in ice drainage systems of Antarctica’, Antarctic J. USA, 20, 6–13.Giovinetto, M.B. and Bull, C. 1987. Summary and Analysis of Surface Mass Balance Compilations for Antarctica, 1960–1985, Report
1, Byrd Polar Research Center, Columbus.Giovinetto, M.B., Bromwich, D.H. and Wendler, G. 1992. ‘Atmospheric net transport of water vapor and latent heat across 70°S’,
J. Geophys. Res., 97, 917–930.Gow, A.J. 1965. ‘On the accumulation and seasonal stratification of snow at the South Pole’, Ann. Glaciol., 5, 467–477.Harangozo, S.A. 1997. ‘Atmospheric meridional circulation impacts on contrasting winter sea ice extent in two years in the Pacific
sector of the Southern Ocean’, Tellus, 49, 388–400.Jacobs, S.S. and Comiso, J.C. 1997. ‘Climate variability in the Amundsen and Bellingshausen Seas’, J. Clim., 10, 697–709.Jacobs, S.S., Helmer, H.H., Doake, C.S.M., Jenkins, A. and Frolich, R.M. 1992. ‘Melting of ice shelves and the mass balance of
Antarctica’, J. Glaciol., 38, 375–387.Jones, D.A. and Simmonds, I. 1993. ‘A climatology of Southern Hemisphere extratropical cyclones’, Clim. Dyn., 9, 131–145.King, J.C. 1994. ‘Recent climate variability in the vicinity of the Antarctic Peninsula’, Int. J. Climatol., 14, 357–369.King, J.C., Anderson, P.S., Smith, M.C. and Mobbs, S.D. 1995. ‘Surface energy and water balance over an Antarctic ice shelf in
winter’, in Preprints, Fourth Conference on Polar Meteorology and Oceanography, American Meteorological Society, Boston, pp.79–81.
Limbert, D.W.S. 1963. ‘The snow accumulation budget at Halley Bay in 1959, and associated meteorological factors’, BAS Bull.,2, 73–92.
Loewe, F. 1962. ‘On the mass economy of the interior of the Antarctic ice cap’, J. Geophys. Res., 67, 5171–5177.Loewe, F. 1970. ‘The transport of snow on ice sheets by the wind’, Studies on Drifting Snow, Publication 13, Meteorology
Department, University of Melbourne, Melbourne.Marshall, G.J. and King, J.C. 1998. ‘Southern Hemisphere circulation anomalies associated with extreme Antarctic Peninsula winter
temperatures’, Geophys. Res. Lett., 25, 2437–2440.Mosley-Thompson, E., Thompson, L.G., Paskievitch, J.F., Pourchet, M., Gow, A.J., Davis, M.E. and Kleinman, J. 1995. ‘Recent
increase in South Pole snow accumulation’, Ann. Glaciol., 21, 131–138.Murray, R.J. and Simmonds, I. 1991. ‘A numerical scheme for tracking cyclone centres from digital data. Part I: development and
operation of the scheme’, Aust. Meteorol. Mag., 39, 155–166.Ohmura, A., Wild, M. and Bengtsson, L. 1996. ‘A possible change in mass balance of Greenland and Antarctic ice sheets in the
coming century’, J. Clim., 9, 2124–2135.Radok, U. and Lile, R.C. 1977. ‘A year of snow accumulation at Plateau Station’, in Businger, J.A. (ed), Meteorological Studies at
Plateau Station, Antarctica. Antarctic Research Series, vol. 25, American Geophysical Union, Washington, DC, pp. 17–26.Rusin, N.P. 1961. Meteorological and Radiational Regime of Antarctica, Israel Program for Scientific Translations, Jerusalem, 355
pp.Sato, N., Kikuchi, K., Barnard, S.C. and Hogan, A.W. 1981. ‘Some characteristic properties of ice crystal precipitation in the
summer season at South Pole Station, Antarctica’, J. Meteorol. Soc. Jpn., 59, 772–780.Sinclair, M.R. 1994. ‘An objective cyclone climatology for the Southern Hemisphere’, Month. Weather Re6., 122, 2239–2256.Stearns, C.R. and Weidner, C.A. 1993. ‘Sensible and latent heat flux estimates in Antarctica’, in Bromwich, D.H. and Stearns, C.R.
(eds.), Antarctic Meteorology and Climatology: Studies Based on Automatic Weather Stations, Antarctic Research Series, vol. 61,American Geophysical Union, Washington, pp. 109–38.
Thompson, S.L. and Pollard, D. 1997. ‘Greenland and Antarctic mass balances for present and doubled atmospheric CO2 from theGENESIS version-2 global climate model’, J. Clim., 10, 871–900.
Turner, J., Lachlan-Cope, T.A., Thomas, J.P. and Colwell, S. 1995. ‘The synoptic origins of precipitation over the AntarcticPeninsula’, Antarctic Sci., 7, 327–337.
Turner, J., Bromwich, D., Colwell, S., Dixon, S., Gibson, T., Hart, T., Heinemann, G., Hutchinson, H., Jacka, K., Leonard, S.,Lieder, M., Marsh, L., Pendlebury, S., Phillpot, H., Pook, M. and Simmonds, I. 1996. ‘The Antarctic First Regional ObservingStudy of the Troposphere (FROST) project’, Bull. Am. Meteorol. Soc., 77, 2007–2032.
Turner, J., Colwell, S.R. and Harangozo, S.A. 1997a. ‘Variability of precipitation over the coastal western Antarctic Peninsula fromsynoptic observations’, J. Geophys. Res., 102, 13999–14007.
Turner, J., King, J., Harangozo, S., Connolley, W. and Marshall, G. 1997b, ‘Major changes in the climate of the Antarctic Peninsuladuring the last 50 years’, in Preprints, Se6enth Conference on Climate Variations, February 2–7 1997, Long Beach, CA, AmericanMeteorological Society, Boston, pp. J88–J91.
Turner, J., Marshall, G.J. and Lachlan-Cope, T.A. 1998. ‘Analysis of synoptic-scale low pressure systems within the AntarcticPeninsula sector of the circumpolar trough’, Int. J. Climatol., 18, 253–280.
UNESCO 1978. World Water Balance and Water Resources of the Earth, UNESCO Press, Paris.van Loon, H. 1967. ‘The half-yearly oscillations in middle and high Southern latitudes and the coreless winter’, J. Atmos. Sci., 24,
472–486.Vaughan, D.G., Bamber, J.L., Giovinetto, M., Russell, J. and Cooper, A.P.R. ‘Reassessment of the surface mass balance in
Antarctica’, J. Clim., in press.Zwally, H.J. and Giovinetto, M.B. 1995. ‘Accumulation in Antarctica and Greenland derived from passive-microwave data: a
comparison with contoured compilations’, Ann. Glaciol., 21, 123–130.
Copyright © 1999 Royal Meteorological Society Int. J. Climatol. 19: 697–724 (1999)