spanish sign language survey - sil international · spanish sign language survey ... this paper...
TRANSCRIPT

Spanish Sign Language Survey
Stephen Parkhurst and Diane Parkhurst
SIL International 2006

2
Contents
Abstract
Introduction Focus Definitions Spanish Sign Language
Lexical Study Methodology Wordlist Comparisons
Lexical Differences Conclusion
Recorded Text Tests Definitions Methodology Test Results
Scoring the tests Interpreting the Scores Language Ability
Text Clarity Selection of Questions Dialect Mapping Conclusion
Sociolinguistic Information Introduction History of the Deaf Community Other factors Conclusions Implications for the Future
Appendix A Example wordlist in SignWriting
Appendix B Instructions and Examples for the Recorded Text Tests Bilbao Text (Signed by José Martín Sáenz, April 27, 1996) Questions
Appendix C Manual alphabets in Spain
References

3
Abstract This paper examines and documents sign language variation from eighteen locations throughout Spain by comparing wordlists in deaf communities. Other factors were also considered, such as language attitudes, in reaching our conclusions. From the research, we predict future trends regarding the continuing development of the language.
Introduction
Focus The focus of this study is to examine the variation of signing used by the deaf communities of Spain. Throughout the world, deaf people gather together in homes, clubs, associations, churches, and even subway stations, interacting with each other, using a sign language that is shared by the members of that particular group. Within most countries, numerous groups such as these meet regularly. While a country such as the United States, Spain, Japan, or Argentina may be considered to have one sign language that is unique to that country, there are often further divisions within a country. These divisions may occur between regions, cities, deaf schools, or associations. Language variation is common in almost every language in the world, spoken or signed. The variation may be seen in the choice of vocabulary, the pronounciation of words, or how the words fit together grammatically. In some instances we begin to see the variation is great enough to hinder communication. When communication breaks down, the distinctions between dialects and languages appear. The sign language in Spain varies widely throughout the country. Because of this, Spain is a good testing ground for the linguistic study of sign language variation. Can the sign language in one country be divided into distinct dialects? What factors are used to determine such distinctions? How can the situation be accurately tested and documented? This paper presents several methods used to examine and document the language variation in Spain. We discuss lexical studies and intelligibility tests based on recorded texts. We also look at clues to the language situation offered by sociolinguistic concerns such as attitudes, history, and demographics.
Definitions
Deaf Community We begin by defining the term “deaf community.” There are two perspectives for the concept of community: an inward view and an outward view. In the first perspective, a community must exhibit an inward view of the group, a self-identity as a group. They must consider themselves part of a group. Poplin (1972:7) defines one aspect of community by stating that it involves a “sense of identity and unity with one’s group and a feeling of involvement and wholeness on the part of the individual.” For the deaf in Spain as in most countries, this self-identity is born out of the shared experiences that come from being deaf and from living in a predominantly hearing world. Because only 10 percent of deaf children have deaf parents, most have a shared experience of not being able to communicate freely with parents or other family members and neighbors. In Spain, many members of the older generation share common experiences of living at boarding schools for deaf children.

4
The younger generation has been more influenced by integration policies, and many of them have had the experience of being the only deaf person in a hearing class. These experiences, both positive and negative, shape how a person views his world. A person’s world views are usually most similar to the world views of others who share common experiences. The result of such shared experiences is a feeling of identity among the deaf: “These people understand me.” One part of self-identity is active participation within the group. This is often exhibited by participation in deaf activities. There are more than 115 organized deaf associations in Spain, where a wide variety of activities are offered. These associations provide a regular time and place for deaf people to get together and socialize. In addition to the associations, there are numerous bars and hangouts where deaf people regularly meet. In Spain, identity in the deaf community is centered around participation in these organized associations and informal gatherings. An outworking of such participation is the demand for a common means of communication. Lilian Lawson (1981) defines the role of language in community as follows:
At the heart of every community is its language. This language embodies the thoughts and experiences of its users, and they, in turn, learn about their culture or heritage and share in it together through their language.
This common language is typically some variation of what is generally known as Spanish Sign Language.1 Not all physically deaf people identify with the deaf community. One deaf lady told us, “When I go to a deaf club, I don’t feel comfortable. We are different. My friends are hearing.” These deaf people identify more with the hearing world than with the deaf world. Since this study is primarily concerned with sign language variation, we will refer to the deaf community as those that prefer to communicate using a form of sign language. The second perspective of community is how the group views others, an outward view, a distinction between self and others. A misunderstanding that occurred to us in Mexico illustrates one signer’s distinction between hearing and deaf people. We visited a deaf club with several deaf friends in Mexico City. When we first entered the club, our friends introduced us as hearing friends from the United States. Later one of the members of the club offered each of us a soda. One of the ladies did not like sodas and tried to reply, “No, thanks.” The club member signed, “Why don’t you want it? You and I are the same; it doesn’t matter if you are from Mexico or the United States; we are the same.” At this point our deaf friend interjected, “No, no. They are hearing.” The man then scolded us harshly, “Why didn’t you tell
1 Within the deaf community, two subgroups can be distinguished based on the preference of language. There is a large “signing deaf community” made up of people who use sign language as their preferred medium of communication. However, as a result of oral education, some deaf people are more comfortable communicating orally or using a combination of speech and signing. There are a few deaf associations in Spain whose members are mostly oral deaf individuals. These people share common experiences as deaf people who were raised orally and may not feel as comfortable around those that prefer to use only sign language. Likewise, those who sign may not feel a bond with those who do not sign. Signing deaf people have told us, “At ____ association, they are all oral, so we don't go there.” In these locations, there is an “oral deaf community.” However, both the signing and oral deaf communities are generally considered part of the overall deaf community and distinct from the hearing community.

5
me you were hearing? Are you trying to deceive me? When you meet a deaf person, you should shake hands with one hand and sign HEARING with the other!” Although this proved to be an extreme reaction to the difference between deaf and hearing, it does illustrate identity and distinction. This deaf man was, on one hand, recognizing a distinction between Mexican and American, while saying that (in essence) a deaf Mexican is the same as a deaf American. However, the distinction between deaf and hearing was much greater to him. This example also shows that there are levels of “community.” A deaf person may refer to the international deaf community, making a distinction between those who are deaf and those who are not. At other times, distinctions may be on a national or regional level. On the national level, deaf people from Spain are part of the Spanish deaf community, which is distinct from the French deaf community or the American deaf community. However, on the regional level, those in Cataluña say they are Catalán and, therefore, distinct from deaf people from other regions of Spain. Other levels of community may be divided along lines of city or deaf school, even gender or age. This paper is primarily concerned with the distinctions that come at the national, regional, and city levels.
Idiolect, Dialect, Dialect Groupings, and Language Several other terms need to be defined at this point: idiolect, dialect, dialect groupings, and language. These terms refer to levels of language variation. As will be seen, the concepts of self-identity and distinction play an important role in these definitions. We start with the most limited term, idiolect, and finish with the broadest, language. Idiolect refers to an individual’s way of speaking (or signing); it is the lowest level of distinction of language variation. Every person has a unique way of expressing himself. The choice of words, pronunciation, and even grammar often vary in minute degrees from person to person. Rarely is there a conscious distinction between an individual’s signing and others’. They are aware, however, that individual variation exists. As we ask people how they sign something, they often tell us, “I sign it this way; other people sign it differently.” Dialects refer to regional or social speech varieties which share common characteristics. A sign language dialect is, therefore, a sign language variety that is used by members of a particular region or social group. Each group shares common characteristics in their language, which may take the form of a unique set of signs (the lexicon), or a grammar that differs from that used by other groups. As with the concept of community, the presence of a self-identity as a group and distinction from others is crucial in defining dialect. This identity and distinction are based primarily on linguistic and sociolinguistic factors. Theodor Lewandowski (1992), in his definition of language (idioma), gives a pertinent description of the role of identity and distinction.
The language spoken by a group or community is the strongest and most basic element of unification among its members; it gives individuals the feeling of belonging to a group, but it also can act as a differentiator between other social or regional groupings. (p. 184)
As we traveled around the country asking for deaf people’s impressions of their language, we often received comments such as: “We, here in Granada, sign differently from those in Málaga or Córdoba.” By referring to how “We, here in Granada” sign, there is a realization that the sign language in Granada is unified to some degree. There is a sense of identity: “We.” At the same time, there is a distinction from the sign language which is used in other cities.

6
As with community, there are levels of dialect identity and distinction. While those in Granada said that their sign language is different from that in Córdoba, they also readily agreed that deaf people in the region of Andalucia (which includes both Granada and Córdoba) sign somewhat differently from the people in another region, e.g., Madrid or Valencia. This wider distinction can be called a dialect grouping. Those within a dialect grouping understand each other more easily than they understand those from outside of the dialect grouping. At some arbitrary point, dialect distinctions become language distinctions. Generally, a language distinction means that there is significant linguistic difference between that group and some other group, and that the two groups have significant difficulty understanding each other. Grimes (1995) gives a good description of the difference between dialect and language:
Language and dialect are all too often looked at only POLITICALLY: “languages” are what relatively powerful groups speak, and “dialects” cluster around their periphery regardless of their linguistic nature. That is one dimension of the picture, but it is not everything. The LINGUISTIC dimension, which language surveys also explore, sometimes gives a different answer than the analysis by political power. What a linguist means by a “language” is a cluster of regional or social speech varieties (“dialects”), at least one of which can be understood adequately by everyone who speaks any of the varieties in the cluster natively (p. 17).
The linguistic definition of language and dialect distinctions is dependent on understanding several aspects of the language situation. We must understand how one variety differs from another linguistically by studying the lexicon and grammar of the varieties. We must also discover the level of intelligibility between the groups, i.e., how well speakers of one variety understand other varieties. Linguistic variation and intelligibility are examined closely in this paper, with a hope of determining dialects, dialect groupings, and possible language distinctions. While this paper deals primarily with the linguistic aspects of language variation, Grimes also refers to the political distinction between dialect and language. The attitudes a group has toward its own language variety and other varieties also play a major role in understanding the language situation. We have, therefore, attempted to synthesize the linguistic data with the information we gathered about the attitudes of the deaf community. In this study, we set out to measure the linguistic differences among the signing deaf communities in Spain by comparing a list of 217 words collected from eighteen locations around the country. We also attempted to measure the level of comprehension between groups through intelligibility tests with videoed texts from six locations. Comparisons of the lexical data showed significant enough distinctions between locations that each of the eighteen sites may be considered to have its own dialect. Many of the dialects can be joined together to form dialect groupings. Most of the similarity scores in the lexical data were within the “ambiguous” range, which means that intelligibility testing is necessary to determine whether the dialect distinction should be considered language distinction. The intelligibility testing showed that there was significant comprehension of texts between all communities, to a degree that all the deaf communities of Spain that we tested could be considered to be part of the same language.

7
We also gathered information about language attitudes and other factors. These data indicated a greater difference between some communities than did the linguistic data. In one region, the attitudes were strong enough that their sign language variety could be considered a separate language. By viewing all the linguistic evidence and the attitudes of the communities, we were able to piece together much of the “puzzle” of the current language situation among the deaf in Spain.
Spanish Sign Language Clarification is needed on our use of the term Spanish Sign Language (Lengua de Signos Española or LSE). 2 LSE can refer to all the varieties of sign language that are used in Spain. However, this term has recently been given a more limited definition that refers only to the sign language used in the Castilian Spanish-speaking regions of the country. The sign language used in some of the other autonomous regions of Spain that do not speak Castilian Spanish is referred to by the name of the predominantly spoken language of that region. For this reason, it is possible to find references to Catalán Sign Language (Lengua de Signos Catalana, or LSC), Galician Sign Language (Lengua de Signos Gallega, or LSG), Valencian Sign Language (Lengua de Signos Valenciana, or LSV), and so on. This study was conducted within the geographic borders of Spain and included the sign language varieties such as LSC, LSG, LSV, and others. For this reason, we have chosen the broader interpretation of LSE (Lengua de Signos Española) to refer to all the linguistic variations of sign language used in Spain. The Association of Interpreters uses the term Lengua de Signos de España in its name to refer to all sign language varieties in Spain. The following is a clarification of that name:
Having observed that on numerous occasions our organization has been referred to as Asociación de Intérpretes de Lengua de Signos Española, or Asociación de Intérpretes de L.S.E., we find ourselves needing to clarify that the correct name of our organization is Asociación de Intérpretes de Lengua de Signos de España. This is due to the fact that our organization has as its territory all of Spain, even though this may include different sign languages, not only la española (Confederación Nacional de Sordos de España, 1994:62).
Later, we narrow the interpretation to include the sign language varieties used in all regions of Spain except Cataluña.
Lexical Study Lexical studies are quite simple to carry out and require relatively little preparation. A lexical study consists of collecting and comparing lists of basic vocabulary, typically between 100 and 500 words, from the areas under study. Although there are limitations to what such a study can tell us, insights that can be derived are significant enough to make such a study well worth the effort. This information is divided into two major sections. In the first section, we discuss our methodology in collecting and documenting data. The second section shows how the wordlists compare with each other. We discuss how wordlists can help distinguish between dialects, dialect groupings, and separate languages. From this information we determine what further testing is necessary.
2 The term Lengua de Señas is also used by some deaf leaders, although Lengua de Signos is more common.

8
Methodology
Word Choice The objective of gathering words for a lexical study is to collect a broad sampling of basic vocabulary to enable us to make inferences about the entire vocabulary. It would be an impossible task to compare the entire vocabulary of every community under study. For this reason, lexical studies typically look for 100–500 basic words from a wide range of semantic and grammatical categories. We chose a list of 217 words, from which we compared 200 of them. We carefully selected words which covered a wide range of grammatical areas such as verbs, nouns, adjectives, adverbs, and interrogatives. We also chose words that were contextually relevant to modern Spanish society. The wordlist is presented below.
Survey Wordlist 1. family 2. mother 3. father 4. spouse 5. police 6. law 7. blood 8. meat 9. to live 10. to die 11. strong 12. weak 13. to ask 14. boyfriend 15. brother 16. son 17. grandfather 18. cousin 19. child 20. man 21. woman 22. friend 23. teacher 24. deaf 25. rain 26. house 27. city 28. book 29. paper 30. money 31. to buy 32. to sell 33. to pay 34. rich (money) 35. rock
36. water 37. land 38. mountain 39. tree 40. to work 41. to help 42. to sing 43. to understand 44. thank you 45. mouse 46. cat 47. good 48. bad 49. new 50. old 51. what 52. who 53. when 54. how many 55. where 56. how 57. no 58. yes *59. maybe 60. day 61. night 62. sun 63. moon 64. Spain 65. name 66. story 67. shirt 68. hot 69. cold 70. God
71. devil 72. sin 73. to confess 74. poor 75. priest 76. peace 77. birthday 78. angry 79. happy 80. sad 81. more 82. apple 83. milk 84. wine 85. chicken 86. bread 87. sweet 88. young 89. dirty 90. to fight 91. to kill 92. fire 93. colors 94. white 95. black 96. red 97. blue 98. green 99. seven 100. January February March April (replacing #59) May
June July August (replacing #140) September October November December 101. Monday Tuesday Wednesday (replacing #144) Thursday Friday Saturday (replacing #187) Sunday 102. 100 103. 1,000 104. to tell a lie 105. to play 106. to sit 107. to dance 108. to eat 109. egg 110. fish 111. salt 112. carrot 113. car 114. bus 115. airplane 116. beautiful 117. ugly 118. skinny 119. dry
9
120. wet 121. soldier 122. president 123. judge 124. doctor 125. animal 126. dog 127. snake 128. lion 129. elephant 130. horse 131. bear 132. bull 133. fly (insect) 134. to go 135. to come 136. to sleep 137. to need 138. to read 139. to write *140. to believe
141. Jesus 142. Virgin Mary 143. angel *144. to bless 145. to forgive 146. church 147. to love 148. flower 149. leaf 150. river 151. ocean 152. snow 153. ice 154. wind 155. star 156. almost 157. now 158. week 159. month 160. summer 161. winter
162. year 163. wood 164. table 165. window 166. school 167. bathroom 168. all 169. some 170. other 171. nothing 172. many 173. tired 174. afraid 175. hungry 176. never 177. always 178. only 179. to sign 180. to hate 181. envy 182. to look for
183. to meet 184. to build 185. to cook 186. to see *187. full 188. free 189. true 190. false 191. door 192. shoe 193. bed 194. light 195. knife 196. garbage 197. to dream 198. to continue 199. to begin 200. to end
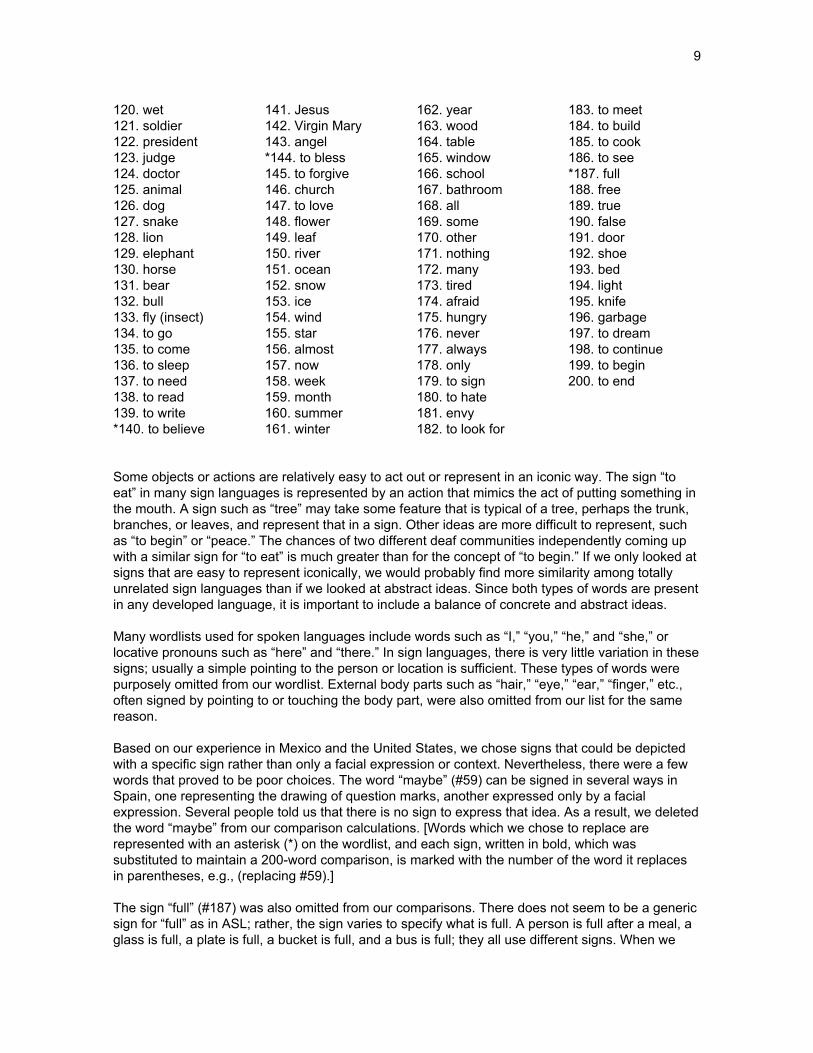
Some objects or actions are relatively easy to act out or represent in an iconic way. The sign “to eat” in many sign languages is represented by an action that mimics the act of putting something in the mouth. A sign such as “tree” may take some feature that is typical of a tree, perhaps the trunk, branches, or leaves, and represent that in a sign. Other ideas are more difficult to represent, such as “to begin” or “peace.” The chances of two different deaf communities independently coming up with a similar sign for “to eat” is much greater than for the concept of “to begin.” If we only looked at signs that are easy to represent iconically, we would probably find more similarity among totally unrelated sign languages than if we looked at abstract ideas. Since both types of words are present in any developed language, it is important to include a balance of concrete and abstract ideas. Many wordlists used for spoken languages include words such as “I,” “you,” “he,” and “she,” or locative pronouns such as “here” and “there.” In sign languages, there is very little variation in these signs; usually a simple pointing to the person or location is sufficient. These types of words were purposely omitted from our wordlist. External body parts such as “hair,” “eye,” “ear,” “finger,” etc., often signed by pointing to or touching the body part, were also omitted from our list for the same reason. Based on our experience in Mexico and the United States, we chose signs that could be depicted with a specific sign rather than only a facial expression or context. Nevertheless, there were a few words that proved to be poor choices. The word “maybe” (#59) can be signed in several ways in Spain, one representing the drawing of question marks, another expressed only by a facial expression. Several people told us that there is no sign to express that idea. As a result, we deleted the word “maybe” from our comparison calculations. [Words which we chose to replace are represented with an asterisk (*) on the wordlist, and each sign, written in bold, which was substituted to maintain a 200-word comparison, is marked with the number of the word it replaces in parentheses, e.g., (replacing #59).] The sign “full” (#187) was also omitted from our comparisons. There does not seem to be a generic sign for “full” as in ASL; rather, the sign varies to specify what is full. A person is full after a meal, a glass is full, a plate is full, a bucket is full, and a bus is full; they all use different signs. When we

10
started gathering the lexical data, we were unaware that we needed to specify what was full. After several lists, it was too late to rectify our mistake, so we decided not to use the word in the comparison. The sign for “to believe” (#140) was deleted from our comparisons because the word “to believe” has two meanings which are signed differently. Some people gave us a sign that represented the idea of “to think with doubt” as in the sentence, “I believe he is coming tonight (but I am not sure).” The other sign we received means “to think or know with assurance,” as in the sentence, “I believe in God.” The idea “to bless” (#144) was not understood in several locations and was therefore omitted from our comparisons as well. Many surveyors eliminate numbers and months from their wordlists since those items are often borrowed from the dominant language. If one number is borrowed, then it is likely that all numbers will be borrowed. For this reason, we only used three numbers as lexical items: seven (#99), 100 (#102), and 1,000 (#103). We chose to use the names of the months as lexical items because in Spain these signs are not borrowed from any other language; rather they reflect some important event or typical characteristic associated with that month. For example, the sign in Madrid for “February” is the same as the sign for Carnaval, (a festival celebrated every February). “March” is represented by the sign for “wind” since March is a windy month. In Mexico, however, all the months except two are signed using the same basic location, orientation, and movement, and all are distinguished from the others by handshape.3 For example, the S handshape is used for septiembre, while the O handshape is used for octubre. In Mexico, then, all the signs for the months are equally influenced by the spoken language. A surveyor who does not know if the numbers and months (and days of the week) are borrowed from another language should probably use only one such item in the lexical comparison. Since we knew that in at least some of the dialects these terms were locally determined and not borrowed, we felt it was acceptable to use the months and days of the week as replacement signs for other lexical items. In countries where there is significant religious diversity, it may not be wise to use many religious terms since these terms may reflect the person’s specific religious affinity, rather than the regional dialect. Bickford (1991:245) comments that the sign for “baptize” in Mexico is signed differently based on the signer’s affiliation with the Catholic or Baptist churches. In Spain, nearly all deaf people consider themselves Catholic, and many of the deaf schools offer Catholic instruction. Since we felt that most deaf Spaniards would be familiar with basic religious terminology, we used religious vocabulary to provide proper nouns such as “Jesus” (#141), and “Virgin Mary” (#142), as well as abstract concepts such as “sin” (#72) and “forgive” (#145).
Eliciting and Recording Information The lexical items were written in Spanish on the pages of pocket-sized spiral notebooks, one word per page. We showed the Spanish word to one or more fluent deaf signers from the area. Since the words were generally basic vocabulary, there was rarely an occasion when the signer was not familiar with the written Spanish word. If there was any confusion over the meaning of a word, the meanings were usually clarified by another deaf person (if more than one person were supplying
3 “March” and “April” use the M and A handshapes, respectively, in small circles near the side of the face. The other months are initialized wrist rotations in the signing space at chest level, with slight handshape variations for May and July.

11
the wordlist). If only one person assisted, we attempted to explain the unfamiliar word in sign language, or we gave examples until the word was clearly understood. We encouraged people to give us as many signs as were commonly used in their area for each word. When more than one sign was given for a Spanish word, we questioned if the signs were used interchangeably or if a difference existed in the range of meaning of the signs. When we knew that other signs existed in other locations for the same word, we often questioned whether the other varieties were used in this area as well. It would have been helpful to have requested additional information about the relevant frequency of use for each variation and how widespread was the degree of comprehension of each sign. The information was recorded in written form using the SignWriting system developed by Valerie Sutton and the deaf Action Committee.4 SignWriting is a system of writing sign language that utilizes simplified drawings and symbols to represent handshapes, hand and body movements, contact, and facial expressions. The symbols are graphic representations of the actual handshapes, facial expressions, etc. These symbols are placed on the page so that they represent the spatial location of the hands (and other pertinent body parts) in the signs. The end result is a simple picture-like drawing that actually looks like the sign. The system is quite easy both to read and to produce, making it ideal for our use in this study. Since we already knew a fair amount of LSE when we began collecting wordlists, we created a scoring sheet representing (in SignWriting) all the signs we already knew for each Spanish word on our list. We used the SignWriter computer program to store the information and print out this list. As we elicited a wordlist in a new location, we wrote directly on the score sheet, circling the sign if it already existed on our sheet. If the sign was a variation of a sign on the list, we altered the sign on our score sheet to reflect the differences. When someone gave us a new sign, we wrote the sign (in Sign Writing) and included any notes as to its use or meaning. Later we recorded the data in the SignWriter dictionary on our computer. Separate files were created for each city, each containing all 217 signs. A new score sheet was then produced, incorporating the new variations. A score sheet with all the varieties of signs is located in appendix A. In every location there were many signs that overlapped with signs from other areas, so the elicitation went quickly. Most lists of 217 signs could be comfortably elicited in 45 minutes with the two of us working at the same time, each with half of the list. (Deaf people could show us the signs much faster than we could write them, so we alternated asking and writing the signs.) An investigator may choose to video the wordlists. If the wordlists are collected for the purpose of comparing minute changes in handshape and orientation, a video is preferable. However, for our purposes we found it more advantageous not to film the sessions. Most of our wordlists were elicited in a deaf club (and in one case, in a small café nearby), where video equipment would have been inappropriate. Also, the presence of video equipment tends to make people nervous. Deaf people seemed to be much more willing to help when they found out that we were not going to video them. One drawback of not filming the wordlists is that the transcription needs to be accurate since there is no replay of the video for a closer scrutiny of the signing. We found that by asking for repetitions and clarifications immediately, before moving on to the next sign, we were able to write reasonably accurate transcriptions and also were able to elicit additional acceptable variations of a sign. Perhaps, if the situation permits, the utilization of both methods would be optimal.
4 For more information about SignWriting or the SignWriter software, contact Valerie Sutton at: The Deaf Action Committee, P.O. Box 517, La Jolla, CA 92038-0517, USA. E-mail: [email protected] or http://www.signwriting.org.

12
Wordlist Comparisons The primary reason we collected wordlists throughout Spain was to be able to describe the linguistic differences that exist between deaf communities and to define boundaries of dialect groupings. We compared the wordlists to find out the linguistic similarities between locations. To quantify the results, we affixed a point value to each lexical item we compared. Signs that are exactly the same in two locations are scored with one (1) point. Signs that are completely different are scored with zero (0) points. Signs that are considered similar are scored with one-half (0.5) point. Our comparisons are based on a list of 200 words. If every comparison of signs in both 200-wordlists were exactly the same, the score would be 200 points. We divided the score in half to find the percentage of similarity: 100 percent similarity. We compared the wordlists from all 18 locations with each other. The matrix of similarity is displayed in table 1. Similarity ranged from 96 percent between Madrid and La Coruña, to 58 percent between Barcelona and Santiago.
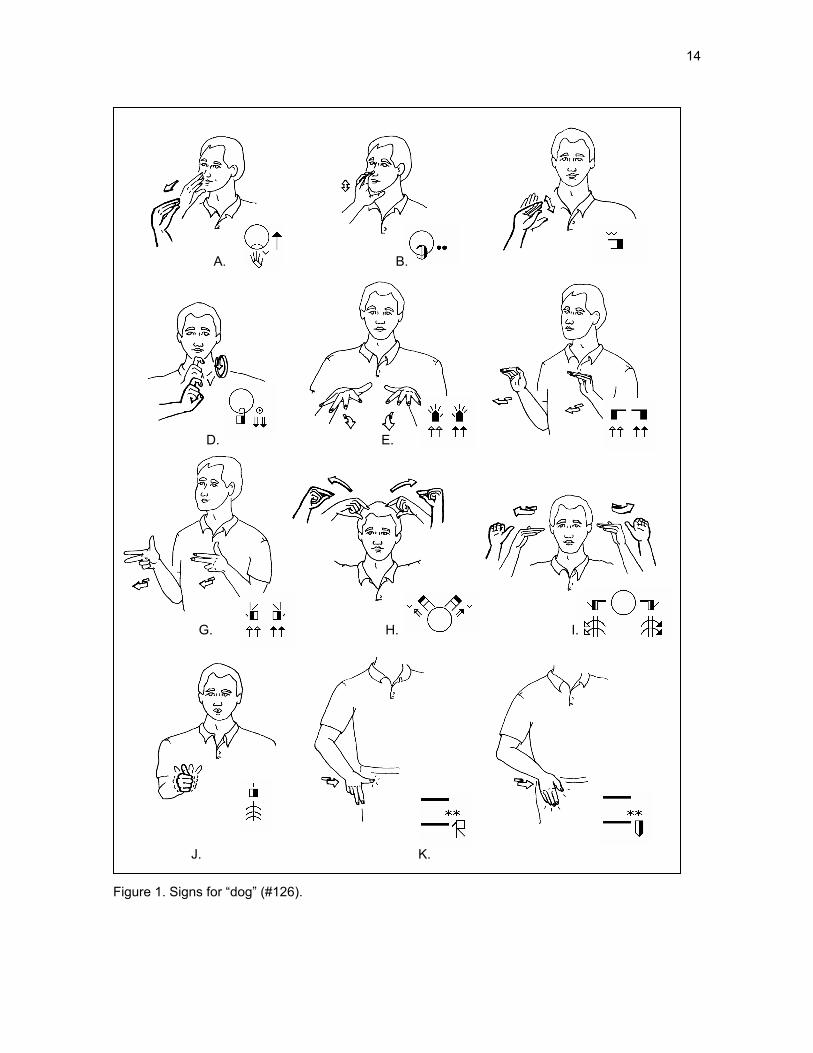
Lexical Differences As we began collecting wordlists from 18 locations around Spain, it became obvious that there are significant lexical differences throughout the deaf communities. We had known, as a result of experiences in the United States and Mexico, that there is almost always some difference in signing vocabulary between distinct regions of a country. Sign languages are dynamic language systems, continually growing and changing.5 Nevertheless, the lexical differences throughout Spain are much greater than anything we had previously experienced. Of the 217 basic words in our list, only 11 are completely unified throughout all 18 locations. Some signs have as many as 18 different variants; see figure 1, which illustrates 12 of the 18 signs for the word “dog” (#126). The signs for “dog” take some typical feature of a dog as the root of the sign, for example, its muzzle, paws, ears, tongue, tail, or the act of calling a dog. These are not descriptions of a particular dog, but rather a symbolizing of the concept of a “dog,” regardless of its breed, whether it be a poodle, a basset hound, a Great Dane, or any other breed.
5 Later, we examine some of the factors that have fomented such great lexical variety in Spain.

13
Tabl
e 1.
Mat
rix o
f lex
ical
sim
ilarit
y.
S.
S.
Bil.
C
or.
Sant
.Vi
go
Ovi
. St
dr.
Valla
.M
ad.
Zar.
Jer.
Cór
d.M
ál.
Gra
. A
lm.
Ten.
Va
l. B
ar.
San
Seba
stiá
n
84
82
71
81
82
80
78
89
72
77
74
72
75
74
84
68
61
Bilb
ao
84
80
72
74
76
80
76
84
72
76
69
71
73
73
78
65
63
La
Cor
uña
82
80
86
91
83
84
86
96
82
83
80
81
81
81
91
76
69
Sant
iago
71
72
86
84
77
77
78
84
71
72
69
74
73
74
81
70
58
Vigo
81
74
91
84
83
85
82
92
77
80
79
78
78
79
90
71
62
Ovi
edo
80
76
83
77
83
82
83
89
78
79
79
76
81
76
88
71
64
Sa
ntan
der
82
80
84
77
85
82
83
90
76
82
77
77
78
77
89
71
67
Va
llado
lid
78
76
86
78
82
83
83
92
77
78
75
78
77
76
88
72
65
M
adrid
89
84
96
84
92
89
90
92
87
87
85
86
87
85
95
79
71
Zara
goza
72
72
82
71
77
78
76
77
87
76
75
75
77
74
81
73
70
Jere
z 77
76
83
72
80
79
82
78
87
76
87
91
88
87
86
73
68
Cór
doba
74
69
80
69
79
79
77
75
85
75
87
83
87
83
83
72
65
Mál
aga
72
71
81
74
78
76
77
78
86
75
91
83
86
86
83
74
65
Gra
nada
75
73
81
73
78
81
78
77
87
77
88
87
86
90
83
72
67
Alm
ería
74
73
81
74
79
76
77
76
85
74
87
83
86
90
81
70
65
Tene
rife
84
78
91
81
90
88
89
88
95
81
86
83
83
83
81
76
62
Va
lenc
ia
68
65
76
70
71
71
71
72
79
73
73
72
74
72
70
76
69
B
arce
lona
61
63
69
58
62
64
67
65
71
70
68
65
65
67
65
62
69
14
Figure 1. Signs for “dog” (#126).
J. K.
G. H. I.
D. E.
A. B.

15
Highly concrete, describable things are relatively easy to symbolize by choosing some feature typical of the object. Some objects, like dogs, have many typical features from which to choose and, therefore, may be signed in many different ways. Other objects, such as “book” (#28), have only a few typical features, e.g., something that is opened (as in figure 2A) or something that has pages (2B) which can be turned (2C), resulting in fewer ways to sign “book.” Figure 2. Signs for “book” (#28). However, even abstract terms show considerable regional differences. The abstract idea “false” (#190) is illustrated in figure 3. Some of the signs for “false” have no other meaning connected to the sign. Others, such as 3D, also represent the related idea of “to tell a lie”: to tell a lie is to tell something that is false. Figure 3 A–C. Signs for “false” (#190)
A. B. C.
A. B. C.

16
Figure 3 D–K. Signs for “false” (#190).
D. E. F.
G. H. I.
J. K.

17
Dialects and Dialect Groupings In nearly every distinct geographic location in Spain where there has been an active deaf community, there is probably a distinct dialect of LSE. Each wordlist we elicited showed considerable difference from other wordlists. Some were taken from cities less than 100 kilometers apart, yet the similarities were only about 85 percent.6 Which dialects are most similar to each other? What dialect groupings exist in Spain? These two questions are intertwined with each other. We assume that the more similar two dialects are, the more likely it is that they are part of the same dialect grouping. Since there are many other factors besides lexical similarity involved in determining dialect groupings, any conclusions at this stage are tentative. However, by mapping out which dialects are more similar to others, dialect groupings begin to take shape. Before discussing the language situation in Spain, let us examine several patterns that often occur when comparing languages. In some places there are several dialects that are similar to each other, yet quite different from others. This is called a dialect cluster. Figure 4 presents an example of four dialects named A, B, C, and D. Dialects A, B, and C are similar to each other, forming a dialect cluster, but all are different from dialect D. A dialect grouping usually consists of one or more dialect clusters. A D A B C
B C Figure 4. Dialect cluster. Figure 5. Dialect chain. A dialect chain can be described as a string of dialects where each dialect is similar to its neighbor, but different from those farther away. For example, in figure 5, A is similar to B, and B is similar to C, but A is not similar to C. There are times when several chains overlap with one dialect that is similar to all the others. This is represented in figure 6. As in a dialect chain, A is similar to E, and E is similar to C, but A is not similar to C. At the same time, D is also similar to E, and E is similar to B, but D is not similar to B. In other words, two chains intersect each other. E is similar to all the others much like a hub is connected to the spokes of a tire. A A D E B D E B C C Figure 6. Intersecting chains Figure 7. Dialect network The dialects at the ends of the chains may also form another chain around the circumference as in figure 7. In this case, A is similar to B, and B is similar to C, but A is different from C. These
6 San Sebastián and Bilbao showed 84 percent similarity, Vigo and Santiago showed 84 percent similarity, and La Coruña and Santiago showed 86 percent similarity.

18
complex interlinkings of chains are called dialect networks. We can see each of these types of networks in the sign language situation in Spain. Many lexical studies use Gudschinsky’s Classical Glottochronology norms (1956) to show distinctions between languages and language families. Glottochronology looks at phonetic and phonological changes over time in order to determine cognates (pairs of words or signs which are historically linked). By assuming a relatively steady rate of change, linguists can determine language family relationships and approximate time frames for when two related languages may have separated. In order to determine these relationships accurately, it is important to eliminate all borrowed words and words that are similar because of coincidence from the wordlist. According to this standard, language varieties that show between 0 percent and 35 percent cognates are considered members of different language families. Cognate percentages between 36 percent and 80 percent are considered members of the same language family, but separate languages. Cognate percentages between 81 percent and 100 percent are considered to be the same language.7 Woodward (1993) used these standards for conducting lexical studies between sign language varieties used throughout India, Pakistan, and Nepal. His comparisons showed between 60 percent and 76 percent cognates, concluding that the sign languages in these three countries are distinct languages, yet part of the same language family. Other lexical studies conducted by Woodward include a study of Costa Rican sign languages (1991), and sign language varieties used in Thailand (1996). Since it is difficult to determine which signs are borrowed or coincidentally similar, many sign language linguists compare wordlists on a basis of similarity—how closely one sign resembles another. Our comparisons in Spain are based on similarity rather than strict cognate criteria. Woll (Kyle and Woll 1985) obtained wordlists from 15 different sign languages and found that the average percentage of similar signs between any two unrelated sign languages was 35 to 40 percent. Other sign languages that are known to be related showed a much higher percentage of similarity: 80 percent between British and Australian Sign Languages (Kyle and Woll 1985); 60 percent between American and French Sign Languages (Woodward 1978). Bickford (1991) found that the nine variations he tested within Mexico ranged from 85 to 100 percent similarity and, therefore, formed part of the same language. Blair suggests that lexical comparisons are not sufficient to make decisions of language distinction when comparisons fall in the range of 60 to 95 percent cognates (1990). He suggests that language variety comparisons with scores that fall in this questionable range, should be tested for intelligibility. Language varieties that have less than 60 percent similarity can be assumed to be unintelligible, and thus, a different language. Scores above 95 percent rarely prove problematic for understanding. Current language assessment criteria adopted by SIL suggests that only lexical scores above 70 percent need to be tested for intelligibility, and that lower scores typically represent a separate language (SIL 1991:44). It is important to note that all these criteria were developed to describe spoken language situations. Until more studies are conducted with sign languages, it is not possible to determine the applicability of these criteria to sign languages. For this study, we assumed the following blending of the criteria listed above. 7 Swadesh (1950) suggests that 85 percent cognates is the minimum required for classifying two dialects as members of the same language.

19
Lexical Similarity 0%–40% = different language family 40%–60% = different language, same language family 60%–70% = likely to be considered a separate language, but intelligibility
testing is necessary 70%–80% = unable to determine if same or different language; intelligibility testing is necessary 80%–95% = same language, different dialect; intelligibility testing is necessary to determine how distinct the dialects are 95%–100% = same or very similar dialects of the same language Each of these levels are viewed to see how they reflect the language and dialect situation throughout Spain.
Above 95 percent Only one comparison showed a score above 95 percent. La Coruña and Madrid scored 96 percent. In La Coruña, there was often more than one way to sign a word. Frequently, at least one sign was the same or similar to a sign used in Madrid; however, many signs coexisted that were typical only to the Galician region. For this reason, we considered the dialects of La Coruña and Madrid to be very similar.8
Above 80 percent By lowering the level of similarity to 80 percent, some significant patterns become visible.
1. There are only two dialect areas that do not show at least 80 percent similarity to any
other cities: Valencia and Barcelona. This means that, at this level, Valencia and Barcelona each form their own distinct dialects.
2. There are three autonomous regions where we gathered multiple wordlists: Andalucía,
Galicia, and País Vasco. Each of these regions forms a complete dialect grouping. This means that each of the five locations in Andalucía has a similarity with each of the others of 80 percent or higher. The same would apply to the three dialects in Galicia and the two dialects in País Vasco.
By arranging the dialects on a graph according to their similarity with other dialects regardless of the geopolitical boundaries several more patterns appear. We will use a graph similar to the sociograms that are commonly used in Social Network Analysis (Scott 1991). See figure 8. Located at the center of the graph are the dialects with the highest number of connections (at 80 percent similarity) with the other dialects. The dialects with fewer numbers of connections are placed farther out on the graph. For clarity, we have drawn the connections between what we call the Madrid Dialect Grouping and the others with thinner lines since they connect with nearly all the other dialects.
8 To check the accuracy of our lexical comparisons, we elicited another wordlist from a second group of Madrid signers. On both occasions, the signers gave multiple signs for many of the Spanish glosses. The two lists showed less than 1 percent variation when compared with each other. This does not mean that the two Madrid lists were identical; only that for each gloss, at least one sign matched one of the signs given in the other list. All the lexical comparisons in this study were conducted using this same method of comparison. Comparison of the second Madrid wordlist with La Coruña resulted in 94 percent similarity.

20
Ref. City Number of # connections 1. Madrid (15) 2. La Coruña (15) 3. Tenerife (12) 4. Vigo (9) 5. Santander (9) 6. Jerez (9) 7. Oviedo (8) 8. Granada (8) 9. San Sebastián (7) 10. Córdoba (7) 11. Málaga (7) 12. Almería (6) 13. Valladolid (6) 14. Bilbao (4) 15. Santiago (4) 16. Zaragoza (2) Madrid (#1 on graph) and La Coruña (#2) connect with all points on the graph. Tenerife (#3) connects with all points except Almería (#12), Bilbao (#14), and Zaragoza (#16). Figure 8. Graph of dialect similarities at 80 percent.
Based on this graph two more patterns emerge.
3. Madrid, La Coruña, and Tenerife form a grouping at the center. Madrid and La Coruña show similarity with all the other groups that are included at this level (recall that Barcelona and Valencia showed no similarity at 80 percent or higher and have, therefore, been excluded from the analysis at this level). Tenerife shows similarity with all groups except Almería, Bilbao and Zaragoza.9 Historically, deaf children from La Coruña and Tenerife attended deaf schools in Madrid. This may explain the similarity in the way these three dialects connect with the others. For reference, we call this grouping of dialects the Madrid Dialect Grouping.
4. Although point 2 (above) states that dialects within a region are similar, we find that the
dialects of Santiago and Bilbao pattern differently from the rest of the dialects in the northern regions. We group together the dialects of Vigo, Oviedo, Santander, San Sebastián, and Valladolid as members of what we call the Northern Dialect Grouping.10 It is interesting to note that there are very old residential schools for the deaf in both Santiago and Bilbao. Until recently, deaf children from other cities in the north typically either attended one of these schools or traveled to Madrid for schooling.
9 Tenerife scored 79 percent with Almería and Zaragoza, and 78 percent with Bilbao. 10 Valladolid connects with all of the other members of this group except San Sebastián (78 percent).

21
Using the Glottochronology norms, there would be three distinct languages at this level. Madrid (or La Coruña ) could be considered the center of one large dialect network connecting the Madrid Dialect Grouping, the Northern Dialect Grouping, Santiago, Bilbao, Andalucia, and Zaragoza, as part of one language. Barcelona and Valencia would each be considered unique sign languages. However, as we see in the following section, intelligibility tests showed that there was significant understanding between dialects that showed less than 80 percent similarity. For this reason, a strict adherence to Glottochronology norms is not advisable.
Above 70 percent Similarity between 70 and 80 percent is considered questionable, making intelligibility testing necessary. However, it is at this level that most linguists make language distinctions between variations of spoken languages. Our data shows several interesting patterns occurring at this level.
1. Barcelona is still isolated from most of the rest of Spain. Only two links are formed with Barcelona at this level: Barcelona with Madrid at 71 percent,11 and 70 percent with Zaragoza.
2. Madrid, Andalucía, Tenerife, Galicia, Oviedo, Santander, Valladolid, and Zaragoza form
one large dialect cluster, which, for the sake of simplicity, we call the Central/Western Dialect Grouping. Each one of these dialects (or dialect groupings) connects to every other dialect or cluster at 70 percent or above (the only exceptions are the links between Córdoba and the two dialects of Bilbao and Santiago, which occur at 69 percent).
3. País Vasco and Valencia form a chain with the larger group. Each connects with almost
all points in the larger group, but they do not connect with each other. Since País Vasco links with the dialects in the Central/Western grouping at a consistently higher level than Valencia does, we consider País Vasco to be part of the Central/Western grouping.
These groupings are represented in figure 9. At 70 percent similarity or higher, there are three distinct groupings: Barcelona, Valencia, and the Central/Western grouping. Of these groupings, only Barcelona has the potential to be considered a separate language since it shows less than 70 percent similarity with nearly all locations. Intelligibility testing is still necessary.
11 The second Madrid test scored 72 percent with Barcelona.

22
Figure 9. Dialect groupings at 70 percent.
Above 60 percent Only one comparison scored below 60 percent. Barcelona and Santiago scored 58 percent. Since Barcelona and Santiago show higher similarity with all other points of comparison, we can say that, according to Blair’s criteria, all of the varieties are part of one language. As previously stated, at the level commonly used for spoken languages, i.e., 70 percent, Barcelona does seem to be a separate language. It is worthwhile to reiterate that all scores between 60 and 80 percent are questionable as to their status as separate languages; further testing is needed to determine that.
Below 40 percent For the sake of comparison, we compared the first 100 words in the list with several European sign languages, as well as two other unrelated sign languages. When comparing French, Italian, and Portuguese sign languages with LSE, each scored between 37 and 39 percent.12 It is difficult to say if these four languages are part of the same language family. Some of the similarity may be due to contact between European countries. Although LSE developed separately from the others, it is possible that there may have been some influence from prominent deaf schools in France and Italy during the early decades of the development of deaf schools in Spain. We also compared LSE with two clearly unrelated sign languages: American Sign Language (ASL) and Mexican Sign language (LSM). The similarity between LSE and ASL is 21 percent and between LSE and LSM is only 18 percent.
Conclusion In this section we have shown that, according to lexical comparisons, virtually all the 18 cities have their own dialect of sign language. Dialects within an autonomous region seem to be more similar to each other than to dialects from other regions, and most of the comparisons showed a need for further testing. However, the lexical comparisons did give us a basis for some hypotheses about dialects and dialect groupings; these hypotheses need to be checked through intelligibility testing. 12 LSE scored 37 percent with Portuguese Sign Language based on 200 words in a multimedia dictionary; 39 percent with French Sign Language based on 95 words from a hearing sign language linguist who has worked among the deaf for many years; 39 percent with Italian Sign Language based on 100 words in a dictionary. All scores are based on the Madrid list.
Valencia
San SebastiánSantander
•• • •
•
•
•••
•••
• ••
••
•Tenerife
La Coruña
Santiago
Vigo
Barcelona
Oviedo Bilbao
ZaragozaValladolid
Madrid
CórdobaGranada
Jerez
Málaga Almería•
•• • • • •
••••
••
• • •••
•

23
At this point, our hypotheses are as follows:
1a. The sign language used in Barcelona (or Cataluña) is, at least, a very different dialect of LSE from the other dialects, or
1b. The sign language used in Barcelona (or Cataluña) is a separate language from the dialects used in the rest of Spain.
2. The dialect in Valencia forms a distinct dialect grouping.
3. Madrid is the central location for a larger dialect grouping that includes Galicia, Oviedo, Santander, País Vasco, Tenerife, Valladolid, Zaragoza, and Andalucía.

24
Recorded Text Tests
Definitions For more than 45 years, linguists have been developing Intelligibility Testing, also known as Recorded Text Tests (RTTs), as a reliable means of determining inherent intelligibility between spoken language varieties. This type of test does not compare words or grammatical structures, but rather asks a deeper question: “How well do people from one language variety understand people from another variety?” Linguists have been studying interdialectical intelligibility since at least 1951 (Voegelin and Harris). In the 1960s, John Crawford and his colleagues at the Summer Institute of Linguistics (SIL) began the process of refining the methodology through numerous surveys among the indigenous peoples of Mexico (Casad 1974). In 1974, Casad, also a linguist with SIL in Mexico, published a guide to dialect intelligibility testing that is still used today as the most complete reference on the methodology. Modifications of the approach have been published in 1990 by Frank Blair and in 1995 by Joseph Grimes. SIL and other linguistic organizations have completed hundreds of dialect studies, covering nearly every corner of the earth. However, until now, RTTs had never been fully tested on sign language. This study continues the process of refining the methodology. One of the primary purposes of this survey project was to determine whether RTTs could be effectively administered in sign languages. This section provides a full description of how the test was carried out in six locations in Spain, followed by a discussion of the results of the tests. We discuss factors that are present in the deaf situation that do not need to be considered in spoken language situations, and how these factors affect the validity of the test results. We also present suggestions for ways the testing procedure could be appropriately adapted and improved in future studies. The concept of intelligibility can be divided into two categories. The first category, inherent intelligibility, also called immediate intelligibility, refers to the degree to which members of one language variety understand members of another variety because of the similarity between the two varieties. This similarity is based on linguistic criteria such as shared vocabulary and grammatical structures. In the previous section, we focused on the lexical similarities and differences between varieties. However, only in extreme cases (scores below 70 percent or above 95 percent lexical similarity) can we adequately estimate, by looking at linguistic similarities, how well people from one variety will understand people from another. RTTs give us a more accurate means by which to evaluate inherent intelligibility.13 The second category, acquired intelligibility, refers to the degree to which speakers of one variety understand speakers of another variety because of previous exposure to the second variety. For deaf people, this exposure can be a result of contact with people from other regions, media exposure (videos produced in one region and distributed in other parts of the country), etc. Two ways that acquired intelligibility are commonly exhibited in the deaf world are through bilingualism and passive bilingualism. Bilingualism (also called active bilingualism) typically refers to the ability to understand and use two languages with fluency. In this paper, we extend the meaning of bilingualism to include bidialectalism: the ability to understand and use two dialects with fluency. 13 RTTs do not directly measure inherent intelligibility, but rather comprehension: how much of the language a sample population understands. By controlling the variables that may affect the test scores, we can make inferences about inherent intelligibility.
25
Passive bilingualism is the ability to understand another language without the ability to express oneself fluently in that language. (Again, we broaden the scope of the term passive bilingualism to include passive bidialectalism.) This can be seen in the following example. The Andalucían Deaf Federation in Granada (southern Spain) produces a weekly TV program which is broadcast in the southern part of the country. Deaf people in other regions who watch videos of the broadcast are exposed to and may learn to recognize some of the dialectical differences from Granada. However, even though they may understand the other dialect, they will not likely be able to express themselves fluently in the dialect without also having had personal contact with people from Granada. This section examines RTTs as a means of determining inherent intelligibility between related varieties of sign language in Spain. Although we attempted to limit the effects of acquired intelligibility by eliminating the known cases of bilingualism, passive bilingualism is still evident in some of the test scores. Later we discuss the effect that this has on the validity of both the scores and the methodology.
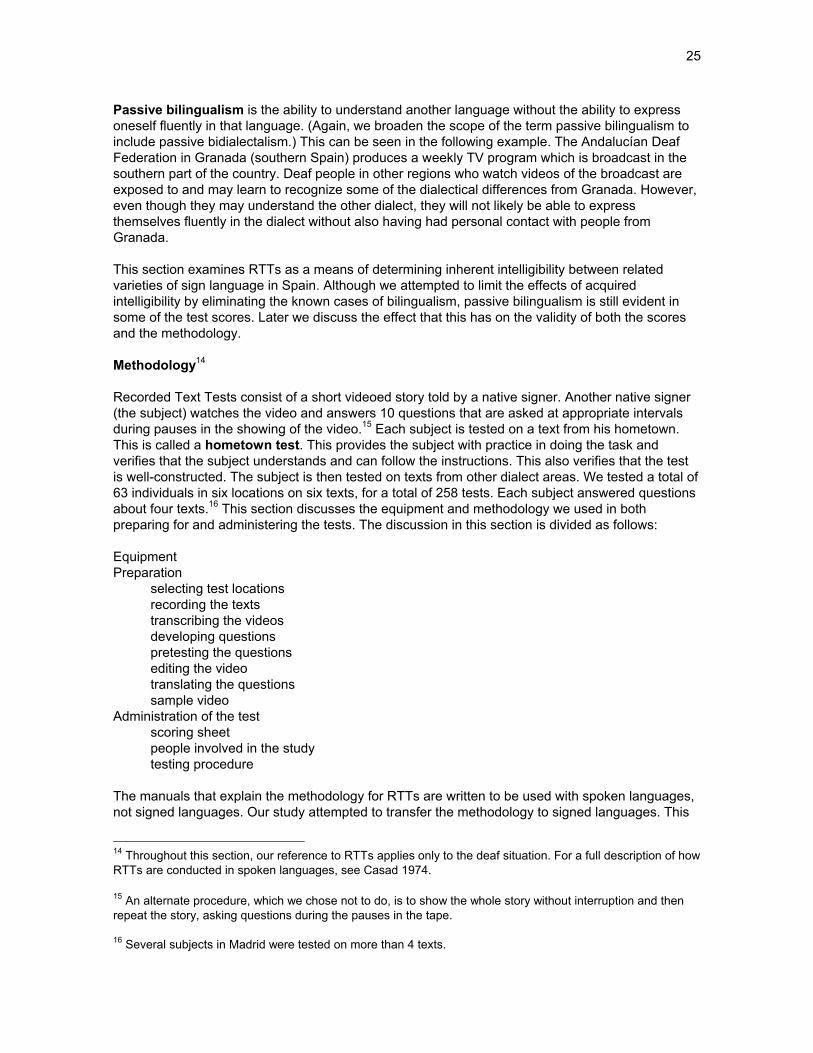
Methodology14 Recorded Text Tests consist of a short videoed story told by a native signer. Another native signer (the subject) watches the video and answers 10 questions that are asked at appropriate intervals during pauses in the showing of the video.15 Each subject is tested on a text from his hometown. This is called a hometown test. This provides the subject with practice in doing the task and verifies that the subject understands and can follow the instructions. This also verifies that the test is well-constructed. The subject is then tested on texts from other dialect areas. We tested a total of 63 individuals in six locations on six texts, for a total of 258 tests. Each subject answered questions about four texts.16 This section discusses the equipment and methodology we used in both preparing for and administering the tests. The discussion in this section is divided as follows: Equipment Preparation selecting test locations recording the texts transcribing the videos developing questions pretesting the questions editing the video translating the questions sample video Administration of the test scoring sheet people involved in the study testing procedure The manuals that explain the methodology for RTTs are written to be used with spoken languages, not signed languages. Our study attempted to transfer the methodology to signed languages. This
14 Throughout this section, our reference to RTTs applies only to the deaf situation. For a full description of how RTTs are conducted in spoken languages, see Casad 1974. 15 An alternate procedure, which we chose not to do, is to show the whole story without interruption and then repeat the story, asking questions during the pauses in the tape. 16 Several subjects in Madrid were tested on more than 4 texts.

26
paper does not delineate every instance in which the technology or the methodology differed as a result of the reception mode (visual vs. aural) of the languages tested, but it does outline the rationale for other deviations from the norm. In addition, most sections include a brief critique of the methods used, in the hopes that future tests can be made more effective.
Equipment For filming the texts, we used a compact 8mm camcorder mounted on a tripod. The camera could be operated by battery or electricity. For playback, editing, and testing, we used a portable unit that included a 5-inch color TV and 8mm video recorder with editing capacity. The TV/VCR unit weighed approximately 12 lbs. and could be carried easily in a camera equipment bag. We purposely chose to use small portable equipment to record and playback the tests. This allowed us the freedom to move about town easily on public transportation and to record texts and conduct the tests in places where professional equipment would have been cumbersome or inappropriate. Although people commented on the size of the television screen, all agreed that the signing was clearly visible and adequate for one-on-one testing situations. The quality of the 8mm recording was also sufficient for our purpose.
Preparation Selecting test locations. Before we started to record the texts, our first task was to choose the most crucial locations to test. During our first 10 months in Spain, we spent most of our time in Madrid learning the sign language. In the process of language learning, we asked people we met about the language variety throughout the country. Many deaf people told us that most regions use signs unique to their region. Those in Madrid consistently mentioned the difficulty they had in understanding deaf people from Cataluña. Others mentioned significant differences in Valencia and País Vasco. As a result of this information and other factors, we decided that Madrid, Cataluña, Valencia, and País Vasco were areas that definitely needed to be tested. By looking at the distribution of deaf associations and regional federations, we also included Galicia and Andalucía in the list of test sites. (See map in figure 9.)
Figure 9. Map of test sites.
•• ••
•
•
•
•
Cantabria País Vasco
Asturias
La Rioja
Castilla - León
GaliciaCataluña
Navarra
AragónMadrid
ExtremaduraCastilla - La Mancha
ValenciaIslas Baleares
AndalucíaMurcia
Islas CanariasGranada
Valencia
Vitoria
Madrid
BilbaoLa Coruña
Sant iago
Barcelona

27
The next issue was to narrow the test location to one city within the region. Since we hoped to work closely with the regional federations, we initially chose the cities where each federation was located. In Madrid, Cataluña, Valencia, and Galicia, the deaf federations are located in the largest city of the region (and therefore, most likely, the largest deaf community in each region as well). In Andalucía, the deaf community is fairly evenly spread throughout each of the major cities. Since Granada is the administrative center of the deaf community and the producer of a weekly television program in sign language, we chose to video in Granada and collect wordlists from as many as possible of the other Andalucían cities. In Galicia, we made our first contact with the regional federation in La Coruña. After talking with deaf people there, we found out that there has been a deaf school in Santiago de Compostela for quite a few years longer than in the other cities in the region, and that the sign language there is considered fairly different from that of the rest of Spain. Most of the older generation in Galicia attended the school in Santiago. The wordlists we collected from the region verified that Santiago was the most different of the three Galician cities we tested. As a result, we chose a story signed by a man who attended the Santiago school instead of the La Coruña school. A similar situation occurred in País Vasco. Although the federation was located in Vitoria, we chose a video from Bilbao, where there has been a longer history of deaf schools and deaf associations. As we designed this survey and tried to decide how many locations to test, we needed to take into account our budget and time frame. We could not afford to conduct tests in every location where there was a deaf community. Therefore, we limited our choices to include the most crucial sites, as well as to cover as much as possible of the country: Madrid, Cataluña, Valencia, País Vasco, Galicia, and Andalucía. Critique. We found it very helpful to have spent 10 months learning the language before we started the survey. Later, as we traveled and interviewed members of the deaf community and the leaders of the associations and federations, we were able to communicate in their language without the need of an interpreter. This broke down the barrier of distance that one often feels when working through an interpreter. Not only were we able to receive helpful information about the deaf world, but we were also able to develop personal relationships with members of the deaf community. Our choice of test locations covered six of the strongest deaf communities, as well as the majority of the most notably different sign language systems. Since the conclusion of the survey, we have found information about a variety of sign language in Gerona, Cataluña. It is said to be significantly different from the other communities in Spain.17 Other regions that were not included in this study, either through wordlists, intelligibility tests, or personal observations, include the regions of Extremadura, Murcia, and the Balearic Islands. Recording the texts. Our goal in recording the texts was to collect short samples of natural signing. To do this, we asked deaf leaders to find three or four deaf individuals who grew up and attended deaf schools in the target area, and who are fluent signers, so that we could film them.
17 “In Gerona, we can say that we have la Lengua de Signos Massana, because the majority of our members use this language that they learned outside of the classroom (during recess time, on excursions…) during their studies at the Massana School. Although it is a degradation of what may have been at one time the pure sign language, it has no relation to the Lengua de Signos Catalana that is used today…” (Federació de Sords de Catalunya 1996).

28
The signers sat in a circle (see figure 10). The camera was focused on one chair where the “storyteller” was to sit. Each deaf person took a turn in the storyteller’s chair and told a story to the others in the circle. When one person finished, he switched places with the next person. This allowed us to keep the camera focused on one location so we did not have to move the camera every time a different signer told a story. We (as hearing observers) sat outside the circle so that we would not be the focus of the signer’s attention. We occasionally checked the camera between stories to make sure that the signer was still centered in the camera screen. Otherwise, we ignored the camera. The signers were asked to sign to the others in the circle, not to the camera. By ignoring the camera, we hoped to lessen the nervousness that signers often feel when signing for a camera. But more importantly, by signing to the other people in the circle rather than the to the camera, their signing reflected the natural way that they sign to deaf people from their area.
Figure 10. Video arrangement. Whenever possible, we asked for two men and two women signers who represented a wide range of ages. The rationale for this request is that we had been told that in many deaf communities here, men and women sign somewhat differently, and young people sign differently from their elders. When men are together, they may sign one way, and they may sign differently when women are also present. Youth modify their signing when people from other generations are present. Since we wanted to show these videos to men and women of all ages, we wanted the storytellers to sign to (and feel they were communicating with) a diverse group. We asked the signers to tell a short story (two to four minutes) about something that happened to them personally, something that the others in the circle might or might not already know. To help them get started, one of us would sit in the storyteller’s chair, explain the process, and then tell a story similar in length and content to what we hoped to record. After telling the story, we mentioned several other ideas for stories. As soon as someone felt that he had a good story to tell, we invited that person to sit in the storyteller’s chair and begin. Grimes (1995) gives a description of the types of stories that should be used for this type of study, as well as types of stories that may not be appropriate.

29
The most useful test texts are personal narratives two to five minutes long—something the speaker was actually involved in. Stories everybody knows, such as folktales or traditional stories, are useless because understanding only one or two words can tip off everything. Explanations and arguments may rely on assumptions that people in other communities cannot relate to; in practice, they have proved hard to collect in a survey setting anyway. Translations from another language…are hard to calibrate because the translation itself may be stilted, and some subjects may be able to guess the content from hearing a few key words; therefore, natural local texts are preferred (p. 18).
We did not list all of the above restrictions to the group of storytellers, but we did ask them not to tell jokes, “personal histories” (i.e., where they lived, where they went to school, and where they worked) or well-known historical events. In each location, we filmed texts for approximately 30 minutes, usually 10 or 12 short stories. We stopped when everyone ran out of stories to tell. We chose one story from each location, the one that we deemed the “best” one from that city. The actual criteria for “best” differed from place to place. (Note: In this study, whenever possible, we refer to the test sites by name. However, to protect the identity of the people who graciously volunteered for this study, we have sometimes found it necessary to use a code to refer to locations or people.) In location A, we filmed two women and a man. One woman was wearing a tan-colored sweater, and her hands were not contrastive enough against that background, so that eliminated her stories. Some of the man’s stories were too long. Other stories relied heavily on mimed sections. Since the miming would probably be understood anywhere, we tried to choose stories that used more signs and less mime. The second woman told several usable stories. From those stories, we chose one that was both interesting for people to watch and long enough to ask 10 or more questions. In location B, we recorded stories from five men who happened to be in the deaf association when we were filming. Two of them grew up in cities outside of the region, so we eliminated their stories since they would not be representative of signing in B. Two of the remaining three people told personal histories. We tried to suggest story ideas, but they couldn’t think of any personal experiences to tell that we could use for testing. The fifth man provided two very usable stories; we chose the longer of the two. In location C, the federation arranged for us to video four people, two men and two women, a man and a woman ages 20 to 25, and a man and a woman between 40 and 50. They all told good stories. One of the women consistently told very short stories, and the other woman was wearing a patterned sweater that made it difficult to see her hands. We chose the best of the remaining stories. In location D, we filmed four employees in the federation, two men and two women, all of whom were approximately the same age. After we filmed them, we found out that two of them had grown up in other cities. One of the other two told a couple of jokes, and we felt the jokes might be familiar to the deaf community. We used the longer of the other person’s stories. In location E, we filmed two men in their 20s and a woman in her 20s and another in her 30s. All either worked at the federation or attended classes there. One person’s stories were not used because he had grown up orally, learning sign language after age 14. One person was wearing a dark shirt, and the contrast between the dark shirt and the white wall made it difficult to see the signs clearly. (This situation could have been corrected by using the backlighting feature on the camcorder, but wasn’t.) We chose the best of the other stories.

30
In location F, we filmed five men. As in location B, one person only told personal histories. The others told usable stories, and one story in particular stood out as very clear and interesting, so we chose it for the test. Critique. Since RTTs in spoken languages are conducted with audio cassette recordings, we did not have a set of pretested guidelines for obtaining optimal video recordings, but we have developed a few suggestions. The filming does not need to be done professionally, but a few details should be monitored closely to help minimize or eliminate the number of unusable stories. The storytellers should be filmed in a location where they will probably not be interrupted, since people entering and exiting the room can cause distractions that will result in unnatural pauses or eye gazes. A blank wall or curtain behind the signers is best, and there should be good contrast between the color of the wall and the color of their clothing. When the contrast between clothing and wall is either too great or too small, it is difficult to see the signers’ hands. If the background is too bright, it may be possible to adjust the camera using the backlighting setting to minimize the effect of the background. It is helpful to film a short test segment, then check the quality before continuing with the filming. The clothing the signer is wearing is important. We discarded several good stories because the signer’s clothes were distracting or not contrastive enough. We are not suggesting that signers be requested or required to wear certain colors or non-patterned clothing; just that people should be aware of this for the filming process. Clothing with “busy” patterns should be avoided, as well as colors that do not give enough contrast between the colors of hands and shirt. Although it does not seem to be entirely necessary to film signers of various ages and both sexes together, we felt that the stories were a little better when we did so. Transcribing the video. After filming the stories and choosing the most appropriate one, we transcribed the text (to the best of our ability), using a combination of glosses and SignWriting. We used glosses for the signs we knew, and we wrote out the ambiguous sections in SignWriting. We then showed the video to one or more native signers (either deaf or hearing with deaf parents). We were able to check the portions we understood, as well as gloss the sections we did not understand. When the person needed to see a section several times before interpreting it for us, we marked that part as unclear, in order to remind ourselves not to ask test questions about it. We then wrote out a free translation of the story in English and used that to write questions about the story. If there was still a section that we found difficult to translate, we did not ask questions about it. Developing questions. To develop a set of questions for the test, we looked at the translation and wrote down as many questions as possible that could be answered directly in the text. These are some of the general guidelines that we followed:
• The answer to every question should be clearly signed in the story. • Questions such as “Why do you think he did that?” should not be asked because the
answer is based on the subject’s reasoning ability, rather than on his understanding of the text.

31
• Most answers should consist of one or two signs. (Some questions may require more than a brief answer, but these are harder to score since there is a greater possibility of only a portion of the answer being right.)
• The questions should cover as wide a range of categories as possible. There should be
no more than two questions per topic (for example, numbers, kinship terms, animals, household objects, etc.).
• There should be a wide variety of grammatical and semantic categories; these can
include subject, object, recipient, description of a condition, description of a person, time, purpose, explanation, cause, result, quote, quantity, location, manner, etc.
• Since miming is a part of signing, we tried to include at least one question based on a
mimed section of the text. However, most of the questions should be based on signed sections.
• Yes/No questions should not be asked since there is a 50 percent chance of guessing
the correct answer.
• Questions that could be reasoned out should not be asked. For example, in one story, the signer tells that the stoplight turned green, so they crossed the street. A question such as, “What color did the light turn?” or “What did they do when the light turned green?” could be guessed too easily.
Questions should be asked at the first reference to new information.
After both of us wrote lists of 18 or 20 questions, we compared the questions, made a master list, and noted which questions were identical, which covered the same material in different ways, and which were different. We then determined if the same topic was questioned more than once. If so, we referred to the video to see which was signed more clearly and listed it as a possible question. If questions were asked about ambiguous sections, these were omitted. We viewed each video, noted where natural semantic breaks occurred, and attempted to ask only one question per section. We found that the texts needed to be two to three minutes in length to find ten good semantic breaks that contained new information in each section. We also took into consideration the ease of asking a question or requesting an explanation. For example, “How long was the section of river?” was easier to ask than, “Describe the 9-kilometer section of river.” The question can be asked by signing something like, “The river, how long is it?”; the latter description comes out something like, “The river has a part which is 9km long; how is it? Describe it.” Making the question as simple as possible cuts down on the chance that the question will be misunderstood. Pretesting the questions. Standard testing procedure suggests pretesting the questions with eight to ten people from the area where the story was recorded, i.e., the hometown. In spoken language situations, native speakers should be able to score between 90 and 100 percent on their hometown test. Questions on the pretest that receive more than one wrong answer among the eight to ten people (90 percent) are usually discarded as invalid questions and are not used in later testing in the hometown or in other locations. In this area, we deviated from the standard practice. We did not conduct a standard pretest of the questions before we started testing, although we did check each question and answer with a native

32
speaker to be sure we were asking the question correctly and would recognize the answer when we saw it. Two of the 60 questions used in the testing procedure proved to be poor choices because almost every signer (people with widely varying levels of language ability) answered them incorrectly, whether the signer was being tested on his hometown test or on that of another region. These two questions were eliminated from all calculations. The other questions seemed to be missed more frequently on the hometown tests than is typical for tests of spoken languages. Only 60 percent (35 of 58) of the questions on the hometown tests were answered correctly at least 90 percent of the time. Using the criteria mentioned above, this would mean that the remaining 23 questions should have been omitted from the study. Later we discuss more fully the effects of language ability on the test results. At this point, we simply mention that certain events may occur, with the result that some deaf adults never reach a high level of ability in the use and comprehension of their dominant language. This is called semi-lingualism and is rarely (if ever) found in spoken language situations (unless unusual factors are involved). At any rate, we did not feel it was fair to eliminate all the questions that were missed on the hometown test and risk creating a test that shows a higher rate of intelligibility between dialects than is accurate for the situation. We suggest that the questions be pretested by a group of 5 to 10 people who are known to have a high level of language ability. Questions that cannot be consistently answered correctly should be discarded in favor of questions that can be answered correctly at least 80 percent of the time. This will give a basis by which to evaluate the degree to which language ability is affecting the scores. Later, those who take the hometown test and score significantly lower than the group in the pretest can be considered to be affected by factors such as language ability. This is discussed more completely later. Editing the video. Using basic video and playback equipment, the editing of the video is a simple and quick process. These are the steps we followed:
• After selecting the questions, we viewed the video and noted the best places to stop for questions. We tried to choose natural breaks, as close as possible to the point where the answer is stated in the story. We wrote down the signs leading up to each question location. Then we connected the camcorder and VCR so that the VCR could play back the original video while the camcorder recorded a copy. We inserted the original tape into the VCR, and a blank tape into the camcorder. Either piece of equipment can be used to record or play back; the set-up that gives the better copy quality and cleaner cut-off is preferable.
• We recorded five to ten seconds of blank space at the beginning of the copy tape and set
the original at the beginning of the story on PLAY and PAUSE and thus, were ready to start. We started the copy tape (in the camcorder), waited a few seconds, and then started playing back the original (by releasing the PAUSE on the VCR).
• When the tape came to a place where we wanted to insert a question, we pressed the
PAUSE button on the VCR and let the camcorder continue recording. After three seconds, we released the PAUSE button and let the tape continue, repeating this step at the next desired pause. This creates a three-second freeze-frame of the signer at the place where a question needs to be asked. We had to be careful not to freeze a frame in which the signer was actually giving the answer to the question, since that frame would be on the screen the whole time the question was being asked and answered.
The copy tape with the recorded pauses is used for conducting the tests. The three-second pauses allow enough time for the tester to pause the video and ask the appropriate question. Since the

33
tester has paused the image on the screen, he can then take as much time as necessary to ask the question and record the answer. When the question has been answered and the subject is again looking at the screen, the tester can release the pause button; in a second or two, the tape resumes its signing. Critique. For spoken languages, the questions are typically recorded in the dialect of each area where the tests are administered. The questions are then spliced into an audio recording. A separate set of cassette tapes is produced for each test location (Casad 1974, pp. 20–22). We decided against the multiple-copy method for three reasons. First, editing videos in this way requires a lot of time and special editing equipment that is not standard on most portable camcorders and VCRs. By simply inserting pauses into the video, the test video can be edited in 10 to 20 minutes, with a very basic technical setup. Second, we found that the subjects needed a second or two to focus on the image on the screen before they were ready to concentrate on receiving new information from that image. Using basic equipment, it is difficult to stop the story tape, insert information recorded on the question tape, and return to the exact spot where the story tape left off. The frequent changing of the image on the screen seemed more problematic than beneficial. By recording a pause and leaving the paused image on the screen during the entire questioning process, we were able to limit the possible interference caused by a constantly changing image. By utilizing the pause button, we were able to stop the video where we wanted and resume the video without overlapping or losing information. Third, by letting the tester ask the question directly rather than having the image on the video ask the question, the tester could clear up any misunderstanding about the actual questions. This also meant that we did not need to reedit the video in each new testing location. By personally asking the questions, we introduced some possible skewing of the results. How the questions were asked varied slightly each time we administered the tests. However, by having the questions written out and checked beforehand, we were able to keep the variation to a minimum. Therefore, we feel that the advantages of personally asking the questions outweighed the disadvantages. Translating the questions. Once the pauses had been inserted into the video, we translated the questions into the local dialect. We worked with native signers to discover the best way to sign the questions. We wrote down the signs in a mixture of SignWriting (to remind us of unfamiliar signs or expressions) and glossing (to remind us of the correct word order). We also wrote down all the possible ways to express the answer to each question. For example, the answer to one question was “dogs.” We then wrote down all the possible signs for “dog” that might be used in that location. We also wrote notes about similar signs that might be confused or misunderstood. For example, the sign used for “dog” in the Cataluña video is similar to the sign for “duck” in Madrid. Sample video. In each location, we recorded a short sample video to be used to demonstrate to the subjects how the tests are administered. In five of the six locations, we used a short story written in Spanish. The story was very short (one or two minutes), but covered the kind of information that appeared in the test tapes. A native signer from each location was asked to retell the same story in his own words. Several signers gave very creative renditions of the story, while others followed the story line almost exactly. In each case, we were able to ask four or five questions similar to the questions asked on the tests. Although translated stories are not generally acceptable for the test tapes, they worked well enough for sample videos. In the sixth location, we were able to use one of the stories we had recorded earlier. The story was short and signed slowly

34
and clearly, and we were able to ask questions comparable to those asked about the other sample videos. In the other five locations, we did not have previously recorded stories that were appropriate in length and content to be used as sample videos.
Administering the Test Scoring sheet. We used a simple scoring sheet to record each subject’s answers to questions (figure 11). On the scoring sheets for each subject, we listed a reference number and the city where the test was being conducted. For the sake of confidentiality, we did not record the subjects’ names. We wrote the person’s age, sex, history of where he had lived, school history, and relationship(s) to deaf family members (if any) on page one of the scoring sheet. The scoring sheets are divided into four sections of ten lines each, numbered to correspond to the questions (1–10). Each number is followed by three small boxes and a blank line. The three boxes are not labeled so that the subject would not know if we marked an answer right or wrong. If the subject answered a question correctly, we marked the first box; if he gave a partially correct answer, we marked the second box; if he gave an incorrect answer, we marked the third box. On the blank line, we wrote in the actual answer the person gave. At the end of each section on the scoring sheet are five blank lines which can be used to record comments from the subject and the tester’s or writer’s observations. For example, comments such as, “Wow, he really signs fast!” or “I went to school with that person” should be written down. Also, observations about how the person is doing on the test can be written in this section. Some of our comments were as follows: “Concentrating hard on this one”; “No problem understanding and is enjoying the story”; “Seemed to have difficulty focusing on the screen with his bifocals.”

35
Dialect Intelligibility Tests Number __________ Age ______ Lives in ___________________________ City______________ M/F _____ Other places _______________________ School ____________________________ Family ____________________________ 1. _____________________________________________________ 2. _____________________________________________________ 3. _____________________________________________________ 4. _____________________________________________________ 5. _____________________________________________________ 6. _____________________________________________________ 7. _____________________________________________________ 8. _____________________________________________________ 9. _____________________________________________________ 10. _____________________________________________________ ________________________________________________________________________________________________________________________________________________________________________________________________________________________________________________________________________________________________________________________________________________________________________________________________________________________________________________________________________________________________ Figure 11. Scoring sheet for RTTs. Critique. In the first test location, we did not write down all answers (only the incorrect or partially correct ones), but later we decided it would be helpful to write all answers. Besides the fact that it is helpful to know what people actually say when they answer the questions (even correctly), we felt it helped the subjects. Most of the subjects knew (to a certain degree) whether or not they understood the passage. They noticed if we wrote only when they thought they’d answered the question incorrectly, which seemed to affect (negatively) their confidence in their own abilities. When we started writing all the answers, they didn’t worry as much about what we were writing. As we analyzed the test results, we realized that factors other than those questioned on the scoring sheet, e.g., language ability and passive bilingualism, were affecting the scores. Since we knew only a small amount of the subjects’ personal histories, we were not able to determine which of these factors may have affected their scores. The following questions would have added helpful information about each subject.
• When did you become deaf? • When did you first begin to learn sign language? • Was sign language used in your schools?

36
• Did you live at the school or commute?18 • When did you become involved in the deaf associations? • How often do you typically attend the association? • Have you always attended regularly? • How often have you met people from X region?
Who was involved in the study? The testing crew. There are several tasks that must be performed during the tests. Someone needs to start and stop the VCR, ask questions, and write the answers (and comments and observations). For clarification, we use the following terms to distinguish who did what during the tests: the “tester” is the person who asks the questions, the “writer” is the person who writes the answers to the questions, and the “subject” is the deaf person watching the video. Given the nature of sign language (the need to use the hands to communicate), it is rather difficult for one person to coordinate the remote control device, use a scoring sheet and a pen, and figure out what to do with them while signing the questions, so we felt that two people were necessary in the testing process. It helps if both tester and writer are familiar with the dialect, although we found that our knowledge of sign language was adequate. If a native signer is available, it is helpful to have him ask the questions or write the answers. In this study, we filled both tester and writer roles. One of us started and stopped the VCR, as well as asked the questions, and the other wrote down the answers, comments, and observations. Subjects. Our goal was to test a cross section of the community, with equal numbers of men and women, a good age range, etc. In most cases, we conducted the tests in deaf associations, so our selection was limited to the people who were actually present at the time of the test. In each location, someone in the association helped us choose people to test. We asked to test people who had grown up and lived all their lives in that city. By choosing people who had never lived in other regions, we were hoping to avoid testing the bilingual people. Passive bilingualism, which can come from repeated contact with another region, was harder to predict and avoid. We found that most deaf people who were active in their association had had contact with signers from other regions. The general questions we asked while noting personal information on the scoring sheets did not specifically inquire about such contact, so we were not able to determine what effect passive bilingualism had on the scores. Another of our requirements was that the subjects must have attended deaf schools in that location. We assumed that most children who attend a deaf school begin to learn sign language at an early age. This was not always the case. Some who attended such a deaf school did not begin until age 12 or later. The most important time for a child to learn a language is between the ages of two and six (Lewandowski 1992). Some children who do not learn any language until after those early formative years may never reach the same level of ability to use and understand language as children who learn language during those early years. Knowing when a person became deaf and when he began learning sign language could have helped to signal people with potentially low language ability. (Language ability is discussed in more detail later.) In several cases, we specifically asked those assisting us to choose people who were known as good signers. While this limited the effect of low language ability in the subjects, it also seemed to increase the chance that the subject had had more contact with people from outside the local deaf community.
18 In many deaf schools in Spain, sign language is not allowed in the classroom, even though the language thrived in the school dorms. Typically, those who commuted received less exposure to the language than those who lived in the dorms.

37
Testing procedure. When each subject came into the room, we explained what we were doing and why, covering basic information such as who we were and our purpose in being there (i.e., hearing Americans, studying the sign language in Spain, comparing it with other sign languages around the country for similarities and differences). We also gave an explanation of the testing procedure. We told each subject that the first story would be a short video from his own city, just for practice. It would be followed by another story (a little bit longer), also from his city, and then several other videos from other cities in Spain. If we felt the subject understood the process, we started the practice tape. During the practice tape, we did not write down any answers on the scoring sheet. We repeated sections of the practice video as many times as necessary, to make sure that the subject understood the process. One problem that occurred often is that subjects wanted to retell the whole section of the video they had just seen. When the section of the video is only several sentences, it is easy to repeat those lines. However, in the longer stories they would forget the last part of the information that contained the answer to the question. During the practice video, we tried to make it clear that we wanted them to wait until we asked a question and then to answer only the question, not to retell the section. Once we felt the subject was accustomed to both the process and the equipment, we began the actual test, using the text from his own city first, assuming that it would be the easiest tape to understand. Because the videos varied in difficulty, the hometown test was not always the easiest tape. Nevertheless, people felt more comfortable knowing that the first text was from their own city. After the practice tape, all answers were written on the scoring sheet. We discouraged repeating a section unless there was a good reason (if, for example, someone walked into the room and distracted the subject). If we repeated a section of the video for a subject, we noted that on the scoring sheet, along with their first and second answers and their comments. After the hometown test, we tested three other tapes. We rotated the order of the tapes so that different tapes were in the last position. The actual order of the tapes was sometimes based on how well the subject was scoring on the first tape, especially when the hometown tape was a difficult one. If it seemed he was getting discouraged after the first tape, we tried to show an easier one in the second slot so he wouldn’t want to give up. In the five peripheral locations (Galicia, País Vasco, Cataluña, Valencia, and Andalucía), we tested the hometown tape and the three closest locations. For example, in Cataluña we tested Cataluña, País Vasco, Madrid, and Valencia texts; while in Valencia we tested Valencia, Cataluña, Madrid, and Andalucía texts. Since Madrid is centrally located, we tested all locations with the Madrid text. Likewise, in Madrid we tested the texts from all of the five other locations. Each tape was labeled with a single letter code so that the subjects would not know which dialect they were seeing. After the test, we told each person where the videos came from. Testing four tapes usually took 30 to 45 minutes. We noticed that some people began to tire after about 30 minutes. We used a similar arrangement in all six locations. In the first location, we put the TV on a table; the subject sat to the left of the center of the screen; the tester sat to the right of the center; the writer sat just behind and between them (figure 12).

38
Figure 12 First testing arrangement. Whenever possible, we arranged the seating so that the door was behind the subject. Then, if someone opened the door and looked in, it would not disturb him. If the door was directly behind his chair, we took special care not to let him sit so close to the door that the opening door might bump his chair. Partway through the testing in the second location, we had to move the equipment to a different office. There was no room for the writer to sit behind the other two people, so we moved the writer to the right of the tester (figure 13). That arrangement made it easier to see the answers (and any questions) that the subject signed, as well as the tester’s questions across the signing space of the tester, without the ping-pong effect that comes when sitting between two signers. The biggest drawback to this arrangement was that the writer was unable to see much of the videos because of the angle of the TV. Advantages outweighed the disadvantages, so we continued using this arrangement in the other locations.
Figure 13 Second testing arrangement. Critique: Some people did not seem to understand the testing procedure. They insisted on trying to explain the whole story as soon as the tape paused, not waiting to watch the questions we were trying to ask. By the time they got to the place where the answer to the question had been signed, they had forgotten it. In most cases, it lowered the comprehension scores somewhat. This form of testing does not take into account the person’s ability to tell other things about one particular section when he could not answer the actual question asked.
tester
writer
subject
writer
tester
TV
subject
TV

39
A very few people could not understand the testing process. They nodded and answered “Yes” to every question, but they could not answer the questions. This may have been caused by the tester, his inability to communicate the questions well, but nonetheless, we did not feel it was fair to include these tests as representative of deaf people’s comprehension of videoed signing from their own and other cities. This affected three of the 66 subjects. Their tests were not included in the data. A few people commented on the size of the TV and said that it would have been better to watch these videos on a larger screen. A few people wanted to talk while the videos were playing, making comments about something they’d just seen, etc. We tried to discourage it since they invariably looked away from the TV when they were talking, thereby missing parts of the information that they would later be tested on. When this occurred, we often needed to repeat the passage of video.
Conclusion We found that it is possible to administer Recorded Text Tests effectively in a sign language situation. We obtained good results using basic, compact equipment; very little technical expertise was needed. There are some methodological differences due to the form of the language, visual vs. aural, but the principles are the same. As can be seen in the remainder of this section, the test results appear to provide an insightful description of the language situation.
Test Results In this section we examine the test scores and what they tell us about the sign language situation in Spain. We examine passive bilingualism, language ability, and other factors that affect the validity of the testing procedure. We also present some suggestions as to how RTTs can be made more effective for future sign language surveys.
Scoring the tests There were 10 questions for each test tape.19 Each answer was awarded a point value: 10 points for a correct answer, 5 points for a partially correct answer, and 0 points for an incorrect answer. A perfect score would result in 100 points, or 100 percent. In each location, we attempted to test 10 people on each tape. The average (mean) and standard deviation are calculated for the scores for each tape in each location. The scores in this study are represented in table 2.20
19 The Madrid and Galicia test scores were based on 9 questions because one question in each location was considered invalid, and therefore discarded. 20 The tests in País Vasco were conducted in Vitoria, although most of the subjects attended the deaf school in Bilbao. The tests in Galicia were conducted in La Coruña, although most of the subjects attended the deaf school in Santiago de Compostela. The other tests were conducted in Madrid, Valencia, Granada (Andalucía), and Barcelona (Cataluña), with subjects from those cities.
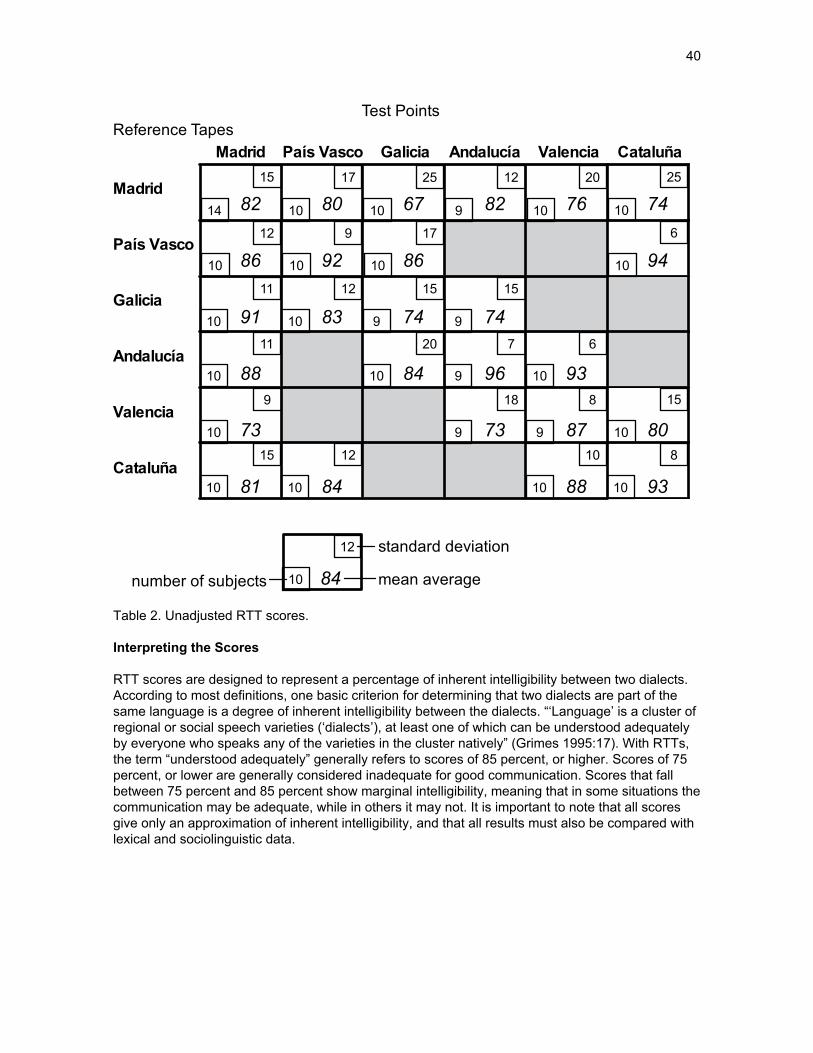
40
Table 2. Unadjusted RTT scores.
Interpreting the Scores RTT scores are designed to represent a percentage of inherent intelligibility between two dialects. According to most definitions, one basic criterion for determining that two dialects are part of the same language is a degree of inherent intelligibility between the dialects. “‘Language’ is a cluster of regional or social speech varieties (‘dialects’), at least one of which can be understood adequately by everyone who speaks any of the varieties in the cluster natively” (Grimes 1995:17). With RTTs, the term “understood adequately” generally refers to scores of 85 percent, or higher. Scores of 75 percent, or lower are generally considered inadequate for good communication. Scores that fall between 75 percent and 85 percent show marginal intelligibility, meaning that in some situations the communication may be adequate, while in others it may not. It is important to note that all scores give only an approximation of inherent intelligibility, and that all results must also be compared with lexical and sociolinguistic data.
82
86
91
88
73
81
80
92
83
84
67
86
74
84
82
74
96
73
76
93
87
88
74
94
80
93
12 9 17 6
11 12 15 15
11 20 7 6
9 18 8 15
15 12 10 8
10 10 10 10
10 10 9 10
10 9 9 10
10 10 9 9
10 10 10 10
14 10 10 9 10 10
15 17 25 12 20 25
Madrid País Vasco Galicia Andalucía Valencia Cataluña
Madrid
País Vasco
Galicia
Andalucía
Valencia
Cataluña
Test PointsReference Tapes
84
12
10
standard deviation
mean averagenumber of subjects

41
A wide variety of factors can affect RTT scores. The most common factor, and the most difficult to control, is bilingualism. The level of bilingualism (or passive bilingualism) is often determined by how much contact a person has with another language or dialect. Frequent contact, e.g., living in the language area for a considerable length of time, can create a high level of bilingualism. Periodic contact, such as watching a signer from the language area at an annual conference, can create some level of passive bilingualism. Some subjects have had more contact than usual with another community, e.g., the person attended school in the other community or has family members from that community. It is relatively easy to find out about this type of contact by asking appropriate questions before conducting the test. Passive bilingualism can also skew the test results. However, in many situations it is not possible to test people who have never had contact with a neighboring community, nor is it advantageous to do so. If the majority of the people have had some contact with a neighboring community, then the testing would not be representative of the population if all people with some level of bilingualism were excluded. Although we attempted to screen out bilinguals from taking the tests, we suspect that some of the subjects had a high degree of passive bilingualism, and that nearly all had at least limited contact with the language varieties used on the test tapes. Most deaf people in Spain have seen signing from Andalucía because of a weekly TV program produced by the deaf federation in that region. Also, for one reason or another, most of them have seen signing from Madrid and Barcelona. Those who are bilingual in a neighboring dialect would score significantly higher on a test of that dialect than those who had never been exposed to it. Those with a passive knowledge of the other dialect may also score higher than those who have had no contact. By testing people with bilingual and passive bilingual knowledge of the other dialect, as well as people who have had no contact with the dialect, we would expect a wide range of scores. The standard deviation is a statistical means of measuring the range of scores. High standard deviation means that there is a wide range of test scores, and low standard deviation means that most of the scores are about the same. A standard deviation above 15 percent is considered high. The standard deviations (shown in figure 5) were very high. Seven (of 26) were higher than 15 percent and nine more were between 12 and 15 percent. However, bilingualism is only one of many factors that can cause a high standard deviation. Since most of the effects of bilingualism in our tests seem to be caused by passive bilingualism as a result of regular contact between neighboring communities, there is no justification for changing the scores to compensate for this variable.21 In addition to bilingualism, there are a wide variety of other factors that can affect the RTT scores. O’Leary (1994:11) lists some factors she noticed in conducting RTTs in spoken languages. Many of these factors apply to our situation as well. Her list is as follows: 1. Variables affecting each subject’s performance:
a. subject’s memory and attentiveness b. intelligence c. test-taking skills d. attitudes toward the language e. attitudes toward the test-taking situation
21 During the testing procedure, we attempted to avoid testing people who were obviously bilingual by asking to test those who had lived in the area all their lives.

42
2. Audio clarity, both in recording and in playback situation. 3. Text differences; i.e., relative difficulty or complexity of text and comprehension questions
asked. 4. Slight inequivalence of translation of test questions into each hometown dialect. 5. Selection of questions, i.e., questions may or may not hit crucial items of difference. There may
be wide variation caused by the influence of particular lexical items. 6. Inconsistent administration (e.g., replays, checking to be sure seemingly correct answers are
understood, giving help to subjects appearing to lack confidence, inconsistently investigating unexpected answers).
7. Different researchers scoring differently (e.g., generic for specific, replayed items’ scores, influence of one key lexical item which may recur in questions, scoring of possible answers from elsewhere in the text).
8. Researcher’s level of proficiency in the dialects. 9. Language of response (subject’s hometown dialect vs. a language of wider contact). 10. Order of administration for multiple RTTs (learning and fatigue effects). Some of these factors can be controlled to some degree by carefully planning and administering the tests; others are more difficult to control. We found that at least three of the factors listed above had significant effects on the test scores: the first, second, and fifth factors.
Language Ability The first factor mentions several variables affecting each subject’s performance. One additional variable that is not usually a factor in spoken language situations is the subject’s language ability. Most children begin hearing and learning the sounds of their language from the day they are born. deaf children born into deaf families also begin seeing and learning their language from infancy. However, only 10 percent of deaf children are born into families with deaf parents. The other 90 percent may not be exposed to sign language until they enter the deaf school system. It is also in the schools that most deaf children are taught how to interpret speech through lip reading and to express themselves with speech. In other words, for many deaf children, communication, either through speech or signs, does not become developed until well into their school experience. In contrast, both the hearing child and the deaf child of deaf parents arrive in the school system with already fully developed language skills. Lewandowski (1992) summarizes the normal pattern of language acquisition.
The decisive time for language acquisition is between the ages of two and six. The appropriation of fundamental syntactic models and basic grammar are complete by the age of five or six, while the vocabulary and lexical refinements will continue to grow. (p. 10)
Some students who arrive at a deaf school with little or no language ability either in the spoken or signed language begin an accelerated learning process that allows them to achieve full language ability in a relatively short time. Others, however, may never reach a high level of language ability. The effects of a slow start to language learning may be compounded by the amount of linguistic stimulus the deaf adult receives. When a deaf teenager leaves the school environment, he may join a local deaf association. Depending on living and working situations, he may only be able to spend one or two evenings a week signing with deaf friends. The rest of the time he is surrounded by the hearing world. With the increase of deaf activities and involvement in the deaf world, many of the younger generation have opportunities for language development that the older generation seldom had. At

43
the same time, Spanish deaf leaders fear that the country’s current integration policies will once again create a generation with a language deficit. One indicator of low language ability is a low test score on the hometown test and all other tests. For example, in one location, a signer scored 56 percent on the hometown test and between 45 and 60 percent on the other three tests. Typical scores for these tests were 20 to 40 percentage points higher. If the subject does reasonably well on the hometown test, but poorly on the others, his scores should be considered valid. If the subject’s scores were significantly low on the hometown test, but normal on some or all of the others, then factors other than language ability are probably affecting the hometown score. In our data, only three subjects’ scores clearly fit the low language ability pattern. All three of these signers were from Galicia.22 By omitting their scores, the overall averages for Galicia rose significantly. Galicians’ scores on the Andalucían text rose from 84 to 95 percent, and the standard deviation dropped from 20 to 7. Their scores on the texts from País Vasco and Madrid showed similar changes; the score on the País Vasco text rose 11 percentage points, and the standard deviation dropped 12 points. The score on the Madrid text rose 12 percentage points, and the standard deviation dropped 7 points. The adjusted scores are presented in table 3.
Table 3. RTT scores adjusted for language ability factors.
22 In Galicia, our method of choosing subjects was different from the other areas; we were looking for people who had attended a particular deaf school in a nearby city. We were not able to choose signers from the whole signing community, but rather only from a small subset of the community.
82
86
91
88
73
81
80
92
83
84
79
96
79
95
82
74
96
73
76
93
87
88
74
94
80
93
12 9 6 6
11 12 15 15
11 7 7 6
9 18 8 15
15 12 10 8
10 10 10 10
10 10 9 10
10 9 9 10
10 10 9 9
10 10 10 10
14 10 10 9 10 10
15 17 19 12 20 25
Madrid País Vasco Galicia Andalucía Valencia Cataluña
Madrid
País Vasco
Galicia
Andalucía
Valencia
Cataluña
Test PointsReference Tapes

44
Text Clarity The second factor in O’Leary’s list deals with the clarity of the recording and playback of the texts. We found that the manner in which texts were recorded and the clarity with which the signers expressed themselves affected the level of text difficulty. It is possible that two videos from the same language dialect, with the same vocabulary and grammar, may not be equally understood by signers because of a different level of difficulty of the text. We have noticed several factors that determine the difficulty of a text, i.e., factors that affect the ease of comprehension. Technical concerns. The viewing screen itself can affect the subjects’ comprehension of the video. In all our tests, the videos were shown on a 5-inch color TV screen. Although several people commented that they would have preferred viewing the video on a larger screen, all agreed that the image was large enough to see adequately. Since the same equipment was used in every location, this factor did not unevenly affect the results. Image size. The actual image size of the signer on the screen was different from video to video, depending on how closely the camera was zoomed in on the signer. The video of the signing from Madrid showed a small image of the signer in comparison to the other five videos. Several subjects commented that the signer looked far away. This may have caused lower overall scores on the Madrid tape. Speed of the signing. In every location we have visited in Spain, we have met some people that consistently sign at a moderate speed and others that consistently sign very rapidly. The ideal set of video texts would consist of videos with similar rates of signing. Rapid signing is more difficult to understand than moderate or slow signing. Subjects frequently made comments about the speed of the signing in some of the videos. The videos from Valencia, Cataluña, and Madrid were signed rapidly. The videos from Galicia, Andalucía, and País Vasco were signed at a moderate speed.23 Clarity of the signing. As with the rate of signing, there are people in every deaf community that sign very clearly and distinctly, and others that sign with less clarity, not fully articulating all the signs. Clear signing is easier to understand than unclear signing. Both the Madrid and the Galicia videos had quite a few partially articulated signs. Size of the signing. A similar aspect is the size of the signing movements. Signs that cover only a relatively small range of signing space are more difficult to distinguish than large signs. The videos in Madrid and Galicia exhibit smaller signing, and many subjects commented on this aspect of these two videos. Mouthing. The degree to which a person mouths words in Spanish as he signs also affects intelligibility scores. In one instance, a lady signed “mother” in a way that could also be understood as “mother-in-law,” but her mouth clearly said, “mamá.” Almost no one misunderstood that sign. Only two of the six tapes exhibited significant mouthing: Barcelona and Galicia. Although the above are the only factors mentioned specifically by the subjects, other factors may also make some texts more difficult than others. Any one of these factors, taken alone, should not make one text significantly more difficult than the others; however, the cumulative effect of several factors could cause sufficient hindrance to skew the data. Table 4 is a chart illustrating the effect of the difficulty factors on the six texts. The texts have been rated for the presence or absence of each difficulty factor. Each factor has been given a value of one point on the chart. If the total number of 23 Signs per minute for each video: Valencia, 157; Cataluña, 149; Madrid, 139; Galicia, 119; Andalucía, 114; and País Vasco, 113.

45
points for a text is high (4 or 5), the text is likely to be somewhat difficult, while the texts with lower totals are inherently easier and closer to an ideal standard for ease of comprehension.
Table 4. Ranking of texts according to factors of text clarity.
There is no easy way to adjust the scores to compensate for the apparent difference in difficulty of the Madrid text. Therefore, we left the scores unadjusted. However, as we analyze the language situation, we allow a lower-than-usual score on the Madrid texts. For example, all hometown scores should be above 85 percent (the level we considered adequate for good communication). Madrid’s hometown score is only 82 percent. But, as we consider the difficulty of the text we consider 82 percent an acceptable score.
Selection of Questions The fifth factor in O’Leary’s list deals with selection of questions. Test scores for the same text can be skewed in two ways, based on which questions are asked. It is possible to create a low intelligibility score by choosing questions that only ask about lexical items that are known to be unique to the dialect. In the same way, it is possible to create a high intelligibility score by choosing questions that ask about lexical items that all of the related dialects have in common. As described earlier, we used an English free translation of the text in order to choose the questions so that we would not be influenced by signs that we knew to be similar or different from other dialects. Nevertheless, we noticed that our test results did not always coincide with our impressions of the levels of comprehension. For example, the Valencia text told about an experience with a dog. The sign for dog was not easily understood in most of the other regions where we tested the text. However, the questions did not ask about the dog; they asked about other things that were relatively easy for signers to answer. Although people were able to answer the questions, many did not really understand what the whole story was about. Their actual comprehension was lower than the test results indicated.
1 1 1 1 1 5
0 0 0 0 1 1
0 0 1 1 0 2
0 0 0 0 1 1
0 1 0 0 0 2
0 1 0 0 0 1
Image Speed Clarity Size of Mouthing Totalsize signing
Madrid
País Vasco
Galicia
Andalucía
Valencia
Cataluña
Image size: 1 = small 0 = averageSpeed: 1 = fast 0 = moderateClarity: 1 = not clearly articulated 0 = clearly articulatedSize of signing: 1 = small 0 = normal to largeMouthing: 1 = none or infrequent 0 = moderate amount
1

46
In other instances, we happened to test a word that was not known in other areas, and although the person could follow the story well and tell us all the surrounding information, he could not tell us the meaning of the one sign about which we asked. Also, asking ten questions may not be enough to balance the data. In a larger sampling of questions, known vs. unknown lexical items should balance out statistically. For all these reasons, our test scores appear to have a relatively high margin of error. This does not mean that the tests are not insightful, only that the results need to be interpreted in light of all other information available, such as lexical and sociolinguistic data. In the following section, we examine one way to interpret the RTT scores.
Dialect Mapping Dialect mapping is a way to use RTT scores to distinguish dialect groupings and locate dialect centers. It asks and answers the question, “Based on the linguistic data, where should sign language materials be produced so that every Spanish deaf community has the greatest possible access to the information contained in them?” A language is defined as a group of dialects, of which one can be understood by every other dialect in the grouping. As a general rule, linguists use 75 percent comprehension as a guideline for determining separate languages (SIL 1991:45). A language variety is considered a separate language when comprehension between it and all other varieties is lower than 75 percent. When intelligibility scores for one language variety are above 75 percent with at least one other variety, those varieties may be considered dialects of the same language. However, if the scores are near the 75 percent level, decisions about language status are more accurate when they also take sociolinguistic, or lexical factors into consideration. Again, we must stress that these percentages are only guidelines, and that all conclusions are dependent on verification from other methods of testing. However, just because dialects are considered part of the same language, this does not mean that material produced in each dialect can be sufficiently understood by each of the other dialects. As discussed previously, it is possible to have dialect chains where dialect A and dialect C can both understand dialect B, but dialects A and C may have significant difficulty understanding each other. In this case, dialect B would be considered the center of a dialect grouping. It is also possible to have several groupings of dialects where comprehension within the group is high, but comprehension of dialects outside of the group may be considerably lower. In this case, it may be necessary to adapt materials produced in one dialect group so that it can be understood at a high level in the other dialect group. When considering the optimal location for producing materials in that language, it is important to know where dialect groupings exist and where the center of each group is located. There are several methods of determining dialect groupings and dialect centers. Casad (1974:28–51) puts forth one formula which was later revised by Grimes (1995:20–26). We have taken the Grimes formula, called optimization, and adapted it to include sociolinguistic factors such as language attitudes. Grimes states:
To interpret intelligibility scores by optimization, think of high intelligibility from another point of view: high intelligibility is another way of saying that there is low effort or cost or hassle in communicating. The language system doesn’t get in the way of the conversation. Think of 100 percent intelligibility as a zero cost of getting information from a reference site to a test site. 0 percent is high cost.

47
The following table is laid out like previous tables, with each (vertical) column representing the mean score of all tests conducted at the test location listed at the top. The (horizontal) rows represent the scores in each test location for the test tape listed at the left side (table 5). An X is placed beside each hometown score. This provides one X per column. The X represents the optimal location, the place where the language is best understood. Since most people would prefer to have material produced in their own dialect rather than another dialect, the X always begins beside the hometown score. However, to produce materials in each location is very time consuming and may not be necessary if members of one community adequately understand a neighboring dialect. The objective is to reduce, wherever possible, the number of locations that need separate materials. On the chart, this is represented by moving the Xs up and down the column until the maximum number of Xs are on one row.
Table 5. Initial optimization table. Before explaining how the Xs are moved, it is necessary find out the COMMUNICATION COST for each location. To calculate the cost, subtract each score that has an X from 100,24 and enter this number in the column labeled “Com. Cost.” For example, the cost for the first row is 18 (100 − 82 = 18). Therefore Madrid’s hometown test score is 18. A low cost represents the idea that it takes little effort to understand materials produced in that dialect; a higher cost means that it takes more effort to understand. Each row that has one or more Xs also receives an ALLOCATION COST. We assign an arbitrary high number, such as 100, as the allocation cost. This represents the idea that it takes time and money to produce materials in each location. Since we start the calculations with an X beside all six hometown scores, there is an X in every row. Our initial allocation cost totals 600. The communication cost and allocation cost are totaled to give a TOTAL COST. The objective is to find the combination of Xs that produces the lowest total cost. At the first stage of calculations, our total cost is 671. The scores can be calculated solely on the merits of the intelligibility scores, thus producing a score of linguistic intelligibility. However, since the method is designed to tell us the best location in which
24 Since 100 percent intelligibility is zero communication cost, 0 percent intelligibility is 100 cost; we subtract the intelligibility score from 100 to find the communication cost.
x 82 80 79 82 76 74 18 100
86 x 92 96 94 8 100
91 83 x 79 74 21 100
88 95 x 96 93 4 100
73 73 x 87 80 13 100
81 84 88 x 93 7 100
71 600 671
Reference Tapes Test Location
Mad. P. V. Gal. And. Val. Cat. Com.Cost
Totals
Madrid
País Vasco
Galicia
Andalucía
Valencia
Cataluña

48
to produce materials, there are sociolinguistic factors that need to be considered. For example, when we conducted the tests in Madrid, most people assumed that they would not understand signing from Cataluña. Even when they scored high on Cataluña’s text, some subjects continued to insist that they could not understand the sign language from Cataluña (and even confused the Cataluña and Valencia videos because the Valencia text was more difficult for them). This tells us that even if the intelligibility scores are high between the two locations, materials from Cataluña would be rejected by many people in Madrid. (We deal specifically with these sociolinguistic factors in the following section.) The scores of the locations that would not likely be acceptable for sociolinguistic reasons are lightly crossed out on the scoring table (table 6). For example, we can assume, based on attitudes, that Madrid would probably not use material produced in the Cataluña dialect, so Madrid’s score on the Cataluña text in column one is crossed out. For similar reasons, País Vasco’s score on Cataluña’s text in column two is crossed out. Cataluña’s score on País Vasco’s in column six can be crossed out since people from that area would probably not want to use materials from País Vasco. The second consideration is the occurrence of an unusually low hometown score. As mentioned earlier, the hometown score should be at least 85 percent (the level generally accepted as adequate for good communication). If the hometown score is below 85 percent, then it is likely that some factor is skewing the results. When we cannot isolate what that factor may be, we do not want to choose that location as an optimal location for producing material. To insure that this does not happen, we move the X assigned to the low hometown score to another score in the column (usually the highest score in the column). All scores in the row of the low hometown score are then crossed off. In the first column, the hometown score for Madrid is 82. As we already noted, one possible reason for this unusually low score is the difficulty of the text. Since the low score is explainable we neither cross it out, nor reassign the X. In the third column, the hometown score for Galicia is 79. Since we cannot clearly explain why this score was unusually low, the X is moved to another location in the same column. Two scores in the column are above 85 percent and the difference between them is very small (96 and 95 percent). Since deaf people in Galicia seemed to be more aligned with the other northern communities such as País Vasco than with Andalucía and other locations in the south, the X is moved to the País Vasco score (which also happens to be the higher of the two scores). Then we add the two costs, 8 for País Vasco and 4 for Galicia, resulting in the cost value for País Vasco being raised from 8 to 12, with the Galicia row no longer having a communication cost, nor an allocation cost. This adjustment changes the total cost to 554 (table 6).
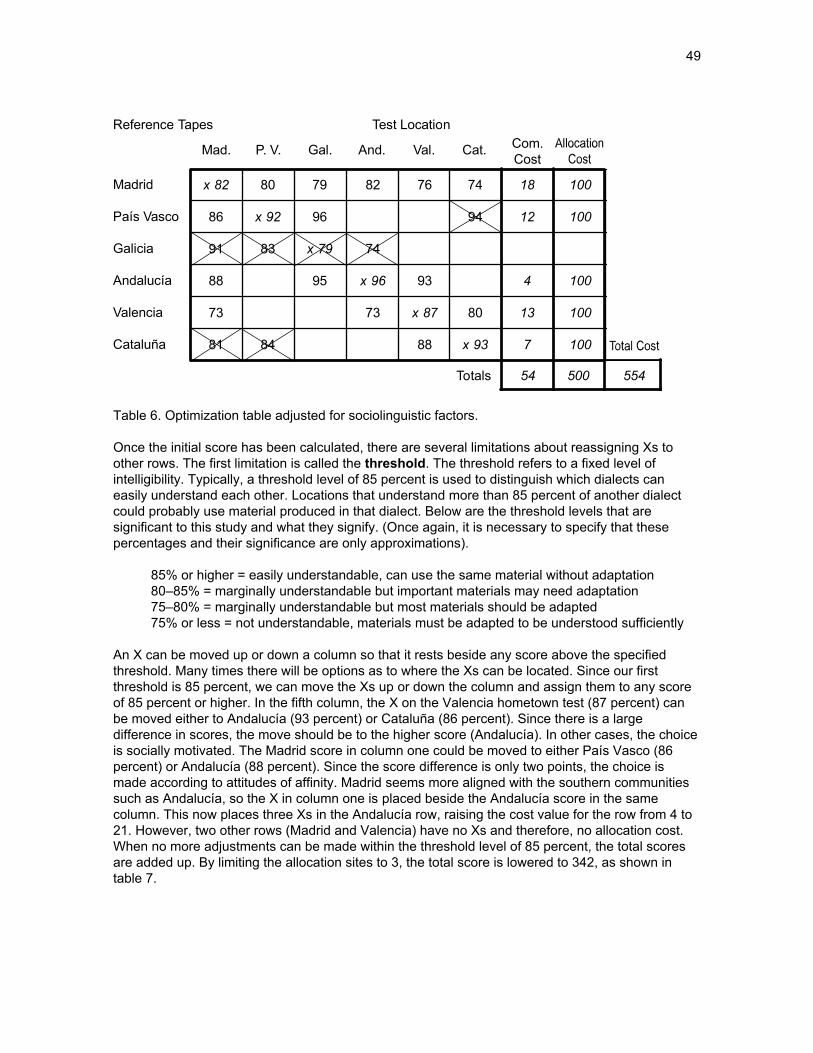
49
Table 6. Optimization table adjusted for sociolinguistic factors. Once the initial score has been calculated, there are several limitations about reassigning Xs to other rows. The first limitation is called the threshold. The threshold refers to a fixed level of intelligibility. Typically, a threshold level of 85 percent is used to distinguish which dialects can easily understand each other. Locations that understand more than 85 percent of another dialect could probably use material produced in that dialect. Below are the threshold levels that are significant to this study and what they signify. (Once again, it is necessary to specify that these percentages and their significance are only approximations).
85% or higher = easily understandable, can use the same material without adaptation 80–85% = marginally understandable but important materials may need adaptation 75–80% = marginally understandable but most materials should be adapted 75% or less = not understandable, materials must be adapted to be understood sufficiently
An X can be moved up or down a column so that it rests beside any score above the specified threshold. Many times there will be options as to where the Xs can be located. Since our first threshold is 85 percent, we can move the Xs up or down the column and assign them to any score of 85 percent or higher. In the fifth column, the X on the Valencia hometown test (87 percent) can be moved either to Andalucía (93 percent) or Cataluña (86 percent). Since there is a large difference in scores, the move should be to the higher score (Andalucía). In other cases, the choice is socially motivated. The Madrid score in column one could be moved to either País Vasco (86 percent) or Andalucía (88 percent). Since the score difference is only two points, the choice is made according to attitudes of affinity. Madrid seems more aligned with the southern communities such as Andalucía, so the X in column one is placed beside the Andalucía score in the same column. This now places three Xs in the Andalucía row, raising the cost value for the row from 4 to 21. However, two other rows (Madrid and Valencia) have no Xs and therefore, no allocation cost. When no more adjustments can be made within the threshold level of 85 percent, the total scores are added up. By limiting the allocation sites to 3, the total score is lowered to 342, as shown in table 7.
x 82 80 79 82 76 74 18 100
86 x 92 96 94 12 100
91 83 x 79 74
88 95 x 96 93 4 100
73 73 x 87 80 13 100
81 84 88 x 93 7 100
54 500 554
Reference Tapes Test Location
Mad. P. V. Gal. And. Val. Cat. Com.Cost
Totals
Madrid
País Vasco
Galicia
Andalucía
Valencia
Cataluña

50
Table 7. Optimization table at 85 percent threshold. By comparing the scores in tables 6 and 7, we can see that the adjustments lowered the communication cost from 54 to 42. The lower communication cost tells us that people would probably understand materials produced in other locations as well as (or better than) material produced in their own location. The allocation cost was also lowered from 500 to 300, evidence that it would take less effort to produce materials in three locations than in five. The three centers would be País Vasco for the northern communities, Andalucía for the central and southern communities, and Cataluña. This is mapped out in figure 14.
Figure 14. Dialect cluster map at 85 percent threshold. By lowering the threshold level to 80 percent, several new options appear. Our goal now is to rearrange the Xs so that we can limit the allocations to only one or two. The Xs can be moved freely to any score that is 80 percent or higher. In the Madrid row, three of the scores are 80 percent or higher, and one score is 79 percent. Since we are accepting lower-than-normal scores on the Madrid texts, we will accept the 79 percent score as acceptable at this threshold level. This means
82 80 79 82 76 74
86 x 92 x 96 94 12 100
91 83 79 74
x 88 95 x 96 x 93 23 100
73 73 87 80
81 84 88 x 93 7 100
42 300 342
Reference Tapes Test Location
Mad. P. V. Gal. And. Val. Cat. Com.Cost
Totals
Madrid
País Vasco
Galicia
Andalucía
Valencia
Cataluña
Galicia
Madrid
Andalucía
Valencia
Cataluña
País Vasco••
•
•
•
•

51
that we can move all the Xs, except the ones next to Cataluña and Valencia, to the Madrid row. Valencia’s score on Cataluña’s text is 88 percent and can therefore be moved to the Cataluña score. This is also consistent with the sociolinguistic information we gathered, which indicates that deaf people from Valencia feel an affinity with those from Cataluña. This arrangement aligns the Xs on only two rows, thus lowering the allocation cost to 200. The total cost at this level is 296 (table 8).
Table 8. Optimization table at 80 percent threshold. This means that there are now only two dialect groups, with Madrid and Barcelona as centers. According to our interpretation of the percentage scores, those with 80 to 85 percent intelligibility may require a separate adaptation of materials if good understanding is necessary. However, 80 percent intelligibility is adequate for most materials. Since all scores here are subject to a certain margin of error (particularly with the Madrid scores, as previously explained), we can say that materials produced in the two locations, Madrid and Cataluña, would adequately communicate with all the other regions that we tested. The mapping of the dialect groups is illustrated in figure 15.
x 82 x 80 x 79 x 82 76 74 77 100
86 92 96 94
91 83 79 74
88 95 96 93
73 73 87 80
81 84 x 88 x 93 19 100
96 200 296
Reference Tapes Test Location
Mad. P. V. Gal. And. Val. Cat. Com.Cost
Totals
Madrid
País Vasco
Galicia
Andalucía
Valencia
Cataluña

52
Figure 15. Dialect cluster map at 80 percent threshold. By lowering the threshold to 75 percent, all locations can be joined into one location. Cataluña’s score with Madrid is 74 percent but as previously stated, we can accept a lower threshold on the Madrid texts. The total cost is now 227 (table 9). There are many occasions where full understanding of a text is not necessary. In these situations, one set of materials is likely to be sufficient for the entire country. However, as stated before, when the numbers near the 75 percent level, it is important to analyze the situation in light of sociolinguistic and lexical data. In the following section we explore sociolinguistic evidence that suggests that the sign language in Cataluña may be considered a separate language from that which is centered in Madrid.
Table 9. Optimization table at 75 percent threshold. Critique. The results of the RTTs are similar to the results obtained in the lexical study previously mentioned. The RTTs showed Valencia and Cataluña forming a separate dialect grouping from Madrid, Andalucía, Galicia, and País Vasco. According to the lexical comparisons, Cataluña is the
GaliciaPaís Vasco
Cataluña
Madrid
Andalucía
Valencia
•
••
•
••
x 82 x 80 x 79 x 82 x 76 x 74 127 100
86 92 96 94
91 83 79 74
88 95 96 93
73 73 87 80
81 84 88 93
127 100 227
Reference Tapes Test Location
Mad. P. V. Gal. And. Val. Cat. Com.Cost
Totals
Madrid
País Vasco
Galicia
Andalucía
Valencia
Cataluña

53
most unique, with Valencia and País Vasco also showing significant differences in vocabulary. The intelligibility of the Cataluña and País Vasco texts was considerably higher than we originally expected, hinting at a possible difference between results obtained in spoken language and sign language situations. However, until more tests of this nature are conducted on sign languages, we have no accurate means of comparing the results of RTTs for spoken and signed languages. Since we did not test every location against every other location, it is difficult to say how high subjects may have scored on the tests they did not take. However, it is possible that subjects in País Vasco and Cataluña would have understood significant portions of the Andalucía tape, or that subjects in Andalucía and Valencia may have understood significant portions of País Vasco’s text. If the testing had shown this, our results would have been quite different, with either Andalucía or País Vasco considered the center of the language. However, sociolinguistic information suggests that Madrid is the cultural and administrative center of the Spanish deaf community. In future small-scale studies, it would be wise to test every text with every location. However, for large surveys with several dozen locations, it is not practical to do so, and decisions have to be made regarding which text will be tested in which locations. These decisions can be made based on sociolinguistic information, such as attitudes and trends of contact. As we noted earlier, we needed to make a number of adjustments to the scores or allow leniency in interpretation in order to compensate for factors of language ability and varied difficulty of the texts. We did not adjust the scores for passive bilingualism, although it probably affected the scores also. Until more intelligibility studies can be conducted in other sign languages, we will not know how valid these adjustments were. For this reason, our conclusions should be considered as only tentative. The following tips may help control the variables that affected the test scores in this study: 1. Record more stories. Record as many potential videos as possible from as many signers as
possible. In most places in this study, we recorded one group of four signers and collected approximately 30 minutes of tape. Two video sessions of the same length with different signers would have provided more options for choosing a usable story. This method would greatly increase the chances of finding stories of comparable difficulty in all locations.
2. Test more subjects. The accuracy of the statistical evidence increases when more tests are
conducted. If more people are tested (perhaps a total of 20 or more in each location), the scores that are affected by language ability or bilingualism can be eliminated while still maintaining a large enough sampling to produce valid statistical evidence. A large sampling also allows for the option of statistical comparisons of sub-groups of data, based on, for example, sex, age, education, etc. This may be significant when attempting to determine the influence of bilingualism on the scores.
3. Obtain more background information about the subjects. A simple questionnaire could be filled
out with the subject before or after the test. By asking information about when and where the subject learned sign language and the extent of contact he has had with deaf people from other areas, it may be possible to gain significant insight about factors such as language ability and bilingualism.
Conclusion In this section, we have examined the manner in which we conducted Recorded Text Tests of sign language in six locations in Spain. We also discussed the possible interpretation of the scores as

54
they relate to dialect intelligibility. We attempted to locate dialect groupings and language centers, in the hopes of determining where materials could be produced so that they communicate their message adequately in all the regions of the country. Our conclusions regarding the language situation in Spain, are as follows: 1. Two groupings show enough distinction that important materials should be adapted to each
grouping. Madrid is considered the center of one grouping consisting of Madrid, Andalucía, Galicia, and País Vasco. Barcelona is considered the center of the other grouping, which consists of Cataluña and Valencia.
2. It remains unclear whether the language variety used in Cataluña should be considered a
separate language from the other varieties of sign language in Spain or just a very different dialect of the same language.
The following section on sociolinguistic factors will add one more piece to this complicated puzzle and clear up the issue as to whether or not the Cataluña variety should be considered a separate language.
Sociolinguistic Information
Introduction Sociolinguistics is the study of the relationship between society and language. In this section we examine various aspects of deaf society that relate directly to the study of language variation. We look at attitudes expressed by members of the deaf community regarding their own dialect of signing and other dialects in Spain. We also look at the history of the deaf community, focusing on the history of deaf schools and associations and how these institutions have affected the evolution of the language and language variation. Other factors such as the demographics, geography, and national politics also play a role in defining the language situation, particularly in defining the most central location of a language or dialect cluster. From this information we have some idea as to what the language situation in Spain will be like in the coming years. Previously we examined the linguistic evidence for the division of dialects throughout the country. There are situations where two dialects may be considered part of the same language because they are linguistically similar and there is adequate intelligibility between them. However, they may be considered separate languages because of the sociolinguistic factors. For example, in the southwestern part of the United States, two Native American languages, Papago and Pima, are very similar in lexicon and are mutually intelligible. However, because the two tribes consider themselves to be politically and culturally distinct, their languages are also considered distinct (Crabtree and Powers 1991). Throughout this study, no one dialect has shown definite linguistic evidence for distinguishing it as a separate language from the others. However, several dialects consistently fall in the ambiguous range between “definitely members of the same language” and “definitely separate languages.” Here we see how attitudes may create a language boundary between Spanish Sign Language (LSE) and Catalán Sign Language (LSC).25 We briefly discuss the legitimacy of drawing such a distinction in light of the other evidence we have about the language situation.
25 Because signers in Cataluña call their sign language LSC, and we are examining the attitudes signers have about their own and other languages, we limit the meaning of the term LSE throughout this section to refer to the sign language used in all areas of Spain except for Cataluña. LSE in this usage means the Lengua de Signos Española, the name used by most of Spain’s deaf population to refer to their language.

55
Attitudes The attitudes of the community toward their own dialect, as well as toward the other dialects or languages play a major role in defining the language situation. In this section we examine two points of view regarding attitudes. First, how others view a particular dialect, and second, how the community views its own dialect and the neighboring dialects. The information in this section comes from interviews and observations that we gathered from the deaf communities as we traveled throughout the country and conducted the lexical and recorded text tests. We realize that these observations may not be representative of the entire deaf population; nevertheless, they help clarify a complicated situation. Cataluña. The clearest example of difference is exhibited in relation to the dialect of sign language used in Cataluña. In every location we visited except Valencia, people immediately associated the signing in Cataluña as being the most different from their own. In several locations, people commented to us that “the deaf in Cataluña are separatists and want to be their own group, separate from the rest of Spain.” Some of these attitudes may be a result of similar attitudes expressed by the hearing culture. In Valencia, all agreed that Catalán signing was different, but some felt that Madrid signing was more different from Valencian than Catalán. Nonetheless, deaf people in every location affirmed that Catalán signing is very different from their own. Not everyone agreed that the Catalán dialect should be considered a separate language. Several people made statements such as, “Even though they sign differently, we all sign Lengua de Signos Española” (LSE). Some seemed to base this decision on linguistic reasons; for example, “We sign differently, but we can still understand each other.” Others seem to make this decision based on a geopolitical basis: “We are all Spaniards.” The deaf community in Cataluña shows less doubt about their own identity as a separate language. Most literature produced in the region regarding the sign language refers to the language as Lengua de Signos Catalana (LSC). When we were conducting the RTTs, several people from Barcelona stated that they had difficulty understanding a particular tape because “They sign LSE and I sign LSC.” One Catalán deaf leader made it clear to us that when they refer to LSC instead of LSE, they are not saying that they are more different from the “standard” than other communities such as Valencia or País Vasco, only that they have come to a common agreement within the community as what to call their variety of signing. Although the linguistic data (lexical and intelligibility scores) are ambiguous about the identity of LSC as a separate language from LSE, the attitudes exhibited in Cataluña and throughout Spain strongly point to a language distinction between LSE and LSC. Madrid. Deaf people in many locations associate their dialect with that of Madrid. Throughout deaf communities in Galicia, Castilla-León, Castilla-La Mancha, and Andalucía, we received comments such as “We sign like Madrid, although we have some signs that are unique to our area.” País Vasco also mentioned that their sign language was similar to Madrid’s, but that their form of signing was more like the other northern communities’ than like Madrid’s. In Valencia, we received comments such as, “In Madrid, they use small, unclear signs. We sign better than they do because we use big, clear signs.” Those in Valencia seemed to be split between alliance with Madrid and alliance with Barcelona. All areas consider Madrid dialect as part of LSE. Deaf people from Madrid recognize that even within the city, there is a great deal of variety in signing. However, this variety is not viewed as bad; rather, it is viewed as a fact of life in Madrid. A signer simply learns to recognize the differences that exist in the city, but he does not necessarily change his own form of signing. A similar attitude is shared with regard to many of the other deaf

56
communities in Spain. Most recognize the differences between signs from Andalucía, Castilla-La Mancha, Castilla-León, and Galicia, but they treat the differences as they do the differences within their own community: with recognition, but without adaptation. When questioned about their attitudes toward signing from Valencia and País Vasco, most deaf people did not express strong opinions. Some considered one or both as very different from their own. Others felt that they were much the same as their own. Few people we met in Madrid had spent much time with signers from País Vasco, so their opinions may have been influenced by the aggressive political movements in that region to form a separate nation. Also, since the spoken language of the region, Euskera, is so different from Castilian Spanish, many seemed to assume that the sign language would probably be just as different. Those who actually knew people from País Vasco did not seem to think that the signing there was considerably more different from Madrid’s than that of the other areas. Those who have had contact with Valencian signers seemed divided over whether the sign language there was significantly different from Madrid’s. Galicia. Not many deaf people we talked with expressed strong feelings about Galicia’s signing. Those in Madrid consider the differences between the Galician dialects and Madrid’s as being minimal. People from País Vasco seemed to consider their own signing a bit more like Galicia’s than Madrid’s. Those in Galicia often refer to the signing that is typical of alumni from the deaf school in Santiago as Gallego. We were told that the older generation still signs Gallego, but the youth sign more or less like Madrid. When questioned about a unique sign, they often replied, “That’s a Gallego sign.” From these indications, it appears that there is a form of signing that could be called Lengua de Signos Gallega, but it is dying out as a distinct form and merging with signing from Madrid. Gallego signs still appear (and likely always will) in the Galician dialects. However, there no longer seems to be a large distinction between the Galician dialects and the other dialects that make up LSE. Andalucía. Most locations associate the signing from Andalucía as being very similar to Madrid’s. We were not told of any particularly negative attitudes toward the sign language dialects from that area. Those in Andalucía recognize that they use some signs unique to Andalucía, or unique to their own area. However, they, like deaf people from Madrid, consider their dialects part of LSE. Valencia. People we talked with in most locations agreed that the dialects used in Valencia are, to some degree, different from those of the rest of Spain. Some linked Valencia and Barcelona as similar. It is not clear if this attitude comes from personal experience with signers or from the cultural and language similarities evident in the hearing community. Nevertheless, most people seemed to consider the Valencian dialect part of LSE. Those in Valencia also recognize that there are significant differences between their form of signing and others. They take pride in their dialect, as is seen in this comment we received from one Valencian signer: “We sign better than Madrid.” This comment was signed in the presence of other Valencian deaf and all agreed. When we asked about the existence of “Lengua de Signos Valenciana” (LSV), they said, “Well, yes, you could call it that, but we call it LSE.” Despite their strong self-image as a distinct dialect, they consider their dialect to be part of LSE. País Vasco. Because of the political movement for an independent Basque nation, many deaf assume that their community exhibits the same attitudes. Those who did not have much contact with the deaf from País Vasco tended to tell us that their language was as different from Madrid’s as Barcelona’s is. Others who know people from País Vasco stated that the sign language there was similar to Madrid’s.

57
Those in País Vasco also recognize that they use signs unique to their area. Several people expressed a fear that due to integration policies, the youth are not learning to sign well and that spoken Spanish grammar is influencing the deaf grammar. There is a desire to revive pride in their language and begin teaching it to the youth at an early age. The dialect in that area is sometimes called Lengua de Signos Euskera; however, the dialect is still considered by most to be part of LSE. Other Regions. Deaf people from Valladolid and Cuenca (located in the central regions) recognize that there are some signs unique to their area, but basically they sign the same as Madrid. They consider their dialect to be part of LSE. Deaf signers from the northern regions of Asturias and Cantabria consider their sign language to have a number of unique signs, yet they consider that their dialect is part of LSE. They also recognize that there are some similarities among all the northern regions including Galicia and País Vasco. The Canary Islands have typically sent their deaf students to boarding schools in Madrid; therefore, the sign language there has a high degree of similarity with the Madrid dialect. However, the deaf community in the Canaries is growing rapidly. Since 1995, the number of deaf associations has grown from two to seven, and a deaf federation has also been founded. Deaf schools have also been started on the islands. Nevertheless, the Canary Islands dialect is still considered part of LSE. We were not able to gather any information from deaf people from the Baleares Islands. However, deaf students from there used to attend boarding schools in Valencia. Those in Valencia who know signers from Baleares tell us that some unique signs exist there, but the dialect is very similar to the Valencian dialect.
Conclusions Based on the attitudes we observed, we can state the following conclusions:
• People in most areas recognize that there are signs that are unique to their area. • In every location, people seemed to have a positive self-image of their dialect. • People in every location except Cataluña consider their dialect to be part of LSE. • Only those from Cataluña consider their dialect to be different enough to be called a
separate language. These conclusions raise an important question: Is it legitimate to say that LSE and LSC are separate languages? Lexical comparisons showed that LSC is significantly different from all of the other varieties in Spain, with similarities ranging from 59 to 71 percent. As previously discussed, this means that there is a strong possibility that LSC is a separate language, but since most of the levels were not below 60 percent, no definitive decision could be made based solely on the lexical study. We also noted that the intelligibility between Barcelona and other areas was relatively high, though still in the ambiguous range. This typically means that the distinction may only be a dialect distinction rather than a language distinction. However, as we discussed earlier, the results of the intelligibility tests may have been skewed because of not being able to measure the effects of acquired intelligibility—a result of contact between regions. While lexical studies lean toward a language distinction, intelligibility tests lean toward a dialect distinction. By considering the attitudes of the communities, we see that the scale tips heavily toward a language distinction. We see in the following section that there is additional evidence of distinction between the communities in Barcelona and Madrid. Many factors, including the history of the deaf community, patterns of contact, demographics, national politics, and geography, all point to the likelihood that
58
two languages and two communities exist in Spain. The cities of Madrid and Barcelona function as centers of the communities.
History of the Deaf Community
Early History The Spanish Benedictine monk Pedro Ponce de León (1520–1584) is generally credited with being the first teacher of deaf children. Over the course of his life from a monastery in North Central Spain in the province of Burgos, he taught at least 12 deaf children of noble descent to read, write, and speak Spanish, and to some, Italian and Latin (Chaves and Soler 1974 and Rodríguez Gonzáles 1992). Very little, however, is known of his actual teaching methods. Since a form of manual communication was used in monasteries of his order at the time, and since his first two students came from a family of four deaf children (who probably had their own form of home signs), it is suggested that Ponce de León may have used some sign language with his pupils.26 That at least a form of a manual alphabet was used with the students is evidenced in the following quote about Don Pedro de Velasco, one of Pedro Ponce’s first students:
He [Don Pedro] came to Salamanca sometimes to visit his sister, the Countess [of Monterrey] and her children which gave them great pleasure and amusement. His nephews, by express order of the monk, would speak to him using certain movements of their hands with which they formed the letters of the alphabet (Chaves and Soler 1974).
Even though it is not a clearly established fact that Pedro Ponce used sign language to teach the children, he is famous for having taught them to speak (as well as read and write) the oral language. The first published reference to a manual alphabet appears in a book by the Franciscan monk, Melchor de Yebra called Refugium Infirmorum, (see appendix C). It was published in 1593, seven years after Yebra’s death. Chaves and Soler (1974) give a good description of this volume and state uses of the alphabet, including its use among deaf people.
Fols. 172 to 179 of Yebra’s Refugium Infirmorum contain the alphabet of Saint Bonaventure, which is a set of maxims of Christian behavior, each one beginning with a different letter of the alphabet. Each is accompanied by the description and picture of how to make the different letters of the alphabet with the hand. The introduction to this manual alphabet on Fol.172 reads: “Grave authors, especially Saint Augustine, have said that each person will die as he has lived. In case anyone wishes to set his life in order, so that he may die as he has lived, we are including an alphabet of Saint Bonaventure or a brief formula for living well. It can also be used to assist the dying and for this purpose, each letter is accompanied by a hand depicting the letter. Those who should assist the dying will find it useful to learn to speak by making the letters with their hand, because it is common that many people know it. I am moved to persuade about this by the fact that a devout priest who was called in an emergency to hear confession and assist a dying man, found that although he could not speak, he had no loss of mental faculties. The sick man looked at every one in silence and wept, begging for assistance with sign language, because he knew how to speak this way, but since there was no one who
26 This is suggested in Plann (1993).

59
could understand these signs, it was not possible to give him help. This situation went on for two days, but as no one came who could help him, he died in anxiety and without fulfilling his wishes of communicating. “The knowledge of these letters will also be advantageous to confessors in order to communicate with very deaf penitents who know this hand alphabet. This way the confessor can respond to what the penitents say without the danger of shouting during confession. Besides its use in confession, this alphabet can be of use in comforting other deaf people who pressed by necessity learn the hand alphabet to be able to communicate with people. This is a work of charity.”
Several years later the alphabet appears in books describing their use in teaching the deaf. The first was published in 1618 by Juan Bautista de Morales describing Manuel Ramírez de Carrión’s method of teaching the deaf.27 Two years later, Juan Pablo Bonet published his description of his methodology.28 There are only a few minor differences between Melchor de Yebra’s system and those of Carrión and Bonet. The fingerspelling alphabet used in Spain today is clearly related to those early signs. The first public school for the deaf was founded in France, in 1760, by the Abbé Charles Michel de l’Epée. Until that time, education for the deaf was limited to royalty. The school in Paris began a movement that spread throughout Europe, and soon deaf public schools were founded in most of the Western European countries. The first public deaf school in Spain was founded in 1795, in Madrid. It lasted seven years, while the first deaf school in Barcelona was open from 1800–1802. Schools for the deaf were again established in 1805, in Madrid, and 1816, in Barcelona (Rodríguez González 1992). These early schools, both private and public, allowed and even encouraged signing. In 1795, Lorenzo Hervás y Panduro published a book that admonished teachers of the deaf to learn the natural signs of the deaf so that they could communicate better and more naturally with the pupils:29
The deaf-mutes possess with perfection the art of pantomime which the teachers should attentively study in order to teach them the signs which are most proper and natural. 1795:264. (Rodríguez González 1992). 30
This implies that by the year 1795, there was already some form of sign language used by deaf people.
27 Juan Bautista de Morales published this and other materials about Manuel Ramírez de Carrión in a book called Pronunciaciones generales de lenguas, ortografía, escuela de leer, escribir y contar y significación de letras en la mano. [General Pronunciation of Languages, Orthography, School of Reading, Writing, Counting, and Meaning of the Manual Alphabet]. The book was printed by the author in Montilla, in 1623, but it had been written at least five years earlier, because the first approval for printing it is dated June 5, 1618, and is signed by Fr. Diego Tello, S.J., in Cordoba (Chaves and Soler 1975). 28 In 1620, Bonet published a book in Madrid titled: Redvction de las letras y arte para ensenar a ablar los mudos [Simplification of the Letters and Art to Teach the Mutes to Speak]. 29 Escuela Española de Sordomudos o Arte para enseñarles a escribir y hablar el idioma español, 1795. [Spanish School of deaf Mutes, or The art of teaching them to write and speak the Spanish language.] 30 “Los Sordomudos poseen con perfeccion el arte pantomimica, la qual deben estudiar con atencion sus maestros para enseñarlos con las señas mas propias y naturales.”

60
In 1881, a congress of educators met in Milan, Italy, to discuss deaf education. The Edict of Milan, resulting from that congress, officially discouraged the use of sign language in the education of deaf children. This strict oral method had been gaining strength in Europe even before this congress; however, after the edict by the congress, most schools throughout Europe complied with the oral method of instruction. Spain was not represented in the congress, but during the 1800s, many schools in Spain adopted the oral method. Some schools in Spain have continued that tradition. This early history shows that sign language has existed in Spain for more than 200 years and that possibly it had early influences from monastic signs, as is clearly the case in fingerspelling systems. However, the deaf people themselves and their own systems of communication probably strongly influenced the language.
The Role of Deaf Schools The first evidence of a deaf community comes from the deaf public boarding schools. Before then it would be very difficult to say if there were a unified deaf community or a unified sign language. However, once the public schools for the deaf opened in the larger cities, they drew many deaf children to those locations. Since most of these schools were boarding schools, the deaf children shared many of the same experiences in their growing-up years. This continual interaction of deaf children and deaf adults who worked at the schools helped develop the sign language into a complete and complex language, capable of expressing any idea, concrete or abstract. In each school, some deaf students arrived having used signs at home with family or with deaf siblings. Some of these signs were adopted by the classmates at the school and thus, introduced into the language. Older students taught the new students the language that they knew, thereby passing on the language from one generation to the next. During the early 1800s when teachers were encouraged to sign with the students, the teachers inevitably introduced signs into the language, especially when they taught the students new concepts. All this language development, carried on separately in each of the schools for nearly two centuries, is probably the major source of the dialectal difference that exists today. Very few deaf schools still have boarding facilities. Most major cities have some plan for deaf education, either in a deaf school or through integration programs. This means that fewer people are relocating from another region to attend a deaf school. The current educational policies in some regions tend toward the integration of deaf children into all-hearing classes. These students are no longer surrounded by deaf classmates from whom they can learn the language. Several deaf leaders have expressed a fear that the youth are not learning sign language until they are past their prime years for language learning. As a result, some young signers do not sign fluently. Contrary to what is often published, deaf people are not born with a natural sign language inside them, waiting to come out. They do have a natural God-given ability to absorb and produce language, in whatever mode, signed or spoken. However, deaf people need to learn to sign just as much as hearing children need to learn to speak. Those who do not have access to signers in schools, deaf associations, or the family, will not learn LSE. The role of teaching deaf children to sign is more and more being placed on the deaf associations. Some of them have started programs aimed at school-age children as an attempt to increase their signing ability. This trend does two things. First, “school signs” are no longer being introduced into the language at the same rate as before. Second, the schools in Madrid have less influence on the development of the language nationwide than they did in previous times. In the past, students from many regions traveled to Madrid for schooling and then returned to their region, bringing with them

61
the signs they learned. This is no longer the case for most students. The result of this change is that fewer Madrid signs are being transferred to other regions by school alumni.
The Role of Deaf Associations Deaf associations have had a profound impact on the language and culture of deaf people in Spain. The first deaf association in the country was founded in 1906, in Madrid (Asociación de Sordomudos de Madrid). Shortly thereafter, two associations were founded in Barcelona (Sociedad de Socorros Mutuos entre los Sordomudos de Ambos Sexos de Cataluña, 1909; Casa del Sordomudo de Barcelona, 1916). Four other associations were founded in the years before the Spanish Civil War (1936–1939): Asociación Valenciana de Sordomudos, 1926; Agrupación de Sordomudos de Zaragoza, 1932; Asociación de Sordomudos de Oviedo, 1934; Asociación Cultural de Sordomudos de Sevilla, 1935.31 In 1935 and 1936, the leaders of the deaf associations around the country convened to form a national organization for the deaf. On June 16, 1936, the Federación Nacional Silenciosa Española was born. One month later the Spanish Civil War broke out and all the plans and dreams of the new federation ground to a halt. It was not until November 1949 that the federation was reenacted. During the first ten years after the Civil War, before the federation’s activities started again, only six more associations were founded (Madrid, 1939; Valladolid and Barcelona, 1941; Toledo and Palma de Mallorca, 1942; and Bilbao, 1949). However, from 1950 until the present time, there has been a steady increase in the number of associations around the country. Currently there are more than 115 associations nationwide, representing nearly every major city in the country. As new associations were created in each region, deaf leaders recognized a need for regional organizations that could coordinate activities and provide services for the deaf. In 1978 and 1979, three regional federations were organized (País Vasco, 1978; Cataluña and Valencia, 1979). Currently there are ten regional federations covering 11 of the 17 regions of Spain. In 1983, the National Federation changed its name to the Confederación Nacional de Sordos de España. The local deaf association is the heart of the Spanish deaf community. Although most deaf people work primarily with hearing people, live in hearing neighborhoods, have hearing family members, and basically carry out most of their daily life with hearing people, their social interaction is almost exclusively with other deaf people in the deaf association setting. Almost every deaf adult who is actively involved in the deaf community is a member of a local deaf association. The larger associations are often open six or seven nights a week; smaller associations may be open three or fewer times per week. The associations offer opportunities for their members to participate in a wide range of sporting and cultural activities together. The signs that are used in the associations are not always the same as those that are learned in the deaf school. In many locations where we collected wordlists, we received comments like, “In school we signed ‘dog’ this way, but when we got out of school and joined the association, we changed the way we signed ‘dog’ in order to be like the others in the association.” One humorous example of this is worth noting. In the deaf school in Bilbao, each residential student was assigned a number. This number was visible on the back of the child’s clothing. The students learned their friends’ numbers and adopted their owners’ name signs as the signs for those
31 These are the names listed in the fiftieth anniversary book of the CNSE, 1986; the word mudo has been removed from the names of many of the associations.

62
numbers. When counting, the students used the standard LSE signs for the numbers one through ten. However, the sign for 11 was the name sign32 of child number 11; the sign for 12 was the name sign for child number 12; and so on through the number 20. The sign for 21 was the name sign for child number 20 plus the sign for 1. The signs for 30, 40, 50, 60, 70, 80, 90, and 100 were the name signs for the children whose clothing had those numbers printed on them. These numbers are presented in figures 16 and 17. When one of the students of the school first began attending a local deaf association in Bilbao, he signed one of the “school numbers” and immediately several people laughed and asked, “Where did you come up with a sign like that?” This deaf man told us that this was when he first realized that the rest of the deaf world didn’t use the same numbers. From then on, he learned and used the numbering system used in the association in Bilbao. In the early years before the advent of deaf associations, federations, and confederations, the boarding schools had the major responsibility for passing on the sign language. Beginning in 1906, the associations added a new aspect to the deaf community by providing a place where deaf adults could meet together regularly. Deaf associations in various cities began to get together for sporting and cultural events, which undoubtedly helped unify the language to some degree. Since the 1950s, the deaf communities have had a national federation (confederation) and later regional federations, as well as economic and political freedom to be able to have regular contact outside of their own region. Greater contact means that more deaf people are becoming aware of the unique signs in the different regions, yet there does not seem to be a strong trend toward adopting new signs from other regions.
32 Rather than manually spelling a person’s name, deaf people refer to each other by using signs. A sign name often has something to do with a person’s physical appearance, such as “hook-nose” or “curly hair.”

63
Figure 16. Bilbao signs for numbers 11 to 19.
11 12 13
14 15 16
17 18 19

64
Figure 17. Bilbao signs for numbers 20 to 100 (by multiples of ten). In conclusion, we find that the two oldest public schools as well as the oldest deaf organizations have been located in Madrid and Barcelona. Although the deaf community is currently dispersed throughout the major cities of the country, Madrid and Barcelona continue to be central locations for the nation’s deaf population. There is a great need to learn more about the history of the deaf community in Spain and the evolution of the language that came about as a result of the historical events.
20 30 40
50 60 70
80 90 100

65
Other factors
Patterns of contact Each deaf community has more contact with some communities than with others. Regular contact with other areas can help people learn the signs that are different in those areas. This contributes to what we discussed earlier as acquired intelligibility—the ability to understand another dialect because of repeated exposure to the second dialect. This exposure to other dialects affects the development of the language. People learn signs from other areas, and occasionally, they decide that the new sign expresses the idea better than their own sign, or they adopt a new sign because their own dialect doesn’t have a specific sign to express that concept. Sometimes the youth adopt a new sign just to be different, and that sign is integrated into the “mainstream” of the sign language at a later time. The patterns of contact (who interacts with whom) affect both the current language situation and also the future development of the language. The patterns we noticed are: Every region has some contact with Madrid. The confederation is located in Madrid and members of it are often asked to speak at special events throughout the country. A weekly half-hour television program in sign language, “En Otras Palabras,” is also aired from Madrid, giving the deaf throughout much of the country ongoing contact with the Madrid dialect. Andalucía has more contact with the neighboring regions of Murcia and the central regions than it does with the northern regions or Cataluña. Most regions have some contact with Andalucía through the television program “TeleSigno,” a weekly half-hour program of world and local news mixed with issues relevant to the deaf community. The program is signed in the Andalucían dialect and is aired only in southern Spain, but copies of the programs are mailed to many of the federations and associations around the country. The northern communities, Galicia, Asturias, Cantabria, and País Vasco, have more contact with each other than they do with the central and southern communities. Valencia and Cataluña often participate in activities together. In conclusion, as a result of these patterns of contact, each dialect appears to share some similarities and acquired intelligibility with its neighboring communities. There should also be some familiarity across the country with signs originating in Madrid and Andalucía. Demographics Demographics have some effect on the evolution of the language. Approximately one of every thousand infants (or 0.1 percent) is born deaf, either because of hereditary deafness (one in 4,000) or prenatal illness (Fernández circa 1986). In addition, one of every thousand children (0.1 percent) becomes profoundly deaf prior to the age of 19 (Schein and Delk 1974).33 These figures place the
33 This is based on a survey of the deaf Population of the United States, published in 1974. The survey noted that the onset of deafness prior to adulthood or the age of full-time employment will result in different psychological consequences from those which result from the onset of deafness after a person has been employed on a full-time basis.

66
prevocationally deaf population of Spain at approximately 80,000.34 Dense population areas have a greater likelihood of interaction between deaf people. The largest cities in Spain are Madrid, Barcelona, and Valencia. Madrid has a population of approximately 4,000,000. Based on the figure of 0.2 percent deaf in a population, there should be about 8,000 deaf individuals in this area. In Madrid, there are 14 deaf associations (not including the associations that are not affiliated to the federations, or the sporting associations, which are usually connected with a regular deaf association), whose membership represents between 30 and 40 percent of the deaf population.35 Most school-age deaf children are not members of the deaf associations, although more and more effort is being made by the associations to include the youth in their programs. In addition, some deaf people who are not currently members of a deaf association regularly get together with their deaf friends. There are, of course, oral deaf people who have learned to speak and read lips to the point that they feel that they are more a part of the hearing community than the deaf one. There are no statistics of how many people in Spain fit this category. The largest concentrations of deaf associations are located in and around Madrid and Barcelona. Each of these cities has 14 associations in the greater metropolitan area. No other city area has more than three associations. This fact reiterates what we have said before: Madrid and Barcelona appear to be important centers of deaf interaction.
National Politics National politics also play a part in the evolution of the language. Before the start of the Spanish Civil War in 1936, there was already an awareness of the Spanish deaf community. The National Federation was founded one month before the outbreak of the war. Although travel was nothing like it is today, there was some contact between the deaf communities around the country. However, the Civil War interrupted normal activities for three years. In 1939, General Francisco Franco began a dictatorship that lasted 36 years. During the 1940s, Spain was struggling to recover from the devastation of the Civil War. Only six new deaf associations were founded during those first ten years of Franco’s rule. During the Franco dictatorship, Madrid set the standards, including the use of Castilian Spanish as the language for all of Spain. Regional languages such as Catalán in Cataluña and Euskera in País Vasco were officially outlawed. Franco’s death in 1975 marked the beginning of a transition to a democratic rule. Gradually the regions were given autonomy, and many of the native languages were reinstated as official languages within those regions. Political groups within several regions have pushed for further autonomy or even independence from Spain, with the strongest separatist movement coming from País Vasco. Although political elements in other regions (for example, Cataluña) are also seeking a higher degree of autonomy, they are choosing to do so in a more diplomatic way.
34The figure often quoted for deaf people in Spain is 120,000 (0.3 percent of the population). It is not clear from where this number comes or if the age of onset is considered. However, this figure does not include those who became deaf as a result of the natural aging process. 35 This figure is approximate, since some hearing people belong to these associations as well, and some deaf people belong to more than one association.

67
Sign language was never specifically prohibited in Franco’s language policies, nor was Madrid’s variety pushed forward as the standard. Even so, deaf people were reluctant to accept any dialect as THE standard for sign language. Signers (just like people in the hearing communities) have the attitude that each region has the right to use its own variety of sign language without being forced to conform to some outside standard. Spanish politics, just like other aspects of Spanish life, point to regional distinctions. The regions with the strongest trends toward distinction among the hearing community are País Vasco and Cataluña; among the deaf, this trend is much stronger for Cataluña than for any other region.
Geography Spain covers an area of 505,990 square kilometers, and all areas are fairly accessible. However, this has not always been the case. The older generation remembers the days when travel across the country was difficult, expensive, and time consuming. Now the deaf community has opportunities for contact with other communities that the older generation did not have. As discussed earlier, these patterns of contact affect the language by increasing the acquired intelligibility and the general acceptance of regional differences.
Conclusions
Dialect and Language Boundaries Sociolinguistic factors add a few more pieces to the puzzle of dialect and language boundaries. Attitudes show that the deaf in Cataluña consider their variety of signing a separate language from the rest of Spain. While the rest of the country agrees that the signing in Cataluña is very different, there is no general agreement that the variety should be considered a separate language. However, all locations except Cataluña consider their own dialects to be part of what is called LSE. In the lexical and intelligibility studies discussed previously, Cataluña stood out as different from the rest, but not to the point that we could state definitively that it is a separate language. When we consider attitudes, there is enough evidence from within Cataluña and from the other regions of Spain that LSC could legitimately be called a separate language. Historical concerns show that Madrid and Barcelona are the two oldest “centers”; they had the first schools for the deaf and deaf associations. They continue to be central locations for the nation’s deaf population. Patterns of contact show that each dialect shares some similarities and acquired intelligibility with those of neighboring communities. There is also some familiarity across the country with signs originating in Madrid and Andalucía. Demographics show that the largest centers of deaf population are in Madrid and Barcelona. This correlates with the historical factors that show these two cities to be important centers in the Spanish deaf community. Political factors show that there is a trend toward recognizing regional distinctions in the sign language. The community with the strongest attitudes in this respect is the deaf community in Cataluña. All these factors combined show that it may be appropriate to consider Spanish Sign Language (LSE) and Catalan Sign Language (LSC) distinct languages. Under this interpretation, LSE is comprised of a number of distinct dialects such as those of País Vasco, Valencia, Galicia, and Madrid. The central locations of the two languages are Madrid for LSE and Barcelona for LSC.

68
We must stress here that these conclusions are our interpretation of the data we gathered. Ultimately, it is the deaf community who will make the decision to consider LSE and LSC as members of the same language or separate languages. Our conclusion in no way denies that the two varieties are similar. As one deaf person from Barcelona told us, the two languages and the two communities need to work together for their common goals. Because the languages are very similar, there is much that the two communities can learn from each other.
Implications for the Future The sociolinguistic factors presented here can be used to help predict trends in the continuing development of the language. The trends we see are as follows:
• There is a movement toward integration policies and away from all-deaf schools in education. The use of sign language may continue in some classroom situations, particularly as deaf leaders push for bilingual education. Nevertheless, the responsibility for teaching deaf children to sign will fall more and more on the shoulders of the deaf associations.
• The attitudes we have noticed show that there is no likelihood of any serious unification
of the sign language between regions. Few deaf people need to leave their region to obtain education, and deaf associations are providing more of the sign language instruction than previously. These factors imply that the differences between regions will likely increase rather than decrease.
• Patterns of contact show that even though the regional differences are sure to continue,
more people will become familiar with the differences throughout the country, thus increasing the ability to communicate freely across the dialect and language boundaries.
This study has examined the language and dialect variation throughout Spain. We have looked at lexical comparisons, intelligibility tests, and some sociolinguistic factors with the hope of gaining a balanced picture of the language situation. However, there is much we have left unstudied. We have only scratched the surface of each of these important areas of study; we have not begun to examine the massive topic of potential grammatical differences that may exist between regions. Also, it is imperative that others conduct similar studies in other countries in order to validate or refute our conclusions in this study. Several theoretical questions have been raised by this study. We saw that intelligibility between dialects (and languages) was unexpectedly high considering the drastic lexical differences. Are sign languages inherently more intelligible than spoken languages? If so, what is it that makes them more intelligible? And does that change our criteria for distinguishing between dialects and languages? This study cannot answer these questions, but we do hope that it will open the way for further studies of this type so that the nature of sign languages can be more fully understood. By writing this paper, we hope to help raise awareness of the rich variety in the sign language situation in Spain. We hope that Spaniards in the academic community will recognize LSE and LSC as living and dynamic languages worthy of careful investigation and documentation. As we have traveled around the country, we have been greatly encouraged by the interest deaf people have in studying their own language, and we have been grateful for the opportunity to join them in this endeavor.

69
Appendix A
Example wordlist in SignWriting

70
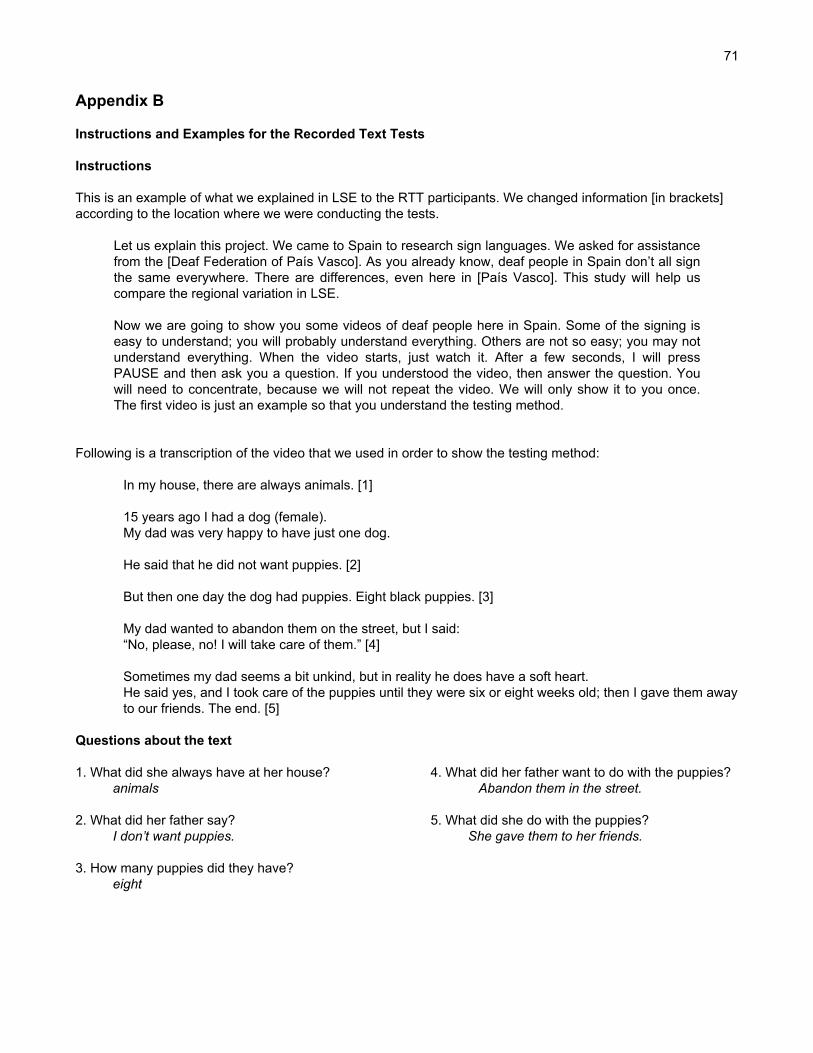
71
Appendix B
Instructions and Examples for the Recorded Text Tests
Instructions This is an example of what we explained in LSE to the RTT participants. We changed information [in brackets] according to the location where we were conducting the tests.
Let us explain this project. We came to Spain to research sign languages. We asked for assistance from the [Deaf Federation of País Vasco]. As you already know, deaf people in Spain don’t all sign the same everywhere. There are differences, even here in [País Vasco]. This study will help us compare the regional variation in LSE.
Now we are going to show you some videos of deaf people here in Spain. Some of the signing is easy to understand; you will probably understand everything. Others are not so easy; you may not understand everything. When the video starts, just watch it. After a few seconds, I will press PAUSE and then ask you a question. If you understood the video, then answer the question. You will need to concentrate, because we will not repeat the video. We will only show it to you once. The first video is just an example so that you understand the testing method.
Following is a transcription of the video that we used in order to show the testing method:
In my house, there are always animals. [1] 15 years ago I had a dog (female). My dad was very happy to have just one dog. He said that he did not want puppies. [2] But then one day the dog had puppies. Eight black puppies. [3] My dad wanted to abandon them on the street, but I said: “No, please, no! I will take care of them.” [4] Sometimes my dad seems a bit unkind, but in reality he does have a soft heart. He said yes, and I took care of the puppies until they were six or eight weeks old; then I gave them away to our friends. The end. [5]
Questions about the text 1. What did she always have at her house? animals 2. What did her father say? I don’t want puppies. 3. How many puppies did they have? eight
4. What did her father want to do with the puppies?
Abandon them in the street. 5. What did she do with the puppies? She gave them to her friends.

72
Bilbao Text (Signed by José Martín Sáenz, April 27, 1996)
A year ago, I went with three friends on a trip to Huesca. What did we decide to do? Go hiking. [1] The three of us agreed and we went. We set up the tent, and I pounded in the pegs. Good. The plan was to sleep there that night and then early in the morning get up about 7:30. [2]
1
2

73
The three of us got up and prepared breakfast. “Come on, let’s go.” We hiked uphill to a river. There at the river, did I hike in the river? No. We put on life jackets and wet suits specially adapted for hiking. The river went through a canyon; climbing over sandbanks, we went down the canyon. Name C-A-Ñ-O-N-E-S canyons. The three of us agreed to climb over rocks, swim in the rapids, get out and hike some more, then swim some more. We came to a cliff.

74
We tied ropes onto ourselves and rappelled down the cliff and continued on. Then it happened that we met a hearing person. No, not that time—there were two hearing people that met us. “Hello, do you know this river?” “Yes.” [3] “Would you like to go with us for a little bit?” The two hearing guys said, “We are in a hurry.” And off they went. “Well, go on then.” We continued on until we came to a waterfall that was about five meters high. [4]
3
4

75
I jumped in, held my nose, arms to my side and jumped into the small pool. We continued on. Then we came to a place where it was about a meter and a half, or maybe two meters in height. I looked down. “That will be easy.” I jumped. But instead I broke my leg. [5] The water in the pool fooled me, acting like a magnifying glass. Really, the rock was closer than it seemed. It deceived me.
5

76
I jumped in and broke my leg. That’s it. I couldn’t move. How was I supposed to continue on like this? I couldn’t continue. I couldn’t go back up the steep way behind us. I had to keep on going down. The three all helped me. A hearing person came and helped me, grabbing me and carrying me all the way down the canyon until we got to a perfect place. [6] I lay down next to a wall and waited. One hearing guy went by himself down the canyon. I asked: “What is he going to do?”
6

77
“He went to call for a helicopter.” [7] Meanwhile, I rested and waited, shivering. My leg was broken, and I couldn’t do anything. I waited until the helicopter came. Two Civil Guards came down out of the helicopter [8] and wrapped up my leg; just like professionals, they did excellent work. I wasn’t sure what to do. When they were done, they put me on a stretcher. They dropped down a cord from the helicopter and fastened it to me. Then the two Civil Guards climbed on and they lifted us all up. They put me in the helicopter, and we flew away.
7
8

78
They carried me to the hospital. With my broken leg, I sat down. People asked me, “What happened?” They thought that I was French, because I mixed up the order of the words as I spoke. [9] “You must be French.” “No, really, I am only deaf.” My words and grammar were all mixed up like the French. “No, I really am Spanish. I’m deaf.” Once everything was clear, they bandaged up my leg. That’s it. I had to have my leg in traction for four months. [10] Even now this leg is still not completely well. The end.
9
10

79
Questions 1. What did the three decide to do? Go hiking 2. What was their plan? Sleep there and then get up early. 3. When they met two hearing guys, what did they ask? Do you know this river? 4. How high was the place where he jumped from? Five meters, more or less. 5. José Martín jumped the two meters, then what happened to him? He broke his leg. 6. Where did they wait? In an open area, perfect to lie down in. 7. What did the hearing guy go to do? Call a helicopter. 8. Who came with the helicopter? Two Civil Guards. 9. What did they ask him when he got to the hospital? Are you French? 10. How long did he have his leg in traction? Four months.

80
Appendix C
Manual alphabets in Spain
Melchor de Yebra’s manual alphabet, 1593

81
Juan Pablo Bonet’s manual alphabet, 1620
A C
D F E
G
B
H I J
L M N
O P Q
R T S
U X Y
Z

82
Current manual alphabet
A C
D or D
CH
F E
H
G
B
I J
K L LL M
N Ñ O or O P

83
Q
S
R or R
T
RR or RR
X or X
U V W
Y Z

84
References Bickford, Albert J. 1991. Lexical Variation in Mexican Sign Language. Sign Language Studies
72:241–276. Blair, Frank. 1990. Survey on a Shoestring: A Manual for Small-Scale Language Surveys. Dallas:
Summer Institute of Linguistics and the University of Texas at Arlington. Casad, Eugene H. 1974. Dialect Intelligibility Testing. Dallas: Summer Institute of Linguistics. Chaves, Teresa L., and Jorge L. Soler. 1974. Pedro Ponce de Leon, First Teacher of the Deaf. Sign
Language Studies 5:235–248. Chaves, Teresa L., and Jorge L. Soler. 1975. Manuel Ramirez de Carrion (1579–1652) and his
Secret Method of Teaching the Deaf. Sign Language Studies 8. Confederación Nacional de Sordos de España. 1994. Faro de Silencio, No. 143. Leon, Spain. Crabtree, M., and J. Powers, compilers. 1991. File 120—Regional Variation: The Origin of
American Dialects. Language Files: Materials for an Introduction to Language. Columbus: Ohio State University Press.
Federació de Sords de Catalunya. 1996. IX Dia Internacional del Sord a Catalunya. Fernández, Vincente Fernellós. circa 1986. Causas de la Sordera. Campaña de Deteccion Precoz
de la Sordera. Madrid: Federación Española de Asociaciones de Padres y Amigos de los Sordos.
Gregory, Susan, and Gillian M. Hartley, eds. 1991. Constructing Deafness. Trowbridge, Wiltshire:
Open University. Grimes, Joseph. E. 1995. Language Survey Reference Guide. Dallas: Summer Institute of
Linguistics. Gudschinsky, Sarah C. 1956. The ABCs of Lexicostatistics (Glottochronology), Word 12:175–210. Kyle, James. G., and Bencie Woll. 1985. Sign Language, the Study of Deaf People and their
Language. Cambridge: Cambridge University Press. Lawson, Lilian. 1981. The Role of Sign in the Structure of the Deaf Community. In Gregory and
Hartley. 31–34 Lewandowski, Theodor. 1992. Diccionario de Lingüística, Tercera Edición. Madrid: Catedra
Lingüística. O’Leary, Clare F. 1994. The Role of Recorded Text Tests in Intelligibility Assessment and
Language Program Decisions. Notes on Literature in Use and Language Programs, special issue 3:48–72.

85
Plann, Susan. 1993. Pedro Ponce de León: Myth and Reality. Deaf History Unveiled: Interpretations from the new scholarship. John Vickney Van Cleve, ed. Washington, D.C.: Gallaudet University Press. 1–12.
Poplin, D. E. 1972. Community: A Survey of Theories and Methods of Research. New York:
MacMillan. Rodríguez González, María Angeles. 1992. Lenguaje de Signos. Madrid, Confederación Nacional
de Sordos de España y Fundación ONCE. Schein, Jerome D. (Director), and Marcus T. Delk, Jr. 1974. The Deaf Population of the United
States. Silver Spring: The National Association of the Deaf. Scott, John. 1991. Social Network Analysis: A handbook. Thousand Oaks: SAGE Publications Inc. Summer Institute of Linguistics. 1991. Language Assessment Criteria Statement, Notes On
Scripture in Use and Language Programs 28:44–48. Swadesh, Morris. 1950. Salish Internal Relationships. International Journal of American Linguistics
16:157–167. Voegelin, C. F., and Zellig S. Harris. Methods for Determining Intelligibility among Dialects of
Natural Languages. Proceedings of the American Philosophical Society 95:322–29. Van Cleve, John Vickney (ed.) 1993. Deaf History Unveiled: Interpretations from the new
scholarship. Washington, D.C.: Gallaudet University Press. Woodward, James. 1978. Historical Bases of American Sign Language. In Understanding
Language Through Sign Language Research, ed. P. Siple. NY: Academic Press, 333–348. Woodward, James. 1991. Sign Language Varieties in Costa Rica. Sign Language Studies 73:329–
346. Woodward, James. 1993. The Relationship of Sign Language Varieties in India, Pakistan, and
Nepal. Sign Language Studies 78: 15–22. Woodward, James. 1996. Modern Standard Thai Sign Language, Influence from ASL, and its
Relationship to Original Thai Sign Varieties. Sign Language Studies 92: 227–252.