spanish flu in st. louis, missouri: a demographic …
TRANSCRIPT

SPANISH FLU IN ST. LOUIS, MISSOURI:
A DEMOGRAPHIC ANALYSIS
_______________________________________
A Thesis
presented to
the Faculty of the Graduate School
at the University of Missouri-Columbia
_______________________________________________________
In Partial Fulfillment
of the Requirements for the Degree
Master of Arts
_____________________________________________________
by
WHITNEY BROOKE COFFEY
Dr. Mark Flinn, Thesis Supervisor
JULY 2013

The undersigned, appointed by the dean of the Graduate School, have examined the thesis
entitled
SPANISH FLU IN ST. LOUIS, MISSOURI: A DEMOGRAPHIC ANALYSIS
presented by Whitney B. Coffey,
a candidate for the degree of Master of Arts
and hereby certify that, in their opinion, it is worthy of acceptance.
Dr. Mark Flinn
Dr. Lisa Sattenspiel
Dr. Keona Ervin

ii
ACKNOWLEDGEMENTS
I would like to thank Dr. Mark Flinn for guiding me through the graduate school
and thesis writing experience. Over the course of the past two years he’s offered guidance
and prompted thoughts and ideas that never would otherwise occurred to me. I am in his
debt and grateful his advisement.
Dr. Lisa Sattenspiel has fostered my interest in demography and medical
anthropology. Through her tutelage I have developed sound research habits and a more
scientific writing style. I can’t believe I was lucky enough to have a recognized expert on
influenza on my committee!
Dr. Keona Ervin allowed me to look at my overall thesis through new eyes. Instead
of focusing purely on biology and science, she encouraged me to spend time factoring the
social realities of the time period I’ve studied. Her perspective was much needed and is
much appreciated.
Dr. Todd Van Pool was instrumental in the quantification of my data. His
explanation of which statistical tests should be used and why gave my thesis credibility. I
am grateful for his patience and never-ending optimism.
Finally, I’d like to thank Rachel Albert and Michelle Oswald for providing constant
feedback throughout the thesis writing process. They suffered through many drafts with
me and my work is much better for it.

iii
TABLE OF CONTENTS
ACKNOWLEDGEMENTS……………………………………………………………… ii
LIST OF FIGURES ……………………………………………………………………...iv
LIST OF TABLES ………………………………………………………………………..v
ABSTRACT……...………………………………………………………………………vi
INTRODUCTION………………………………………………………………………...1
The 1918 Influenza Epidemic……………………………………………………………..2
A Novel Strain…………………………………………………………………………….4
Evolved Virulence………………………………………………………………………...5
Cytokine Storm……………………………………………………………………………6
Patterns of Infection……………………………………………………………………….7
Study Site: St. Louis, Missouri……………………………………………………………8
MATERIALS AND METHODS……………………………………………………….....9
RESULTS………………………………………………………………………………..12
DISCUSSION……………………………………………………………………………24
Quick and Decisive Action………………………………………………………………24
Educating the Public?........................................................................................................26
Environmental and Behavioral Factors Impacting Flu Mortality………………………..28
Explaining Environmental Differences in St. Louis……………………………………..34
CONCLUSION…………………………………………………………………………..36
LITERATURE CITED…………………………………………………………………..40

iv
LIST OF FIGURES
FIGURE PAGE
1. Mortality figures: World Wars I & II versus 1918 flu………………………………….1
2. Percentage of total P & I deaths per week (October-December 1918)………………..14
3. Weekly percentage of total P & I deaths in St. Louis (October-December 1918)…….18
4. Age specific death rate from flu in U.S.A in 1918……………………………………21
5. Age specific death rate from flu in St. Louis (October-December 1918)……………..21
6. St. Louis P & I deaths per age category (October-December 1918)………………….22

v
LIST OF TABLES
TABLE PAGE
1. P & I death totals in St. Louis per week (October-December 1918)………………….15
2. Age standardized death rates from P & I in St. Louis (October-December 1918)……22
3. Chi-square table of weekly death rates due to P & I in St. Louis (October-December
1918)……………………………………………………………………………………..23
4. Two way ANOVA analysis of variation in P & I death rate ages 0-4 (October-
December 1918) in St. Louis…………………………………………………………….24

vi
SPANISH FLU IN ST. LOUIS, MISSOURI: A DEMOGRAPHIC ANALYSIS
Whitney B. Coffey
Dr. Mark Flinn, Dissertation Supervisor
ABSTRACT
It is well known that the Spanish Flu pandemic of 1918 was disastrous worldwide and
many large-scale studies have shown interesting and unusual demographic trends related
to the pandemic. By analyzing the impact of the Spanish Flu at a smaller scale
researchers will be able to draw more definite conclusions about the demographic results
and consequences of the pandemic. Doing so can also serve a function in forming modern
public health policy. This analysis presents demographic information for St. Louis City,
Missouri from the last three months of 1918, during the second wave of the pandemic.
Death records found online through the Office of the Secretary of State of Missouri were
used to collect demographic data for the specified period of time. Analyses of different
demographic categories including age, race, sex, and citizenship were conducted and
possible explanations for the results are posited.

1
Introduction
The influenza pandemic of 1918 was one of the deadliest events in modern
history. Estimates of the worldwide death toll from Spanish Flu now range from 20 to
100 million (Chowell et al. 2006). These numbers become even more poignant when
compared to other catastrophic events occurring at the same period in history. Kolata
(2001) compares 1918 flu mortality to that of the two world wars, and the difference is
staggering (Figure 1).
Figure 1. Mortality figures: World Wars I & II versus 1918 flu (Kolata 2001)
Despite the 100 years that have passed since 1918, scientists, historians, and
public health personnel still have many unanswered questions related to the pandemic
and its overall impact. By completing a demographic analysis (using historical and
0
5
10
15
20
25
WWI combat
deaths
WWI total deaths WWII combat
deaths
1918 flu deaths
(low end of
estimates)
Dea
ths
(in
mil
lio
ns)
Event

2
archival data) of St. Louis, a large urban city, more can be learned about specific
elements of the disease and its impact. Further, by breaking the population of St. Louis
into five distinct subpopulations, variation in flu mortality and experience can be
explored at a deeper level. While this approach is common in many demographic
contexts, relatively few analyses of the 1918 epidemic have been done at the city
subpopulation level (most have focused on the response of larger areas to flu). This type
of exploration should be relevant to public health procedure today and potential changes
that could positively affect the health of Americans. As this project will show, different
subpopulations within a single community can experience disease and health issues in
quite different ways. Many underlying and unrecognized factors can potentially
contribute to morbidity and mortality rates, program success, and overall healthiness of
an individual or group. By introducing specific policies and procedures that address these
issues at the subpopulation level, rather than at a population level, less variation in
response and impact should be seen, with more consistent positive results.
The 1918 Influenza Epidemic
In the United States, Crosby (2003) estimated that nearly one fourth of all
Americans experienced symptoms during the 1918 epidemic which would have been
clinically recognized as flu. In 1918, and today, it is difficult to accurately estimate the
number of true cases of Spanish Influenza that occurred in the United States. Decreased
rates of reporting due to a lack of physicians, inability to travel long distances, and
economic concerns related to lack of infrastructure cannot be accounted for when

3
estimating influenza morbidity. Influenza swept through the country, affecting
communities large and small in 1918. The seemingly innocuous disease, seen nearly
every year, was suddenly killing hundreds every day. What about the disease had
changed so dramatically that death rates during the pandemic were 5-20 times higher than
during a standard flu season (Taubenberger and Morens 2006)? It is well documented
that physicians were overwhelmed, both by the intense symptoms of the 1918 strain of
flu, and by the huge numbers of infected (Bristow 2003).
One cannot blame their confusion; common symptoms of the 1918 influenza
strain are described by Kolata as, “…frequently frightening, including, for instance,
discoloration of the extremities, labored breathing, a bloody or sputum ridden cough and
a face shaded to blue or purple, the last a result of patients drowning in their own bodily
fluids” (2001:49-50). Vanneste (2012) references a 1917 treatise by A.G. Shera,
published in The Lancet, that describes the confusion of some physicians when
confronted with the novel symptoms of a 1915 battlefield epidemic which would prove to
be very similar to those of Spanish influenza, “the older physician scarcely recognizes the
modern type of influenza as his old friend the 'knock-me-down-fever,' and therefore is apt
to overlook it, if not to despise it as unworthy of much attention.” Physicians were
obviously not treating a traditional yearly flu virus, and many noted larger than normal
proportions of flu with increased virulence during the 1915-1916 seasons, an ominous
foreshadowing of what was to come (Vanneste 2012).
We now know that this specific strain of influenza relentlessly attacked the
respiratory tract and lung tissue of its victims, infiltrating healthy cells well after the virus

4
had already replicated (Loo and Gale 2007). It was this attack of the lungs which
differentiated this 1918 strain of influenza from its precursors. Often victims did not
actually die from flu; they died of complications from pneumonia days or weeks after
contracting the virus. Crosby (2003) also notes that deaths unrelated to flu or pneumonia
were disproportionately high during the period of the pandemic, indicating that the virus
was a contributory factor in the deaths of many more. Those with chronic conditions
were more likely to succumb to either influenza as it exacerbated the chronic condition,
or that chronic condition itself during the 1918 epidemic. Collins (1932) found that there
was an 18% increase in excess deaths due to organic heart disease over the course of the
Spanish Flu epidemic of 1918-1919, as well as an 11% increase in excess deaths due to
nephritis.
There are several competing theories as to why the 1918 pandemic featured such
high mortality, though a conclusive determination has yet to be reached. Researchers
attribute the high mortality of the 1918 pandemic to a novel strain of flu (Ewald 2011),
the unique evolution of this particular flu strain (Ewald 2011), or the intense genetic
response of the human immune system to this strain (a cytokine storm) (Kobasa, et al.
2007), among other theories.
A Novel Strain
Some researchers view the Spanish Flu as a kind of novel disease where two or
more flu strains combined in a unique fashion. It is one of the hallmarks of a novel
disease to have high initial mortality, followed by a decreased level of virulence (Ewald

5
2011). Along with other features of a novel disease, the 1918 flu’s overall pattern (three
waves lasting over a year) does support the traditional routes of novel infectious diseases.
Populations, societies, and disease intervention evolve over time, much like influenza
strains, making it impossible to predict whether or not another pandemic analogous to the
1918 Spanish Flu could reoccur. That specific strain of flu persisted until the 1950’s and
the H1N1 flu scare of 2009 was a result of a descendent strain of 1918 flu (Morens, et al.
2009).
Evolved Virulence
A second theory that focuses on the enhanced virulence of the 1918 pandemic is
Ewald’s hypothesis regarding the evolution of this particular influenza strain. It is well
documented that Spanish Flu was introduced in a unique environment at the latter part of
1918. Oxford (2010) suggests that early cases of Spanish Flu were seen as early as 1916,
in the same army camps where Ewald (2011) posits this flu strain evolved (though his
hypothesis put the development later in time than Oxford, around 1918). Others
hypothesize that this particular flu strain developed in the United States and was
transferred to France with American troops entering the Great War. One conclusion is
certain, military camps across Europe saw high mortality from flu and it is probable that
it was in one of these camps that presented Spanish Influenza the opportunity to evolve
into the deadly flu strain that spread across the world (Ewald 2011). According to Ewald
circumstances related to the transport and close contact of influenza patients created an
evolutionary environment that spurred a rapid increase in virulence and mortality (Ewald

6
2011). Generally, a pathogen merely exploits the resources of their host, before infecting
another individual. Killing the host is not often beneficial, so that trend is rare in disease
evolution. However, in the military camps of the Great War there were ample individuals
available for infection, so the evolutionary path of this particular influenza strain did not
have to follow traditional routes. The packed army hospitals and sick wards of World
War I Europe allowed for the easier-than-normal transmission of flu strains from host to
host, making the death of the originally infected individual less of a concern. If the virus
was able to quickly find another host without having to inhabit their original host for an
extended period of time, a decrease in virulence is not necessary for the survival of the
pathogen strain.
Cytokine Storm
While Ewald’s theory can account for the evolution of Spanish Flu’s increased
virulence, it does not explain why the virus was so deadly to young adults and middle
aged citizens (who are usually the least susceptible to mortality from influenza). Recently
researchers have been conducting experiments using macaques to test a new hypothesis
related to the 1918 influenza pandemic (Kobasa et al. 2007). Several research groups are
trying to prove independently that the influenza strain from 1918 differentially affected
those with the strongest immune systems, generating something called a cytokine storm.
Basically, they posit that the immune system response to this strain of flu was much more
intense than necessary to fight off the pathogen. The virus triggered the increased
expression of genes in the innate immune system which cause inflammation, cytokines

7
and chemokines (Loo and Gale 2007). This caused damage to the lung tissue, leading to
many deaths, not from flu, but from pneumonia. This theory would explain why the
strongest, least likely flu victims had substantially higher rates of mortality during the
1918 epidemic than during normal flu epidemics, while subpopulations where high
mortality would be predicted (such as those with compromised immune systems) actually
had lower or only slightly higher mortality than expected, as seen with older age
categories in 1918. Those who had robust immune systems capable of fighting off
infection were actually at a disadvantage during the 1918 epidemic because of the subtle
way the virus caused the immune system to overexpress itself, leading to tissue damage.
Simply put, those most likely to contract influenza were sometimes less likely to die from
its effects, while those who were less likely to catch the disease were sometimes more
likely to succumb to its symptoms. This is exactly what was seen in St. Louis, Missouri.
Patterns of Infection
Another factor in the increased death tolls during the 1918-1919 pandemic was
the fact that in the United States the flu season was long lasting and came in three distinct
waves, beginning in spring 1918 with low mortality rates, and then re-occurring in the
fall with much higher than usual mortality (Carpenter and Sattenspiel 2009). Following
the dramatic second wave of infection, flu was seen again in early 1919, but mortality
rates were not comparable to the disastrous fall wave. By spring 1919, though some
lingering infections were seen, the pandemic threat of Spanish Flu in the United States
was over. This undulating trend of infection and partial herd immunity made St. Louis,

8
Missouri, a poor urban city, a natural target for the virus. Lower temperatures, humidity,
more indoor crowding, and lack of ventilation (Taubenberger and Morens 2006) made
urban populations, like those in St. Louis, particularly susceptible to influenza. As
Spanish Flu swept across the United States the reactions of urban centers varied
considerably, affecting the overall mortality in those areas. Though St. Louis seemed
primed for a devastating bout with the flu, city officials understood the probable effects
of the pandemic and planned accordingly. They were able to do so because St. Louis
experienced the fall wave of flu later than many other parts of the country, possibly
because of its insular location in the middle of the United States.
Study Site: St. Louis, Missouri
St. Louis provides an interesting case study of the 1918 pandemic for many reasons.
Most notably, soon after the pandemic reached its close, St. Louis was referred to as the
“model city” related to flu response because of its lower than average mortality rates (Jones
2010). Secondly, St. Louis (like other urban centers) was home to several distinct
subpopulations that experienced the pandemic in slightly different ways. These different
experiences (some more severe than others) led to varied outcomes related to overall
infection patterns and mortality for each subpopulation. Analysis of mortality from
influenza and pneumonia (as well as deaths where either was noted as contributing factor)
for five separate subpopulations were studied: males, females, African Americans, and
Caucasians, which were then subdivided into two more categories, immigrant whites and
native whites. Each of these populations was further subdivided into six age categories.
9
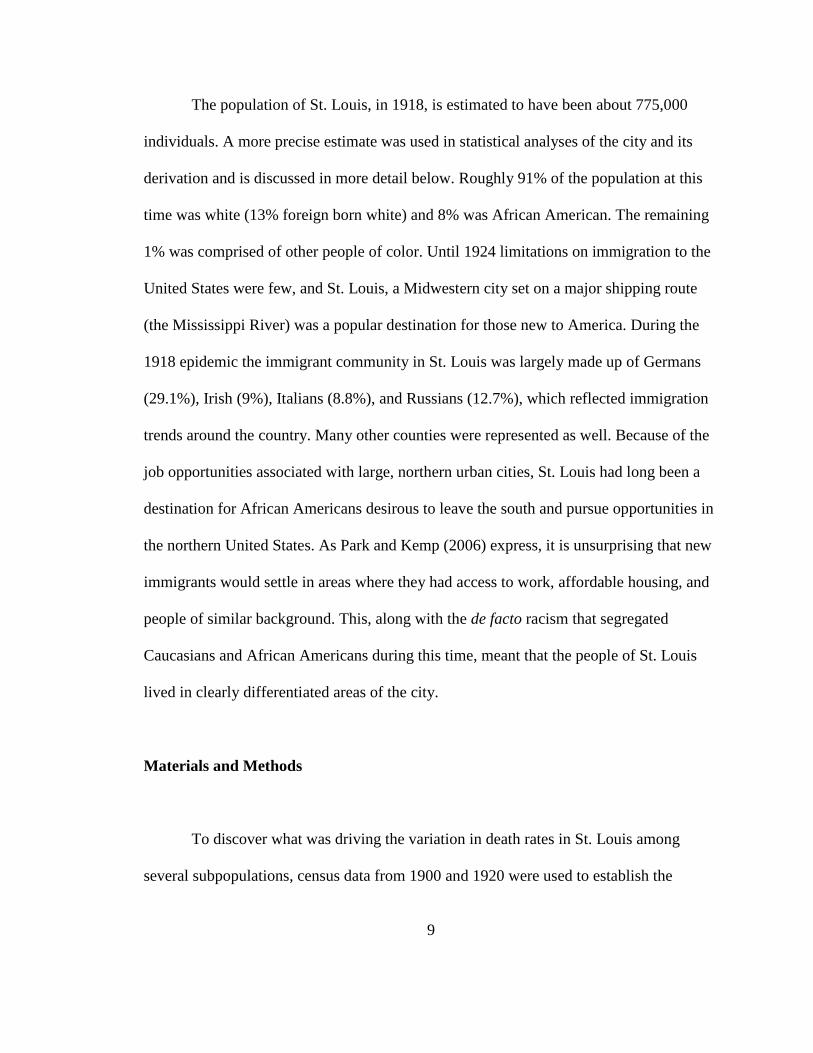
The population of St. Louis, in 1918, is estimated to have been about 775,000
individuals. A more precise estimate was used in statistical analyses of the city and its
derivation and is discussed in more detail below. Roughly 91% of the population at this
time was white (13% foreign born white) and 8% was African American. The remaining
1% was comprised of other people of color. Until 1924 limitations on immigration to the
United States were few, and St. Louis, a Midwestern city set on a major shipping route
(the Mississippi River) was a popular destination for those new to America. During the
1918 epidemic the immigrant community in St. Louis was largely made up of Germans
(29.1%), Irish (9%), Italians (8.8%), and Russians (12.7%), which reflected immigration
trends around the country. Many other counties were represented as well. Because of the
job opportunities associated with large, northern urban cities, St. Louis had long been a
destination for African Americans desirous to leave the south and pursue opportunities in
the northern United States. As Park and Kemp (2006) express, it is unsurprising that new
immigrants would settle in areas where they had access to work, affordable housing, and
people of similar background. This, along with the de facto racism that segregated
Caucasians and African Americans during this time, meant that the people of St. Louis
lived in clearly differentiated areas of the city.
Materials and Methods
To discover what was driving the variation in death rates in St. Louis among
several subpopulations, census data from 1900 and 1920 were used to establish the

10
population parameters of St. Louis, as direct data of the specificity required from the year
1918 is unfortunately unavailable. In order to estimate population figures, the population
difference between the year 1900 and the year 1920 was divided by 20 (the number of
years separating the two census counts). That figure was then multiplied by 2 and
subtracted from the 1920 population to estimate the population of St. Louis in 1918. This
approach assumes that the population of St. Louis was stable during this twenty-year
period, and it is recognized that this method introduces some error into all equations in
which population estimates are used. It should also be noted that all data used are related
to St. Louis City, which was distinguished from St. Louis County years before the 1918
influenza outbreak, in 1877 (The City of St. Louis 2013).
Using the Missouri Secretary of State’s online database every death record from
October, November, and December 1918 was analyzed to determine the cause of death. If
influenza or pneumonia was listed as the cause of death, or contributed to the death of the
individual, that death was categorized as a flu death. Synonyms for influenza (including la
grippe), and deaths denoted as ‘Spanish Flu epidemic’ and ‘epidemic flu’ were categorized as
cause specific influenza deaths. In addition to the cause and date of death, other information
was recorded related to the social and economic status of the decedent. This information
included: sex, race, age at death, occupation, address, place of birth, and whether or not the
decedent had been treated by a doctor or admitted to one of the local St. Louis hospitals.
Other information, such as familial relationships, was included when possible.
Statistical analyses were conducted to determine the significance of several
factors related to the overall influenza infection and mortality trends in St. Louis.

11
Standard t-tests were conducted among a series of subpopulations from St. Louis to
determine whether weekly death rates over the course of 14 weeks were significantly
different from each other.
Because of the increased probability of committing a Type II error in this specific
case, the alpha of these tests was increased from the traditional 0.05 to 0.10. A p-value so
near the designated alpha could indicate a value within the overlap of the two
populations, creating a statistically significant result when that is not actually the case. By
increasing the alpha there is less chance of misidentifying populations that are
significantly different from each other.
In order to compare flu mortality across different ages, age standardized death
rates were calculated for each of 6 different age categories. These calculations were made
using population data from the 1900 and 1920 US Censuses, where, again, the 1918
population total for a certain age category was calculated. The number of St. Louis flu
victims in that age category was then divided by the total population in the age category,
then multiplied by 1000, in order to standardize mortality rates. By computing these rates
direct comparison is possible across age categories with widely varying populations that
saw very different mortality rates during the pandemic of 1918.
After age standardized death rates were calculated for St. Louis influenza victims,
the data were used to conduct a Chi-Square test, looking for meaningful differences
between the occurrence of flu mortality in African Americans and Caucasians and the
interaction of subpopulation categorization and weekly mortality. Finally, a two way
ANOVA was conducted on deaths in the 0-4 age category to discern where variation was

12
occurring within the age category, from sub categorical differences (African American
versus Caucasian) or through the overall pattern of mortality.
Throughout the course of this paper “race” is used purely as a biological term;
“racialization” or “ethnicity” refers to the social construct that comes with grouping
people together based upon perceived common characteristics, and the results of that
grouping. To be clear, during the 1918 Spanish Flu epidemic there is no evidence that
either African Americans or Caucasians had any kind of biological or genetic adaptation
that made them more or less likely to contract or succumb to flu. Thus, race, in a
biological sense, cannot account for disparate mortality trends in St. Louis
subpopulations during this period of 1918, though at the time prevailing thoughts would
have supported this assumption. However, racialization, where groups at the bottom of
the ethnic hierarchy have low symbolic capital, resulting in discrimination in the labor
market, lack of economic opportunity, and other negative impacts based upon their
perceived social status (Grosfoguel 2004), most definitely played a role in how subgroups
in St. Louis responded to the 1918 Spanish Flu.
Results
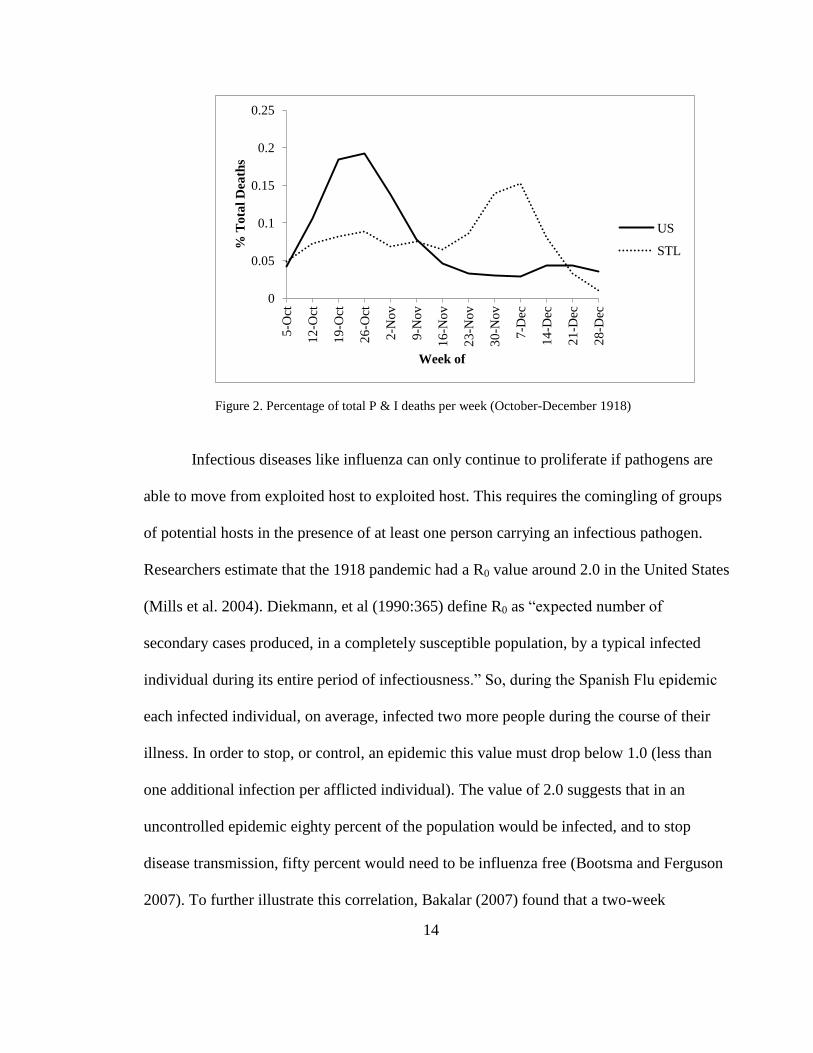
The timing of mortality due to influenza between the United States and St. Louis
differed greatly (Figure 2). The nation saw deaths peak toward the end of October,
decline sharply, and then rise a small amount again in December. This time span

13
represents the second wave of the 1918 influenza epidemic. St. Louis, on the other hand,
had many fewer deaths in October before the number of deaths peaked in early
December. As well as being a product of the inward movement of influenza across the
United States, this pattern is directly related to the quick and decisive action taken by St.
Louis city officials early in the epidemic, which included banning gatherings of large
groups of people. Bootsma and Ferguson (2007) cite early intervention as the most
important factor in decreasing excess mortality during the influenza epidemic. The peak
of mortality in St. Louis followed the disruption of quarantine on Armistice Day, which
could support this argument. When comparing the overall impact of flu in St. Louis to
other large urban areas, the differences due to early intervention are stark. The city did in
fact have cause-specific mortality rates (defined as death due to influenza and/or
pneumonia or cases in which either was contributory) lower than the aggregate United
States death rates as calculated from 48 large (those with populations over 100,000)
urban cities (3.8 deaths per 1000 people as opposed to the national rate of 4.8 deaths per
1000) (Crosby 2003). Comparatively, New York City had a mortality rate of 4.3 deaths
per 1000 people. Chicago’s death rate was 4.1 people per 1000 and Los Angeles
experienced mortality of 4.0 individuals per 1000 (Department of Commerce 1920).
14
Figure 2. Percentage of total P & I deaths per week (October-December 1918)
Infectious diseases like influenza can only continue to proliferate if pathogens are
able to move from exploited host to exploited host. This requires the comingling of groups
of potential hosts in the presence of at least one person carrying an infectious pathogen.
Researchers estimate that the 1918 pandemic had a R0 value around 2.0 in the United States
(Mills et al. 2004). Diekmann, et al (1990:365) define R0 as “expected number of
secondary cases produced, in a completely susceptible population, by a typical infected
individual during its entire period of infectiousness.” So, during the Spanish Flu epidemic
each infected individual, on average, infected two more people during the course of their
illness. In order to stop, or control, an epidemic this value must drop below 1.0 (less than
one additional infection per afflicted individual). The value of 2.0 suggests that in an
uncontrolled epidemic eighty percent of the population would be infected, and to stop
disease transmission, fifty percent would need to be influenza free (Bootsma and Ferguson
2007). To further illustrate this correlation, Bakalar (2007) found that a two-week
0
0.05
0.1
0.15
0.2
0.25
5-O
ct
12
-Oct
19
-Oct
26
-Oct
2-N
ov
9-N
ov
16
-No
v
23
-No
v
30
-No
v
7-D
ec
14
-Dec
21
-Dec
28
-Dec
% T
ota
l D
eath
s
Week of
US
STL

15
difference in response times is significant enough to see influenza infection rates double
three to five times. This is easily confirmed through the 1918 epidemic, as once infection
began to spread it was increasingly difficult to contain. As Bootsma and Ferguson (2007)
point out, it was the ability to sustain these containment efforts that made the biggest
difference in death rates. This is where St. Louis officials fell short, despite their quarantine
efforts. Infection and deaths rose steadily and peaked in early December after city officials
failed to enforce a city quarantine in order to celebrate Armistice Day. Crowds gathered to
celebrate the end of World War II in Europe, providing an ideal setting for infected
individuals who may not yet have been experiencing flu symptoms, to pass the influenza
virus to other members of the crowd. Officials quickly realized the magnitude of this
quarantine disruption, when after a few days of people comingling death rates again began
to rise. The damage had been done (Table 1).
Table 1. P & I death totals in St. Louis per week (October –December 1918)
Week of White
Native
White
Immigrant
White
African
American
1-Oct 27 17 6 6
8-Oct 109 82 17 31
13-Oct 171 127 36 40
20-Oct 202 154 40 34
27-Oct 219 164 46 37
3-Nov 182 125 49 19
10-Nov 200 134 57 18
17-Nov 166 134 30 21
24-Nov 230 172 47 19
1-Dec 373 300 62 32
8-Dec 411 317 60 30
15-Dec 212 157 35 21
22-Dec 78 59 14 17
29-Dec 21 17 3 8
2601 1959 502 333

16
Differences in mortality patterns over the course of October, November, and
December 1918 can also be seen within the subpopulations of St. Louis (Figure 3).
African Americans experienced higher mortality rates early in the second wave of the
epidemic, followed by a sharp decrease in mortality, minimal stabilization through
November, punctuated with another peak in mortality in early December. Caucasian
death rates were lower in the first few weeks of the epidemic, but then much more
pointed than those of African Americans. Native whites and immigrant whites follow
similar patterns, though there is an anomalous increase in overall mortality during the
beginning of November for the immigrant population. Presumably some type of cultural
or environmental tradition recognized by some faction of the immigrant community, but
not native whites, was observed in the weeks prior to this anomalous increase. This
would explain the increase in mortality for this subgroup exclusively. All subpopulations
see a significant decrease in the number of deaths from influenza the last weeks of
December, as was the trend across the country. This is where the second wave of
infection drew to a close before reemerging during the shorter and less deadly third wave
in early 1919.
The cause specific death rate from flu (and contributing disease) during the last
three months of 1918 (during the second wave of influenza) for Caucasians in St. Louis
was 3.8 deaths per 1000 Caucasian people (3.20 deaths per 1000 for native whites). The
African American death rate, on the other hand, was around 5.1 deaths per 1000 African
American citizens, a rate nearly one and half times higher than a different demographic

17
subgroup living in the very same city. However, when you note the death rates of
immigrant whites in the city (4.8 deaths per 1000), it becomes clear that race is not the
main factor driving the variation, though racialization of these two populations most
definitely played a role. Statistical analyses show that there was not a significant
difference in weekly death rates between African Americans and white immigrants in St.
Louis. Additionally, the differences between male (4.07 deaths per 1000 males) and
female cause specific death rates (3.58 deaths per 1000 females) are negligible, though
there were interesting differences in the disease pattern between the two (males had much
higher death rates during the month of October before rates evened out in November).
This could be explained by traditional labor constructs where, at this time in history,
males provided for the family through the workforce, while women generally did not
seek employment outside the home (this was not always the case, especially for lower
income families). All subcategories followed this trend, with the cause specific death rate
of males being only slightly higher than that of females. Clearly in 1918 sex did not
dramatically affect mortality rates related to Spanish Flu.
Stark differences become apparent related to age, though, when deaths are
organized into set age categories. Not only did St. Louis buck the national trend regarding
death rates and patterns, within the city subpopulations exhibited differential death rates
and patterns. For all categories, except for native whites, the highest mortality was seen
in the 0-4 age category, which was not unexpected. The young often experience the
highest mortality during a regular flu season. All subgroups saw high mortality in the 20-
44 age group, one of the unique and defining characteristics of the 1918 flu epidemic.

18
Interestingly, it was immigrant whites, not African Americans, who were the hardest hit
in this category, which could be explained by their higher overall population in St. Louis
at this time.
Figure 3. Weekly percentage of total P & I deaths in St. Louis (October-December 1918)
These different patterns of mortality further emphasize that each subpopulation in
St. Louis responded to the Spanish Flu a bit differently. This assertion is qualified
through a series of statistical evaluations determining the relative similarity or difference
of subgroups to one another. Initial t-tests showed that African Americans and
Caucasians in St. Louis had weekly mortality rates that were only slightly significantly
different (1.5>1.3 p=0.07, alpha=.10). However, if you further subdivide the Caucasian
population based on citizenship, there is a statistically significant difference in weekly flu
mortality between native white and African American populations in St. Louis
0
0.02
0.04
0.06
0.08
0.1
0.12
0.14
0.16
0.18
1-Oct 1-Nov 1-Dec
% T
ota
l D
eath
s
Date
Uncharacterized
Whites
Native Whites
Immigrant Whites
African Americans

19
(3.08>1.71; p=0.02; alpha=.10). The notion that these differences are a result of race
alone is erroneous, proven by the lack of difference in mortality rates between immigrant
white and African American subgroups (1.17<1.71; p=0.38; alpha=.10). There is also a
slight significant difference between native whites and immigrant whites (1.756>1.705;
p=0.06; alpha=.10) further indicating an environmental or behavioral cause for
differential mortality, not a racial explanation.
Additionally, no significant difference was discerned between men and women’s
weekly influenza mortality rates in St. Louis (0.60<1.7; p=0.275; alpha .05), which
invalidates theories that cite sex as a factor for increased or decreased flu mortality in
1918. As analyses show, it was not race (in a biological sense) or sex that increased the
likelihood of mortality, but age and the sociocultural environment (the way in which an
individual was able to interact with their environment based on perceived social status
and cultural beliefs and trends) in which a St. Louis citizen lived. As noted by Carpenter
and Sattenspiel (2009:290),”sociocultural factors within the community determine the
overall severity of the epidemic once it got into a community.” This was most definitely
the case in St. Louis.
These t-tests yielded expected results, with African American and immigrant
white populations having weekly death rates significantly different from the native white
population. The weekly death rates of African Americans and immigrant whites,
however, were not significantly different from each other, indicating an environmental or
behavioral cause for differential mortality among groups, rather than a racial explanation
exclusively.

20
Most puzzling, though, relative to standard influenza trends, were the differential
death rates in separate age categories during the 1918 influenza pandemic. These notable
differences were seen worldwide, and the case is no different in St. Louis, MO. When
examining the fatality distribution of most flu seasons, a U-shaped distribution (high
mortality for infants and the elderly, and much lower mortality for young and middle
aged adults) is seen. However, in 1918 there is an anomalous W-shaped distribution of
mortality in the United States (Figure 4), with an additional peak in mortality for young
adults and the middle aged. Though some of the shape has been lost because of larger
than desirable age categories, the trend can certainly be seen in St. Louis (Figure 5). All
subgroups have the highest age-standardized death rates in children aged 0-4. ASDRs
then decline until rising again after age 14. There is another mortality peak in adults aged
20-44, then mortality declines for ages 45 and up. Worldwide Taubenberger and Morens
(2006) report that influenza deaths for ages 15 to 34 were up to twenty times higher than
expected during the 1918 pandemic. Though the ASDRs for older individuals were
anomalously lower in 1918 than in previous flu seasons, should the age categories have
been smaller, another peak would have been seen in older individuals. Morens and
Taubenberger (2011) attribute this anomaly, in part, to acquired immunity garnered from
influenza epidemics in the 1830’s and 1840’s (where significant mortality came from
older individuals with preexisting conditions; children of this era would have remained
largely unaffected in terms of mortality).

21
Figure 4. Age specific death rate from flu in the U.S.A. in 1918 (Linder and Grove 1943)
Figure 5. Age specific death rate from flu in St. Louis (October-December 1918)
0
500
1000
1500
2000
2500
Sp
ecif
ic D
eath
Rat
e (p
er 1
00
,00
0)
19
18
Age Category
0
1
2
3
4
5
6
7
8
0-004 005-09 010-15 15-19 20-44 45+
Sp
eifi
c D
eath
Rat
e (p
er 1
00
0)
Age Category

22
Table 2. Age standardized death rates from P & I in St. Louis (October-December 1918)
Age Sex
Demographic Group
Uncharacterized White Native White Immigrant White African American
0-4 M 5.87 4.21 19.92 19.2
F 5.87 3.89 20.58 16.69
5-9 M 0.95 0,95 0 3.31
F 1.57 1.5 2.99 2.77
10-15 M 0.68 0.68 1.07 0.46
F 0.96 0.85 2.02 0
15-19 M 2.26 1.89 2.19 4.61
F 2.14 1.91 3.32 4.2
20-44 M 4.72 4.03 6.45 5.53
F 4.53 3.81 3.82 5.25
45+ M 3.67 2.88 4.33 5.56
F 2.5 1.49 2.65 3.87
Figure 6. St. Louis P & I deaths per age category (October – December 1918)
When ASDRs were calculated for the African American and Caucasian
subpopulations of St. Louis (Table 2) it was simple to spot a few notable aberrations
0
5
10
15
20
25
30
35
Dea
ths
(per
1,0
00
)
Age Categories
Uncharacterized White
Native White
Immigrant White
African American

23
(Figure 6). A Chi-Square test allowed an in-depth examination of these differences
through statistical qualification (Table 3) The Chi-Square residuals indicated meaningful
anomalies in two separate age categories (0-9 and 30-39). Ages 0-9 had the highest age-
specific death rates, as expected with influenza, but the ASDR of African American
children in this age category was higher than expected, as indicated by adjusted residual
numbers.
Table 3. Chi-square table of weekly death rates due to P & I in St Louis (October-December 1918)
Group Age Observed Expected
Chi-
Square
Value
Adjusted
Residuals
Uncharacterized
White 0-9 391 420.98 2.14 -4.73
10-19 172 171.94 0 0.01
20-29 694 685.98 0.09 1.06
30-39 697 679.78 0.44 2.28
40-49 271 270.31 0 0.13
50-59 165 164.85 0 0.04
60-69 124 123.19 0.01 0.22
70+ 89 85.97 0.11 0.99
African
American 0-9 84 54.02 16.64 4.73
10-19 22 22.06 0 -0.01
20-29 80 88.02 0.73 -1.06
30-39 70 87.22 3.4 -2.28
40-49 34 34.69 0.01 -0.13
50-59 21 21.15 0 -0.04
60-69 15 15.81 0.04 -0.22
70+ 8 11.03 0.83 -0.99
Chi-Square value= 48.88
Critical Value (.05, 7)= 14.07
*p<.05

24
Further testing using a two way ANOVA (Table 4) revealed that only 30% of this
variation of weekly ASDRs of children aged 0-4 was due to grouping differences, in this
case the African American subgroup versus the Caucasian subgroup. Sixty-nine percent
of the variation came from the infection pattern of the disease (i.e. which weeks saw
greater mortality than others).
Table 4. Two way ANOVA analysis of variation in P & I death rates ages 0-4
(October-December 1918) in St. Louis
Source of
Variation df SS MS Fs
Sex 1 0.07 0.07 0.13
Race 1 11.77 11.77 20.92
Interaction 1 0.09 0.09 0.16
Within 48 27.00 0.56
Total 51 38.94
*p<.05.
Discussion
Quick and Decisive Action
As shown by decreased age standardized mortality rates relative to US averages
early in the 1918 influenza pandemic, St. Louis experienced a different mortality trend
than the rest of the nation. Several factors impacted this variation, the first being the
quick and decisive approach taken by St. Louis Health Commissioner Max Starkloff to
avoid the horror happening in Eastern cities like Philadelphia (with a final mortality rate

25
of 7.4 deaths per 1000 citizens). With hundreds dying each day and most of the
population either too sick or too afraid to bury the deceased, flu victims literally piled up
in the streets or the hallways of hospitals around Philadelphia. Not only did this increase
the risk of spreading secondary disease, it dramatically lowered morale in the city
(Crosby 2003). In a meeting with city leaders St. Louis Commissioner Starkloff moved
to close schools, meetings, conventions, and public places of amusement, and to grant
him the authority to take any and all steps to protect the city. They agreed. A second
proclamation closed houses of worship (Moser-Jones 2010). To those opposing the
quarantine, Commissioner Starkloff had this to say on November 1, “I have not changed
my position on the order. The situation is improving, but I am convinced a little more
hesitation and St. Louis will be out of danger.” (“Influenza ban not to be lifted at this
time”) Not long after his statement world events contrived to effectively end his ban on
the gathering of large groups. On November 14 the city reopened schools and businesses.
This precipitated a spike in deaths, of which 30-40% were children (Bakalar 2007). One
could posit that by the time the ban was lifted on November 14, however, the damage had
already been done. On Armistice Day, November 11, the limited quarantine in St. Louis
was broken when citizens rushed to celebrate the ceasefire on the Western Front on the
Great War. “St. Louis Begins Peace Celebration Long before Dawn,” read a headline in
the November 11 edition of the St. Louis Post-Dispatch (1918:4). A false headline days
earlier claiming that the Armistice had been signed spurred additional celebrations. City
officials, including the mayor, tried to stop these celebrations, as confirmed by Post-
Dispatch headlines, “Influenza Ban Kept on During Celebrations: Mayor to Call Formal

26
Peace Gathering When Epidemic Situation Improves” (1918:5). They were clearly
unsuccessful. When looking at St. Louis’ weekly total deaths from flu, during the week
of November 17 there were 166 Caucasian deaths, which more than doubled two weeks
later to 373 Caucasian deaths the week of December 1 (Table 1). This huge increase was
seen in both native white and immigrant white subpopulations, and to a lesser degree, in
the African American population of S. Louis. Some of this increase in mortality can be
directly attributed to the reopening of the City of St. Louis and death totals would have
been predictably lower had the ban not been violated.
Educating the Public?
Overall, even accounting for the Armistice Day disaster, St. Louis dealt with an
overwhelming and catastrophic situation with more success than many other urban areas
in the country. This is evidenced by St. Louis have a cause specific mortality rate of 3.8
persons per 1000 citizens, versus 4.8 persons per 1000, which was the average cause
specific mortality rate for 48 large American cities (Crosby 2003). City officials worked
closely with the American Red Cross to mobilize nurses and volunteers, as well as
distribute Public Health Service influenza prevention pamphlets (Jones 2010). At this
time, most American Red Cross intervention occurred at the local level, depending on
volunteers from local chapters integrating with public health sources in the city. Most of
these volunteers would have been middle to upper class white women who were part of
the Progressive Movement, with aspirations of improving conditions of the urban poor.
The American Red Cross did not accept African American volunteers at this time) (Jones
27
2010), so it is questionable if the public health pamphlets were delivered to lower class
African American or immigrant neighborhoods. It is known that the Red Cross did divide
the city up into districts assigned to volunteer groups and these areas would have, at the
time, been considered dangerous and the families of volunteers, if not the Red Cross
itself, would have barred volunteers from entering these areas (Jones 2010). At least one
of the PHS pamphlets did include simple instructions for avoiding flu in languages other
than English. These languages included: Polish, Russian, Yiddish, Hungarian, Italian,
Bohemian (Czech), and Spanish (Jones 2010). While this nod to the existence of different
cultures within the city is noted, it still remains a question as to whether these pamphlets
were properly distributed or not.
In addition to the PHS pamphlets distributed by Red Cross volunteers, the St.
Louis Post-Dispatch was running daily ads with advice on how to avoid influenza and
what should be done should infection occur. Typical ads related to the Spanish Flu
included in the pages of the St. Louis Post-Dispatch relayed common advice for avoiding
the flu, whether it was medically correct or not. For example, one ad suggested that
citizens “keep organs of digestion and elimination active and your system from poisonous
accumulation” (“How to avoid influenza”). The pages of the Post-Dispatch also included
ads for various drugs that would safeguard families from flu, and ranged from quinine
suppliers, cleaning brands like Lysol, and myriad other cures of questionable origin.
Drawings of young couples dancing at a local YMCA while wearing face masks
encouraged proactivity in the face of the influenza epidemic (“The Bal (sic) Masque”).
While this was a conscientious act on the part of the editorial staff (or a profitable

28
economic act), the same problems related to distribution can be seen with local
newspapers, as with the PHS pamphlets from the Red Cross. Due to economic concerns
of both the patrons and the newspaper, it is likely that the distribution routes and
subscription campaigns did not extend to wards of St. Louis that were inhabited by those
with lower socioeconomic status. The Argus, a bi-weekly African American newspaper
was in circulation at the end of 1918, but its focus was political news and in October,
November, and December, flu was mentioned only a handful of times (“Flu ban is off.”
and “Influenza raging at…”). These short articles focused exclusively on the St. Louis
quarantine and no advertisements for flu care or treatments were noted. Beyond access to
this type of prevention and treatment information, there is the additional problem of
literacy among some demographic subgroups in St. Louis at this time. For instance, it
should be noted that according to the 1920 US Census in no state did the native white
population have the highest percentage of illiteracy, but Missouri was the only state
where the greatest percentage of the illiterate were African American (Horton
1923).These percentages include all ages. The St. Louis Post-Dispatch was also printed in
an English-only format, which would have precluded immigrants who could not read the
language from benefitting from advertised Spanish Flu prevention and treatment
strategies.
Environmental and Behavioral Factors Impacting Flu Mortality
Statistical analyses in the form of t-tests show that the differential weekly
mortality rates of Caucasians and African Americans in St. Louis during the 1918

29
influenza epidemic were only slightly significant; however, there is enough evidence to
place this variation at the door of environmental (political and social) or behavioral
differences between the two subpopulations. This is especially true when you reconsider
the results when the citizenship status of St. Louis Caucasians is introduced (differences
between native and immigrant whites widened the gap between mortality rates of African
American and native white subpopulations). Feagin and Eckberg (1980:12) sum up the
political situation in St. Louis when they describe direct institutionalized discrimination
as, “comprised organizationally or community prescribed actions that by intention have a
differential and negative impact on members of a subordinate group.”
It was not only African Americans that experienced negative community actions
in St. Louis. As in many large, urban areas of the time, community consensus was that
new immigrants to the area were both deliberately segregating themselves and displacing
a long standing population of earlier immigrants and native whites, while also creating
slum conditions in the city (Park and Kemp 2006). These thoughts increased the rate of
racialization of white immigrants and made it increasingly harder for them to live in
conditions comparable to those at a higher socioeconomic level. Germ theory, a novel
idea at this time, could be interpreted in a way that propagated the stereotype that those
living in these slums were a danger to the general public, harboring the pathogens that
spread illness (Park and Kemp 2006). During the influenza pandemic of 1918, these
thoughts no doubt affected the level of care given to marginalized members of society
who became ill.

30
When introducing environmental differences as a factor in overall demographic
difference in mortality from flu in St. Louis it is important to understand why some
subgroups could be more susceptible to influenza infection than others. Influenza is a
contact disease that spreads through infected respiratory droplets which are exhaled by an
infected person. When these droplets come in contact with another person or a shared
environment, there is potential for infection. People who live in close quarters with large
numbers of people, as was the case with many households with low economic status in
1918, would be much more likely to spread infection than those who could effectively
quarantine themselves in different rooms of a home. Another factor increasing
susceptibility of subgroups with lower socioeconomic status was the increased likelihood
of introducing flu to a household.
Households with lower economic status were more likely to have two parents
working outside of the home, doubling the chances of picking up an influenza pathogen
and potentially spreading it to members of their household. In fact, a 1928 study found
that African American mothers were two and a half times more likely to work outside of
the home than white mothers (Klaczynska 1976). Whether or not immigrant women
worked outside of the home was contingent on several variables: most importantly the
ability to speak English and cultural traditions. Women who were more involved in
serving members of their native group were less likely to work outside the home
(Klacyznska 1976). Based upon these variables, Klacyznska (1976) found that Irish
women were most likely to work outside the home while Italians were the least likely.

31
Polish women often supplemented income by bringing boarders into their homes, which
would increase the likelihood of spreading flu throughout a household.
Introducing the size of a household as a factor increasing flu mortality seems a
valid argument. According to contacts at the United States Census office, the average
number of people living in an African American household in 1910 was five people (US
Census Bureau, personal communication). Compare these numbers to the 4.54 children
per average US household (this number includes African American households,
suggesting that Caucasian households were even smaller than this figure suggests) and it
is apparent that significant differences in household size and the dynamics within the
household were taking place (US Census Bureau, personal communication). An increased
number of dependents would put strain on resources for the entire household (most
especially during an epidemic where caregivers were potentially infected), and it is
apparent that some demographic subgroups in St. Louis were feeling the pressure more
than others. This stress could have negatively impacted overall mortality rates from flu
for these groups in a number of ways. Differences may have been in the form of resource
allocation, which would contribute to differences in medical care, immune system
function, health, education, and many other sociopolitical and health categories.
Klaczynska (1976) found that African Americans had five times more women in the
workforce than any other ethnic group. This specific situation would have impacted flu
mortality rates in many ways, most notably through increased risk of infection and
decreased availability of resources and care for the infected.

32
Additionally, the immunological differences between individuals at different
levels of socioeconomic status clearly predispose some groups to infection at higher rates
than others, mostly due to chronic stress. The most basic function of the human immune
system is to identify pathogens and destroy them before they can multiply and cause
further damage to a host (Wiley and Allen 2009). However, multiple studies have
demonstrated the reactive relationship between cortisol (a stress hormone) and the
immune system. Levels of stress (be it economic, social, political) vary based on gender,
race, and class, but any significant increase in cortisol levels over time will decrease
immune system function. Cohen, et al (1993) have shown that subjects reporting more
stressful instances in their life have higher infection rates when exposed to a pathogen,
indicating decreased immune system function. This means that while some demographic
subgroups in St. Louis would have been more likely to become infected with influenza,
their immune systems were not aggressive enough to produce the so-called “cytokine
storm”, which is, simply, an overreaction to infection that causes more harm, in this case,
to a host’s lungs. Some in St. Louis were more likely to become infected, but not die
from the flu, while others who were less likely to contract the pathogen actually had an
increased risk of death.
Many studies have shown that African American groups, as well as immigrant
groups, had lower socioeconomic status (and, as such, increased levels of chronic stress)
than native whites at this period in history and that these differences in status did affect
the health of individuals in these subgroups (Williams 2012). It would make sense, then,
for those groups that have an increased risk of contracting influenza to have higher death

33
rates from the disease than those groups who are less likely to contract the disease. This
is why differential death rates of influenza can be attributed to environment, rather than
race. If biological notions of race (not racialization) was the main concern, immigrant
whites and native whites would not have statistically different weekly mortality rates.
However, if environmental factors such as housing and immunology directly affect
mortality rates, it makes sense that African American and immigrant white subgroups
would show mortality rates that were not statistically different from one another, while
both have rates that are statistically different from the native white subpopulation. These
results emphasize the effects of racialization and its consequences, rather than explaining
mortality differences based on race alone.
Environmental and behavioral differences can also account for another trend seen
in St. Louis during the Spanish Flu epidemic between the sexes. Males had much higher
weekly mortality rates for the month of October before the rates became comparable to
that of females in November. After three months there was no statistical difference in
mortality between males and females from flu in St. Louis. Klaczynska (1976) found that
at this time only 48% of native white women were out in the workforce, while 78% of
African American women worked outside of the home (women from most immigrant
groups were less likely to have employment outside of the home). Males, overall, were
more likely to contract influenza by being out in the community workforce, explaining
their initially higher mortality rates. These pathogens were then introduced to their
households and dependents, increasing their mortality, which eventually became

34
comparable to that of the household males, explaining the infection pattern related to sex
in St. Louis.
Explaining Environmental Differences in St. Louis
Statistical analyses have indicated that there were a series of environmental or
behavior factors that influenced mortality rates in St. Louis during the 1918 influenza
epidemic. Data collected during this period has invalidated the argument that race
(though not racialization) played a role in who was more likely to die of flu. However,
there is no denying that there was ethnic tension in St. Louis at the time of the epidemic,
which undoubtedly influenced the environment and behavior of different subgroups
living in the city, then affecting their susceptibility to influenza morbidity and mortality.
The first of a series of deadly race riots that crossed the Midwest in the early 20th
century
occurred just across the border in Illinois, in East St. Louis, in 1917. This historic race
riot no doubt cemented and exposed the racial discrimination that could be seen in both
formal and informal rules (Feagin and Eckberg 1980) in St. Louis.
In 1916 St. Louis became the first city to legally segregate housing by popular
petition (Bourgois 1989). Though the petition was not in effect in 1918 (and
overwhelmingly failed to be enforced), the existence of a popular petition to segregate
living space speaks to the political climate in St. Louis during the early part of the 20th
century. De facto segregation in housing would have inhibited access to information,
medical care, and assistance during the flu epidemic in St. Louis. It should be noted that
the City Hospital of St. Louis was segregated in 1918 (Bourgois 1989), but there is no

35
indication that African Americans received inferior care while patients at the institution.
In fact, death certificates show many African American decedents did receive care at one
of the city’s hospitals. Later in the epidemic the Red Cross allowed African American
nurses to volunteer in various areas of the city, which likely increased the medical
attention given to African Americans stricken with influenza or pneumonia (Jones 2010).
Across the nation, illiteracy rates for those with lower socioeconomic status were
disturbingly high at this time. Census records from 1920 show that in urban Missouri
areas, native whites had an illiteracy rate of 0.8%. Compare this to the 9.6% illiteracy
rate of African Americans and the even higher rate for immigrants, 10 percent. Though
by the time of the 1918 epidemic this disparity in literacy was being rectified for children,
it was an everyday reality for their parents and grandparents. Again, this environmental
disparity would have negatively affected access to information and other necessary aid
during the epidemic.
A survey conducted in 1912 found that only 0.1% of the African American
occupational force was made up of professionals (Bourgois 1989). In the years leading up
to 1920 immigrants made up over half of the workforce in the manufacturing sphere, but
the racialization of these foreign born workers inhibited their ability to achieve economic
and social comfort. With African American and immigrant workers filling the positions
of lower status, they were effectively promoting lower tier native white workers into
managerial or higher status positions, which would rarely have been given to workers of
a lower socioeconomic group (Hirschman and Mogford 2009). This specific type of
ladder in the workplace, and the economic consequences of these practices, would have a

36
huge impact on housing, nutrition, and overall health practices, causing the disparities
seen in death rates between native whites and African Americans.
Conclusions
As the data analyses from St. Louis have shown, differential mortality during the
1918 Spanish Flu epidemic was due to a combination of behavioral and environmental
factors, not due to biologically determined racial differences. Demographic analyses
allow researchers to see trends such as these that might not have otherwise been obvious
and then evaluate the underlying causes of those trends. Factors related to socioeconomic
status affected the way demographic subgroups were exposed to, experienced, and treated
influenza in St. Louis. African American and immigrant subgroups experienced
statistically similar rates of weekly mortality, which were significantly different from the
mortality experienced by the native white subgroup. Further, men and women in St.
Louis did not experience differential mortality, meaning that sex was not a leading factor
in morbidity and mortality rates. Age, however, did impact whether an individual was
more likely to die of influenza, pneumonia, or related causes, and this phenomenon was
seen worldwide.
The socioeconomic factors that influenced mortality rates among subgroups in St.
Louis ranged from illiteracy to chronic stress, which impacted the way these groups
received information about the virus and the way that the influenza virus replicated inside

37
of an individual. Native whites were better informed about how to avoid infection, how to
treat infection, and most likely had immune systems that made it less likely that they
would be infected by an influenza pathogen. African American and immigrant groups
(lower on the socioeconomic ladder) did not have equal access to this information, had
increased likelihood of contracting influenza due to behavioral habits, and possessed
immune systems that could have been compromised by chronic stress, making it more
likely for them to become infected. However, weekly mortality rates show a lower degree
of difference between these disparate groups than expected.
This significant, but not overwhelming, difference in weekly mortality between
the privileged and the disadvantaged could be explained by revisiting some of the
competing theories about the increased virulence of the 1918 influenza pandemic.
Ewald’s theory of increased virulence due to the unique evolution of the virus cannot be
dismissed as St. Louis does show a pattern of increased mortality relative to other flu
seasons. Again, the theory of this influenza strain as novel cannot be discounted because
of the overall pattern of the pandemic worldwide. A disastrous second wave of the flu
was followed by a third wave hallmarked by decreased virulence and mortality, as is
expected when a new disease emerges. However, it is the cytokine storm theory that is
most strongly supported by the specific data coming out of St. Louis. During any other
influenza epidemic it is the young and the old, and those with compromised immune
systems that fall victim to the virus. However, in 1918, in St. Louis, analysis shows that
those with increased immune system function suffered greater than expected mortality,
while those who were most likely immunosuppressed did not die in as great of numbers

38
as predicted (Table 3). There was not as significant a difference between native white
mortality and the mortality of African Americans and immigrant whites as was expected.
This makes sense if overall mortality is related to immune system function, in this
unexpected way. Those with suppressed innate immune system function due to chronic
stress (from economics, nutrition, socio-political issues, etc.) would not have been able to
respond as strongly to the invading pathogen as those with healthy immune systems,
which in the case of the 1918 influenza strain, was actually a benefit. In 1918 the specific
influenza pathogen generated an increased response of the innate immune system in those
with healthy immune systems, leading to increased production of cytokine genes, which
cause inflammation. This inflammation was primarily confined to the lungs and damaged
the tissue there, leading to eventual death from pneumonia, which was often misclassified
as flu death.
By understanding the factors that could have led to differential mortality from the
1918 Spanish Flu pandemic in St. Louis, research can inform public health policies of
today. Had St. Louisians had equal access to information about flu prevention and
treatment, lower mortality totals would likely have been seen. As Selgelid (2005:286)
states, “…we need a greater grip on complex social, political, historic, and economic
dynamics in order to explain and thus comment upon the justice of the current global
healthcare situation.” Modern practices of canvassing all neighborhoods with information
in appropriate styles and languages could decrease the likelihood of this differential
mortality today. Equal treatment of individuals at different socioeconomic levels in
society could decrease the chronic stress common in some subgroups, making them less

39
likely to contract a virus. Public policy related to health care cannot always be effective
when developed and practiced at a population level, though that is most often the
template for programs and policies developed by public health organizations today. It is
through integrating information about different subgroups of a population and tailoring
specifically chosen policies and practices to these specific groups in a community that
change can be effected, in some cases. The results of analysis from the 1918 influenza
pandemic in St. Louis show this to be true historically. Subgroups within a population
exposed to the same pathogen clearly respond very differently based upon environmental
and behavioral factors. Modern interventions and changes in policy can prevent
differential mortality in community subgroups based on socioeconomic status if it they
are uniquely developed and proactively used.

40
Literature Cited
Bakalar, Nicholas. "How (and How Not) to Battle Flu: A Tale of 23 Cities." The New
York Times, April 17, 2007.
Bootsma, Martin CJ, and Neil M. Ferguson. "The effect of public health measures on the
1918 influenza pandemic in US cities." Proceedings of the National Academy of
Sciences 104, no. 18 (2007): 7588-7593.
Bourgois, Philippe. "If you're not black you're white: a history of ethnic relations in St.
Louis." City & Society 3, no. 2 (1989): 106-131.
Bristow, Nancy K.”You can’t do anything for influenza: doctors, nurses, and the power
of gender during the influenza pandemic in the United States.” In The Spanish
Influenza Pandemic of 1918-1919: New Perspectives, edited by Howard Phillips
and David Killingray, 58-69. New York: Routledge, 2003.
Bureau of Census: Twelfth Census of the United States, 1900. Vol. II, Table 9, p. 143
Bureau of Census: Fourteenth Census of the United States, 1920. Vol. III, Table 8, p. 550
Bureau of Census: Fourteenth Census of the United States, 1920. Vol. III, Table 6, p. 549
Carpenter, Connie, and Lisa Sattenspiel. "The design and use of an agent-based model to
simulate the 1918 influenza epidemic at Norway House, Manitoba." American
Journal of Human Biology 21, no. 3 (2009): 290-300.
Chowell, G., C.E. Ammon, N.W. Hengartner, and J.M. Hyman. 2006. "Estimation of the
reproductive number of the Spanish flu epidemic in Geneva, Switzerland."
Vaccine 24, no. 44-46: 6747-6750.
Cohen, Sheldon, David A. Tyrrell, and Andrew P. Smith. "Negative life events,
perceived stress, negative affect, and susceptibility to the common cold." Journal
of personality and social psychology 64, no. 1 (1993): 131.
Collins, Selwyn D. "Excess mortality from causes other than influenza and pneumonia
during influenza epidemics." Public Health Reports (1896-1970) (1932): 2159-
2179.
Crosby, Alfred W. America's forgotten pandemic: the influenza of 1918. Cambridge
University Press, 2003.
Department of Commerce, Bureau of the Census. Mortality statistics 1918. Nineteenth

41
annual report, 1920.
http://www.cdc.gov/nchs/dat/vsushistorical/mortsatsh_1918.pdf (accessed July 3,
2013)
Diekmann, O., J. A. P. Heesterbeek, and J. A. J. Metz. "On the definition and the
computation of the basic reproduction ratio R 0 in models for infectious diseases
in heterogeneous populations." Journal of mathematical biology 28, no. 4 (1990):
365-382.
Ewald, Paul. 2011. "Evolution of virulence, environmental change, and the threat posed
by emerging and chronic diseases." Ecological Research 26, no. 6: 1017-1026.
Feagin, Joe R., and Douglas Lee Eckberg. "Discrimination: Motivation, action, effects,
and context." Annual Review of Sociology 6 (1980): 1-20.
“Flu ban is off.” The Argus, November 15, 1918, p. 1.
Grosfoguel, Ramán. "Race and ethnicity or racialized ethnicities? Identities within global
coloniality." Ethnicities 4, no. 3 (2004): 315-336.
Hirschman, Charles, and Elizabeth Mogford. "Immigration and the American industrial
revolution from 1880 to 1920." Social science research 38, no. 4 (2009): 897-920.
Horton, Rouchen. "A brief study of illiteracy in the United States." Peabody Journal of
Education 1, no. 2 (1923): 108-114.
"How to avoid influenza." St. Louis Post-Dispatch, November 2, 1918, p. 4.
"Influenza ban not to be lifted at this time." St. Louis Post-Dispatch, November 1, 1918,
p. 13.
"Influenza ban kept on during celebration: mayor to call formal peace gathering when
epidemic situation improves." St. Louis Post-Dispatch, November 9, 1918, p. 5.
“Influenza raging at Liberty Loan.” The Argus, October 18, 1918, p. 1.
Jones, Marian Moser. "The American Red Cross and local response to the 1918 influenza
pandemic: a four-city case study." Public Health Reports 125, no. Suppl 3 (2010):
92-116.
Klaczynska, Barbara. "Why women work: A comparison of various groups‐ Philadelphia,
1910–1930." Labor History 17, no. 1 (1976): 73-87.

42
Kobasa, Darwyn, Steven M. Jones, Kyoko Shinya, John C. Kash, John Copps, Hideki
Ebihara, Yasuko Hatta et al. "Aberrant innate immune response in lethal infection
of macaques with the 1918 influenza virus." Nature 445, no. 7125 (2007): 319-
323.
Kolata, Gina. Flu: the story of the great influenza pandemic of 1918 and the search for
the virus that caused it. Touchstone, 2001.
Linder, Forrest Edward, and Robert D. Grove. Vital statistics rates in the United States,
1900-1940. US Government Printing Office, 1943.
Loo, Yueh-Ming, and Michael Gale. "Influenza: Fatal immunity and the 1918 virus."
Nature 445, no. 7125 (2007): 267-268.
Mills, C.E., J.M. Robins, and M. Lipsitch. 2004. “Transmissibility of 1918 pandemic
influenza.” Nature 432, no. 7019: 904-906.
Missouri Digital Heritage. Missouri Secretary of State. Missouri Death Certificates 1910-
1961.
Morens, David M., and Jeffery K. Taubenberger. "Pandemic influenza: certain
uncertainties." Reviews in medical virology 21, no. 5 (2011): 262-284.
Morens, David M., Jeffery K. Taubenberger, and Anthony S. Fauci. "The persistent
legacy of the 1918 influenza virus." New England Journal of Medicine 361, no. 3
(2009): 225-229.
Oxford, J. S. "Influenza A pandemics of the 20th century with special reference to 1918:
virology, pathology and epidemiology." Reviews in medical virology 10, no. 2
(2000): 119-133.
Park, Yoosun, and Susan P. Kemp. "“Little alien colonies”: Representations of
immigrants and their neighborhoods in social work discourse, 1875–1924." Social
Service Review 80, no. 4 (2006): 705-734.
Phillips, Howard and David Killingray. Introduction to The Spanish Influenza Pandemic
of 1918-1919: New Perspectives, 1-25. New York: Routledge, 2003.
Selgelid, Michael J. "Ethics and infectious disease." Bioethics 19, no. 3 (2005): 272-289.
"St. Louis begins peace demonstration long before dawn." St. Louis Post-Dispatch,
November 11, 1918, p. 4.

43
Taubenberger, Jeffery K., and David M. Morens. "1918 Influenza: the mother of all
pandemics." Rev Biomed 17 (2006): 69-79.
"The Bal Masque, a la mode, 1918 as seen at the YMCA canteen during the epidemic."
St. Louis Post-Dispatch Daily Magazine, October 22, 1918, p. 15.
The City of St. Louis, Missouri. "A PFreservation Plan for St. Louis." http://stlouis-
mo.gov/departments/planning/cultural-resources/preservation-plan/Part-I-People-
and-Government.cfm.
Vanneste, Sarah Frances. "Medical Progress and the Influenza Pandemic of 1918."
Michigan Academician 41, no. 1 (2012): 68-91.
Williams, David R. "Miles to Go before We Sleep Racial Inequities in Health." Journal
of health and social behavior 53, no. 3 (2012): 279-295.