spain: development, democracy and equity (*)
TRANSCRIPT

SPAIN: DEVELOPMENT, DEMOCRACY AND EQUITY (*)
Carles Boix (**)
(December 27, 2004)
(*) Prepared for the World Development Report 2005. The author acknowledges the thorough
research assistance and general input of José Fernández-Albertos.
(**) The University of Chicago. Email: [email protected]

EQUITY & DEVELOPMENT World Development Report 2006 Background Papers
In the last half century Spain has undergone a dramatic and by most counts successful
political and economic transformation from relative underdevelopment and authoritarianism to
wealth and democracy. In the immediate aftermath of World War II, which resulted in the re-
establishment of democracy in Western Europe, Spain remained a culturally and diplomatically
isolated country, governed by authoritarian institutions. Moreover, whereas democratic Europe
experienced a period of rapid economic growth and growing trade integration, Spain was
burdened by the destruction yielded by its civil war fought in the 1930s, the pursuit of autarkic
policies and a long history of relative poverty. Following the decision to liberalize its economy in
the late 1950s, Spain quickly transformed into a modern manufacturing and service-based
economy, experiencing unprecedented levels of prosperity, massive urbanization and a growing
middle class. With the death of its dictator in 1975, Spain embarked in a peaceful transition to
democracy, the construction of a broad welfare state and its integration in the European Union.
This successful transition to economic and political modernity is particularly relevant,
both theoretically and from the viewpoint of policymakers, because Spain stands as one of the
few countries that managed to move peacefully from underdevelopment and authoritarianism to
democracy and prosperity in the last decades. Most of today’s wealthy democracies
(concentrated in Europe and North America) were already industrialized and had liberal political
regimes by the middle of the twentieth century. With the exception of a few Asian cases and,
more recently, some small Eastern European nations, the rest of the world, which was either
underdeveloped, undemocratic or both a few decades ago, has still a long way to catch up with
the developed West.
1
EQUITY & DEVELOPMENT World Development Report 2006 Background Papers
To examine the story of Spain’s economic and political transitions, this paper is
organized as follows. Sections 1 and 2 explore the nature and causes of the economic
underdevelopment of Spain since the 19th century as well as the violent collapse of its brief
democratic experiment in the early 1930s. Section 3 depicts the Franco regime – particularly its
heavily regulated economy in place till the late 1950s, the decision to liberalize it in 1959, and
the period of rapid growth that followed. This section includes an exploration of the causes of
that economic policy shift arguing that although its exact timing was probably random, its
consolidation was not. Section 4 describes the democratic transition that followed the death of
Franco in 1975. That section puts special emphasis on the conditions (economic growth and the
formation of a broad middle class in the 1960s) that made the advent of democracy possible.
Section 5 examines the impact of democratization on the structure of the welfare state in Spain.
Case studies offer a chance to dwell upon the details of the historical development of
either a particular country or set of events as well as track the motives and interactions of the
agents who took the decisions which shaped the outcomes under study. Under that light, case
studies may perform a particularly helpful task in constructing empirical knowledge and testing
the logical consistency of our existing theories. Because of their nature, however, case studies
are inherently limited in their ability to adjudicate between different theoretical accounts.
Researchers can always develop several alternative explanations to fit the events that are
narrated. To minimize this problem, this paper follows two strategies. First, taking Spanish
history as if it were a time series, it engages in several temporal comparisons. Thus, it examines
why democracy failed in the 1930s but succeeded forty years later. It debates what caused the
economic policy shift of 1959. And it evaluates the expansion of the Spanish public sector in the
2

EQUITY & DEVELOPMENT World Development Report 2006 Background Papers 1970s and 1980s by looking at both the factors which remained unchanged and those which did
covary with the construction of a modern welfare state. Second, this study makes extensive
reference to a broader theoretical literature and to cross-national empirical studies. This emphasis
on theory garners particular strength in the concluding section of the paper. There the story of
Spain in the 20th century is retold very succinctly in a comparative frame in the following terms.
After being trapped in a world of economic failure and political authoritarianism, Spain
eventually broke free from its state of relative underdevelopment in the 1960s following the
liberalization of its economy. Rapid economic growth dissolved most of the social tensions that
had blocked the introduction of democracy in the past. The process of democratization in turn
transformed the political economy of Spain even further. A still heavily regulated state gave way
to an increasingly liberalized, open economy. In part to respond to the demands unleashed by
competitive elections but also as a result of that deregulation, the Spanish state grew in size to
perform an important compensatory role similar to any European welfare state. The economic
and political transformation was successful and almost complete. Still, as the conclusion points
out, two central issues remain unresolved to date – the territorial organization of the state and the
performance of the labor market.
1. A Story of Relative Political and Economic Failure
Until the second half of the 20th century Spanish contemporary history was, broadly
speaking, a tale of relative political and economic failure. After a period of territorial expansion
and European hegemony in the early Modern Ages, Spain lapsed into economic decline and
cultural stagnation in the following centuries (North and Thomas 1973). During most of the 19th
3

EQUITY & DEVELOPMENT World Development Report 2006 Background Papers century, its industrial take-off was blocked by considerable political instability, inefficient legal
institutions, substantial inequalities and a poorly educated population. The entry of Napoleonic
troops and liberal ideas in the early 19th century triggered a protracted and often violent period of
confrontation, which included three civil wars, among political elites. For the first three quarters
of the 19th century, liberals and conservatives succeeded each other in power through military-
led “pronunciamientos”. In the early 1870s the monarchy gave way to a brief republican
experiment that collapsed amid anarchy and territorial dissensions. Eventually, the two main
political factions of conservatives and liberals agreed to restore the monarchy and reconcile their
differences in the constitutional settlement of 1876. For the next fifty years, the two parties took
turns at governing the country through pre-arranged elections and an extended system of patron-
client relations.
[Figure 1 here]
The pacification of the country and the final creation of a relatively stable system of
property rights eventually fostered a spur of growth. As shown in Figure 1, the Spanish per
capita income doubled from less than $1,400 (in constant $ of 1990) in 1870 to about $3,000 in
1929. Still, that represented only two fifths of the British per capita income and less than two
thirds of the French one. Moreover, most of the growth concentrated in Catalonia and the Basque
Country, in the North of the Iberian Peninsula. Finally, it only implied moderate change in the
sectoral mix of the Spanish economy. Figure 2 reports the sectoral composition of the Spanish
economy from 1850 to 1930. Growing at the same pace the economy did, services and
construction generated about half of total production throughout the period. Agricultural output
roughly doubled in absolute terms but fell from 40 to 27 percent of the economy. The
4
EQUITY & DEVELOPMENT World Development Report 2006 Background Papers
manufacturing sector, which multiplied by eight, claimed a quarter of total output by 1930.
Overall, Spain remained an agricultural country with almost 50 percent of the labor force
employed in the primary sector (Nadal 1975, Tortella 1995).1
[Figure 2 here]
2. Democratic Transition and Civil War
The loss of the last two main Spanish colonies, Cuba and the Philippines, in 1898, the
progressive organization of the trades union movement and the emergence of regionalist parties
in Catalonia and the Basque country eroded the constitutional settlement of 1876 during the first
two decades of the twentieth century. In sync with the widespread political turmoil affecting
Europe after World War I, Spain experienced substantial social unrest and political violence in
the early 1920s. To quash it, the monarchy prompted a military coup d’etat by Primo de Rivera
in 1923. Seven years later Alphonse XIII dismissed the latter and decided to democratize the
country gradually through local elections. However, the victory of the Republican parties in the
urban municipalities in April 1931 resulted in the king’s abdication and, excluding a brief
democratic period in 1868-73, in the introduction of democratic institutions for the first time in
Spain.
1 Although the industrialization of the Basque Country and Catalonia has been well studied (e.g. Nadal 1975, Nadal and Carreras, eds. 1990), theoretical accounts about its take-off are scarce. Abundant natural resources did not seem to play an ultimate role: even though the Basque Country was well endowed with coal and iron, Catalonia was not. It is more likely that the social composition of both regions (with an abundant artisan class and relatively equal farming and urban communities) favored their industrialization. Urban artisans had the basic know-how to adopt quite easily the new industrial technologies generated in Britain. The relatively larger number of farmers and urban strata could in turn absorb these new industrial products. The different Basque and Catalan social background may have derived from the continuity of medieval autonomous political institutions that made both regions less vulnerable to the failed economic policies of the Spanish state in the modern period. As a matter of fact, the industrial revolution emerged in the two areas where medieval parliamentary practices had lasted longer – the Catalan parliament was abolished in 1714 and the Basque institutions in 1876.
5

EQUITY & DEVELOPMENT World Development Report 2006 Background Papers The Spanish republic did not last long. Spain was polarized by considerable social and
economic inequalities. In a country which still was eminently agrarian, the distribution of land
was very unequal – particularly in the Southern half of the Peninsula. About 1 percent of the
number of holdings occupied 50 per cent of the land. Although arable land was more evenly
distributed, the structure of holdings was considerable biased in favor of the largest ones. About
one third of the arable land was occupied by holding of more than 100 hectares, while the
proportion in Europe was around 10 percent (Merigó 1982). The urban working classes, who
were well organized in two trade unions, the Socialist UGT and the anarchist CNT, espoused
radical social and economic programs. Except for Catalonia and the Basque country, which had
industrialized in the 19th century, Spain lacked a large ‘bourgeois’ middle class. The Spanish
middle class simply consisted of civil servants, military officers and professionals (such as
doctors and lawyers).
In addition to highly charged economic differences, the Republic had to cope with
substantial territorial demands. The Catalan and the Basque nationalist movements, which had
become electorally mobilized at the turn of the 20th century to regain their own political
institutions and the official recognition of their historic languages, were met with stiff resistance
from large parts of Spanish society. Finally, Spaniards were intensely divided between the
supporters of the Catholic Church, which aspired to maintain the educational quasi-monopoly
and political recognition it had secured in the previous regime, and a rabid anticlerical movement
inspired by the French Radicals next door.
6

EQUITY & DEVELOPMENT World Development Report 2006 Background Papers Benefiting from a disorganized right, Republicans and Socialists secured a strong
parliamentary majority in July 1931. 2 Under pressure from street agitation and well-organized
unions, they went ahead with a constitution that institutionalized a strong separation of Church
and state, established a single system of state schools, and threatened religious orders with their
possible expulsion. The Republican government initiated a process of land reform, approved a
law to decentralize political power to Catalonia and stepped up efforts to reform the army.
Due to an electoral law that magnified small vote swings, the left lost two thirds of its
parliamentary seats in 1933. As the right-wing party, which ran as a pro-Church movement and
favored a constitutional reform, was about to join the government, the radical left and the
Catalan regional government organized an insurrection a year later. The government had to call
the army to pacify the mining valleys of Asturias. A year and a half later, in the spring of 1936,
new elections were held. A small swing in the popular vote now resulted in a crushing victory for
the Left in terms of parliamentary seats.
In July 1936 general Franco launched a coup. Instead of leading to a bloodless change in
regime, as had been the case with all military coups in 19th-century Spain, this pronunciamiento
was met with the active resistance of a fully mobilized union movement. Spain became engulfed
in a three-year civil war which presaged the world war that would erupt in the summer of 1939 in
the issues it was fought over, its symbolism and its domestic and international political
alignments.3
2 An analysis of the period can be found in Brennan (1990) and Malefakis (1970). 3 In calculations developed in Boix (2004) for a panel data encompassing all sovereign nations from 1850 to 1997, civil wars are shown to be particularly likely to take place in highly unequal agrarian societies. Given the characteristics of Spain in 1936, the probability of a civil war outbreak in the 1930s was of 1 out of 6 according to that model. It is 0 percent today.
7

EQUITY & DEVELOPMENT World Development Report 2006 Background Papers 3. Authoritarianism. From Autarky to Growth
With the defeat of the Republican government, Franco established an authoritarian
regime that lasted until his death in 1975. The destruction caused by the civil war (and the world
war that burst a few months after the former ended) depressed the Spanish economy
considerably. Per capita income fell to its 1900 level by 1938 and could not reach its 1918 level
until 1950. The proportion of active population in industry declined to 22 percent in 1940 (or the
level of 1920) and the share of employed in agriculture grew above 50 percent. Growth was
feeble. The average annual rate was 1.25 percent in the 1940s.
The autarkic model and its breakdown
Spain’s economic recovery was hampered, above all, by the heavily autarkic and statist
policies pursued by the Franco regime. Inspired by the corporatist ideologies of Italian Fascism
and German Nazism and in part compelled by its political isolation in the postwar European
context, Franco’s regime generalized a system of price controls and rationing and regulated
foreign trade through quantitative controls. The creation of new industries required
administrative authorization. The state assigned specific areas to the production of particular
agrarian products, such as wheat. Financial credit was subject to stringent regulations to channel
it to certain activities. Moreover, the state reinforced its intervention in the economy through
both the expansion of public-owned firms created under the Primo de Rivera dictatorship and the
creation of new ones. Public employment and investment were boosted to foster industrial
development defined according to political considerations and an autarkic creed. 4
4 This section relies on Merigó (1982), Payne (1987) and Preston (1993).
8

EQUITY & DEVELOPMENT World Development Report 2006 Background Papers This intensely interventionist strategy was extended to the labor and housing market. To
quell one of the main forces that opposed the military insurrection, Franco outlawed any
independent labor unions. Instead, workers and employers had to affiliate in a national trade
union organization. In a concession to Falange, the Fascist party that formed part of the Francoist
coalition, this repressive stance was accompanied by very strict labor legislation that made it
very hard for employers to dismiss workers or to hire them through temporary contracts. This
state-based form of protection offered to employees was complemented with similar regulations
in the housing market to cheapen rentals and favor current tenants. The emphasis on permanent
jobs and houses ought to be seen in part as a substitute for the lack of either direct social policies
or any attempt to educate a very unskilled workforce. As a matter of fact, it did not differ
substantially from similar protectionist, import-substitution strategies adopted in the mid 20th
century in Latin America and parts of the recently decolonized Third World. It contrasted
sharply, however, with the economic policies dominant among Spain’s democratic neighbors,
which were committed to free trade, human capital formation and universal social policies.
Naturally, the Spanish economic framework that followed the civil war had extraordinary
stifling effects on entrepreneurial activity. Still, the flow of United States aid starting in the early
1950s and the growth of tourism and the remittances of emigrant workers in the late 1950s
bought the Franco regime some time before it had to change its economic policies. The Spanish
economy experienced significant growth throughout the 1950s. But it did in a very volatile
manner and constrained by important supply bottlenecks (Figure 3). The economy went through
a spurt of growth in the early 1950s with high inflation – consumer prices increased at the annual
rate of 8.7 percent between 1948 and 1951. Inflation then eased up due to the easing of import
9
EQUITY & DEVELOPMENT World Development Report 2006 Background Papers restrictions (related to United States aid) and the effect of higher electricity output (related to
investments made in the 1940s). Its reduction was also helped by an oversupply of agricultural
labor and a very repressive labor system, which contributed to dampen wage pressures.
[Figure 3 here]
In 1956 the government met a wave of illegal strikes with significant wage increases
(averaging 14 percent) in 1956. This sparked a new round of inflation, which averaged 12.2
percent in 1956-58. Moreover, Spain faced a balance-of-payment crisis. Gold and foreign-
currency reserves fell to an all-out low. Large short-term capital outflows took place in 1957 and
1958. A rigid, two-tier exchange rate system limited the government’s room for maneuver. More
generally, Spain’s economic structure remained stuck in an agrarian, underdevelopment trap.
Although investment went up, it took place within a highly protectionist, import-substitution
structure. Export-led growth was negligible. As shown in Table 1, imports as a share of national
income remained flat during the 1950s. Exports actually fell by half. The structure of foreign
trade reflected the structure of the Spanish economy. Exports were dominated by agricultural
products and raw materials. By contrast, Spain mostly imported inputs for the productive sectors,
particularly industry.
[Table 1 here]
After a prolonged period of stop-and-go policies, in the late 1950s Spain eventually
moved to break with its old interventionist system. In a rebuke to the core of Falangist and
interventionist ministers who had dominated the social and economic departments of the Spanish
government, Franco appointed two technocrats to head the economic ministries in February
1957. Their first attempt to impose contractionary policies and to overhaul and simplify the
10

EQUITY & DEVELOPMENT World Development Report 2006 Background Papers exchange rate system that same year did not follow through completely due to considerable
political squabbling within the government. A multiple exchange rate system was re-established
and import restrictions tightened shortly after their appointment. Yet an acute political crisis,
with a wave of strikes, and an economic recession, with zero growth rates and a severe balance-
of-payment crisis, led the government to adopt a stabilization plan in March 1959. In addition to
new fiscal and monetary measures to stabilize the economy, the plan included wide-ranging
measures to liberalize the economy. At the behest of the IMF and OEEC, the government
established a single exchange rate (accompanied by a significant devaluation) and suppressed
price controls over freely imported goods and any allocation procedures for freely imported raw
materials. State trading in imports was limited to agricultural products. About half of imports
were liberated and an additional share brought under global import quotas. Foreign investment
was also liberalized.
The stabilization plan was an outright success. Despite the devaluation and the
suppression of price controls, inflation remained subdued. More important, the economy grew
very quickly. From 1960 to the outbreak of the first oil crisis, output expanded at an average
annual rate of over 7 percent with very little inter-year volatility. As a result, per capita income
more than doubled from about $3,000 to $8,500 (in $ of 1990) in fifteen years. Inflation stayed at
6.5 percent in the same period. Overall productivity averaged 6 percent in the same period. In
part due to emigration to Northern European countries, unemployment was low at less than 3
percent. Economic growth was to some extent generated by a substantial increase in investment,
which rose from 16 percent to 21.5 percent, but it mostly derived from considerable
technological progress – resulting from the incorporation of foreign ‘best practices’ and foreign
11

EQUITY & DEVELOPMENT World Development Report 2006 Background Papers
direct investment. Labor productivity in industry grew by 8.5 percent annually between 1960 and
1975. Growth also derived from a shift in employment from low-productivity sectors
(agriculture) to high-productivity sectors (industry).
To understand why the reorientation of the Spanish macroeconomic policy framework (at
least in its monetary, exchange rate and trade components) took place it is worth distinguishing
between the ‘short-term’ factors that explain its adoption and the ‘long-run’ causes of its
consolidation. Its adoption resulted above all from domestic reasons: the lack of industry-led
growth, the short-run difficulties in controlling prices and balancing the trade deficit, and the
parlous condition of state finances made it possible for the ‘reformist’ sectors of the regime to
convince Franco about the need to make a fresh break with past policies.5 The Franco regime
was an authoritarian yet by no means monolithic power structure. Although led by the army, the
1936 insurrection had relied upon a coalition of diverse and heterogeneous interests: monarchists
keen on overthrowing the Republic; Catholics concerned with the anticlerical policies of the
1930s and frustrated by the de facto veto imposed by the Left to the entry of the right-wing
parties in the Spanish government in 1933-34; landowning families; important sectors of the
Basque financial elite; some Catalan industrialists; and the fascist movement of Falange. For the
fist two decades of the regime, Falangists played a dominant role in the regime and shaped the
economic policies of the state for two reasons: international conditions, defined by the strength
of the Axis power until 1944 and the isolation Spain experienced until 1953, and their much
better organizational strength (since they controlled the quasi-party structures that underpinned
the Francoist regime). But the existence of non-Falangist supporters, who always retained a share
5 It is also likely that some Spanish bureaucratic and economic elites became unsettled by the contemporary development of negotiations to establish the European Economic Community and the effects that such a broad market may have on Spain in the future.
12

EQUITY & DEVELOPMENT World Development Report 2006 Background Papers of ministerial posts, gave Franco enough room both to check Falange and to rely upon alternative
policies to overcome the economic and financial exhaustion experienced by the dictatorship in
the late 1950s. It is in fact likely that Franco decided to reinforce the presence of non-Falangist
economists to check an aggressive campaign launched in the mid 1950s by some Falangists to
strengthen the institutional and political role of Falange.
Whereas the timing of the policy shift of 1957-59 may be thought of as random, its
consolidation was not. The stabilization plan was not reversed (as many other stabilization plans
have been across the world) because there were several pre-existing conditions (which do not
exist in those countries that abandon their macroeconomic liberalization plans) that made it
immediately successful and that therefore convinced Franco not to deviate from the new
macroeconomic framework of 1959.
The Spanish ‘economic miracle’ of the 1960s was made possible by three factors, so far
strangled by the interventionist schemes of postwar Spain. In the first place, Spain already
counted with a set of ‘virtuous’ pockets, mostly concentrated in the Basque country and in
Catalonia, which had industrialized in the past and which therefore had enough managerial and
technical know-how to respond quickly to the liberalization of markets. In the second place, the
Spanish state had a relatively reliable legal and administrative structure, established by the liberal
governments of the 19th-century and then explicitly modernized by the same technocratic cadres
that engineered the stabilization plan of 1959. Finally, Spain could count upon an extremely
favorable foreign environment: for geopolitical considerations, the American and European
governments were keenly interested in a stable, rapidly growing Spain; foreign capital was
available and ready to invest in a potentially medium market located close to the European core;
13

EQUITY & DEVELOPMENT World Development Report 2006 Background Papers and the military ties with the United States acted as a mechanism to insure foreign investors
against any policy reversals or confiscatory threats in the Peninsula.
The social consequences of economic liberalization and growth
The transformation of the Spanish economy led to significant structural changes in
Spanish society. Figure 4 displays the evolution of output shares of different economic sectors
after 1930. Agriculture fell from 23 percent to 10 percent between 1960 and 1975. Industry
remained at 30 percent. The service sector experienced a 10-percentage-points increase.
Construction went up from 5 to 7 percent. In employment terms, the proportion working in
agriculture dropped from 41 percent to 23 percent. In industry the proportion increased four
points to 27 percent. Most of the fall in agriculture was absorbed by a jump in the service sectors
(employing 40 percent of the population in 1975).
The structural change in the economy was accompanied by strong migration flows. The
share of the three top destinations (Catalonia, Madrid and the Basque Country) rose from 20 to
32 percent of the population between 1950 and 1975. By contrast, the Southern part of the
Peninsula declined from 35 percent to 25 percent in the same period. These migrations resulted
in an unprecedented increase in urbanization. The proportion of Spaniards living in cities of over
100,000 inhabitants climbed from 30 percent in 1940 to 50 percent in 1975.
[Figures 4 and 5 here]
The combination of economic growth, industrial expansion and internal migration
produced a substantial decline in the levels of inter-regional inequality. Figure 5 tracks the
evolution of the coefficient of variation of per capita regional product from 1900 to 1990 and the
14

EQUITY & DEVELOPMENT World Development Report 2006 Background Papers standard deviation of regional per capita income after 1955. A dramatic fall in inter-regional
inequality (from a standard deviation in per capita income of 0.37 in 1955 to 0.27 in 1973) took
place during the Spanish ‘miracle’ of the 1960s.
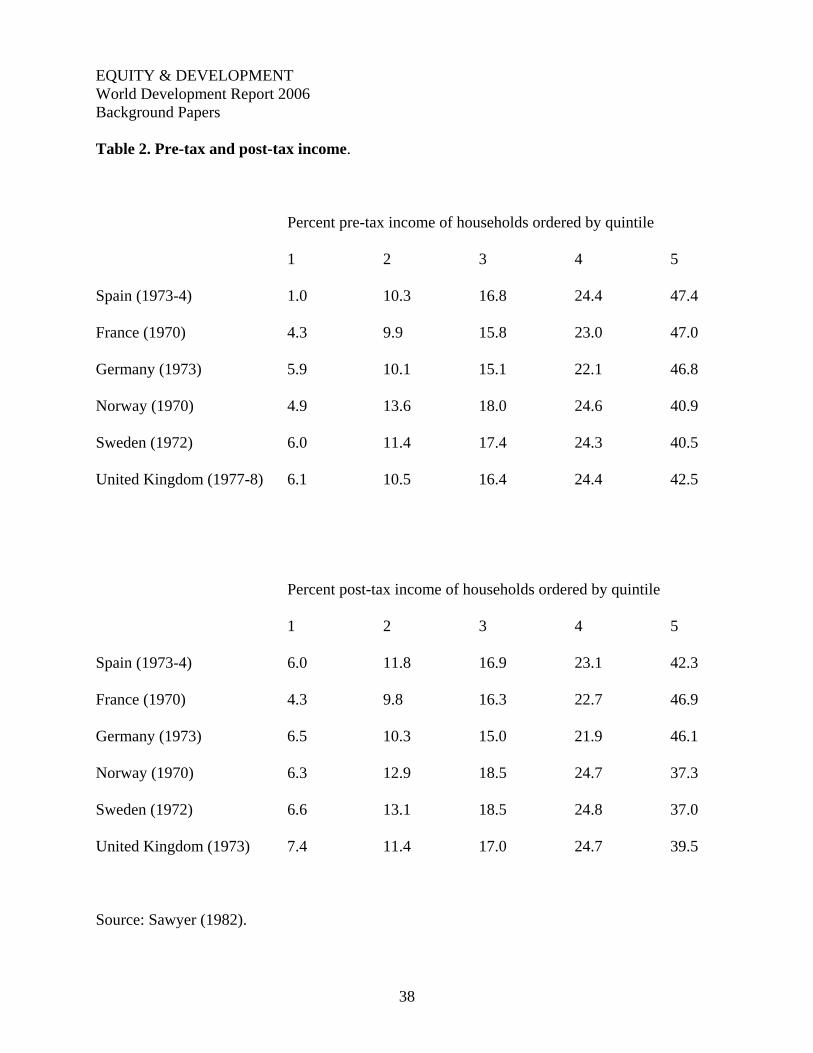
A much larger middle class emerged in Spain as a result of growth. Table 2 seems to
indicate that by the early 1970s, Spanish income inequality was broadly in line with the largest
European countries. A similar outcome emerges from the UNU/WIDER-UNDP database. The
Spanish Gini coefficient for household net income fluctuates around 0.37 – similar to the
German one although higher than the British (0.26) or Swedish (0.21) Gini indexes. A similar
pattern emerges from data on consumption habits: by 1980, Spain had around 200 cars, 193
telephones lines and 254 television sets per 1,000 inhabitants – those figures were about three
quarters of the European average.
[Table 2 here]
Still, significant social and economic inequities remained in place for three reasons. First,
educational attainment was low. Although by 1970 the illiteracy rate had fallen to 10 percent,
only 6 percent of the population had completed secondary studies by that year. Second, wages
were dampened by excess labor supply and repressive labor institutions. Finally, taxation and
public spending were low and redistributive social programs virtually absent. General
government tax revenues fluctuated around 20 percent of GDP in the 1960s. Social spending was
below 10 percent of GDP or less than half the European average.
4. Democratic Transition
15

EQUITY & DEVELOPMENT World Development Report 2006 Background Papers General Franco died in November 1975. His successor, King Juan Carlos, grandson of
Alphonse XIII, who had renounced the crown in 1931, became the Spanish head of state
according to the legal mechanisms put in place by Franco.
In the wake of the intense economic development of the 1960s and the social and cultural
transformations that accompanied it, some sectors of the Francoist regime, mostly including
moderate monarchists, a few Christian democrats and members of business circles, warmed to
the possibility of transforming the political system from within before the dictator’s death. In
1973-74 this reformist wing attempted a timid process of political liberalization. But it was
interrupted by the emergence of Basque terrorism and the reaction of the regime’s hardliners.
The new monarch immediately launched again a process of political change toward
democratization. His first attempts became stalled by the status-quo-biased institutional set-up of
the Francoist regime. After some difficult and behind-the-scenes maneuvering, Juan Carlos
succeeded in appointing a reformist cabinet in July 1976. Staffed by very young politicians and
civil servants who had worked within the Francoist regime, the new government moved swiftly
to democratize Spain. Employing the legal mechanisms put in place by the very technocratic
generation that had reformed the economy in the early 1960s as well as pointing to the existence
of wide popular support for democracy, in the fall of 1976 the government secured the consent of
the old Francoist Cortes (the Spanish parliament) to establish a truly democratic parliament
elected through direct, competitive elections. After the political reform was ratified with
overwhelming popular support in a referendum in December 1976, the government engaged in
informal conversations with the democratic opposition, legalized the Communist party and
granted a wide political amnesty. Although the transition to democracy was conducted in a
16

EQUITY & DEVELOPMENT World Development Report 2006 Background Papers
climate of uncertainty, particularly over the reaction of the army and the extent to which terrorist
violence or labor mobilization could disrupt the negotiation process, democratic elections were
promptly held in June 1977. This clean and competitive election returned representatives and
parties reflecting the whole range of political preferences of Spaniards. The centre-right
government coalition obtained close to the majority of seats. The center-to-the-left Socialist
party secured one third of the parliament. Both the Francoist party and the Communist party
received less than 10 percent of the vote and around 5 percent of seats each. Catalan and Basque
regionalist parties also entered the new parliament. Consensual politics dominated the transition
to democracy. After protracted negotiations, a new Constitution was approved in 1978 with the
support of all parliamentary groups and only a handful of negative votes from some former
Francoist parliamentarians. To reinforce the political pact in parliament, the government also
struck a wide economic and social deal with employers and trade union that same year.
The constitution established a parliamentary monarchy in which the king only exercised
symbolic power. State and Church were separated – still private education was protected and the
Catholic Church was given special recognition as the denomination of the majority of the
population. The constitution enshrined as well the existing social consensus around private
property and the market economy and the need to develop a welfare state to meet a generous list
of social rights. Finally, it established a decentralized state to accommodate the political
demands of the Catalan and Basque regions. 6
An influential section of the scholarly literature has explained the success of the Spanish
democratic transition as the result of a process of negotiation between enlightened elites who had
6 For an account of the period, see Maravall (1981), Gunther et al. (2004).
17

EQUITY & DEVELOPMENT World Development Report 2006 Background Papers learnt the lessons of excessive confrontation the hard way, that is, through the hardship of war in
the 1930s and economic stagnation till the 1950s. Nevertheless, the roots of democracy lay first
and foremost upon the changed economic and social conditions of Spain in the 1970s. According
to estimations in Boix and Stokes (2003) based on a panel data for all sovereign countries from
1850 to 2000, the annual probability of a democratic breakdown (that is, the transition to
authoritarianism in a country that has started a democracy) is close to 5 percent with a per capita
income of $2,000 (the level of Spain in 1930) but 0 percent for any income above $7,000 (a level
attained by Spain in 1974). Naturally, the level of per capita income simply proxies for the
absence or presence of social conditions that make it reasonable for all the parties in contention
to subject themselves to free elections and to the possibility of losing them and therefore power.
The rapid economic transformation of Spain, revolving around industrialization and
urbanization, had deflated past conflicts around the distribution of land. The extension of literacy
and the adoption of advanced industrial technologies (with the correlated increase in productivity
and incomes) had generated a strong middle class beyond the existing bourgeois strata in
Catalonia and the Basque country. The very experience of sustained growth defused social
conflict with the credible promise of higher incomes and more social mobility in the future. It is
likely that the possibility of European integration reinforced the expectations of Spaniards about
sustained growth in the future. In short, Spain had overcome the zero-sum game in which it had
been locked in during the past century and a half. This structural change explains why some
timid attempts to open up the Francoist regime, entertained in 1945-47 in the wake of the Allies’
victory and again in the late 1950s, failed completely. True political reform had to wait till social
and economic conditions were ripe for political change to occur.
18

EQUITY & DEVELOPMENT World Development Report 2006 Background Papers
In addition to the transformation of material conditions for broad swaths of Spanish
society, religious and cultural life experienced as well considerable change in the two decades
preceding the transition to democracy. In the aftermath of Vatican II, the Spanish Catholic
Church went through a thorough ‘aggiornamento’ in both its leadership and ideological
commitments. In addition to embracing the possibility of freedom of religion and political
liberalization in the public arena, substantial parts of its hierarchy and lay basis actively
cooperated with a nascent union movement and the democratic opposition. Moreover, Spanish
society secularized rapidly. Between 1970 and 1979 the percentage of Spaniards who described
themselves as “very good’ or ‘practicing” Catholics declined from 64 percent to 37 percent. The
proportion of “non-practicing” Catholics, “indifferent” or “atheist” trebled from 12 percent to 37
percent (Gunther et al. 2004: 143). This secularization was not associated with growing
anticlericalism – but rather with the expansion of more liberal views about religion and social
mores across the board.
As they did before 1936, religion and class (as well as national identity in the Basque
country and Catalonia) continued to play a key role in voting behavior. Table 3 shows that
whereas middle-class practicing voters overwhelmingly voted for center-right parties in 1982,
about two thirds of non-believing workers supported the left. However, they did from much more
moderate positions. Surveys taken since the mid-1970s show a unimodal distribution of the
population on the left-right continuum, with the peak located in the center and between 80 to 85
percent of the surveyed placing themselves between the center-left and center-right. Although
overall less conservative than other European electorates, Spaniards consistently adopt reformist
economic and political positions. About 80 percent of those surveyed favor gradual reforms
19

EQUITY & DEVELOPMENT World Development Report 2006 Background Papers versus 10 percent opting for “the defense of society against subversive forces” and even fewer
respondents embrace the idea of revolutionary action (Gunther et al. 2004: 172).
5. Building the Welfare State
As discussed above, economic growth resulted in a different economic structure and
better distributional outcomes and the latter two propitiated a swift and successful transition to
democracy. In turn, the transition to democracy resulted in a larger public sector, with
considerable transfers directed to lower income brackets.
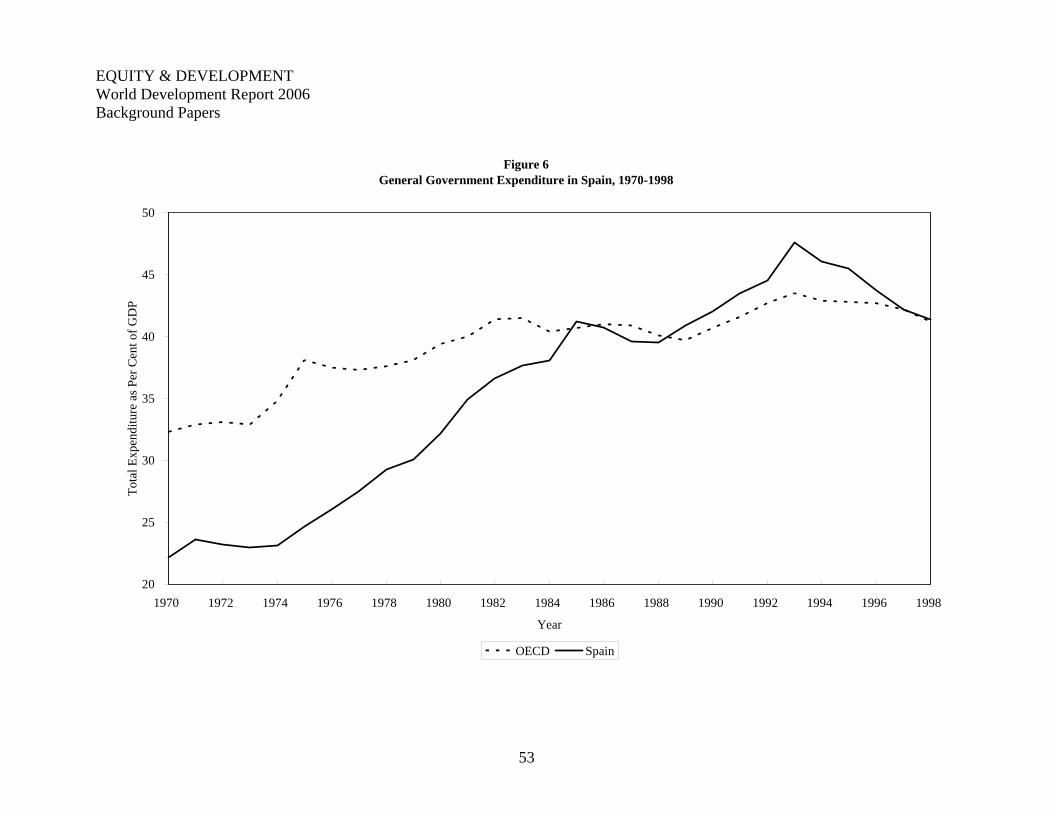
[Figures 6 and 7 here]
As is apparent in Figure 6, which reports public spending by general government, and
Figure 7, which displays current revenues of the general government, Spanish public expenditure
fluctuated slightly over 20 per cent of GDP or around two thirds of the OECD average up until
the early 1970s. On the one hand, redistributive pressures were effectively suppressed through
political means. On the other hand, the dictatorship met part of those demands through heavily
regulated labor and housing markets that secured permanent jobs and cheap rentals to broad
sectors of the labor force. The moderate growth of public spending until 1975 covered an
increase in investment on education and roads needed both to respond to rapid economic growth
and to attract capital from more advanced countries.
After the death of Franco’s appointed Prime Minister Carrero Blanco in 1974 and
particularly with the beginning of the democratic transition, public spending underwent a clear
change in its trend. During the following twenty years it grew by over 1 point of GDP per year in
real terms to reach 49.6 per cent of GDP in 1993.
20
EQUITY & DEVELOPMENT World Development Report 2006 Background Papers The growth of public expenditure did not follow a uniform pattern, however. Public
spending experienced an unprecedented expansion from less than 25 per cent of GDP in 1974 to
over 41 per cent of GDP in 1985. The increase in public expenditure was generated by two
sequential trends: a rapid growth in social expenditure (in the form of unemployment benefits
and pensions) in the second half of the 1970s; and a significant rise in interest payments,
resulting from a growing public deficit (to pay for the expansion of social spending) in the first
half of the 1980s. As a result of the expansion of public spending, by the mid-1980s Spain had
closed a historical gap with other advanced nations, building a public sector equal to the average
OECD public sector and only slightly below the European average. The trend of public spending
changed temporarily in the mid-1980s. After the accession of the Socialist party to power in
1982 and mainly as a consequence of rapid economic growth in the second half of the 1980s,
public spending stabilized as a proportion of GDP and then declined by 1.5 percentage points of
GDP from 1986 to 1988. In the wake of both a general strike in December 1988 to protest the
strategy of fiscal discipline followed by the González government and of important electoral
losses of the PSOE in favor of Izquierda Unida in 1989, the socialist cabinet approved extensive
social programs in 1989 and 1990. As a result, public spending grew intensely again, reaching
43.5 per cent of GDP in 1991. This should be considered its equilibrium rate since, although the
economic downturn of the early 1990s pushed public spending to around 48 per cent of GDP in
1993, three years later public expenditure had declined to its level before the crisis.
The growth of public revenue and expenditure as well as its internal structure was a
function of three factors. First, it responded to new social demands (related to the provision of
public infrastructures and education as well as pensions and health) generated by the process of
21

EQUITY & DEVELOPMENT World Development Report 2006 Background Papers social and economic modernization of Spain. Second, it emerged as a result of democratization,
increased political participation and electoral competition among parties. Finally, the
transformation of the public sector was linked to the shift from a regulated state, in which
protection came through permanent jobs and cheap rentals, to a liberal economy with low tariffs
and flexible markets and where the main mechanism to compensate losers and make them more
competitive was public spending.
[Figure 8 here]
The interaction of development and democratization in shaping the Spanish public sector
becomes apparent in Figure 8, which reports the evolution of public revenue as a percentage of
GDP and per capita income from 1960 to the late 1990s. Figure 8 also displays the predicted size
of the public sector for different levels of per capita income and type of political regime based on
estimations in Boix (2001) using a panel of about 2,000 country-year observations for all
countries of the world (for which data is available) since the 1960s.
Until 1975 the public sector grew slowly and in perfect correlation with economic
growth. In the mid 1970s, however, the economy stagnated for almost a decade. Spain had a per
capita income of $7,291 (in 1985 prices) in 1974 and of $7,330 in 1984. By contrast, the political
regime changed abruptly and with it the size of the Spanish state.
The transition to democracy unleashed strong social demands for redistribution.
Spaniards maintain a substantial egalitarian ideology and demand from the state a very active
role in the reduction of inequality. In 1979, more than seventy percent of Spaniards agreed with
the statement that “the distribution of wealth in this country is totally unjust.” (Gunther et al
2004, p. 173). As Table 4 shows, support for redistributive policies is very high in Spain: less
22

EQUITY & DEVELOPMENT World Development Report 2006 Background Papers than 3 percent of the population thought that the state should not be responsible for the provision
of health services, pensions, housing for the poor and regulating the environment. With
democracy and hence full political participation, the public sector quickly doubled in size -- from
22.8 per cent of GDP to 34 per cent in 1985 and then at a slower pace till around 40 percent by
the late 1990s.7 As democracy consolidated, public spending reached a plateau by the early
1990s.
[Table 4 here]
Social Expenditure
Public expenditure grew first and above all to fund new social programs. In response to
electoral competition and to shore up support for the democratic process, the reformist
government that presided over the political transition rapidly expanded the provision of
unemployment benefits and increased the allocation of money to health and pensions. In ten
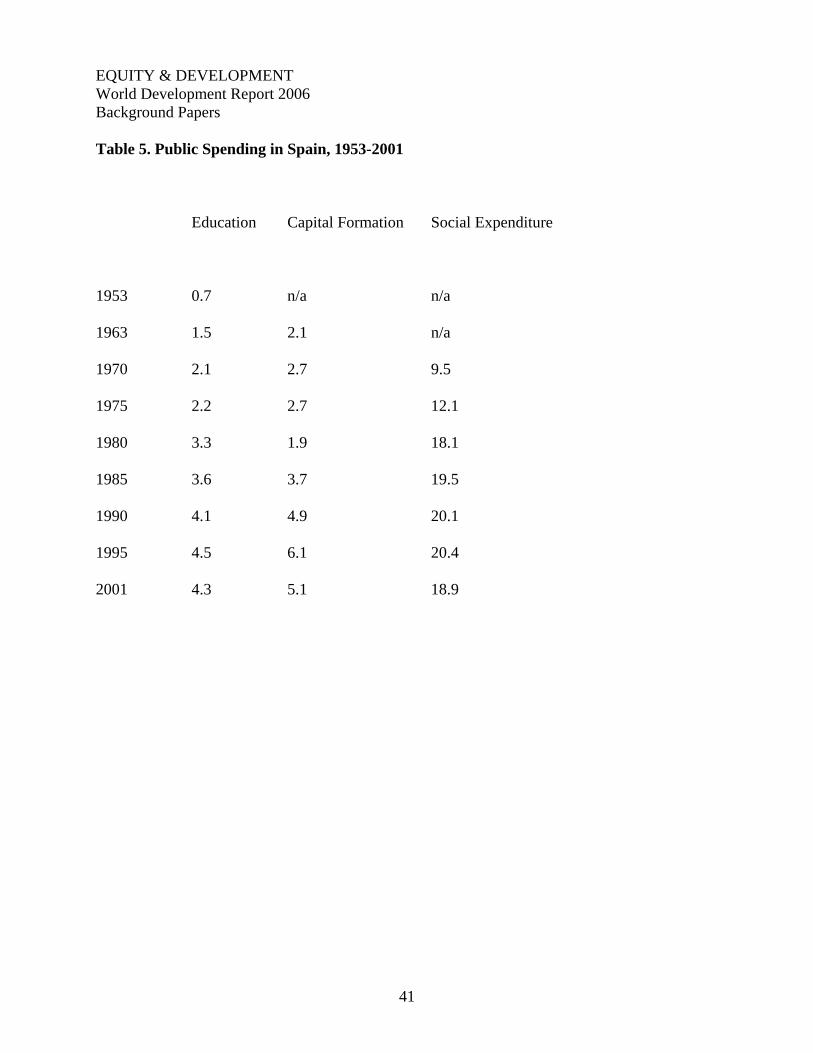
years social expenditure almost doubled to reach about 16 percent of GDP in 1980 (Table 5) or
about 80 percent of the European average. Pensions amounted to 6.4 percent of GDP and public
spending on health to 4.3 percent of GDP in 1980 (Table 6).
Social spending grew at a much slower moderate pace in the 1980s. But strong union
pressure in 1988-89 eventually pushed the Spanish government to universalize the provision of
public health, introduce old-age pensions for non-contributors, raise low-income pensions and
make unemployment benefits more generous in the early 1990s.
7 The quick expansion of public spending was also related to the double shock of high unemployment and high inflation that characterized the stagflation crisis of the 1970s.
23

EQUITY & DEVELOPMENT World Development Report 2006 Background Papers
As a result, by 2001 pensions were 8.9 percent of GDP or 90 percent of the European
average. Public health spending stood at 5.4 percent – again 90 percent of the European mean.
Spending on unemployment benefits and active labor market programs matched the European
level.
[Tables 5 and 6 here]
Capital Formation
Besides making more equitable the access to basic services and minimizing the effects of
economic volatility in an open economy in which standard macroeconomic policies were
increasingly in the hands of European institutions, public spending was also designed with an
eye to bolster the competitiveness of the factors of production. Accordingly, the Spanish state
directed heavy sums of money to fixed and human capital formation. Fixed capital formation
increased from about 2 percent of GDP in 1980 to around 5 percent of GDP in the mid 1990s.
Most public investment was allocated to build or ameliorate those basic infrastructures that were
thought to play a key role in linking the country (specially its less developed regions) to the
European market, increasing overall productivity and therefore offering more incentives to
private investment. An ambitious construction program tripled the public highway network from
2,300 km. to 6,000 km, revamped and expanded the metropolitan transportation system, and
modernized the railroad system.
Human capital formation was also a central part of the expansion of the Spanish state.
Public expenditure in education, which represented 2 per cent of GDP in 1975, was steadily
increased to 4.5 per cent of GDP in 1995. The Spanish state reorganized primary and secondary
24
EQUITY & DEVELOPMENT World Development Report 2006 Background Papers education (through legislation in 1985 and 1990) and extended free and compulsory education
until the age of 16 (in 1990). Combined with a decline in demographic growth, the rise in
educational expenditure meant doubling the amount spent per student in real terms, a vast
expansion in teachers' hirings and the extension of education in secondary and university levels
(Puerto 1991). The proportion of students from 14 to 18 years attending school went up from 50
per cent in 1980 to 70 per cent in the 1990s and from 19 to 23 years went up from 22 to 33.1 per
cent. By 2001, almost 50 percent of the population had completed secondary education – ten
times more than in the mid 1970s. The average number of years of education increased from 8.2
in 1977 to 11.4 in 1994. This increased was particularly marked in low income sectors: the
average number of years of education grew by 25 percent in the bottom quintile (in the
distribution of income) yet by less than 10 percent in the top income quintile (Oliver and Ramos
2001). Education policies were also complemented with active labor market policies, which rose
from 0.2 percent of GDP in 1980 to 1 per cent of GDP in the 1990s.
Tax Policy
The successful expansion of the Spanish welfare state relied on a comprehensive tax
reform approved in 1977-78. The reform, which included a modern income tax and the creation
of a specialized tax enforcement agency, boosted tax revenue from 18.8 percent of GDP in 1975
to 24.6 percent of GDP in 1982. Yet since public expenditure and the public deficit did not stop
growing in the early 1980s, the Spanish Socialist party, which governed from 1982 to 1996,
expanded the tax base through two mechanisms. On the one hand, it stepped up efforts to reduce
tax fraud. In the aftermath of the 1977 tax reform, the number of taxpayers filing tax returns had
25

EQUITY & DEVELOPMENT World Development Report 2006 Background Papers increased from 400,000 in 1977 to 5 million in 1979 but then stabilized around 6 million from
1981 onward. Still, by 1980-82 only 56 per cent of all taxpayers were filing tax returns - or less
than 50 per cent in terms of all national income. A thorough campaign to reduce tax fraud
doubled the number of tax returns to almost 11 million by 1990 - therefore nearly doubling the
figures of 1981. On the other hand, the government raised revenue mostly through fiscal drag. As
a result, the total tax base grew in ten years by 6.4 per cent annually in real terms. By 1990 the
national tax base was almost twice that of 1981 measured in constant pesetas. In the same period,
the Spanish GDP had increased by 40 per cent in real terms. As shown in Table 5, tax revenues
grew 9 percentage points to 33 percent of GDP in 1995.
[Table 5 here]
The tax system acquired an increasingly progressive profile. Almost two thirds of tax
increases until the mid 1990s derived from higher personal and corporate income taxes. Most of
the rest came from consumption taxes as a consequence of the introduction of the VAT required
by the Spanish integration into the European Community. Combining fiscal drag to expand
taxation on middle- and high-level incomes and partial legal amendments to relieve lower
incomes, the Spanish government sharpened the progressivity of income tax in the 1980s. In
1981, the effective tax rate on an income of Pta 500,000 was 5.4 per cent. For an income ten
times larger, the effective tax rate was 21 per cent. The effective tax rate reached 30 per cent
only when the income exceeded Pta. 9 million. Ten years later tax rates had gone up for all
incomes over Pta 700,000 (in 1981 Pta.), that is, for more than 50 per cent of all taxpayers. Thus,
for example, all taxpayers who paid 15 per cent of their income in 1981 were paying 22 per cent
in 1990 - again assuming their income had remained constant. For all those who paid 17 per cent
26

EQUITY & DEVELOPMENT World Development Report 2006 Background Papers or more of their incomes in 1981, effective tax rates increased from 10 to 15 points in a decade
(Boix 1998).
6. Conclusions
Spain stands as one of the few countries in the world which have completed a successful
transition from authoritarianism and relative underdevelopment to democracy and economic
abundance in the last half century. Most of today’s wealthy democracies were already liberal and
industrialized by the mid 20th century. The majority of countries which were poor in the 1950s
are still part of the developing world today. The process of full economic and political
modernization has only taken place in Southern Europe, in a few East Asian countries and in
sections of the former Soviet bloc.
With a few exceptions, pre-industrial societies are characterized by the combination of
low economic growth, authoritarianism and inequality. Although underdevelopment may derive
in part from excessive population growth, it ultimately results from a structure of perverse
institutional incentives. In an agrarian world, authoritarian rulers are the standard solution
devised to protect any population against the raids of external bandits that understand that the
appropriation of land and any other type of fixed assets in general is the only path of wealth and
power. In this context, authoritarianism and inequality come hand in hand. In exchange for
protection against bandits like themselves, the rulers seize an important part of their subjects’
assets. Moreover, subjects have no mechanism in their hands to curb the expropriation they may
suffer at the hands of their rulers. Growth is extremely unlikely to happen. Authoritarian rulers
favor the maintenance of those (non-commercial, pro-land) policies that are the basis of their
27
EQUITY & DEVELOPMENT World Development Report 2006 Background Papers wealth. They mistrust and block the emergence of alternative sources of income generation that
may eventually challenge their political preeminence.
Although coming in many forms and with different degrees of intensity, this political and
economic landscape of stagnation dominated the whole world until the modern period. Modern
development, that is, the emergence of a commercial society then followed by an industrial take-
off, happened in a self-generating fashion in very few places – all of them located in the North
Atlantic area. Growth happened where no monarch was able to suffocate some pre-existing
medieval and pluralistic institutions in the name of modern absolutism. There governments
sustained economic policies that protected the interests of merchants and investors and that
allowed the latter to take advantage of the scientific revolution of the 17th and 18th centuries.
With growth and higher productivity, inequality subsided. And inequality made the transition to
political liberalism and democracy possible.
In those places in which absolutism prevailed up to the contemporary period,
development and democratization only happened (whenever they did) through one of two
alternative paths. In some instances, the breakdown of the old authoritarian elite (and of the
institutions that blocked growth) came as a result of war, defeat and foreign occupation. This is
the case of East Asia and Eastern Europe, where World War II and particularly its victors
destroyed the ‘Ancien Régime’ social coalitions and political institutions which hindered
democracy and economic development. As those countries eventually became linked to the
international economy (either in the 1950s and 1960s in East Asia or after the fall of the Berlin
wall in Eastern Europe), economic growth (followed by political liberalization in Asia and
contemporaneous with democratization in Eastern Europe) took place. Alternatively,
28

EQUITY & DEVELOPMENT World Development Report 2006 Background Papers development happened through a more peaceful (but perhaps even less frequented) path. As
capital accumulated in the already developed core and began to suffer from growing congestion
costs, it gradually spilled over to the near periphery – particularly when the latter had either
stable institutions or foreign military pacts which credibly protected capital against the threat of
expropriation.
The Spanish case fits the second pattern. Its civil war did not transform the social and
political structures of the country – if anything it reasserted the old status quo the Second
Republic had been unable to change. Nonetheless, prodded by the United States and stimulated
by the formation of the European Union, Spain embraced economic policies that fostered rapid
growth and the social transformation of the country. European and American capital flowed into
Spain and new industries, such as tourism, sprang up to cater to an increasingly well-off
European population. Spain’s full transit to the club of developed nations comes with a caveat,
already underlined in this paper, to this story of foreign-induced growth (in the framework of a
stable dictatorship). The ‘economic miracle’ of the 1960s was made considerably easier by the
presence of a few areas in the North of Spain which already had the skills and capital ready to
take advantage of the stabilization program of 1959 because they had already industrialized in
the 19th century.
As Spaniards grew richer and joined an expanding middle class, past political and
economic clashes mellowed. In the 1930s most of the political and social conflict pivoted around
the distribution of wealth in a poor economy. As the economy boomed, the past zero-sum game
around property distribution lost steam. Instead, substantial numbers of Spaniards moved into
new economic sectors that delivered growing incomes without having to expropriate well-off
29
EQUITY & DEVELOPMENT World Development Report 2006 Background Papers sectors. These changing underlying conditions made possible to push forward two broad
institutional transformations in a peaceful and quite consensual manner. First, Spain managed to
transit from authoritarianism to democracy: once the stakes of the electoral game had changed in
a way that made everyone ready to accept a defeat at the polls, democracy could be introduced
and consolidated rather quickly. Second, Spain moved from a heavily regulated and closed
economy to a regime defined by much more open and flexible markets, now fully integrated in
the European Union.
Although the political deal that paved the way to democracy and an internationalized
economy was broadly successful, it is worth concluding this essay by stressing two questions –
one institutional, the other economic – that remain unsolved in Spain.
The Second Republic broke down under the weight of three contentious issues: a highly
unequal distribution of economic assets; an acute conflict between religious and anticlerical
parties; and the territorial demands of Basques and Catalans. The first two conflicts diminished
in intensity with the economic and cultural transformations of the 1960s. The third one also
abated – at least in its economic dimension, due to substantial interregional convergence in level
of development. In addition, the constitutional pact of 1978 made considerable progress in
accommodating, through a process of institutional decentralization, the historical demands of
Catalan and Basque regionalist movements. However, the pro-decentralization implementation
of the constitution suffered a setback in 1981, after a group of senior officers attempted a
military coup. Centralizing policies were again reintroduced after the center-right party won an
absolute majority in parliament in 1996. Moreover, even though the Spanish state is relatively
decentralized, regional governments manage rather than decide the content of policies. Thus,
30
EQUITY & DEVELOPMENT World Development Report 2006 Background Papers
whereas the economic and religious conflicts that bolted the Second Republic in 1936 have
almost disappeared, the regional question still lingers unresolved in the Spanish political arena.
Spain has been systematically hailed as the model to which other countries should look at
to complete a successful democratic transition. Less noticed, however, is the fact that Spain also
underwent an important transition in its overall economic policy framework: from a protectionist
regime with thorough price controls, a bulky public enterprise sector and a regulated labor and
housing markets to an internationalized economy, stable macroeconomic policies and essentially
deregulated financial and product markets. Successive democratic governments deepened the
process of economic reform which started in the late 1950s. Since the mid 1970s, the economy
was further liberalized in preparation for the entry in the European Union. In the mid 1980s the
Socialist government engaged in a painful adjustment of several industrial sectors to reduce their
bloated labor force and considerable financial losses. The transition to democracy and the
expansion of the welfare state were undeniably helpful in easing the costs of the economic
transition in two senses. From a strict welfarist point of view, the implementation of
universalistic social policies in health, unemployment, education and pensions minimized the
losses that the industrial and economic transition carried for important sectors of the Spanish
labor force. From a political point of view, the expansion of compensatory programs (as well as
of policies directed toward education and human capital formation) extracted a much higher
level of popular compliance with the general strategy of ‘modernizing’ the Spanish economy
than what might have been possible otherwise.8
8 The lack of much broader compensatory policies may explain why popular support for reform fizzles so rapidly in developing countries whenever growth rates fall and unemployment goes up. For a theoretical discussion of this issue, in a context in which trade policy and public spending are endogenously determined, see Adsera and Boix (2002).
31
EQUITY & DEVELOPMENT World Development Report 2006 Background Papers
As is often the case in many economic reforms, the process of economic transition
remained incomplete in one central sphere. To shore up support for the new regime, the
transition government struck an encompassing social and economic deal with left-wing parties,
trade unions and employers’ associations in 1977. Yet, instead of further liberalizing the Spanish
labor system, that agreement as well as the legislation which derived from it reinforced the
stringent labor market regulations put in place by the Francoist regime. In the context of a
country that still had a substantial part of the population employed in the primary sector and
where most of the population was rather unskilled, that regulatory structure interacted with the
skill-biased shock that most European economies suffered in the 1970s and 1980s to cause
unprecedented levels of unemployment. The Spanish unemployment rate shot upward to over 20
percent in the mid 1980s (see Figure 9).9 More important, unemployment affected different
social sectors very differently. Unionized male employees remained relatively protected by labor
laws. By contrast, the unemployment rate reached over 30 percent of women in the early 1990s
and almost 45 percent of young people. Participation rates among women remained extremely
low – despite the extraordinary inflow of women both in the educational system and in the job
market. The welfare state smoothed the economic shock substantially. But the high level of
unemployment had a considerable impact on Spain’s economy and demography. First, the low
level of workforce participation probably accounts for the fact that Spain’s per capita income has
not caught up with the European income significantly – always hovering at around three fourths
of the European Union level since the mid 1970s. Second, in response to the structure of the
labor market, with high unemployment and a sharp division between permanent jobs (mostly for
9 Bentolila and Jimeno (2003) estimate that 80 percent of the Spanish unemployment is explained by the interaction of the shock and the existing labor institutions.
32

EQUITY & DEVELOPMENT World Development Report 2006 Background Papers old men) and temporary contracts (for young and women), Spanish women postponed
childbearing (Adsera 2004). The Spanish fertility rate dropped to 1.2 -- one of the world’s lowest
level, for the last two decades. This in turn should have extraordinary consequences on the
ability of Spain to finance its welfare state in the future.
.
33

EQUITY & DEVELOPMENT World Development Report 2006 Background Papers References
Adsera, Alicia. 2004. “Changing Fertility Rates in Developed Countries: The Impact of Labor
Market Institutions,” Journal of Population Economics 17 (January).
Adsera, Alicia and Carles Boix. 2002. “Trade, Democracy and the Size of the Public Sector: The
Political Underpinnings of Openness.” International Organization 56 (2): 229-62.
Bentolila, Samuel and Juan F. Jimeno. 2003. “Spanish Unemployment: The End of the Wilde
Ride,” CEMFI Working Paper, # 0307. Madrid.
Boix, Carles. 1998. Political Parties, Growth and Inequality. New York: Cambridge University
Press.
Boix, Carles. 2001. “Democracy, Development and the Public Sector,” American Journal of
Political Science 45 (January): 1-17.
Boix, Carles. 2003. Democracy and Redistribution. New York: Cambridge University Press.
Boix, Carles. 2004. “Political Violence Around the World.” Prepared for the Conference on
Order, Conflict, and Violence at Yale University, Department of Political Science, April
30th – May 1st, 2004. March.
Boix, Carles and Susan Stokes. 2003. “Endogenous Democratization.” World Politics 55 ( July):
517-49.
Brennan, Gerald. 1990. The Spanish Labyrinth. Cambridge: Cambridge University Press.
Gunther, Richard, José Ramón Montero and Joan Botella. 2004. Democracy in Modern Spain.
New Haven: Yale University Press.
Linz, Juan J. and J. R. Montero, eds. 1986. Crisis y cambio: electores y partidos en la España de
los años ochenta. Madrid: Centro de Estudios Constitucionales.
34

EQUITY & DEVELOPMENT World Development Report 2006 Background Papers Malefakis, Edgard. 1970. Agrarian Reform and Peasant Revolution in Spain. New Haven: Yale
University Press.
Maravall, José María. 1981. La política de la transición. Madrid: Taurus.
Merigó, Eduardo. 1982. “Spain.” In Andrea Boltho, ed. The European Economy. Growth and
Crisis. Oxford University Press.
Nadal, Jordi. 1975. El fracaso de la revolución industrial en España, 1814-1913. Espulgues de
Llobregat: Ariel.
Nadal, Jordi and Albert Carreras, eds. 1990. Pautas regionales de la industrialización española
(siglos XIX y XX). Barcelona: Ariel.
North, Douglass C. 1973. and Robert Paul Thomas. The Rise of the Western World: A New
Economic History. Cambridge University Press.
Oliver, Josep and Xavier Ramos. 2001. “Capital humano y desigualdad en España 1985-1996,”
Papeles de Economía Española 88: 240-256.
OECD. 2002. Revenue Statistics of OECD Member Countries, 1965-2001. Paris: OECD.
OECD. 2004. Social Expenditure Database. SOCX: www.oecd.org/els/social/expenditure.
Payne, Stanley G. 1987. The Franco Regime: 1936-1975. Madison: University of Wisconsin
Press.
Preston, Paul. 1993. Franco: a biography. London: HarperCollins.
Puerto, Mariano. 1991. “La reforma de la enseñanza no universitaria: aspectos económicos y
presupuestarios.” Presupuesto y Gasto Público 4: 153-170.
Sawyer, M. 1982. “Income Distribution.” In A. Boltho, ed. . The European Economy. Growth
and Crisis. Oxford University Press.
35

EQUITY & DEVELOPMENT World Development Report 2006 Background Papers Tortella, Gabriel. 1995. El desarrollo de la España contemporánea. Madrid: Alianza Editorial.
36

EQUITY & DEVELOPMENT World Development Report 2006 Background Papers
Table 1. Structure of Foreign Trade in the 1950s
Imports Exports
1950 1955 1959 1950 1955 1959
Share in national income 10.5 9.8 10.2 12.2 7.1 6.4
Shares of:
Food products 19 8 11 50 56 60
Raw materials and
unfinished products 62 62 65 27 31 27
Machinery and equipment 17 28 22 3 2 1
Consumer goods 2 2 2 20 11 12
(a) Goods only
(b) 1951.
Source: Merigó (1982: 560).
37
EQUITY & DEVELOPMENT World Development Report 2006 Background Papers Table 2. Pre-tax and post-tax income.
Percent pre-tax income of households ordered by quintile
1 2 3 4 5
Spain (1973-4) 1.0 10.3 16.8 24.4 47.4
France (1970) 4.3 9.9 15.8 23.0 47.0
Germany (1973) 5.9 10.1 15.1 22.1 46.8
Norway (1970) 4.9 13.6 18.0 24.6 40.9
Sweden (1972) 6.0 11.4 17.4 24.3 40.5
United Kingdom (1977-8) 6.1 10.5 16.4 24.4 42.5
Percent post-tax income of households ordered by quintile
1 2 3 4 5
Spain (1973-4) 6.0 11.8 16.9 23.1 42.3
France (1970) 4.3 9.8 16.3 22.7 46.9
Germany (1973) 6.5 10.3 15.0 21.9 46.1
Norway (1970) 6.3 12.9 18.5 24.7 37.3
Sweden (1972) 6.6 13.1 18.5 24.8 37.0
United Kingdom (1973) 7.4 11.4 17.0 24.7 39.5
Source: Sawyer (1982).
38

EQUITY & DEVELOPMENT World Development Report 2006 Background Papers
Table 3. Percentage of Left Vote (Socialist and Communist) in 1982 according to 'Subjective' Social Groups and Religious Practice. Subjective Social Class Upper-Middle Lower Working All Middle-Middle Middle Class Practicing Catholics 6 17 31 23 Irregular Practicing 13 43 48 43 Religion Non Practicing Catholics 28 50 62 55 Non Believers 53 53 65 63 All 17 33 47 Own estimations based on data presented by Linz and Montero (1986).
39

EQUITY & DEVELOPMENT World Development Report 2006 Background Papers Table 4. Spanish Support for the Welfare State
Speaking generally, do you think it should be the state’s responsibility…
Yes, undoubtedly
It probably should No, it shouldn’t Don’t know
…to offer health coverage to everyone? 80 18 1 1
…to secure decent pensions to seniors? 79 19 1 1
…to offer scholarships to university students from low income families?
74 23 2 2
…to facilitate decent housing to low income families? 68 28 2 2
…to impose strict regulations on industry to reduce environmental damage?
66 27 3 4
…to give industry the support it needs in order to develop? 61 31 4 4
…to create a job for anyone demanding one? 60 29 9 3
…to provide decent subsidies to the unemployed? 57 33 6 4
Source: Centro de Investigaciones Sociológicas, January 1996. Estudio 2206.
40
EQUITY & DEVELOPMENT World Development Report 2006 Background Papers Table 5. Public Spending in Spain, 1953-2001
Education Capital Formation Social Expenditure
1953 0.7 n/a n/a
1963 1.5 2.1 n/a
1970 2.1 2.7 9.5
1975 2.2 2.7 12.1
1980 3.3 1.9 18.1
1985 3.6 3.7 19.5
1990 4.1 4.9 20.1
1995 4.5 6.1 20.4
2001 4.3 5.1 18.9
41

EQUITY & DEVELOPMENT World Development Report 2006 Background Papers Table 6. Social Spending Programs in Spain and the OECD, 1980-2001
1980 1985 1990 1995 2001
Spain 15.9 18.2 19.5 21.4 19.6 EU-15 20.6 22.9 23.4 25.6 24.0 Total OECD-23 17.9 19.8 20.9 22.9 22.1 Spain 6.4 7.7 8.3 9.3 8.9 EU-15 8.1 9.0 9.3 10.2 9.9 Old-Age OECD-23 6.9 7.6 8.1 8.9 8.9 Spain 4.3 4.4 5.3 5.5 5.4 EU-15 5.6 5.6 5.7 6.0 6.1 Health OECD-23 5.1 5.2 5.5 5.8 6.1 Spain 2.2 3.1 3.1 2.8 2.1 EU-15 1.7 2.7 2.3 2.9 2.1
Unemployment and active labor policies OECD-23 1.4 2.2 2.0 2.4 1.7
Spain 2.4 2.5 2.3 2.6 2.4 EU-15 3.1 3.1 3.2 3.1 2.9 Incapacity-
related OECD-23 2.5 2.5 2.7 2.7 2.6 Spain 0.5 0.3 0.5 1.1 0.8 EU-15 2.6 2.7 2.9 3.3 3.0 Other OECD-23 2.4 2.4 2.7 3.1 2.9
Source: OECD 2004, Social Expenditure Database.
42

EQUITY & DEVELWorld DevelopmBackground Papers
OPMENT ent Report 2006
43
Table 7. Tax Revenues and Tax Structure in Spain, 1965-2000
Tax Revenues Personal Income Tax Social Security Tax As % of GDP as % of Total Taxes as % of Total Taxes
1965 14.7 14.3 28.3
1970 16.3 11.5 37.4
1975 18.8 14.5 47.5
1980 23.1 20.4 48.6
1985 27.8 19.7 41.3
1990 33.2 21.7 35.4
1995 32.8 23.6 36.2
2000 35.2 18.7 35.1
Source: OECD (2002).

EQUITY & DEVELOPMENT World Development Report 2006 Background Papers
Figure 1. GDP per capita, 1820-1930
0
1000
2000
3000
4000
5000
6000
7000
8000
1820 1850 1870 1875 1880 1885 1890 1895 1900 1905 1910 1915 1920 1925 1930
Year
Con
stan
t $ o
f 199
5
France Germany Italy UK Spain USA
44

EQUITY & DEVELOPMENT World Development Report 2006 Background Papers
45

EQUITY & DEVELOPMENT World Development Report 2006 Background Papers
Figure 2. Sectoral Distribution of GDP in Spain, 1850-1930
0
1000
2000
3000
4000
5000
6000
7000
8000
9000
10000
1850 1860 1870 1880 1890 1900 1910 1920 1930
Year
Pese
tas
of 1
995
(Mill
ion)
ServicesConstructionIndustryAgriculture
46
EQUITY & DEVELOPMENT World Development Report 2006 Background Papers
47

EQUITY & DEVELOPMENT World Development Report 2006 Background Papers
Figure 3. Annual Growth Rates in Spain, 1930-2000
-25
-20
-15
-10
-5
0
5
10
15
1930 1935 1940 1945 1950 1955 1960 1965 1970 1975 1980 1985 1990 1995 2000
GD
P an
nual
gro
wth
rate
48

EQUITY & DEVELOPMENT World Development Report 2006 Background Papers
49

EQUITY & DEVELOPMENT World Development Report 2006 Background Papers
Figure 4. Sectoral Distribution of GDP in Spain, 1930-2000
0
10000
20000
30000
40000
50000
60000
70000
80000
90000
100000
1930 1940 1950 1960 1970 1980 1990 2000
Year
Pese
tas
of 1
995
(Mill
ion)
ServicesConstructionIndustryAgriculture
50

EQUITY & DEVELOPMENT World Development Report 2006 Background Papers
51

EQUITY & DEVELOPMENT World Development Report 2006 Background Papers
Figure 5Inter-Regional Inequality in Spain
0.1
0.15
0.2
0.25
0.3
0.35
0.4
1900 1910 1920 1930 1940 1950 1960 1970 1980 1990 2000
Year
Inte
r-reg
iona
l var
iatio
n
STD/M of per capita regional product (Prados 1992) STD of regional per capita income (Perez et al. 1996)
II Republic
Democracy
52
EQUITY & DEVELOPMENT World Development Report 2006 Background Papers
Figure 6General Government Expenditure in Spain, 1970-1998
20
25
30
35
40
45
50
1970 1972 1974 1976 1978 1980 1982 1984 1986 1988 1990 1992 1994 1996 1998
Year
Tota
l Exp
endi
ture
as P
er C
ent o
f GD
P
OECD Spain
53

EQUITY & DEVELOPMENT World Development Report 2006 Background Papers
Figure 7General Government Current Revenues in Spain, 1970-1998
20
25
30
35
40
45
1970 1972 1974 1976 1978 1980 1982 1984 1986 1988 1990 1992 1994 1996 1998
Year
Cur
rent
Rev
enue
as a
Per
Cen
t of G
DP
OECD (unweighted average) Spain
54

EQUITY & DEVELOPMENT World Development Report 2006 Background Papers
Figure 8. Public Revenue and Per Capita Income in Spain, 1960-1997
60 64 65 66
67 68 69 70 71 72
73 75
81
74
82
79
8483
76
80
7877
85 86
87 88
89 9091
92939495
96 97
15
20
25
30
35
40
45
0 2000 4000 6000 8000 10000 12000Per Capita Income (Constant 1985 $)
Cur
rent
Rev
enue
of G
ener
al G
over
nmen
t as
Per
cent
age
of G
DP
Real current revenues under democracyFitted Values Under Democracy with Turnout Equal to 85 Per Cent of the ElectorateFitted Values Under DictatorshipReal current reveneus under Franco
55
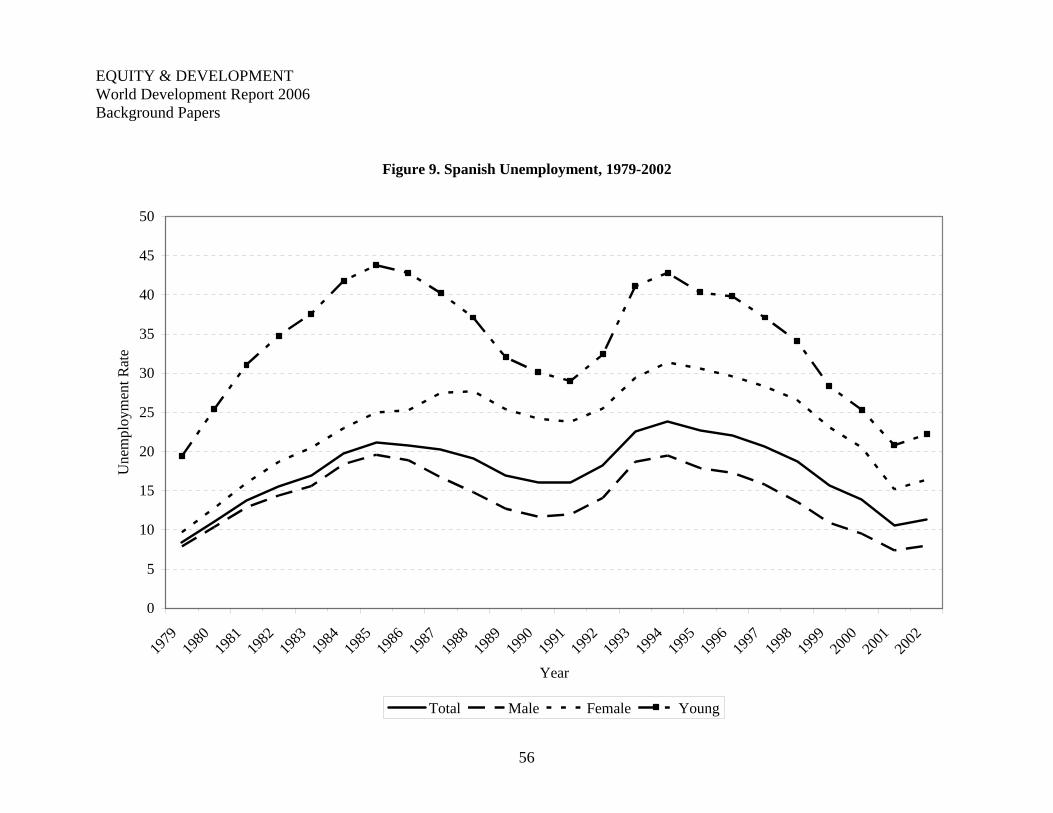
EQUITY & DEVELOPMENT World Development Report 2006 Background Papers
Figure 9. Spanish Unemployment, 1979-2002
0
5
10
15
20
25
30
35
40
45
50
1979
1980
1981
1982
1983
1984
1985
1986
1987
1988
1989
1990
1991
1992
1993
1994
1995
1996
1997
1998
1999
2000
2001
2002
Year
Une
mpl
oym
ent R
ate
Total Male Female Young
56