space observations and monitoring of climate changes
TRANSCRIPT

Space Observations and Monitoring ofSpace Observations and Monitoring ofClimate ChangesClimate Changes -- Indian InitiativesIndian Initiatives
4646thth Session of the Scientific and Technical Subcommittee ofSession of the Scientific and Technical Subcommittee ofUnited Nations Committee On the Peaceful Uses of Outer SpaceUnited Nations Committee On the Peaceful Uses of Outer Space
IAF SYMPOSIUMIAF SYMPOSIUM9th February2009 , Vienna
Dr. KDr. K RadhakrishnanRadhakrishnan
Ind ian Space Research Organisat ion

Increase in rainfall by 15-40% by the end of the 21st
century with high regional variability
Increase in annual mean temperature by 3 to 5°C by theend of 21st century under SRES A2 scenario (morewarming is projected in Northern India)
Changes in frequency and/or magnitude of extremetemperature and events precipitation events.
These changes would result in adverse impacts onagriculture, water resources, health, forests,vulnerability to extreme events, and coastal areas.
Climate Change over India – The Concerns
Increase in rainfall by 15-40% by the end of the 21st
century with high regional variability
Increase in annual mean temperature by 3 to 5°C by theend of 21st century under SRES A2 scenario (morewarming is projected in Northern India)
Changes in frequency and/or magnitude of extremetemperature and events precipitation events.
These changes would result in adverse impacts onagriculture, water resources, health, forests,vulnerability to extreme events, and coastal areas.

1. National Solar Mission2. National Mission for Enhanced Energy Efficiency3. National Mission on Sustainable Habitat4. National Water Mission5. National Mission for Sustaining the Himalayan
Ecosystem6. National Mission for a Green India7. National Mission for Sustainable Agriculture:8. National Mission on Strategic Knowledge for
Climate Change
• India has actively invested in Earth Observation from Space andpresently has a strong cluster of Polar and GEO satellites
• India has actively invested in Earth Observation from Space andpresently has a strong cluster of Polar and GEO satellites
National Action Plan on Climate Change(June 2008)
1. National Solar Mission2. National Mission for Enhanced Energy Efficiency3. National Mission on Sustainable Habitat4. National Water Mission5. National Mission for Sustaining the Himalayan
Ecosystem6. National Mission for a Green India7. National Mission for Sustainable Agriculture:8. National Mission on Strategic Knowledge for
Climate Change

TREND=+0.480C/100 YEARS
-0.8
-0.6
-0.4
-0.2
0
0.2
0.4
0.6
0.8
1901 1911 1921 1931 1941 1951 1961 1971 1981 1991 2001
Y E A R S
Ann
ual M
ean
Tem
p A
nom
alie
s(0C
)
9 POINT BINOMIAL FILTER
Temperature Trends : 1901 to 2008
Maximum Temperature
Minimum Temperature
TREND=+0.480C/100 YEARS
-0.8
-0.6
-0.4
-0.2
0
0.2
0.4
0.6
0.8
1901 1911 1921 1931 1941 1951 1961 1971 1981 1991 2001
Y E A R S
Ann
ual M
ean
Tem
p A
nom
alie
s(0C
)
9 POINT BINOMIAL FILTER
MinimumTemperature
MaximumTemperature
-30
-20
-10
0
10
20
30
1901 1904 1907 1910 1913 1916 1919 1922 1925 1928 1931 1934 1937 1940 1943 1946 1949 1952 1955 1958 1961 1964 1967 1970 1973 1976 1979 1982 1985 1988 1991 1994 1997 2000 2003 2006
Monsoon R/F (% Dep)
Year
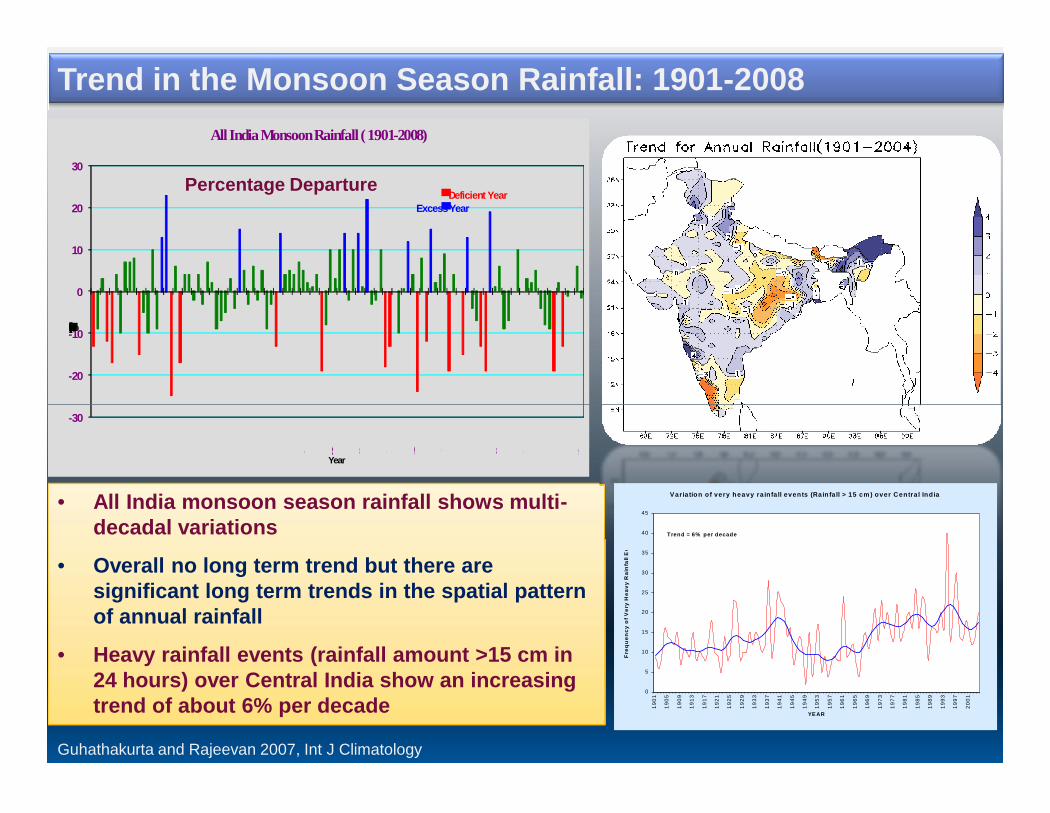
All India Monsoon Rainfall ( 1901-2008)
Deficient YearExcess Year
Unit: mm/dayPercentage Departure
Trend in the Monsoon Season Rainfall: 1901-2008
-30
-20
-10
0
10
20
30
1901 1904 1907 1910 1913 1916 1919 1922 1925 1928 1931 1934 1937 1940 1943 1946 1949 1952 1955 1958 1961 1964 1967 1970 1973 1976 1979 1982 1985 1988 1991 1994 1997 2000 2003 2006
Monsoon R/F (% Dep)
Year
All India Monsoon Rainfall ( 1901-2008)
Deficient YearExcess Year
• All India monsoon season rainfall shows multi-decadal variations
• Overall no long term trend but there aresignificant long term trends in the spatial patternof annual rainfall
• Heavy rainfall events (rainfall amount >15 cm in24 hours) over Central India show an increasingtrend of about 6% per decade
Guhathakurta and Rajeevan 2007, Int J Climatology
Variation of very heavy ra infa ll events (Rainfa ll > 15 cm ) over Centra l Ind ia
0
5
10
15
20
25
30
35
40
45
1901
1905
1909
1913
1917
1921
1925
1929
1933
1937
1941
1945
1949
1953
1957
1961
1965
1969
1973
1977
1981
1985
1989
1993
1997
2001
YEAR
Fre
qu
ency
of V
ery
Hea
vy R
ain
fall
Eve
nts T rend = 6% per decade

Trends in sea-level risemm
Cirrus Clouds (Indian Subcontinent)
• Coastal tide gauge records in India for 40years show a regional MSL rise of 1.29mm per year
• This is consistent with the global sea-level-rise estimates of IPCCRef : Unnikrishnan and Shankar, 2007, Global andPlanetary Change
• Coastal tide gauge records in India for 40years show a regional MSL rise of 1.29mm per year
• This is consistent with the global sea-level-rise estimates of IPCCRef : Unnikrishnan and Shankar, 2007, Global andPlanetary Change
• Spatial distribution of Semi-TransparentCirrus Clouds (KALPANA-1-VHRR)
• Large dominance of convective outflowsin the generation of cirrus clouds
(Updated from Rajeev et al., Geophys. Res. Lett., ‘08)
• Spatial distribution of Semi-TransparentCirrus Clouds (KALPANA-1-VHRR)
• Large dominance of convective outflowsin the generation of cirrus clouds
(Updated from Rajeev et al., Geophys. Res. Lett., ‘08)

1962 BOUNDARY
1999BOUNDARY
1962 BOUNDARY
1999BOUNDARY
2006 BOUNDARY
SNOUT (GAUMUKH)
BHAGIRATI RIVER
Glacier Retreat – Gangotri Glacier
IRS LISS-III SEP 1999
GANGOTRI GLACIER FULLVIEW
IRS LISS-III SEP 2006
Sl no Year Loss in area(Sq.km)
1 1962 – 1999 2.9
2 1999 - 2006 0.6
2006 BOUNDARY

• Large seasonal and inter annual variations
in Aerosol Optical Depth (AOD)
• Overall, the AOD has increased by about
55% during the last 22 yearsRef : Updated from Satheesh et al., 2002
• Large seasonal and inter annual variations
in Aerosol Optical Depth (AOD)
• Overall, the AOD has increased by about
55% during the last 22 yearsRef : Updated from Satheesh et al., 2002
Aerosol Optical Depth (630 nm): (1996-2003)Long-term Space-borne observations of Aerosols
Long-term in situ observationsLong-term in situ observations
Months since Jan 1985 Jan 2007
NOA AAVHRR
IRS – P4 OCM
Long Term Monitoring of Aerosols
Aerosol Optical Depth (630 nm): (1996-2003) NOA AAVHRR
IRS – P4 OCM
Sandhya et al., Ann.Geophys,‘05

LowMediumHighVery highOrchardsAgricultureBarren/riverbed/screeWater bodyShadowSnow/cloud
W.Ghats (Ref : IRS) Himalayas (Ref : IRS)Himalayas (Ref : IRS)
Biodiversity Characterization
LowMediumHighVery highOrchardsAgricultureBarren/riverbed/screeWater bodyShadowSnow/cloud
India's BiodiversityFlora: 7.0% of world’sFauna: 6.5% of world’s

Rocks
SubmergedLive corals
Live coralpatches
CORAL REEFS (SEEN FROM IRS LISS-III DATA)
Rocks
Lagoon
WANDOORWANDOORA & N ISLANDSA & N ISLANDS
Live coralpatches
Deep lagoon
Algal patches
BANGARAM, LAKSHADWEEPBANGARAM, LAKSHADWEEP
Reef crest

Changes in Earth’s Surface Temperature,Evaporation & Monsoon rainfall
Retreating of GlaciersRising Sea levels & increasing ocean acidity; Coral
bleaching
Ocean Currents; Shift in Conveyor belt behavior
Damages from storms, coastal erosion and floods
Impact on Biodiversity: Moving Species & extinction
Consequences of Climate Changes
RainfallChange
Changes in Earth’s Surface Temperature,Evaporation & Monsoon rainfall
Retreating of GlaciersRising Sea levels & increasing ocean acidity; Coral
bleaching
Ocean Currents; Shift in Conveyor belt behavior
Damages from storms, coastal erosion and floods
Impact on Biodiversity: Moving Species & extinction
Droughts, Heat waves,wildfires
Impact on farms, forests,& fisheries
Health (Asthma, Cancer,Malaria etc.
Impact on Economy
Droughts, Heat waves,wildfires
Impact on farms, forests,& fisheries
Health (Asthma, Cancer,Malaria etc.
Impact on Economy
Freq. OfHeat wave
Freq. OfHeavyRainfall

ISRO-GBP Projects Towards Climate Studies1. Aerosol Radiative Forcing over India (ARFI)2. Atmospheric Trace Gases, Chemical Transport & Modelling over India3. Atmospheric Dust, Chemistry & Transport modeling over India4. Atmospheric Boundary Layer Network & Characterization5. Energy and Mass Exchange in Vegetative System6. Land Use Land Cover Dynamics & Impact of Human Dimensions in Indian River Basins7. National Carbon Project8. Quantitative Multi-proxy Paleo-monsoon Reconstruction for the past 21000 years BP9. Regional Climate Modeling
Long Term National Programs
ISRO-GBP NETWORK OF AEROSOLOBSERVATORIES (ARFI)
ISRO-GBP Projects Towards Climate Studies1. Aerosol Radiative Forcing over India (ARFI)2. Atmospheric Trace Gases, Chemical Transport & Modelling over India3. Atmospheric Dust, Chemistry & Transport modeling over India4. Atmospheric Boundary Layer Network & Characterization5. Energy and Mass Exchange in Vegetative System6. Land Use Land Cover Dynamics & Impact of Human Dimensions in Indian River Basins7. National Carbon Project8. Quantitative Multi-proxy Paleo-monsoon Reconstruction for the past 21000 years BP9. Regional Climate Modeling
Shipboard and Airborne Measurements

Satellite Systems for Observing Climate Changes : Present & Future
AtmosphereOceanSat-I Aerosols
MSMR Rain rate, Column Integrated WaterVapour Cloud Liquid Water Content
INSAT Series Clouds, Radiation
KALPANA-1 Clouds, Radiation, Upper TroposphericHumidity
OceanSat-II Aerosols
LandPresent Satellites
Future Satellites
IRS Series Vegetation, Land Use,Coastal Zone, Glaciers
Oceansat-1 Ice/Snow (MSMR)Cartosat-1 Land use, Urbanization
INSAT Series Vegetation
IRS Series,Oceansat-2
Vegetation, Land Use,Coastal Zone, Glaciers
RISAT Land ProfileINSAT Series Vegetation
Present Satellites
Future Satellites
Ocean
OceanSat-II Aerosols
INSAT Series Clouds, Radiation
INSAT-3D Temperature, humidity profiles, clouds
Megha-Tropiques
Radiation budget, Water vapour profile,Integrated Water Content, SatelliteOccultation for temperature and humidityprofiles
I-STAG Aerosols (Profiles and column integrated),Air Chemistry
Oceansat-1 Ocean color, Chlorophyll,Ocean sediments (OCM)SST, Surface Wind (MSMR)
OceanSat-II
Ocean color, Chlorophyll,Ocean sediments (OCM-II) ,Altimetry, Surface Wind (SAR)
INSAT Series Sea Surface Temperature
Megha-Tropiques
Sea Surface Wind, SST
Present
Future
INSAT Series Vegetation
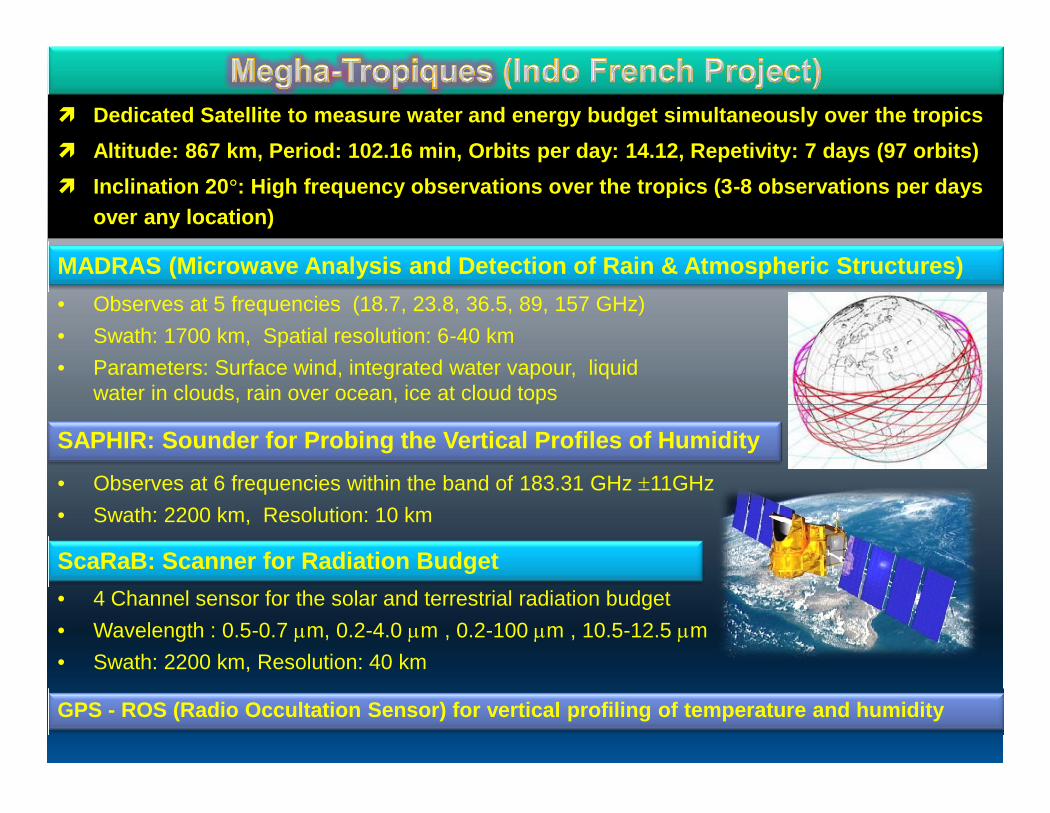
Dedicated Satellite to measure water and energy budget simultaneously over the tropics Altitude: 867 km, Period: 102.16 min, Orbits per day: 14.12, Repetivity: 7 days (97 orbits) Inclination 20°: High frequency observations over the tropics (3-8 observations per days
over any location)
MADRAS (Microwave Analysis and Detection of Rain & Atmospheric Structures)• Observes at 5 frequencies (18.7, 23.8, 36.5, 89, 157 GHz)• Swath: 1700 km, Spatial resolution: 6-40 km• Parameters: Surface wind, integrated water vapour, liquid
water in clouds, rain over ocean, ice at cloud tops
• Observes at 5 frequencies (18.7, 23.8, 36.5, 89, 157 GHz)• Swath: 1700 km, Spatial resolution: 6-40 km• Parameters: Surface wind, integrated water vapour, liquid
water in clouds, rain over ocean, ice at cloud tops
SAPHIR: Sounder for Probing the Vertical Profiles of Humidity
• Observes at 6 frequencies within the band of 183.31 GHz 11GHz• Swath: 2200 km, Resolution: 10 km
ScaRaB: Scanner for Radiation Budget• 4 Channel sensor for the solar and terrestrial radiation budget• Wavelength : 0.5-0.7 m, 0.2-4.0 m , 0.2-100 m , 10.5-12.5 m• Swath: 2200 km, Resolution: 40 km
GPS - ROS (Radio Occultation Sensor) for vertical profiling of temperature and humidity
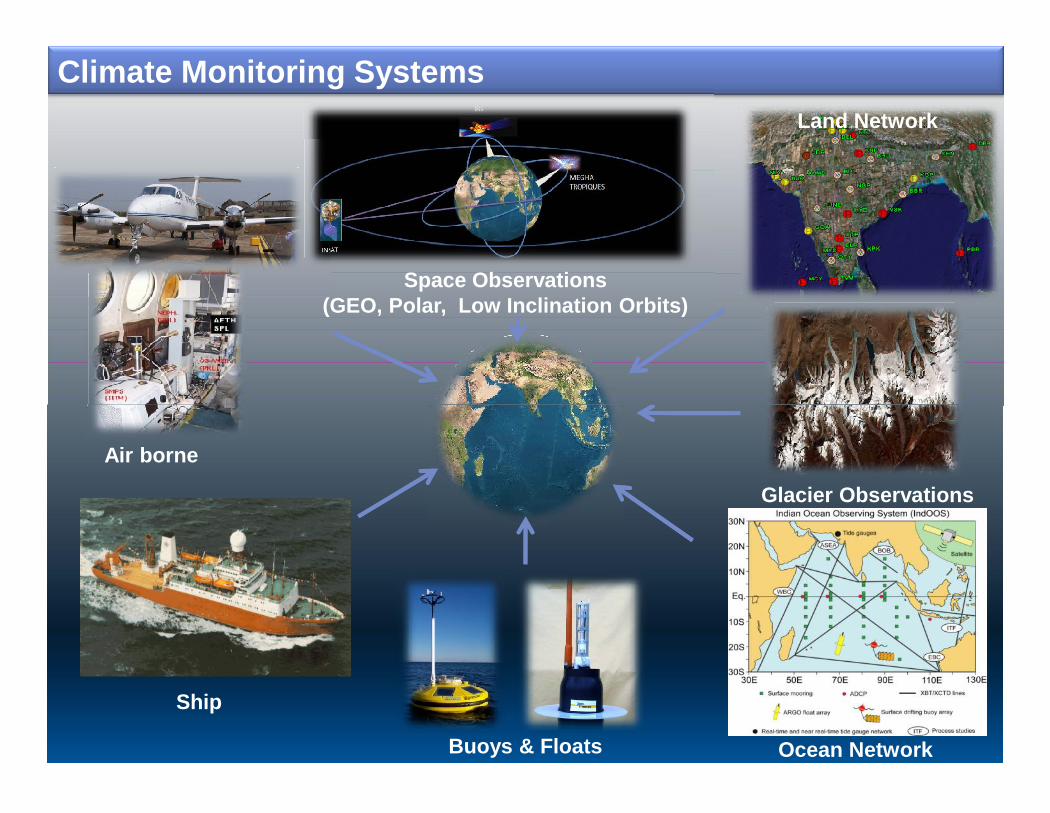
Climate Monitoring Systems
Space Observations(GEO, Polar, Low Inclination Orbits)
Land Network
Air borne
Ship
Buoys & Floats Ocean Network
Glacier Observations

Studies on Climate Change : The Strategy
• Satellite-based observations• National Network of Land Stations for Aerosols• National Network of Metrological Observatories for surface and upper-air• Buoys• Dedicated Ship-borne and Air-borne Observations
Integrated Approach
Integration into CLIMATE MODELS for understanding of the phenomena VALIDATION OF THE CLIMATE MODEL projections (particularly short-
term projections) Integration into climate models for LONG-TERM FORECASTING of
climate Undertaking the necessary CORRECTIVE MEASURES AND PLANNING
Leading to
Integration into CLIMATE MODELS for understanding of the phenomena VALIDATION OF THE CLIMATE MODEL projections (particularly short-
term projections) Integration into climate models for LONG-TERM FORECASTING of
climate Undertaking the necessary CORRECTIVE MEASURES AND PLANNING
Leading to

Thank YouThank You