space e ciency of technical installations in tall o ce
TRANSCRIPT

Space Efficiency of TechnicalInstallations in Tall Office BuildingsAn early stage analysis based on HVAC, elevators, water distributionand fire safety design
Master’s thesis in Structural Engineering and Building Technology
HENRIC ERNTOFTTOR LUNDBERG
Department of Architecture and Civil Engineering
CHALMERS UNIVERSITY OF TECHNOLOGY
Master’s Thesis ACEX30-19-38
Gothenburg, Sweden 2019


Master’s Thesis ACEX30-19-38
Space Efficiency of Technical
Installations in Tall Office Buildings
An early stage analysis based on HVAC, elevators,
water distribution and fire safety design
HENRIC ERNTOFT
TOR LUNDBERG
Department of Architecture and Civil Engineering
Division of Building Services Engineering
Chalmers University of Technology
Gothenburg, Sweden 2019


Space Efficiency of Technical Installations in Tall Office Buildings
An early stage analysis based on HVAC, elevators, water distribution
and fire safety design
© HENRIC ERNTOFT, 2019
© TOR LUNDBERG, 2019
Supervisor: Goran Andersson, GICON Installationsledning AB
Examiner: Jan Gusten, ACE Building Services Engineering
Master’s Thesis ACEX30-19-38
Department of Architecture and Civil Engineering
Division of Building Services Engineering
Chalmers University of Technology
SE-412 96 Gothenburg
Telephone: +46 31 772 1000
Cover: Visualization of a tall building with technical systems made in SketchUp.


Space Efficiency of Technical Installations in Tall Office Buildings
An early stage analysis based on HVAC, elevators, water distribution and
fire safety design
HENRIC ERNTOFT
TOR LUNDBERG
Department of Architecture and Civil Engineering
Chalmers University of Technology
Abstract
Tall buildings are becoming more common in Sweden and the progress will require
knowledge within the field. This thesis is aimed at an early stage analysis and
investigates the technical systems for HVAC, elevators, water distribution and fire
safety design in tall office buildings with focus on space efficiency and the distri-
bution of the systems. The thesis is meant to illustrate the importance of design
choices rather than to provide optimized solutions.
Information about relevant system choices was gathered through a literature study
and by interviewing professionals within the field. A case study was performed
where three fictitious buildings of increasing height were investigated. For each of
the mentioned systems, a number of possible configurations were tested in all three
buildings to investigate the effects of increasing height and design choices on the
space efficiency and the distribution of the systems.
The results show that the space efficiencies of the studied systems are affected
differently by the building height and that some design choices are more beneficial
with respect to space efficiency. It was also evident that some of the systems have a
greater potential of space saving than others. Additionally, it was seen that the dis-
tribution and sectioning vary between the systems depending on the requirements
and prerequisites of each system.
While it is recognized that many aspects need to be taken into account in a build-
ing project, the results in this report is considered to have the potential of being a
support in an early stage analysis of tall office buildings.
Keywords: Tall office buildings, high-rise, space efficiency, HVAC, water distribu-
tion, elevators, fire safety

Yteffektivitet hos tekniska installationer i hoga kontorsbyggnader
En analys i tidigit skede baserad pa VVS, hissar, vattendistribution och brandsak-
erhet
HENRIC ERNTOFT
TOR LUNDBERG
Institutionen for Arkitektur och samhallsbyggnadsteknik
Chalmers tekniska hogskola
Sammanfattning
Hoga byggnader blir allt vanligare i Sverige och utvecklingen kommer att krava
kunskap inom omradet. Detta arbete riktar sig mot ett tidigt analysskede och
undersoker de tekniska systemen for VVS, hissar, vattendistribution och brand-
sakerhet i hoga kontorsbyggnader med fokus pa yteffektivitet och sektionering av
systemen. Arbetet avser att illustrera vikten av designval snarare an att forse op-
timerade losningar.
Information gallande relevanta systemval samlades genom en litteraturstudie samt
intervjuer med yrkesverksamma inom omradet. En fallstudie genomfordes dar tre
fiktiva byggnader med okande hojd undersoktes. For de namnda systemen tes-
tades ett antal olika konfigurationer i de tre byggnaderna for att undersoka hur en
okad byggnadshojd och designval paverkar yteffektiviten och sektioneringen av de
tekniska systemen.
Resultaten visar att yteffektiviteten hos de undersokta systemen paverkas olika
av den okande byggnadshojden och att vissa designval ar mer fordelaktiga med
avseende pa yteffektivitet. Det var aven tydligt att vissa system har en storre
potential for besparing av yta an andra. Vidare noterades att fordelningen och
sektioneringen varierade mellan de olika systemen beroende pa systemens krav och
forutsattningar.
Samtidigt som det inses att manga aspekter maste tas hansyn till i ett byggprojekt
sa bedoms resultaten i denna rapport ha potential att vara en bidragande del i ett
tidigt analysskede av hoga kontorsbyggnader.
Nyckelord: Hoga kontorsbyggnader, hoghus, yteffektivitet, VVS, vattendistribu-
tion, hissar, brandsakerhet

Table of contents
Preface I
Abbreviations II
List of Figures III
List of Tables VI
1 Introduction 1
1.1 Background . . . . . . . . . . . . . . . . . . . . . . . . . . . . . . . 1
1.2 Purpose and aim . . . . . . . . . . . . . . . . . . . . . . . . . . . . 2
1.3 Objectives . . . . . . . . . . . . . . . . . . . . . . . . . . . . . . . . 3
1.4 Delimitations . . . . . . . . . . . . . . . . . . . . . . . . . . . . . . 3
1.5 Previous work and knowledge in the field . . . . . . . . . . . . . . . 4
1.6 Disposition . . . . . . . . . . . . . . . . . . . . . . . . . . . . . . . 5
2 Theory 6
2.1 Tall buildings . . . . . . . . . . . . . . . . . . . . . . . . . . . . . . 6
2.1.1 Definition . . . . . . . . . . . . . . . . . . . . . . . . . . . . 6
2.1.2 Why tall buildings? . . . . . . . . . . . . . . . . . . . . . . . 8
2.1.3 History of tall buildings . . . . . . . . . . . . . . . . . . . . 9
2.1.4 Space efficiency . . . . . . . . . . . . . . . . . . . . . . . . . 11
2.1.5 Room height . . . . . . . . . . . . . . . . . . . . . . . . . . 12
2.1.6 Technical rooms . . . . . . . . . . . . . . . . . . . . . . . . . 12
2.1.7 Building dimensions . . . . . . . . . . . . . . . . . . . . . . 12
2.1.8 Stack Effect . . . . . . . . . . . . . . . . . . . . . . . . . . . 13
2.1.9 Building areas - definitions . . . . . . . . . . . . . . . . . . . 15
2.1.10 Key performance indicators . . . . . . . . . . . . . . . . . . 19
2.1.10.1 Economical key performance indicators . . . . . . . 19
2.1.10.2 Technical key performance indicators . . . . . . . . 20
2.2 HVAC . . . . . . . . . . . . . . . . . . . . . . . . . . . . . . . . . . 20

TABLE OF CONTENTS TABLE OF CONTENTS
2.2.1 Cooling demand . . . . . . . . . . . . . . . . . . . . . . . . . 20
2.2.2 Means of cooling and ventilating . . . . . . . . . . . . . . . 21
2.2.2.1 Airborne cooling . . . . . . . . . . . . . . . . . . . 21
2.2.2.2 Waterborne cooling . . . . . . . . . . . . . . . . . . 22
2.2.3 Centralized and decentralized ventilation systems . . . . . . 23
2.3 Elevators . . . . . . . . . . . . . . . . . . . . . . . . . . . . . . . . . 25
2.3.0.1 Control . . . . . . . . . . . . . . . . . . . . . . . . 25
2.3.0.2 Machine room . . . . . . . . . . . . . . . . . . . . 26
2.3.0.3 Configuration . . . . . . . . . . . . . . . . . . . . . 26
2.3.0.4 Elevator rope . . . . . . . . . . . . . . . . . . . . . 28
2.3.0.5 Rescue elevator . . . . . . . . . . . . . . . . . . . . 29
2.3.1 Stairwells . . . . . . . . . . . . . . . . . . . . . . . . . . . . 29
2.4 Water distribution . . . . . . . . . . . . . . . . . . . . . . . . . . . 30
2.4.1 Water pressurization system . . . . . . . . . . . . . . . . . . 30
2.4.2 Wastewater treatment . . . . . . . . . . . . . . . . . . . . . 32
2.5 Fire safety . . . . . . . . . . . . . . . . . . . . . . . . . . . . . . . . 34
2.5.1 Stairwells and evacuation . . . . . . . . . . . . . . . . . . . . 35
2.5.2 Alternative means of evacuation . . . . . . . . . . . . . . . . 36
2.5.3 Fire ladders . . . . . . . . . . . . . . . . . . . . . . . . . . . 36
2.5.4 Pressurization of shafts and stairwells . . . . . . . . . . . . . 36
2.5.5 Pressurization of pipes . . . . . . . . . . . . . . . . . . . . . 37
2.5.5.1 Sprinkler pressurization . . . . . . . . . . . . . . . 37
2.5.5.2 Water mist pressurization . . . . . . . . . . . . . . 39
2.5.5.3 Risers and pressurized risers . . . . . . . . . . . . . 39
3 Method 41
3.1 Case study . . . . . . . . . . . . . . . . . . . . . . . . . . . . . . . . 41
3.1.1 HVAC . . . . . . . . . . . . . . . . . . . . . . . . . . . . . . 44
3.1.1.1 Ventilation . . . . . . . . . . . . . . . . . . . . . . 44
3.1.1.2 Cooling . . . . . . . . . . . . . . . . . . . . . . . . 44
3.1.1.3 Air handling plant room size . . . . . . . . . . . . 45
3.1.1.4 Ducts and shafts . . . . . . . . . . . . . . . . . . . 46
3.1.2 Elevators . . . . . . . . . . . . . . . . . . . . . . . . . . . . 46
3.1.3 Water distribution . . . . . . . . . . . . . . . . . . . . . . . 47
3.1.4 Fire safety . . . . . . . . . . . . . . . . . . . . . . . . . . . . 49
4 Analysis 51
4.1 HVAC . . . . . . . . . . . . . . . . . . . . . . . . . . . . . . . . . . 51
4.1.1 Results . . . . . . . . . . . . . . . . . . . . . . . . . . . . . . 51
5

TABLE OF CONTENTS TABLE OF CONTENTS
4.1.2 Reflections . . . . . . . . . . . . . . . . . . . . . . . . . . . . 58
4.1.2.1 Space efficiency . . . . . . . . . . . . . . . . . . . . 58
4.1.2.2 Waterborne vs. airborne cooling . . . . . . . . . . 59
4.1.2.3 Distribution . . . . . . . . . . . . . . . . . . . . . . 59
4.2 Elevators . . . . . . . . . . . . . . . . . . . . . . . . . . . . . . . . . 61
4.2.1 Results . . . . . . . . . . . . . . . . . . . . . . . . . . . . . . 61
4.2.2 Reflections . . . . . . . . . . . . . . . . . . . . . . . . . . . . 68
4.2.2.1 Zone choices . . . . . . . . . . . . . . . . . . . . . 68
4.2.2.2 Sky lobbies . . . . . . . . . . . . . . . . . . . . . . 68
4.3 Water distribution . . . . . . . . . . . . . . . . . . . . . . . . . . . 69
4.3.1 Results . . . . . . . . . . . . . . . . . . . . . . . . . . . . . . 69
4.3.2 Reflections . . . . . . . . . . . . . . . . . . . . . . . . . . . . 72
4.4 Fire safety . . . . . . . . . . . . . . . . . . . . . . . . . . . . . . . . 73
4.4.1 Results . . . . . . . . . . . . . . . . . . . . . . . . . . . . . . 73
4.4.1.1 Sprinkler system . . . . . . . . . . . . . . . . . . . 73
4.4.1.2 Water mist . . . . . . . . . . . . . . . . . . . . . . 76
4.4.2 Reflections . . . . . . . . . . . . . . . . . . . . . . . . . . . . 78
4.5 The value of space efficiency . . . . . . . . . . . . . . . . . . . . . . 79
4.6 Sources of error . . . . . . . . . . . . . . . . . . . . . . . . . . . . . 79
4.6.1 HVAC . . . . . . . . . . . . . . . . . . . . . . . . . . . . . . 79
4.6.2 Elevators . . . . . . . . . . . . . . . . . . . . . . . . . . . . 80
4.6.3 Water distribution . . . . . . . . . . . . . . . . . . . . . . . 80
4.6.4 Fire safety . . . . . . . . . . . . . . . . . . . . . . . . . . . . 81
4.7 Further studies . . . . . . . . . . . . . . . . . . . . . . . . . . . . . 81
5 Conclusion 83
References 85
6

Preface
This master’s thesis investigates technical installations in tall office buildings and
expresses these in terms of space efficiency and distribution within the building.
The idea for the master’s thesis was proposed to us by GICON Installationsledning
AB and the study was conducted at their office from January to June, 2019.
First and foremost we would like express our gratitude to our supervisors. We
thank Goran Andersson at GICON for sharing his expert knowledge with us and
for all the valuable and interesting discussions that have advanced both the mas-
ter’s thesis and our understanding of buildings overall. We thank Jan Gusten at
Chalmers for all the encouragement and guidance during the master’s thesis work.
In moments of doubt we always felt that we were back on track after our discussions.
Secondly, we would like to thank to our opponent, Inga Sierpinska, for the valuable
input that a fresh pair of eyes can provide in combination with knowledge on the
subject.
Lastly, we would like to thank the entire staff at GICON for their help and es-
pecially for making these months an enjoyable time.
Gothenburg, June 2019
HENRIC ERNTOFT
TOR LUNDBERG
I

Abbreviations
AHU - Air handling unit
BA - Building area
BBR - Boverket´s building regulations – mandatory provisions and general recom-
mendations (Boverkets byggregler)
BBRAD - The Swedish National Board of Housing, Building and Planning’s general
recommendations on the analytical design of a building’s fire protection (Boverkets
byggregler analytisk dimensionering)
GEA - Gross external area
HVAC - Heating, ventilation and air conditioning
HWC - Hot water circulation
KPI - Key performance indicator
MER - Mechanical equipment room
MWC - Meter water column
NIA - Net internal area
NPP - Neutral pressure plane
OH - Ordinary hazard
PA - Premises area
PBF - Plan and building regulations (Plan- och byggforodningen)
PBL - Plan and building act (Plan- och bygglagen)
PPD - Percentage of people dissatisfied
PRV - Pressure reducing valve
SBF - The Swedish Fire Protection Association (Svenska Brandskyddsforeningen)
SFP - Specific fan power
II

List of Figures
2.1 Tall, supertall and megatall buildings illustrated with examples (CT-
BUH, 2015b). . . . . . . . . . . . . . . . . . . . . . . . . . . . . . . 7
2.2 Tall buildings through history in percentages per region (CTBUH,
2019c). . . . . . . . . . . . . . . . . . . . . . . . . . . . . . . . . . . 10
2.3 Number of completions and sum of heights(m) in 2017. Only build-
ings above 200 meters are shown(CTBUH, 2019c). . . . . . . . . . . 11
2.4 Positive and negative pressure differences and location of the neutral
pressure plane. . . . . . . . . . . . . . . . . . . . . . . . . . . . . . 14
2.5 Wind speeds over the height of the building, wind speed depends on
geographical location and type of landscape. . . . . . . . . . . . . . 15
2.6 The area within the red boundary illustrates the net internal area
which is measured between the outer walls of the building. . . . . . 16
2.7 Gross external area (GEA). The orange area characterizes gross ex-
ternal area. . . . . . . . . . . . . . . . . . . . . . . . . . . . . . . . 17
2.8 The area underneath the building characterizes building area. . . . 18
2.9 Examples of areas in a building which are defined as Atemp. . . . . . 18
2.10 The different areas of a building and their connection to each other. 19
2.11 Machine room, machine room-less (Al-Kodmany, 2015). . . . . . . . 26
2.12 Elevators with different configurations. Zoning choices, double-deckers
and sky lobbies are illustrated (Jong, 2008). . . . . . . . . . . . . . 27
2.13 Double-deckers with escalators (Simmonds, 2015) . . . . . . . . . . 28
2.14 Total cost over 20 years for different water distribution systems
(Nielsen & Nørgaard, 2018). . . . . . . . . . . . . . . . . . . . . . . 32
2.15 Probability flow and its relation to standard flow. . . . . . . . . . . 33
2.16 Heights relevant to fire safety. . . . . . . . . . . . . . . . . . . . . . 35
2.17 The pressure loss is dependent on the water flow through the sprin-
kler and velocity of the water. . . . . . . . . . . . . . . . . . . . . . 38
III

LIST OF FIGURES LIST OF FIGURES
3.1 The three buildings next to each other. The height of each building
is given and a person is placed at the bottom left of each building
for scale. . . . . . . . . . . . . . . . . . . . . . . . . . . . . . . . . . 42
3.2 The example buildings next to existing tall buildings. Original graphic
from (CTBUH, 2015b). . . . . . . . . . . . . . . . . . . . . . . . . . 43
3.3 Shaft for tap water, wastewater and hot water circulation. . . . . . 48
4.1 Building 1 with the three ventilation configurations for waterborne
cooling at 30 w/m2. Marked in blue is the plant rooms and venti-
lation ducts. A person is placed at the bottom left of each building
for scale. . . . . . . . . . . . . . . . . . . . . . . . . . . . . . . . . . 53
4.2 Building 2 with the three ventilation configurations for waterborne
cooling at 30 W/m2. Marked in blue is the plant rooms and venti-
lation ducts. A person is placed at the bottom left of each building
for scale. . . . . . . . . . . . . . . . . . . . . . . . . . . . . . . . . . 55
4.3 Building 3 with the three ventilation configurations for waterborne
cooling at 30 W/m2. Marked in blue is the plant rooms and venti-
lation ducts. A person is placed at the bottom left of each building
for scale. . . . . . . . . . . . . . . . . . . . . . . . . . . . . . . . . . 57
4.4 Building 1 with its three elevator configurations, C1, C2 and C3
from left to right. The elevator shafts are marked in grey and the
mechanical rooms are marked in black. A person is placed at the
bottom left of each building for scale. . . . . . . . . . . . . . . . . . 63
4.5 Building 2 with its three elevator configurations, C1, C2 and C3
from left to right. The elevator shafts are marked in grey and the
mechanical rooms are marked in black. A person is placed at the
bottom left of each building for scale. . . . . . . . . . . . . . . . . . 65
4.6 Building 3 with its three elevator configurations, C1, C2 and C3
from left to right. The elevator shafts are marked in grey and the
mechanical rooms are marked in black. A person is placed at the
bottom left of each building for scale. . . . . . . . . . . . . . . . . . 67
4.7 Buildings 1,2 and 3. Water distribution. The pump rooms and pipe
shafts are marked in blue. A person is placed at the bottom left of
each building for scale. . . . . . . . . . . . . . . . . . . . . . . . . . 71
4.8 Buildings 1,2 and 3. Sprinkler sectioning with pump rooms and water
tanks marked in red. A person is placed at the bottom left of the
building for scale. . . . . . . . . . . . . . . . . . . . . . . . . . . . . 75
IV

LIST OF FIGURES LIST OF FIGURES
4.9 Buildings 1,2 and 3. Water mist. The pump rooms and pipe ducts
are marked in yellow. A person is placed at the bottom left of each
building for scale. . . . . . . . . . . . . . . . . . . . . . . . . . . . . 77
V

List of Tables
2.1 Height to gross external area ratios of tall buildings. Source: (Sev &
Ozgen, 2009). . . . . . . . . . . . . . . . . . . . . . . . . . . . . . . 13
2.2 The fire safe stairwells required for offices at certain number of floors
if one stairwell is considered sufficient. . . . . . . . . . . . . . . . . 35
3.1 Example buildings with data . . . . . . . . . . . . . . . . . . . . . . 42
3.2 Ventilation rates for water and airborne cooling for different cooling
needs. . . . . . . . . . . . . . . . . . . . . . . . . . . . . . . . . . . 44
3.3 Waterborne and airborne cooling configurations. . . . . . . . . . . . 45
4.1 Area taken by the ventilation solutions for Building 1 expressed in
percentages. Shown also is the number of floors supplied from one
plant room. In parenthesis is the number of odd floors. . . . . . . . 52
4.2 Area taken by the ventilation solutions for Building 2 expressed in
percentages. Shown also is the number of floors supplied from one
plant room. In parenthesis is the number of odd floors. . . . . . . . 54
4.3 Area taken by the ventilation solutions for Building 3 expressed in
percentages. Shown also is the number of floors supplied from one
plant room. In parenthesis is the number of odd floors. . . . . . . . 56
4.4 Building 1. Possible elevator configurations and the area taken by
each, expressed in percentages of the GEA. . . . . . . . . . . . . . . 62
4.5 Building 2. Possible elevator configurations and the area taken by
each, expressed in percentages of the GEA. . . . . . . . . . . . . . . 64
4.6 Building 3. Possible elevator configurations and the area taken by
each, expressed in percentages of the GEA. . . . . . . . . . . . . . . 66
4.7 Water pressure and pressure losses for tap water. . . . . . . . . . . 69
4.8 Pump area, shaft area and total area for buildings 1,2 and 3. . . . . 70
4.9 Space efficiency of water pump area. . . . . . . . . . . . . . . . . . 70
4.10 Water pressure at the 25th floor. . . . . . . . . . . . . . . . . . . . 73
VI

LIST OF TABLES LIST OF TABLES
4.11 Area needed for sprinkler rooms. The tank height is chosen as 2.5 m.
The sprinkler area is for each floor that a sprinkler room is located
and the water tank area is for each floor that a water tank is located. 74
4.12 Space efficiency for sprinkler rooms. . . . . . . . . . . . . . . . . . . 74
4.13 Area needed for water mist room. The tank height is chosen as 2.5
m. The water mist central area is for each floor that has a central
and the water tank area is for each floor that has a water tank. . . 76
4.14 Space efficiency for water mist rooms. . . . . . . . . . . . . . . . . . 76
4.15 A space efficiency comparison between sprinkler- and water mist sys-
tems. . . . . . . . . . . . . . . . . . . . . . . . . . . . . . . . . . . . 78
VII

1
Introduction
The definition of a tall building varies depending on who is asked. It could be
a specific number of floors or a height. It can also be that the height creates a
need for certain solutions. In this report emphasis will be put on the latter. Some
buildings will be referred to as high-rises, although the chosen term in most cases
will be ”tall”. The definition is explained in Section 2.1.1.
Tall buildings differ from lower buildings in several aspects. To accommodate the
needs of the occupants in a tall building there are several services that should be
provided. Transportation up and down via elevators have to be solved in a way that
ensures acceptable travel-time as well as not taking up too much space. The venti-
lation system in combination with heating and cooling equipment has to provide a
pleasant indoor climate at the same time as it does not make to much noise or take
up too much space. To provide water it has to be pumped from the bottom of the
building. For a building of a couple of a hundred meters this will require pumping
in steps. Another aspect that requires extra attention in tall buildings is the fire
safety. Both extinguishing the fire and evacuating the building is more difficult. To
provide functional and feasible solutions to these systems requires knowledge and
cooperation between the different disciplines involved in a building project. The
spaces needed for technical installations will be affected as a building gets taller
and this will inevitably affect the economy of the project.
The results of this thesis is intended to provide information on tall building technical
installations at an early stage of the design process.
1.1 Background
There are several reasons for building tall and it has been done successfully in many
parts of the world since the 19th century. Most well known for their tall buildings
is the United States but tall buildings are seen in several other countries as well.
Currently the tallest building, the Burj Khalifa, is situated in the middle east in
the United Arab Emirates.
1

1.2. PURPOSE AND AIM 1. Introduction
The reason for building tall can be to densify an area, to turn a profit on ex-
pensive land or to create a landmark and tourist attraction. Regardless the reason,
knowledge and experience is needed in order to be successful in the endeavour.
Tall buildings are in a sense multiple buildings stacked on top of each other, but
it is not as simple as that. The technical installations has to be positioned and
divided in a way that makes sense both functionally and economically. Unfortu-
nately, there is not an optimal solution that can be applied in all buildings, it will
differ depending on which system is regarded and the local conditions.
Many disciplines are involved in a building project and the project will benefit
from good cooperation at an early stage.
Tall buildings are becoming more common in Sweden as dwellings, hotels and of-
fices. Turning Torso in Malmo has been the tallest building in Sweden since 2005
with its 190 m but is to be surpassed by the 245 m tall Karlatornet in Gothenburg
in 2021. The knowledge in Sweden is growing within the field of tall buildings as
more are being built and the documentation and distribution of the knowledge will
be important for the future of tall building development in Sweden.
1.2 Purpose and aim
The purpose of this thesis is to investigate the technical installations in tall office
buildings and describe them in terms of space efficiency and distribution in the
building.
The aim of this thesis is to gain insight on what affects the design of the tech-
nical installations and how they affect the building design. The outcome of the
thesis should provide insight on the space efficiency and distribution of the chosen
technical systems and hopefully facilitate the early stage analysis process of future
tall office buildings.
2

1.3. OBJECTIVES 1. Introduction
1.3 Objectives
In order to fulfill the purpose and aim of this master thesis the following questions
should be answered:
• What are the difficulties and challenges regarding building height and tech-
nical installations?
• What are the possible and relevant technical solutions for tall buildings?
• At what height are the breaking points and what are the important levels of
each system?
• How is the space efficiency affected by the building height?
1.4 Delimitations
There are many possible aspects and topics that can be discussed and investigated
regarding tall buildings. This master’s thesis focuses on technical installations of
tall office buildings and is intended as support for early stage analysis rather than a
design guide. Focus has been on space efficiency and questions such as energy per-
formance and sustainability have not been considered although they have a great
importance in real projects. The key values for each technical system is chosen
according to perfect conditions. The results are an outcome of the specific choices
that have been made throughout the report.
The master’s thesis has its main focus on the technical installations regarding
HVAC, elevators, water distribution and fire safety. Structural and building physics
aspects will be treated indirectly, to a very limited extent, in order to support the
main focus of the report. Economy will be discussed in the project, since it will
serve to bring relevance to the different technical solutions that will be investigated,
but only to a limited extent. Three fictitious buildings with realistic settings in-
spired by existing solutions are modeled for the case study but no real buildings
are investigated or modeled.
The following issues will be dealt with in this master’s thesis:
• HVAC
• Elevators
• Water distribution
• Fire safety
3

1.5. PREVIOUS WORK AND KNOWLEDGE IN THE FIELD 1. Introduction
1.5 Previous work and knowledge in the field
The non-profit organization Council on Tall Buildings and Urban Habitat (CTBUH)
provides studies and information on tall buildings. The organization is considered
an authority on official height of tall buildings (CTBUH, 2019a).
Akbar Tamboli published Tall and Supertall Buildings: Planning and Design in
which gives extensive overviews of some of the tallest buildings in the world and
also explains tall building systems in general (Tamboli, 2014).
Peter Simmonds has in cooperation with American Society of Heating, Refrigerating
and Air-Conditioning Engineers published ASHRAE Design Guide for Tall, Super-
tall, and Megatall Building Systems that cover most fields involved when planning
and designing tall buildings and emphasis is put on the HVAC systems (Simmonds,
2015).
In the master thesis Space Requirements for Technical Systems in Office Buildings
– Air handling plant room model, from 2015, Emil Kvist investigates the connec-
tion between the size of the air handling plant room and the SFP and airflow. The
impact that different shaft solutions and sizes has on the gross external area in a
building is discussed. It is explained how different fan solutions work and how they
differ from each other and also how this might affect the design in terms of area.
It is shown that there is a space efficiency potential in designing well which also
implies that there are economical benefits (Kvist, 2015).
Grundfos did a study comparing roof tanks with pressurized systems for water
supply in tall buildings. The systems are evaluated over a 20 year period based on
energy cost, initial cost, maintenance cost and lost revenue. Dividing the system
into zones was proved energy efficient as it was possible to keep lower pressures
(Nielsen & Nørgaard, 2018).
Lutfi Al-Sharif published the article The Design of Elevator Systems in High Rise
Buildings which describes elevator solutions available for tall buildings and some
approaches on how to simulate or calculate the right elevator number and configu-
ration (Al-Sharif, 2017).
4

1.6. DISPOSITION 1. Introduction
1.6 Disposition
The areas which will be dealt with in this thesis that are listed in the delimitations
overlaps to some extent which will be seen throughout the report. Water distribu-
tion is a large part of the fire safety and a part of the HVAC as well. However, the
disposition within each chapter is considered appropriate given the content of the
report.
The general disposition of the report is described below.
Chapter 2 - Theory
This chapter presents information regarding tall buildings, technical systems and
factors that are important for tall building design.
Chapter 3 - Method
This chapter describes what has been considered for the technical systems and
also how the case study has been conducted.
Chapter 4 - Analysis
This chapter presents the results and reflections of the case study. Also, possi-
ble sources of error and ideas of further stuides are mentioned.
Chapter 5 - Conclusion
This chapter presents a summary of the analysis and also concludes the report.
5

2
Theory
The theory chapter gives the information regarding tall buildings and technical
installations that is of importance for this thesis. Many factors that are important
for tall building design is described. However, all that is covered in this chapter is
not included in the analysis due to limitations in terms of time and resources.
2.1 Tall buildings
Tall buildings are increasing in numbers as well as in height in many parts of the
world. The definition of a tall building is somewhat changing with time and prefixes
such as ”super” and ”mega” are added as the limit is being pushed. This chapter
will give an explanation of the general conception of what a tall building is and
what is considered in this thesis. The chapter will also explain the main reasons
for building tall and give a brief history of tall buildings.
2.1.1 Definition
There is no one definition of a tall building. The term has different meaning
in different parts of the world and has changed over time. When talking about
tall buildings there are a couple of expressions that are used, such as high-rise,
skyscraper and tower.
Some definitions simply state a required height or number of floors while some
definitions include that the height affects the planning or use. In a Swedish dictio-
nary a high-rise is defined as a house with many floors, usually at least five (SAOL,
2009). This provides a hint as to which buildings could be high-rises but the term
is still rather wide.
Emporis standards gives the definition that a structure with an architectural height
of between 35 and 100 meters is a high-rise building. Alternatively, a building can
be regarded as a high-rise if it has a minimum of 12 floors and less than 40 floors
(Emporis, n.d.-a).
6

2.1. TALL BUILDINGS 2. Theory
According to CTBUH the height relative to the surrounding buildings, the pro-
portions of the building as well as the functions in the building will be determining
whether or not a building is tall. If the building is considered tall in one or more of
these aspects then it it tall. Also, 14 floors or 50 m could be regarded as thresholds
of where a building becomes tall. Furthermore, three levels of tall are identified as
tall (<300m), supertall (>300m) and megatall (>600m), see figure 2.1 (CTBUH,
2015b).
In this thesis the term ”tall” will be used as it is considered to cover all of the
said expressions. A tall building can be identified by its height or the number of
floors but what will be of importance is if the design of the building is influenced
by the fact that it is a tall building, and that is how the concept of tall buildings
will be approached in this thesis.
Figure 2.1: Tall, supertall and megatall buildings illustrated with examples (CTBUH,
2015b).
7

2.1. TALL BUILDINGS 2. Theory
2.1.2 Why tall buildings?
There are several factors and motivations for tall buildings and how these differ will
affect the design of the building.
Urbanisation is one factor that motivates tall buildings. When people on a large
scale move into areas that are already densely populated it is necessary to utilize
the available areas in an efficient way. As of 2018 as much as 55 % of the total world
population are living in urban areas and it is projected to increase to 68 % by the
year 2050 (UN, 2018). When choosing to build tall it is possible to provide housing
or work places for people on these limited spaces. There is an argument that to
densify a city is to make sustainable choices both environmentally and socially. The
necessary means of conveyance are already present which makes for a decreased car
dependency. Densification also increases the probability of spontaneous encounters
which is valued in terms of social sustainability. Furthermore, a denser city can be
a means to reduce segregation and increase security in a city (Boverket, 2017b).
When choosing to densify a city more of the surrounding land is left preserved
which is also of value. There are also economic aspects such as increased possibility
of finding work and decreased transportation costs (Patrik Hostmad, 2012).
There are of course arguments against densification as well. Green areas are often
sacrificed to serve the purpose of densification which is of course seen as negative
by the surroundings. With more buildings there is also the risk of overshadowing
others and preventing access to daylight which can have consequences on the well
being of people. At the same time as it can be advantageous to utilize the already
existing infrastructure and other services there is a risk of overloading which will
create problems for the citizens of the city (Boverket, 2017b). There are also argu-
ments that tall buildings have an alienating effect on people, due to the separation
from the streets, and is thus not good for human health and social functioning
(Villegas, 2018). Nevertheless, tall buildings does serve the purpose of providing
space for many people on a limited area.
Land prices also affect the choice to build tall. In certain areas the prices are
at such high levels that the buildings are required to have a large number of floors
in order to be profitable (Alex Block, 2014). This is what the architect of the Wool-
worth building, Cass Gilbert, was expressing in the year 1900 when he referred to
high-rise buildings as ”the machine that makes the land pay” (Sun, Architecture,
& Planning, 2016). Within this formulation is that the land price is what it is and
whether the price is worth it is up to the property developer, meaning that the
8

2.1. TALL BUILDINGS 2. Theory
design choices are of the essence. Although, it is not as simple as increasing the
height and thereby turning a profit. A ”height threshold” will be reached where the
cost of construction and systems is greater than the potential profit (Wood, 2006).
Prestige is perhaps the reason for the most famous tall buildings in the world.
In history this can be seen with the pyramids and presently with the Burj Khalifa.
This can of course be in combination with densification and high land prices but
when motivated by prestige the building often looks very different compared to
more ”rational” reasons. In these cases the buildings are often very costly (Langdon
& Watts, 2010). In connection to the prestige, there is also the aspect of placemak-
ing in which tall buildings play an important role in their built environment. They
can help by improving the identity of a city and by asserting its position on a global
scale (Al-Kodmany & Ali, 2012). This is very much the case with the Burj Khalifa
in Dubai, which the city is very well known for. Antony Wood of the CTBUH
points out that the trend has gone from having company names (e.g. Woolworth
or Sears) on tall buildings to having the city name (e.g. TAIPEI 101 or Shanghai
Tower) (Wood, 2006).
2.1.3 History of tall buildings
The tallest buildings of today are constructed with advanced technology but tall
structures can be seen even when looking back in history. A famous example is
the pyramids in Egypt, where the tallest one, the pyramid of Khufu, reaches 139
m (Emporis, n.d.-b). In its time it was a considerable height and the structure is
still impressive.
In modern time the first tall buildings are found in the United States and was
made possible partly as a result of the invention of the elevator safety braking sys-
tem in 1852 (Mowrey Elevator, 2018). With the elevator it could be motivated to
have buildings with more than a couple of floors. Another invention to have a large
impact on tall buildings was the steel frame construction which enabled a slender
yet sturdy structure (Marshall, 2015).
The first skyscraper is said to be the Home Insurance Building built in Chicago
1885 by William Le Baron Jenney. This was not the tallest building in the world
but it is considered the first skyscraper due to the new way of construction, with
the steel and iron frame making it more slender. Initially the building consisted of
10 floors but an additional 2 floors were added later on, making it reach 55 m high
(Marshall, 2015).
9

2.1. TALL BUILDINGS 2. Theory
The highest buildings in the world during most of the 20th century could be found
in the US, most of them in New York City. Every couple of years a higher building
was built that took the record title. The Empire State Building had the title the
longest (1931-1972) with its 381 m. It was not until 1998 that a building outside of
the US was the tallest. This was the Petronas Towers in Kuala Lumpur, Malaysia,
with its 452 m. Presently the tallest building in the world is the 828 m high Burj
Khalifa in Dubai, United Arab Emirates (CTBUH, 2015a). In 2013 the construc-
tion of the Jeddah Tower started in Saudi Arabia, the completion is said to be
in 2021. The building is planned to be the highest in the world, possibly higher
than 1000 meters (CTBUH, 2019b). The dominating geographic locations of tall
buildings from 1930 to 2018 is seen in Figure 2.2.
Figure 2.2: Tall buildings through history in percentages per region (CTBUH, 2019c).
As can be seen in Figure 2.2 there is a clear trend of more tall buildings being built
in Asia. Although several Asian countries are building tall China represents the
larger part of the statistics. Figure 2.3 below shows the buildings built in 2017 that
are above 200 meters (Beedle, 2018).
10

2.1. TALL BUILDINGS 2. Theory
Figure 2.3: Number of completions and sum of heights(m) in 2017. Only buildings above
200 meters are shown(CTBUH, 2019c).
2.1.4 Space efficiency
Space efficiency (or area efficiency) is important for all building projects but it can
be more difficult to have a good space efficiency in some projects. Tall buildings
are generally more difficult to get a high space efficiency in due to the increasing
dimensions of both the technical installations and the load bearing structure (Sev
& Ozgen, 2009). When looking at some existing tall buildings the ratio between
net internal area and gross external area could be below 0.8 (Sev & Ozgen, 2009).
In a couple of tall buildings in Sweden it can be seen that the ratio is somewhere
around 0.8.
Space efficiency is important because it can be the difference between if a project
will be feasible or not. Since the cost of construction, materials, operational costs
and more is to be paid for by renting or selling the built space, all space that can
be used for this purpose will be important. The space efficiency of buildings is
different depending on the country. Different regulations apply which dictate e.g.
the needed daylight factor. Different climates will also have an affect on how the
building can be designed (Sev & Ozgen, 2009). Many factors will ultimately be
determining whether a building project will be feasible or not, space efficiency is
one of them.
In this thesis, the space efficiency will be expressed as percentages of the gross
external area (GEA). The GEA and other area definitions are explained in 2.1.9.
11

2.1. TALL BUILDINGS 2. Theory
2.1.5 Room height
The building height is directly affected by the regulations regarding the room height.
The room height differs depending on the use of the room. The expression ”room
height” refers to the height from the floor to the ceiling (not from floor to floor).
For office rooms intended for longer use the minimum height is 2.4 m. In rooms
that are only occupied temporarily it can be as low as 2.1 m in certain areas and 1.9
m if the roof is sloping. In cases when the room is intended for a large number of
people the required room height is 2.7 m. The general aim of the minimum height
is for people not to experience inconvenience. For communication areas such as
hallways, stairs and doors the minimum height is 2.0 m (Boverket, 2018c).
For this thesis the height used for floor to floor is set to 3.6 m with a room height of
2.7 m for the office areas. The distance in between is for the slab, pipes and ducts.
2.1.6 Technical rooms
All of the technical installations will require certain space were the machines,
pumps, fans and other equipment is located. These rooms will naturally need to
house the equipment itself but also provide enough space around the equipment to
enable maintenance work, possibility to change parts etc. For the different systems
there will be natural places for these rooms that depend on the limits and planning
of each system. This might result in each system having its own technical room
and they might be spread out on different floors throughout the building.
If the equipment of the different systems could share spaces then the needed room
for maintenance could be reduced. It would also be easier for the mechanics to have
much equipment gathered as opposed to having is spread in the building.
2.1.7 Building dimensions
As explained in 2.1.1, a contributing factor to why a tall building is perceived as
tall is its proportions, the ratio of the total building height to the gross external
area. Table 2.1 shows the height:area ratio for some of the tallest buildings in the
world. These ratios are the basis of the ratios of the example buildings seen in
Chapter 3.
12

2.1. TALL BUILDINGS 2. Theory
Table 2.1: Height to gross external area ratios of tall buildings. Source: (Sev & Ozgen,
2009).
Height [m] GEA [m2] Ratio
Taipei 101 Tower 509 2650 0.192
Shanhai WFC 492 2500 0.197
Petronas Towers 452 2150 0.210
Jin Mao Tower 421 2800 0.150
Two International Finance Center 415 2800 0.148
CITIC Plaza 391 2230 0.175
Shun Hing Square 384 2160 0.178
Central Plaza 374 2210 0.169
Bank of China 367 2704 0.136
2.1.8 Stack Effect
Stack effect is always present in buildings, but even more so in tall buildings. The
stack effects main driver is the air temperature difference between the indoor air
temperature and the exterior air temperature. The difference between the exterior
and interior temperature could be both positive and negative depending on which
temperature is the highest. A typical hot summer day or a cold winter day, the
pressure inside the building will be different. Somewhere along the height of the
building the interior pressure and the exterior pressure will be equal, this is called
the neutral pressure plane (NPP). In Figure 2.4 stack effect and reverse stack effect
is explained and also how the negative pressure changes to positive pressure above
the NPP.
The facade of the building could be of poor quality, not completely airtight, which
enables air infiltration or exfiltration depending on the differential pressure. The
infiltration or exfiltration will affect the resulting pressure and the resulting pres-
sure will affect the technical installations. The design challenges in tall buildings
due to the differential pressure are, elevator- and swing doors could be difficult
to open, uncomfortable air flow, heating and cooling system not working properly
because of cold or hot air that in- or exfiltrates, the in- and exfiltration could cause
noise and the fire strategy could change due to changed pressure differences since
controlling the spread of fire is often done by controlling the pressure differences
between rooms.
13

2.1. TALL BUILDINGS 2. Theory
Figure 2.4: Positive and negative pressure differences and location of the neutral pressure
plane.
Apart from the stack effects in tall buildings, a large pressure effect is created by
the wind. The wind pressure increases with the height of the building, but it also
differs depending on the surrounding environment. How the wind speed increases
with the height can be seen in Figure 2.5. The sum of both wind pressure and stack
effect will give an indication about the resulting pressure.
14

2.1. TALL BUILDINGS 2. Theory
Figure 2.5: Wind speeds over the height of the building, wind speed depends on geographical
location and type of landscape.
2.1.9 Building areas - definitions
In Sweden the definition of floor areas are defined in the Swedish Standard (SS)
21054:2009 which is used in the design process of non-residential and residential
buildings. It is important to have a definition of each building area as different
countries have different definitions, in this report the Swedish Standard is used.
Net internal area (NIA) is the area which is usable for the resident, the net
internal area together with the sub-area gives the buildings total area. All area of
the building cannot be utilized in the same way, this is why the total area is divided
in sub-area and net internal area . The net internal area is measured between the
outer walls, the inner walls should also be included as seen in Figure 2.6. All of the
floor’s area should be included in net internal area except a floor that has a sloping
15

2.1. TALL BUILDINGS 2. Theory
roof where special rules need to be taken into account. The net internal area equals
the Swedish living area (BOA) is specified for measuring value (Jagemar, 1996).
Figure 2.6: The area within the red boundary illustrates the net internal area which is
measured between the outer walls of the building.
Gross external area (GEA) is the total floor area and is only limited by the
buildings facade. The entresol of the building is also included in gross floor area
but the openings in the floor construction is not included in gross floor area. Gross
floor area is used in many cases such as house valuation and rent regulations. The
gross floor area equals the Swedish gross area (BTA) (Jagemar, 1996).
16

2.1. TALL BUILDINGS 2. Theory
Figure 2.7: Gross external area (GEA). The orange area characterizes gross external area.
Building area (BA) the area of which the building affiliate. The building area is
independent of the building height and is often used in detailed development plan.
Parts of the facade which is protruding is not included in the building area nor
balconies that are higher than 3 meters (Jagemar, 1996).
17

2.1. TALL BUILDINGS 2. Theory
Figure 2.8: The area underneath the building characterizes building area.
Atemp is an abbreviation for tempered area, which is the area within the building
heated above 10 ◦C e.g. floor plan, attic floor and basement floor. Garage, shafts,
internal and exterior walls are not included in Atemp, which is illustrated in Figure
2.9 (Boverket, 2014).
Figure 2.9: Examples of areas in a building which are defined as Atemp.
Premises area (PA) in Sweden (LOA) includes premises area for business LOA(V),
premises area for personnel (toilets, cloakrooms etc.) LOA(P), premises area for
18

2.1. TALL BUILDINGS 2. Theory
horizontal access between premises on the same floor, mainly corridors LOA(K)
(Jagemar, 1996). The connection between different floor areas is shown in Figure
2.10.
Figure 2.10: The different areas of a building and their connection to each other.
2.1.10 Key performance indicators
A performance indicator or key performance indicator (KPI) is a type of perfor-
mance measurement. KPI could be both of technical or economical meaning de-
pending on the context, the border between technical- and economical key perfor-
mance indicators may be very small, this is described in 2.1.10.1 and 2.1.10.2.
2.1.10.1 Economical key performance indicators
Premises area and gross external area are both technical and economical key perfor-
mance indicators due to the fact that they both describe technical space and ratio
between revenue-generating area, premises area and gross external area. Higher
ratio between premises area and gross external area indicates that the building has
a larger floor area that is revenue-generating. Another TKPI is kr/m2 which de-
scribes how much something costs per square meter, it could be e.g land price or
production cost.
19

2.2. HVAC 2. Theory
2.1.10.2 Technical key performance indicators
Different floor ratios could be explained through technical key performance indica-
tors, the floor ratios is of importance when talking about revenue-generating area,
the different floor areas is explained in 2.1.9. Other important TKPI is cooling
need which is how much of cooling is needed per square meter, W/m2. The cooling
need is connected to how much heating surplus the building has which correlates to
higher or lower demand on the air- or waterborne cooling systems. The TKPI of-
ten tells something of importance which has consequences on the technical systems
which in turn affects the economy.
2.2 HVAC
There are several acquis to consider when designing the ventilation system for a
building. The regulations for ventilation are mainly found in the Swedish National
Board of Housing, Building and Planning (Boverkets Byggregler, BBR). Additional
regulations are given by the Swedish Work Environment Authority (Arbetsmiljover-
ket), the Swedish Environmental Code (Miljobalken) and the Public Health Agency
of Sweden (Folkhalsomyndigheten). Sveby provides a compilation of the regulations
with focus on energy use. The compilation suggest values of e.g. temperatures and
air flows.
The general minimum ventilation flow is 0.35 l/s·m2 and 7 l/s·person. For of-
fices the basic ventilation rate is around 1.3 to 1.6 l/s·m2Atemp (Sveby, 2013). The
maximum velocity is between 0.15 - 0.20 m/s (Arbetsmiljoverket, 2018). The set-
points for heating and cooling should be 22 ± 2 ◦C and 24,5 ± 1.5 ◦C for winter
and summer respectively to be within PPD ≤ 10%(Sveby, 2013).
2.2.1 Cooling demand
The cooling need differs vastly depending on a number of factors such as activity,
level of insulation, type of windows and geographic location. The type of activity
that has been considered in this thesis is office work. Dwellings, hotels and similar
are not investigated. Three levels of cooling need has been chosen for offices to
account for some variance in activity. 20, 30 and 40 W/m2 have been used as
the office’s cooling needs based on interviews with professionals within the field.
For offices this cooling need is due to the internal heat gains from people, light,
computers, sun load and other equipment.
20

2.2. HVAC 2. Theory
2.2.2 Means of cooling and ventilating
There are several approaches to handle the cooling need in a building. Two main
categories can be identified as airborne and waterborne (Tamboli, 2014). An air
flow could be supplied at the needed rate and appropriate temperature to ensure a
good indoor climate. Another approach is to utilize the cooling effect of water by
installing e.g. chilled beams. In this case the supplied air flow would only need to
satisfy the hygienic needs. The different approaches are described below.
To better understand what is described in this section see Equation 2.1:
Q = ρ · Cp ·∆T · V (2.1)
Q - effect [W]
ρ - density [kg/m3]
Cp - specific heat capacity [J/kg◦C]
∆T - temperature difference [◦C]
V - volume flow [m3/s]
2.2.2.1 Airborne cooling
When looking at equation 2.1, the cooling need is Q. To handle the cooling need
of a building, supplying the right amount of air is a very viable solution in many
cases. If the building in question is not densely occupied and the internal and ex-
ternal heat loads are at a reasonable level the cooling need is likely to be met by
only ventilating with air that has only a small temperature difference (∆T) to the
room. Should the cooling need be higher, a means of handling this is to increase the
volume flow of air (V). Although, at a certain point the air flow will give velocities
at the air diffuser that are too high and can cause both noise and draught which
will be unpleasant for the occupants of the building. Also, with increased air flows
the whole system will have to be larger which will encroach on other areas in the
building that could be put to better use.
Low-tempered air
A means of handling a high cooling need with air while still keeping the air flows
small is by supplying low-tempered air, i.e. using a large ∆T. As seen in Equa-
tion 2.1, an increased ∆T can be used instead of an increased V. This means that
21

2.2. HVAC 2. Theory
the air flows can be kept at a moderate level while still handling the cooling need.
The main parts of the ventilation system, such as the AHU and ducts, can be of
smaller dimensions and the space saved can be utilized for other purposes. The
low-tempered air does however require other cooling equipment than what would
be required to supply a normal temperature. As large temperature differences as
16 ◦C can be used (Simmonds, 2015). Too large ∆T:s can result in occupants
experiencing draught from the low temperatures and the air flow still has to be
kept high enough to ensure a good air quality. With a well-chosen air diffuser the
low-tempered air will not result in any draught.
2.2.2.2 Waterborne cooling
An effective way to handle the heat surplus is to use waterborne cooling systems
as chilled beams in the office space. The chilled beams could be of passive or
active cooling which is explained below. The temperature of the water in the active
chilled beam should not be too low, a very low water temperature in combination
with a high humidity will result in condensation on the pipes. The difference
between supply- and return water from the chilled beam could be from 2◦C to 10◦C
depending on the indoor climate and cooling need. The waterborne cooling takes
advantage of both the cooling capacity of water and air which is seen in Equation
2.1 where the specific heat capacity and density must be changed to air or water.
If there is a large cooling need waterborne cooling is an effective choice compared
to airborne cooling where the dimensions of the ducts gets very large if not a very
large air flow or low temperature is used. The return water from the chilled beam
needs to be cooled down to supply temperature before returning to the chilled beam
again, this heat surplus needs to be removed either by having cooling towers on the
roof of the building or by using district cooling.
22

2.2. HVAC 2. Theory
Active and passive cooling
There are different ways to achieve comfort cooling in a building, passive cool-
ing or active cooling could be used to reduce the heating surplus. A first step to
reduce the heating surplus could be by decreasing the solar gains with awnings or
sun blinds, changing the lightning system to a more energy efficient or have enough
of insulation in walls and roof. All of these alternatives prevent the building from
being heated in the first place. If these solutions are not enough, then passive or
active cooling could be an alternative to achieve a pleasant indoor climate. The
point with passive cooling is to use cold sources such as a nearby lake, groundwater
or a borehole. The cold water is circulated through a circuit in a building or only
certain rooms which takes away the heat surplus, the coldness could also be diffused
by a fan-radiator (Thermia, 2019). If the passive cooling is not enough to reduce
the heat surplus, active cooling could be an alternative. Active cooling could be
achieved by using a heat pump which is inverted and therefore works as a refrigera-
tor. This could be achieved by reversing the cooling circuit in the heating pump, or
by switching over the primary and secondary connection on the pump (Viessmann,
2019). A common choice regarding cooling is to use active or passive chilled beams,
the active chilled beam is connected to both ventilation supply air ductwork and
the chilled water system. The passive chilled beam has no supply air connected to
it, but it has a cooling battery which works due to natural convection. The air is
cooled which changes the density of the air and therefore the cooled air drops, the
air gets heated by the surroundings which changes the density of the air and the air
rises, this procedure continues over and over again. Due to the natural convection,
passive chilled beams are not suitable over working spaces but the cooling effect
from the beam could be rather large (Flaktwoods, 2008).
2.2.3 Centralized and decentralized ventilation systems
In Sweden most types of ventilation systems are centralized, the owner of the build-
ing is responsible for all of the technical installations and their functions. The tenant
has no responsibility regarding the technical installations, the rent from the tenant
should cover the costs for the maintenance which the owners pays for (Nathan,
2018). A central air handling unit (AHU) is distributing the supply air via the
ductwork. The base demand in the meaning of air temperature and air humidity
is distributed by the AHU, if a certain room or area have a different demand this
could be achieved by adding a cooling or heating coil in the ductwork before the
supply air enters the room or area. In other countries as USA decentralized sys-
tems are more common compared to Sweden (Nathan, 2018). It is common that
23

2.2. HVAC 2. Theory
the tenant has their own AHU, the tenant could choose which solution of air han-
dling system that fulfills their requirement of indoor climate. In this case the owner
has no responsibility regarding the air handling system, both the cost of AHU and
maintenance is the tenants responsibility, but there are several ways to solve the
problem with AHU and its costs.
Shared responsibility - The costs for the HVAC system is shared between the
landlord and the tenant. Often the maintenance and repairs is paid by the tenant
and the replacement of the AHU is paid by the landlord (ASHRAE, 2016).
Tenant pays all - The tenant has responsibility for maintenance, repair and re-
placement if needed. The landlord will not cover any costs, it is a good deal for
the landlord but it could occur problems when the lease is going to end, the tenant
might not tell the truth about the condition of the AHU (ASHRAE, 2016).
Limited responsibility - The total cost of an AHU is divided by its service
life (15-25 years), this is how much the AHU costs per year for the landlord. If the
tenants wants to end the lease in advance the yearly cost of the AHU is billed to
the tenant for the remaining time of the contract (ASHRAE, 2016).
In tall office buildings the position of the plant room could be different, a very
large AHU could supply many floors but a smaller AHU supply fewer. The dis-
tribution of the plant room is analysed in Chapter 4 where space efficiency is in
focus. An AHU supplying many floors will need more space than a smaller AHU
but the amount of smaller AHU:s will be higher. The position of the plant room
will also affect the space efficiency which is discussed in the analysis chapter but
the aim is to use as few square meters as possible. The distance from floor to ceiling
will limit the height of the AHU which limits how many floors could be supplied,
an alternative is to use two floor heights for plant rooms. The advantage of using
centralized ventilation system is that the building owner could design the building
in an efficient way which could give more space over for rental.
24

2.3. ELEVATORS 2. Theory
2.3 Elevators
According to the plan and building regulations (PBF) buildings with more than
one floor should be equipped with an elevator or equivalent lifting equipment if it is
required to ensure accessibility. It is further stated that dwellings with up to three
floors is not required to have an elevator. It should however be possible to install
in the future (Boverket, 2019b).
Boverket’s building regulations (BBR) provides information on when two elevators
are required and when a rescue elevator is needed. The latter should be possible
to install in dwellings with four floors or more. The dimensions for certain sizes
of elevators are regulated and BBR refers to the Swedish Standards Institute for
the measurements of those. At ten floors two elevators are required, one of these
needs to be a rescue elevator (Boverket, 2019b). If the floor area exceeds 900 m2
two rescue elevators should be installed (Boverket, 2019a).
A very important component in tall buildings is the elevator system. Tall buildings
depend on a well-functioning elevator system that combines a high capacity with
space efficiency. There are several possible solutions for this and the solutions can
differ depending on the building in question.
When a building increases in height (and in size) a higher capacity is required
from the elevators. Traditionally this has been equivalent to simply increasing the
number of regular elevators but modern technology provides alternatives on control,
machine room size, cable material and configuration.
The required capacity of an elevator system is determined based on the popula-
tion (number of employees), the level of occupancy (presence/simultaneousness)
and the peak demand (indicative traffic flow peak) (Wit, 2007). For offices the
lunch peak is dominant (J. Wit, personal communication, February 12, 2019).
2.3.0.1 Control
The main types of control are conventional control and destination control.
Conventional control means that the user requests an elevator with the push of an
”up” or ”down” button. The user then chooses the desired floor when inside the
elevator. Destination control means that the user at the point of requesting the
elevator specifies which floor is desired. The destination control reduces the total
time, although the waiting time increases compared to the conventional system
25

2.3. ELEVATORS 2. Theory
(Wit, 2007). Destination control is preferred when more than four elevators are
installed (L.G. Sergerlind, personal communication, April 1, 2019).
2.3.0.2 Machine room
Machine room size can differ depending on the characteristics of the elevator. It is
even possible to remove the machine room (Elevatorpedia, n.d.). Different machine
room solutions can be seen in Figure 2.11 and it is evident that the choice will affect
the space efficiency of the system.
Figure 2.11: Machine room, machine room-less (Al-Kodmany, 2015).
2.3.0.3 Configuration
The standard elevator solution which is sufficient for most buildings is to have an
elevator group with a couple of single-deck elevators on conventional control. This
solution works well up to a certain height and size of the building, after that other
solutions are required.
Zoning of elevators can be used to manage the people flow when a building in-
creases in height. Zoning means that different groups of elevators serve different
floors (zones) in the building. For a building of 45 floors it could mean that one
elevator group serves floors 1-15 (zone 1), one elevator group serves floors 15-30
(zone 2) and one elevator group serves floors 30-45 (zone 3). Each group would
then only stop at its designated floors and have an express zone passing the zones
below. An illustration of zones can be seen in Figure 2.12.
When the building height continues to increase the zoning approach will require
a fairly large number of elevator groups. Since all elevator groups start at the
26

2.3. ELEVATORS 2. Theory
ground floor and continues to each designated zone it will claim a high percent-
age of the floor area, especially at the lower floors. At a certain point there is a
need for a different approach. ASHRAE identifies two main elevator approaches
for supertall (>300m) and megatall (>600m) buildings; the sky lobby approach
and the double-deck system (Simmonds, 2015). These solutions can be applied in
buildings lower than 300 m as well. These two approaches are illustrated in Figure
2.12. The double-deck system has two elevator cabs in the same shaft. This is a
very costly solution but in projects where area and space efficiency is of the essence
it is a viable solution. When applying the double-deck solution it affects the design
of the rest of the building. As there are two cabs on top of each other you might
arrive at a level above or below your destination depending on your initial choice
of cab. This can be solved with escalators to easily reach your wanted floor, see
Figure 2.13. The idea of the sky lobby approach is to have two separate elevator
systems that meet at the sky lobby level. The first system serves the floors from
ground to sky lobby while the second system serves the floors from the sky lobby
and above. As can be seen in Figure 2.12 there is also shuttle elevators from the
ground level to the sky lobby. The shuttle elevators travel directly from the ground
floor to the sky lobby and a transfer to the upper zones is made there.
Figure 2.12: Elevators with different configurations. Zoning choices, double-deckers and
sky lobbies are illustrated (Jong, 2008).
27

2.3. ELEVATORS 2. Theory
The company Thyssenkrupp has developed a similar concept to the double-decker
but instead of connecting two cabs on top of each other there are two independent
cabs moving within the same shaft. The concept is called TWIN and can poten-
tially save 25 % of space according to Thyssenkrupp themselves (Thyssenkrupp,
2019). The company has also developed a new type of elevator system which is
based on the technology of magnetic levitation that makes ropes unnecessary. The
system is called MULTI and will have vertical and horizontal shafts with several
cabs in each. The capacity will be significantly increased but at a cost around five
times as high compared to a conventional solution (Maglev, 2017).
Figure 2.13: Double-deckers with escalators (Simmonds, 2015)
2.3.0.4 Elevator rope
A component that has been limiting the travel height for elevators is the elevator
rope. The material of choice has traditionally been steel due to the high tensile
strength. However, steel is relatively heavy and there is a height limit at around
550 m where the elevator rope can no longer carry its own weight. Steel ropes also
have issues with sway that arises as an effect of wind acting on the building (de
Jong, 2014). The new KONE Ultrarope allows longer elevator travel distances up
to 1000 m by utilizing carbon fibres which are both light weight and strong (KONE,
2013). Due to the lower weight the energy use will decrease and the effect of rope
sway is significantly reduced due to the high natural frequency in the rope.
28

2.3. ELEVATORS 2. Theory
2.3.0.5 Rescue elevator
A rescue elevator is required in buildings with more than ten floors. The rescue
elevator is meant to be used by the emergency personnel in case of fire or other
emergencies. The shaft of the rescue elevator needs to be its own fire cell and the
elevator needs to fulfil the same fire requirements as the shaft. The inner dimensions
of the rescue elevator are 1.1 X 2.1 in order to be able to carry a stretcher. The area
outside of the elevator should be a fire lock and be large enough to fit the stretcher
with personnel (Boverket, 2019a).
2.3.1 Stairwells
In lower buildings stairwells are the main means of vertical transportation whereas
in taller buildings the elevators are the choice of transportation. Stairwells are an
alternative to the elevators and important to the fire escape strategy.
The dimensions of the stairwells are partly chosen by the architect and partly
regulated by fire safety restrictions. For stairs with <150 persons the minimum
width is 0.9 m. For stairs with >150 persons the minimum width is 1.2 m. In
most cases it is considered worthwhile to use the larger dimensions (H. Rosenqvist,
personal communication, March 29, 2019). The number of people specified does
not refer to the total number of people in the building but to the number of people
who are planned to evacuate at the same time.
More information on stairwells is found in Section 2.5.
29

2.4. WATER DISTRIBUTION 2. Theory
2.4 Water distribution
The distribution of water is dependent on minimum and maximum pressure in pipes
and taps. The water is pumped through the building and different systems need
different pressures. The building could be divided into different sections which is
dependent on the differential pressure. When building tall there is a need of pumps
which adds pressure to incoming water, if the building is very tall many pump
stations will be needed. The amount of pumps is also depending on the water flow
together with desired pressure.
2.4.1 Water pressurization system
In tall buildings there is a need of water in many forms e.g. tap water, water to
toilets, showers and sprinkler system. In the municipal water supply network the
tap water pressure of 4-6 bar is available, 4-6 bar can be compared to 40-60 MWC
(Lundagrossisten, 2018). If there is a need of higher pressure than 4-6 bar, it has
to be pressurized by a water pump. The pressure of 4-6 bar is enough for many
residential buildings and offices but some are higher than 40-60 meter. The water is
distributed from water towers or other kinds of reservoirs. The reservoir is depend-
ing on the height of the reservoir location in relation to the place of consumption.
The minimum pressure for tap water is 1 bar and it might occur problems if the
pressure is too low such as no water through the tap. The maximum working pres-
sure is between 4-5 bar depending on the tap. The recommended value of 1-5 bar
as working pressure is from manufacturers of tap water installations. The pipes
should be able to handle 16 bar according to (Boverket, 2011). Pumping water
one meter up in the air is equal to one meter of water column (MWC) which is
the same as 0.1 bar. Friction losses in the pipes is depending on water flow and
pipe size and have to be taken into account when design the pressurization system.
Too high water pressure will result in wear in pipes and too high pressure at the
tap. The pressure losses in the tap water system are from friction and difference in
height. The probable water flow for an office of 1000 m2 is 0.7 l/s and the velocity
should not exceed 2 m/s (VVS Foretagen, 2013). The number of worker is 1 per
15 m2 according to (Sveby, 2013).
There are many possible solutions for solving the problem with distributing water
to tall buildings. Possible systems for solving the distribution are, single booster
system, zone divided system, roof top tank system, series connected intermediate
break tanks and series connected system (Nielsen & Nørgaard, 2018). One solution
30

2.4. WATER DISTRIBUTION 2. Theory
which is commonly used in USA is to pump up the water to gravity feed tanks on
the roof, the water is then distributed downwards from the tank with the help of
gravity (Nielsen & Nørgaard, 2018). When distributing the water from the tanks
on the roof high speeds could occur which creates noise in the pipes, well-insulated
pipes is a possible solution but the water also creates large forces which needs to
be taken care of with special vents (Nielsen & Nørgaard, 2018). Another problem
is the floors close to the tank could get too low water pressure, to solve this an
extra water pump needs to be installed. It can be considered counterproductive
to pump the water to the top of the building and then pump it downwards to
provide sufficient pressure for the top floors. Another solution is to have tanks in
series which distributes water to surrounding floors. The pump does not need to
pump the water a great distance, but instead it pumps the water to a lower level
and from this level to the next level. Instead of one giant water pump there are
several small water pumps. The requirements of the pump is lower for the case
with smaller pumps in the meaning of pressurizing the system and special pipes
due to high water pressure. Either the building is divided into pressure levels or
the entire building functions as a pressure zone. Dividing the building into pressure
zones is a more energy efficient solution but especially a space efficient solution. In
the report from Anders Nielsen and Jens Nørgaard, pressurizing zone-systems are
superior compared to roof top tank system.
The total cost during a time period of 20 years is lower for the pressurizing zone-
systems compared to the roof top tank system, but the loss of revenue for the roof
top tank is not the worst compared to the other water distributing systems. The
system which affects the revenue-generating area the most in a negative way is ”se-
ries connected systems with intermediate break tanks”. The life cycle cost for the
5 different water distributing systems is shown in Figure 2.14. The choice of water
distributing system is explained in the method chapter.
31

2.4. WATER DISTRIBUTION 2. Theory
Figure 2.14: Total cost over 20 years for different water distribution systems (Nielsen &
Nørgaard, 2018).
2.4.2 Wastewater treatment
In BBR chapter 6 section 6:641, installations for wastewater, there are two types
of flows, standard flow and probability flow (Boverket, 2011). Standard flow is
dependent on kind of sewage unit, a water closet has a flow of 1.8 l/s and a bathtub
0.9 l/s (Lindblad & Lindstrom, 1996). The sum of all sewage units will give a
total standard flow, this flow is not utilized to 100 % due to the fact that every
sewage unit is not used at the same time. Probability flow is a function of all
connected sewage units standard flows which could be seen in Figure 2.15. The
numbers in Figure 2.15 is depending on what kind of building that is investigated.
There is a difference between residential buildings, hospitals and schools (Lindblad
& Lindstrom, 1996).
32

2.4. WATER DISTRIBUTION 2. Theory
Figure 2.15: Probability flow and its relation to standard flow.
Wastewater pipes should be designed to fulfill the requirement of being able to han-
dle 150 % of the standard flow to reduce the possibility of flood (Boverket, 2011).
Bad smell should not be able to be spread through the wastewater system, this is
usually solved by a siphon which separates the air masses on different sides of the
siphon. High velocities in the wastewater system could create noise which has to
be considered, a possible solution to reduce the noise is to use well-insulated pipes.
Regardless if the building is 100 meter or 300 meter the velocity of the water will
not increase due to the air resistance that is generated by the falling water. The
terminal speed of the water is not depending on the height of the building (Bohm,
1989).
Most water treating systems have separate systems for urban runoff and wastewater
as in Figure 2.15. The reason for this is to lower the amount of water that goes
to treatment plants, the urban runoff leads to nearby lakes or streams if possible
(Klimatanpassningsportalen, 2016). Even though the buildings roof area in relation
to the building height is low it cannot be neglected that the roof area is large due
to the large circumference of the building. The roof will collect a large amount of
water which has to be taken care of. It is not desired to have gutters and downpipes
on the facade but a possible solution is to lead the water inside the building in a
separate water system. Another solution that is used is to lead the water through
33

2.5. FIRE SAFETY 2. Theory
the building a couple of floors and then lead the water through the facade out from
the building as rain. The amount of water collected on the roof is reduced if the
design of the tall building is acute, the rain will not stay on the roof in this case,
instead it will slide down on the facade.
2.5 Fire safety
Fire safety in tall buildings is different from in low buildings. In a low building the
fire can be fought from the outside either from the street or from a fire truck. In
a tall building this is not possible above a certain height, the fire has to be fought
from inside the building. This means that apart from enabling the occupants to
escape, the firefighters have to be able to access the building.
The rescue elevator is seen in the figure below, as it is connected to fire safety,
but is explained in 2.3.0.5.
The Swedish fire safety aquis are found in PBL, PBF, SBF, BBR and BBRAD.
The latter is an extension of BBR with focus on analytical dimensioning (AD) of
the fire safety.
Buildings are divided in BBR into different building classes depending on the need
for safety measures. There are four classes; Br0, Br1, Br2 and Br3. Br0 requires
the highest level of safety and Br3 the lowest. As seen in Figure 2.5 buildings with
more than 16 floors are classified as Br0-buildings and will require analytical di-
mensioning. Other important fire safety levels are marked in the same figure. The
heights in Figure 2.5 are given in number of floors at the vertical axis. This is due
to that the regulations for elevators and building classes are specified for number
of floors. For risers and ladders the limits are given in meters as well since the floor
height can vary.
34

2.5. FIRE SAFETY 2. Theory
Riser (24m)Fire Ladder Limit (30m)Rescue Elevator
Pressurized Riser (40m)
Br0
0
2
4
6
8
10
12
14
16
18
20
Activities
Flo
ors
Figure 2.16: Heights relevant to fire safety.
2.5.1 Stairwells and evacuation
BBR states that there should be two available escape routes but in certain cases it
can be allowed to have only one escape route. Table 2.2 shows what stairwells can
be applied for the activity class (verksamhetsklass) Vk1 which pertain to offices.
The type of dimensioning required is also seen.
There are two types of classifications of stairwells that are of importance with
respect to fire safety; Tr-1 and Tr-2. Tr-1 is to fulfil the highest fire safety demands
and Tr-2 the second highest. The demands specify connected areas and time that
fire should be resisted. The specifications can be found in BBR chapter 5 (Boverket,
2018b).
Table 2.2: The fire safe stairwells required for offices at certain number of floors if one
stairwell is considered sufficient.
Offices (Vk1)
Number of floors Stairwell Dimensioning
2 - 8 Tr2 Simplified
8 - 16 Tr1 Simplified
16 - Tr1 Analytical
35

2.5. FIRE SAFETY 2. Theory
As seen in Table 2.2, the specified stairwells can be used as a single fire escape route
for the given activity classes if the solution is satisfactory. The general advice of
what is deemed satisfactory for simplified dimensioning is given in BBR 5:322 and
depends on number of people and distance to the fire escape route. For buildings
with more than 16 floors, BBR gives no recommendation, instead BBRAD is to be
used. The aim should be that an analytical dimensioning provides the same safety
as what would be possible if simplified dimensioning could be applied. What is
stated is that buildings with more than 16 floors, as Br0-buildings, are to have one
Tr-1 stairwell and additional stairwells should be at least Tr-2 (Boverket, 2018b).
2.5.2 Alternative means of evacuation
Traditionally, the evacuation route is from your floor through the fire escape (stair-
well in a tall building) to the outside. In very tall buildings the evacuation route
can be very long which results in both significant evacuation times and possibly ex-
haustion of the evacuees. Some occupants of the building might not be able to use
the stairs and will be in need of other solutions. In super- and megatall buildings
it can be considered if refuge areas and/or fire escape elevators can be used during
evacuation (Simmonds, 2015).
The idea of a refuge area is that it is unoccupied during normal operation so that
it is ready to be used and it is an own fire cell with a separate ventilation system.
The solution is very costly as it claims space both for the refuge floor itself and for
the extra technical installations needed for the floors.
To enable evacuation, the evacuation route and the rescue elevator has to be free
of fire and smoke. A way to ensure this is to pressurize the stairwells and elevator
shafts as explained in 2.5.4.
2.5.3 Fire ladders
Fire ladders reaches a maximum of approximately 30 meters (9 floors) and at 10
floors a rescue elevator is required in accordance with BBR (Eskilsson, 2019) (Bover-
ket, n.d.).
2.5.4 Pressurization of shafts and stairwells
To control the air flows and pressures during a fire in a tall building there is need
for pressurization of certain areas.
36

2.5. FIRE SAFETY 2. Theory
In tall buildings, elevators are used as the main vertical transportation during
normal operation. In case of fire however, the main means of escape is not the
elevators but the stairs. Due to this the stairwells need to be pressurized to pre-
vent smoke and fire from entering. There is a minimum and a maximum to this
pressure difference, 20 Pa and 80 Pa respectively (Jensen, 2005). The minimum is
to ensure that the smoke and fire is kept out and the maximum is to not have too
high pressure differences on doors which would prevent them from opening. There
is no height limit on stairwells with regards to pressurization (Henrik Rosenqvist,
personal communication, March 29, 2019). The pressurization of the stairwell is
provided by a fan that supplies air at even levels at approximately every third floor
(Simmonds, 2015).
Pressurization of stairwells in tall buildings has to be done with analytical dimen-
sioning but the commonly used solutions does not provide the same safety as the
simplified dimensioning does. The problem in these solutions is not with the fans
but with the dampers, counterbalance dampers or pressure sensors (Runefors &
Persson, 2017). One aspect that makes pressurization difficult is wind. Since the
value of the pressure in the stairwell is the value of the pressure difference between
inside and outside of the stairwell this will fluctuate depending on the pressure
outside of the stairwell.
2.5.5 Pressurization of pipes
There are no regulations mandating sprinklers in tall buildings. It is however com-
mon practice to have sprinklers as part of the fire safety design in tall buildings.
The use of sprinklers can be a costly solution but is often considered worthwhile
especially in tall buildings where the fire safety can be more difficult to assure.
Sprinklers also provide benefits such as less strict fire requirements on structural
parts. Traditional sprinkler systems need large amounts of water in the pipe system
and there could be a need of water tanks if it is not possible to get water from a
nearby lake or from the municipal water pipeline network. The water mist system
is a high pressure system but does not need as much water as the sprinkler system.
The water mist also removes oxygen from the air which counteracts the fire. For the
firefighters there is a need of water risers, depending on the height of the building
the riser needs to be pressurized or not.
2.5.5.1 Sprinkler pressurization
The sprinkler system has pressure losses at the sprinkler head and in the pipes
as friction losses. The friction losses in the pipes is dependent on the water flow
37

2.5. FIRE SAFETY 2. Theory
and the size of the pipe, as seen in Figure 2.17. The main distribution pipes have
dimensions of 65 to 150 mm, the range pipes are 50 to 25 mm and the pipes
supplying the nozzle is 25 mm (Fogtec, n.d.). The friction loss occurs from the
pump to the sprinkler head furthest away from the pump. The friction loss has
been calculated by adding the vertical distance of the pipes with the distance from
the center of each floor plan to the corner of the building. Each building has the
geometry of a square and therefore the distance from the center to the corner is
calculated as√GEA · 2
2 m.
Figure 2.17: The pressure loss is dependent on the water flow through the sprinkler and
velocity of the water.
The pressure loss at the sprinkler head depends on the water flow through the head
and the size of the sprinkler head. The conditions for the calculations is depen-
dent on the type of building e.g if it is an office- or a residential building. Office
buildings has a lower hazard group than residential buildings or warehouses. The
hazard group determines the working area for the sprinklers and the value of de-
sign density. The design density gives the total water flow in the unit mm/min.
The hazard group also decides how large the water tanks have to be, if the water
tanks should be able to supply water to the sprinkler system for 30 or 60 minutes
(Standard, 2004).
38

2.5. FIRE SAFETY 2. Theory
The pressure loss over the sprinkler head is calculated by using Equation 2.2 (Stan-
dard, 2004). The constant K depends on the sprinkler head but for office buildings
which is in hazard group 1 a value of 80 or 100 is recommended (Standard, 2004).
The minimum pressure at the sprinkler head to function is 0.35 bar and the max-
imum pressure is 12 bar (Standard, 2004). The friction loss together with the
pressure loss over the sprinkler head and minimum pressure over the furthest away
sprinkler results in the total pressure for the pump to overcome.
Q = K ·√P (2.2)
Q - water flow [l/min]
K - constant [(l/min)/√bar]
P - pressure [bar]
2.5.5.2 Water mist pressurization
For the water mist system the lowest required water mist pressure is 60 bar at the
highest point (Fogtec, n.d.). High-pressure pumps of 140 bar is able to pressurize
the system to heights of 600-700 meters depending on pressure losses in the pipe
network. The main distribution pipes have dimensions of 28 to 42 mm and the pipes
supplying the nozzle is 12 mm (Fogtec, n.d.). High water pressure and reduced
water consumption gives smaller pipe dimensions for the pipe network. The water
needed depends on the hazard class but for offices the design density is 2.2 mm/min
(Fogtec, n.d.). This value is lower than for sprinkler design which is due to that
water under high pressure expands when exiting the system into the air (LU, 2006).
The water tanks do not need to be as large as for traditional sprinkler design because
of the volume expansion of water mist. The water tanks should be able to supply
the water mist system with water for 60 minutes (Standard, 2004).
2.5.5.3 Risers and pressurized risers
At heights above 24 meters (8 floors) water risers should be installed and above
40 meters (12 floors) the water risers need to be pressurized to ensure sufficient
water pressure for the fire fighters (Boverket, 2018a). The Swedish Fire Protection
Association has in SBF 504:1 provided information on how risers can be designed
in accordance with BBR for systems that are automatic and water filled (Brand-
skyddsforeningen, 2018).
39

2.5. FIRE SAFETY 2. Theory
The maximum pressure is not to exceed 20 bar except for in express risers sup-
plying higher areas, which will be the case in tall buildings. The pressure at outlet
fittings is to be between 8 and 12 bar. Outlet fittings are to be placed on at least ev-
ery other floor starting from the third floor. The distance between an outlet fitting
and the farthest place it is to reach shall not exceed 50 m. For every stairwell that is
intended for fire safety use there needs to be a riser. The minimum riser dimension
is DN 100 and the minimum water flow is 900 l/min. The risers are to be connected
to two pumps, a primary and a secondary for back-up. Lower floors can be supplied
by a municipal water pipe while higher floors will need water tanks. The required
water flow needs to be supplied for at least 45 minutes (Brandskyddsforeningen,
2018).
40

3
Method
The thesis work has mainly consisted of the case study of the three fictitious build-
ings and the technical systems of those. Information was gathered by studying
literature and previous work within the field, some of which is mentioned in Sec-
tion 1.5. As a help to attain more information, professionals within the field have
provided their knowledge and assistance.
3.1 Case study
What has been investigated is how the design choices of the chosen technical sys-
tems affect the space efficiency of a tall building. The approach has been to look
at each system individually to identify important characteristics and levels specific
to the system in question. For pipes and ducts the focus has been on the vertical
distribution.
As explained in the introduction, the buildings of interest are tall office build-
ings and the data for the modeling has been chosen to comply with the activity
of office buildings. Three fictitious tall buildings have been used to investigate the
different systems. The buildings have been given values on height, areas etc. and
the systems have been adjusted to fit the chosen buildings. The characteristics of
the fictitious buildings have been based on existing buildings in order for the system
solutions to have relevance to real projects.
The parts that are presented for the case study are:
• HVAC
• Elevators
• Water Distribution
• Fire Safety
The example buildings that have been used are seen with their data in Table 3.1
and the buildings are illustrated in Figure 3.1 and Figure 3.2.
41

3.1. CASE STUDY 3. Method
Table 3.1: Example buildings with data
Building 1 Building 2 Building 3
Total height [m] 151.2 252 352.8
Gross external area (GEA) [m2] 800 1100 1700
Number of floors 42 70 98
Floor to floor [m] 3.6 3.6 3.6
Net internal area (NIA) [m2] 640 880 1360
NIA/staff 15 15 15
Staff/floor 43 59 91
Figure 3.1: The three buildings next to each other. The height of each building is given
and a person is placed at the bottom left of each building for scale.
The height and GEA of the buildings are chosen to have similar ratios as those
shown in Table 2.1. With more tall buildings being built in Sweden the height
is increasing as well. The heights of the chosen example buildings are chosen as
plausible heights for future Swedish tall buildings. The three GEA-values are chosen
as a result of building rules and practices. At 900 m2 two rescue elevators are
42

3.1. CASE STUDY 3. Method
required and at 1250 m2 it should be investigated if a floor should be divided into
more than one fire cell. The floor to floor height is based on a number of tall
buildings found in Sweden. In the U.S. or Asia it is common to have higher values.
The NIA is set as 80% of the GEA based on existing tall buildings and is used as a
basis for how many occupants each building has. To simplify the case study the NIA
and the A-temp have been considered as the same. This is due to that all areas that
are considered and used in calculations are office space with its associated activity.
No parking garages or similar areas are considered which could be an example of
where NIA and A-temp differs.
Figure 3.2: The example buildings next to existing tall buildings. Original graphic from
(CTBUH, 2015b).
43

3.1. CASE STUDY 3. Method
3.1.1 HVAC
What has been investigated for the ventilation and cooling is the effects that certain
design choices have on area efficiency. For each of the possible choices in Table 3.3
the three AHU choices seen in Section 3.1.1.3 have been tested. As an example:
airborne cooling at a cooling need of 40 W/m2, ∆T of 10◦C is supplied with air by
one AHU that is limited to the ceiling height. Depending on the choices a varying
number of floors can be supplied with air and different percentages of the GEA will
be claimed by the ventilation system resulting in different efficiencies.
No fan or ventilation calculations are done for the pressurization of shafts. That
part is treated in the theory chapter.
3.1.1.1 Ventilation
The ventilation rates used in the case study has been based partly on Svebys rec-
ommendations and partly on common values used by professionals within the field.
However, what has been dimensioning for the ventilation rate has been the cooling
need. The values can be seen in Table 3.2 below.
Table 3.2: Ventilation rates for water and airborne cooling for different cooling needs.
Ventilation rates [l/s·m2]
Cooling need [W/m2] Waterborne Airborne
20 1.8 1.7
30 2.0 2.5
40 2.2 3.3
3.1.1.2 Cooling
The ventilation and cooling is based on cooling needs that was found when look-
ing at a number of tall office buildings in Sweden. Higher values could potentially
occur as well, but these are the values that have been used; 20, 30 and 40 W/m2.
Two different design approaches are tested for the cooling. The first is waterborne
cooling which is to have a hygienic ventilation in combination with active chilled
beams. The second is airborne cooling which is to have only ventilation that pro-
vides sufficient amounts of air as well as removes the excess heat. For the first case
5◦C is used as a temperature difference for the air and for the second case 10◦C is
used as temperature difference.
The different cooling needs represent different activities as explained in Section
44

3.1. CASE STUDY 3. Method
2.2.1 and the idea is to test which type of system could be better suited at a given
cooling need. The aim is not to do an optimization but to illustrate the importance
of design choices. Table 3.3 illustrates the configurations that have been tested.
Table 3.3: Waterborne and airborne cooling configurations.
Waterborne Airborne
Cooling need [W/m2]
20
30
40
20
30
40
∆T [◦C] 5 10
3.1.1.3 Air handling plant room size
As mentioned in Section 1.5 a previous study on the connection between SFP, air
flow and plant room size has been of help when testing the different configurations.
Data has been available for one AHU per plant room and two AHU:s per plant
room with a range of air flow between around 4-40 m3/s.
While it is understood that an optimal size of the plant room is not always possible
it is assumed that the plant room areas used in this thesis have the potential of being
as well planned as possible since an early stage of the planning process is considered.
An SFP of 1.5 kW/(m3/s) has been chosen for this master’s thesis as it is a com-
monly used value when designing. This has been established by interviews with
professionals within the field, it is also the value suggested by BBR (Boverket,
2017a). The type of heat exchanger that has been chosen is a rotary heat ex-
changer. This does take up more space than the alternatives but is more common
for the intended use and is hence the most realistic choice.
As previously mentioned the example buildings have been given certain measure-
ments. The restriction in ceiling height has given a restriction when choosing the
ventilation system as a larger air flow will generally require a higher ceiling height.
Three different configurations have been tested when choosing the ventilation sys-
tem with regards to ceiling height. What has been investigated is how many floors
can be ventilated and how much of the GEA is taken depending on the following
configurations:
• Configuration 1: One AHU within the ceiling height
• Configuration 2: One AHU within double the ceiling height
45

3.1. CASE STUDY 3. Method
• Configuration 3: Two AHU:s within the ceiling height
As seen in Table 3.1 the floor to floor height is 3.6 m for all three buildings. For
the office spaces the ceiling height is assumed to be 2.7 m. However, for the plant
rooms it is assumed that the ceiling height is 3.3 m and that is the height that can
be utilized for the plant rooms. The ceiling height in the plant room data that has
been used accounts for 0.4 m of space above the AHU to make room for water pipes,
meaning that the AHU itself is maximum 2.9 m high, unless two ceiling heights are
being used as in configuration 2.
3.1.1.4 Ducts and shafts
The only ducts that have been dimensioned are the vertical ducts in the shafts.
The dimensions of the ducts have been chosen as consistently as possible based
on air flow, air speed and pressure drop. The air speed and pressure drop have
been chosen as approximately 10 m/s and 1 Pa/m respectively. Naturally, there
have been some variance due to that standard dimensions have been chosen for
the ducts. Ducts have only been dimensioned for the vertical shafts and the large
air flows have resulted in rectangular ducts. The size of the ventilation shafts have
been chosen as twice the size of the supply and return duct with insulation included.
This is both due to enable maintenance work and provide room for flexibility.
3.1.2 Elevators
Very advanced technology is mentioned in Section 2.3 and all of it will not be part
of the solutions that are tested in this thesis due to the intricacy of the systems and
the limitations of the software. What has been tested in this thesis is the influence
of zoning choices and also the use of one or several sky lobbies. Destination control
has been used for all of the calculations as it is preferred when there are more than
four elevators (LG Segerlind, personal communication, April 1, 2019).
The programs that have been used to model the elevator configurations are KONE
Quick Traffic and KONE Planulator. Quick Traffic allows the user to provide data
on type of building (office) and type of use (multiple tenant, flexible working hours)
as well as zone information such as travel distance, number of floors served and oc-
cupants per zone. Estimated speed and size per elevator is suggested and depending
on the choices a certain number of elevator cars will be required. The program has
a predefined limit of ”time to destination” which is from when the user requests a
floor to when the elevator doors open on the requested floor. The chosen elevator
configuration has to fit within the given time. Planulator allows the user to choose
46

3.1. CASE STUDY 3. Method
number of people per elevator and elevator speed among other things and then
provides required dimensions of an elevator shaft. As understood when consulting
the KONE-support the Quick Traffic program uses the full population value and
that is what has been entered in the calculations. It is assumed that the entered
type of use ”multiple tenant, flexible working hours” accounts for any variance in
occupancy. The default setting for the peak handling capacity has been kept at
14% of the population/5 minutes.
The program provides the option of changing the elevator size in the sense that
the number of occupants per elevator can be chosen. However, it is not possible
to choose a rescue elevator which would have its own closed off shaft with certain
dimensions. Hence, the use of rescue elevators is merely treated in the theory part
of the thesis.
The two programs have been used together to find realistic configurations and
measurements that could be used for the example buildings. The intention is not
to optimize the solutions and give conclusive answers to what is the best solutions
but rather to illustrate the importance of design choices.
When using the programs it is assumed that all floors have the same activity and
number of occupants. This is not likely to be the case in reality but had to be
assumed to use the programs.
3.1.3 Water distribution
Distribution of water in tall buildings is a question of pressure levels. The water
pressure has to be in range of minimum and maximum pressure and these levels are
depending on what kind of water pressure system is used. Pumping water a great
vertical distance costs a lot of energy but it is achievable if the water flow together
with desired water pressure suits the pump curve. It is a balance between energy
consumption and space needed for pump rooms. The water distribution system
that is chosen according to Figure 2.14, is a combination of energy- and space effi-
cient system resulting in a series connected system. Tap water demand in an office
building is low when comparing with residential buildings but is of great impor-
tance. The water usage per worker is multiplied by the total number of workers and
then divided on the number of pumps to get a specific flow per pump. The pump
should be able to distribute the total water flow to all desirable floors, the pumps
have then been evaluated to see if the water flow could be pumped to the highest
floor within the sectioning. The same procedure has been done for wastewater but
47

3.1. CASE STUDY 3. Method
the system does not need any pumps it is just the dimension of the wastewater
pipes that is of importance.
The water pressure should be between 1-5 bar for the installations to work cor-
rectly. The friction loss in the pipes depends on the water flow and pipe size but
a pressure loss of 0.0125 bar/m has been used in the calculations. The minimum
pressure at the tap is 1 bar, this means that the differential pressure is 4 bar which
is around 40 meters.
The size of the water and sewage shaft has been calculated by using the defini-
tion of a standard shaft in Sweden, this is seen in Figure 3.3. The dimensions of
the ducts depends on the water- and wastewater flow but the insulation thickness
and the distance between the ducts is chosen according to the Figure 3.3.
Figure 3.3: Shaft for tap water, wastewater and hot water circulation.
To get the pipe dimensions for tap water the flow for cold and hot water is used
and the same principal for wastewater duct dimensions. The hot water circulation
has not been investigated but the dimensions of the pipes are very small compared
to the insulation thickness and other pipe dimensions. The shaft area should be
multiplied with a factor 3 to get the area needed for service personnel to be able
to repair and maintain the ducts. The pump also need extra space for service and
therefore extra space of 300 mm from the nearest side wall, 500 mm from the wall
behind the pump and at least 1000 mm in front of the pump (Magnus Johansson,
personal communication, April 8, 2019)
48

3.1. CASE STUDY 3. Method
3.1.4 Fire safety
For the sprinkler system the pressure losses in the system is from friction loss in
pipes and pressure loss at sprinkler heads. The friction losses in the pipes occur
from the pump to the sprinkler head furthest away from the pump. The pressure
loss at the sprinkler head is depending on the water flow and size of head. For
ordinary hazard group 1 (OH1) the K-factor is 80 l/min/√bar, the pressure drop
over the sprinkler head is calculated by using Equation 2.2 which gives a pressure
drop of 0.56 bar. The minimum pressure at the sprinkler head is 0.35 bar and the
maximum pressure is 12 bar and this pressure needs to be fulfilled for the sprinkler
to function (Fogtec, n.d.). The required water flow at the sprinkler is dependent
on the classification of the building, if it is e.g an office, hotel or restaurant. In this
case it is an office building which has the lowest demand (Standard, 2004). The
water flow should be spread over an area which is dependent of the hazard type. A
sprinkler head could handle 8-12 m2 floor area, the floor area is divided on 8-12 m2
and the result is the amount of sprinklers (Standard, 2004). For OH1 the design
density is 5 mm/min and the working area for the sprinkler is 72 m2. The total
water flow for a floor is then working area times the design density. The maximum
amount of floors for each sprinkler central is a combination of the water flow and
required water pressure. The water tanks should have enough water to supply the
sprinkler system with water for 60 minutes (Standard, 2004). The area needed for a
sprinkler room to function is 30 m2 (Fogtec, n.d.). The room should be sufficiently
large for service staff and for the firefighter to use it.
For the water mist system the available pressure is much higher than for the sprin-
kler system, using high-pressure pumps with a pressure of 140 bar. The needed
pressure at the head is 60 bar which means that 80 bar is left for vertical transport
of the water and to handle pressure losses. Depending on the pressure losses a
height of 600-800 meter is attainable, in the thesis the buildings are lower than this
and usage of a water mist system is therefore considered. The design density for
the water mist system is 2.2 mm/min and the water tanks should be able to supply
the system for 60 minutes. The area needed for a water mist room to function is
24 m2 (Fogtec, n.d.).
49


4
Analysis
This chapter presents the results and reflections from the studied example buildings.
As described in the method chapter, three fictitious buildings have been used to
investigate possible solutions for HVAC, elevators, water distribution and fire safety.
The result for each technical system is presented below and the result should be
seen as alternative solutions which does not need to be the best. In reality each
project has to be treated individually to find what is best suited.
4.1 HVAC
Presented below is the results for the ventilation and cooling followed by reflections.
4.1.1 Results
The results for the different ventilation and cooling solutions will be presented as
percentages of how much area each solution claims of the gross external area. As
presented in Tables 3.2 and 3.3 three cooling needs are used as basis for the ventila-
tion rates and both waterborne and airborne cooling is investigated. For waterborne
a temperature difference of 5 ◦C is used whereas for airborne a temperature differ-
ence of 10 ◦C is used.
Tables 4.1, 4.2 and 4.3 presents how much of the gross external area is taken by
the three ventilation configurations expressed in percentages (C1, C2 and C3 as
described in Section 3.1.1.3). It is also shown how many floors are supplied by each
plant room. Included in the ventilation area is the area of the plant rooms and the
area of the ventilation shaft on each floor.
Since the number of floors have been decided for each building and the number
of floors supplied by each plant room should be maximized it will for some of the
cases result in that the last plant room supplies a smaller number of floors. These
floors will be marked in parenthesis in the result tables. This is less than optimal
but does not have a significant effect on the results. Some deviations in choices re-
51

4.1. HVAC 4. Analysis
garding this approach has been done as well and is further discussed in Section 4.1.2.
After each table of results there are illustrations of the three ventilation config-
urations next to each other. The illustrations show only a couple of the possible
configurations and it is stated in the figure text which it is.
Table 4.1: Area taken by the ventilation solutions for Building 1 expressed in percentages.
Shown also is the number of floors supplied from one plant room. In parenthesis is the
number of odd floors.
Building 1
42 floors
151.2m
800 m2 GEA
Waterborne
cooling ∆T Plant room Shaft Vent.Area/ Floors/
5 [◦C] area [m2] area [m2] GEA Plant room
Cooling C1 315 109 1.3 % 8 (+2)
need 20 C2 559 203 2.3 % 21
[W/m2] C3 276 166 1.3 % 14
C1 371 109 1.4 % 7
30 C2 599 240 2.5 % 21
C3 302 203 1.5 % 14
C1 403 109 1.5 % 7
40 C2 632 284 2.7 % 21
C3 324 203 1.6 % 14
Airborne
cooling ∆T Plant room Shaft Vent.Area/ Floors/
10 [◦C] area [m2] area [m2] GEA Plant room
Cooling C1 304 109 1.2 % 9 (+6)
need 20 C2 532 203 2.2 % 21
[W/m2] C3 219 203 1.3 % 19 (+4)
C1 454 109 1.7 % 6
30 C2 695 284 2.9 % 20 (+2)
C3 379 203 1.7 % 12 (+6)
C1 614 109 2.2 % 4 (+2)
40 C2 947 284 3.7 % 14
C3 495 203 2.1 % 9 (+6)
52

4.1. HVAC 4. Analysis
Figure 4.1: Building 1 with the three ventilation configurations for waterborne cooling at
30 w/m2. Marked in blue is the plant rooms and ventilation ducts. A person is placed at
the bottom left of each building for scale.
53

4.1. HVAC 4. Analysis
Table 4.2: Area taken by the ventilation solutions for Building 2 expressed in percentages.
Shown also is the number of floors supplied from one plant room. In parenthesis is the
number of odd floors.
Building 2
70 floors
252m
1100 m2 GEA
Waterborne
cooling ∆T Plant room Shaft Vent.Area/ Floors/
5 [◦C] area [m2] area [m2] GEA Plant room
Cooling C1 761 182 1.2 % 6 (+4)
need 20 C2 1203 473 2.2 % 20 (+10)
[W/m2] C3 617 339 1.2 % 12 (+10)
C1 842 182 1.3 % 5
30 C2 1292 473 2.3 % 18 (+16)
C3 684 339 1.3 % 11 (+4)
C1 1093 182 1.7 % 6 (+4)
40 C2 1453 473 2.5 % 16 (+6)
C3 741 339 1.4 % 10
Airborne
cooling ∆T Plant room Shaft Vent.Area/ Floors/
10 [◦C] area [m2] area [m2] GEA Plant room
Cooling C1 690 176 1.1 % 7
need 20 C2 1035 473 2.0 % 21 (+7)
[W/m2] C3 553 339 1.2 % 14
C1 1050 182 1.6 % 4 (+2)
30 C2 1610 473 2.7 % 14
C3 830 339 1.5 % 9 (+6)
C1 1418 182 2.1 % 3 (+2)
40 C2 2186 473 3.5 % 10
C3 1105 339 1.9 % 7
54

4.1. HVAC 4. Analysis
Figure 4.2: Building 2 with the three ventilation configurations for waterborne cooling at
30 W/m2. Marked in blue is the plant rooms and ventilation ducts. A person is placed at
the bottom left of each building for scale.
55

4.1. HVAC 4. Analysis
Table 4.3: Area taken by the ventilation solutions for Building 3 expressed in percentages.
Shown also is the number of floors supplied from one plant room. In parenthesis is the
number of odd floors.
Building 3
98 floors
352.8m
1700 m2 GEA
Waterborne
cooling ∆T Plant room Shaft Vent.Area/ Floors/
5 [◦C] area [m2] area [m2] GEA Plant room
Cooling C1 1637 247 1.1 % 4 (+2)
need 20 C2 2554 662 1.9 % 12 (+2)
[W/m2] C3 1324 474 1.1 % 8 (+2)
C1 1837 212 1.2 % 3 (+2)
30 C2 2838 662 2.1 % 11 (+10)
C3 1463 474 1.2 % 7
C1 2007 255 1.4 % 3 (+2)
40 C2 3137 662 2.3 % 10 (+8)
C3 1640 474 1.3 % 6 (+2)
Airborne
cooling ∆T Plant room Shaft Vent.Area/ Floors/
10 [◦C] area [m2] area [m2] GEA Plant room
Cooling C1 1510 255 1.1 % 4 (+2)
need 20 C2 2298 662 1.8 % 14
[W/m2] C3 1200 388 1.0 % 9 (+8)
C1 2241 247 1.5 % 3 (+2)
30 C2 3505 662 2.5 % 9 (+8)
C3 1807 474 1.4 % 6 (+2)
C1 3014 255 2.0 % 2
40 C2 4595 662 3.2 % 7
C3 2462 474 1.8 % 4 (+2)
56

4.1. HVAC 4. Analysis
Figure 4.3: Building 3 with the three ventilation configurations for waterborne cooling at
30 W/m2. Marked in blue is the plant rooms and ventilation ducts. A person is placed at
the bottom left of each building for scale.
57

4.1. HVAC 4. Analysis
4.1.2 Reflections
All three cooling needs that have been used in the case study require a larger air
flow than what is needed to satisfy the hygienic air flow which means that the hy-
gienic air flow is provided in all cases.
When increasing the height of a building there are no drastic changes in how the
ventilation system is designed. The outside air can in many cases be taken from the
same height as the air handling plant room is at, which means that a plant room at
floor 5 can look the same as on floor 50. Although, in some cases the risk of getting
in polluted or dirty air will require the outside air to be taken from another floor
than the one of the AHU. This would result in large ducts taking up extra space
on several floors.
In Table 4.1 the floors per plant room seem much more evenly distributed com-
pared to the other buildings. For C2 there could actually have been more than
21 floors supplied by one AHU but it was chosen to divide the floors evenly on
two plant rooms, 21 floors for each. Otherwise one plant room would have taken
perhaps 30 floors and the other 12. The second plant room that would supply 12
floors would still have to use the double ceiling height which in total would result
in a less space efficient solutions. For buildings 2 and 3 seen in Tables 4.2 and 4.3
this was not an issue.
4.1.2.1 Space efficiency
As can be seen in Tables 4.1, 4.2 and 4.3, C2 (one AHU, double ceiling height) is
least space efficient in all cases. When looking at C1 (one AHU, regular ceiling
height) and C3 (two AHU:s, regular ceiling height) the results are less conclusive.
The relation between C1 and C3 are not always the same when comparing the
Vent.Area/GEA for 20, 30 and 40 W/m2 for both waterborne and airborne cooling.
In some cases C1 is more space efficient and in some cases C3 is. This is interesting
because at first glance it might feel natural that C3, that has two AHU:s in the
same plant room and can utilize that space more efficiently, will be more space
efficient overall. In Figure 4.1 C1 (left) and C3 (right) for waterborne cooling at 30
W/m2 in Building 1 are seen. C1 has six plant rooms, i.e. six AHU:s. C3 has three
plant rooms, i.e. six AHU:s. The number of AHU:s are the same but it is clearly
seen in Table 4.1 that C3 takes up less space for the plant rooms. Based on simply
the plant rooms C3 is more space efficient in every comparison. However, it is not
that simple. Due to the fact that C3 can supply more floors from one plant room
the flow from each room will be larger, which results in larger ducts and shafts.
58

4.1. HVAC 4. Analysis
With the plant rooms and shafts considered, C1 and C3 takes up basically the same
amount of space. The model that the plant room areas are based on is considered
to be valid and thus the areas are trusted to be valid as well. However, it should be
said that the plant room model is a bit of a best-case scenario and all plant rooms
might not be as space efficient. The areas for the shafts are based on calculations
of the required flows, assumed thickness of insulation, shaft walls and space needed
for maintenance. Although the shaft calculations and assumptions are believed to
be true to real solutions the space assumed for maintenance might be smaller or
larger in real buildings depending on what is prioritized.
4.1.2.2 Waterborne vs. airborne cooling
The two main means of cooling that was used in the case study was waterborne
cooling and airborne cooling. Which of them that is best in terms of space efficiency
depends on the cooling need. What was found is that at a cooling need of 20 W/m2
waterborne and airborne were quite even in terms of space efficiency. This is due
to that the low cooling need was satisfied almost entirely by the basic ventilation
and very little extra cooling was required. At cooling needs of 30 and 40 W/m2
however, waterborne cooling was more space efficient since the airborne solution
required a lot larger air flows. The space taken by cooling towers, chilled beams
and connecting pipes are not taken into account in this comparison.
4.1.2.3 Distribution
The distribution of the system, the number of plant rooms and the number of
floors that can be supplied with air by one plant room, depends on the required
air flow and the type of configuration (C1, C2 or C3). With the chosen floor to
floor height of 3.6 m the maximum floor per plant room for each configuration is
seen in the results tables. There is of course the possibility of having fever floors
supplied by each plant room than what is presented here, the tables simply show
the limits. The choice of configuration is in reality not as simple as choosing the
one that takes the least space. Other factors have to be taken into account, e.g. the
cost of the ventilation system itself as well as the rent price. The number of floors
supplied by each plant room could also be increased in reality. The ceiling height
for the plant rooms was set to 3.3 m which resulted in the presented distributions.
However, this distribution would look different if the ceiling height changed. The
distribution could also look different if other configurations had been used. If for
example 3 AHU:s were put in one plant room, or if 2 AHU:s utilized double ceiling
height. Another possibility is to increase the ceiling height of only the floors that
have technical rooms. This would give the possibility to increase the number of
59

4.1. HVAC 4. Analysis
floors supplied by each plant room without increasing the total height drastically.
The distribution depends on the prerequisites of the project and will be a result of
the choices made.
60

4.2. ELEVATORS 4. Analysis
4.2 Elevators
Presented below are the results on the elevator calculations followed by reflections.
4.2.1 Results
As mentioned in Chapter 3, the elevator configurations are found with the help of
certain software and with guidance from previous work. It should be understood
that the configurations presented in this section is not meant to be optimized as
it is recognized that elevator design is very complex. This is meant to illustrate
the importance of design choices and the effect it has on the space efficiency of tall
buildings and also to illustrate possible levels that can be relevant for the elevator
systems. With that said, the configurations are believed to be fairly close to real
solutions as the programs have been used in accordance with the instructions.
The percentages presented account for the elevator shafts with the needed machine
rooms, not entire structural shafts. As can be seen in the elevator illustrations
in this chapter the machine rooms (marked in black in the figures) vary in height
depending on the shaft. This is related to the speed at which the elevator travels.
A lower speed will result in a smaller machine room.
The overall size of the elevator shafts presented in the figures are proportionate
to what is presented in the tables. However, all shafts have been made square while
the real shape would be more rectangular. Also, the positioning of the shafts is
merely meant to show how it could look, not to show exactly how it should look.
Rescue elevators that have specific requirements on size and safety have not been
taken into account in the modeling due to that it was not possible to add in the
programs.
Tables 4.4, 4.5 and 4.6 shows possible elevator solutions for the three buildings.
The tables present number of zones, number of floors per zone, area per floor taken
by each elevator shaft, total area taken by each shaft, total area taken by all shafts
together and how much of the GEA is taken by the shafts. The Figures 4.4, 4.5
and 4.6 are meant to help the understanding of the tables. No marks are shown in
the figures to illustrate the floors but the tables explain what floor pertain to what
zone and shaft.
61

4.2. ELEVATORS 4. Analysis
Table 4.4: Building 1. Possible elevator configurations and the area taken by each, ex-
pressed in percentages of the GEA.
B1
Zone Floors Area Area Total Total Area
/Floor [m2] [m2] Area [m2] /GEA
C1 1 1-22 45.4 1089
2 22-42 51 2144 3233 9.6 %
C2 1 1-16 29 493
2 16-29 31.1 964
3 29-42 34.7 1458 2915 8.7 %
C3 1 1-12 22.3 289
2 12-22 24.5 588
Sky lobby 23.4 560
3 22-32 22.3 289
4 32-42 27.5 577 2303 7.1 %
62

4.2. ELEVATORS 4. Analysis
Figure 4.4: Building 1 with its three elevator configurations, C1, C2 and C3 from left to
right. The elevator shafts are marked in grey and the mechanical rooms are marked in
black. A person is placed at the bottom left of each building for scale.
63

4.2. ELEVATORS 4. Analysis
Table 4.5: Building 2. Possible elevator configurations and the area taken by each, ex-
pressed in percentages of the GEA.
B2
Zone Floors Area Area Total Total Area
/Floor [m2] [m2] Area [m2] /GEA
C1 1 1-30 82.7 2648
2 30-52 72.5 3916
3 52-70 83.7 5859 12423 16.1 %
C2 1 1-16 40.7 692
2 16-30 40.5 1295
3 30-44 44.7 2054
4 44-57 53.2 3139
5 57-70 53.2 3725 10905 14.2 %
C3 1 1-16 40.7 692
2 16-30 40.5 1295
3 30-44 44.7 2054
Sky lobby 53.2 2446
4 44-57 38.5 616
5 57-70 40.5 1133 8236 10.7 %
64

4.2. ELEVATORS 4. Analysis
Figure 4.5: Building 2 with its three elevator configurations, C1, C2 and C3 from left to
right. The elevator shafts are marked in grey and the mechanical rooms are marked in
black. A person is placed at the bottom left of each building for scale.
65

4.2. ELEVATORS 4. Analysis
Table 4.6: Building 3. Possible elevator configurations and the area taken by each, ex-
pressed in percentages of the GEA.
B3
Zone Floors Area Area Total Total Area
/Floor [m2] [m2] Area [m2] /GEA
C1 1 1-25 98.7 2667
2 25-46 93.0 4461
3 46-65 93.0 6227
Sky lobby 104.6 7010
4 65-82 68.0 1360
5 82-98 68.3 2324 24049 14.4 %
C2 1 1-14 50.6 758
2 14-26 50.2 1406
3 26-38 59.7 2388
4 38-50 63.3 3292
Sky lobby 109.1 5673
5 50-63 60.0 900
6 63-75 50.2 1406
7 75-87 60.4 2416
8 87-98 63.3 3102 21341 12.8 %
C3 1 1-12 32.1 418
2 12-22 38.1 914
3 22-32 40.2 1366
4 32-42 43.7 1921
Sky lobby 74.5 3279
5 42-52 38.5 462
6 52-61 40.3 887
7 61-70 40.5 1254
Sky lobby 94.8 6825
8 70-80 38.5 462
9 80-89 40.3 887
10 89-98 40.5 1173 19848 11.9 %
66
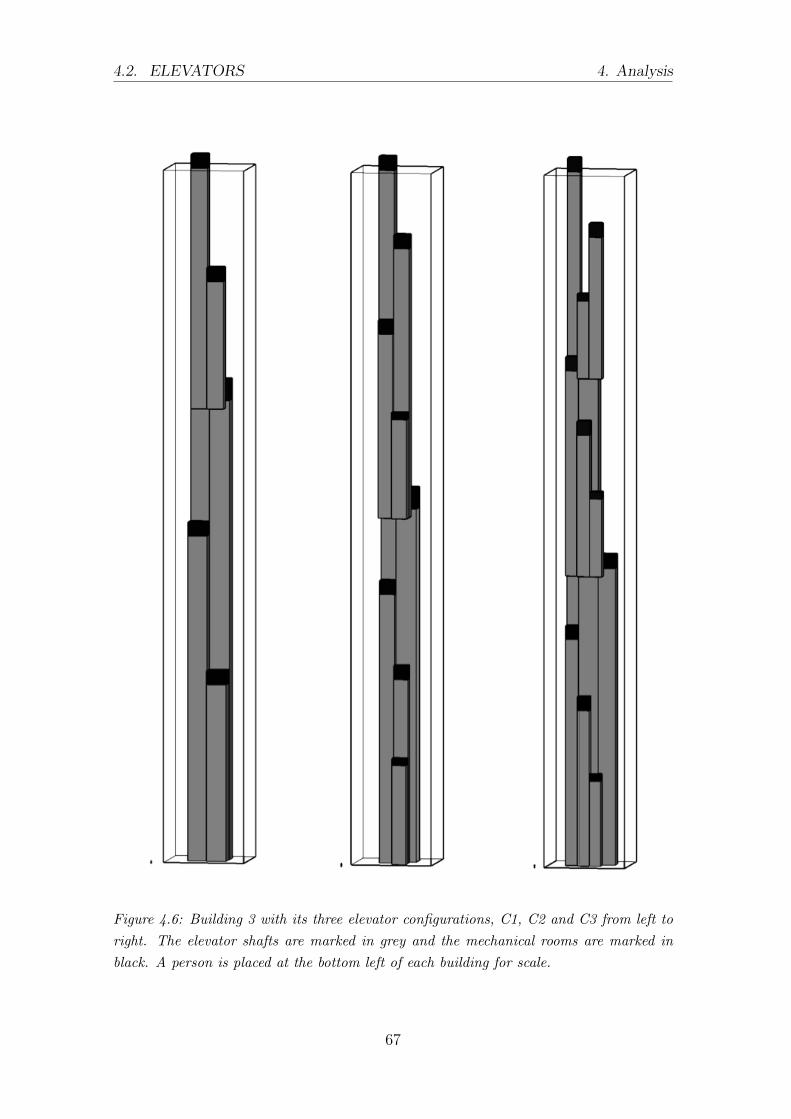
4.2. ELEVATORS 4. Analysis
Figure 4.6: Building 3 with its three elevator configurations, C1, C2 and C3 from left to
right. The elevator shafts are marked in grey and the mechanical rooms are marked in
black. A person is placed at the bottom left of each building for scale.
67

4.2. ELEVATORS 4. Analysis
4.2.2 Reflections
Elevators do take up a significant amount of space in tall buildings which means
that there is a large potential to save space by well-planned design. When looking
at the ventilation configurations it was noted that the area claimed by the system
was not dependent on the height of the building but the choice of floors supplied
by each plant room. In the case of elevators the system is much more affected by
the building height due to that most of the elevator shafts take up space even on
floors that they do not serve. See C1, zone 5 in Table 4.5 for example. The elevator
group serves floors 57-70 but takes as much space from each floors it serves as each
floor it does not serve. Thus, with increasing height there will be more ”dead space”
taken by elevator shafts.
4.2.2.1 Zone choices
Choosing the number of zones and number of floors per zone will have a large effect
on the total area claimed by the elevators. In Table 4.4 it can be seen that when
increasing from two zones to three the total area taken by the elevators decreases
even though it essentially means adding another elevator shaft. The main reason
for the decrease in area taken by the shafts is that with one more zone each zone
serves fever people which requires a lower capacity and thus smaller dimensions of
the shaft. It is seen clearly in Figure 4.4 that C1 (left) has larger dimensions of the
shafts than C2 (middle). The same can be seen for Building 2 and 3 as well.
4.2.2.2 Sky lobbies
It is evident for all three buildings that the use of sky lobbies has the potential of
decreasing the space taken by the elevator system. When searching for information
and looking at existing tall buildings and their elevator solutions sky lobbies was
not seen in buildings at similar heights as Building 1 (151.2 m) which would suggest
that it is not realistic to have in a building of that height. An explanation to this
could be that it is not as easy as space saved equals money saved.
For the taller buildings however, the use of sky lobbies is more common. This
could be partly because of the physical limitations that arise when reaching certain
heights, but also that when a building increases in height much of the elevator shaft
will be ”dead space” as discussed previously and sky lobbies will counteract this.
68

4.3. WATER DISTRIBUTION 4. Analysis
4.3 Water distribution
Results for distribution of tap water is evaluated and analysed below but also
reflections how sectioning of the systems could be done and what limitations the
systems have.
4.3.1 Results
The distribution of tap water has fewer floors per pump room than sprinkler, this
is due to the pressure range. The minimum pressure is 1 bar and the maximum
pressure is 5 bar at the tap. The pump needs to overcome the pressure losses as
static losses and friction losses. The differential pressure could maximum be ∼ 4 bar
if no pressure reducing valves is used. The static loss is 0.1 bar/m and the friction
loss is 0.0125 bar/m, the static loss will be 0.36 bar/floor and the friction loss 0.045
bar/floor which is seen in Table 4.7. This results in a sectioning of maximum 10
floors per pump room. In this case for building 1, 2 and 3 a sectioning of 10 floors
per pump room is chosen. This sectioning results in 4, 7 and 10 pump rooms for
building 1, 2 and 3.
Table 4.7: Water pressure and pressure losses for tap water.
FloorStatic loss
[bar]
Friction loss
[bar]
Total pressure
[bar]
1 0.36 0.045 0.41
2 0.72 0.045 0.81
3 1.08 0.045 1.22
4 1.44 0.045 1.62
5 1.80 0.045 2.02
6 2.16 0.045 2.42
7 2.52 0.045 2.84
8 2.88 0.045 3.24
9 3.24 0.045 3.65
10 3.60 0.045 4.05
A probable water flow is calculated by using the value of 1000 m2, this gives a water
flow of 0.7 l/s and the maximum velocity of 2 m/s results in a pipe dimension. The
same calculations have been done for wastewater to get a dimension of the pipes,
the results are shaft dimensions of 0.3, 0.35 and 0.4 m2. The shaft goes from the
bottom to the top of the building and a shaft area of 0.9 m2/floor, 1.05 m2/floor
and 1.2 m2/floor is needed for building 1, 2 and 3. The increase of shaft area is due
69

4.3. WATER DISTRIBUTION 4. Analysis
to extra area for service personnel. The required tap water pump for building 1 will
be of a smaller kind than for building 2 and 3, the size of pump 1 is 1050x1460x828
mm and 1350x1460x828 mm for pump 2. The total area needed for pump rooms is
shown in Table 4.8. The pump needs an area of 3.1 m2 for building 1 and 3.8 m2 for
building 2 and 3. The total area required for water distribution is small compared
to the GEA of the buildings as seen in Table 4.9.
Table 4.8: Pump area, shaft area and total area for buildings 1,2 and 3.
BuildingPump area
[m2]
Shaft area
[m2/floor]
Total area
[m2]
1 3.1 0.9 50.4
2 3.8 1.05 100.4
3 3.8 1.2 156
Table 4.9: Space efficiency of water pump area.
Building GEA [m2] Pump+Shaft area [m2] (Pump+Shaft area)/GEA [%]
1 33600 50.4 0.15
2 77000 100.4 0.13
3 166600 156 0.09
70

4.3. WATER DISTRIBUTION 4. Analysis
Figure 4.7: Buildings 1,2 and 3. Water distribution. The pump rooms and pipe shafts
are marked in blue. A person is placed at the bottom left of each building for scale.
71

4.3. WATER DISTRIBUTION 4. Analysis
4.3.2 Reflections
The sectioning of 10 floors per pump room implies that no pressure reducing valves
(PRV) is used, it is a possible solution to use pressure reducing valves at floors which
has too high pressure, this would result in more than 10 floors per pump room.
Theoretically, it is possible to pump water extremely high if the water flow matches
the pump curve, perhaps only one pump room would be needed but on the other
hand many PRV:s are needed and the solution would not be energy efficient but
could be more space efficient. Tap water distribution is a very important function
for the building, the space needed for tap water compared to plant room or elevators
is very low. To save space it could be a good idea to let pump rooms coincide with
sprinkler rooms or if possible air handling plant rooms. The chosen tap water
distribution system is, as explained before, a series connected system where water
is pumped through the building from one zone to another. The system entails that
no water tanks are required which saves space and no PRV:s is needed because of
the sectioning. The water pressure from the municipal water pipe network could be
used to get the water a number of floors up in the building before pressurizing the
water with pumps. The municipal water pressure is between 4-6 bars which could
supply 8-10 floors, after this point a water pump will be needed, this could save
space by removing one pump room. As seen in Figure 4.7 the tap water distribution
is solely a duplication of pump rooms with a distance of 10 floors between each pump
room. The distribution system looks the same for building 1, 2 and 3, only shaft
and pump areas differ. Also, a difference which has to be mentioned is for building
1 where the first pump room takes care of 12 floors instead of 10 floors. Building
1 has 42 floors which should result in 5 pump rooms, the last pump should then
distribute water to 2 floors which is a space inefficient solution.
72

4.4. FIRE SAFETY 4. Analysis
4.4 Fire safety
Results for pressurization of sprinkler- and water mist system is evaluated and
analysed below but also reflections how sectioning of the systems could be done
and what limitations the systems have are presented below.
4.4.1 Results
Presented below are the results for sprinkler- and water mist systems followed by
reflections.
4.4.1.1 Sprinkler system
As mentioned in Chapter 2 the water distribution is calculated by adding friction
losses with static losses and pressure losses. The pressure from the pump needs to
overcome the total pressure loss in the system and deliver a minimum pressure at the
sprinkler head or at the tap. The minimum pressure for the sprinkler head is 0.35
bar and the maximum pressure is 12 bar. In Table 4.10, the maximum allowable
total pressure occurs at floor 25, the total pressure is 11.68, 11.76 and 11.88 bar for
building 1, 2 and 3 which is below the maximum pressure. The sectioning for the
sprinkler system could maximum be each 25th floor with the prerequisites of the
office building.
Table 4.10: Water pressure at the 25th floor.
Building Total pressure [bar] Floor
1 11.68 25
2 11.76 25
3 11.88 25
As seen in Table 4.11 the needed area for building 1, 2 and 3 is 116, 174 and 232
m2. In the total area it is included a water tank of 70 m3 per sprinkler room, the
area needed for the water tank is 28 m2 with the chosen tank height of 2.5 m.
73

4.4. FIRE SAFETY 4. Analysis
Table 4.11: Area needed for sprinkler rooms. The tank height is chosen as 2.5 m. The
sprinkler area is for each floor that a sprinkler room is located and the water tank area is
for each floor that a water tank is located.
BuildingSprinkler area
[m2]
Water tank area
[m2]
Total area
[m2]
1 30 28 116
2 30 28 174
3 30 28 232
The area needed for sprinkler rooms in the buildings are quite small compared to
the GEA of the buildings, which can be seen in Table 4.12. The shaft area needed
for water distribution for sprinkler is not included in the sprinkler room area, the
shaft size has not been investigated and therefore it is not taken into account.
Looking at the shaft size for tap water distribution the area needed is not large, the
same thing could apply to sprinkler. The pipes is only in one direction and there
is no need for insulation which reduces the shaft area needed.
Table 4.12: Space efficiency for sprinkler rooms.
Building GEA [m2] Total area [m2] Total area/GEA [%]
1 33600 116 0.35
2 77000 174 0.23
3 166600 232 0.14
74

4.4. FIRE SAFETY 4. Analysis
Figure 4.8: Buildings 1,2 and 3. Sprinkler sectioning with pump rooms and water tanks
marked in red. A person is placed at the bottom left of the building for scale.
75

4.4. FIRE SAFETY 4. Analysis
4.4.1.2 Water mist
According to (Fogtec, n.d.) high-pressure pumps with 140 bar pressure could be
used in a water mist system, the pressure at the furthest away head should be
minimum 60 bar. 80 bar of pressure losses as friction loss and vertical pressure
loss is then acceptable, this results in a sectioning of 600-700 meter per water mist
central. The water mist central is 24 m2 which is 6 m2 smaller than the sprinkler
central. The water tank needed has the volume of 22, 36 and 50 m3 for building 1,
2 and 3. The water tanks have the area of 9, 13 and 20 m2, this means that the
needed area for building 1, 2 and 3 is 33, 37 and 44 m2 which is seen in Table 4.13.
The water tanks for the sprinkler system have constant volume for building 1, 2
and 3 due to the sectioning of the buildings being the same. One sprinkler room
each 25th floor, but for the water mist system the water tanks are depending on
the number of floors in the building due to that only one water mist room is used,
this results in three different tank volumes and areas. In Table 4.14 the total area
of the water mist room is divided with the GEA. The space taken by the water mist
room is 0.1, 0.05 and 0.03 % for building 1, 2 and 3 which is very low comparing
with other technical rooms for e.g. elevators and ventilation.
Table 4.13: Area needed for water mist room. The tank height is chosen as 2.5 m. The
water mist central area is for each floor that has a central and the water tank area is for
each floor that has a water tank.
Building Water mist central [m2]. Water tank [m2] Total area [m2]
1 24 9 33
2 24 13 37
3 24 20 44
Table 4.14: Space efficiency for water mist rooms.
Building GEA [m2] Total area [m2] Total area/GEA [%]
1 33600 33 0.1
2 77000 37 0.05
3 166600 44 0.03
76

4.4. FIRE SAFETY 4. Analysis
Figure 4.9: Buildings 1,2 and 3. Water mist. The pump rooms and pipe ducts are marked
in yellow. A person is placed at the bottom left of each building for scale.
77

4.4. FIRE SAFETY 4. Analysis
4.4.2 Reflections
A sectioning of sprinkler rooms each 25th floor does not imply that it is the most
space efficient solution other types of sectioning could be better. For buildings 1,
2 and 3 the number of floors is 42, 70 and 98, this means that if the sectioning of
the sprinkler system is each 25th floor, the number of sprinkler rooms are 2, 3 and
4. If the sectioning were each 20th floor the number of sprinkler rooms would be
3, 4 and 5. A sectioning each 20th floor would need 174, 232 and 290 m2. In this
case a sectioning every 25th floor would be more space efficient. The shaft needed
for both systems will be of different dimensions, the main pipes for sprinkler- is 65
to 150 mm and 28 to 45 mm for water mist system. The difference in dimensions
will not have a large affect on the space efficiency.
Water mist system is a more space efficient solution when comparing traditional
sprinkler with water mist system which is seen in Table 4.15. The space difference
between the systems are 250, 360 and 370 % for building 1, 2 and 3. It does not
need as much area due to the high pressure in the system which is able to distribute
water from the bottom of the building to the top and the water tanks does not need
to be as large. Due to the high pressure it could occur severe damage if the pipes
brake and the investment cost of water mist system is higher than traditional sprin-
kler system (Fogtec, n.d.). The systems have both pros and cons which have to be
compared but just looking at the parameter space efficiency, water mist system
could be a better choice. By comparing Figure 4.8 with Figure 4.9 it is seen that
the water mist system has less amount of installations than the sprinkler system.
It could be a good idea by placing water mist rooms at the same floor as the tap
water pumps, which could coincide with the plant rooms to get a space efficient
solution.
Table 4.15: A space efficiency comparison between sprinkler- and water mist systems.
BuildingTotal sprinkler area
/GEA [%]
Total water mist area
/GEA [%]
1 0.35 0.10
2 0.23 0.05
3 0.14 0.03
78

4.5. THE VALUE OF SPACE EFFICIENCY 4. Analysis
4.5 The value of space efficiency
The value of a square meter depends on the geographical location, different pricing
for various cities. The yearly rent for a square meter in an newly built office in
Gothenburg is about 3000 kr/m2 compared to 13000 kr/m2 in London. An example
how much space efficiency could be worth is the difference of space needed for the
HVAC system for building 1 with a cooling need of 30 W/m2 waterborne cooling.
Configuration 1 needs 480 m2 and configuration 2 needs 839 m2 the difference in
area is 359 m2. The 359 m2 will be worth 1 070 000 kr/year in Gotenburg and 4
667 000 kr/year in London. Comparing the two configurations is not only about
square meters, configuration 1 has more AHU:s than configuration 2, if they are
taken into account an investment cost of 3 888 000 kr for configuration 1 and 3 492
000 kr for configuration 2 (AB, 2019). The result will still be profitable if choosing
configuration 1 but there are other parameters than just space efficiency that have
to be considered.
4.6 Sources of error
The case study is based on key values and research data, the key values as cooling
demand and staff density will have a large impact on the technical system. The
key values used in the master’s thesis is achievable but in real life projects they
might be a little optimistic, the conditions for the case study are very good and
aims for future tall office buildings. The staff density of the building is according
to Sveby reasonable but most office buildings today have different types of tenants
which uses the area differently for their staff which could lead to other demands on
the technical installations.
4.6.1 HVAC
Regarding what is discussed in Section 4.1.2.1 about the variance between C1 and
C3. A contributing factor to the variance is likely that each configuration has been
chosen to fit within the restricted ceiling height. The ceiling height will always be
the same, but it can be utilized differently. For a required flow there will not always
be an AHU that fits perfectly, it might leave some space up to the ceiling. At the
same time, there might be an AHU that fits perfectly. The type of AHU that can
utilize the full ceiling height will be able to provide a larger air flow (more floors)
with fewer AHU:s and will be more space efficient in terms of plant room area.
Another aspect that can make a configuration seem less space efficient is that the
79

4.6. SOURCES OF ERROR 4. Analysis
number of floors that are supplied by each AHU will add up to a number that
requires a smaller number of floors supplied by the last AHU, as illustrated with
the numbers in parenthesis in the tables. Since the shaft size will be that which is
required by the largest flow this will result in the shaft being unnecessarily large
for the last number of floors.
4.6.2 Elevators
When adding the shuttle elevators it was difficult to follow the methods that applies
to regular elevators since a shuttle elevator only serves two floors, the bottom floor
and the floor of the sky lobby it reaches. This makes is difficult to estimate the
number of users of the shuttle elevators and hence the needed capacity. This may
have resulted in the number of shuttle elevators and the sizes of the shafts being
less true to a real solution than the rest of the elevators and shafts.
Full occupancy was assumed when calculating the needed elevator capacity. This
gives the worst-case scenario since the need for elevators is at its highest. The level
of occupancy is assumed to be handled by the chosen type of building and the type
of use. However, it is not known to which extent the program alters the number of
occupants that is given by the user of the program.
4.6.3 Water distribution
The standard value of 0.7 l/s for 1000 m2 from (VVS Foretagen, 2013) has been
used as a preliminary value, to get the correct tap water flow a summary of all taps
is needed and this design has not been done in the master’s thesis. The pipe area
depends on the water flow and the velocity in the pipe, however the velocity of 2
m/s is correct and the only parameter that will affect the area is the water flow.
The needed pump area for the tap water pump is chosen according to Grundfos
product list and other pumps from other companies could be of a smaller size but
with the same capacity, they could also be larger. The friction loss in the main tap
water pipe has been assumed to be constant even though it will change over the
length of the pipe. As for tap water flow the wastewater flow is also taken as a
standard value due to that no detailed design has been done in the master’s thesis,
this could in turn affect the wastewater pipe area. The dimension of the shaft for
tap water, wastewater and HWC an insulation thickness is assumed this thickness
may be smaller or larger depending on circumstances but in this master’s thesis it
is designed according to Figure 3.3.
80

4.7. FURTHER STUDIES 4. Analysis
4.6.4 Fire safety
The area for the pipes of the systems have not been accounted for, which is a
source of error in the space efficiency calculations. The hazard classification for tall
buildings could be higher than OH1, but OH1 is correct according to the Swedish
Sprinkler Standard (Standard, 2004). An higher classification would affect the
needed water flow for each sprinkler zone which affects the needed pipe area. The
height of the water tank is set to a arbitrary value of 2.5 m, a change of this value
would affect the area needed for the water tank. The friction loss in the main pipe
is assumed to be constant over the total pipe length even though the water flow in
the main pipe is not constant. The area needed for the sprinkler- and water mist
central is said to be 30 m2 respectively 24 m2 these numbers are standard values,
may be larger or smaller areas could be chosen at a more detailed design. The
maximum pressure in the sprinkler system is 12 bar according to (Fogtec, n.d.) a
higher value would increase the sectioning of the sprinkler system, FOFTEC is a
German company and the choice of 12 bar as maximum pressure could be according
to other guidelines than the Swedish.
4.7 Further studies
As mentioned throughout the report, several aspects have not been considered in
this thesis. For further studies it would be interesting to account for the energy
use of the system and connect the economy of that with the economy of the space
efficiency. It would also be interesting to look further into the building physics
aspects and see what measures can be taken to improve the performance of the
building on that end.
It would be interesting to investigate what measures could be taken to affect the
space efficiency in the vertical direction. In this thesis the floor to floor height of 3.6
m with a room height of 2.7 m was chosen as it complies with the regulations and
is used in tall office buildings in Sweden. The 0.9 m is meant to fit both structural
elements and technical installations. If this could be decreased to 0.8 m it would
for a building of e.g. 70 floors mean a difference of 7 m and for taller buildings the
potential for saving space would of course be larger.
It is concluded that C3 is space efficient with its plant rooms but that the number
of floors supplied by each plant room increases the dimensions of the ducts so that
C1 and C3 are even. If an optimization was to be made it could be interesting
to look further into the use of several AHU:s in one plant room and the optimal
81

4.7. FURTHER STUDIES 4. Analysis
number of floors supplied by one plant room.
It was seen in the results on the elevator system that there is a great potential
of space saving there and it was found in the literature study that double-deckers
can have a big influence on the space claimed by the elevator shafts. Therefore, the
use of double-deckers could be further investigated to get specific numbers on the
potential of them.
82

5
Conclusion
The height affects the space efficiency of the technical systems differently and the
distribution of the systems differ as well. Some of the systems can be stacked on
top of each other while some of the systems have to extend from the bottom to the
top floor.
When looking at the ventilation system it is seen than C1 and C3 are very even in
terms of space efficiency. C3 requires less space for the plant rooms but C1 requires
less space for the ducts due to the smaller number of floors supplied by each plant
room. This shows that the most space efficient solution will be a compromise be-
tween plant room size and duct size. C2 takes the most space both in plant room
and ducts and is hence the least space efficient solution. However, C2 is a possible
solution if the priority is to increase the number of floors per plant room as much
as possible. As the building height increases, AHU:s and ducts will be added to
supply air to the added floors, but the space efficiency will not be affected by the
increased height. The parts of the ventilation system will simply be stacked on top
of each other, as seen in the figures in Section 4.1. When comparing waterborne and
airborne cooling it was seen that at 20 W/m2 the two solutions claimed roughly the
same amount of space, while at 30 and 40 W/m2 the waterborne was more space
efficient.
The elevator system differs from the other systems in that the space claimed by the
system increases with an increased height of the building. The elevator system is
also the most demanding in terms of space as can be seen in the results. Although
this is not surprising, the relation seen between the percentages claimed by the
elevators and the other systems shows that the space saving potential in elevator
design choices is substantial. Zoning choices is observed to have a big influence on
the space claimed by the elevator shafts. Shorter zones will generally result in a
more space efficient solution although shafts are added for the extra zones. The
shorter zones serve fewer people per group of elevators and will result in decreased
dimensions of the shafts which in total will result in a more space efficient solution.
The use of sky lobbies also show positive effects on the space efficiency. However,
83

5. Conclusion
sky lobbies might not be used in real building projects with similar heights as the
lower ones used in this case study. Nevertheless, from what can be observed in the
results it is concluded that the space efficiency can potentially be improved by the
use of sky lobbies.
A sectioning of the water distribution system each 10th floor implies that no PRV
is needed, it could be a good alternative to use the municipal water pressure be-
fore pressurizing the tap water. The sectioning of the water distribution system
is independent of the height of the building, and the space needed for the system
compared to the total GEA is very low. The series connected system has not the
lowest space efficiency but the total cost compared to other water distribution sys-
tem is the lowest. Single booster system could be an option but the need of PRV
is very large because of the high water pressure that will be needed.
The sprinkler system has a sectioning each 25th floor compared to water mist
system which has sufficient capacity to supply water to the whole building. It is
due to the high pressure that water mist system could handle, the sprinkler system
does need more space than the water mist system but none of the system do need
much space compared to the total GEA. Water mist system is very space efficient
but sprinkler is a very common fire protection method with detailed guidelines, why
it is more common.
The focus of this thesis has been on the space efficiency and distribution of the
chosen systems. This has meant that many aspects that will have influence in real
building projects have not been considered. The intention of the thesis work is
that people with a good understanding of the building as a system will be able to
understand how to use the results in combination with their knowledge. The results
of the thesis is believed to have the potential of being a contributing part in early
stage analysis of tall office buildings.
84

References
AB, W. B. (2019). Wikells sektionsfakta-VVS 19/20. Vaxjo.
Alex Block. (2014). A machine to make the land pay – City Block. Re-
trieved from http://www.alexblock.net/blog/2014/04/02/a-machine-to
-make-the-land-pay/
Al-Kodmany, K. (2015). Tall Buildings and Elevators: A Review of Recent Tech-
nological Advances. Buildings.
Al-Kodmany, K., & Ali, M. M. (2012). Skyscrapers and placemaking: Supporting
local culture and identity. Archnet-IJAR, 6 (2), 43–64. Retrieved from
https://www.researchgate.net/publication/265067165_Skyscrapers
_and_placemaking_Supporting_local_culture_and_identity
Al-Sharif, L. (2017). The Design of Elevator Systems in High Rise Buildings. Lift
Report , 43 , 46–62.
Arbetsmiljoverket. (2018). Temperatur och klimat - Arbetsmiljoverket. Retrieved
from https://www.av.se/inomhusmiljo/temperatur-och-klimat/
ASHRAE. (2016). 2016 ASHRAE Handbook - Heating, Ventilating, and
Air-Conditioning Systems and Equipment (I-P Edition) - Knovel. Re-
trieved from https://app.knovel.com/web/toc.v/cid:kpASHRAEN1/
viewerType:toc/root_slug:ashrae-handbook-heating?kpromoter=
federation&hierarchy=kt010ZFI92
Beedle, L. S. (2018). The Council on Tall Buildings and Urban Habitat. CTBUH
Journal , 1968. Retrieved from www.ctbuh.org%7Cwww.skyscrapercenter
.com
Bohm, H. P. (1989). A General Equation for the Terminal Fall Speed
of Solid Hydrometeos. American Meteorological Society . Re-
trieved from https://journals.ametsoc.org/doi/pdf/10.1175/
1520-0469%281989%29046%3C2419%3AAGEFTT%3E2.0.CO%3B2
Boverket. (n.d.). Raddningshissar - PBL kunskapsbanken - Boverket. Re-
trieved from https://www.boverket.se/sv/PBL-kunskapsbanken/regler
-om-byggande/boverkets-byggregler/brandskydd/raddningshiss/
Boverket. (2011). BOVERKETS FORFATTNINGSSAMLING BFS 2011:6 BBR 18
85

REFERENCES REFERENCES
(Tech. Rep.). Retrieved from https://www.boverket.se/contentassets/
3108c5069a60495380949c906e9c6f0b/bbr-18-ovk.pdf
Boverket. (2014). Atemp - Boverket. Retrieved from https://www.boverket.se/
sv/byggande/bygg-och-renovera-energieffektivt/Atemp/
Boverket. (2017a). Boverkets forfattningssamling BFS 2018:xx BBR
xx. Retrieved from https://www.boverket.se/contentassets/
ac528c243fed4ee4ab08cf27e04a7eeb/bfs-2018-xx-bbr-avsnitt-9.pdf
Boverket. (2017b). Urban Density Done Right (Tech. Rep.). Re-
trieved from www.boverket.sehttps://www.boverket.se/globalassets/
publikationer/dokument/2017/urban-density-done-right.pdf
Boverket. (2018a). BBR 26.
Boverket. (2018b). Brandskyddade trapphus, Tr1 och Tr2 - PBL kunskaps-
banken - Boverket. Retrieved from https://www.boverket.se/sv/
PBL-kunskapsbanken/regler-om-byggande/boverkets-byggregler/
brandskydd/trapphus/
Boverket. (2018c). Rumshojd - PBL kunskapsbanken - Boverket. Re-
trieved from https://www.boverket.se/sv/PBL-kunskapsbanken/regler
-om-byggande/boverkets-byggregler/rumshojd/
Boverket. (2019a). Raddningshissar - PBL kunskapsbanken - Boverket. Re-
trieved from https://www.boverket.se/sv/PBL-kunskapsbanken/regler
-om-byggande/boverkets-byggregler/brandskydd/raddningshiss/
Boverket. (2019b). Tillganglighet - PBL kunskapsbanken - Boverket. Re-
trieved from https://www.boverket.se/sv/PBL-kunskapsbanken/regler
-om-byggande/boverkets-byggregler/tillganglighet/
Brandskyddsforeningen. (2018). Installation av vat trycksatt stigarledning.
Stockholm. Retrieved from https://www.brandskyddsforeningen.se/
globalassets/blanketter/remiss-sbf-504_1.pdf
CTBUH. (2015a). Burj Khalifa - The Skyscraper Center. Retrieved from http://
www.skyscrapercenter.com/building/burj-khalifa/3
CTBUH. (2015b). CTBUH Height Criteria for Measuring & Defining Tall
Buildings. CTBUH Journal . Retrieved from http://ctbuh.org/uploads/
CTBUH_HeightCriteria.pdf
CTBUH. (2019a). About the CTBUH | Council on Tall Buildings and Urban
Habitat. Retrieved from http://ctbuh.org/about/about/
CTBUH. (2019b). Jeddah Tower - The Skyscraper Center. Retrieved from http://
www.skyscrapercenter.com/building/jeddah-tower/2
CTBUH. (2019c). Tall Buildings in Numbers. CTBUH Journal(1).
Retrieved from http://global.ctbuh.org/resources/papers/
4045-Journal2019_IssueI_TBIN.pdfhttp://global.ctbuh.org/
86

REFERENCES REFERENCES
resources/papers/2848-Journal2016_IssueIII_TBIN.pdf
de Jong, J. (2014). Innovative Elevator Technologies To Future Proof Your
Building. In Ctbuh 2014 shanghai conference proceedings (pp. 817–
823). Retrieved from http://global.ctbuh.org/resources/papers/
download/1866-innovative-elevator-technologies-to-future-proof
-your-building.pdf
Elevatorpedia. (n.d.). Traveling cable | Elevator Wiki | FANDOM powered by Wikia.
Retrieved from https://elevation.fandom.com/wiki/Machine_room
_less_elevatorhttp://elevation.wikia.com/wiki/Traveling_cable
Emporis. (n.d.-a). high-rise building | Emporis Standards | EMPORIS. Re-
trieved from https://www.emporis.com/building/standard/3/high-rise
-building
Emporis. (n.d.-b). History of the World’s Tallest Buildings. Re-
trieved from https://www.emporis.com/statistics/history-of
-worlds-tallest-buildingshttp://www.emporis.com/statistics/
history-of-worlds-tallest-buildings
Eskilsson, M. (2019). Stegbilar | Svensk Utryckningsfordonsforening. Retrieved
from http://utryckningsfordon.se/stegbilar/
Flaktwoods. (2008). Projekteringshandledning Kyla (Tech. Rep.). Re-
trieved from http://resources.flaktwoods.com/Perfion/File.aspx?id=
82af80b9-bd71-4dcc-b6cc-4b53100e0b30
Fogtec. (n.d.). High-rise Buildings Standard sprinkler system High pressure
water mist Case Study (Tech. Rep.). Retrieved from https://fogtec
-international.com/files/fogtec_brozura_a4_en_print_rgb.pdf
Jagemar, L. (1996). Design of energy efficient buildings (Doctoral dissertation,
Chalmers). Retrieved from http://www.enerma.se/wp-content/uploads/
2017/02/d34-1996.pdf
Jensen, L. (2005). Trycksattning av trapphus for utrymning (Tech. Rep.).
Retrieved from https://www.brandskyddsforeningen.se/globalassets/
brandforsk/rapporter-2000-2015/trycksattning-av-trapphus-for
-utrymning/bf_rapport_330_031-1.pdf
Jong, J. (2008). Advances in Elevator Technology: Sustainable and Energy
Implications. In Ctbuh 8th world congress (p. 7). Retrieved from http://
global.ctbuh.org/resources/papers/download/461-advances-in
-elevator-technology-sustainable-and-energy-implications.pdf
Klimatanpassningsportalen. (2016). Dagvatten och spillvatten | Klimatanpass-
ningsportalen. Retrieved from http://www.klimatanpassning.se/hur
-paverkas-samhallet/vatten-och-avlopp/dagvatten-och-spillvatten
-1.107468
87

REFERENCES REFERENCES
KONE. (2013). THE NEXT LEAP KONE high-rise solutions. , 6. Re-
trieved from http://download.kone.com/ultrarope/assets/download/
KONE_high-rise_solutions.pdf
Kvist, E. (2015). Space Requirements for Technical System in Office
Buildings-Air handling plant room model (Doctoral dissertation). Re-
trieved from http://publications.lib.chalmers.se/records/fulltext/
227252/227252.pdf
Langdon, D., & Watts, S. (2010). High vs Low: An Elemental Comparison. CTBUH
Journal , Issue 3 . Retrieved from http://global.ctbuh.org/resources/
papers/45-Journal2010IssueIII_TBIN.pdf
Lindblad, N., & Lindstrom, B. (1996). Vatten och avlopp, En handbok i anslutning
till Boverkets byggregler. Stockholm: AB Svensk Byggtjanst.
LU, L. U. (2006). Gaslagar. Lund. Retrieved from https://www.lth.se/
fileadmin/kemigen/pdf/gaslagar.pdf
Lundagrossisten. (2018). VVS-KUNSKAP (Tech. Rep.). Retrieved
from https://lundagrossisten.se/common/pdf/Utbildningskompendium
_VVS_steg_2.pdf
Maglev. (2017). World’s First Maglev Elevator. Retrieved from https://www
.maglev.net/worlds-first-maglev-elevator
Marshall, C. (2015). The world’s first skyscraper: a history of
cities in 50 buildings, day 9. The Guardian. Retrieved from
https://www.theguardian.com/cities/2015/apr/02/worlds-first
-skyscraper-chicago-home-insurance-building-history
Mowrey Elevator. (2018). The Evolution of the Elevator | Changes Over
The Years | Mowrey. Retrieved from http://www.mowreyelevator.com/
industry-updates/the-evolution-of-the-elevator/
Nathan, S. (2018). 11 Important Tips When Leasing Warehouse
Space -. https://www.austintenantadvisors.com/ . Retrieved from
https://www.austintenantadvisors.com/blog/11-important-tips
-when-leasing-warehouse-space/
Nielsen, A., & Nørgaard, J. (2018). GRUNDFOS WATER BOOSTING In-
troduction (Tech. Rep.). Retrieved from http://www.pacopumps.com/
Documentation/WhitePapers/Roof_Tank_Whitepaper.pdf
Patrik Hostmad. (2012). Hog tat stad - Yimby Goteborg. Retrieved from http://
gbg.yimby.se/2012/12/hog-tat-stad_3210.html
Runefors, M., & Persson, C. (2017). TRYCKSATTNING AV TRAP-
PHUS - RISKER OCH MOJLIGHETER (Tech. Rep.). Retrieved
from http://vpp.sbuf.se/Public/Documents/ProjectDocuments/
d7c9c10a-31ed-4d6b-a032-80aa1701ba22/FinalReport/SBUF_13210
88

REFERENCES REFERENCES
_Slutrapport_Trycksattning_av_trapphus.pdf
SAOL. (2009). hoghus | SO | svenska.se. Retrieved from https://svenska.se/
so/?id=21467&pz=7
Sev, A., & Ozgen, A. (2009). Space Efficiency In High-Rise Office Build-
ings. METU Journal of the Faculty of Architecture, 26 (2), 69–89. Re-
trieved from http://jfa.arch.metu.edu.tr/archive/0258-5316/2009/
cilt26/sayi_2/69-89.pdf doi: 10.4305/METU.JFA.2009.2.4
Simmonds, P. (2015). ASHRAE Design Guide for Tall, Supertall, and Megatall
Building Systems. Atlanta: W. Stephen Comstock.
Standard, S. (2004). Brand och raddning-Fasta slacksystem-Automatiska
sprinklersystem-Utforande, installation och underhall Fixed firefighting
systems-Automatic sprinkler systems-Design, installation and maintenance
Provlasningsexemplar / Preview (Tech. Rep.). Retrieved from www.sis.se
Sun, L., Architecture, C., & Planning, U. (2016). Title : Research on the Effect
of High-Rise Commercial Building Construction on Land Value of Shanghai
in the 1920s Research on the Effect of High-Rise Commercial Building Con-
struction on Land Value of Shanghai in the 1920s. International Journal of
High-Rise Buildings , 5 (2), 145–154. Retrieved from www.ctbuh-korea.org/
ijhrb/index.php
Sveby. (2013). Brukarindata kontor (Tech. Rep.). Retrieved from
http://www.sveby.org/wp-content/uploads/2013/06/Brukarindata
-kontor-version-1.1.pdf
Tamboli, A. (2014). Tall and Supertall Buildings: Planning and Design. McGraw-
Hill Education.
Thermia. (2019). Komfortkyla – aktiv och passiv kyla | Thermia. Re-
trieved from http://www.thermia.se/varmepump-kunskap/hur-fungerar
-en-varmepump/varmepump-teknik/komfortkyla/
Thyssenkrupp. (2019). TWIN - elevator by thyssenkrupp. Retrieved from https://
www.thyssenkrupp-elevator.com/uk/products/elevators/twin/
UN. (2018). 2018 Revision of World Urbanization Prospects | Multimedia Li-
brary - United Nations Department of Economic and Social Affairs. Re-
trieved from https://www.un.org/development/desa/publications/2018
-revision-of-world-urbanization-prospects.html
Viessmann. (2019). Naturkyla och aktiv kyla – kylning med varmepumpar |Viessmann. Retrieved from https://www.viessmann.se/sv/bostadshus/
varmepumpar/naturkyla-och-aktiv-kyla.html
Villegas, L. N. (2018). The Density Fallacy: Don’t Need Towers to add density –
lewisnvillegas. Retrieved from https://lewisnvillegas.wordpress.com/
2018/08/15/the-economics-of-high-rise-buildings/
89

REFERENCES REFERENCES
VVS Foretagen. (2013). VVS Foretagens Teknikhandbok.
Wit, J. (2007). Elevator planning for high-rise buildings.
Wood, A. (2006). Tall Buildings A Strategic Design Guide. In
(p. 8). Retrieved from https://store.ctbuh.org/index.php?controller=
attachment&id_attachment=9
90