s&p global platts top 250
TRANSCRIPT

www.platts.com
China – the big questionsThe new economic scenarios. What they mean for
crude demand. And are the data giving the true picture
Greetings from the GulfWhat the changing shape of Middle Eastern
market share reveals about Asia’s energy dynamics
S&P Global Platts Top 250Global energy company rankings – in a tumultuous year
PLUS: INDIA – THE NEW DRIVER • INDONESIA GASOLINE • PETCHEMS • US CRUDE – AND MORE
Asia & the New Oil Landscape
Autumn 2016

Every dawn brings with it new opportunity & every new opportunity - A unique set of risk.
themes of today’s Commodity and Energy Trading Industry. With the growing need to address
GLOBAL THOUGHT LEADERSHIP. DELIVERED.

InsightAutumn 2016
ISSN 2153-1528 (print)ISSN 2153-1536 (online)
Publisher
Murray Fisher, 720-264-6644
murray.fi [email protected]
Editor
Maurice Geller
Production Manager
Nelson Sprinkle
Designer
Constantina Bertsoukli
Production Offi ce
Platts Insight Magazine
1800 Larimer, Suite 2000
Denver, CO 80202
Global Director, Conferences
and Strategic Media
Steven McCarthy, 857-383-5727
Advertising Sales Manager
Robin Mason, 631-642-2600
Article Reprints and Permissions:
The YGS Group, +1 717-505-9701, ext
Subscribe free at:
http://marketing.platts.com/forms/
SMSInsightSubscribe
S&P Global Platts
20 Canada Square, 9th Floor
London, E14 5LH, UK
President:
Imogen Joss
VP Finance:
Hywel Thomas
Global Head of Content:
Martin Fraenkel
Global Head of Oil Content:
Dave Ernsberger
Global Editorial Director, Gas,
Power, Coal and Petrochemicals:
Simon James Thorne
Content Director, Asia:
Sarah Cottle
ContentsAutumn 2016
A matter of projection ............................................................................... 6What are the implications of a slowing economy
for Chinese oil demand? Choose your scenario
China’s true crude demand ..................................................................... 10It may be higher than it appears, with
the fi gures skewed by incomplete data
Infrastructure angst ............................................................................... 16The stumbling block for China’s
blossoming independent ‘teapot’ refi neries
Changing shape of Persian Gulf .............................................................. 19Dramatic shifts in Middle Eastern market share
as producers compete to meet Asia’s needs
Driving force ........................................................................................... 22All eyes are on India as the new motor
behind global oil demand in coming years
Stormy waters ........................................................................................ 26Boom times led to a ship-shopping spree
but now the tanker market may be swamped
US crude migration ................................................................................ 32 What has happened since the lifting of the US
export ban – and where are the barrels going?
Petchems strives to keep its edge .......................................................... 38Cheap feedstocks meant beautiful margins
for Asian players but that may soon be eroded
Gasoline goes into reverse ..................................................................... 42Weak fundamentals and excess supplies
have tarnished last year’s ‘King of the Barrel’
Indonesia’s refi ning industry .................................................................. 46Developments are fi nally taking off – which
may not be good news for oil product exporters
Myanmar’s roadblock ............................................................................. 49Failure to tackle surging energy demand
could prove an expensive obstacle to growth
S&P GLOBAL PLATTS TOP 250 ................................................................. 52The 15th annual global energy rankings,
as a price shakeout sparks industry upheaval
Cover Photo: ©shutterstock/chuyuss

“People say believe half of what you see, some or none of what you hear,” goes the Motown anthem. And much of this special APPECissue of Insight magazine involves intense scrutiny of Asian economic and energy scenarios and the assumptions underlying them as wellas the implications for crude and oil products demand.
Skepticism may turn momentarily to disbelief almost elsewherein this issue, even for those inured to the wild price action and volatility of the past year or two. Witness the Top 250 feature –our 15th annual global energy company rankings with perhaps the most dramatic shifts to date. I won’t say any more here – read on.But the list of biggest movers – up as well as down – is particularly eye-opening.
This is also our inaugural APPEC issue – to tie in with an event that, since its inception in 1985, has grown to become one of Asia’s most important oil industry forums. The acquisition of APPEC by S&P Global Platts refl ects our commitment to providing up-to-date industry intelligence and deepening the insights and attendance base thatthe oil community has come to expect from this event.
And it comes at a particularly signifi cant time for the industry. As one of our authors says – and proceeds to demonstrate – the importance of the region to global oil demand over the next fi ve years could not be more clear. Equally, it’s hardly going out on a limb to suggest those fi ve years will throw up as many challenges as they do opportunities.
But ultimately what one can bank on, for markets and businessesto survive and thrive, is a capacity for innovation, adaptability, resilience – and trust.
In the end, pace Marvin Gaye, as Mariel Hemingway said toWoody Allen at the end of Manhattan, “You have to have a littlefaith in people.”
Editor’s Letter
Maurice Geller
Editorial Director,
Central Editing Desk,
EMEA,
S&P Global Platts

PlattsOil AnalyticsSo much of your success lies in understanding the space betweenprice and value. It’s where you’ve always found us, talking to themarket every day, gathering data and publishing our price assessments.
To meet market demand, we’re taking our analysis of this world evenfurther, not just of the transactional side of price but also the supplychain dynamics shaping it.
Building on the insights our editors and analysts already share with you,we’re expanding our data sets and analytical tools to give you even greatercoverage of oil industry verticals and the trade-fl ows between them.
With S&P Global Platts facilitating connected thinking across tradingprice and supply chain infl uences, this wider context of value helps youfurther develop your own view and seize the opportunity you fi nd there.
Platts China Oil Analytics | Platts cFlow | Platts Ocean Intelligence | Platts Well Economics Analyzer
www.platts.com
ANALYTICSANALYTICS

China Economy
6 Platts Insight Autumn 2016
Where China is heading – a matter of projectionWhat is the likely extent of a slowing economy – and its implications for Chinese oil demand?
As crude demand falls in the OECD over the next fi ve years, oil demand will increasingly be driven by Asia. The importance
of the region to global oil demand over the next fi ve years could not be more apparent – witness the International Energy Agency’s expectations of incremental global oil demand over the period 2015-2021(Chart 1).
The IEA expects global demand to grow by 7.2 million b/d by from 2015 to 2021. While demand from India, the Middle East and other non-OECD Asian countries is expected to account for 4.1 million b/d or 57% of total incremental demand, it is China that will be in everyone’s sights over the six years 2015-2021. With uncertainties over the sustainability of China’s economic growth, there are questions over whether China can really be expected to account for a third or 2.4 million b/d of newcrude demand.
China’s economy has performed remarkably well since 2000 with growth rates averaging 9.5%. However, much of this growth has been built on giving state-owned enterprises (SOEs) access to easy credit where it has been funneled into the real estate, infrastructure and heavy industry sectors. This has resulted insignifi cant misallocation of capital
and overcapacity across many industrial sectors and which has become a drag on the economy.
We can identify three narratives that are used to explain the Chinese macro-economy:
• “Hard Landing” – offi cial numbers can’t be trusted and are thought to be suspect. The “true” growth rate as measured by metrics like railway cargo volume and electricity consumption is more like 2% to 3%;
• “It’s still largely under control” – There may be problems, but the Chinese authorities have a great track record in managing the economy;
• “Extend and pretend” – Growth is probably close to the offi cial number but this is being propped up by credit which is unsustainable.
At S&P Global, our view is that the “extend and pretend” narrative is closest to the actual situation on the ground with credit continuing to grow faster than nominal GDP (Chart 2).
While consumption, which in China is not primarily driven by debt, is holding up well, credit continues to be channeled into the increasingly unproductive state-owned sector where there are fewer and fewer opportunities for productive investment. While we do not think that the Chinese economy is in imminent danger of a macro shock or
Sebastian Lewis
Content Director, China,
S&P Global Platts

China Economy
Autumn 2016 Platts Insight 7
rapid slowdown in growth, we do believe that this strategy of continuing to prop up growth with credit is unsustainable.
In order to rein in credit growth and bring the economy on to a more sustainable path the government needs to engage in structural reform targeted at the state-owned sector so that it becomes more productive and requires less credit. This would result in an economy with a smaller state-owned sector, with growth being driven by the larger (and more productive) private sector. It would also entail considerable social costs as the government removes
overcapacity and overemployment in the state sector. This would also mean the government accepting a lower, but more sustainable, rate of growth, something that thus far it seems unwilling to do. (Lower growth would mean for example abandoning Premier Xi Jinping’s much publicized “China Dream” of doubling 2010 GDP by 2020.)
The government has laid out plans for structural reform in the latest fi ve year plan (2016-2020) however the implementation has been slow and radical reform does not seem to be on the cards. That said, we believe the
government has fi scal and external reserve cushions and effective policy levers to support growth and fi nancial stability at least in the short to medium term. Given this we expect China to continue to grow at around 6% for the next three years.
Earlier this year S&P Global Ratings published a paper which examined a hypothetical “hard downside” economic scenario in which the government sharply constrains lending to SOEs in order to accelerate the rebalancing of the economy which inadvertently triggers a sharp slowdown in growth as the private sector adopt a wait and see attitude towards investment and consumer spending fails to pick up from current levels. In this “hard downside” scenario Chinese GDP growth slows to an average annual 3.4% over 2017-2020 from 6% in our baseline projection.
We have modelled Chinese oil demand to see how it performs under our baseline, low growth and “hard downside” scenarios. We use an approach to modelling oil demand based on projecting historical trends in per capita GDP and per capita over the period 2010–2015 into the future. Our economic assumptions and resulting forecasts for Chinese crude demand are given in the table and chart (Table 1, Chart 3).
Our base case sees Chinese oil demand rise to 13.3 million b/d by 2020, or 2.2 million b/d of new incremental demand over the fi ve year period 2016-2020.This is in line with 2020 oil demandas forecast by the IEA of 13.2 millionb/d in its 2016 Medium Term Oil Market Report. This is hardly surprising as the economic assumptions from the IMF that the the Paris-based agency usesto forecast medium term oil demandare very similar to the base casegrowth rates produced by our S&P Global economists.
IEA PROJECTED GROWTH IN OIL DEMAND 2015�2021 & SHARE OF GLOBAL GROWTH
Source: ΙΕΑ
-1
0
1
2
3
ChinaOther AsiaMiddle EastIndiaAfricaRoWOECD
(million b/d)
-14%
11% 13%15%
18%
24%
33%
Chart 1
CHINA: CREDIT GROWTH VS NOMINAL GDP GROWTH
Source: S&P Global
-10
0
10
20
30
40
50
60
70
2015201420132012201120102009200820072006
(%) Aggregate FinancingCumulative difference Nominal GDP
Chart 2

©shutterstock/LIUSHENGFILM

Autumn 2016 Platts Insight 9
Oil demand slips slightly in the downside scenario to 13.2 million b/d by 2020. Or 100,000 b/d less incremental demand 2016-2020 than the base case. In the hard downside case demand falls sharply, reaching only 12.5 million b/d by 2020, around 800,000 b/d around 800,000 b/d lower than the base case.
Forecasting oil demand in the “hard downside” case is made more diffi cult because this scenario assumes a heavy contraction in fi xed investment like construction, and infrastructure which is more oil intensive than consumption which includes consumer goods and services. The “hard downside” assumes that fi xed investment falls to 32% of GDP in 2020 from 43% in 2016. We have taken account of this by modelling the historical relationship between oil demand and both investment and consumption components of GDP and projecting these into 2017-2020. In this scenario growth in investment is negative and consumption growth falls in the initial years with consumption growth improving from 2019 onwards. Using these assumptions we fi nd that demand growth falls by more than half compared to the base case, reaching only slightly more than 12.0 million b/d by 2020, around 1.2 million b/d down on the base case.
But any rapid fall in Chinese growth would have signifi cant knock-on effects to the global economy. A decline in Chinese investment and a substantially depreciated yuan would see a slowdown in Chinese imports. Given that China’s imports only account for only around 3% of global GDP this would actually be a relatively minor shock to the global economy but would be most keenly felt by economies like Taiwan and Korea with high trade exposure to China.
Much more signifi cant would be the effect that this would have on global business and consumer confi dence. In our “hard downside” scenario, we see
global growth impacted via lower global investment, capital outfl ows from emerging economies and the depreciation of their currencies. Investors and banks around the world would become more risk-adverse, provoking a liquidity squeeze in emerging economies similar to that seen in 2008-2009 with milder liquidity stresses occurring in developed economies. This “hard downside” scenario for China would see an annual shortfall in global GDP of just under 1% over 2017-2020 (or a cumulative 3.8%).
In terms of impact on global oil demand, this lower global growth scenario would see global oil demand fall by at least 1.8 million b/d compared to our base case and indeed we believe the decline could be even greater if much of the fall in oil demand is as a result of a pullback in investment in emerging markets especially in Asia which will be more impacted by any China “hard downside” than regions like Europe and North
America which will feel less of an impact as well as being less oil intensive. At the same time this demand shock would also result in dramatically lower prices for oil and other commodities which would be positive for oil and commodity importers. We do stress however that this hard downside scenario is a tail-risk analysis. As such, it is neither part of S&P Global base-case nor even our downside view about the Chinese economy and oil demand.
The Chinese state has suffi cient fi scal reserves and control over the fi nancial sector that it can step in and ensure enough credit is supplied to the economy to support growth if it starts to falter (at least in the short term). However this will just be delaying the inevitable reforms that must take place if China is not to succumb to a prolonged period of low growth. Or in the words of Laozi (Lao Tzu) the ancient Chinese philosopher and founder of Daoism (Taoism) “If you do not change direction, you may end up where you are heading”.
CHINESE OIL DEMAND UNDER THREE GROWTH SCENARIOS
Source: S&P Global, IEA, Platts
0
2
4
6
8
10
12
14
2020201920182017
(million b/d) DownsideBase case Hard downside
Chart 3
REAL GDP BASELINE, LOW & HYPOTHETICAL “HARD DOWNSIDE” SCENARIOS (%)
2017 2018 2019 2020Base Case 6.1 6.0 6.0 6.0Downside 5.8 5.7 5.7 5.7Hard Downside 2.5 2.6 3.6 5.0
Source: S&P Global
Table 1
China Economy

©shutterstock/Hung Chung Chih

Autumn 2016 Platts Insight 11
Playing by numbers: China’s true demandCrude demand may be higher than it appears with figures skewed by incomplete data
Anyone monitoring headline oil demand data in China would have noticed that growth this year has decelerated
signifi cantly from the heady rate of 2015, when low oil prices encouraged consumption at the pump while the ongoing economic transition to consumption-led expansion boosted transport fuels such as gasoline andjet fuel.
In 2016, apparent oil demand during the fi rst six months contracted slightly by 0.6%. In contrast, it spiked 5.8% in 2015 – the strongest growth rate since the end of the global fi nancial crisis. Strength was seen particularly in the light ends with gasoline’s apparent demand surging 9%.
What has put thebrakes on growth?
The Chinese government does not release consumption data on oil. S&P Global Platts, as well as other agencies looking at China, uses a proxy for oil demand by adding domestic production – comprising refi nery runs released by the National Bureau of Statistics – to net imports of oil products, data for
which is made available by the General Administration of Customs.
Calculations based on these data put apparent oil demand at 11.15 million b/d during the fi rst half, a 0.6% decline year on year. Yet crude oil imports this year have upended expectations and risen nearly 900,000 b/d, or 13.6%, over the period. This incremental volume is nearly equal to the growth in crude imports in 2014 and 2015 combined.
If crude imports are so strong and demand appears to have weakened, does it imply a signifi cant volume of crude going into stocks?
On the contrary, Platts believes apparent demand to be higher because independent refi ners have raised their processing rates signifi cantly this year, but this has not been captured by the offi cial statistics.
The NBS reported that total refi nery runs in China over the fi rst half rose just 1.9% or nearly 200,000 b/d to 10.73 million b/d. However, data collected by Platts and JYD Commodities Hub, a domestic data provider, shows that over 600,000 b/d of additional crude oil was processed by independent refi ners
Yen Ling Song
Senior Analyst,
S&P Global Platts
China Demand

12 Platts Insight Autumn 2016
during the fi rst half comparedwith the same period of 2015. Theserefi ners have raised their run ratesfrom an average of 39% over January to June last year, to 54% in the fi rsthalf of 2016 and this has been thedirect result of the government deregulating the refi ning sectorand allowing independent refi nersto import crude oil.
Before this, they were offi cially banned from importing crude oil and mainly relied on crudes that were available in the domestic market, supplemented with imported fuel oil. The restrictions on their feedstock posed cost challenges which constrained their operations. But after the government awarded 1.2 million b/d of new crudeoil import rights to independent refi ners since the second half of last year, these refi ners have now been able to boost utilization to record levels, with some even claiming to be running at 80%to 100%.
Since the deregulation, independent refi ners have made a big impact on global markets, accounting for at least three quarters of the growth in China’s crude oil imports this year and opening up a new avenue for foreign traders and crude suppliers to do business in China in an area traditionally dominated by a handful of state-owned companies.
In previous years independent refi ners largely operated under the radar and typically accounted for less than 10% of China’s refi nery runs. Incentivized by the newly acquired crude import quotas to compete on a level playing fi eld, this year they have, in true David and Goliath fashion, leveraged their nimbleness, small scale and fl exibility to seize market share from the state-owned giants by undercutting them on price.
Independent refi ners have likely doubled their crude processing volumes in the last year, according to Platts estimates. Faced with heated competition, the state-owned companies have raised their exports of oil products by some 70% to a record high level of 680,000 b/d. Dominant refi ner Sinopec, the largest by capacity in Asia, reported a 3% decline in refi nery runs in the fi rst half of this year.
So why is data from independent refi ners not being captured by the offi cial statistics? Independent refi ners have been notorious for going to great lengths to minimize payment on taxes. Because of the way consumption taxes are structured in the country – different
tax amounts are levied on various oil products and crude oil, while exemptions can be applied under certain conditions – companies have been creative at fi nding loopholes to avoid paying some consumption taxes. This, coupled with hitherto poor oversight by offi cials, has resulted in tax avoidance among independent refi ners becoming a fairly widespread yet covert practice for many years.
But sources explain that the NBS collates domestic production of commodities by looking at tax submissions, known in China as fapiao. These are invoices issued for every kind of payment made in China and are used by the government to monitor tax payments. So if tax payments are avoided, then the NBS will not be able to tally production accurately.
This is key to understanding why there is such a big difference between the growth in crude oil imports and the apparent oil demand fi gure this year.
If independent refi neries were included in the calculation, that would raise refi nery runs by at least 400,000 b/d
CHINA’S APPARENT OIL DEMAND
Sources: National Bureau of Statistics, General Administration of Customs, Platts China Oil Analytics
0
2
4
6
8
10
12
DecNovOctSepAugJulJunMayAprMarFebJan
(million b/d) 2014 2015 2016
If tax payments
are avoided, then
the NBS will not be able
to tally production
accurately
China Demand

Autumn 2016 Platts Insight 13
this year, meaning apparent demand would likely have increased by 3%, rather than a 0.6% contraction if calculated using the offi cialgovernment data.
This would be closer in line with Platts China Oil Analytics’ original forecast of 2% growth for apparent oil demand in China in 2016. Macroeconomic data
also support this rate of growth. GDP growth in China in the second quarter came in at 6.7%, unchanged from the fi rst three months of the year but stronger than market expectations. Secondary sector nominal GDP – an indication of expansion in the industrial and manufacturing sectors – rose to 4.8% year-to-date in the second quarter, the strongest pace of growth
since late 2014. Credit also continues to fl ood the economy, with total social fi nancing rising by nearly $1.5 trillion in the fi rst half.
S&P Global Ratings, a sister divisionof Platts, in July raised its forecast for China’s GDP growth in 2016 to 6.6%,up from its previous forecast of 6.4%.
©shutterstock/tolotola
China Demand
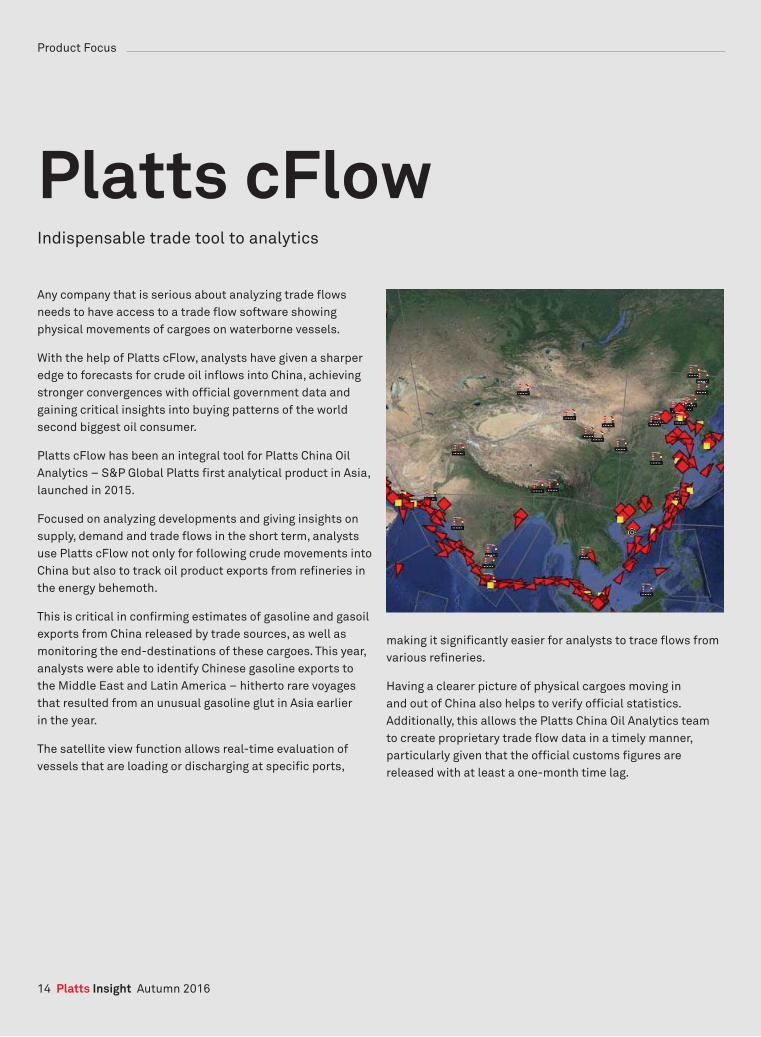
Platts cFlowIndispensable trade tool to analytics
Any company that is serious about analyzing trade fl ows needs to have access to a trade fl ow software showing physical movements of cargoes on waterborne vessels.
With the help of Platts cFlow, analysts have given a sharper edge to forecasts for crude oil infl ows into China, achieving stronger convergences with offi cial government data and gaining critical insights into buying patterns of the world second biggest oil consumer.
Platts cFlow has been an integral tool for Platts China Oil Analytics – S&P Global Platts fi rst analytical product in Asia, launched in 2015.
Focused on analyzing developments and giving insights on supply, demand and trade fl ows in the short term, analysts use Platts cFlow not only for following crude movements into China but also to track oil product exports from refi neries in the energy behemoth.
This is critical in confi rming estimates of gasoline and gasoil exports from China released by trade sources, as well as monitoring the end-destinations of these cargoes. This year, analysts were able to identify Chinese gasoline exports tothe Middle East and Latin America – hitherto rare voyages that resulted from an unusual gasoline glut in Asia earlierin the year.
The satellite view function allows real-time evaluation of vessels that are loading or discharging at specifi c ports,
making it signifi cantly easier for analysts to trace fl ows from various refi neries.
Having a clearer picture of physical cargoes moving inand out of China also helps to verify offi cial statistics. Additionally, this allows the Platts China Oil Analytics teamto create proprietary trade fl ow data in a timely manner, particularly given that the offi cial customs fi gures are released with at least a one-month time lag.
Product Focus
14 Platts Insight Autumn 2016

Platts cFlowConnecting the dots you can see – and the dots you can’t
Gaining a deeper, richer understanding of today’s waterborne commodities marketrequires more than simply connecting the dots on a satellite map. To completethe picture, you need to combine real-time vessel location information with the latest news, market data, trends, prices, insight and analysis.
Platts cFlow is a trade fl ow analytics service that helps you join up your tradingideas with dynamic market fundamental-driven information to make more informedtrading and operational decisions. With Platts cFlow you can view, monitor and analyzethe key factors affecting the supply chain and impacting prices such as vessel movement, cargo data and freight bunker pricing information.
For more information visit www.platts.com/products/cfl ow
www.platts.com
ANALYTICSANALYTICS

16 Platts Insight Autumn 2016
Infrastructure angstThe biggest stumbling block for China’s blossoming independent ‘teapot’ refineries
Several independent Chinese refi ners have joined the export bandwagon this year butmust overcome signifi cant
infrastructure challenges to have a smooth and profi table ride.
So far in 2016, 10 independent refi ners have won quotas to export 1.255 million mt of refi ned products. As of July, they have exported around 200,000 mt.
The independent “teapot” refi neries, as they are often called, refer to those that have not been built by state-owned oil majors CNOOC, Sinopec, PetroChina and Sinochem – though CNOOC and Sinochem later acquired stakes in some of these refi neries to meet their own strategic needs.
Exporting products is a new business for them given that until early last year, they were not even allowed to process imported crudes and relied either on domestic crude or imported fuel oilfor feedstock.
But a lot has changed in the last year since Beijing deregulated crude imports and allowed the independents to start processing imported grades. With ample feedstock choice and availability, these refi ners have boosted run rates and production and have surplus products available for export.
Too much, too soon?
But all these opportunities may have come a little prematurely.
Lack of adequate pipeline, storage and port infrastructure has added greatly to their cost of doing business and solving those problems is key to securing their long-term profi tability.
Infrastructure bottlenecks have led to a heavy reliance on trucks to transport crude and products.
An estimated three out of every four independent refi neries in Shandong province have to rely either in part or entirely on trucks to transport crude and/or oil products, according to Platts China Oil Analytics.
Companies like Chambroad Petrochemical, Fuhai Petrochemical, Yatong Petrochemical and Qingyuan Petrochemical have set up trucking businesses, each with a vehicle fl eet ranging from 100 to 400.
Oceana Zhou
Senior Writer, Oil,
S&P Global Platts
Ports are also
under pressure with the
rise in refi ning activity
in the region
China Independents

Autumn 2016 Platts Insight 17
The high land freight costs take a big bite out of the refi ners’ margins. To illustrate, the point-to-point transportation cost of state-owned refi ners who own ports, storage tanks and an extensive crude and oil product pipeline network is half that compared with transportation via trucks.
These trucks are loaded with 30 mt tanks, a standard size that has in recent years been strictly regulated by the local government.
When Hongrun Petrochemical exported its fi rst gasoline cargo in April this year, the 35,000 mt parcel had to be transported on over a thousand trucks before it could be loaded and shipped out of Laizhou port, more than 200 km northeast of its refi nery in Qingzhou city.
Similarly, Chambroad Petrochemical spent at least Yuan 3.2 million ($500,000) to send the cargo from its refi nery in Zibo to Laizhou port.
Freight for sending gasoline to the ports is around Yuan 160/mt ($2.88/barrel),
Shang Xinkai, trading manager with Chambroad, told S&P Global Plattsin March.
One advantage of road transport however, is that it provides fl exibility for independent refi neries to send their oil products to various parts of China.
Some independent refi ners sell their products as far away as Yunnan province in southwest China, about 2,500 km from Shandong, but transportation cost is also high at about Yuan 600/mt ($12.31/b), according to an offi cial at Zibo-based Wonfull Petrochemical.
Ports are also under pressure with the rise in refi ning activity in the region.
Qingdao Port, which oversees the busiest Huangdao port and the new Dongjiakou port, is currently the largest in China in terms of annual cargo turnover, but it is one of only two in Shandong that can receive VLCCs. Not surprisingly, it has been hit the hardest.
Since the third quarter of last year,
congestion has become routine at the port. Early this year when the independent refi ners imported a wave of crude cargoes, vessels waited between three weeks to a month before they could discharge at Qingdao.
A VLCC that is in the Qingdao queue for 25 days may incur additional costs of more than $2 million, or $1/b, to be borne by the buyer of the cargo, according to a trading source with Chinaoil.
Projects underway
Given the urgent need to improve transport links, plans are underway to build more pipelines.
One major project many companies are eagerly awaiting is the 400,000 b/d Yanzi pipeline, which will run from Yantai port in northern Shandong, to Zibo in the central part of the province.
Construction of the pipeline was completed in July 2016 but it is stillnot clear when the pipeline will begin operations as several approvals arestill pending.
This would be the second crude oil pipeline to be freely available to independent refi ners. The fi rst is the existing 400,000 b/d Huangwei pipeline which connects Huangdao port in Qingdao with Weifang city, another refi ning hub in central Shandong.
Separately, the port of Qingdao has proposed a plan to construct a pipeline to connect its new VLCC berth in Dongjiakou, adjacent to Huangdao, with Weifang and Dongying.
But these projects will not materialize overnight as they are capital intensive and require long lead times, especially
China Independents

18 Platts Insight Autumn 2016
as they span multiple districts and municipal areas, from which approvals must be sought. In addition, pipelines may involve numerous partners and getting alignment from all stakeholders often leads to delays.
The outlook for oil products is even more dire as there are only a couple of pipelines and those too are dedicated to specifi c refi neries.
Key to survival
It is hard to generalize how independent refi ners continue to make money and operate despite their additional operational costs as each of them has a unique plan and mode of survival. Moreover, as these refi ners test the
international markets, their aims and ambitions vary. Some see the higher costs incurred to export products as an investment in the future as they look to shed their traditional reputation of being producers of sub-quality products made from fuel oil.
This goes beyond economics and is related more to getting the experience of exporting products and creating a brand name for themselves. It helps them show their products are acceptable to international buyers.
Moreover, it is not just the independent refi ner who is keen to make a mark in the export market. Trading houses are just as keen to build relationships with them and offer them advantageous deals.
Trafi gura has been one of the most active companies. Besides supplying foreign crude it has also been the offtaker of a number of gasoline cargoes exported by these refi ners.
Sources said Trafi gura has struck a tolling deal with Luqing Petrochemical in particular to sell the refi nery crude feedstock and buy the gasoline processed. This can be seen as an example of the trading houses abilityto help independent refi neries toexport barrels.
But this does not mean there will be a big outfl ow of oil products from the independent refi neries. A sustainable rise in exports will ultimately depend on margins, and that is linked to having the right infrastructure.
Yellow Sea
Bohai Bay
CHINA
Henan
Shandong
Hebei
Ridong pipeline
Yanzi pipeline
Donghuang pipeline
Huangwei pipeline
Laichang pipeline
Proposed Dongwei pipeline
Port
Qingdao
Dongjiakou
Rizhao
Yantai
Laizhou
Longkou
Dongying
Dongying
Zibo
Weifang
Heze
Dezhou
Source: Platts China Oil Analytics
MAJOR PORTS AND PIPELINES IN SHANDONG
China Independents
Autumn 2016 Platts Insight 19
Changing shape of Gulf’s market shareMixed results from Middle East producers show intense competition to meet China’s needs
The Middle East has been losing its share of global crude oil sales to Asia’s biggest energy consumer, despite near-record
output for at least the past year by key Persian Gulf producers.
The surprising trend, which began in 2013, is masked by large monthly fl uctuations in oil trade, but is revealed by analysis of Chinese customs data on imports of crude oil by source country.
The data show Chinese imports of Persian Gulf and other Middle East crudes growing in volume to average 3.364 million b/d in 2015 from 2.943 million b/d in 2013 for a 14.3% increase over two years. However, the Middle East’s share of total Chinese crude imports fell over the same period by more than fi ve percentage points to 50.9% from 56.3%, meaning that other suppliers, including Russia, Angola and Brazil, have been outperforming their Middle East counterparts in boosting crude sales to China. New exportersare also joining the fray – even theUS, which has started selling crudeto China.
The market-share downturn continued in the fi rst fi ve months of this year,
dragging the Middle East’s share of Chinese crude imports below 50% mark for the fi rst time in years. (Fig.1)
That surely casts doubt on the effectiveness of the Saudi-led strategy, to which key Arab oil producers from the Persian Gulf region have adhered since late 2014, of maintaining high output to protect their share of the global market instead of defending prices. China is by far the biggest oil consumer in the Asia-Pacifi c region, which for years has been the key export market for Persian Gulf producers.
In 2015, China consumed 559.7 million mt (11.24 million b/d) of crude oil and refi ned petroleum products, according to BP in the latest issue of its Statistical Review of World Energy, amounting to more than a third of total oil consumption in the Asia-Pacifi c region last year.
A closer look at Chinese imports reveals that, among the large Persian Gulf producers, Saudi Arabia has suffered the biggest erosion of its share of the Chinese oil market. That fell to 14.9% in 2015 from 19.6% two years earlier, accompanied by a nearly 9% decline in export volumes to China. The sales volumes rebounded in the fi rst fi ve
Tamsin Carlisle
Senior Editor,
Oil News and Analysis,
S&P Global Platts
Middle East Supply

20 Platts Insight Autumn 2016
months of 2016 to average more than 1 million b/d for the fi rst extended period since 2013, but even that failed to arrest a further decline in market share to 14.2%.
Iran, as it struggled under international sanctions targeting its petroleum sector, saw the Gulf region’s second largest fall in market share of crude sales to China in 2013-15 with a drop of nearly two percentage points to 7.9% from 9.8%. Despite the January lifting of the most economically damaging
sanctions, Iran saw its share of Chinese crude imports slip further in January-May 2016, to 7.7%.
The region’s other major oil producers have fared better with loss of marketshare since 2013 amounting to less than a percentage point each forthe UAE and Oman – the largestArab oil producer from outside OPEC.Iraq and Kuwait have managed toincrease both oil export volumes to China and their respective market shares, although not enough to offset
completely the corresponding Saudi and Iranian declines.
Iraq provided a steady 9.3% of Chinese crude imports between 2013 and 2015 and in the fi rst fi ve months of 2016 achieved a slight increase to 9.5%.That was backed by an almost 50% increase in export volumes to China over the past two-and-a-half years which may be due, at least in part, to Chinese state-controlled company involvement in projects to boost output from some of Iraq’s largest oil fi elds. Those include the giant BP-operatedRumaila fi eld where China National Petroleum Co. holds a 46.4% stake in the development.
Kuwait, which exports less than halfas much oil to China as neighboring Iraq, has achieved the region’s best results in terms of percentage gainsin its crude sales to the big Asian consumer. Volumes are up nearly 65%, while market share has climbed to 4.2%from 3.6%. Kuwait strives to maintain close commercial and trade ties with China and is a partner in a project to build a refi nery and petrochemicals complex in China’s Guangdong province. However, the project has faced a series of delays.
Overall, the mixed results from Middle East producers exporting to China suggest the Gulf region’s major exporters may be competing as intensely with each other as well as with other international producers to supply China’s oil needs.
Elsewhere in the Asia-Pacifi c region, Japan, with a mature economy, has increased its crude imports from most major oil producers in the Persian Gulf region, including Saudi Arabia and Iran . Both have gained market share there
CHINESE OIL IMPORTS BY SOURCE
Source: Platts
0
5
10
15
20
YemenQatarKuwaitUAEIranOmanIraqSaudi Arabia
(%) 2013 2014 2015 Jan-May 2016
INDIA OIL IMPORTS BY COUNTRY, 2016
Source: Platts
0.0
0.2
0.4
0.6
0.8
1.0
1.2
UAESaudi ArabiaQatarOmanKuwaitIraqIranEgypt
(million b/d) Jan Feb Mar Apr
Fig1.
Fig2.
Middle East Supply

Autumn 2016 Platts Insight 21
since 2013. Over the same period, only Oman has seen a signifi cant drop in its share of Japan’s oil market. However, that market is smaller than China’s and likely to expand slowly at best in coming years.
If some Middle East producers are losing ground in the crowded Chinese market, they still have a chance closer to home to grab a chunk of the rapidly emerging Indian oil market, which so far this year has been importing around 2.8 million b/d of crude from Middle East producers to feed its large refi neries. That compares with about 3.6 million b/d of Middle East oil imports by China and 2.9 million b/d by Japan in the January-May period (Fig.2).
“We’re already ahead of China in economic growth. The brightest spotin the global economic landscape is India,” the spokesman for India’s ruling BJP, Narendra Taneja, told S&P Global
Platts earlier this year in an interview in Doha in which he said India’s government planned to pursue domestic and international petroleum-sector partnerships with Persian Gulf oil and gas producers.
“We are doing everything possible to deepen our energy ties with the region’s oil producers, particularly Saudi Arabia and Iran,” he said.
A barrier for some could be that India wants equity in any international upstream oil and gas ventures in which it participates, even in the Gulf region where most of the biggest producers –Saudi Arabia, Kuwait, Iraq and Iran –offer only service contracts. However, India already has close to $20 billion invested in Iran and is taking a good look at the country’s oil and gas exploration and production sector for further opportunities, Taneja said.
“We would be most interested in buying equity in oil fi elds,” he said, referring broadly to international investment plans. “Our strategy is to invest in equity oil and equity gas so we could bring the oil and gas to India.”
Speaking at an industry event in Doha, Taneja said he favored oil prices in the range of $40-58/b as the sweet spot that would be good for consumers and producers and would stimulate the global economy. At such prices most Middle East upstream oil projects could still offer attractive returns, while many outside the region would struggle.
From a Middle East oil producer’s perspective, if oil prices were tostay in Taneja’s favored range, it just might be worth opening up to equity investment by a trade partner eager to buy more crude.
©shutterstock/vahitdag
Middle East Supply

India Demand
22 Platts Insight Autumn 2016
Driving force: India moves into top gear The nation’s thirst for oil is a key factor behind global demand growth this year and next
It’s neither a knee-jerk reactionto feeble oil prices nor atemporary upsurge on theback of seasonal swings.
Taking a deeper look at India’s ballooning oil demand trajectory over the last year or so clearly points to one thing – that growth is holding up on the back of fundamentals and structural factors, and this is sending a strong signal to world markets that the momentum is here to stay.
The BJP government’s clearly focused policies for the oil sector, strong and sustained GDP growth, a huge push towards making India a manufacturing hub and rising disposable incomes are all playing crucial roles in helping accelerate India’s oil consumption into top gear.
The International Energy Agency in its July report said that India’s thirst for oil will be a key factor driving global oil demand growth this year and next year. It expects India’s oil demand to rise by 280,000 b/d in 2017, closely followedby China.
Buoyant Indian demand growth and strong government policy initiatives have
raised the interest level of international companies to make inroads into India’s retail oil sector. Highlighting that, India’s Petroleum Minister Dharmendra Pradhan in June said that companies such as Saudi Aramco and Total have expressed interest in setting up retail fuel stations in India.
India’s oil products demand grew 8.5% in 2015 from 2014 levels to 177 million mt, or 3.81 million b/d, as gasoline, LPG and naphtha saw double-digit growth in consumption. And in the fi rst half of 2016, India’s overall oil products demand surged 11.1% to 97.62 million mt, or 4.2 million b/d. The IEA expects total Indian oil products demand to average 4.3 million b/d in 2016.
With the country dependent on imported crudes, LNG and LPG for meeting a large chunk of demand, the petroleum ministry, led by Pradhan, is taking steps to strengthen relationships with key suppliers. Pradhan has visited countries such as Iran, Qatar and Russia to boost energy ties with them.
The ‘make in India’ dream
One of the brightest spots on which the world oil market is banking its hopes
Sambit Mohanty
Senior Editor,
Asia Oil News & Analysis,
S&P Global Platts

India Demand
Autumn 2016 Platts Insight 23
on India is the government’s ‘Make in India’ initiative – which aims to boost the share of the manufacturing sector in GDP from 15% to as high as 25%by 2022.
This is expected to give a huge liftto demand for industrial fuels. In addition, the push to build more highways and expand road infrastructure is expected to ignite demand for transport fuels.
“In this new era of slower Chinese growth, a new contender has emerged: India, which in 2015 was the main driver of non-OECD oil demand growth,” the Oxford Institute for Energy Studies said in research paper published earlierthis year.
“In addition to the boost from low oil prices, structural and policy-driven changes are underway which could result in India’s oil demand ‘taking off’ in a similar way to China’s during the late 1990s, when Chinese oil demand was at levels roughly equivalent to current Indian oil demand,” the institute added.
Galloping gasoline
Gasoline continues to gain ground since late 2014 when a removal of subsidies on diesel triggered a massive shift towards gasoline-driven vehicles in the passenger cars segment. With the transport sector accounting for almost 40% of India’s oil demand, gasoline sales in the domestic market rose nearly 15% in 2015 to 21.1 million mt.
And the momentum continues this year. Gasoline consumption in the fi rst half of 2016 grew nearly 13% to 11.63 million mt.
In the 2015-16 fi scal year to end-March,
India’s domestic automobile sales were 20.47 million units, a growth of nearly 4% from the previous year’s 19.72 million units, according to data from the Society of Indian Automobile Manufacturers.
And expectations are growing that as disposable incomes rise, the shift in ownership would take place in favor of passenger cars, from two-wheelers, leading to rising consumption of transport fuels, the Oxford Institute study said.
Diesel sales were up 5% to 72.7million mt in 2015, which is seen as substantial given the large base. And as the manufacturing push continued, diesel demand growth picked up in the fi rst half of 2016, rising 7.8% to 39.59million mt.
Market participants are of the view that despite gasoil losing out to gasoline in the passenger vehicle segment, strong demand from the industrial sector will more than offset the losses.
Clean fuels surge
As New Delhi steps up efforts to promote LPG as a cooking fuel across the country, demand continues to grow at a healthy pace, rising by close to 10% in the fi rst half of the year to 10.06 million mt.
“The government’s drive to increase total LPG dealerships by 60% should keep LPG demand growth above 8% year on year here on,” Credit Suisse said in a research note, adding that while LPG penetration was as high as 88% in urban India, it was only about 20% in rural India. A raft of government initiatives propelled LPG
consumption to a record high of 1.84 million mt in March, up more than 14% year on year, leading analysts to believe that growth is expected to hover close to double-digit levels as New Delhi intensifi es its push towards cleaner fuels.
In its drive towards making 2016 the “year of LPG consumers,” India’s BJP-led government has set an ambitious target to open 10,000 new LPG dealerships across the country this year, in addition to the 16,000 that already exist.
New Delhi also has ambitious plans to provide additional subsidies to create 50 million new connections among lower-income families, with another15 million being added this year.
With LPG domestic demand growing at a much faster rate than output, the country, where refi ners fi nd it more profi table to focus on middle distillates rather than boosting LPG output, will be increasingly dependent on imports to meet its incremental consumption growth.
Petchems powers ahead
Domestic demand for naphtha witnessed the sharpest growth among all oil products in 2015, and is set to increase further in the coming years as India pushes forward to become a manufacturing hub.
Naphtha consumption, which accounts for about 7% of the country’s overall oil products demand, surged more than 18% in 2015 to 12.96 million mt, surpassing the growth rate of 15% seen for gasoline in 2015. In the fi rst half of 2016, naphtha demand rose 11% to 6.94 million mt.

24 Platts Insight Autumn 2016
Consumption of naphtha has been rising because of increased appetitefor its use as a gasoline-blendingstock, surging demand from the petrochemicals sector and pockets of demand from the fertilizer sector.
In addition, changing lifestyles promoting hygiene and packaging alongside infrastructure growth promoting smart city programs could take petrochemicals growth abovethe current GDP growth rate. This will support naphtha consumption in abig way.
But despite this, India is expected to remain a net naphtha exporter over the next four to fi ve years as expansion plans in the pipeline can only absorb a part of the surplus the country is currently producing.
“While the bulk of the growth in Indian oil demand so far has been in the transportation and power sectors,an important aspect for oil products demand going forward could be the potential change to industrial fuel demand,” the Oxford Institutestudy said.
When other key Asian consumers, like China, are witnessing a slowdown, India’s galloping growth certainly offers a ray of hope.
And there is every reason to remain optimistic about the Indian growth story which is just starting to take off – but it is ultimately dependent on the continuation of the strong government policy initiatives that have been launched, for a happy ending.
India Demand

©shutterstock/monotoomono

Shipping
26 Platts Insight Autumn 2016
Global tanker market set for stormy watersBoom times led to a ship-shopping spree – but excess tonnage may outstrip demand
The global tanker market had a sort of dream run in 2015 with freight rates offering handsome returns to ship owners. Come
2016, the tanker market is on the cusp of a marked change in fortune.
When the market is good, ship owners tend to get overambitious and excitable and end up placing orders for new ships. This in turn skews the supply dynamics and causes massive tonnage overhang in the market.
The market is expecting a storm toward the end of the year. The modest increase in global demand to move oil – or provide fl oating storage – will not be able to soak up the tonnage.
“It is likely to be a bit of a bumpy ride for the rest of the year and early 2017 as the order book for both crude and product tankers gets delivered,” said Erik Nikolai Stavseth, a Norway-based shipping analyst with Arctic Securities.
The order book deliveries are not evenly spaced out over several years and this implies that there will be a surge in deliveries in the near-term that willadd to the downward pressure onfreight rates.
More than half of the crude tanker order book is due for delivery over the next 12 months and will likely outstrip demand for a period of time, Stavseth said.
It is not surprising to see why shipping companies took the plunge and went on a ship-shopping spree. Daily earnings on the key Persian Gulf-to-Japan route for VLCCs briefl y reached above $100,000 late last year. As the earnings were moving northwards over the last two years, orders for construction and purchase of new ships poured in but deliveries always come with a lag. Now as ships are fi nally being delivered, VLCC earnings for the same route have plunged, estimated at around $17,000/day and analysts say they are yet to bottom out.
The growth in demand to move oil and oil products has not kept pace with the incremental new buildings. Expansion in crude supply from OPEC members is expected to slow down from 0.8-0.9 million b/d this year to 0.4-0.5 million b/d next year.
Crude export sales in Latin America and West Africa are in decline; in recent years, the tankers market benefi ted from longer voyages from the Caribbean and West Africa to North Asia.
Sameer Mohindru
Senior Editor,
Asia Shipping,
S&P Global Platts

Shipping
Autumn 2016 Platts Insight 27
Longer voyages keep ships occupied for an extended duration, thereby tightening the tonnage supply. Not any more. Analysts point toward cash-crunched Venezuela where drilling activity is at historical lows. Idle ships from Latin America are ballasting to West Africa in search of cargoes.
“This is creating a ripple effect of oversupply over the broader seaborne trade,” Morgan Stanley said in a report in July.
While the existing fl eet is struggling to fi nd business, the new ship buildings have been ordered.
An additional 1 million b/d of crude trade typically translates into incremental demand for 30-35 VLCCs, which can load cargoes of up to 2 million mt each. However, the supply is expected to increase by at least 45 VLCCs this year and another 35 VLCCs in 2017. The corresponding increase in supply over the last three years was around 13-15 VLCCs annually, according to industry estimates.
If most of the order book gets delivered, and the world continues to have near-zero demolition, the crude tanker fl eet could expand by as much as 8% in deadweight ton terms this year, these estimates show.
Interestingly, the order book is being fi nanced by export credits or by companies who have access to the capital market and so the normalbanking market, which bore the brunt of the ongoing global recession, has only been a marginal contributor to this boom in new buildings, said Dagfi nn Lunde, Chairman of Executive Ship Management, or ESM, and a Netherlands-basedshipping consultant.
“Unfortunately, ship owners have a talent for shooting themselves in the foot,” said Ralph Leszczynski, research director at Bancosta, an Italian shipping brokerage and consultancy.
The second half of this year andlikely most of 2017 will probablybe disappointing for VLCC owners,who will need to weather a storm, Leszczynski said.
In 2014 and 2015, trade fl ows for crude increased because importers rushed to
take advantage of lower prices. However, now with storage tanks full in many locations, importers have cut down on buying, in line with their refi ning requirements. And while crude prices are drastically lower than the $100-plus/b that seemed the norm even two years ago, they’ve recovered signifi cantly from the mid-$20s lows seen in January, eroding the incentive to buy more volumes.
“The tanker party seems to be over for now as global stock building of oil is
DIRTY TANKER FLEET SIZE
Sources: Arctic Securities
0
100
200
300
400
500
2018e2017e2016e2015201420132012
(million deadweight)
VLCC
Suezmax
Aframax
Other
DIRTY TANKER FLEET NEW DELIVERIES
Sources: Arctic Securities*For 2016 the vessel count is for already delivered and scheduled deliveries whereas 2017 and 2018 are projections
0
30
60
90
120
150
180
2018e2017e2016e2015201420132012201120102009
(number of vessels)
Aframax
Suezmax
VLCC

28 Platts Insight Autumn 2016
tapering off,” said Jarle Hammer, a Norway-based veteran shipping researcher and consultant. The total global commercial stocks of oil and oil products are close to 6 billion barrels which is equivalent to more than two months of demand, he said. In addition, there are also strategic reserves in various countries as well as crude and refi ned products in sea transit that account for volumes equivalent to a month of demand, said Hammer, who is also a lecturer in maritime economics.
Chartering ships to store crude was another avenue of demand in recent years, which has tapered off signifi cantly.
“Trading activity declined as contango in crude prices has disappeared,”Fotis Giannakoulis, a New York-based shipping analyst with MorganStanley said.
When crude prices are in contango, traders make purchases from the physical market and use ships to store it for sales in subsequent months. During backwardation, traders buy futures contracts from derivatives market and there is no incremental demand for ships. Instead, the market draws down on inventories. Hammer said currently less than two days’ worth of global demand for oil and oil products is on fl oating storage.
“It is illogical to expect the volumes of trade that we saw last year to continue forever,” said Leszczynski.
Problem of plentyfor product tankersThe supply pressure that we see in crude tankers is manifesting itself in product tankers as well, where the fl eet grew by 7% last year and is projected to
grow by another 8% in 2016. Deliveries and fl eet growth have already begun to spike in 2015 with close to 10 million dwt of deliveries compared with just 7 million dwt in 2014 and 6 million dwt in 2013. Another 14 million dwt of deliveries are either done or scheduled to take place during the rest of this year, according to industry estimates.
“There is a strong link between the two markets. It is rare to have a crude tankers’ market on fi re when product tankers’ rates are low and vice versa,” Arctic Securities’ Stavseth said.
Daily earnings from a Long Range I product tanker that typically carries around 55,000 mt cargoes on theMiddle East to East Asia routes are currently around $12,000/day, down 70% year-on-year.
In the last two years, refi neries in China, the Middle East and India pushed up their capacity utilization to take advantage of lower crude prices.
Europe’s naphtha exports to Northand Southeast Asia are expected to decline by close to 50% this year
CLEAN TANKER FLEET NEW DELIVERIES*
Sources: Arctic Securities*For 2016 the vessel count is for already delivered and scheduled deliveries whereas 2017 and 2018 are projections
0
40
80
120
160
2018e2017e2016e2015201420132012201120102009
(number of vessels) LR 2 LR 1 MR Handy
EXISTING FLEET AND ORDERBOOK
Sources: Arctic Securities
0
300
600
900
1200
1500
1800
HandyMRLR 1LR 2AframaxSuezmaxVLCC
(number of vessels) Existing fleet Orderbook
Shipping

Autumn 2016 Platts Insight 29
due to poor demand and lack of price competitiveness, according to market estimates. China is struggling to sell off its surplus gasoil and gasoline and even trying to send shipments to the Americas. Europe is fl ush with gasoil, hitting cargo movement prospects from the Middle East refi neries. The US is likely to move more cargoes of cheaper LPG, which is an alternative feedstock for petrochemical plants, via a widened Panama Canal and thus hitting demand for products tankers which move naphtha.
“High products inventories and low refi nery runs have kept chartering activity at low levels intensifying the seasonal weakness in rates,” the Morgan Stanley report said.
An interesting aside to these developments is that should the downside in the market continue as is expected, “Some companies will be squeezed to sell off their ships giving a fi llip to the second-hand tankers sales market though it may not happen quickly,” said Dagmar’s Lunde.
Sunny days again forthe tanker market?
And yet… further out, the outlook for the tankers market gives some grounds for optimism. For once, the order book for deliveries is not large in the near term and when they are complete, rates are expected to bottom out.
“Contracting activity for more ships is now fairly modest,” said Hammer. Echoing the same sentiment, Bancosta’s Leszczynski said, “It is expected to be smoother sailing again for owners from 2018 onwards as fortunately we are seeing very few new newbuilding orders now and there are quite a number of older units which are approaching an age where they will fi nd very diffi cult to get approvals for trade.”
From the costs side, sharply lower bunker prices have provided a tremendous cushion and ensured that the fall in freight rates does not dent owners’ earnings as much as was the case two years ago. This also explains relatively higher returns for ship owners
currently compared with earlier years, when bunker prices were expensive.The 380 CST grade bunker price on a delivered basis in Singapore was at $209.50/mt as of August 3 compared with $270/mt a year earlier and $606/mt two years ago, according to S&P Global Platts data.
Analysts are also optimisticabout the prospects of a revivalin product tankers.
The large volumes of crude in storage near refi ning facilities will need to be processed sooner or later. The general trend is of refi ning capacity to be built in the Middle East, India and China, away from many other end-users of middle distillate products such as Australia, West Africa and Latin America, where refi ning capacities are scarce, uncompetitive and closing down. This will add to demand for longer voyages and thereby help absorb part of the expanded fl eet, arguably justifying some of the shopping spree that owners have been indulging in.
©shutterstock/Oleksandr Kalinichenko
Shipping

Product Focus
Aviation spending analysisAirlines look to streamline competitive fuel spending and risks in a low-cost environment
In a relatively low-price fuel environment, many in the aviation industry are looking to capture the best buying opportunities and manage risk competitively. Followinga substantial period of hedging losses, airlines are now carefully looking ahead to consider the most effi cientoptions for buying and hedging in order to best weatherfuture volatility.
The gains made by airlines that were not heavily hedgedhave now largely been realized. The challenge airlines are currently facing is to plan ahead, managing risk and costs now the majority of airlines are exposed to the benefi ts of cheaper jet fuel.
In turn, airlines will need to watch as Asian oil markets continue to evolve and adapt to the rebalancing of crude
and refi ned product markets. Chinese refi ners in particular are changing dynamics as more and more barrels of jet fuel are being exported alongside Chinese airlines expandinginto international markets.
In light of this changing landscape, Platts has beenworking collaboratively with the aviation industry tobetter understand its needs and deliver a solution that provides essential market intelligence by combining its benchmark assessments, market and fundamentalinsights, and analytics.
Through the collaboration of more than 30 airlines, air freight and jet fuel distributors, the Platts Jet Fuel Dashboard curates the most important data and information, providing a tool to quickly understand the essential intelligence Platts offers. The result is a tool which allows customers to:
• Quickly identify historical trends • Watch the market evolve throughout the day • Anticipate buying/selling opportunities in the future
Aviation clients currently beta-testing the Jet Fuel Dashboard appreciate the ability to quickly review trendsand developments in the market to identify purchasing opportunities, evaluate contract pricing and manage risk.
Transforming the way the industry engages with Platts data, information and analysis, Platts is working to integrate the insights it provides to help clients identify opportunities, whether that is by monitoring and projecting shifts in global trade fl ows (cFlow), anticipating crude oil product economics (Platts Well Economics Analyzer) or analyzing patters in jet fuel markets (Platts Jet Fuel Dashboard).
30 Platts Insight Autumn 2016

Looking fora clear picture of China’s oil supply and demand?Platts China Oil Analytics covers all the analysis, news, and data relating to China’s oil balance. Its in-depth reports and insights, delivered by our team of analysts, gives you a winning edge and the short and medium-term forecasts can help you develop robust strategies. And all that comes in a single online intuitive analytical tool.
An exclusive interactive refi nery map enables you to look at a macro view, or focus on agranular perspective – capturing everything from import and export volumes to refi nerycapacities and turnaround. You can quickly drill down to the information that’s relevantto you and access our extensive historical database. Packed with supply and demand data from well-respected regional and national named sources, you can download and integrate it into your models to compare our data with yours.
Get a truly informed picture of the factors affecting China’s Oil balance.
For more information visit www.platts.com/products/china-oil-analytics
Platts China Oil Analytics
www.platts.com
ANALYTICSANALYTICS

©shutterstock/Sergii Tverdokhlibov

US Crude Exports
Autumn 2016 Platts Insight 33
US crude migration
in a holding patternThe US export ban has been lifted – but who actually wants the oil and what will they pay?
Think of the fi rst months of the lifting of the US ban on exporting crude oil as resembling online dating, but
with a bit more money at stake.
When the US Congress, seemingly outof the blue, approved the export of US crude oil in late 2015, it caught the industry by surprise. Companies and industry groups for years had been pushing for lifting the ban, imposed in 1975 in the wake of the fi rst oil crisis. But calling the pace of change in the US Congress “glacial” would be an insult to the speed of glaciers – yet suddenly, there it was: the end of the export ban,a compromise between the Obama administration and the Republican-controlled Congress as part of a broader deal on taxes and spending. As the Wall Street Journal noted, the end to the ban would have been considered “unthinkable” just a few months earlier.
And then the question faced oil producers: who is going to buythis oil and at what price?
The raw numbers so far don’t tell much of a story. Monthly fi gures, released by the Energy Information Administration
two months after the fact, showed US crude exports in April were 591,000 b/d and then 662,000 b/d in May. The latter fi gure is the highest ever, and it wasn’t just a stampede of oil headed to Canada, where as long as they met certain conditions, exports had never been banned. The May total of 308,000 b/d to Canada was a little on the low side compared with recent trends.
But the May report did show the evidence of deals rumored in themarket months ago, to Curacao (2 million barrels), the Dutch refi ning centers (3.4 million barrels) and a number of other European countries, such as 1.1 million barrels to the UK. China took a half million barrels in May. Reportedly, the grade was Poseidon, an offshore Louisiana Gulf Coast crude.
That is a small slice of data. In the actual market, S&P Global Platts market reporters are fi nding a fair number of deals but nothing thatcould yet be called a pattern. It’sonline dating again: testing out a number of possible opportunitiesbut fear of making a commitment.
Some of the deals that have been done
John Kingston
Director,
S&P Global

34 Platts Insight Autumn 2016
show the creativity of global oil traders. For example, while most of the trades have been done on a FOB Gulf Coast basis, the trading fi rm of Gunvor bought a cargo to be delivered into the Caribbean side of the pipeline that runs across the Panama Canal, in essence giving it maximum fl exibility to put it through to the other side of the canal or ship it somewhere on the eastern side of that route.
Other sales have run the gamut. A quantity of DSW – domestic sweet, the blend that comes out of the delivery point of Cushing, Oklahoma – was bid into a PetroPeru tender. (It didn’t win, but PetroPeru gave it a long look). Trade sources were reporting months ago that Latin American countries were taking cargoes, and the evidence of that started showing up in the May data: Colombia for a half-million barrels, and Peru for 330,000 barrels.
One ironic trade: Alaskan North Slope crude reportedly has been sold to Japan. In the ’90s, BP spent plenty of time and money lobbying for a change in the regulations to allow the export of ANS to Asia. The idea was that crude
moving on a foreign-fl agged vessel to Asia made more economic sense than putting it on a more expensive Jones Act ship to California (and into the early ’90s, the US Gulf Coast). When that permission was fi nally granted, sales of ANS, mostly to Taiwan, had their online dating period…and promptly fl opped. (Data shows a brief spike of US crude exports to Asia for a few months in the fi rst half of 1999). Why it would work now when it didn’t then is unclear, but there simply isn’t the ANS production anymore (1.1 million b/d then vs. less than 500,000 b/d now) to make this a signifi cant stream, even if the economics work.
Will those economics work for other US crude grades? In a report being prepared for Platts Analytics, Al Troner, long-time industry observer and President of Asia Pacifi c Energy Consulting, notes several other key factors that he says contributes to forecasting “modest expectations” of US crude exports. The tight spread between Brent and WTI – which opened up 2014 at more than $12 and was about $3 at the end of the year, and has been consistently less than $2 for most
of 2016 – discourages exports. Buying crude at a WTI-related price and selling into a Brent-linked market would have been easy when that spread reached $27, as it did by autumn 2011. But with crude-by-rail and numerous pipeline projects having fl attened that spread, the slam dunk arbitrage of a few years ago – albeit one that couldn’t legally be traded – is long gone. Traders will need to pick their opportunities when they fi nd them, and they might not necessarily be obvious.
And what of condensates, the fi rst break in the wall against the long-time ban on US crude oil exports? A Commerce Department decision in June 2014 to allow the export of processed condensate – a fi nding which concluded that processed condensate was essentially a refi ned product, not crude – helped lead to a signifi cant jump in condensate exports from the port of Corpus Christi, not far from the condensate-rich fi elds of the Eagle Ford shale. Full-year data shows the Corpus Christi port exported 2.6 million mt of condensate for all of 2014, but at the halfway point this year was on track only to export 2.3 million mt. Still, that would be more than the 2.1 million tons exported last year.
Still, too much focus on the ending of the US crude ban tends to obscure the fact that the shale revolution that led to the opening of US crude exports continues to provide an enormous level of exports of other products. Crude may be getting all the attention, but the biggest exports are being racked up in other products, which were never banned.
LPG exports are at the top of that list. US LPG exports rose to a record 1.139 million b/d in May, the third month this year that they had topped the 1 million
US CRUDE OIL EXPORTS
Sources: EIA
2013 2014 2015 20160
100
200
300
400
500
600
700(’000 b/d)
US Crude Exports

Autumn 2016 Platts Insight 35
b/d mark. China, Japan and Latin America were the largest destinations. Three years ago – to take a snapshot comparison – US LPG exports in April 2013 stood at 310,000 b/d. Ten years ago, they were fewer than 100,000 b/d.
LPG exports took another signifi cant step forward in early August whenthe fi rst ethane cargo was scheduledto be shipped out of the Gulf Coast.The US is long on ethane – one of the only countries in the world with that distinction – which has led to a
signifi cant decline in its price relativeto other feedstocks used to make propylene, such as naphtha. The US surplus in ethane effectively became stranded, because exporting it traditionally has been seen as problematic; it needs to be chilled, not to the temperatures needed for LNG but still in a process that adds costs. (The surplus would get consumed by leaving it in the natural gas stream, known as ethane rejection, so it was burned for its BTUs rather than cracked for its feedstock value). But Sunoco Logistic’s
Marcus Hook facility near Philadelphia exported its fi rst ethane in March, and Enterprise Product Partners, at its new facility in Morgan Point, Texas, is joining Sunoco Logistics with its 200,000 b/d ethane export terminal on the Gulf Coast.
US refi ned products exports have continued to soar, not slowed at all by reduced US crude production. Flip through an Energy Information Administration table of refi nery operating rates, and you’ll fi nd that for the last few years, refi nery utilization month-by-month has for the most part been steadily at a higher level than in the corresponding month a year earlier. And some of that push has been needed to supply growing US gasoline demand, which – depending on what data stream you look at – appears to be running anywhere from 2% to 3% more than a year earlier.
EIA data shows US gasoline exports have been solidly above 500,000 b/d since the end of last year, with a record surge to 722,000 b/d in February. Distillate exports are consistently running at more than 1.2 million b/d, a level that is down slightly from the record-breaking levels of late 2013, but is still among the highest months ever recorded. Overall, fi nished petroleum product exports from the US in the fi rst months of this year continued to hover just under the 3 million b/d level, not far from the record months, reached a few times, where product exports crossed the 3.1 million b/d mark. Exports in May once again broke through the 3 million b/d mark.
When the elimination of the crude oil ban was agreed upon at the end of 2015, it was only the fi rst of two steps that occurred in rapid succession that drove home to world energy markets the
US LPG EXPORTS
Sources: EIA
2013 2014 2015 20160
200
400
600
800
1000
1200(’000 b/d)
US TOTAL PETROLEUM NET IMPORTS
Sources: EIA
2004 2006 2008 2010 2012 2014 20160
2
4
6
8
10
12
14(million b/d)
US Crude Exports

36 Platts Insight Autumn 2016
changing role of the US in hydrocarbon trade. That’s because at the end of February, the US – or more specifi cally, Cheniere Energy – shipped out the fi rst cargo of LNG from the Gulf of Mexico. (It wasn’t the fi rst LNG export from the US; LNG has been shipped out of ConocoPhillips’ Kenai Peninsula in Alaska for many years and resumed in 2015 after a yearlong shutdown).
But there was one other cargo after that list was compiled, signifi cant because of where it was going – somewhere in Asia, destination unclear at press time – and how it got there. When the Shell-controlled Maran Gas Apollonia left the Gulf Coast on July 19, it headed to Asia through the expanded Panama Canal, the fi rst LNG carrier to make the passage through there. LNG tankers were too large to fi t through the canal before its expansion.
The exports that have fl owed out of the US so far have come solely from Cheniere’s terminal, though approval has been granted to other terminals.
But in late July, the tough market conditions that any potential exporters face claimed a victim when Shell said it would hold off on a fi nal investment decision for its approved LNG export facility in Lake Charles, Louisiana. It was the second time that Shell took such a decision that month; just a few weeks earlier, Shell put on hold a decision on its Canadian West Coast LNG project in Kitimat, BC.
Just like the narrowing of the Brent/WTI spread, the tighter gap between North American natural gas prices and the global price of LNG looms as a factor in many of these decisions. As noted, WTI exports looked like they’d be tremendously profi table when Brent/WTI was at $27 – even if nobody thought that spread was going to stay there, where it was going to settle as a new norm could still have been a spur to profi table exports. Similarly, the gap between Henry Hub and the Platts Asian-based JKM marker, at the start of 2014, was about $14-$15/Mcf. By this spring, it was less than $2.50 (though it
has risen recently). The easy profi ts of a $14 spread mostly disappear with that kind of movement. The list of approved export projects is almost certainly longer than the list of those that will actually operate.
So even before the exports fl owed, the markets narrowed. They sometimes do unplanned things like this. But even if US crude and LNG exports never become the torrent that some foresaw, the fact that they now can make an exit will work to make US markets far more aligned with those around the world than if old restrictions had remained in place. That’s an impact that may not be visible in any export data, but is present in the market nonetheless.
©shutterstock/Jim Parkin
John Kingston comments on the late Al Troner, a contributor to this article, who passed away on August 2 this year:After being asked by Platts to write this
piece on the status of US crude exports
in the wake of the policy changes of late
2015, I learned that Platts Analytics had
hired Al Troner to perform a broader
study on the same subject. My reaction
was one of horror; how could I possibly
do something on the same subject that
lived up to the standards that Al would
certainly establish in his own work?
Rather than fi ght it, I just decided to call
Al and see what perspectives he could
offer me. As always, he was gracious
and helpful. There are only a few direct
references to Al’s work in the piece, but
his assistance was far greater than the
word count indicates. When he sent me
the rough draft of the work he had done
for Platts, he asked me to contact him if
anything was “unclear.” I joked with him
that the whole universe was unclear.
To which he responded, “I would think
confused in action, but not unclear in
scope. God does not play dice with the
universe, as old Albert said,” referring
to Einstein’s famous dictum. Maybe he
doesn’t, but it’s sad to all of us that God
took Al away when he did, and I dedicate
this piece to him.
US Crude Exports

Platts eWindow Market DataHow increased structure drives greater dynamism
In the trading day, the period of time just before Platts Market On Close is often whenyou look to be at your most dynamic. To maximize your lateral thinking and effectivenessyou need free-fl owing information that you can interpret instantly.
Platts eWindow Market Data via Excel Add-In or API is the most effi cient way to populateyour systems and models with all the data from Platts eWindow. Its structured formatenables you to immediately take your trade analysis in any direction you desire, movingseamlessly from performing historical trade analysis to seeing developments as theyhappen in near real time.
With greater depth of transparent, real-time information presented in an ideal format for data clarity, you can act even more decisively.
For more information visit www.platts.com/ewindowmarketdata
www.platts.com
ANALYTICSANALYTICS

38 Platts Insight Autumn 2016
Petrochemicals
Can Asia’s petchems players keep an edge?Low oil and naphtha costs meant beautiful margins but competitiveness may be eroded
Will the Asian petrochemical industry continue to enjoy robust margins in 2017and beyond? This is a
question that producers are grappling with as they draw up their strategiesfor survival for the coming yearswhen headwinds such as a sluggish global economy, increasing feedstock costs and oversupply threaten toerode profi tability.
The strategies include innovation, value-addition, and diversifi cation of feedstocks and markets.
Thanks to low oil and naphtha input costs, petrochemical producers in Asia, who are mostly naphtha-based, have found their competitiveness improving beyond their wildest dreams. To take just one example, prior to the plunge in oil prices in June 2014, Middle East cracker operators, whose plants use low-cost ethane feedstock, were fi ve times as competitive as their counterparts in Asia. At the end of July 2016, thanks to the 60% lower oil and naphtha costs, the Middle East was only 1.5 times as competitive as Asia.
Polymer players in Asia have had it best. Margins for polyethylene over naphtha were close to $300/mt at the end of July
this year, while those for polypropylene were at $190/mt. This is terrifi c news for a segment which has in the past even seen negative margins.
Equally heartening for the industryis the sustained good margins that aromatics producers are enjoying.The spread of paraxylene over naphtha at the end of July 2016, was around $450/mt, way above the $250/mt breakeven level.
Rising oil and naphtha prices will mean higher feedstock costs
But these good times may be short-lived as feedstock costs creep up. According to the short-term energy outlook released by the US Energy Information Administration in July, Brent prices are expected to average $52/b in 2017, above the $44/b average estimated for 2016.
“This could well reverse the advantage Asian producers are enjoying over the US-based producers who use ethane feedstock,” one Southeast Asian producer said in late July. Currently naphtha is priced lower than ethane, but there is considerable anxiety over
Prema Viswanathan
Associate Editorial Director,
Petrochemicals,
S&P Global Platts

Autumn 2016 Platts Insight 39
the anticipated fl ood of polymer imports from the US once the shale gas-based steam cracker projects in North America get off the ground from 2017 onwards.
Eight ethane crackers are expectedto go on stream in North America by 2020, according to Platts Petrochemical Analytics. Much of the polyethylene produced is expected to be exported, and there is a possibility that a signifi cant portion could reach Asian shores. A recent announcement by Sabic and ExxonMobil that they are evaluating a joint venture petrochemical project on the US Gulf Coast, has added to the anxiety among Asian producers.
In 2016 alone, around 7 million mt/year of polyethylene is estimated to be added in Asia and the Middle East, and more than 3 million mt/year of polypropylene in Asia alone, according to Platts data.
Slowing Chinesedemand growth,growing self-suffi ciency
With so much additional supply in the works, Asian producers are concerned about the impact of the sluggish demand growth in China, the world’s largest petrochemicals consumer and importer. The dip in GDP growth, which is expected to cool to 6.5% for the full year 2016, is already exerting its infl uence on polymer growth, which has slowed to single digit from the double digit pace seen a few years ago.
Another cause for concern for Asian exporters is China’s march towards self-suffi ciency. Will it put a brake on petrochemical majors’ engagementwith the country? Despite its concern over sustainability, the Chinese government is likely to push ahead with its coal-based polymer projects in order to ensure feedstock security and competitiveness, as China has one of the largest reserves
of low-cost coal in the world.
According to estimates by Platts Analytics, the proportion of ethylene produced from coal will go up to 18.83% in 2024 from a mere 2.87% in 2014, while ethylene production from naphtha will go down from 76.52% to 59.95% in the same period.
The concern over this trend is that coal-based plants consume more than seven times the water resources as naphtha-based plants, say market players. There is also the additional factor of carbon dioxide emissions from coal-based plants, which far outweigh those from the conventional naphtha crackers.
Could India be the next big polymer guzzler?
Faced with the prospect of oversupply and shrinking Chinese demand for
©shutterstock/marinart1
Petrochemicals

40 Platts Insight Autumn 2016
Petrochemicals
petrochemicals, Asian producers are now looking to target new markets such as India, Africa and Latin America.
Although India’s per capita consumption of polymers is only one-fi fth that of China, India’s demand is growing at close to double-digit pace, compared with China’s single digit growth.
Take the case of polyethylene. India accounts for only 12% of Asia’s polyethylene consumption, whereas China accounts for 55%. However, China’s year-on-year demand growth was only 5.9% in 2015, while India’s was 8%.
What is more worrying to exporters is that PE imports into China have fallen 3% year on year in the fi rst quarter of 2016 to 2.4 million mt. PP imports are down 23% in the same period to 1 million mt, according to China Customs.
Value addition key to maintaining market shareOne of the key strategies being pursued by petrochemical producers to maintain their margins is value addition. China’s imports of polyethylene and polypropylene have been steadily falling, thanks to the increase in local coal-based production, which has been focusing on commodity grades.
The Chinese government’s policy of focusing on value-added grades for imports has prompted polymer exporters to China to turn their attention to high-end grades such as metallocene linear low PE and copolymer PP.
“Metallocene is probably one of the best [in demand] growth in the PE portfolio; that’s why we are supporting our customers by investing in our Nexlene technology in [South] Korea and
introducing it to our customers in China,” Sabic’s Executive Vice President of Polymers Abdulrahman Al-Fageeh told Platts on the sidelines of the Chinaplas exhibition in Shanghai in late April.
A similar trend can be witnessed in PP, where producers are diversifying increasingly into higher-end grades. For instance, IRPC of Thailand is looking into producing high rubber PP for the automotive sector using Japan’s JPP technology at its plant in Rayong.
The unit is expected to be up and running by end-2017.
It’s a win-win situation for both — producers looking to lock in their margins in a volatile market, and customers aspiring to improve their lifestyle options.
While China’s imports of homopolymer PP, a commodity grade of PP, fell by 6.5% year-on-year in 2015, imports of the value-added copolymer grade PP, rose by 8.5% in the same period.
Like China, India’s demand for higher-end polymers is also on the increase. Polypropylene copolymer imports into
India surged 27% in Q1 this year compared with same quarter last year to about 40,000 mt, according to the Indian Ministry of Commerce, helped by strong demand from the country’s thriving automotive sector, industry sources said. Passenger vehicle demand is up in India, buoyed by strong sales growth, with FY2015 sales clocking in at 3.4 million units, a 6% growth on the year, according to the Society of Indian Automobile Manufacturers. Industry sources expect auto sales to continue for the next two years at the rate of about 8% a year.
With increasing emphasis being placed on “lightweighting” in the Indian automotive industry, demand for polymers is bound to surge, say industry observers. “In Europe, the weight of automotive plastics is 20% of the dead weight of a car, and a car made in Germany consumes nearly 300 kg, which is equal to 22% of the total weight,” an Indian industry source said recently. And it won’t be long before India also catches up with this global trend, he adds.
All of which is good news for the Asian petrochemical industry.
ETHYLENE PRODUCTION COSTS
Source: Platts Analytics
0
400
800
1200
1600
Jul-16Feb-16Sep-15Apr-15Nov-14Jun-14
($/mt)
US ethane
Saudi ethane
CTO
NE Asia naphtha
New ethane China
Asia ethylene

PETROCHEMICAL COMMODITY PRICESStay ahead of today’s unpredictable markets with regional and global
solvent markets.
decisions based on Platts coverage of the key petrochemical markets. You can access the latest price assessments, news and market commentaries, whenever and wherever you need them.
Platts provides you with:
• Daily spot prices - Negotiate
counterparties with access to an independent and impartial set of reference prices.
• - Get a sense of where the market is trading on a particular day so that you can benchmark your own data against that of Platts.
• - Gain an
the knowledge of how we arrived at a particular price before you approach your counterparty or enter it into your own models.
• - Get a rounded picture of market activity to support your investment decisions.
• – Keep up to date wherever you are, with access to prices on your desktop, tablet or smartphone.
5 REASONS TO CHOOSE PLATTS
1. We’re , with no vested interest in the market.
2. We have an price
the true market value.
3. We operate across the energy value chain,
into our downstream prices.
4. We go beyond the required reporting standards to be .
5. We’re connected to every market .
www.platts.com
For more information on Platts price assessments and market insight, visit: www.platts.com/petrochemicals

Gasoline
42 Platts Insight Autumn 2016
Gasoline’s fortunes face sharp reversalWeak fundamentals and excessive supplies have tarnished last year’s ‘King of the Barrel’
A little over a year ago, the Asian gasoline market was dubbed as the triumphant “King of the Barrel,” giving Asian refi ners
much hope that their fortunes had changed, after a dismal year in 2014.
For much of this year, however, heavy fl ows from North Asian refi ners, coupled with heavier-than-usual arbitrage volumes from Europe andUS, resulted in a dramatic shift in gasoline prices.
“Fundamentals in the Asian gasoline market remain weak, with excessive supplies pouring out of China, South Korea and Japan as production growth in these countries outstrips modest gains in demand,” BMI Research said in a research report in July.
Customs data from these countries showed that combined gasoline exports over the fi rst fi ve months of 2016 increased 37.2% year on year, it added.
Meanwhile, regional demand balances in the fi rst half of 2016 were a far cry from what they were in 2015, with imports by the region’s largest gasoline importer Indonesia falling signifi cantly over the past year, as the country scrambles to reduce its trade defi cit by
lowering oil product imports.
Exporter India has also scaled back from its unusually heavy gasoline buying seen last year, on fewer refi nery shutdowns and an increase in refi ning capacity.
“Global gasoline markets are facing huge gluts ... Asian gasoline cracks have plummeted amid a persistent stock overhang in Singapore,” according to a July report by Energy Aspects.
“The prospect of run cuts seems to be enough to clear up the picture for some, but we do not expect reduced crude oil throughputs to restore balance to the market. What gasoline needs is sustained reductions in conversion unit utilization, which is far more diffi cult to achieve, and what we are getting instead is CDU run cuts.”
Surplus fl ows from around the globeturns up the heat
Singapore saw total gasoline imports rise by 14% year on year in H1 2016 to 8.7 million mt, from around 7.6 million mt in the year-ago period, Singapore customs data showed.
Jonathan Nonis
Senior Managing Editor,
S&P Global Platts

Autumn 2016 Platts Insight 43
Gasoline
Gasoline exports from Asia’s main oil trading hub Singapore, however, fell by 2.5% year on year to around 12.3 million mt over January-June, from 12.6 million mt over the same period last year.
The burgeoning imports into Singapore since earlier this year saw light distillate stocks soar to 15.54 million barrels for the week ended March 2, 2016, the highest since International Enterprise Singapore began collecting data in January 1999.
Weekly light distillate stocks in Singapore have averaged 14.43 million barrels in the fi rst six months of 2016, up from 12.74 million barrels over the same period last year. But the weekly inventory data is not representativeof all oil terminals in Singapore, and covers only 13 out of the total 17oil terminals.
Much of the fl ows from Europe and the US to Asia had been due to healthy refi ning margins in late 2015 to early this year, which encouraged refi ners to
ramp up light distillate production, and saw surplus being pushed into Asia, amid their belief that gasoline consumption in the region would hold up in the new year, trade sources said.
And from North Asia, volumes from China and Taiwan have surged by double-digit growth rates in the fi rst six months of the year. Singapore’s gasoline imports from China grew by 29% year on year to 2.56 million mt in H1 2016, up from 1.98 million mt, while volumes from Taiwan jumped 33% to 1.3 million mt over the same period.
South Korean gasoline imports to the city state by contrast have fallen by 9% in H1 2016 to around 835,000 mt, from 920,000 mt. One reason behind the decline is the favorable import tariff on gasoline that South Korea has with Vietnam. Under a Free Trade Agreement with South Korea, Vietnam cut the import tariff on gasoline to 10% effective December 20, 2015, from 20%, and the new rate is expected to remain in place until 2018.
The infl ux of gasoline over the lastsix months has seen the price spread between FOB Singapore 92 RON gasoline cargoes and front-monthICE Brent futures falling to recordlows in July, even as the Northern Hemisphere is at the peak of the summer driving season.
The benchmark gasoline outright value over front-month ICE Brent futures dropped to a record low of $1.66/b on July 8, 2016. This was the lowest the crack spread has been since October 30, 2013, when it stood at $1.45/b.
Crack spreads mark the price difference between oil products and crude which, often refl ects a refi nery’s basic margin,
RON 92�BRENT SPREAD VERSUS LIGHT DISTILLATE STOCKS IN SPORE
Source: Platts, IE Singapore
0
4
8
12
16
Jul-16Jan-16Jul-15Jan-15Jul-14Jan-14
(’000 mt) ($/b)
0
5
10
15
20IES Lt Distillates Singapore Stocks (left) 92 RON Gasoline–Brent Crack (right)
RON 92 TIME SPREADS VERSUS LIGHT DISTILLATE STOCKS IN SPORE
Source: Platts, IE Singapore
0
4
8
12
16
Jul-16Jan-16Jul-15Jan-15Jul-14Jan-14
(’000 mt) ($/b)
-2
0
2
4
6IES Lt Distillates Singapore Stocks (left) 92 RON Gasoline M1/M2 (right)

©shutterstock/Take Photo

Autumn 2016 Platts Insight 45
Gasoline
or profi tability. The gasoline crack spread had hit a high of $19.62/bon June 17, 2015.
The month-to-date average for Asian gasoline cracks stood at $3/b – by contrast, for the same period last year the gasoline crack averaged $15.69/b.
Indonesia, India scale back gasoline importsGasoline imports by Indonesia have fallen by 22% for January-May to around 936,000 mt on a monthly basis, data from Statistics Indonesia showed.
For the same period last year, Indonesia’s monthly gasoline imports have averaged 1.199 million mt.
The decline in imports since November 2015 is twofold. (See Indonesia feature on page 44). State-owned Pertaminahas expanded its gasoline production capacity with the start-up of a new 62,000 b/d residue fl uid catalytic cracker at its 348,000 b/d Cilacap refi nery and restarted the Trans-Pacifi c Petrochemical Indotama petrochemical complex at Tuban, which has a 100,000 b/d condensate splitter.
In addition, a consumption shift to higher octane gasoline in the country has pressured imports of the more frequently consumed 88 RON gasoline.
One key driver of the change was the narrower price spread between 88 RON and higher octanes grades like 90 RON and 92 RON gasoline, sources said. Pertamina offi cially launched its 90 RON gasoline grade under the brand Pertalite in July 2015, S&P Global Platts has reported
Over in India, the fi rst six months of this year saw gasoline imports total 344,000
mt, down from 497,000 mt in the fi rst half last year, data from the Petroleum Planning & Analysis Cell showed. (See India feature on page 22).
However, India’s total gasoline imports of 993,000 mt for 2015 were unusually high, more than triple the total import volume of 328,000 mt in 2014. The impact of India’s gasoline imports last year had a signifi cant impact on gasoline prices in the region, by soaking up already limited supply, traders said.
The country’s gasoline consumption, meanwhile, has risen to 11.63 million mt in H1 2016, averaging 1.94 million mt each month, versus a consumption of 10.33 million mt, or 1.72 million mt/month, in H1 2015.
The reduction in gasoline imports in 2016 follows a 15% production increase in gasoline to date. In the fi rst half of 2016, India produced a monthly average volume of 3.089 million mt gasoline, up from 2.671 million mt in H1 2015.
According to Platts early estimates done in March, India’s gasoline exports in 2016 could reach 16.50 million mt,up around 3.8%, or 610,000 mt, fromthe previous year, amid an increase in domestic production.
Gasoline production capacity in India is also set to grow this year following the commissioning of Indian Oil Corp.’s 2.9 million mt/year continuous catalytic reformer at its greenfi eld 15 million mt/year (300,000 b/d) Paradip refi nery, and completion of Bharat Petroleum Corp. Ltd.’s gasoline capacity expansion – but the new secondary units will raise its gasoline output yield at its Kochi refi nery by 6 million mt/year to 15.5 million mt/year in the fi rst half of 2016. Gasoline production capacity at BPCL’s Kochi refi nery is expected to reach 2.240
million mt/year following the expansion, up from 1.115 million mt/year.
Meanwhile, Indian gasoline imports in 2016 are estimated to fall by 34% on year to 650,000 mt based on a consumption growth of around 8% in 2016, according to Platts Oil Analytics.
“Asian gasoline demand grew by just 120,000 b/d year on year, less than a quarter of the demand growth of 540,000 b/d in May last year,” the report by Energy Aspects said.
Long-term gasolinestill looks positive Though the short-term outlook for the Asian gasoline market looks weak, the long-term view remains fairly bullish,as regional production in Asia remains below consumption levels.
According to the US Energy Information Agency, Asia’s net defi cit in gasoline production has persisted since 2003, and by 2012, the region was short of around 50,000 b/d.
Analysts have also continued to factor in gasoline growth consumption in both China and India over the next fi ve to 10 years.
“The Asian gasoline market is expected to register a defi cit in the fuel from 2018, on the back of strong demand growth from India and China,” BMI Research said.
“This will be supplemented by positive growth in many of the region’s emerging economies including Vietnam, Indonesia, the Philippines and Pakistan, where a mixture of demographic and macroeconomic factors will see consumption of gasoline increase at an average rate of 5.4%/year over the next fi ve years (2016-2020).”

46 Platts Insight Autumn 2016
Indonesia
Indonesian refining:a pipe dream no longerIndustry plans are finally taking off. Not everyone will necessarily welcome them…
Backed by top oil producers Saudi Arabia and Russia, development in Indonesia’s refi ning sector has fi nally
picked up pace. Which may not be good news for oil product exporters.
The region’s largest gasoline and gasoil importer has been notorious for planning a spate of refi ning projects with companies from across the world over the last two decades with no result. Indonesia last built a new refi nery in 1994.
But momentum has picked up since late 2015 when President Joko Widodo signed a decree declaring the upgrade and expansion of the refi ning industry a top national priority. The decree ensures refi ning projects enjoy benefi ts such as preferential tax rates and easy access to land.
The decree has given Indonesia’s state-owned energy company Pertamina the ammunition it needsto go all out and get partners forrefi ning projects.
Pertamina is now willing to take full responsibility on local issues such as land acquisitions, land preparation, and
environmental permits, Dwi Soetjipto, Pertamina’s president and CEO, told S&P Global Platts in an interview in May.
Projects
Pertamina in November 2014 launched a massive plan to upgrade and expand several of its existing refi neries and signed deals with China’s Sinopec, Japan’s JX Nippon Oil and Energy,and Saudi Aramco.
The plan had a rocky start with Sinopec and JX pulling out, but fi nally picked up speed in May this year when Pertamina and Aramco announced the award of the engineering and project management services contract for the upgrade of the Cilacap refi nery, Pertamina’s largest, to Amec Foster Wheeler Energy.
The Cilacap upgrade will maximize the refi nery’s gasoline and diesel yields as well as hike its total nameplate processing capacity to 370,000 b/dfrom 348,000 b/d. The project is targeted for completion in late 2022.
Aramco and Pertamina are also in talks for the upgrade and expansion of the 170,000 b/d Dumai refi nery and 125,000
Mriganka Jaipuriyar
Associate Editorial Director,
Asia & Middle East Oil News & Analysis,
S&P Global Platts

Indonesia
Autumn 2016 Platts Insight 47
b/d Balongan refi nery but details on these are still to be fi nalized.
Pertamina is meanwhile pursuing the revamp of the 260,000 b/d Balikpapan refi nery on its own after JX dropped out. The fi rst phase of the Balikpapan project involves expanding capacity by 100,000 b/d and will be completed by the end of 2019 and the second phase, which involves improving the quality of the fuel to Euro IV standard from Euro II, will be completed around 2022.
Pertamina has also joined hands with Russian state oil giant Rosneft to build a 300,000 b/d greenfi eld refi nery in Tuban, East Java. The refi nery is expected to be ready by end-2021.
The plant’s products slate will include 45% of gasoline, 30-35% diesel oil and 15-20% feedstock for petrochemicals, and the plan is to integrate the refi nery with the TPPI petrochemical plantin Tuban.
For Saudi Arabia and Russia, the refi nery deals with Indonesia give a boost to their market share at a time of intense competition. Aramco is expected to supply 260,000-270,000 b/d of crude to the refurbished Cilacap refi nery and Rosneft will supply 45% of the crude to the Tuban refi nery.
In addition to Tuban, Indonesia is planning another 300,000 b/d greenfi eld refi nery in Bontang, and is seeking partners for this project.
Possible exporter?
Based on current data on refi ning projects, Indonesia’s refi ning capacity will go up from 1.02 million b/d to 1.75 million b/d in the next 10 years. This excludes possible expansions at Dumai and Balongan. According to the Pertamina CEO, the company is targeting capacity of 2.3 million b/d by 2025, including refi neries in Indonesia and stakes in overseas plants.
Though the country has a refi ning capacity of over 1 million b/d, the fact that these plants are several years old makes it impossible for Pertamina to operate them at full hilt, leaving a big gap between supply and demand.
INDONESIA
Kalimantan
Sumatra
Java
Sulawesi
EXISTING AND PLANNED REFINERIES IN INDONESIA
Source: Pertamina, Platts
DUMAI170,000 b/d
PLAJU118,000 b/d
BONTANG
BALIKPAPAN260,000 b/d
BALONGAN125,000 b/d
CILACAP348,000 b/d
TUBAN
Planned refineries
Existing refineries

48 Platts Insight Autumn 2016
Indonesia
The refi neries operate at around 800,000 b/d, and Indonesia imports another 800,000 b/d of oil products to meet full demand.
Based on Pertamina’s projection of 3-4% annual growth in oil demand, the company expects the country to become self-suffi cient in refi ned products once all the projects are on stream, and it may even have surplus products available for export if oil-to-gas conversion proceeds in the transport sector. So where does that leave exporters?
Strategic move
Exporters of gasoline have already lost some of their market after Indonesia brought online in October last year a residue fl uid catalytic cracker at the Cilacap refi nery and restarted a 98,000 b/d condensate splitter at the TPPI petrochemical complex. And things are only likely to get tougher.
According to latest data from Statistics Indonesia, the country imported 4.68
million mt of gasoline over January-May 2016, down nearly 22% from 6 million mt in the same period last year. Gasoil exports rose 7.5% year on year to1.97 million mt. Gasoline and gasoil account for 70% of Indonesia’s totaloil product imports.
China exported 461,446 mt of gasoline to Indonesia in the fi rst half of 2016, down 20% from 576,754 mt. South Korea exported 8.73 million barrels of oil products to Indonesia in the fi rst half of 2016, down 46% from 16.22 million barrels in H1 2015.
Pertamina is certainly not worrying about excess refi ning capacity in the region. For Soetjipto, Indonesia’s refi ning capacity target is a strategic move.
His logic is straightforward. Indonesia is a big demand center and by having its own refi neries, Pertamina has control over products supply.
“When we import, that is controlled by others. We have no control over crude supply – why not have as much control as possible over products supply?”
©shutterstock/Dudarev Mikhail
INDONESIA’S REFINERY ROADMAPUnit: b/d
Refinery Capacity New Capacity Timing PartnersRevamp ProjectsCilacap 348,000 370,000 2022 Pertamina, Saudi AramcoBalikpapan 260,000 360,000 2019 PertaminaDumai 170,000 Not Decided 2023 Pertamina, Saudi AramcoBalongan 125,000 Not Decided 2023 Pertamina, Saudi AramcoPlaju 118,000 No Expansion Planned N/A Greenfield ProjectsTuban 300,000 300,000 2021 Pertamina, RosneftBontang 300,000 300,000 N/A Not Decided
Source: PertaminaNotes: According to Pertamina, the revamp projects will enable the refineries to produce Euro-IV equivalent fuels, up from Euro-II,and raise their Nelson Complexity Index to 9 from an average 5.

Autumn 2016 Platts Insight 49
Surging imports vexvulnerable MyanmarFailure to tackle energy demand would prove an expensive obstacle to economic growth
Myanmar faces an uphill struggle in its quest to upgrade and build oil infrastructure, such as
storage terminals, to handle product imports, which are set to grow in coming years because ageing refi neries provide little room to boost output at home.
Not only is the task daunting, it is urgent as well.
Following the lifting of sanctions in 2012, Myanmar, which lacks advanced road infrastructure, is witnessing a dramatic surge in vehicle imports, triggering massive traffi c jams – similar to the ones seen in Jakarta or Bangkok. Motorcycles and mopeds are still banned on Yangon’s roads, a city of over 5 million people.
In the fi rst nine months of the 2015-16 fi scal year starting April, Myanmar granted import licenses for over 1.87 million mt of fuel and diesel, worth more than $1 billion, according to the Ministry of Commerce. It was much higher than the volumes imported over the same period a year earlier.
While there have been some upgrades at the refi neries in recent years through
foreign assistance, including help from India, in the short term rising oil products demand is most likely to be met through higher imports, sources in the country said.
“Myanmar will have to depend more on oil products in the future. It is clear that oil products demand will grow due to increase in number of vehicles,” Nomura Research Institute said in a research study last year.
Myanmar’s three ageing state-owned refi neries with a total capacity of 51,000 b/d, are all running substantially below capacity and are only able to supply a part of the country’s daily fuel requirements.
According to sources, state-owned Myanma Petrochemical Enterprise, which runs the refi neries, has operating rates of around 20,000 b/d. BMI Research quoted in the Myanmar Times on April 6 noted that “chronic under-utilization of Myanmar’s three ageing refi neries meant the country had to import to cover over 60pc of its annual fuel requirements.”
In addition, “BMI estimated that consumption of refi ned products would
Daniel Colover
Associate Editorial Director,
S&P Global Platts
Myanmar

Myanmar
50 Platts Insight Autumn 2016
rise from under the current 50,000 b/d to 60,000 b/d by 2020.”
Myanmar’s demand for oil products has been steadily rising. In 2015, it imported 74,012 mt/month of gasoline from Singapore, Thailand and China, its main suppliers. A year earlier, its gasoline imports were just 33,558 mt/month.
To meet this rising trend, the government in Myanmar, with the help of the Ministry of Energy and private sector companies, has been steadily boosting fuel imports. But, in addition to imports, the industry also sees an urgent need for Myanmar to plan and build new refi neries.
“We estimate that oil product demand will reach 200,000 b/d in around 2025, and could be over 350,000 b/d in 2035,” Nomura added. “Without refi neries, Myanmar will lose up to $2.8 billion. From the planning to the refi nery operation, it will take about 10 years.”
And as the bank also noted: “Rapid increase in energy consumptioncan also become a potentialbottleneck towards economicgrowth of the country.”
Rocky path
Although the country faces promising demand growth prospects, it is battling a number of hurdles on the supply front.
According to Nomura, a number of factors stand in the way – management constraints, lower competitiveness of domestic products as against imported cargoes, an ineffi cient distribution system and doubts around safe and reliable operations. In addition, doing business in Myanmar for private companies is seen as far from free of
constraints, as the political and economic environment remains complex. Data on oil products demand, salesor imports is hard to come by as it isnot released on a regular basis bythe government.
To give an indication of sales, ministry sources had said last year that the government sector’s monthly sales of gasoil were around 6 million gal/month, or around 4,600 b/d, in August 2015.
Gasoline imports by the ministry had been less regular. Production of naphtha at the three state-owned refi neries stood around 7 million gal/month or 5,400 b/d last year, according to the sources. Private sector sales of diesel are higher, around 16 million gal/month or 12,300 b/d, while sales of gasoline around 13 million gal/month or around 10,000 b/d.
MPPE, a major retailer and wholesaler of oil products in Myanmar, has four main fuel terminals, 24 sub-fuel storage facilities, and 12 oil stations throughout the country.
In July last year, MPPE issued a tender to establish an oil products joint venture, in which it would have a 51% stake, to engage in import, storage, distribution and sales of oil products, rehabilitate its storage facilities, and expand the oil business.
Infrastructure push
Puma Energy, whose main shareholders are trader Trafi gura and Angola’s state-owned Sonangol, was thefi rst foreign company to be granted permission to develop oil storage facilities in Myanmar when in July2013 it won a tender to constructa jetty at Thilawa port just outside
Yangon in the south of the countryand storage facilities for bitumenand petroleum products.
Construction of Puma Energy’s 90,000 cu m oil products storage facility at Thilawa was completed at the end of March this year, EPC contractor China Petroleum Pipeline Bureau, a subsidiary of CNPC, has said.
The facility is the largest oil products import terminal in Myanmar and is capable of receiving MR-sized vessels, Puma Energy said.
In addition, Max Energy, a major domestic fuel retailer, also has plans to develop a storage terminal that would be able to store up to 40,000 cu m of clean petroleum products and would use a shared jetty. It currently leases tank space at the port and uses fl oating barges to store imported oil products.
The company has around 4,000 b/d of oil product sales and is looking to increase this through its network of 30 service stations across the country.
In addition, the local IGE Group of companies, which has around 18 retail stations under the PPCL brand along with a number of joint venture service stations, is also planning to build its own terminal and jetty at the port, having won one of the 37 lots offered by MPE, according to industry sources and local media.
While these investments in infrastructure are clearly being made with a view to coping with the rise in oil demand in the years to come, it remains to be seen if it will be suffi cient to keep up with the wider economic development and growth the country is seeing.

Whether you nominate your company, sponsor, or attend the event, don’t miss an opportunity to be involved with this highly competitive and prestigious event.
We will be accepting nominations between and September , . For more information contact us at +1-720-264-6840 or [email protected]
or visit www.globalenergyawards.com
December 8, 2016 | Cipriani Wall Street | New York

52 Platts Insight Autumn 2016
Top 250 Global Energy Company Rankings
S&P GlobalPlatts Top 250Price shakeout sparks industry upheaval
Although the plot lines began playing out in advance, the energy industry only felt the full force of OPEC’s strategy
shocker of defending its dominance of global oil markets during 2015.
The move – which triggered the biggest crude price collapse in almost three decades – saw the global fuel mix shift as energy demand and supply adjusted to the new norm.
The year of low prices sparked billions of dollars in spending cuts across the oil and gas industry, widespread asset sales, drove some US drillers to bankruptcy and saw swathes of projects shelved or cancelled. The price slump prompted key adjustments in energy markets, curtailing the most costly supply and shifting some fossil fuel demand from coal to oil and gas.
But for those energy players less exposed to the commodity price rout, 2015 was a very different story.
This year’s Top 250 rankings show the biggest winners are independent power producers and the power and gas utility sector. While energy-producing industries saw their cash fl ow, earnings
and asset values shrink, most power producers gained from sharply lower fuel costs for their plants and regulated downstream environments.
As a sector, electric utilities retained the biggest share of the rankings bynumber, with eight new entrants taking the sector’s total to 28% of the total. The outright number of IPPs in the list, for example, jumped almost 50% this year to their highest since the rankings began in 2002.
In terms of growth, power producers and utilities also swept the board, taking 32 of the 50 top spots for compound growth. Asian IPPs and utilities dominate here with 17 of the fastest growing list.
Refi ners also received a boost from stronger margins buoyed by cheaper oil and stronger fuel demand. The improvement saw global crude runs rise by almost 2 million b/d, well ahead of the 10-year average, despite declines in South America, Africa and Russia.
Longer-term trends in both the global demand and supply continue to play out through the data. Global energy demand grew by just 1% in 2015, similar to 2014
Robert Perkins
Senior Writer,
EMEA Oil News,
S&P Global Platts
Stephanie Wilson
Editor,
International Coal & LNG,
S&P Global Platts

Autumn 2016 Platts Insight 53
Top 250 Global Energy Company Rankings
but nearly half the average rate over the past decade, according to BP in its June 2016 Statistical Review of World Energy. Asian energy demand growth continues to lead the world but its pace also slowed sharply. Although still the world’s biggest in terms of energy growth, China saw consumption growat its slowest rate in almost 20 years.
On supply, the US shale boom saw oil and natural gas either hold on or increase their share of the global energy mix, helped by sharply lower prices. In addition to the growth of renewable energies, global coal supply paid the price, experiencing its biggest fall on record as its proportion of the global energy mix was cut.
On average, Dated Brent ended the year at $52.39/b, a decline of 47% from the 2014 level and the lowest annual average since 2004.
Natural gas prices also fell sharply, with the deepest declines in the US where the Henry Hub benchmark slumped to average $2.60/MMBtu, its lowest since 1999. Regional gas prices disparities remained a feature, although the differential between LNG and European onshore gas values narrowed considerably versus previous years as supply began to outweigh demand.
LNG traded at an average of over $7.50/MMBtu for delivery in Japan and South Korea, while the UK onshore NBP market averaged around $6/MMBtu for month-ahead delivery over 2015.
Global coal prices fell for a fourth consecutive year, with Asian market prices the lowest since 2006 averaging below $50/mt for import into China, although Japan remained the premium paying market.
Top 10 Nowhere is the impact of the oil price slump more apparent than the leaderboard of the world’s biggest energy players. The stranglehold on the top rankings by integrated oil majors in recent years has been abruptly broken, refl ecting the changing fortunes of the energy supply chain.
While Exxon holds on to its top spot for the 12th consecutive year – despite losing its coveted AAA S&P credit rating – the commodities rout has catapulted South Korea’s Korea Electric Power Corp, or Kepco, into second place up from 41st in 2015.
The state-run behemoth, which supplies more than 80% of Korea’s power, benefi ted from the steep drop in fossil fuel prices and a high reliance on nuclear capacity, which shrank its generation costs while tariffs were largely maintained.
In third place, Russia’s gas giant Gazprom has returned to the Top 10 this year after a brief absence. The state-run producer recovered from a major foreign exchange hit in 2014 on the back of the ruble’s collapse.
Gazprom is not the only Russian player to bounce back. With cash fl ows boosted by the ruble’s devaluation, Russia’s exporting oil producers bucked the trend of their multinational peersby either rising into or improving their Top 10 positions. Rosneft, Russia’s top oil producer, gained ground this year while Lukoil and Surgutneftegaz moved into the leaderboard, the latter for the fi rst time.
Buoyed by stronger margins, refi ners have also consolidated their rankings this year, propelling two – India’s
Reliance Industries and the US’ Marathon Petroleum – to their Top 10 debuts. No less than four refi ners now sit in the leaderboard, twice that of the previous year.
Notable absentees in the top spots this year include oil majors Chevron, Shell, CNOOC, PetroChina and ConocoPhillips. All were shunted off due to the commodity price slump.
Conoco, a stalwart in the Top 10 which sat at 7th overall last year, dropped to 129th overall, its lowest ranking on record after spinning off its refi ning and marketing operations, leaving it highly exposed to low oil prices.
Chevron dropped a total of 15 places, moving from 2nd place in 2015 to 17th by 2016, owing in part to a restructure. The company has also sustained heavy losses from large projects, such as its 47.3% stake in the delayed Gorgon LNG facility – Australia’s largest ever resource development at a cost of $54 billion.
Shell, also a 25% stake holder in the same facility, slipped 28 places to 31st in the list after completing its acquisition of BG Group in 2015, which had ranked 193rd on the Top 250 list last year.
BP, which briefl y bounced back fromits 2010 Macondo spill debacle in the 2014 rankings, was again dragged down the pack after posting its biggest annual loss last year. Further costs from the Gulf of Mexico oil spill saw BP slipping to 99th overall, down from 29th a year earlier.
China’s largest coal miner Shenhua Energy had enjoyed only a brief placing in the top 10 as the industry continues to face strong headwinds. The company
> continued on page 59

54 Platts Insight Autumn 2016
PLATTS TOP 250 GLOBAL ENERGY COMPANY RANKINGS®
Platts Return onrank Assets Revenues Profits invested capital 3-Year Industry2016 Company Country Region $ million rank $ million rank $ million rank ROIC % rank CGR% code1 Exxon Mobil Corp USA Americas 336758 3 236810 4 16150 1 8 38 -17.3 IOG2 Korea Electric Power Corp South Korea Asia/Pacific Rim 147003 14 49137 26 11147 3 10 20 6 EU3 Public JSC Gazprom Russia EMEA 253440 7 90266 9 11698 2 6 70 9.2 IOG4 Phillips 66 USA Americas 48580 52 85195 13 4221 11 13 13 -19.9 R&M5 Valero Energy Corp USA Americas 44343 60 87804 11 3987 13 14 8 -14.1 R&M6 PJSC LUKOIL Oil Co Russia EMEA 74620 32 85447 12 4327 10 7 44 -16.9 IOG7 OJSC Rosneft Oil Co Russia EMEA 144098 15 75323 19 5308 6 6 65 19 IOG8 Reliance Industries Ltd India Asia/Pacific Rim 89843 25 40985 29 4095 12 7 48 -11.4 R&M9 OJSC Surgutneftegas Russia EMEA 60220 41 14755 76 10527 4 20 2 5.9 IOG10 Marathon Petroleum Corp USA Americas 43115 63 64471 20 2848 16 9 24 -5.6 R&M11 National Grid plc United Kingdom EMEA 84921 28 21780 57 3734 14 6 57 1.7 DU12 TOTAL SA France EMEA 224484 9 143421 6 5087 7 3 142 -15.1 IOG13 China Petroleum & Chemical Corp China Asia/Pacific Rim 219471 10 306885 1 4933 8 3 148 -10.2 IOG14 Indian Oil Corp Ltd India Asia/Pacific Rim 35863 80 52527 24 1663 37 9 27 -8.4 R&M15 Enterprise Products Partners LP USA Americas 48952 51 27028 43 2512 21 6 60 -14.1 S&T16 PetroChina Co Ltd China Asia/Pacific Rim 364055 1 262403 3 5401 5 2 174 -7.7 IOG17 Chevron Corp USA Americas 266103 5 122566 8 4587 9 2 163 -18 IOG18 Exelon Corp USA Americas 95384 24 29447 37 2269 24 4 105 7.8 EU19 NextEra Energy, Inc USA Americas 82479 30 17486 66 2752 18 5 76 7 EU20 Oil & Natural Gas Corp Ltd India Asia/Pacific Rim 52792 45 19162 62 2093 28 6 57 -7.3 E&P21 Iberdrola, SA Spain EMEA 116950 19 35107 33 2730 19 4 133 -2.8 EU22 CNOOC Ltd Hong Kong Asia/Pacific Rim 101036 21 26096 45 3079 15 4 124 -11.5 E&P23 Southern Co USA Americas 78318 31 17489 65 2367 23 5 93 1.9 EU24 Enel SpA Italy EMEA 180098 11 82697 15 2454 22 2 168 -3.9 EU25 China Shenhua Energy Co Ltd China Asia/Pacific Rim 85133 27 26929 44 2684 20 4 130 -11.4 C&CF26 Duke Energy Corp USA Americas 121156 18 23063 53 2791 17 3 135 9.8 EU27 Huaneng Power International Inc China Asia/Pacific Rim 45583 57 19604 60 2097 27 5 79 -1.3 IPP28 Gas Natural SDG, SA Spain EMEA 53782 44 29069 38 1717 35 4 107 1.5 GU29 Tesoro Corp USA Americas 16332 138 28150 39 1544 40 13 11 -1.4 R&M30 Chubu Electric Power Co Inc Japan Asia/Pacific Rim 50596 47 26070 46 1551 39 4 97 2.5 EU31 Royal Dutch Shell plc Netherlands EMEA 340157 2 264960 2 1939 30 1 201 -17.2 IOG32 American Electric Power Co Inc USA Americas 61683 38 16453 73 1763 33 5 93 3.3 EU33 Oil Transporting JSC Transneft Russia EMEA 39522 71 12123 88 2131 25 6 53 3.7 S&T34 Sasol Ltd South Africa EMEA 20748 118 11879 91 1905 31 12 14 5.2 IOG35 Bharat Petroleum Corp Ltd India Asia/Pacific Rim 13900 156 27929 40 1183 53 14 7 -8 R&M36 Public Service Enterprise Group Inc USA Americas 37535 77 10415 105 1679 36 7 41 2.1 DU37 CLP Holdings Ltd Hong Kong Asia/Pacific Rim 26247 102 10385 106 2017 29 10 22 -8.4 EU38 Coal India Ltd India Asia/Pacific Rim 16358 137 11227 98 2118 26 41 1 3.4 C&CF39 Tokyo Electric Power Co Holdings Inc Japan Asia/Pacific Rim 124775 17 55446 23 1286 50 2 174 0.5 EU40 Dominion Resources, Inc USA Americas 58797 43 11683 92 1899 32 4 97 -3.1 DU41 The Kansai Electric Power Co Inc Japan Asia/Pacific Rim 67709 35 29650 36 1286 49 3 148 4.3 EU42 Tenaga Nasional Berhad Malaysia Asia/Pacific Rim 28222 94 10429 104 1474 42 8 35 6.5 EU43 Energy Transfer Equity LP USA Americas 71189 33 42126 27 1186 52 2 170 35.4 S&T44 Formosa Petrochemical Corp Taiwan Asia/Pacific Rim 13039 163 19292 61 1450 44 12 15 -11 R&M45 Consolidated Edison Inc USA Americas 45642 56 12554 84 1193 51 4 97 1 DU46 NTPC Ltd India Asia/Pacific Rim 35635 81 11580 93 1509 41 5 76 2.7 IPP47 Tokyo Gas Co Ltd Japan Asia/Pacific Rim 20567 119 17215 69 1022 58 6 50 -0.5 GU48 Hindustan Petroleum Corp Ltd India Asia/Pacific Rim 12996 164 27726 42 729 81 11 18 -4.7 R&M49 Sempra Energy USA Americas 41150 66 10231 109 1349 47 5 85 2 DU50 Electricite de France SA France EMEA 311683 4 83810 14 666 88 1 207 1.3 EU
Notes: C&CF = coal and consumable fuels, DNR = data not reported, DU = diversified utility, E&P = exploration and production, EU = electric utility, GU = gas utility, IOG = inte-grated oil and gas, IPP = independent power producer and energy trader, R&M = refining and marketing, S&T = storage and transfer. All rankings are computed from data col-lected and translated into USD June 2, 2016.
Source: S&P Global Market Intelligence/Platts
Top 250 Global Energy Company Rankings

Autumn 2016 Platts Insight 55
PLATTS TOP 250 GLOBAL ENERGY COMPANY RANKINGS®
Platts Return onrank Assets Revenues Profits invested capital 3-Year Industry2016 Company Country Region $ million rank $ million rank $ million rank ROIC % rank CGR% code51 PPL Corp USA Americas 39301 72 7669 133 1597 38 5 73 -14.2 EU52 Edison International USA Americas 50310 48 11524 94 984 63 4 114 -1 EU53 China Resources Power Holdings Co Ltd Hong Kong Asia/Pacific Rim 26778 100 9193 118 1290 48 6 60 4.6 IPP54 SSE plc United Kingdom EMEA 31970 86 41473 28 664 89 4 124 0.6 EU55 SK Innovation Co, Ltd South Korea Asia/Pacific Rim 26304 101 40561 30 783 76 4 124 -13 R&M56 EDP-Energias de Portugal SA Portugal EMEA 47530 53 17338 68 1020 59 3 153 -1.7 EU57 PG&E Corp USA Americas 63339 37 16833 71 874 70 3 159 3.8 EU58 Polski Koncern Naftowy ORLEN SA Poland EMEA 12250 170 22481 54 722 84 8 31 -9.7 R&M59 Huadian Power International Corp Ltd China Asia/Pacific Rim 31428 88 10800 102 1170 54 4 97 6.1 IPP60 Tohoku Electric Power Co Inc Japan Asia/Pacific Rim 37930 76 19142 63 889 68 3 135 5.3 EU61 Xcel Energy Inc USA Americas 39054 74 11024 100 984 62 4 109 2.9 EU62 PJSC Tatneft Russia EMEA 11871 171 8215 126 1470 43 15 6 7.6 E&P63 PTT Plc Thailand Asia/Pacific Rim 60939 40 56816 21 538 100 1 192 -10.1 IOG64 Osaka Gas Co, Ltd Japan Asia/Pacific Rim 16714 135 12076 89 770 77 6 60 -1.4 GU65 China Yangtze Power Co Ltd China Asia/Pacific Rim 21595 115 3686 185 1752 34 8 32 -2 IPP66 Türkiye Petrol Rafinerileri A.S. Turkey EMEA 8651 203 12531 85 866 71 14 8 -4.6 R&M67 Rosseti, Public JSC Russia EMEA 31892 87 11397 96 952 65 4 124 5.5 EU68 Snam S.p.A. Italy EMEA 27800 97 4397 170 1383 46 6 60 1.1 GU69 JSC NOVATEK Russia EMEA 13157 160 7107 139 1112 55 10 23 31.1 E&P70 Zhejiang Zheneng Electric Power Co Ltd China Asia/Pacific Rim 15765 141 6036 147 1061 57 8 38 -5.5 IPP71 HollyFrontier Corp USA Americas 8388 205 13238 81 738 79 11 19 -13 R&M72 CEZ, a.s. Czech Republic EMEA 24916 106 8550 123 857 72 5 88 -0.6 EU73 Kyushu Electric Power Co Inc Japan Asia/Pacific Rim 43373 62 16768 72 671 87 2 170 5.9 EU74 Eversource Energy USA Americas 30580 89 7955 129 878 69 4 105 8.2 EU75 DTE Energy Co USA Americas 28737 93 10337 107 725 82 4 114 5.5 DU76 FirstEnergy Corp USA Americas 52187 46 14610 79 578 96 2 178 -0.4 EU77 Veolia Environnement SA France EMEA 40101 67 27895 41 423 115 2 178 2.4 DU78 Empresas Copec SA Chile Americas 19937 122 18160 64 539 99 3 135 -7.3 R&M79 S-Oil Corp South Korea Asia/Pacific Rim 9055 198 15006 74 512 103 7 47 -19.8 R&M80 PJSC Bashneft Oil Co Russia EMEA 7730 212 8666 121 737 80 13 12 5.5 E&P81 The Hong Kong & China Gas Co Ltd Hong Kong Asia/Pacific Rim 14871 145 3808 183 954 64 8 37 5.9 GU82 SCANA Corp USA Americas 17146 133 4380 171 746 78 6 53 1.6 DU83 Neste Oyj Finland EMEA 7590 216 10135 110 624 94 11 16 -17.9 R&M84 Companhia Energética de Minas Gerais SA Brazil Americas 11354 176 5914 150 692 85 9 26 14.6 EU85 Ultrapar Participações SA Brazil Americas 5829 237 21032 58 418 117 9 25 12 S&T86 Saudi Electricity Co Saudi Arabia EMEA 95462 23 11016 101 412 118 1 197 7.2 EU87 Polskie Gornictwo Naftowe I Gazownictwo SA Poland EMEA 12680 167 9280 116 543 98 6 65 8.3 IOG88 Cheung Kong Infrastructure Holdings Ltd Hong Kong Asia/Pacific Rim 17000 134 780 249 1436 45 9 27 10.4 EU89 China National Nuclear Power Co Ltd China Asia/Pacific Rim 40031 68 3985 179 1081 56 3 153 13.9 IPP90 GD Power Development Co Ltd China Asia/Pacific Rim 38048 75 8301 125 664 90 2 168 -4.1 IPP91 WEC Energy Group Inc USA Americas 29355 92 5926 149 640 92 3 135 11.8 DU92 Power Grid Corp of India Ltd India Asia/Pacific Rim 26961 99 3164 195 891 67 4 107 17.5 EU93 Ameren Corp USA Americas 23640 110 5885 151 579 95 4 114 1.7 DU94 CGN Power Co Ltd China Asia/Pacific Rim 33123 83 3479 188 1003 60 3 142 9.7 IPP95 Datang International Power Generation Co Ltd China Asia/Pacific Rim 46136 55 9412 115 427 114 1 192 -7.3 IPP96 CMS Energy Corp USA Americas 20340 120 6456 144 523 102 4 114 1.1 DU97 Cenovus Energy Inc Canada Americas 19716 123 9987 111 472 106 3 142 -8.1 IOG98 SDIC Power Holdings Co Ltd China Asia/Pacific Rim 27913 96 4757 167 825 74 3 146 9.4 IPP99 BP p.l.c. United Kingdom EMEA 261832 6 223279 5 -6484 244 -4 230 -15.9 IOG100 Antero Resources Corp USA Americas 14155 152 1573 232 941 66 8 35 81.1 E&P
Notes: C&CF = coal and consumable fuels, DNR = data not reported, DU = diversified utility, E&P = exploration and production, EU = electric utility, GU = gas utility, IOG = inte-grated oil and gas, IPP = independent power producer and energy trader, R&M = refining and marketing, S&T = storage and transfer. All rankings are computed from data col-lected and translated into USD June 2, 2016.
Source: S&P Global Market Intelligence/Platts
Top 250 Global Energy Company Rankings

56 Platts Insight Autumn 2016
PLATTS TOP 250 GLOBAL ENERGY COMPANY RANKINGS®
Platts Return onrank Assets Revenues Profits invested capital 3-Year Industry2016 Company Country Region $ million rank $ million rank $ million rank ROIC % rank CGR% code101 The AES Corp USA Americas 36850 78 14963 75 306 145 1 192 -4.5 IPP102 Plains All American Pipeline LP USA Americas 22288 112 23152 51 305 146 2 183 -15.1 S&T103 Kinder Morgan, Inc USA Americas 84104 29 14403 80 214 173 0 211 13 S&T104 Western Refining, Inc USA Americas 5833 236 9787 112 407 120 9 27 1 R&M105 Petróleo Brasileiro SA - Petrobras Brazil Americas 249996 8 89329 10 -9675 249 -5 231 4.6 IOG106 Korea Gas Corp South Korea Asia/Pacific Rim 35552 82 21853 56 264 160 1 204 -9.4 GU107 Power Assets Holdings Ltd Hong Kong Asia/Pacific Rim 17419 131 168 250 995 61 6 60 -49.9 EU108 ENGIE SA France EMEA 179516 12 78086 17 -5321 242 -5 233 -10.4 DU109 Manila Electric Co Philippines Asia/Pacific Rim 6054 230 5543 153 409 119 17 4 -3.2 EU110 EnBW Energie Baden-Wuerttemberg AG Germany EMEA 42637 64 23755 50 140 196 1 197 3.1 EU111 YPF SA Argentina Americas 26007 103 11173 99 328 138 2 170 32.5 IOG112 Public JSC Inter RAO UES Russia EMEA 8371 206 11970 90 338 135 5 79 13.1 EU113 Enbridge Inc Canada Americas 64608 36 25834 47 -28 215 0 215 11.1 S&T114 E.ON SE Germany EMEA 127038 16 130394 7 -7822 246 -19 246 -4.1 DU115 Red Eléctrica Corporación SA Spain EMEA 11842 172 2190 219 677 86 7 40 3.4 EU116 Fortis Inc Canada Americas 22019 113 5142 162 557 97 3 146 22.6 EU117 Statoil ASA Norway EMEA 116357 20 56006 22 -4514 241 -6 236 -12.7 IOG118 Eni SpA Italy EMEA 150614 13 75691 18 -8581 248 -9 241 -18.9 IOG119 Pinnacle West Capital Corp USA Americas 15028 143 3495 187 437 112 5 79 1.9 EU120 RWE AG Germany EMEA 88646 26 52124 25 -1893 235 -6 237 -2.9 DU121 GS Holdings Corp South Korea Asia/Pacific Rim 15956 140 10318 108 405 122 3 153 8.2 R&M122 China Power International Development Ltd Hong Kong Asia/Pacific Rim 13116 162 3092 198 631 93 5 71 5 IPP123 Repsol, SA Spain EMEA 70481 34 37468 32 -1396 233 -3 228 -13.6 IOG124 Hydro One Ltd Canada Americas 18598 127 4998 164 527 101 3 135 4.5 EU125 JX Holdings Inc Japan Asia/Pacific Rim 61426 39 79816 16 -2544 237 -6 238 -8 R&M126 TERNA SpA Italy EMEA 17271 132 2263 216 657 91 5 91 5.3 EU127 Public JSC Federal Hydro-Generating Co - RusHydro Russia EMEA 13943 154 5378 155 469 107 4 114 5.3 EU128 Magellan Midstream Partners LP USA Americas 6042 231 2188 220 819 75 15 5 7.3 S&T129 ConocoPhillips USA Americas 97484 22 30299 35 -4428 240 -7 239 -20.4 E&P130 The Chugoku Electric Power Co Inc Japan Asia/Pacific Rim 28052 95 11250 97 248 163 1 188 0.9 EU131 Oil & Gas Development Co Ltd Pakistan Asia/Pacific Rim 5292 245 2013 224 834 73 20 3 2.1 E&P132 GAIL (India) Ltd India Asia/Pacific Rim 10521 186 8088 128 334 136 4 97 2.2 GU133 China Gas Holdings Ltd Hong Kong Asia/Pacific Rim 6515 226 4078 176 434 113 8 34 18.7 GU134 Guangdong Electric Power Development Co Ltd China Asia/Pacific Rim 10938 180 3912 181 492 104 5 85 -4.5 IPP135 Electric Power Development Co Ltd Japan Asia/Pacific Rim 23259 111 7126 138 363 131 2 176 5.9 IPP136 Thai Oil Pcl Thailand Asia/Pacific Rim 5393 241 7281 137 342 134 7 44 -15.3 R&M137 JSC KazMunaiGas Exploration Production Kazakhstan EMEA 5965 233 1572 233 723 83 13 10 -12.7 E&P138 Toho Gas Co Ltd Japan Asia/Pacific Rim 5108 248 4415 169 396 126 11 16 -2.5 GU139 Suncor Energy Inc Canada Americas 59266 42 22328 55 -1525 234 -4 229 -8.5 IOG140 China Resources Gas Group Ltd Hong Kong Asia/Pacific Rim 7708 213 4002 178 365 130 7 43 31.7 GU141 AGL Resources Inc USA Americas 14754 147 3941 180 353 133 4 109 3.4 GU142 Plains GP Holdings LP USA Americas 24142 108 23152 51 118 204 1 207 -15.1 S&T143 Buckeye Partners LP USA Americas 8369 207 3453 190 438 110 6 68 -6.9 S&T144 Alliant Energy Corp USA Americas 12495 169 3254 191 381 128 5 88 1.7 EU145 ENN Energy Holdings Ltd China Asia/Pacific Rim 7151 221 4876 166 310 144 6 53 21.2 GU146 Inpex Corp Japan Asia/Pacific Rim 39916 69 9222 117 153 192 0 210 -6 E&P147 Entergy Corp USA Americas 44648 59 11513 95 -177 218 -1 217 3.8 EU148 Atmos Energy Corp USA Americas 9093 196 4142 174 314 143 5 79 6.4 GU149 OMV Aktiengesellschaft Austria EMEA 36498 79 25171 48 -1229 232 -6 234 -19.2 IOG150 China Longyuan Power Group Corp Ltd China Asia/Pacific Rim 20299 121 2988 200 438 110 2 163 4.4 IPP
Notes: C&CF = coal and consumable fuels, DNR = data not reported, DU = diversified utility, E&P = exploration and production, EU = electric utility, GU = gas utility, IOG = inte-grated oil and gas, IPP = independent power producer and energy trader, R&M = refining and marketing, S&T = storage and transfer. All rankings are computed from data col-lected and translated into USD June 2, 2016.
Source: S&P Global Market Intelligence/Platts
Top 250 Global Energy Company Rankings

Autumn 2016 Platts Insight 57
PLATTS TOP 250 GLOBAL ENERGY COMPANY RANKINGS®
Platts Return onrank Assets Revenues Profits invested capital 3-Year Industry2016 Company Country Region $ million rank $ million rank $ million rank ROIC % rank CGR% code151 Companhia Paranaense de Energia - COPEL Brazil Americas 8040 209 4090 175 331 137 5 73 20.1 EU152 PT Perusahaan Gas Negara (Persero) TBK Indonesia Asia/Pacific Rim 6495 227 3069 199 401 123 7 46 6 GU153 Idemitsu Kosan Co Ltd Japan Asia/Pacific Rim 21942 114 32612 34 -329 221 -2 227 -6.5 R&M154 The National Shipping Co of Saudi Arabia Saudi Arabia EMEA 5092 249 2000 225 485 105 10 21 44.9 S&T155 UGI Corp USA Americas 10547 185 6691 141 281 153 4 122 0.9 GU156 Centrica plc United Kingdom EMEA 27176 98 40305 31 -1076 231 -10 242 5.3 DU157 Genesis Energy LP USA Americas 5460 239 2247 217 423 116 8 30 -12.6 S&T158 ONEOK Inc USA Americas 15446 142 7763 130 251 162 2 170 -8.7 S&T159 Galp Energia, SGPS, SA Portugal EMEA 14295 151 17393 67 137 198 1 188 -5.7 IOG160 Enagás, SA Spain EMEA 8662 202 1337 240 461 109 6 57 0.5 GU161 Acciona, SA Spain EMEA 17630 129 7588 134 232 170 2 176 -3.3 EU162 Shenergy Co Ltd China Asia/Pacific Rim 7842 211 4357 172 324 141 5 88 5.9 IPP163 Ecopetrol SA Colombia Americas 39825 70 16868 70 -2318 236 -8 240 -8.7 IOG164 HK Electric Investments & HK Electric Investments Ltd Hong Kong Asia/Pacific Rim 14634 148 1443 236 462 108 4 124 2.5 EU165 BKW Inc Switzerland EMEA 8104 208 2623 206 280 154 7 49 -2.5 EU166 Canadian Natural Resources Ltd Canada Americas 45313 58 9451 114 -487 225 -1 221 -5.4 E&P167 Yanzhou Coal Mining Co Ltd China Asia/Pacific Rim 21148 117 10495 103 131 201 1 204 5 C&CF168 Calpine Corp USA Americas 18833 125 6407 146 235 168 2 186 5.7 IPP169 TransCanada Corp Canada Americas 49294 49 8638 122 -948 230 -2 226 12.2 S&T170 Spectra Energy Corp USA Americas 32923 84 5234 160 196 181 1 204 1 S&T171 PBF Energy Inc USA Americas 6105 229 13124 82 146 195 4 124 -13.3 R&M172 Beijing Jingneng Power Co Ltd China Asia/Pacific Rim 5892 235 1652 230 397 125 7 41 2.6 IPP173 Williams Companies Inc USA Americas 49020 50 7360 136 -571 227 -1 221 -0.6 S&T174 China Coal Energy Co Ltd China Asia/Pacific Rim 39081 73 9014 120 -383 223 -1 219 -12.1 C&CF175 Guangxi Guiguan Electric Power Co Ltd China Asia/Pacific Rim 6601 225 1568 234 391 127 6 50 25.6 IPP176 Aboitiz Power Corp Philippines Asia/Pacific Rim 5201 246 1827 228 378 129 8 33 11.1 IPP177 Occidental Petroleum Corp USA Americas 43437 61 12480 87 -8146 247 -25 248 -14.7 IOG178 ONEOK Partners LP USA Americas 14928 144 7761 131 195 183 1 187 -8.7 S&T179 Hokkaido Electric Power Co Inc Japan Asia/Pacific Rim 16681 136 6614 143 194 185 2 183 7.5 EU180 NHPC Ltd India Asia/Pacific Rim 9181 195 1258 244 398 124 5 85 9.8 IPP181 CPFL Energia SA Brazil Americas 11257 177 5612 152 240 167 3 156 10.7 EU182 NRG Energy Inc USA Americas 32882 85 14674 77 -6402 243 -25 249 20.3 IPP183 Westar Energy Inc USA Americas 10706 182 2459 212 291 151 4 109 2.8 EU184 TonenGeneral Sekiyu KK Japan Asia/Pacific Rim 11047 178 24004 49 0 214 0 214 -2.2 R&M185 Reliance Infrastructure Ltd India Asia/Pacific Rim 10679 183 2473 210 293 150 4 114 -9.4 EU186 Royal Vopak NV Netherlands EMEA 6142 228 1567 235 315 142 6 52 2 S&T187 YTL Corp Berhad Malaysia Asia/Pacific Rim 16070 139 4037 177 245 164 2 178 -6 DU188 Anadarko Petroleum Corp USA Americas 46414 54 9486 113 -6695 245 -20 247 -10.7 E&P189 APA Group Australia Asia/Pacific Rim 10632 184 1127 245 406 121 4 109 13.6 GU190 Emera Inc Canada Americas 9183 194 2132 222 304 147 4 97 10.7 EU191 NiSource Inc USA Americas 17492 130 4652 168 183 186 2 178 -2.6 DU192 OGE Energy Corp USA Americas 9597 191 2197 218 271 158 4 96 -15.7 EU193 Centrais Elétricas Brasileiras SA - Eletrobras Brazil Americas 41561 65 9051 119 -4011 239 -16 244 5.2 EU194 AusNet Services Ltd Australia Asia/Pacific Rim 8472 204 1392 239 355 132 5 93 5.4 EU195 Devon Energy Corp USA Americas 29532 91 12642 83 -14459 250 -60 250 12.8 E&P196 Husky Energy Inc Canada Americas 25270 105 12513 86 -2971 238 -16 245 -9.7 IOG197 Pembina Pipeline Corp Canada Americas 9889 190 3543 186 271 157 3 142 10.6 S&T198 AGL Energy Ltd Australia Asia/Pacific Rim 11488 175 7748 132 158 191 2 178 12.7 DU199 Origin Energy Ltd Australia Asia/Pacific Rim 24210 107 8380 124 -375 222 -2 224 -3.7 IOG200 Inter Pipeline Ltd Canada Americas 6903 223 1281 242 327 139 5 73 11.6 S&T
Notes: C&CF = coal and consumable fuels, DNR = data not reported, DU = diversified utility, E&P = exploration and production, EU = electric utility, GU = gas utility, IOG = inte-grated oil and gas, IPP = independent power producer and energy trader, R&M = refining and marketing, S&T = storage and transfer. All rankings are computed from data col-lected and translated into USD June 2, 2016.
Source: S&P Global Market Intelligence/Platts
Top 250 Global Energy Company Rankings

58 Platts Insight Autumn 2016
PLATTS TOP 250 GLOBAL ENERGY COMPANY RANKINGS®
Platts Return onrank Assets Revenues Profits invested capital 3-Year Industry2016 Company Country Region $ million rank $ million rank $ million rank ROIC % rank CGR% code201 Oil India Ltd India Asia/Pacific Rim 5722 238 1393 238 297 148 6 53 -2 E&P202 Empresa de Energia de Bogotá SA ESP Colombia Americas 7681 215 1102 247 327 140 5 76 29.2 GU203 Hawaiian Electric Industries Inc USA Americas 11790 173 2603 207 160 190 4 109 -8.3 EU204 Cosmo Energy Holdings Co Ltd Japan Asia/Pacific Rim 12876 165 20501 59 -459 224 -5 232 -10.8 R&M205 Hera S.p.A. Italy EMEA 9225 193 5284 158 201 178 3 152 0.7 DU206 Huadian Fuxin Energy Corp Ltd China Asia/Pacific Rim 14835 146 2334 215 277 155 2 167 10.5 IPP207 Beijing Jingneng Clean Energy Co Ltd China Asia/Pacific Rim 7057 222 2182 221 297 149 5 91 51.2 IPP208 VERBUND AG Austria EMEA 13144 161 3189 194 232 169 2 163 -3.4 EU209 ENERGA Spólka Akcyjna Poland EMEA 4695 250 2748 202 212 174 6 65 -1.1 EU210 Woodside Petroleum Ltd Australia Asia/Pacific Rim 23839 109 5030 163 26 212 0 212 -7.5 E&P211 TECO Energy Inc USA Americas 8961 200 2744 203 240 166 4 130 4.7 DU212 Abu Dhabi National Energy Co PJSC United Arab Emirates EMEA 29613 90 5267 159 -490 226 -2 225 -11.4 DU213 Vectren Corp USA Americas 5410 240 2435 213 197 180 6 68 2.9 DU214 NuStar Energy LP USA Americas 5149 247 2084 223 257 161 5 71 -29.5 R&M215 MOL Hungarian Oil & Gas Co Hungary EMEA 13991 153 14613 78 -941 229 -11 243 -9.4 IOG216 Public Power Corp SA Greece EMEA 19347 124 6409 145 -115 217 -1 218 -1.4 EU217 Shikoku Electric Power Co Inc Japan Asia/Pacific Rim 12804 166 5974 148 102 207 1 188 5.2 EU218 ACEA S.p.A. Italy EMEA 7494 218 3160 196 196 182 4 114 -7.3 DU219 Guangzhou Development Group Inc China Asia/Pacific Rim 5297 243 3209 192 198 179 4 97 11.7 IPP220 CenterPoint Energy Inc USA Americas 21334 116 7386 135 -692 228 -6 234 -0.3 DU221 The Tata Power Co Ltd India Asia/Pacific Rim 11516 174 5504 154 129 202 2 183 4 EU222 Shenzhen Energy Group Co Ltd China Asia/Pacific Rim 8831 201 1693 229 272 156 4 130 -4.6 IPP223 Enbridge Energy Partners LP USA Americas 18816 126 5146 161 -85 216 0 216 -8.4 S&T224 Hokuriku Electric Power Co Japan Asia/Pacific Rim 13788 157 4974 165 118 205 1 192 3.4 EU225 Targa Resources Corp USA Americas 13254 159 6659 142 58 210 0 209 5.4 S&T226 Great Plains Energy Inc USA Americas 10739 181 2502 209 211 175 3 157 2.7 EU227 YTL Power International Berhad Malaysia Asia/Pacific Rim 10514 187 2857 201 221 172 2 162 -9.3 DU228 Columbia Pipeline Group Inc USA Americas 10056 189 1335 241 268 159 3 135 10.1 S&T229 Fortum Oyj Finland EMEA 25439 104 3895 182 -258 220 -1 219 -17.5 EU230 Huaneng Renewables Corp Ltd China Asia/Pacific Rim 12555 168 1119 246 283 152 3 159 22.2 IPP231 MDU Resources Group Inc USA Americas 6628 224 4192 173 149 194 3 135 0.9 DU232 WGL Holdings Inc USA Americas 5294 244 2660 205 131 200 5 79 3.1 GU233 Cosan Ltd Brazil Americas 14527 150 3460 189 128 203 1 188 NA R&M234 Brookfield Infrastructure Partners LP Canada Americas 17735 128 1855 227 166 188 1 192 6.8 EU235 Kunlun Energy Co Ltd Hong Kong Asia/Pacific Rim 13909 155 5359 156 18 213 0 212 8.1 E&P236 Hellenic Petroleum SA Greece EMEA 8971 199 8160 127 52 211 1 201 -11.3 R&M237 IdaCorp Inc USA Americas 6023 232 1270 243 195 184 5 79 5.5 EU238 Rabigh Refining & Petrochemical Co Saudi Arabia EMEA 13689 158 6803 140 -202 219 -2 223 -25.6 R&M239 A2A S.p.A. Italy EMEA 10951 179 5287 157 82 208 1 197 -9 DU240 ITC Holdings Corp USA Americas 7582 217 1045 248 241 165 4 114 7.9 EU241 ATCO Ltd Canada Americas 14567 149 3158 197 118 206 1 197 1 DU242 Shanghai Electric Power Co Ltd China Asia/Pacific Rim 7907 210 2586 208 203 176 3 157 4.2 IPP243 Interconexión Eléctrica SA E.S.P. Colombia Americas 9059 197 1441 237 226 171 3 148 1.3 EU244 Southwest Gas Corp USA Americas 5359 242 2464 211 138 197 4 104 8.5 GU245 EVN AG Austria EMEA 7264 219 2407 214 165 189 4 133 -9 EU246 Portland General Electric Co USA Americas 7221 220 1898 226 172 187 4 122 1.7 EU247 Reliance Power Ltd India Asia/Pacific Rim 9337 192 1580 231 202 177 3 159 29.3 IPP248 Iren SpA Italy EMEA 7697 214 3206 193 132 199 2 163 -10.7 DU249 PT Adaro Energy Tbk Indonesia Asia/Pacific Rim 5959 234 2684 204 152 193 3 148 -10.3 C&CF250 Adani Power Ltd India Asia/Pacific Rim 10280 188 3734 184 72 209 1 201 54.9 IPP
Notes: C&CF = coal and consumable fuels, DNR = data not reported, DU = diversified utility, E&P = exploration and production, EU = electric utility, GU = gas utility, IOG = inte-grated oil and gas, IPP = independent power producer and energy trader, R&M = refining and marketing, S&T = storage and transfer. All rankings are computed from data col-lected and translated into USD June 2, 2016.
Source: S&P Global Market Intelligence/Platts
Top 250 Global Energy Company Rankings

Autumn 2016 Platts Insight 59
slipped from its number 9 ranking –the fi rst time it had placed in the top10 – to 25th place as its asset rank, revenue and profi ts all slipped on dwindling demand for coal in China.
Overall, revenues of the Top 10 global energy companies more than halved and profi ts sank to levels not seen since 2004 when Brent crude averaged $38.20/b. Collectively, the world’s top 10 companies posted combined earnings of $74.31 billion last year on revenues of $851.97 billion, 38% and 54% lower than the year before.
Regional shifts
Utilities and refi ners in Asia and Pacifi c Rim region were the main benefi ciaries of the full year of lower oil and gas prices in 2015, enjoying lower fuel bills and sporadic adjustments to regulated pricing which lagged the sharp fall in input costs.
The knock-on effect to the regional rankings has been dramatic. After dipping last year, Asian energy fi rms are fi rmly back in driving seat in terms of taking a growing slice of global energy markets. Thirteen more Asian energy players made the list this year, 17% more than in 2015, taking their total to the highest since the rankings began.
One region’s gain is another’s loss and the more producer-focused make-up of fi rms in the Americas has certainly paid the price. From dominating 60% of the entire list back in 2003, the region fi elded 98 energy companies this year, a record low representing 39% ofthe total.
The extended period of depressed commodity prices began taking its toll on US oil and gas companies in 2015. As
Top 250 Global Energy Company Rankings
ASSETS
Assets Rank Company Name Assets (millions) Platts Top 2501 PetroChina Co Ltd 364055 162 Royal Dutch Shell plc 340157 313 Exxon Mobil Corp 336758 14 Electricite de France SA 311683 505 Chevron Corp 266103 176 BP p.l.c. 261832 997 Public JSC Gazprom 253440 38 Petróleo Brasileiro SA - Petrobras 249996 1059 TOTAL SA 224484 1210 China Petroleum & Chemical Corp 219471 13
PROFITS
Profits Rank Company Name Profits (millions) Platts Top 2501 Exxon Mobil Corp 16150 12 Public JSC Gazprom 11697.8 33 Korea Electric Power Corp 11146.72 24 OJSC Surgutneftegas 10526.68 95 PetroChina Co Ltd 5401.41 166 OJSC Rosneft Oil Co 5307.62 77 TOTAL SA 5087 128 China Petroleum & Chemical Corp 4933.16 139 Chevron Corp 4587 1710 PJSC LUKOIL Oil Co 4327.06 6
REVENUES
Revenues Rank Company Name Revenues (millions) Platts Top 2501 China Petroleum & Chemical Corp 306885 132 Royal Dutch Shell plc 264960 313 PetroChina Co Ltd 262403 164 Exxon Mobil Corp 236810 15 BP p.l.c. 223279 996 TOTAL SA 143421 127 E.ON SE 130394 1148 Chevron Corp 122566 179 Public JSC Gazprom 90266 310 Petróleo Brasileiro SA - Petrobras 89329 105
ROIC
ROIC Rank Company Name ROIC % Platts Top 2501 Coal India Ltd 40.6 382 OJSC Surgutneftegas 19.8 93 Oil & Gas Development Co, Ltd 19.7 1314 Manila Electric Co 17.2 1095 Magellan Midstream Partners LP 15 1286 PJSC Tatneft 14.6 627 Bharat Petroleum Corp Ltd 14.2 358 Valero Energy Corp 13.9 59 Türkiye Petrol Rafinerileri A.S. 13.9 6610 JSC KazMunaiGas Exploration Production 13.4 137

60 Platts Insight Autumn 2016
of November, 36 exploration and production companies had fi ledfor bankruptcy in the United Stateswith total indebtedness in excess of$13 billion.
In Europe, where meager or fl at energy demand growth and tough environmental legislation have stymied many of the region’s players, the showing was little changed on the year.
Helped by a rare increase in EU energy consumption last year, the EMEA region – which includes Russia – fi elded 24% of the total list.
Of the global energy companies rising by more than 50 positions in the rankings this year, nearly half arebased in Asia. Refi ner Indian Oil Corp and Japan’s third-largest power utility, Chubu Electric Power, top the list of
the biggest movers this year, liftedby access to cheaper crude andLNG respectively.
In the reverse direction, a full 60% of the companies falling by more than 50 places were from the Americas. Only 15% of the biggest reversals this year were from Asia. Overall, the EMEA region saw more winners than losers. Italian utility Enel jumped 177 places on the year after recovering from a big writedown in 2014. Finnish utility Fortum, however, dropped most overall hit by low wholesale power prices.
Led by gas giant Gazprom, Russian oil and gas companies dominate the top four positions for the highest ranked EMEA companies. Helped by the weaker ruble which infl ated cash fl ows at the country’s biggest energy exporters, Russia’s energy players have risen up the rankings in terms of their average score. Surgutneftegaz, Russia’s third largest oil producer and now 9th overall, has emerged as a key winner from the weaker ruble, amassing over 1 trillion rubles in cash reserves.
Novatek, Russia’s biggest independent gas producer, is both Russia’s and the EMEA region’s fastest growing company.
Despite slowing economic activity and changing governmental policy, China retained its role as the world’s largest energy consumer, producer and net importer in 2015, accounting for 23% of global energy consumption and 34% of net energy consumption growth.
The country has become the world’s top generator of solar energy, with more than 16% of the global total, overtaking both Germany and the US, as the focus on renewable energy remained strong, while new nuclear reactors and
Top 250 Global Energy Company Rankings
THE AMERICAS
Rank Company Name Country Industry Platts Top 2501 Exxon Mobil Corp USA IOG 12 Phillips 66 USA R&M 43 Valero Energy Corp USA R&M 54 Marathon Petroleum Corp USA R&M 105 Enterprise Products Partners LP USA S&T 156 Chevron Corp USA IOG 177 Exelon Corp USA EU 188 NextEra Energy, Inc USA EU 199 Southern Co USA EU 2310 Duke Energy Corp USA EU 26
EMEA
Rank Company Name Country Industry Platts Top 2501 Public JSC Gazprom Russia IOG 32 PJSC LUKOIL Oil Co Russia IOG 63 OJSC Rosneft Oil Co Russia IOG 74 OJSC Surgutneftegas Russia IOG 95 National Grid plc United Kingdom DU 116 TOTAL SA France IOG 127 Iberdrola, SA Spain EU 218 Enel SpA Italy EU 249 Gas Natural SDG, SA Spain GU 2810 Royal Dutch Shell plc Netherlands IOG 31
ASIA/PACIFIC RIM
Rank Company Name Country Industry Platts Top 2501 Korea Electric Power Corp South Korea EU 22 Reliance Industries Ltd India R&M 83 China Petroleum & Chemical Corp China IOG 134 Indian Oil Corp Ltd India R&M 145 PetroChina Co Ltd China IOG 166 Oil & Natural Gas Corp Ltd India E&P 207 CNOOC Ltd Hong Kong E&P 228 China Shenhua Energy Co Ltd China C&CF 259 Huaneng Power International, Inc China IPP 2710 Chubu Electric Power Co, Incorporated Japan EU 30

Autumn 2016 Platts Insight 61
hydroelectric units have also eroded the coal plants’ share of capacity.
However, renewables are not without their challenges in the country, with wind and solar output increasing by only 14% and 28% respectively in the fi rst half of 2016. While these are remarkably high growth rates by international standards, they are lower than might be anticipated given the amount of capacity installed in 2015. 18.3 GW of solar capacity was addedin 2015, a 73.7% increase, while wind capacity additions of 32.5 GW wereup 34%.
Connecting renewable energy plants to the grid and securing their dispatch has been a long-running problem in China, resulting in lower utilization. Nor is the problem improving, with curtailment of wind capacity almost doubling from 8% to 15% of total output in 2015.
By contrast, hydro and nuclear plants, whose output rose 13.5% and 25% respectively in H1 2016, have faced fewer problems from local protectionism.
Despite this, Chinese independent power producers continue to gain market share, with a total of 22 companies placing in the top 250,up from 15 the previous year, asthe government’s adjustments to regulated downstream energy andgas tariffs failed to keep pace with reductions upstream.
Those generating power from imported LNG saw particularly strong gains, as prices of both term contracts and spot imports plummeted.
Although holding up better than oil and gas companies elsewhere, China’s integrated oil and gas companies saw
their rankings slide – both CNOOC and PetroChina dropped out of the top 10 placings in 2016 after a brief spate at the top.
CNOOC – the country’s largest offshore oil and gas company – slipped 18 places as its three year CGR dropped 11.5%, while piped gas major
Top 250 Global Energy Company Rankings
PLATTS TOP 50 COMPANIES 2016 VS. 2015
Platts Platts Rank Rank2016 2015 Company Country Region Industry1 1 Exxon Mobil Corp USA Americas IOG2 41 Korea Electric Power Corp South Korea Asia/Pacific Rim EU3 43 Public JSC Gazprom Russia EMEA IOG4 6 Phillips 66 USA Americas R&M5 8 Valero Energy Corp USA Americas R&M6 13 PJSC LUKOIL Oil Co Russia EMEA IOG7 10 OJSC Rosneft Oil Co Russia EMEA IOG8 14 Reliance Industries Ltd India Asia/Pacific Rim R&M9 12 OJSC Surgutneftegas Russia EMEA IOG10 15 Marathon Petroleum Corp USA Americas R&M11 21 National Grid plc United Kingdom EMEA DU12 26 TOTAL SA France EMEA IOG13 11 China Petroleum & Chemical Corp China Asia/Pacific Rim IOG14 66 Indian Oil Corp Ltd India Asia/Pacific Rim R&M15 18 Enterprise Products Partners LP USA Americas S&T16 5 PetroChina Co Ltd China Asia/Pacific Rim IOG17 2 Chevron Corp USA Americas IOG18 39 Exelon Corp USA Americas EU19 28 NextEra Energy, Inc USA Americas EU20 17 Oil & Natural Gas Corp Ltd India Asia/Pacific Rim E&P21 32 Iberdrola, SA Spain EMEA EU22 4 CNOOC Ltd Hong Kong Asia/Pacific Rim E&P23 35 Southern Co USA Americas EU24 84 Enel SpA Italy EMEA EU25 9 China Shenhua Energy Co Ltd China Asia/Pacific Rim C&CF26 45 Duke Energy Corp USA Americas EU27 44 Huaneng Power International, Inc China Asia/Pacific Rim IPP28 46 Gas Natural SDG, SA Spain EMEA GU29 47 Tesoro Corp USA Americas R&M30 122 Chubu Electric Power Co, Incorporated Japan Asia/Pacific Rim EU31 3 Royal Dutch Shell plc Netherlands EMEA IOG32 42 American Electric Power Co, Inc USA Americas EU33 83 Oil Transporting JSC Transneft Russia EMEA S&T34 30 Sasol Ltd South Africa EMEA IOG35 59 Bharat Petroleum Corp Ltd India Asia/Pacific Rim R&M36 48 Public Service Enterprise Group Inc USA Americas DU37 52 CLP Holdings Ltd Hong Kong Asia/Pacific Rim EU38 38 Coal India Ltd India Asia/Pacific Rim C&CF39 16 Tokyo Electric Power Co Holdings, Incorporated Japan Asia/Pacific Rim EU40 72 Dominion Resources, Inc USA Americas DU41 183 The Kansai Electric Power Co, Incorporated Japan Asia/Pacific Rim EU42 36 Tenaga Nasional Berhad Malaysia Asia/Pacific Rim EU43 88 Energy Transfer Equity, LP USA Americas S&T44 132 Formosa Petrochemical Corp Taiwan Asia/Pacific Rim R&M45 67 Consolidated Edison, Inc USA Americas DU46 56 NTPC Ltd India Asia/Pacific Rim IPP47 74 Tokyo Gas Co Ltd Japan Asia/Pacific Rim GU48 133 Hindustan Petroleum Corp Ltd India Asia/Pacific Rim R&M49 70 Sempra Energy USA Americas DU50 25 Electricite de France SA France EMEA EU

62 Platts Insight Autumn 2016
PetroChina also fell 11 places.
The increased capacity in gas, renewables and nuclear came at the detriment of the coal industry, which saw its lowest share of the energy mix in 2015, although it remained the
dominant fuel in the country at 64%.
India, the second demand powerhouse in Asia, saw its energy consumption rise by 5.2%, surpassing Russia to become the third-largest consumer in the world.
The country saw its consumption of oil increase by over 8% during the year, propelling refi ner Reliance Industries – owner of the biggest refi nery in the world, Jamnagar – into the top 10 for the fi rst time, closely followed by fellow refi ner Indian Oil Corp.
Somewhat unexpectedly, gas consumption in the country declined by 0.1% over 2015, as importers struggled to compete with cheaper coal and free up infrastructure to take delivery of lower LNG spot prices. With more expensive oil-linked LNG term contracts lagging reductions for both spot and competing fuels, LNG consumers exercised downward quantity tolerance on existing contracts, with some even returning to the negotiating table in order to barter for better prices or increased fl exibility around restrictive contract terms.
After prolonged discussion, Qatar’s RasGas agreed to cut the price of its LNG supplies to India’s largest gas importer Petronet LNG Ltd by almost half under its existing 25-year contract, reducing the price to $6-$7/MMBtu rather than the $13/MMBtuagreed previously.
The penalty for taking less-than-contracted volumes over 2015 was also waived by RasGas which appeared to be becoming increasingly fl exible in its offering as it struggled to fi nd homes for all available quantities of LNG.
Consumption of coal rose almost 5% in India, retaining its share as the dominant fuel in the energy mix at 56%. This increased the country’s share of global coal consumption to over 10%, the highest share ever, while domestic production increased 4.7%, curtailing its reliance on exports somewhat.
Top 250 Global Energy Company Rankings
TOP 10 FASTEST GROWING – AMERICAS
Fastest PlattsGrowing 3 Year Top 250Rank Company Name Country Industry CGR % Rank1 Antero Resources Corp USA E&P 81.1 1002 Energy Transfer Equity, LP USA S&T 35.4 433 YPF SA Argentina IOG 32.5 1114 Empresa de Energia de Bogotá SA ESP Colombia GU 29.2 2025 Fortis Inc Canada EU 22.6 1166 NRG Energy, Inc USA IPP 20.3 1827 Companhia Paranaense de Energia - COPEL Brazil EU 20.1 1518 Companhia Energética de Minas Gerais SA Brazil EU 14.6 849 Kinder Morgan, Inc USA S&T 13 10310 Devon Energy Corp USA E&P 12.8 195
TOP 10 FASTEST GROWING – ASIA/PACIFIC RIM
Fastest PlattsGrowing 3 Year Top 250Rank Company Name Country Industry CGR % Rank1 Adani Power Ltd India IPP 54.9 2502 Beijing Jingneng Clean Energy Co, Ltd China IPP 51.2 2073 China Resources Gas Group Ltd Hong Kong GU 31.7 1404 Reliance Power Ltd India IPP 29.3 2475 Guangxi Guiguan Electric Power Co, Ltd China IPP 25.6 1756 Huaneng Renewables Corp Ltd China IPP 22.2 2307 ENN Energy Holdings Ltd China GU 21.2 1458 China Gas Holdings Ltd Hong Kong GU 18.7 1339 Power Grid Corp of India Ltd India EU 17.5 9210 China National Nuclear Power Co, Ltd China IPP 13.9 89
TOP 10 FASTEST GROWING – EMEA
Fastest PlattsGrowing 3 Year Top 250Rank Company Name Country Industry CGR % Rank1 The National Shipping Co of Saudi Arabia Saudi Arabia S&T 44.9 1542 JSC NOVATEK Russia E&P 31.1 693 OJSC Rosneft Oil Co Russia IOG 19 74 Public JSC Inter RAO UES Russia EU 13.1 1125 Public JSC Gazprom Russia IOG 9.2 36 Polskie Gornictwo Naftowe I Gazownictwo SA Poland IOG 8.3 877 PJSC Tatneft Russia E&P 7.6 628 Saudi Electricity Co Saudi Arabia EU 7.2 869 OJSC Surgutneftegas Russia IOG 5.9 910 Rosseti, Public JSC Russia EU 5.5 67

Autumn 2016 Platts Insight 63
Fastest growing Overall energy industry growth rates plummeted in 2015, with three-year compound rates averaging just 0.92%, down from 7.3% in 2014 and 10%in 2013.
Drilling into the data, IPPs were the only players to experience higher average growth on the year, leading the pack with 9.45% three-year CGR. Refi ners came in worse off with an average minus 10.5% compound growth while oil majors and coal producers follow closely in the laggards group with negative average growth.
Shrugging off the oil and gas price collapse, for now at least, Colorado-based shale gas player Antero Resources managed to hold on the top spot for growth a second year after jumping into the Top 50 fastest growing leaderboard last year. Its exposure to low-cost acreage in the Marcellus and Attica shale plays is a testament to how far many US shale drillers have come in slashing costs to ride out lower prices. At 81.1%, its compound growth still outshines all the rest.
But Antero’s stellar growth has not been matched by its North American peers. While the spoils of the shale and oil sands boom saw US and Canadian companies take 60% of last year’s fastest growth list, their numbers have now fallen back sharply. Their positions have, again, been usurped by Asian power producers and utilities enjoying a windfall from lower input costs.
Beijing Jingneng Clean Energy, the Chinese capital’s largest natural gas-fi red power plants developer, leads the Asian utilities making both the Platts rankings and the top growers list for the fi rst time.
Tellingly, only two refi ners, the US’ Western Refi ning and Korea’s GS Holdings, remained on a growth
trajectory last year. GS Holdings is also the only refi nery to make it on the Top 50 fastest growing list with 8.2%
Top 250 Global Energy Company Rankings
50 FASTEST GROWING ENERGY COMPANIES
Fastest PlattsGrowing 3 Year Top 250Rank Company Name Country Industry CGR % Rank1 Antero Resources Corp USA E&P 81.1 1002 Adani Power Ltd India IPP 54.9 2503 Beijing Jingneng Clean Energy Co, Ltd China IPP 51.2 2074 The National Shipping Co of Saudi Arabia Saudi Arabia S&T 44.9 1545 Energy Transfer Equity, LP USA S&T 35.4 436 YPF SA Argentina IOG 32.5 1117 China Resources Gas Group Ltd Hong Kong GU 31.7 1408 JSC NOVATEK Russia E&P 31.1 699 Reliance Power Ltd India IPP 29.3 24710 Empresa de Energia de Bogotá SA ESP Colombia GU 29.2 20211 Guangxi Guiguan Electric Power Co, Ltd China IPP 25.6 17512 Fortis Inc Canada EU 22.6 11613 Huaneng Renewables Corp Ltd China IPP 22.2 23014 ENN Energy Holdings Ltd China GU 21.2 14515 NRG Energy, Inc USA IPP 20.3 18216 Companhia Paranaense de Energia - COPEL Brazil EU 20.1 15117 OJSC Rosneft Oil Co Russia IOG 19 718 China Gas Holdings Ltd Hong Kong GU 18.7 13319 Power Grid Corp of India Ltd India EU 17.5 9220 Companhia Energética de Minas Gerais SA Brazil EU 14.6 8421 China National Nuclear Power Co, Ltd China IPP 13.9 8922 APA Group Australia GU 13.6 18923 Public JSC Inter RAO UES Russia EU 13.1 11224 Kinder Morgan, Inc USA S&T 13 10325 Devon Energy Corp USA E&P 12.8 19526 AGL Energy Ltd Australia DU 12.7 19827 TransCanada Corp Canada S&T 12.2 16928 Ultrapar Participações SA Brazil S&T 12 8529 WEC Energy Group, Inc USA DU 11.8 9130 Guangzhou Development Group Incorporated China IPP 11.7 21931 Inter Pipeline Ltd Canada S&T 11.6 20032 Enbridge Inc Canada S&T 11.1 11333 Aboitiz Power Corp Philippines IPP 11.1 17634 CPFL Energia SA Brazil EU 10.7 18135 Emera Incorporated Canada EU 10.7 19036 Pembina Pipeline Corp Canada S&T 10.6 19737 Huadian Fuxin Energy Corp Ltd China IPP 10.5 20638 Cheung Kong Infrastructure Holdings Ltd Hong Kong EU 10.4 8839 Columbia Pipeline Group, Inc USA S&T 10.1 22840 Duke Energy Corp USA EU 9.8 2641 NHPC Ltd India IPP 9.8 18042 CGN Power Co, Ltd China IPP 9.7 9443 SDIC Power Holdings Co, Ltd China IPP 9.4 9844 Public JSC Gazprom Russia IOG 9.2 345 Southwest Gas Corp USA GU 8.5 24446 Polskie Gornictwo Naftowe I Gazownictwo SA Poland IOG 8.3 8747 Eversource Energy USA EU 8.2 7448 GS Holdings Corp South Korea R&M 8.2 12149 Kunlun Energy Co Ltd Hong Kong E&P 8.1 23550 ITC Holdings Corp USA EU 7.9 240

64 Platts Insight Autumn 2016
three-year CGR.
Asian leaders’ average growth posted a slight gain on the year at 21.9%, with a total of eight independent power producers in China leading the pack. Meanwhile, only two companies placed into the rankings from Europe and the Middle East, highlighting the fl at lining growth in the region.
INDUSTRY SECTORS
Oil and gas
One of the biggest trends for the year has been the impact on the energy sectors most exposed to falling oil and gas price. The oil price downturn has devastated the earnings and profi ts of oil and gas producers while downsizing and the lower price deck has shrunk their asset values. At their expense, gas, power utilities and refi ners have seen their prospects lifted.
Over last three years, global oil majors have seen their standings in the rankings more than halve from a sector average of 41st place to 88th. Industry consolidation has also pared their ranks in recent years and their numbers fell again this year to a new low.
The combined profi ts of the 28 integrated oil and gas companies in the list slumped to $25.73 billion from $139.34 billion the year before, the lowest sector total since the Top250 was launched in 2002.
But the most dramatic shift in fortunes at the sector level last year was for smaller exploration and production companies. Although their average rankings have suffered to a lesser extent than deeper-pocketed majors, upstream companies have seen their
Top 250 Global Energy Company Rankings
RANKINGS BY COUNTRY REPRESENTATION � 2016
Company count by country
1 73
REGIONAL FORTUNES: CHANGE IN THE NUMBER OF COMPANIES REPRESENTED INTHE RANKINGS BY COUNTRY � 2015�2016
Sum of change
-16 5

Autumn 2016 Platts Insight 65
outright showings in the list sink vertiginously.
Compared with the previous year, the number of exploration and production companies has collapsed to make up just 16 positions on the list, down from 42 previously.
While some smaller upstream players hit the wall during the downturn, ongoing price volatility has largely kept fears of widespread industry consolidation at bay. As a result, the lower headcount of the sector in the rankings refl ects more their shrinking in scale compared to other energy players.
North American producers, dominated by success stories from the shale and oil sands boom years, have taken the brunt of the damage. No fewer than 24 US and Canadian fi rms have dropped out of the rankings, the biggest sectorial correction Platts has seen since the rankings began.
With more than 50 North American oil and gas producers fi ling for bankruptcy since early 2015 and more expected this year, the toll on industry standings is hardly surprising. With US onshore production costs continuing to average above $40/b, the sector is likely to feel more pain this year.
In terms of the Top 250, the list of casualties this year includes Encana Corp, Noble Energy, Murphy Oil and Concho Resources.
In Asia-Pacifi c, Australia’s second-largest oil and gas producer Woodside Petroleum plummeted down the ranking list, sliding 160 places to 210th, as sales dropped despite increased output of both oil and gas at one of its largest fi elds.
The company also fi nally scrapped plans to develop a fl oating LNG liquefaction facility in the Browse basin, citing the low price gas environment that is making the investment – estimated around $40 billion – look increasingly unappealing.
The move raised questions over the viability of numerous other large LNG projects waiting to be developed, including ventures in Australia, Canada and Mozambique, with delays adding to budgets. Around 110.7 million mt of LNG facilities was slated to reach fi nal investment decision in 2016, according to Platts data, with estimates suggesting that only a tenth of the volume would likely come on stream between 2018 and 2023. The LNG industry has already entered a period of surplus and has a long list of projects under construction on which it is too late to turn back. The wave of new LNG supply from projects in Papua New Guinea, Australia and – at the beginning of the year – the fi rst cargoes from the US sent LNG delivered into Japan and South Korea to the lowest levels since May 2009 in Q2 2016, as demand for gas among Asian utilities faltered.
Despite this, global LNG trade grew by 2.5% in 2015, with most of the growth coming from the Middle East – which looks set to become a net importer while prices are so low – and Europe, following a reduction in re-exports.
Refi ning and marketing
For years, overcapacity and tougher fuel quality laws have depressed refi ning margins and forced some industry players to bring down the shutters or convert to storage.
But in 2015 global refi nery utilization
rose by 1 percentage point to 82.1%, the fastest increase in fi ve years, according to BP’s statistical review. In the OECD alone, crude runs increased by 1 million b/d, with growth in Europe the highest since 1986.
Despite a sharp fall in during fourth quarter, the recovery was assisted by higher average refi ning margins over the year pulled up by stronger global gasoline demand. Margins began improving in the second half of 2014 on sliding crude prices, but retained their strength even after benchmark crude values recovered some ground. Benchmark Medium Sour Coking margins in the US Gulf Coast hit eight-year highs at over $16/b before slipping at year-end while hydrocracking margins in Singapore remained more resilient.
As a sector, refi ners have improved their standing this year with fi ve more players in their ranks. The sector’s overall average placement has also risen to average 100th this year, the highest since 2006. Refi ners also dominated the list of top movers in the rankings year-on-year. Indian Oil Corp surged to 14th overall, up from 52nd last year while Taiwan’s Formosa Petrochemicals jumped 88 places to 44th.
In the US HollyFrontier’s (up 79 places to 71st) mid-continent plants were better placed to capture the improvement in margins while in Europe Poland’s PKN Orlen also got a boost from cheaper crude storming the list at 58th overall.
Regionally, Asian refi ners continue to dominate the sectors helped by the sheer scale of their energy-hungry domestic markets and healthy demand for oil products. In terms of numbers,
Top 250 Global Energy Company Rankings

66 Platts Insight Autumn 2016
US refi ners are catching up with 10 placings in the list this year, only three behind their counterparts in Asia.
But many US refi ners have now largely lost the fi llip of access to cheap shale oil which had propelled their earnings in recent years. The differential between Brent and the US benchmark WTI continued to narrow in 2014 reaching its smallest level since 2010 at $3.68/b. Two years before, the average Brent-WTI spread was a whopping $19/b. The loss of exposure to discounted crude plays out in the rankings with the American region refi ners seeing their average sector standing slide back to levels last seen in 2012.
In Asia and Europe, the refi ning sectors fared much better. Overall the two regions saw their participants hold the highest average position since 2006.
The improvement across the sector year-on-year only tells half the story, however. By sector, refi ners and marketers are still being hamstrung by overcapacity and remain the laggards when it comes to growth. Averaging minus 10.5% three-year CGR, the sector sits fi rmly at the bottom of the growth pack for the global energy sector.
Storage and transport
Global midstream companies continued to grow in 2015, but that growth was moderate compared with this year.
Many midstream companies have worked to limit their exposure to prices using fi xed-fee contracts and hedges in areas where they have price exposure. As a result, their cash fl ow is more dependent on volumes than on the price of the underlying commodity values. Some, such as the US’ Enterprise
Top 250 Global Energy Company Rankings
BIGGEST MOVERS – UP
Platts Platts Rank Rank 2016 2015 UP Company Name Country Region14 66 52 Indian Oil Corp Ltd India Asia/Pacific Rim24 84 60 Enel SpA Italy EMEA30 122 92 Chubu Electric Power Co, Japan Asia/Pacific Rim Incorporated 41 183 142 The Kansai Electric Power Co, Japan Asia/Pacific Rim Incorporated 44 132 88 Formosa Petrochemical Corp Taiwan Asia/Pacific Rim48 133 85 Hindustan Petroleum Corp Ltd India Asia/Pacific Rim55 191 136 SK Innovation Co, Ltd South Korea Asia/Pacific Rim58 251 193 Polski Koncern Naftowy Poland EMEA ORLEN SA 67 210 143 Rosseti, Public JSC Russia EMEA71 150 79 HollyFrontier Corp USA Americas73 220 147 Kyushu Electric Power Co, Japan Asia/Pacific Rim Incorporated 76 141 65 FirstEnergy Corp USA Americas77 131 54 Veolia Environnement SA France EMEA79 252 173 S-Oil Corp South Korea Asia/Pacific Rim83 248 165 Neste Oyj Finland EMEA100 153 53 Antero Resources Corp USA Americas105 161 56 Petróleo Brasileiro SA – Brazil Americas Petrobras 110 202 92 EnBW Energie Baden – Germany EMEA Wuerttemberg AG 112 207 95 Public JSC Inter RAO UES Russia EMEA114 166 52 E.ON SE Germany EMEA
BIGGEST MOVERS – DOWN
Platts Platts Rank Rank 2016 2015 DOWN Company Name Country Region99 29 70 BP p.l.c. United Kingdom EMEA108 33 75 ENGIE SA France EMEA111 55 56 YPF SA Argentina Americas117 27 90 Statoil ASA Norway EMEA118 54 64 Eni SpA Italy EMEA120 24 96 RWE AG Germany EMEA123 65 58 Repsol, SA Spain EMEA129 7 122 ConocoPhillips USA Americas139 23 116 Suncor Energy Inc Canada Americas147 76 71 Entergy Corp USA Americas163 19 144 Ecopetrol SA Colombia Americas166 20 146 Canadian Natural Resources Ltd Canada Americas168 81 87 Calpine Corp USA Americas169 82 87 TransCanada Corp Canada Americas170 98 72 Spectra Energy Corp USA Americas173 60 113 Williams Companies, Inc USA Americas178 117 61 ONEOK Partners, LP USA Americas191 128 63 NiSource Inc USA Americas195 51 144 Devon Energy Corp USA Americas196 62 134 Husky Energy Inc Canada Americas198 130 68 AGL Energy Ltd Australia Asia/Pacific Rim

Autumn 2016 Platts Insight 67
Product Partners and Plains All American also have oil trading operations to fall back on.
By average rank, the sector slipped 14 places to 144th overall but midstream companies continued to increasetheir numbers.
Despite a strong start to the year, US master limited partnerships (MLPs) had a rocky second half of the year, with price decreases reversing a signifi cant amount of the prior year’s growth. The MLP market also continued to be impacted by merger activity.
Kinder Morgan, North America’s largest owner of pipelines and a bellwether for the US oil and gas industry, suffered from lower US oil production, which kicked into reverse last year. Although its earnings held up reasonably well in 2015, it was exposed to lower oil prices as it has some producing assets in Texas. As a result, cash fl ow thinned and investors became jittery over its ability to fi nance its $43 billion debt pile. Kinder Morgan’s market valuefell over 60% in 2015 and the company ultimately slashed its dividend to preserve cash. The company’s Top 250 ranking has fallen from 86th to 103th.
Regionally, midstream industry showings have been dominated by US and Canadian players in recent years and little has changed. Only two of the top 10 storage and transport companies – Russian Transneft and Brazil’s Ultrapar – were based outside North America. Enterprise Products Partners and Energy Transfer Equity continuedto lead the sector globally as the highest ranked US midstream players.
In the Middle East, a notable newcomer to the rankings is The National Shipping
Co of Saudi Arabia, the world’s second-largest VLCC owner. At 154th overall and enjoying an impressive 45% three-year CGR, the Saudi tanker company known as Bahri expanded its VLCC fl eet further last year with the merger of Vela Marine.
Utilities,gas utilities, coalWeak fossil fuel prices have buoyed margins across energy suppliers, network operators and power generators globally in 2016, with many posting a stronger showing in the 2016 Top 250, sweeping a total of 146 places, up from 126 in 2015.
All 10 of the highest-placed electricity and gas utilities have climbed the Top 250 rankings this year versus 2015, highlighting the growth in revenue and profi ts particularly, although several Asian utilities were undoubtedly the clear benefactors owing to lower input costs and largely regulated downstream prices.
South Korea’s Korea Electric Power Corp, or Kepco, was catapulted into second place, up from 41st in 2015 as the integrated utility reaped the benefi ts of a steep drop in fossil fuel prices and saw a bounce in revenues owing to its high reliance on nuclear capacity.
The company manages fi ve power generation companies and is the country’s sole nuclear power provider, and has a monopoly on power sales, transmission and distribution.
Kepco generated over 80% of the country’s power in 2015, increasing margins as operating rates of gas-fi red plants dropped owing to high LNG import costs. As such, gas-fi red
generation supplied by private companies could not competeagainst coal and nuclear supplied through Kepco.
Coal-fi red plants accounted for 44%of Kepco’s total electricity generation, which was slightly down on the yearas nuclear had increased.
State-run Korea Gas Corp., which has a monopoly on domestic natural gas sales, said its LNG sales to power generators have been sharply decreasing due to the increasing use of relatively cheaper coal as well as weak demand due to the country’s economic slowdown and moderate temperatures.
South Korea has been attempting to aggressively minimize fuel costs, cutting gas-fi red generation considerably in favor of cheaper nuclear and coal generation as, despite falls towards the end of the year, LNG contract prices have largely lagged the signifi cant declines in crude and other commodities, owing to the oil-link pricing formula.
At its peak, power generation costs using LNG were around Won 140-170/kWh ($0.13-0.15/kWh), which was considerably higher than the Won 35-45 for coal, and nuclear at Won 3-4.
“The fi rst principle in our energy mix for power production is to minimize costs because South Korea imports almost all of its energy requirements,” Executive Vice President Park Jung-Keun had told Platts earlier in the year. “As we have to import all sources for power generation such as coal, gas and oil, what matters most to us is mixing of the sources in the most effi cient manner, and the effi ciency means cost reduction to us,” he said, adding that the company has
Top 250 Global Energy Company Rankings

68 Platts Insight Autumn 2016
reduced the share of oil and LNG in the past few years.
Electricity reserves in the country had been on the rise, moving above 20%, as nuclear reactors restarted after safety checks, while the country’s power demand remained sluggish due to a slowing economy.
Similar trends were noted in Japan, where one or two utilities also benefi tted from the return of nuclear generation in conjunction with lower hydro-carbon prices and reduced more-costly LNG imports. A combination of slow economic growth, energy conservation and mild weather conditions also curbed appetite for energy in the country.
Japan’s second largest power producer Kansai Electric rocketed 142 places up the ratings list following the restart of nuclear reactors at Sendai, although the utility was struggling to maintain market share against Osaka Gas and other power providers as requests to restart units at Takahama nuclear plant – which would lower its power rates considerably – were overturned.
Not all utilities were able to capitalize on the lower prices however. Tokyo Electric Power dropped back 23 places in the ratings as it struggled to manage its procurement plan, with large gaps appearing in its planned and actual monthly consumption volume. The overhang was exacerbated by a combined 3.1 GW of operable oil-fi red capacity which dropped out early in the year, resulting in the company having to carry over contract volumes to fi scal 2015-16, despite aims to move to purchasing cheaper spot cargoes, a source close to the matter said.
In Europe, lower input costs have seen a relatively stronger showing from power generators, gas utilities and network operators, although there was a clear division between those companies in deregulated markets and those with centralized tariffs.
Utilities in southern Europe – where power and gas prices are widely regulated – showed the largest gains over the year, with Italy’s ENEL rising 60 places to rank in the top 25 companies on its predictable wholesale price. Also among the biggest winners were Spain’s Iberdrola, Gas Natural and Portugal’s GALP.
Utilities in the northern half of Europe, also faired reasonably well, with the UK’s Centrica rising up the list on stronger profi ts, while Germany’s E.On and EnBW showed a strong performance, largely on renewable generation, moving both up the rankings by more than 50 places.
E.On had gained by spinning off its fossil fuel assets into a subsidiary Uniper, earlier this year, but the company still faces signifi cant headwinds from record low wholesale electricity prices and its planned phase-out of six nuclear reactorsby 2022.
French energy generator Engie (formally GDF Suez) plummeted 75 places in the rankings to 108th place, as the company struggled to rebound from a nearly $5bn revenue drop off last year. Following in E.On’s lead, Engie has taken steps to separate out its fossil fuel activity and concentrate on low-carbon activity.
While feed-in tariffs had offset some of the pain of record-low power prices at German utilities, this growing infl uence
of renewables could be felt in other sectors, as the unpredictable nature of generation continued to disrupt planning and procurement and sent power prices into negative territory more frequently than in previous years.
Ongoing tough environmental legislation, particularly in Europe, continues to fuel the renewables boom which is spreading as technologies develop. This accounted for the leap in generation of over 15% in 2015, bringing the total to more than 213 TWh, which was around the equivalent to the increase in power generation globally, according to fi gures from BP’s Statistical Review.
Outside of renewables, gas showed the second strongest increase in consumption, as utilities switched their fuel sources in order to benefi t from historic low prices. Gas use registered gains of nearly 5% to reach 22% of the fuel mix, which in turn bolstered profi ts at infrastructure providers such as National grid in the UK and Spain’s Enagas, both of which climbed the rankings in 2016.
Coal
Wins for the gas, nuclear and renewable sector largely came at the expenseof the global coal industry, which continued to witness signifi cant structural and fundamental shifts over 2015 as suppliers – particularly in China and the US – worked to redress the overhang in supply.
Coal’s share of global energy consumption was down to just under 30% in 2015, the lowest share since 2005, according to the latest fi gures from BP, as consumers cut their offtake in order to achieve climate change
Top 250 Global Energy Company Rankings

Autumn 2016 Platts Insight 69
and environmental objectives across the globe.
Only fi ve coal and consumable fuels companies made the Top 250 ranking in 2016 (down from seven in 2015), the majority of which were Chinese, where coal use had declined by 1.5% in 2015 although it continued to dominate the energy mix at 64%. While this may be high by international standards, coal had accounted for an even higher 73.4% as recently as 2005.
China has implemented protectionist measures to guard its domestic coal mining sector, triggering a decline in imports that has exacerbated theglobal glut.
1.627 billion mt of coal was produced in China in fi rst-half 2016, falling 9.7% year-on-year, even as coal stockpiles grew. The fall led the National Development and Reform Commission to say that 280 million mt out of the 4.2 billion mt of national coal mine capacity must close by end-2016 in order to rebalance the market.
Also weighing on margins was the radical shift towards goods and services rather than manufacturing and heavy industry that has defi ned the Chinese
economy for the past several years, resulting in less demand for electricity.
In 2015, year-on-year electricity demand grew by a puny 0.5% to 5,550 TWh, while GDP rose 6.9%, with manufacturing’s electricity use rising only 0.5% year-on-year, while the service sector’s power requirements increased by 9.2%.
The impact of these trends is apparent on miner-to-power generator China Shenhua Energy, which sank 16 places on the Platts Top 250 in 2016.
However, the company still placed 25th on the ranking as coal prices slipped to under $60/mt at the Qinhuangdao hub, while state-set tariffs were slow to follow prices down, making plants more profi table for their owners, although the on-grid tariffs were cut in January 2016.
One of China’s largest listed coal-fi red generators, Huaneng Power International appeared to have reaped the benefi ts of this, climbing from 44th place to 27th in 2016, as revenues and profi ts surged.
However, 2016 fi rst-half resultsfrom the company revealed that its generation fell 8.60% year-on-year
to 146.08 TWh, with the second quarter registering a decline of 10.43%year-on-year.
HPI attributed the decline in its predominantly coal-fi red output to the “sluggish growth in power consumption and decrease in utilization hours” of power plants across the country. It also blamed “the substantial increase of cross-regional power transmission [which] squeezed the generation potential of the coal-fi red power generators in the coastal areas in the east and south of the country ... which accounted for a relatively high proportion in the company’s total power generation capacities.”
In addition, HPI outlined that “heavy rainfall in the fi rst half of the year [meant] the power generation of nationwide large-scale hydro power plants increased by 16.7%, compared to the same period of last year, which reduced the output of coal-fi red power plants located in the middle and eastof China.”
Meanwhile, on the nuclear front, “the release of the 2015 newly installed capacity in Liaoning, Guangdong and Fujian, combined with the commencement of operations of new nuclear power generators in Guangdong and Guangxi in 2016, had a negative impact on the output of coal-fi red power units in these regions.”
Elsewhere, consumption of coal in the US – still one of the largest demand centers – declined more than 12% in 2015, while output was scaled back by more than 10%. Low prices both domestically and in the export market resulted in a total of six US fi rms fi ling for bankruptcy over 2015 alone.
The latest casualty was the US’ largest
Top 250 Global Energy Company Rankings
AVERAGE GROWTH RATES BY SECTOR AND REGION
-15 -10 -5 0 5 10 15 20
Storage and Transportation
Refining and Marketing
Exploration and Production
Multi-Utilities
Integrated Oil and Gas
Independent Power Producers
Gas Utilities
Electric Utilities
Coal
(avg. 3-yr CGR %)
Americas
Asia/Pacific Rim
EMEA

miner Peabody which fi led for Chapter 11 protection for most of its US assets in Q2 2016, although the company’s Australian operations would be unaffected.
Slowing output was also evident from major supplier Indonesia – down 14% year on year – with PT Adaro Energy just clinging to 249th place in the Top 250 listing.
Overall, global coal consumption fell by 1.8% in 2015, as many took signifi cant steps to curtail coal burn. Coal prices slipped by an average of 30% as a result in 2015, with some of the largest falls registered in Western Europe.
Despite profi table books, several Europe-based coal traders were looking to exit the sector, citing the move towards sustainable energy, including French utility EDF and Swedish state-owned Vattenfall. Coal consumption declined by 1.8% in Europe to reach the
lowest levels since 1965, according to BP, with UK electricity generation from coal hitting zero for up to 12 hours several times in May, when more than half of the county’s coal capacity was out of action for planned maintenance.
Clean power from solar and wind also supplied almost all of Germany’s demand for the fi rst time in May, meeting 45.5 GW of the 45.8 GW demand, causing power prices to turn negative.
Producers traditionally supplying the European market suffered the fallout, with South Africa’s Anglo American unveiling a plan to shrink its assetsheld in Australia, South Africa and Colombia by up to two thirds after writing down signifi cant losses inthe last fi nancial year.
The only apparent bright spot for coal demand was India, where consumption
rose almost 5%, retaining its share as the dominant fuel in the energy mix at 56%. This increased the country’s share of global coal consumption to over 10%, the highest share ever, while domestic production increased 4.7%, curtailing its reliance on exports somewhat.
The strong performance of the coal industry enabled the largest pure coal mining company in the world Coal India to hold its place at number 38 on the rankings list.
The state-owned miner’s challenge remains keeping up with strong internal demand and hitting the coal ministry’s ambitious extraction targets, particularly given the renewed focus on self-suffi ciency. Should the Indian government achieve its aims to cut imports entirely by 2020, the global supply glut is likely to worsen.
Top 250 Methodology
This annual survey of global energy companies by S&P Global Platts measures companies’ fi nancial performance using four key metrics: asset worth, revenues, profi ts, and return on invested capital.
All companies on the list haveassets greater than US $5 billion.The fundamental and market data comes from a database compiledand maintained by S&P GlobalMarket Intelligence.
Energy companies were grouped according to their Global Industry Classifi cation Standard (GICS) code. Each company is assignedto an industry according to the
defi nition of its principal business activity. (Source of GICS Industry Classifi cation: S&P Global and MSCI)
Because the survey is global, and because all countries do not share a common fi nancial reporting standard, the information presented is for each company’s most current reporting period. Since then, material changes to a company’s fi nancial health may have occurred. Data for U.S. companies came from Securitiesand Exchange Commission (SEC) Form 10K.
The company rankings are derived using a special Platts formula. We added each company’s numerical
ranking for asset worth, revenues, profi ts, and ROIC and assigned a rank of 1 to the company with the lowest total, 2 to the company with the second-lowest total, and so on.
Finally, ROIC fi gures-widely regarded as a driver of cash fl ow and value-were calculated using the following equation: ROIC = [(Income before extraordinary items) - (Available for common stock)] ÷ (Total invested capital) x 100 where “Income before extraordinary items” is net income less preferred dividends and “Total invested capital” is the sum of total debt, preferred stock (value), noncontrolling interest, and total common equity.
Top 250 Global Energy Company Rankings

Category Right
Autumn 2016 Platts Insight 71

Energy powers our world, it enriches our lives.Korean artist Mina Cheon uses energy as an inspiration for her art.It fuels her imagination.RasGas provides clean, reliable energy for Qatar and the world.Energy for Life.
“The light and energy of Seoul ignites great ideas.”Mina Cheon - Artist
ENERGYfor life
South Korea