sovereign bancorp, inc. analyst presentation july 19, 2005
TRANSCRIPT

Sovereign Bancorp, Inc.
Analyst Presentation
July 19, 2005

2
Agenda
Overview of Sovereign’s Strategies and Performance
Shareholder Value and Corporate Governance
Improving Performance and Strong Operating/Cash Earnings Growth
Capital Allocation Discipline
Comparison to Top 50 Banks and Management’s Priorities
Summary and What to Expect From Sovereign

3
Forward Looking Statement This presentation contains statements of Sovereign’s vision, mission, strategies, goals, beliefs, plans, objectives,
expectations, anticipations, estimates, intentions, financial condition, results of operation, estimates of future operating results for Sovereign Bancorp, Inc. as well as estimates of financial condition, operating efficiencies, revenue creation and shareholder value.
These statements and estimates constitute forward-looking statements (within the meaning of the Private Securities Litigation Reform Act of 1995) which involve significant risks and uncertainties. Actual results may differ materially from the results discussed in these forward-looking statements.
Factors that might cause such a difference include, but are not limited to: general economic conditions; changes in interest rates; inflation; deposit flows; loan demand; real estate values; competition; changes in accounting principles, policies, or guidelines; integration of acquired assets, liabilities, customers, systems and management personnel into Sovereign’s operations and the ability to realize the related revenue synergies and cost savings within expected time frames; possibility that expected merger-related charges are materially greater than forecasted or that final purchase price allocations based on fair value of the acquired assets and liabilities at acquisition date and related adjustments to yield and/or amortization of the acquired assets and liabilities are materially different from those forecasted; deposit attrition, customer loss, revenue loss and business disruption following Sovereign’s acquisitions, including adverse effects on relationships with employees may be greater than expected; anticipated acquisitions may not close on the expected closing date or it may not close; the conditions to closing anticipated acquisitions, including stockholder and regulatory approvals, may not be satisfied; Sovereign’s timely development of competitive new products and services in a changing environment and the acceptance of such products and services by customers; the willingness of customers to substitute competitors’ products and services and vice versa; the ability of Sovereign and its third party processing and related systems on a timely and acceptable basis and within projected cost estimates; the impact of changes in financial services policies, laws and regulations, including laws, regulations, policies and practices concerning taxes, banking, capital, liquidity, proper accounting treatment, securities and insurance, and the application thereof by regulatory bodies and the impact of changes in and interpretation of generally accepted accounting principles: technological changes; changes in consumer spending and saving habits; unanticipated regulatory or judicial proceedings; changes in asset quality; employee retention; reserve adequacy; changes in legislation or regulation or policy or the application thereof; and other economic, competitive, governmental, regulatory, and technological factors affecting the Company’s operations, pricing, products and services.
Sovereign Bancorp is followed by several market analysts. Please note that any opinions, estimates, forecasts, or predictions regarding Sovereign Bancorp’s performance or recommendations regarding Sovereign’s securities made by these analysts are theirs alone and do not represent opinions, estimates, forecasts, predictions or recommendations of Sovereign Bancorp or its management. Sovereign Bancorp does not by its reference to any analyst opinions, estimates, forecasts regarding Sovereign’s performance or recommendations regarding Sovereign’s securities imply Sovereign’s endorsement of or concurrence with such information, conclusions or recommendations.

4
Non-GAAP Financial Measures
This report contains Financial information determined by methods other than in accordance with U.S. Generally Accepted Accounting Principles (“GAAP”). Sovereign’s management uses the non-GAAP measures of Operating/Cash Earnings, and the related per share amounts, in its analysis of the company's performance. These measures, as used by Sovereign, adjust net income determined in accordance with GAAP to exclude the effects of special items, including significant gains or losses that are unusual in nature or are associated with acquiring or integrating businesses, and certain non-cash charges. Operating/Cash Earnings represent net income adjusted for after-tax effects of merger-related and integration charges, other various non-recurring charges and the amortization of intangible assets. Since certain of these items and their impact on Sovereign’s performance are difficult to predict, management believes presentations of financial measures excluding the impact of these items provide useful supplemental information in evaluating the operating results of Sovereign’s core businesses. These disclosures should not be viewed as a substitute for net income determined in accordance with GAAP, nor are they necessarily comparable to non-GAAP performance measures that may be presented by other companies.

Overview of Sovereign
6
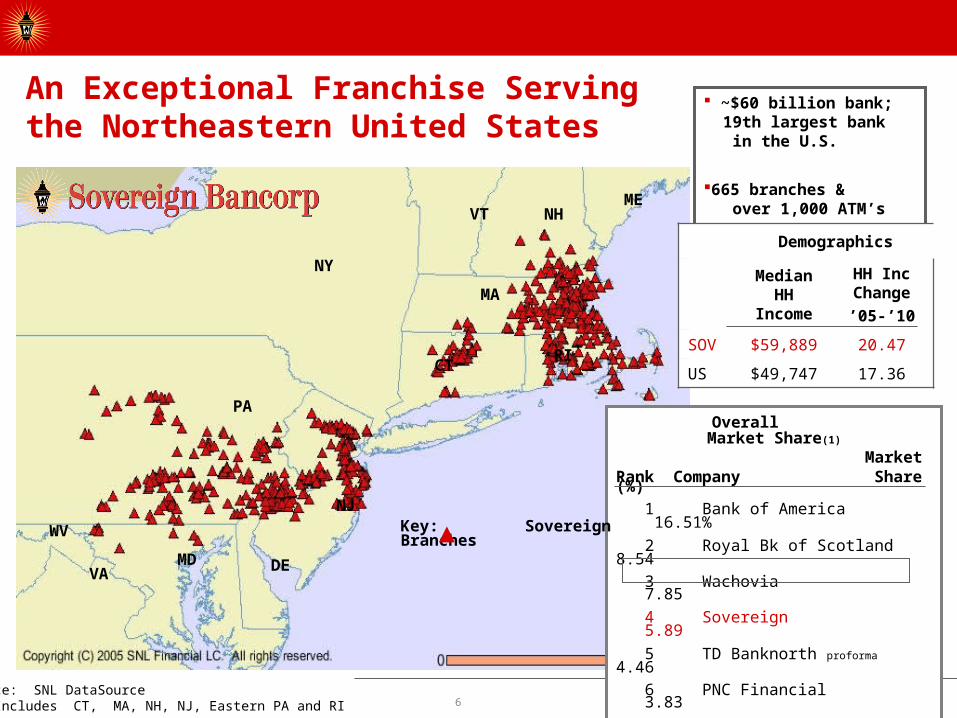
Overall Market Share(1)
MarketRank Company Share (%) 1 Bank of America 16.51%
2 Royal Bk of Scotland 8.54 3 Wachovia 7.85 4 Sovereign 5.89
5 TD Banknorth proforma 4.46 6 PNC Financial 3.83 7 Commerce 3.07
An Exceptional Franchise Servingthe Northeastern United States
Key: Sovereign Branches
~$60 billion bank; 19th largest bank in the U.S.
665 branches & over 1,000 ATM’s
PA
NH
DE
WV
VAMD
RICT
NY
NJ
VTME
MA
Demographics
Median HH
Income
HH Inc Change’05-’10
SOV $59,889 20.47
US $49,747 17.36
Source: SNL DataSource(1) Includes CT, MA, NH, NJ, Eastern PA and RI

7
Mission
When consumers and businesses think of a World Class financial services provider, they choose Sovereign
Vision
Sovereign is a World Class financial services provider, committed to helping our customers succeed by understanding and anticipating their individual financial needs and providing customized solutions, resulting in each customer having six or more services with Sovereign

8
Sovereign’s Business Strategy
Combining the best of a large bank with the best of a smaller community bank.Best of a Large Bank:
–Products and services–Technology–Brand–Delivery channels and distribution system–Talent–Diversification–Sophistication of risk management
Best of a Small Bank:–Flat structure–Local decision making–Cross functional lines to deliver bank to customer–Treat customers as “individuals”–Active community involvement culture

9
Summary of Sovereign’s Business Model
Target attractive markets (growth opportunities, market insight)
Community banking delivery model in all markets, effective 1/1/05 10 local markets, each with a Market CEO Local decision making by experienced
commercial bankers
Consumer banking emphasizes convenience and customer service Many markets offer 7 day banking Appointment banking 24/7/365 phone and internet availability Guaranteed minimum customer service
standards/”Red Carpet” service
Best-in-class customer/product makeup Full product suite Customer mapping/segmentation Targeting 6+ services sold/used
Extremely attractive franchise in one of the most desired geographic markets in the world
Consistent growth in operating/cash earnings, improving operating metrics and high internal generation of capital

10
Local Market Tactics
Presidents calling on small/medium sized businesses
Small community banking, commercial real estate and C&I focus
Courier pick-up service for small businesses
Localized banking for consumers
Localized marketing compliments bank-wide brand advertising
Free checking for consumers, businesses and not-for-profit organizations
Free bill pay
Local market private banking services
Sales results are monitored on a daily basis
11
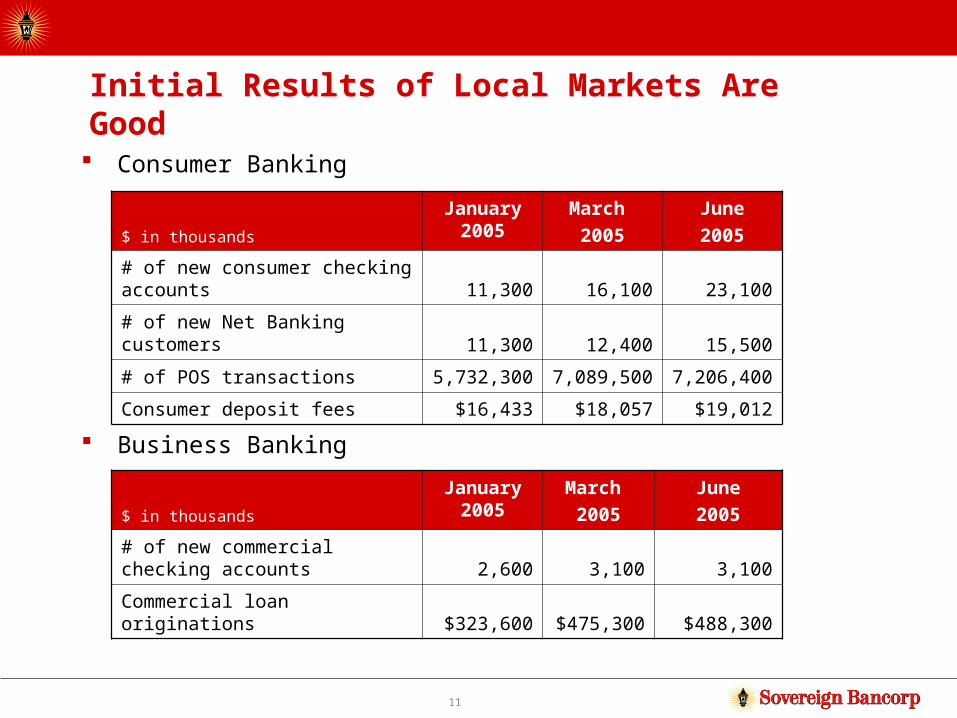
Initial Results of Local Markets Are Good
Consumer Banking
Business Banking
$ in thousands
January 2005
March 2005
June2005
# of new consumer checking accounts 11,300 16,100 23,100
# of new Net Banking customers 11,300 12,400 15,500
# of POS transactions 5,732,300 7,089,500 7,206,400
Consumer deposit fees $16,433 $18,057 $19,012
$ in thousands
January 2005
March 2005
June2005
# of new commercial checking accounts 2,600 3,100 3,100
Commercial loan originations $323,600 $475,300 $488,300

12
Emphasis on Teamwork and Continuous Improvement Culture

13
Team Members Continuously Involved in Improving Operations
Revenue: Make good loans with good margins + Interest Income Hold A grade investment securities + Interest Income Sell other financial services + Fee Income Collect fees for deposits, cash mgmt, loans, capital markets, precious metals, etc. + Fee IncomeMistakes: Bad loans - Provision/Charge-offs Bad checks, fraud, poor reconcilements, etc. - LossesDeposit Sales: Core and other deposits - Interest ExpenseWe Invest in People - Salary/BenefitsOur People Need Systems, Space, Computers, etc. - Operating ExpensePay Uncle Sam - Tax Expense
OUR GOAL – Net income growth of 10% - 15% a year NET INCOME
EPS (Net income divided by number of shares) EPS=
How We Make Money

Shareholder Value and Corporate Governance

15
Above Average Shareholder Value Creation
6/30/05 closing price of $22.34
3-Year Stock Price Performance
60%
80%
100%
120%
140%
160%
180%
Jun-2002 Dec-2002 Jun-2003 Dec-2003 Jun-2004 Dec-2004 Jun-2005
Daily from 30-Jun-2002 to 30-Jun-2005
Ind
exed
Pri
ces
Sovereign Bancorp S&P 500 Banks S&P 500 Dow Jones
49.4 %
16.5 %
20.4 %
11.2 %
% Appreciation

16
Above Average Shareholder Value Creation
6/30/05 closing price of $22.34
5-Year Stock Price Performance
0%
50%
100%
150%
200%
250%
300%
350%
400%
Jun-2000 Jun-2001 Jun-2002 Jun-2003 Jun-2004 Jun-2005
Daily from 30-Jun-2000 to 30-Jun-2005
Ind
ex
ed
Pri
ce
s
Sovereign Bancorp S&P 500 Banks S&P 500 Dow Jones
217.7 %
55.2 %
(18.1)%
(1.7)%
% Appreciation

17
Above Average Shareholder Value Creation
6/30/05 closing price of $22.34
10-Year Stock Price Performance
0%
50%
100%
150%
200%
250%
300%
350%
400%
450%
Jun-1995 Jun-1997 Jun-1999 Jun-2001 Jun-2003 Jun-2005
Daily from 30-Jun-1995 to 30-Jun-2005
Ind
ex
ed
Pri
ce
s
Sovereign Bancorp S&P 500 Banks S&P 500 Dow Jones
264.1 %
183.2 %
119.9 %
126.1 %
% Appreciation

18
Insider Ownership and Buys Last Twelve Months
8.07%
Insider Ownership*as of March 1, 2005
* Includes non-vested and vested stock options and restricted stock. See 2005 Proxy Statement for further details.
Insider Buys in Last Twelve Months (1)
Date of Purchase Insider
# of Shares
8/10/04 Lynch 5,000
4/25/05 Campanelli 10,000
5/12/05 Lynch 3,000
5/16/05 Sidhu 20,000
5/16/05 Sidhu 1,650
(1) As disclosed in accordance with Form 4 filings with the SEC

19
Strong Corporate Governance
Sovereign’s Corporate Governance Quotient* is better than 97.6% of bank companies as ranked by Institutional Shareholder Services
Goal is to always remain in top quartile of bank companies
Source: Yahoo Finance CGQ provided byInstitutional Shareholder Services (ISS) as of 7/1/05*ISS is currently in the process of revising their ratings methodology

Improving Performance and Strong Operating/Cash
Earnings Growth

21
Stronger Balance Sheet
2002 2003 2004 1Q05 2Q05
Residential Loans Consumer LoansCommercial Loans
2002 2003 2004 1Q05 2Q05
Checking SavingsMoney Market CD's
$36.7
$32.6
$27.3$26.9
$40.3
$36.6
$26.1
$23.2
25.6% CAGR
Diverse Loan Mix
12.4% CAGR
Attractive Low-Cost Deposit Base
$41.3
$36.1
Source: period-end balances presented in company financials

22
Improved Quality of Balance Sheet
28.7% 29.0%21.2% 19.6% 19.4%
11.0% 11.7%
15.6% 16.6% 16.7%
21.5% 23.0% 26.2% 25.8% 25.3%
26.1% 25.4% 25.5% 26.1% 27.0%
2002 2003 2004 1Q05 2Q05
Commercial
Consumer
ResidentialMortgageInvestments
Commercial and Consumer Loans are Increasing as a Percentage of Total Assets, Reducing Reliance on the Investment Portfolio
Comm’l & ConsumerLoan Yld: 5.61%NCO’s: .25%Net Loan Yld: 5.36%
Net Yld onInvestments: 5.06%Residential: 5.20%
Source: period-end balances presented in company financials

23
Balance Sheet Has Been Gradually Delevered
29.0%
21.2%19.6%
28.7%
19.4%
2002 2003 2004 1Q05 2Q05
Significant Improvement Has Been Made in Reducing Investment Securities as a Percentage of Total Assets
Source: period-end balances presented in company financials

24
Positive Operating Leverage
51.67%
49.22%
50.44%
48.36% 48.67%
50.10%
1Q04 2Q04 3Q04 4Q04 1Q05 2Q05
Results in Continued Improvement in Efficiency Ratio
2Q05 2Q04 % Change
Total Revenue $562 $456 23%
G&A Expenses $273 $225 22%
Operating Leverage 1.1x
Efficiency ratio equals G&A expenses as a percentage of total revenue, defined as the sum of net interest income and total fees and other income before securities transactions
25
$0
$100
$200
$300
$400
$500
$600
$700
2002 2003 2004
Net
Incom
e
$0.00
$0.20
$0.40
$0.60
$0.80
$1.00
$1.20
$1.40
$1.60
$1.80
$2.00
Earn
ings p
er
Share
Net Income Operating/Cash Net IncomeGAAP EPS Operating/Cash EPS
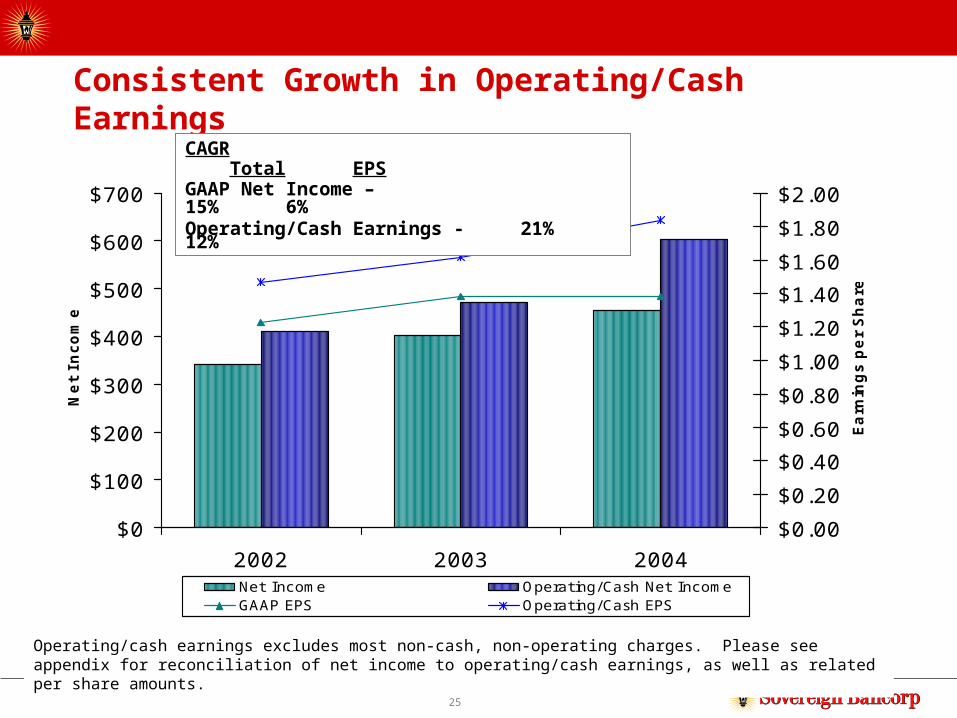
Consistent Growth in Operating/Cash Earnings
CAGR Total EPSGAAP Net Income – 15% 6%Operating/Cash Earnings - 21% 12%
Operating/cash earnings excludes most non-cash, non-operating charges. Please see appendix for reconciliation of net income to operating/cash earnings, as well as related per share amounts.
26
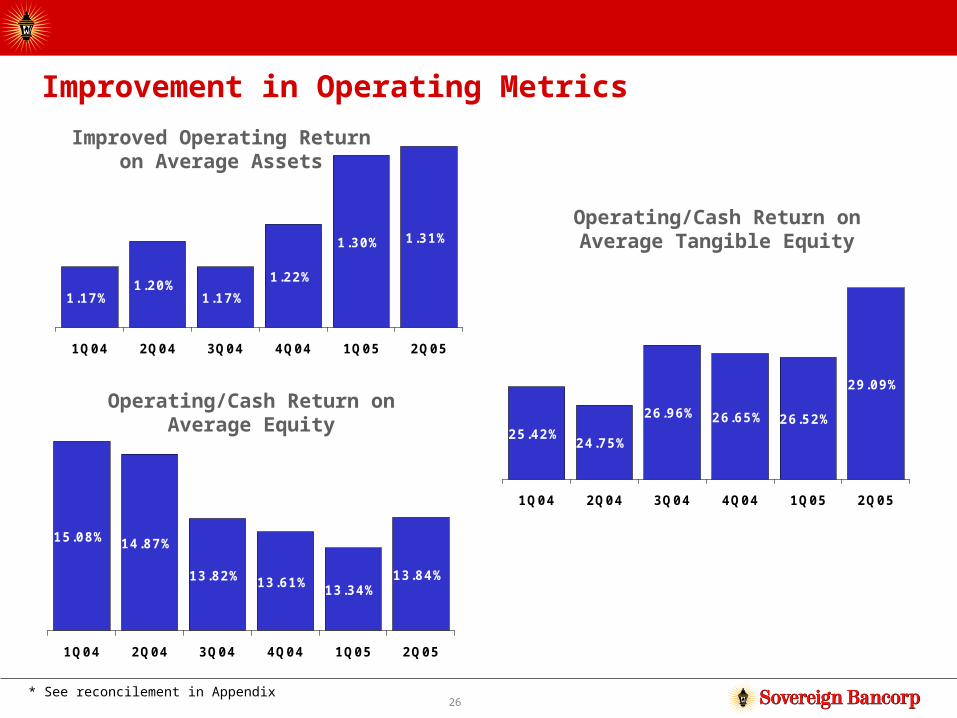
Improvement in Operating Metrics
Operating/Cash Return onAverage Equity
1.17%1.20%
1.17%
1.30% 1.31%
1.22%
1Q04 2Q04 3Q04 4Q04 1Q05 2Q05
Improved Operating Returnon Average Assets
25.42%24.75%
26.96% 26.52%
29.09%
26.65%
1Q04 2Q04 3Q04 4Q04 1Q05 2Q05
Operating/Cash Return onAverage Tangible Equity
15.08% 14.87%
13.82%13.34%
13.84%13.61%
1Q04 2Q04 3Q04 4Q04 1Q05 2Q05
* See reconcilement in Appendix

27
High Cost Debt Has Been Paid Off
Amount(millions) Description
Maturity Date Date Paid Off
$200 10.25% Senior Notes 5/15/04 $162.4 on 3/7/03$37.6 on 5/15/04
$175 8 5/8% Senior Notes 3/15/04 $139.2 on 3/7/03$35.8 on 3/15/04
$500 10.50% Senior Notes 11/15/06 9/21/04
Current Debt Outstanding
Sovereign Bancorp outstanding debt
$300 million senior notes, Libor + 33 bps, due 8/25/06
Sovereign Bank outstanding debt
$300 million subordinated notes, 4 1/2%, due 8/1/13
$500 million subordinated notes, 5 ¼%, due 3/15/13

CapitalManagement

29
Strong Internal Generation of Capital
Average TCE generated per quarter in 2005 = ~ $200 million
Sovereign Bancorp 12/ 03 12/ 04 3/ 05 6/ 05Tier 1 Leverage 5.61% 7.05% 6.96% 6.86%TCE/TA 4.66% 5.00% 4.86% 4.88%
Sovereign BankTier 1 Leverage 6.66% 7.21% 7.44% 7.19%Risk Based Capital 12.12% 11.64% 11.55% 11.28%

30
Return of Net Income to Shareholders
Dividends Paid
Stock Repurchased Total
Net Income
% of Net Income
2002 $26 $0 $26 $342 7.7%2003 $28 $0 $28 $402 7.0%2004 $38 $0 $38 $454 8.3%
YTD '05 $26 $259 $285 $330 86.4%
(dollars in millions)

31
Capital Allocation Discipline
Investing in organic growth
Share repurchases
Cash dividend
Mergers and acquisitions Only if it meets our M&A criteria:
• Accretive to operating/cash earnings within the first year• Must not significantly deviate from capital goals• Should be consistent with or improve our operating/cash earnings
growth rate• Consistent with our critical success factors• Any acquisition will be compared to other alternative uses of capital

32
Capital Allocation Decisions
Current yield curve limits balance sheet growth
Repurchase program Previously authorized repurchase program of ~20 million shares Sovereign has repurchased 16 million shares through July 1, 2005
YTD Combined Payout Ratio of 86%
Cash dividend Increased annual cash dividend by $.04 during the first quarter of
2005, to $.16 per year Board of Directors has committed to revisit the dividend level
again during the second half of 2005 Current Dividend Yield of .8% Current Dividend Payout Ratio of 8.7%
At the current time, share repurchases are an optimal use for deploying excess capital

33
Sovereign’s Growth Compared to Eastern U.S. Banks and Thrifts
Growth 3-Year Historical CAGR
06 / 05 EPS LT IBES EPS GAAP EPS TBV/Share
Company Value Rank Value Rank Value Rank Value Rank Value Rank Value Rank
Sovereign 11.1 % 10.5 % 5.2 % 18.7 % 8.9 % 25.8 %
Large Cap Eastern Banks 2 1 3 1 5 2
Regional Eastern Banks 2 1 1 1 5 1
New York Area Thrifts 2 1 2 1 4 3
Large Cap Eastern Banks 11.08108 2 10.5 1 5.151845 3 18.74815 1 8.9096505 5 25.78274 2
SunTrust 8.7 % 5 9.0 % 5 5.5 % 2 (5.7)% 6 15.7 % 3 15.6 % 4
BB&T 8.9 4 10.0 3 1.5 5 (1.7) 5 13.2 4 13.0 5
North Fork 12.1 1 10.5 1 3.7 4 14.7 2 62.9 1 78.9 1
PNC Financial 8.1 6 8.0 6 0.7 6 (0.2) 4 6.1 6 10.7 6
M&T 9.1 3 10.0 3 12.0 1 3.5 3 24.7 2 22.2 3
Median 8.9 % 10.0 % 3.7 % (0.2)% 15.7 % 15.6 %
Regional Eastern Banks 11.08108 2 10.5 1 5.151845 1 18.74815 1 8.9096505 5 25.78274 1
TD Banknorth 9.2 % 6 10.1 % 2 (6.2)% 8 4.4 % 3 11.4 % 4 14.7 % 6
Mercantile 10.4 3 9.0 3 2.7 3 (1.3) 5 15.0 1 18.6 3
Fulton Financial 9.1 7 9.0 3 4.2 2 (2.3) 6 12.4 3 20.0 2
Valley National 9.5 5 8.5 6 2.1 5 4.3 4 5.5 7 9.8 7
Hudson United 7.8 8 8.0 7 2.4 4 13.6 2 (2.1) 8 5.7 8
Susquehanna 14.9 1 8.0 7 1.6 7 (5.4) 7 13.8 2 17.1 5
Provident 9.6 4 9.0 3 1.8 6 (8.5) 8 8.3 6 17.8 4
Median 9.5 % 9.0 % 2.1 % (1.3)% 11.4 % 17.1 %
New York Area Thrifts 11.08108 2 10.5 1 5.151845 2 18.74815 1 8.9096505 4 25.78274 3
New York Community 14.2 % 1 10.0 % 2 3.2 % 3 11.0 % 2 42.9 % 1 56.4 % 1
Independence Community 9.8 4 10.0 2 12.6 1 (1.7) 5 36.0 2 38.6 2
Astoria Financial 8.5 5 9.0 5 2.6 4 5.1 3 2.6 5 4.7 5
Webster Financial 10.1 3 9.5 4 (2.6) 5 (1.0) 4 15.2 3 19.5 4
Median 10.0 % 9.8 % 2.9 % 2.0 % 25.6 % 29.1 %
Total LoansTotal Core Deposits1
Source: SNL DataSource
[1] Core deposits are total deposits excluding foreign deposits and jumbo time deposits.

34
Growth Driven in Part by Acquisitions1995 - 2005 YTD 2001 - 2005 YTD
Aggregate Value of Acquisitions Aggregate Value of Acquisitions
Number of Market Cap Assets Number of Market Cap Assets
Acquisitions Amount % of Growth Amount % of Growth Acquisitions Amount % of Growth Amount % of Growth
Sovereign 16 $ 5,968 73.5 % $ 33,804 64.6 % 4 $ 2,746 41.4 % $ 13,088 51.4 %
Large Cap Eastern BanksSunTrust 10 $ 16,884 80.9 % $ 55,329 45.3 % 3 $ 8,386 108.6 % $ 28,739 47.0 %BB&T 28 12,981 64.8 55,608 70.8 9 6,208 88.7 26,426 74.5PNC Financial 4 5,491 50.5 26,309 215.6 2 1,339 NM 9,104 46.1North Fork 11 9,629 74.7 41,690 73.8 3 7,394 79.8 31,457 68.5M&T Bank 10 5,765 51.4 33,781 77.9 1 2,984 51.8 18,319 73.5Median 10 64.8 % 73.8 % 3 84.3 % 68.5 %
Regional Eastern BanksTD Banknorth 10 $ 2,146 42.5 % $ 10,606 36.1 % 10 $ 2,146 88.3 % $ 10,606 76.3 %Mercantile Bankshares 9 939 29.1 3,724 38.3 2 768 69.9 3,037 45.1Fulton Financial 14 1,230 53.6 5,363 42.5 5 587 51.5 2,706 31.5Valley National 7 1,093 65.4 4,212 63.9 2 277 51.3 1,059 30.2Hudson United 21 1,501 108.3 8,906 146.5 1 (0) (0.1) 270 13.3Susquehanna 9 347 41.3 1,773 35.3 2 208 46.0 1,105 44.9Provident Bankshares 3 452 53.4 2,207 53.3 1 308 66.4 1,262 135.8Median 9 53.4 % 42.5 % 2 51.5 % 44.9 %
New York Area ThriftsNew York Community 2 $ 3,354 74.1 % $ 14,022 59.8 % 2 $ 3,354 92.7 % $ 14,022 70.5 %Independence Community 7 1,928 NM 10,110 NM 1 1,502 67.4 7,486 66.4Astoria Financial 2 1,640 58.8 9,061 48.7 0 0 0.0 0 0.0Webster Financial 17 1,729 70.9 10,610 73.9 6 576 49.8 3,122 50.7Median 5 70.9 % 59.8 % 2 58.6 % 58.5 %
($ in millions)
Source: SNL DataSource, Factset
*
* Excludes TD Banknorth/HU transaction
35
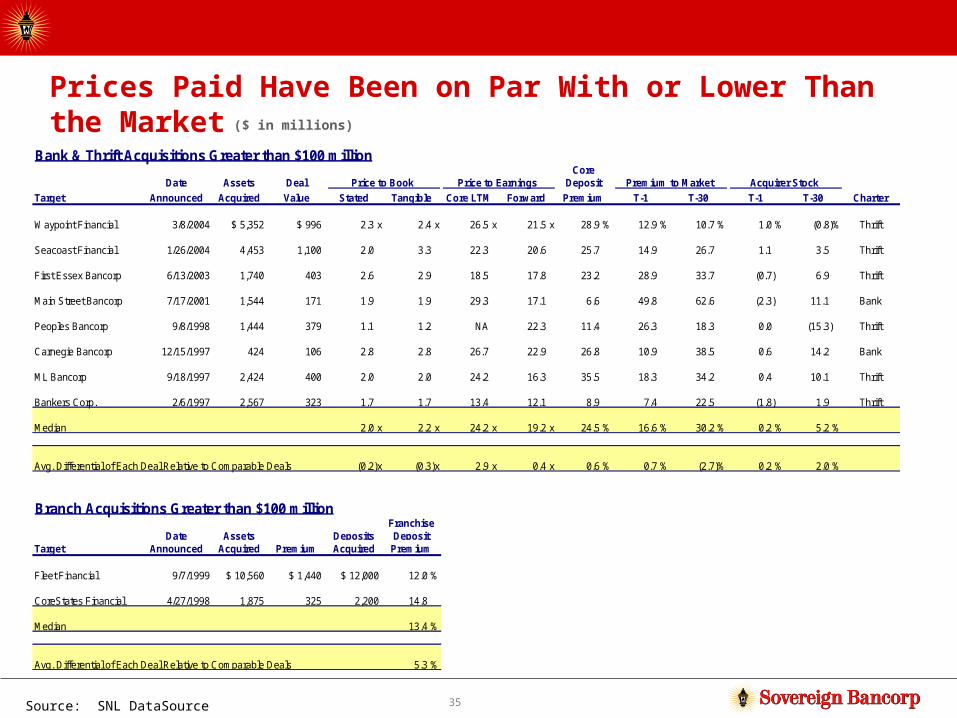
Prices Paid Have Been on Par With or Lower Than the Market ($ in millions)
Source: SNL DataSource
Bank & Thrift Acquisitions Greater than $100 millionCore
Date Assets Deal Price to Book Price to Earnings Deposit Premium to Market Acquirer Stock
Target Announced Acquired Value Stated Tangible Core LTM Forward Premium T-1 T-30 T-1 T-30 Charter
Waypoint Financial 3/8/2004 $ 5,352 $ 996 2.3 x 2.4 x 26.5 x 21.5 x 28.9 % 12.9 % 10.7 % 1.0 % (0.8)% Thrift
Seacoast Financial 1/26/2004 4,453 1,100 2.0 3.3 22.3 20.6 25.7 14.9 26.7 1.1 3.5 Thrift
First Essex Bancorp 6/13/2003 1,740 403 2.6 2.9 18.5 17.8 23.2 28.9 33.7 (0.7) 6.9 Thrift
Main Street Bancorp 7/17/2001 1,544 171 1.9 1.9 29.3 17.1 6.6 49.8 62.6 (2.3) 11.1 Bank
Peoples Bancorp 9/8/1998 1,444 379 1.1 1.2 NA 22.3 11.4 26.3 18.3 0.0 (15.3) Thrift
Carnegie Bancorp 12/15/1997 424 106 2.8 2.8 26.7 22.9 26.8 10.9 38.5 0.6 14.2 Bank
ML Bancorp 9/18/1997 2,424 400 2.0 2.0 24.2 16.3 35.5 18.3 34.2 0.4 10.1 Thrift
Bankers Corp. 2/6/1997 2,567 323 1.7 1.7 13.4 12.1 8.9 7.4 22.5 (1.8) 1.9 Thrift
Median 2.0 x 2.2 x 24.2 x 19.2 x 24.5 % 16.6 % 30.2 % 0.2 % 5.2 %
Avg. Differential of Each Deal Relative to Comparable Deals (0.2)x (0.3)x 2.9 x 0.4 x 0.6 % 0.7 % (2.7)% 0.2 % 2.0 %
Branch Acquisitions Greater than $100 millionFranchise
Date Assets Deposits DepositTarget Announced Acquired Premium Acquired Premium
Fleet Financial 9/7/1999 $ 10,560 $ 1,440 $ 12,000 12.0 %
CoreStates Financial 4/27/1998 1,875 325 2,200 14.8
Median 13.4 %
Avg. Differential of Each Deal Relative to Comparable Deals 5.3 %

Comparison toTop 50 Banks

37
0.00
1.00
2.00
3.00
4.00
5.00
6.00
7.00
8.00
9.00
10.00
WES
CBP
OP
WFC
ZIO
NSN
VBA
CBB
TCB
HJP
MFB
PUS
BCN
B HIB
NCC
KEY RF
MTB
ASBC
CBSS NF
B MI
BNK
FHN
HBAN
HCBK CM
ANY
BIC
BCW
BS FITB
SOV UB
ASO WB AF
PNC
NDE ST
IG
DW WM
DSL
NTRS BK ST
T
Sovereign’s Total Loan Yield Compared to Top 50 National Banks
Source: SNL Datasource as of 1Q05Data not available for DRL, MEL, & WHI
Green = Top quartileRed = Bottom quartile
Sovereign’s Total Loan Yield is in the Third Quartile
5.40%
Median
5.67%
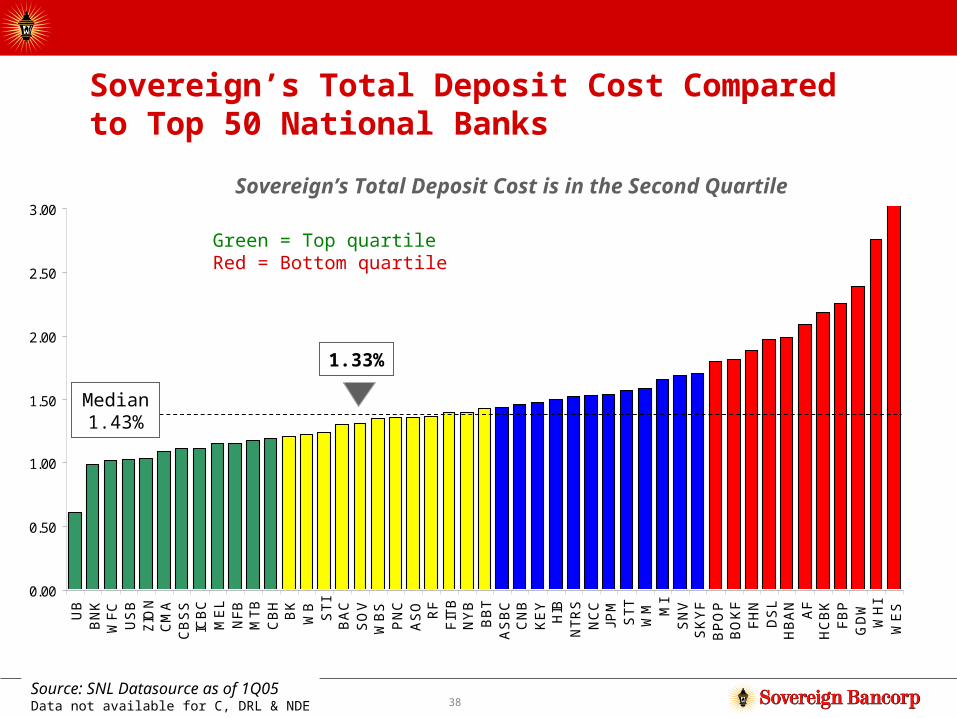
38Source: SNL Datasource as of 1Q05Data not available for C, DRL & NDE
0.00
0.50
1.00
1.50
2.00
2.50
3.00
UB
BN
KW
FC
US
BZ
ION
CM
AC
BS
SIC
BC
ME
LN
FB
MT
BC
BH
BK
WB
ST
IB
AC
SO
VW
BS
PN
CA
SO RF
FIT
BN
YB
BB
TA
SB
CC
NB
KE
YH
IBN
TR
SN
CC
JPM
ST
TW
M MI
SN
VS
KY
FB
PO
PB
OK
FF
HN
DS
LH
BA
NA
FH
CB
KF
BP
GD
WW
HI
WE
S
Sovereign’s Total Deposit Cost Compared to Top 50 National Banks
Green = Top quartileRed = Bottom quartile
Sovereign’s Total Deposit Cost is in the Second Quartile
1.33%
Median1.43%

39
0.0
10.0
20.0
30.0
40.0
50.0
60.0
70.0
WH
IH
CB
KN
YB
GD
WW
ES
NF
BU
SB
DS
LA
FIC
BC
FB
PS
OV
AS
BC
BA
CB
BT
FIT
BM
TB
BN
KA
SO
BO
KF
WM
SK
YF
CM
AZ
ION C
CN
BN
DE
WB
SC
BS
SH
IBS
TI
WF
CW
BR
FN
CC
UB
BP
OP
MI
KE
YN
TR
SH
BA
NJP
MB
KC
BH
PN
CF
HN
SN
VM
EL
ST
T
Sovereign’s Efficiency Ratio Compared to Top 50 National Banks
Source: SNL Datasource as of 1Q05Data not available for DRL
Green = Top quartileRed = Bottom quartile
Sovereign’s Efficiency Ratio is in the First Quartile
48.4%Median
55.8%

40
0.0
1.0
2.0
3.0
4.0
5.0
6.0
7.0
8.0
9.0
10.0
CM
AS
NV
FBP
WE
SH
BA
NZI
ON
BO
KF
NY
BM
EL
KE
YU
SB UB
WH
IH
IBC
BS
SFI
TBS
KY
FB
PO
P RF
AS
BC
CN
BN
DE
PN
CN
CC
WFC
NTR
SB
BT
SO
VD
SL MI
FHN
GD
WM
TBA
SO
WB
S STI BK
NFB A
FJP
MB
NK
CB
HH
CB
KW
BB
AC
ICB
CS
TT C
Sovereign’s Tier 1 Leverage Compared to Top 50 National Banks
Source: Data as of 1Q05Data not available for DRL & WM
Green = Top quartileRed = Bottom quartile 6.96%
Median7.19%
Sovereign’s Tier 1 Leverage Ratio is in the Third Quartile

41
Management’s Priorities
Continue to increase loan yields by gradually changing mix
Continue to focus efforts on core deposit growth
Maintain solid capital position and capital allocation discipline
Remain focused on four critical success factors

Summary
43
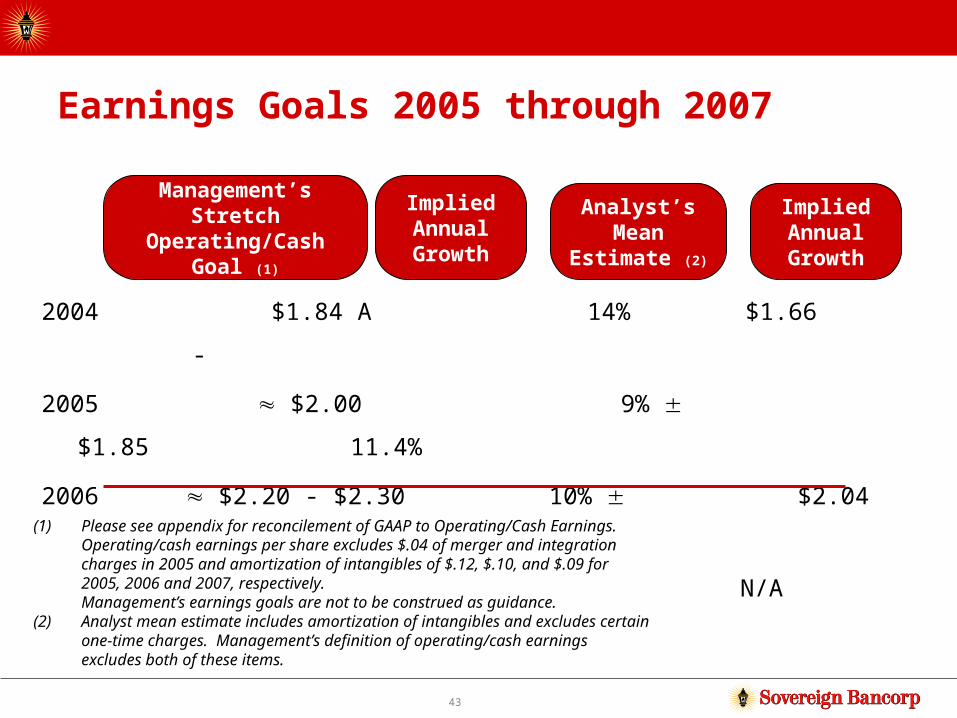
Earnings Goals 2005 through 2007
2004 $1.84 A 14% $1.66 -
2005 $2.00 9% $1.85 11.4%
2006 $2.20 - $2.30 10% $2.04 10.3%
2007 $2.40 – $2.50 10% N/A N/A
Management’s Stretch
Operating/Cash Goal (1)
Implied Annual Growth
(1) Please see appendix for reconcilement of GAAP to Operating/Cash Earnings. Operating/cash earnings per share excludes $.04 of merger and integration charges in 2005 and amortization of intangibles of $.12, $.10, and $.09 for 2005, 2006 and 2007, respectively.Management’s earnings goals are not to be construed as guidance.
(2) Analyst mean estimate includes amortization of intangibles and excludes certain one-time charges. Management’s definition of operating/cash earnings excludes both of these items.
Analyst’sMean
Estimate (2)
Implied Annual Growth

44
Above Average Shareholder Value Creation Potential
2004A $1.84 12.3x $22.55 N/A
2005E $2.00 13x $26.00 15%
2006E $2.20 - $2.30 13x $29.25 14%
2007E $2.40 - $2.50 13x $31.85 12%
Management’s Stretch
Operating/Cash Goal (1)
P/E
* From year-end 2004 stock price of $22.55 to the date indicated(1) Please see appendix for reconcilement of GAAP to Operating/Cash
Earnings
CAGR*Implied Stock Price

45
Analyst Opinions Relative to Eastern U.S. Banks/Rating Agency Actions
Source: Thomson Financial
As ofJune 15, 2005
Strong Buy / Buy Hold
Under- perform /
Sell
Sovereign 53% 47% 0%
Large Cap
SunTrust 15% 69% 15%
BB&T 4% 72% 24%
PNC 15% 70% 15%
North Fork 72% 24% 4%
M&T Bank 14% 86% 0%
Average 24% 61% 12%
Regional
TD Banknorth 12% 82% 6%
Mercantile 37% 58% 5%
Fulton Financial 17% 58% 25%
Valley National 0% 88% 13%
Hudson United 0% 73% 27%
Susquehanna 0% 90% 10%
Provident 0% 55% 9%
Average 15% 72% 14%
As ofJune 15, 2005
Strong Buy / Buy Hold
Under-perform /
Sell
Sovereign 53% 47% 0%
New York Area Thrifts
New York Community 41% 41% 18%
Independence Community 33% 67% 0%
Astoria Financial 8% 92% 0%
Webster Financial 20% 60% 20%
Average 26% 65% 9%
Rating Agency Actions
Received upgrade from Moody’s in January 2004
Placed on positive outlook by Moody’s inMarch 2005
Placed on positive outlook by S&P and Fitch in April 2005

46
Clear and Consistent Strategy and Tactics for the Future
Strong, experienced and deep management team in place
Structure and strategy are organized to seize superior growth opportunities, while maintaining our capital allocation and M&A discipline
Focus is on tactics and superior execution
As we execute, we will remain committed to our critical success factors of: Superior asset quality Superior risk management Strong sales and service culture that aligns team member
performance with a recognition and rewards system High level of productivity through revenue growth and efficient
expense control
Above average earnings and shareholder value growth and consistent improvement in operating metrics expected over the coming few years

Appendix

48
One Non-GAAP Financial Measure
Effective in the fourth quarter of 2004, Sovereign moved to one non-GAAP financial measure – Operating/Cash Earnings Provides greater financial transparency
Provides useful supplemental information when evaluating Sovereign’s core businesses
Consistent with SEC’s publicly stated desire for fewer non-GAAP disclosures
Operating/Cash Earnings represent net income adjusted for after-tax effects of merger-related and integration charges, any other non-recurring charges and the amortization of intangible assets

49
Reconciliation of Operating/Cash Earnings to GAAP Earnings - Actual
Year Ended December 31,
2004 2003 2002 2005 1 2004
Net Income/(loss) as reported 453,552$ 401,851$ 341,985$ 189,805$ 131,354$
Merger-related and integration costs 30,134 10,316 (5,490)
Provision for Loan Loss 3,900 3,900
Loss on Debt Extinguishment 42,605 18,838
Impairment Charge for FNMA and FHLMC Preferred Stock 20,891
Amoritzation of Intangibles 51,186 50,100 54,121 12,229 12,047
Operating/Cash Earnings 602,268$ 470,789$ 410,322$ 196,544$ 143,401$
Note: Further details are available on our web site at www.sovereignbank.com and in our Annual Reports to Shareholders
Qtr Ended June 30,($ in thousands, all numbers shown net of tax)
1 Net Income for EPS purposes

50
Reconciliation of Operating/Cash EPS to GAAP EPS - Actual
Year Ended December 31,
2004 2003 2002 2005 2004
Diluted Earnings per Share 1.38$ 1.38$ 1.23$ 0.47$ 0.42$
Merger-related and integration costs 0.10$ 0.04$ (0.01)$
Provision for Loan Loss 0.01$ 0.01$
Loss on Debt Extinguishment 0.13$ 0.07$
Impairment Charge for FNMA and FHLMC Preferred Stock 0.06$
Amoritzation of Intangibles 0.16$ 0.17$ 0.19$ 0.03$ 0.04$
Operating/Cash Earnings per Share 1.84$ 1.62$ 1.47$ 0.49$ 0.46$
Note: Further details are available on our web site at www.sovereignbank.com and in our Annual Reports to Shareholders
Qtr Ended June 30,
51
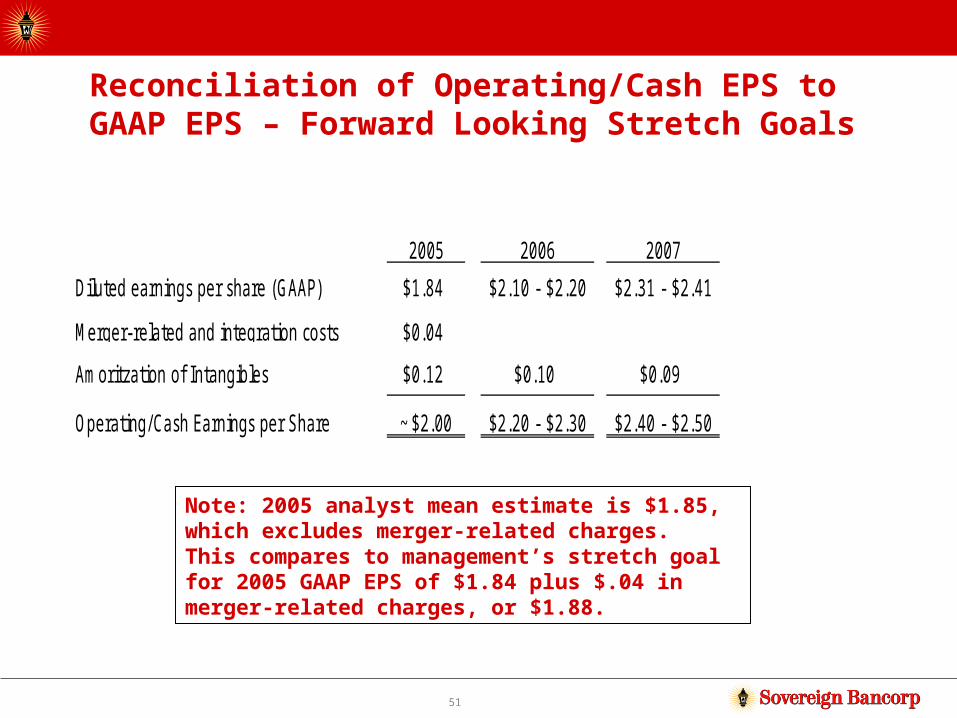
Reconciliation of Operating/Cash EPS to GAAP EPS – Forward Looking Stretch Goals
2005 2006 2007
Diluted earnings per share (GAAP) $1.84 $2.10 - $2.20 $2.31 - $2.41
Merger-related and integration costs $0.04
Amoritzation of Intangibles $0.12 $0.10 $0.09
Operating/Cash Earnings per Share ~$2.00 $2.20 - $2.30 $2.40 - $2.50
Note: 2005 analyst mean estimate is $1.85, which excludes merger-related charges. This compares to management’s stretch goal for 2005 GAAP EPS of $1.84 plus $.04 in merger-related charges, or $1.88.
52
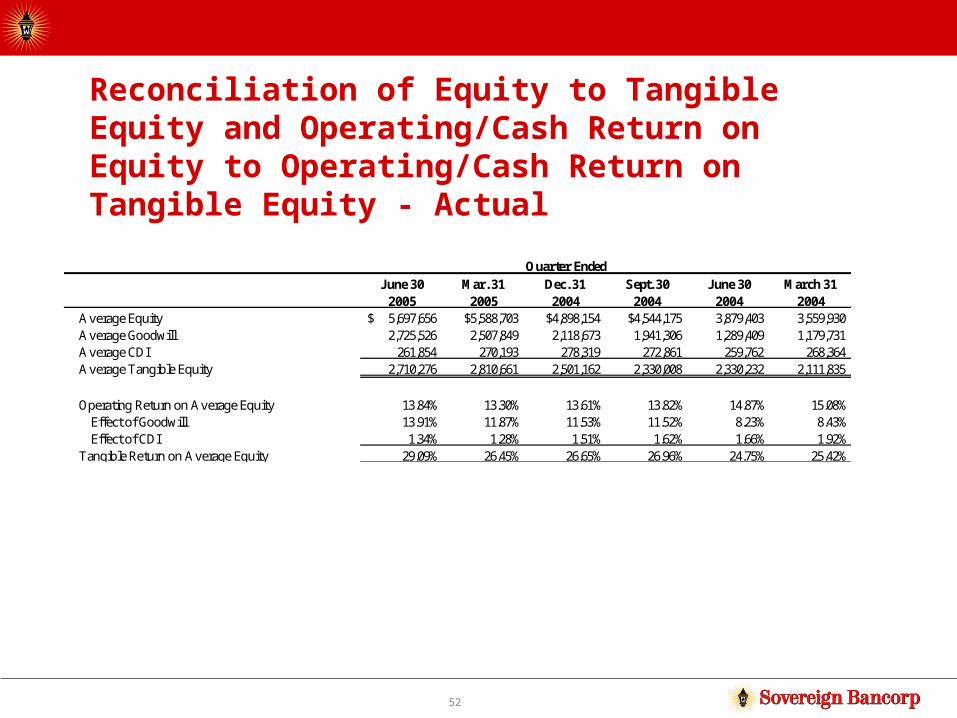
Reconciliation of Equity to Tangible Equity and Operating/Cash Return on Equity to Operating/Cash Return on Tangible Equity - Actual
June 30 Mar. 31 Dec. 31 Sept. 30 June 30 March 312005 2005 2004 2004 2004 2004
Average Equity 5,697,656$ $5,588,703 $4,898,154 $4,544,175 3,879,403 3,559,930 Average Goodwill 2,725,526 2,507,849 2,118,673 1,941,306 1,289,409 1,179,731Average CDI 261,854 270,193 278,319 272,861 259,762 268,364Average Tangible Equity 2,710,276 2,810,661 2,501,162 2,330,008 2,330,232 2,111,835
Operating Return on Average Equity 13.84% 13.30% 13.61% 13.82% 14.87% 15.08%Effect of Goodwill 13.91% 11.87% 11.53% 11.52% 8.23% 8.43%Effect of CDI 1.34% 1.28% 1.51% 1.62% 1.66% 1.92%
Tangible Return on Average Equity 29.09% 26.45% 26.65% 26.96% 24.75% 25.42%
Quarter Ended