southern sudan guinea worm eradication program 2009 ... · southern sudan guinea worm eradication...
TRANSCRIPT
Southern Sudan Guinea Worm Eradication Program 2009: Countdown to Extinction
2008 Program Review MeetingThe Carter Center, Atlanta, Georgia
October 16th – 17th, 2008
Makoy Samuel YibiDirector, SSGWEP
Ministry of Health – Government of Southern Sudan
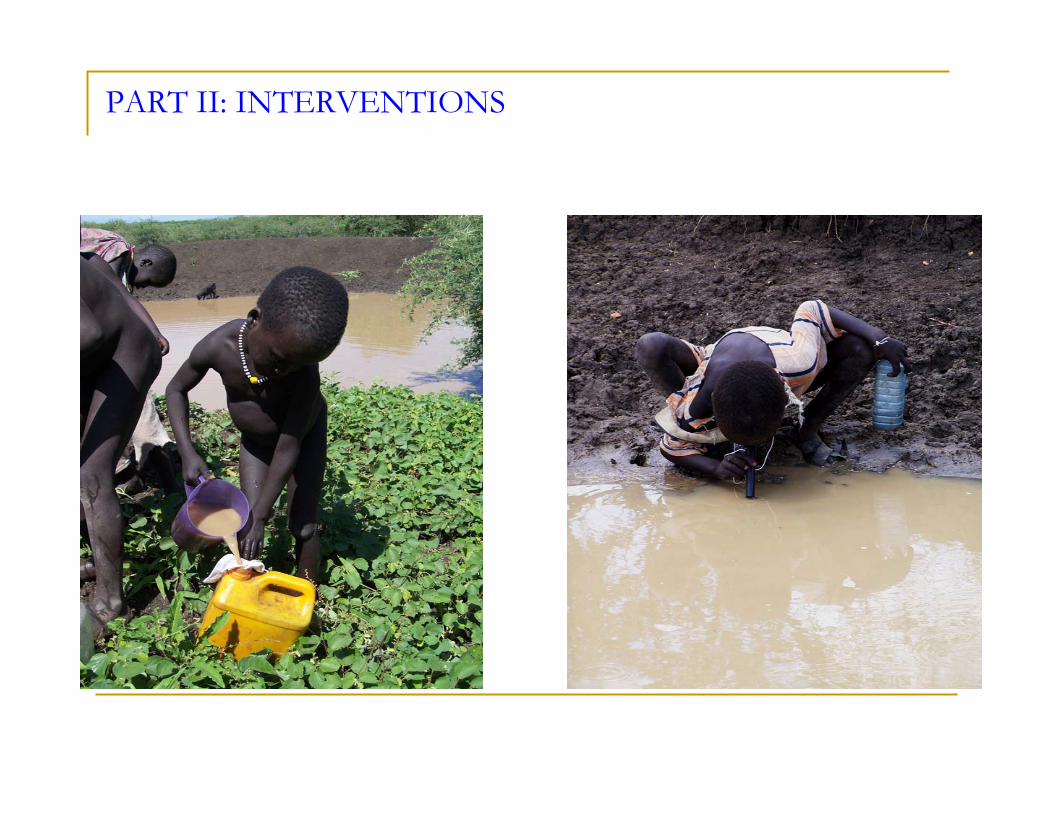
PART II: INTERVENTIONS

The SSGWEP TeamDirectorate of Preventive Health, Ministry of Health – Government of Southern Sudan
17,427 Village Volunteers in 15,590 villages under active surveillance in 2008
1420 Area Supervisors
151 County Field Officers
12 National Program Officers
14 Technical Advisors
6 State MOH Field Coordinators
Partnerships between GOSS Ministries, local government, traditional leaders, multi-lateral donors, NGO partners, and Civil Society Groups ( through the SSGWETF)

Status of Interventions 2006-2008
0% 10% 20% 30% 40% 50% 60% 70% 80% 90% 100%
Overall Case Containment Rate
Overall Reporting Rate
% Evs w ith 100% Monthly Reporting
% EV w / 1+ Trained Village Volunteer
% EV w / access to 1+ Safe Water Sources
% EV w / 100% Monthly Cloth Filter Coverage
% EV w / 100% Pipe Filter Coverage for Eligible Persons
% EV w / 1+ Health Education for the Year
% EV w / Monthly Health Education
% EV w / 100% Monthly Supervisory Visits
% EV w / 1+ Abate Applications This Year
% EV w / GPS Points
Indi
cato
r
% Coverage
2008
2007
2006

Reporting Rates, Endemic Vilages 2004-2008
0%
10%
20%
30%
40%
50%
60%
70%
80%
90%
100%
JanuaryFebruary
March
Apri l May
June
July
AugustSep tember
Octobe r
NovemberDecember
Month
% E
Vs re
port
ing EV Reporting Rate 2008
EV Reporting Rate 2007
EV Reporting Rate 2006
EV Reporting Rate 2005
EV Reporting Rate 2004
January Through August2008: 87% Reporting Rate2007: 70% Reporting Rate

Progress Towards Containment Condition Targets, 2008 (n=3102)
0% 10% 20% 30% 40% 50% 60% 70% 80% 90% 100%
Overall Containment Rate
Staying out of the w ater w ith hangingw orm(s)
Detected w ithin 24 hours
Bandaged w ithin 24 hours
Worm(s) are completely removed
Confirmed by a supervisory w ithin 7 days
Con
tain
men
tCon
ditio
ns
% Compliance
% of Cases Satisfying Condition
Interventions: Case Containment
Case containment rate: 49% (1520/3102)
100% (3102/3102) of cases detected had complete patient records.
83% (2596/3102) of cases were detected within 24 hours of worm emergence, an improvement from 76% in 2007.
12% of these cases (376/3102) contaminated the water, a reduction from the 22.6% recorded in 2007 and the 23% recorded in 2006 –addressing this contamination rate is the NUMBER ONE priority for the SSGWEP.

Interventions: Case Containment
Remaining challenges: Late detection, Poor case management
practices due to de-motivated and unskilled volunteers & Area Supervisors, and
Traditional practices for removal of Guinea worms,
Defaulting of care for mobile cases ( cattle camps, Soldiers, traders etc.)

Cases/Contained, Top 10 Endemic Counties, Jan-August, 2008 (93% of all Cases, 2879/3102)
0 100 200 300 400 500 600
Tonj South
Juba
Terekeka
Jur River
Aw erial
Tonj East
Kapoeta North
Kapoeta South
Kapoeta East
Tonj North
Cou
nty
Cases/Contained
Contained
Not Contained48.5% of cases in the top 10 Counties were contained; of those not contained, 23% contaminated the water in 2008 (336/1482)
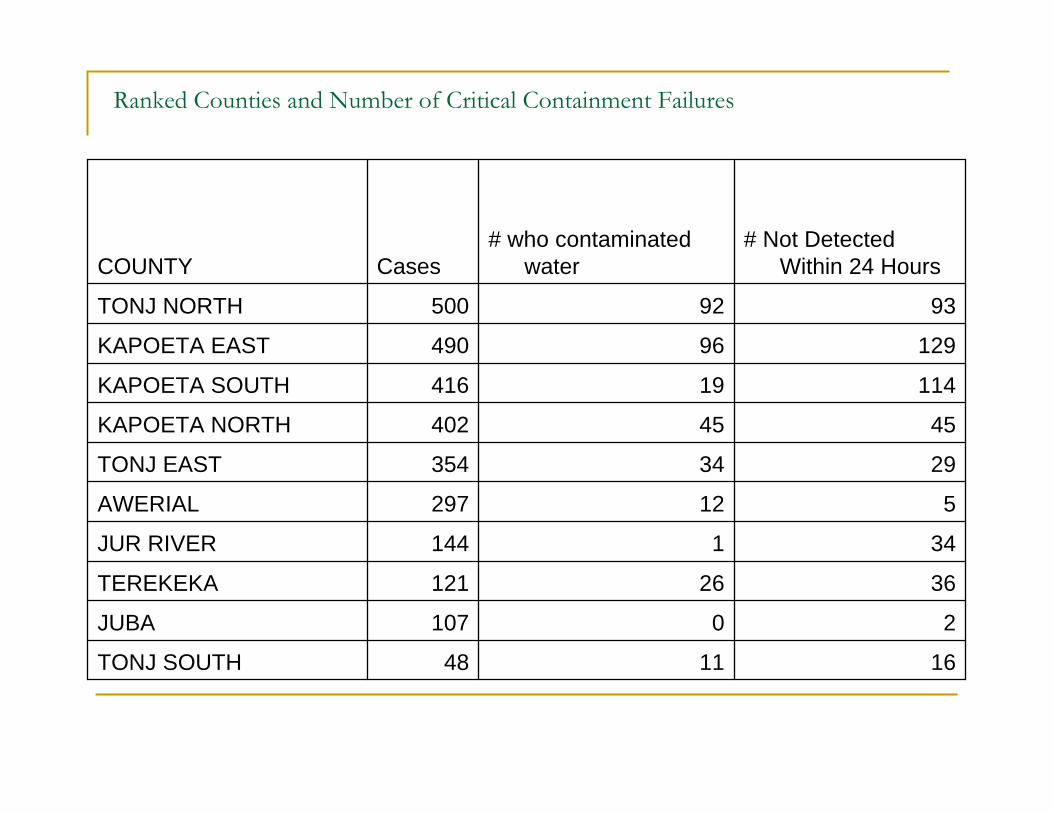
161148TONJ SOUTH
20107JUBA
3626121TEREKEKA
341144JUR RIVER
512297AWERIAL
2934354TONJ EAST
4545402KAPOETA NORTH
11419416KAPOETA SOUTH
12996490KAPOETA EAST
9392500TONJ NORTH
# Not Detected Within 24 Hours
# who contaminated waterCasesCOUNTY
Ranked Counties and Number of Critical Containment Failures

Interventions: Cloth Filters
464,115 Cloth Filters Distributed in Endemic Villages
68% of EVs had 100% cloth filter coverage in 2008, an increase from the 37.8% of EVs with 100% coverage in 2007.
Failure to meet 100% targets can be attributed to weak replacement by volunteers and
breakdowns in the logistics pipeline, supervisory challenges, and weak reporting/documentation on
interventions.

INTERVENTIONS: Pipe Filters
41% of all EVs had 100% of eligible population (80% of total) covered with pipe filters, an improvement from 38.4% in 2007
Other challenges to Pipe filers includes; Inconsistent use and poor care in
many communities, undermining the effectiveness of the intervention.
Poor attitude towards the filters, A weak nylon string for fastening the
pipe around necks Documentation challenges

Interventions: Health Education
94% of endemic villages received monthly health education activities.

Health Education: Evening Rallies
Health Education Videos produced and shown during evening health education rallies throughout Greater Tonj and Greater Kapoeta
These events also include traditional singing and dancing, skits, slide shows, and games.

Health Education, Radio Programming
Ongoing production of “Let’s Fight Disease” to radio listening groups in all endemic communities in Toposa, Dinka, Bari and Mundari
Radio Listening Groups being trained

Interventions: Chemical Control
1406 stagnant water sources treated in 2008 vs. 806 water sources treated in 2007 and 263 in 2006.
This represent a coverage of 28% of EVs with 1+ abate treatments.
Of these EVs treated, their combined caseload was 48% (1452/3102) vs. 37% (2165/5815) of the 2007 total.

Cases Who Contaminated Water and Abate Coverage, Top 10 Endemic Counties, 2008
0
20
40
60
80
100
120
TONJ SOUTH
JUBA
TEREKEKAJU
R RIVERAWERIAL
TONJ EAST
KAPOETA NORTHKAPOETA SOUTH
KAPOETA EASTTONJ N
ORTH
County
No.
0%
10%
20%
30%
40%
50%
60%
70%
%
Cases who contaminated water% Evs with 1+ Abate Treatments

Abate Application Challenges
Identifying and accessing the infective, measurable water sources
Establishing competent abate teams and resourcing them properly.
Multiple, homestead level of farms within the same village making use of Abate, without clarity as to which water source is actually infected, a tedious effort.
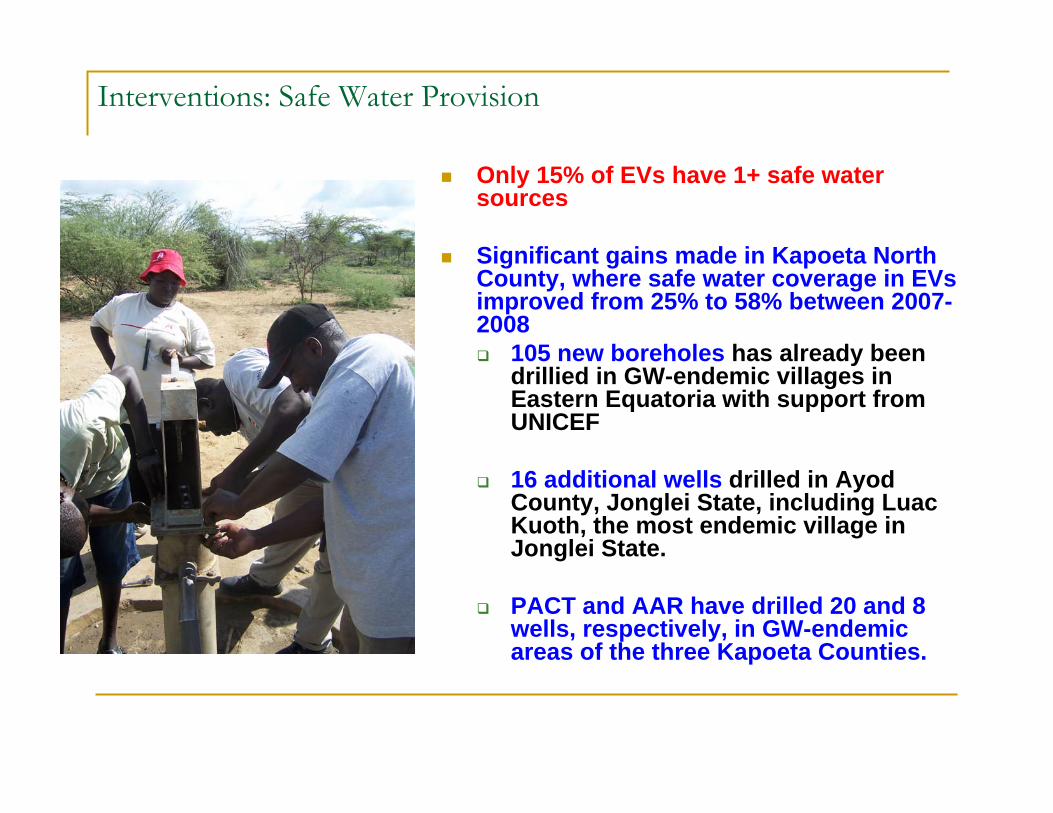
Interventions: Safe Water Provision
Only 15% of EVs have 1+ safe water sources
Significant gains made in Kapoeta North County, where safe water coverage in EVsimproved from 25% to 58% between 2007-2008 105 new boreholes has already been
drillied in GW-endemic villages in Eastern Equatoria with support from UNICEF
16 additional wells drilled in AyodCounty, Jonglei State, including LuacKuoth, the most endemic village in Jonglei State.
PACT and AAR have drilled 20 and 8 wells, respectively, in GW-endemic areas of the three Kapoeta Counties.
Active case searches and verifications of rumors and cross-border notifications
Verification of notifications of cases by EDEP in Pochalla
Follow up training of health workers in Pochallacounty to enhance surveillance
Active case searches for guinea worm disease in Magwi county.
Verification on rumors in Mvolo county (WEQ)

Challenges

Challenges
Poor road infrastructure to endemic areas
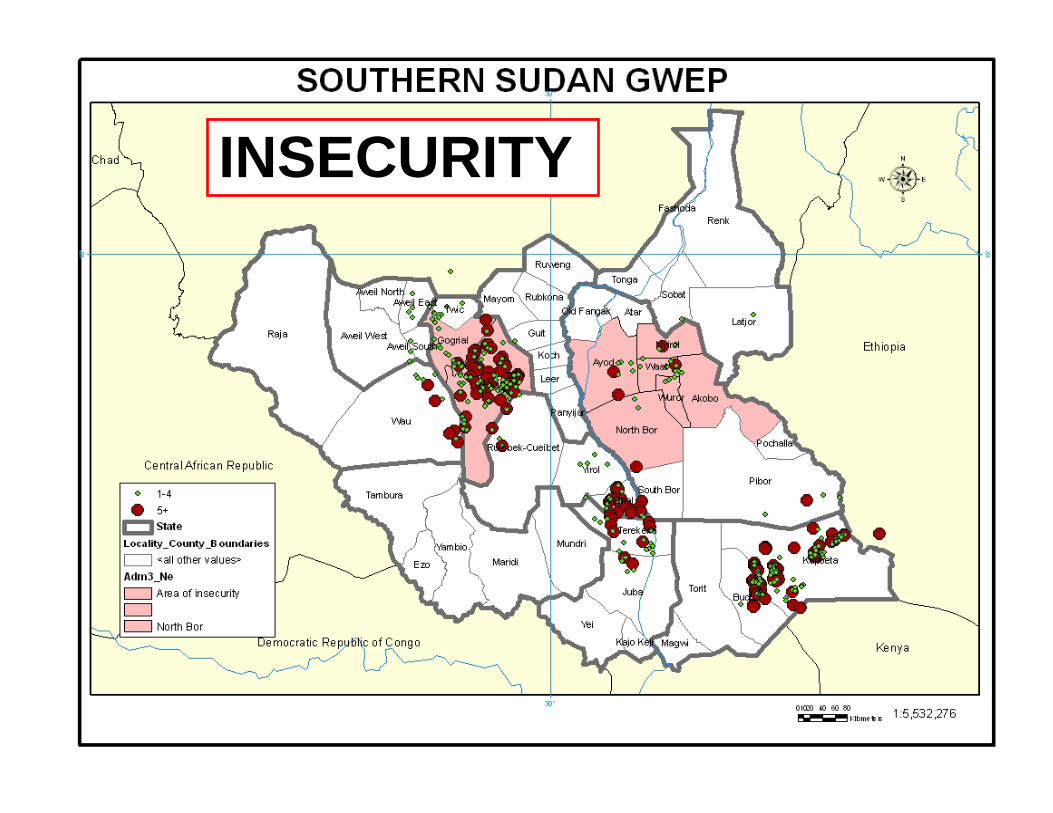
INSECURITY

Challenges
Insufficient numbers of supervisory staff ( AS, FOs, TAs) coupled with inconsistent placement of Field officers miles away from areas of high infestation due to poor data from other areas.
High Turn-over of Volunteers and Area Supervisors

Challenges
Absolute illiteracy and customs in most endemic areas, limits overall compliance in filtering drinking water from unsafe water sources especially in KapoetaCounties.
The population dynamics associated with excessive mobility by populations in cattle camps and soldiers

Challenges
Snakes.

THANK YOU!!!