southern copper corporation highlights · metal market copper molybdenum • 92% of world reserves...
TRANSCRIPT
Southern Copper Corporation HighlightsSouthern Copper Corporation Highlights
Southern Copper Corporation Highlights
January 2009January 2009
0

Safe Harbor Statement
This presentation contains ‘‘forward-looking statements,’’ as defined by federalsecurities laws, with respect to our financial condition, results of operations andbusiness, and our expectations or beliefs concerning future events. Thesestatements include words such as, but not limited to, ‘‘expect,’’ ‘‘anticipate,’’‘‘believe,’’ ‘‘intend,’’ ‘‘plan,’’ ‘‘seek,’’ ‘‘forecast,’’ ‘‘estimate,’’ ‘‘continue,’’ ‘‘may,’’believe, intend, plan, seek, forecast, estimate, continue, may,‘‘will,’’ ‘‘would,’’ ‘‘could,’’ ‘‘likely,’’ and similar expressions. These forward-lookingstatements reflect management’s current expectations and assumptions regardingf t t d ti d fi i l f d b d tlfuture events and operating and financial performance and are based on currentlyavailable information. However, actual results are subject to risks anduncertainties, which could cause actual results to differ materially from thosecontained in the forward-looking statements.
Many risks and uncertainties are inherent in the copper industry. Others are moreMany risks and uncertainties are inherent in the copper industry. Others are morespecific to our operations. Additional information about risks and uncertainties thatcould affect our future results are contained in our SEC filings, including our
t F 8 K 10 Q d 10 K d i t ti t t t F S 3
1
reports on Forms 8-K, 10-Q, and 10-K and a registration statement on Form S-3relating to our proposed public offering of common stock.

I. Introduction
2

Management Presenters
Presenters TitlePresentersRaúl Jacob
TitleManager of Financial Planning & IR
3

Corporate Structure
79.1%
20 9%
Public Float
20.9%
99.29 % 99.95 %
SCC Peru Branch Minera México
4

Metal Market
MolybdenumCopper
• 92% of world reserves and productioncapacity are concentrated in: Mexico, Peru,USA, China, and Chile.
• Slowdown in demand due to concernsabout industrial production.
• Supply constraints and cash cost• Demand largely driven by special steelalloys consumption.
pp yincreases.
• Strong long-term fundamentals fromBRIC’s and N-11.BRIC s and N 11.
Molybdenum PricesLME CopperCash Price vs. Inventories
1,000,000.00 $4.50
600,000.00
700,000.00
800,000.00
900,000.00
$2.50
$3.00
$3.50
$4.00
$15$20$25$30$35$40$45
100,000.00
200,000.00
300,000.00
400,000.00
500,000.00
$0.50
$1.00
$1.50
$2.00
$0$5
$1020
00/0
1/07
2001
/01/
07
2002
/01/
07
2003
/01/
07
2004
/01/
07
2005
/01/
07
2006
/01/
07
2007
/01/
07
2008
/01/
07
5
-
,
$0.00
01/0
5/00
04/0
4/00
07/1
1/00
10/0
9/00
01/0
9/01
04/0
9/01
07/1
2/01
10/1
6/01
01/2
2/02
04/2
2/02
07/2
4/02
10/2
1/02
01/2
3/03
04/2
3/03
07/2
2/03
10/1
7/03
01/2
1/04
04/2
0/04
07/2
0/04
10/1
5/04
01/2
1/05
04/2
5/05
07/2
5/05
10/2
1/05
01/2
4/06
04/2
5/06
07/2
5/06
10/2
0/06
01/2
3/07
04/2
4/07
07/2
4/07
10/2
2/07
01/2
2/08
04/2
2/08
07/2
3/08
10/2
1/08
3 month price US$ per ton Registered inventories in tons
2 2 2 2 2 2 2 2 2
FOB North America price US$ per lb
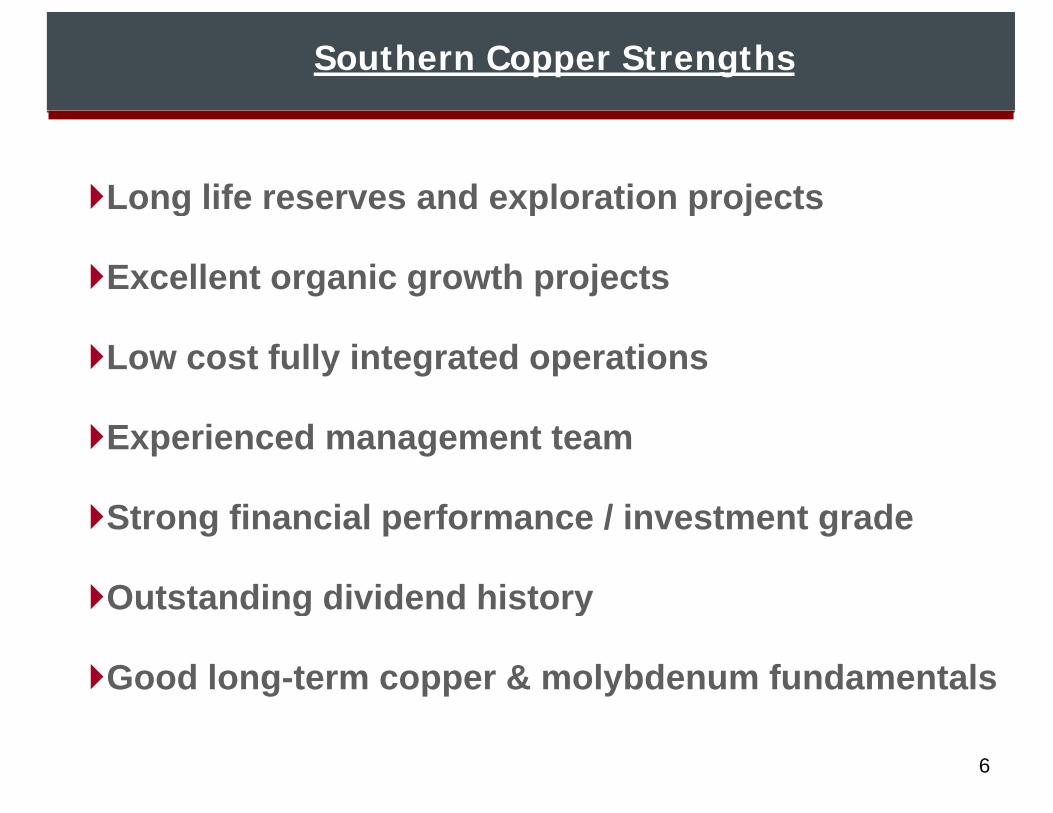
Southern Copper Strengths
Long life reserves and exploration projectso g e ese es a d e p o at o p ojects
Excellent organic growth projects
Low cost fully integrated operations
Experienced management team
St fi i l f / i t t dStrong financial performance / investment grade
Outstanding dividend historyOutstanding dividend history
Good long-term copper & molybdenum fundamentals
6

II. Overview of Operations
7

Company Overview
MexicoCopper Reserves 1: 49.1 mmtFor December 2008 La CaridadCananeaFor December 2008
Copper Production: 489 ktSales: $ 4,851 M
Santa Barbara
Charcas
Santa Eulalia
El Arco
Buenavista
San Martin
Peru
EBITDA: $ 2,557 MCash Cost: $ 0.34 / lb. Taxco
San Luis PotosiAngangueo
e u
Mines
Key#2 copper company by reserves 2
#7 copper producer 3Smelters and Refineries
Projects
#7 copper producer #8 copper smelter 3
Tantahuatay
Ilo
Cuajone
Toquepala
Los ChancasTia Maria
Source: Company FilingsNotes: 1 Copper contained in reserves based on US$1.20 per pound of copper as of December 31, 2007
8
2 Based on available companies reports3 CRU

Long Life Reserves
First largest copper reserves of any publicly traded company
Long life reserves with strong capacity expansion plansLong-life reserves with strong capacity expansion plans
69 9
Main Copper Reserves SCC Copper Reserves
50.3 49.150
60
38.2
49.1
69.9
40
50
60
70
d in
rese
rves
(Mt)
42%
29%SEC
40.0
25.622.9
30
40
er R
eser
ves
(Mt)
0
10
20
30
Cop
per C
onta
ine
2006
200717.3 16.512.1 10.2
0
10
20
Cop
pe
00.90 1.20 2.664
Copper prices ($/lb)
Source Annual Rep. 10K 10K 20F Annual Rep. 20F Reserve Rep. Annual Rep. Annual Rep.
0
Cod
elco
SC
C
FCX
BH
P B
illito
n
Ang
loA
mer
ican
Rio
Tin
to
Xst
rata
CV
RD
-Inco
Ant
ofag
asta
9
Period 06/12/31 07/12/31 07/12/31 07/06/30 07/12/31 07/12/31 07/06/30 07/12/31 07/12/31Cu Price N/A $1.20 $1.20 $2.00 N/A $2.31 N/A N/A N/A

Low Cost Operations
Cash Costs per pound of Copper Produced Net of By-Products
Management focus on cost efficiency
Low Cost Drivers
0 6 Management focus on cost efficiencySignificant low cost SX-EW productionHigh quality reservesStrong by-product credits – 12M08:
0.44
0 18
0.340.4
0.6
/lb)
– molybdenum (16% of revenues) – zinc (4% of revenues)– silver (4% of revenues)– gold & others (3% of revenues)
0.18
0.03
0.16
-0.13
0
0.2
(US$
/
Cost Structure Operating Cash Cost per Pound of Copper Produced
gold & others (3% of revenues)– sulphuric acid (4% of revenues)
-0.22003 2004 2005 2006 2007 2008
pp
Operating Materials
16%
FuelMaintenance
Other12%
1.01
1.281.38
1.71
1.20
1.50
1.80
) Fuel12%
Energy31%
Labor14%
15%0.74 0.85
0.30
0.60
0.90
(US
$/lb
)
10As of December 31, 2008 As of December 31, 2008
0.002003 2004 2005 2006 2007 2008

Low Cost of Operations
SCC’s cash cost as per Brook Hunt estimates is in the bottom quartile of global copper producers
High quality reserves, large scale open-pit mines, low cost SX-EW production, strong by-products credits, and management focus on cost efficiency are among SCC’s key low cost drivers
Top 8 Lowest Cash Cost Copper Producers1 Top 10 Lowest Cash Cost Copper Minesites1,2
100 0
80.0
100.0
5.116.6 18.1 18.4
79.9
40.0
80.0
54 0 57 066.0
86.040.0
60.0
c/lb
)
(82 7)(62.9)
(29.9)(22.7)
(80.0)
(40.0)
0.0
(c/lb
)(2.0)
39.754.0 57.0
(10.8)(16 8)
0.0
20.0
(c
(174.5)
(145.3)
(82.7)
(200.0)
(160.0)
(120.0)
(16.8)
-40.0
-20.0
SCC
Anto
faga
sta
Rio
Tin
to
Cod
elco
BHP
Billit
on
Xstra
ta
Angl
oAm
eric
an
Free
port
Sier
rita
Bing
ham
Can
yon
Anta
min
a
La C
arid
ad
Los
Pela
mbr
es
Bagd
ad
Toqu
epal
a
Chu
quic
amat
a
Cua
jone
OK
Tedi
Can
anea
11
Source: Based on companies reportsNotes:1 Excludes minesites/facilities with annual Cu production less than 100 Mlbs. As of 12/31/07.2 Operating cost net of by-product credits
B
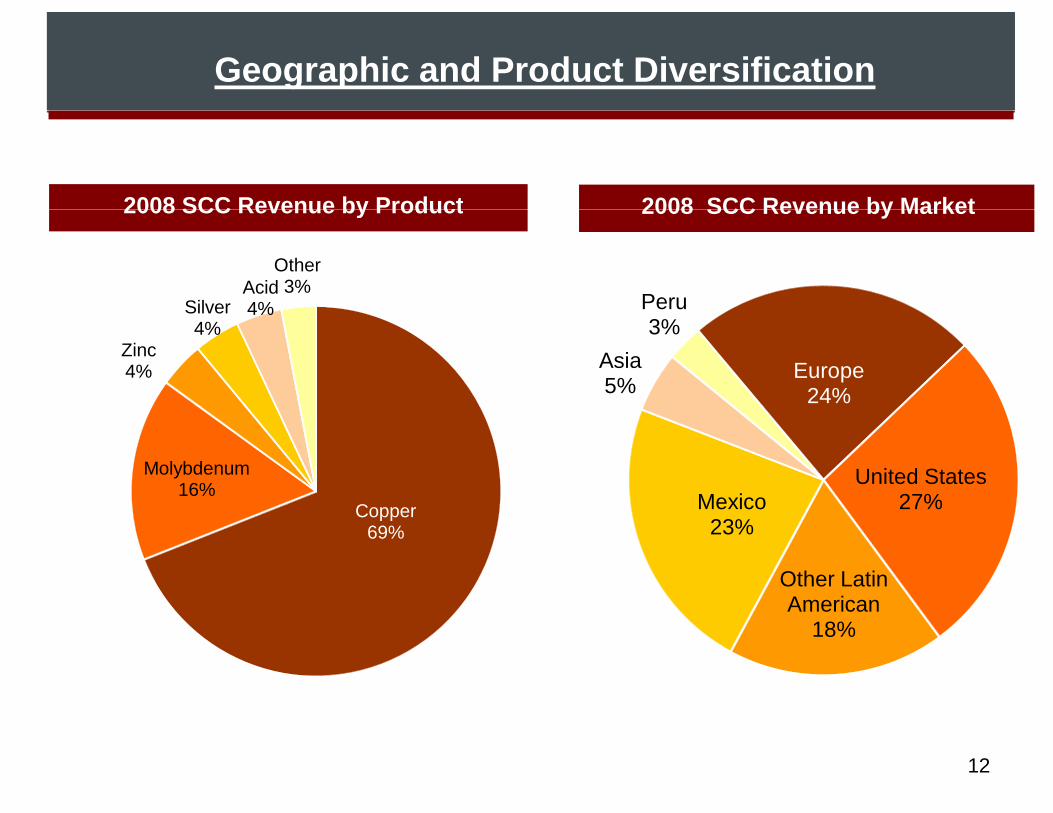
Geographic and Product Diversification
2008 SCC Revenue by Product 2008 SCC Revenue by Market2008 SCC Revenue by Product 2008 SCC Revenue by Market
SilverAcid 4%
Other 3%
Peru
Zinc 4%
Silver 4%
4%
Europe24%
Asia5%
Peru3%
Molybdenum19%
C
Molybdenum 16% United States
27%MexicoCopper 69%
27%
Other Latin American
Mexico23%
American18%
12

Expansion Projects
Tía María SX EW / Copper Ilo Metallurgical Operations ExpansionLBE for Operations: 4Q - 2010Annual Copper Production: 120 ktpyEstimated Capex: $934 M
LBE for Operations: 2012Additional Concentrates from Cuajone & Toquepala, 445 ktpyS lt i f 1 2 MTPY tToquepala Concentrator Expansion
LBE for Operations: 2011Annual Production: Copper = 100
Smelter expansion from 1.2 MTPY to 1.8 MTPYCopper Anode production: 325 ktpy to 490 ktpyktpy; Moly = 3.1 ktpy
Estimated Capex: $600 M
490 ktpyCopper Cathode production: From 280 ktpy to 360 ktpyEstimated Capex: $200 MCuajone Concentrator Expansion Estimated Capex: $200 M
LBE for Operations: 2012Annual Production: Copper = 50 ktpy Moly = 0.7 ktpy
j
y pyEstimated Capex: $374 M
Additi l C P d ti 270 kt C $2 1B13LBE : Last Best Estimate
Additional Copper Production : 270 ktpy; Capex : $2.1B

Tia Maria Project
Estimated Capex : US $934 M120,000 MT of copperSX EW Cathodes per yearLBE for Operations :
14
2010, for 18 years

Tia Maria: New Operating Unit Overview
Key Metals: Copper
SX EW Plant Capacity: 120 ktpy
Key Operating DataHighlightsLocated at 100 Km north of Ilo, PeruAnnual production of 120 ktpy of copper SX-EW Plant Capacity: 120 ktpyAnnual production of 120 ktpy of copperCash cost estimated at ¢ 70-80 per Lb
Life of mine : 18 years
ExpansionResource Information
Possible concentrator after 2021, when sulfide resources are reached
Resource: 2.5 MT of contained copper
Average Copper Grade: 0.39%
Stripping Ratio: 1.00x
15Source: SCCNote:(1) Reserves based on US$0.90 per pound of copper.

III. Financial Overview
16

SCC Financial Summary
(US$ MM) 2005 2006 2007 2008Copper Price (LME) US$ per pound 1.67 3.05 3.23 3.16Income Statement:Net Revenues $4,089 $5,460 $6,086 $4,851EBITDA 2,335 3,316 3,766 2,557EBITDA Margin 57% 61% 62% 53%Interest Expense 109 113 123 116Interest Expense 109 113 123 116Net Income 1,400 2,038 2,216 1,407Balance Sheet Statement:Cash & Equivalents $876 $1,023 $1,409 $717Total Assets 5,688 6,376 6,581 5,730Total Debt 1 1,172 1,528 1,450 1,290Total Liabilities 2,349 2,696 2,716 2,331Total Shareholders' Equity 3,326 3,667 3,848 3,385Cash Flow Statement:Capital Expenditures 2 $471 $456 $316 $517F C h Fl 3 1 193 1 604 2 388 1 204Free Cash Flow 3 1,193 1,604 2,388 1,204Key Credit RatiosNet Debt / EBITDA 0.1x 0.2x 0.01x 0.2xEBITDA / Interest Expense 21 4 29 3 30 6 22 0
17
EBITDA / Interest Expense 21.4 29.3 30.6 22.0
1 Includes short-term and long-term debt including current portion2 Includes capitalized stripping costs until 20053 Free Cash Flow defined as net cash from operating activities less capital expenditures

Solid Financial Performance
Among the highest EBITDA margins and strongest leverage ratios in the metals & mining industry
2007 EBITDA Margin (%) Net Debt/ 2007 EBITDA (x)2007 EBITDA Margin (%) / ( )
72%Antofagasta-0.7xAntofagasta
62%Southern Copper 0.01xSouthern Copper
46%
46%
Freeport
Anglo American
0.5x
0.4x
Anglo American
BHP Billiton
46%BHP Billiton
p
1.0x
0.7x
Xstrata
FCX
42%Rio Tinto2.7xCVRD - Inco
18Source: SCC; Company Reports
39%Xstrata 3.2xRio Tinto

Focus on Total Return to Investors
Current Dividend Yield1 (%) 3-Year Share Price Performance1 (%)
Disciplined approach to creating shareholder value
12.1%Southern Copper39% Southern Copper
7.4%
8.9%
Freeport
Antofagasta
14%
23%
Antofagasta
BHP Billiton
5.6%
6.8%
Anglo American
Rio Tinto
-36%
13%
Anglo American
CVRD
3.3%
4.6%
BHP Billiton
CVRDIn 2008, SCC paid
US$1.7 Billion
US$ 1.94 per share
-53%
-53%
Xstrata
Rio Tinto
0.0%
0 0% 2 0% 4 0% 6 0% 8 0% 10 0% 12 0% 14 0%
Xstrata -57%
-60% -40% -20% 0% 20% 40% 60%
Freeport
19
Source: Bloomberg; Company FilingsNote:1 Regular and special dividends declared over last twelve months by record date
divided by current share price as of December 31, 2008 (SCC = US$16.06)1 As of December 31, 2008
0.0% 2.0% 4.0% 6.0% 8.0% 10.0% 12.0% 14.0% 60% 40% 20% 0% 20% 40% 60%

Capital Expenditure Forecast (US$M)
$107
$199$1,200
$800
$1,000
$940
$1,200$600
$517$393
$780
$250$200
$400
$250$0
2008 2009E 2010E 2011E 2012E 2013E
20Source: SCC

SCC Debt Amortization Schedule
Millions of USD as of December 31, 2008
SCC is evaluating the best financing option for its projects.
$1,000
$56
$200
$0 $10 $10 $10 $10 $10$
2008 2009 2010 2011 2012 2013 2015 2028 2035
21
Mitsui Yankee Bonds 10 & 30 year Bonds

IV. Appendix
22

Estimated Production Capacity Growth
(Ktpy)1,579 1,579
1,3421,276
1,086
970 116
190
66
237
920820
120
50100
116
700
2008 Full CapacityProduction
2010 - Tía MaríaSX EW (120 ktpy
Cu)
2012 - ToquepalaConcentrator
Expansion (100ktpy Cu)
2012 - CuajoneConcentrator (33
ktpy Cu) + SX EW(17 ktpy Cu)
2014 - LosChancas SX EW
(100 ktpy Cu) 2011- Angangueo (16
ktpy Cu)
2014 - El Arco SXEW +
Concentrator (190ktpy Cu)
2014 - Cananea SXEW +
ConcentratorExpansion (66
ktpy Cu)
2016 - NewCananea
Concentrator (160ktpy Cu) 2013 -
Buena Vista Mine
2016 - TotalProduction
ktpy Cu) ktpy Cu) Buena Vista Mine(22 ktpy Cu)
1D 1D 2P 2P 2P 2P
2014 20162008
Stage
2010 - 2012
1D
23Source: SCC

Other Expansion Projects
El Arco (SX EW + Concentrator) Los Chancas (SX EW + Concentrator)
LBE for Operations: 2014Annual Copper Production: SX-EW = 35 ktpy; Conc.= 155 ktpy
LBE for Operations: 2014Annual Copper Production: SX-EW = 20 ktpy Conc = 80 ktpySX EW 35 ktpy; Conc. 155 ktpy
Annual Gold Production= 81 kozpyEstimated Capex: $1,800 M
SX EW 20 ktpy Conc. 80 ktpyAnnual Moly= 4.7 ktpyEstimated Capex: $1,200 M
LBE for Operations: 2014
Angangueo
Capacity 2000 tpd (Cu, Zn, Ag).Annual Copper Production: 16 ktpyEstimated Capex: $145 M
$24Source: SCC LBE : Last Best Estimate
Additional Copper Production : 306 ktpy; Capex : $1.9B

Operational Update - Cananea Minesite
Key Metals: Copper
Concentrator Capacity: 77 ktpd
Operating Statistics (2008) HighlightsLargest mine in MexicoFourth largest copper mine worldwide in Concentrator Capacity: 77 ktpd
SX-EW Plant Capacity: 55 ktpy
Copper Production: 16 kt
Fourth largest copper mine worldwide in terms of reserves (similar to Escondida)Recent LOM study shows operations th h 2070 U i d itthrough 2070 Unique deposit: no evidence of decline in ore grades at deeper stratas
Reserve Information (2007)
Reserves (1): 19.0 MT
ExpansionSeveral projects underway or planned to increase production to an estimated 66kt
Average Copper Grade:
Sulfide: 0.577%
Leachable Materials: 0.267%
per year:- SX-EW III 33 ktpy- Concentrator expansion 33 ktpy
Production (kt)
Stripping Ratio: 2.23x
p pyMolybdenum circuit, 4 ktpyPossible second expansion to increase capacity by an additional 160 ktpy
173 175 164 99
25
capacity by an additional 160 ktpySource: SCCNote:(1) Reserves based on US$1.20 per pound of copper.
99
162004 2005 2006 2007 2008

Operational Update - Caridad MinesiteOperating Statistics (2008)
Key Metals: Copper, Mo, Au, Ag
Concentrator Capacity: 90 ktpd
Highlights
p y p
SX-EW Plant Capacity: 22 ktpy
Copper Production: 119 kt
Molybdenum Production: 7 28 kt
Second largest mine in Mexico
Recent LOM study shows operations
through 2044Molybdenum Production: 7.28 kt
Increasing Mo grades with depth
potentially allows conversion of
operations to a copper equivalent mine
Reserve Information (2007)
Reserves (1): 5.2 MToperations to a copper equivalent mine
ExpansionP t ti l t i d
Average Copper Grade:
Sulfide: 0.348%
Leachable Materials: 0.161%Potential to increase copper and
molybdenum recoveries
Future moly plant expansion due to Production (kt)
Stripping Ratio: 1.73x
higher ore grade
132 144 125 119
26Source: SPCCNote:(1) Reserves based on US$1.20 per pound of copper.
69
2004 2005 2006 2007 2008

Operational Update - Cuajone MinesiteOperating Statistics (2008)
HighlightsKey Metals: Copper, Mo
Concentrator Capacity: 87 ktpdSecond largest copper mine in Peru
Leachable ore sent to Toquepala by
pipeline
Concentrator Capacity: 87 ktpd
Copper Production: 196kt
Molybdenum Production: 4.4 ktpipeline
LOM study shows expanded
operations through 2038
h l bd b d d
Reserve Information (2007)
Reserves (1): 9.1 MTAverage Copper Grade:
High molybdenum by-product credits
Expansion
g ppSulfide: 0.566%Leachable Materials: 0.584%
Stripping Ratio: 2.36xp
Concentrator expansion underway:
– Copper : +50 ktpy
M l bd 700 t
Production (kt)
– Molybdenum : +700 tpy194
164 174 182
196
27Source: SPCC(1) Reserves based on US$1.20 per pound of copper. Includes sulfur ore reserves
and in-pit leachable reserves.
2004 2005 2006 2007 2008

Operational Update - Toquepala Minesite
Key Metals: Copper, Mo
Concentrator Capacity: 60 ktpd
Highlights
Thi d l t i i P
Operating Statistics (2008)
Concentrator Capacity: 60 ktpd
SX-EW Plant Capacity: 56 ktpy
Copper Production: 153 kt
Third largest copper mine in Peru
LOM study shows expanded operations
through 2036Molybdenum Production: 4.7 ktHigh molybdenum by-product credits
Installation of crusher / conveyor
system for leachable ore in operation
Reserves Information (2007)
Reserves (1): 16.0 MTy p
Expansion
Average Copper Grade:Sulfide: 0.598%Leachable Materials: 0.195%
Concentrator & SX EW expansion
underway: Production (kt)
Stripping Ratio: 5.07x
– Copper : +100 ktpy
– Molybdenum : +3.1 ktpy
203 194 188 178 153
28Source: SPCC(1) Reserves based on US$1.20 per pound of copper. Includes sulfur ore reserves
and in-pit leachable reserves.
203 194 188 178 153
2004 2005 2006 2007 2008

Operational Update - Caridad Metallurgical Complex
Highlights
Consists of a smelter, electrolytic copper
Operating Statistics (2008)
Smelter capacity: 1,000 ktpy
refinery, precious metal refinery and a
copper rod plant
10th largest copper smelter worldwide
Anode capacity: 300 ktpy
Cathode production: 140 kt10th largest copper smelter worldwide
8th largest copper refinery worldwide
World-class facilities commissioned in
1997 09
Rod plant capacity: 150 ktpy
Copper rod production: 76 kt
1997-09
Plans for a 600 Megawatt coal-fired
Gold production: 666 kg
Silver production: 136 tons
Sulfuric acid production: 578 ktpower facility by 2012, to be built and
operated by an independent power
producer.
Sulfuric acid production: 578 kt
producer.
29

Operational Update - Ilo Metallurgical Complex
Operating Statistics (2008)
Smelter Capacity: 1,200 ktpy
Highlights
Consists of a smelter, anode plant, Smelter Capacity: 1,200 ktpy
Copper Anode Production(1): 307 kt
Cathode Capacity: 280 ktpy
electrolytic plant and precious metals
plant
6th largest copper smelter worldwideCathode Production: 249 kt
Silver Production: 92 tons
G ld P d ti 153 k
g pp
9th largest copper refinery worldwide
Record production in 2005
Long term power supply agreement Gold Production: 153 kgLong-term power supply agreement
with Enersur until 2017
Expansion
Ilo modernization completed in 1Q07
- 2¢/lb reduction in cash cost
Sulfuric acid production increased- Sulfuric acid production increased
from 0.35 to 1.1 million tons
Potential to further increase capacity
30
- Smelter: 1,800kt/y
- Refinery: 360kt/y(1) Blister production has been replaced by anode production as of January 2006.

SLP Metallurgical Complex: Overview
Operating Statistics (2008)Highlights
Assets consist of copper smelter and zinc Zinc refinery capacity: 105 ktpyrefinery
One of the most cost-efficient zinc refineries
in the world
Zinc refinery capacity: 105 ktpy
Zinc production: 107 kt
Copper concentrate f d itin the world
Expansion
feed capacity: 230 ktpy
Copper concentrate feed: 41 ktPossible 55kt/y expansion of the zinc
refinery underwayCopper blister production: 19 kt
31

Comparable Company AnalysisSouthern Copper Antofagasta Codelco Freeport
Data as of: LTM 12/31/2008 LTM 06/30/2008 12/31/2007 LTM 12/31/2008Current Rating Ba1 / BBB- / BB+ -- / -- / -- Aa3 / A / -- B1 / B+ / --
I St t tIncome StatementNet Revenues $4,851 $4,292 $16,988 $17,796EBIT 2,202 2,902 8,548 (12,710) EBIT Margin 45% 68% 50% -(71%)EBITDA $2,557 $2,986 $7,853 (11,202) EBITDA Margin 53% 70% 46% -(63%)Interest Expense $116 $16 $245 $584Net Income 1,407 2,232 2,982 (11,341)
Balance SheetCash & Equivalents $717 $2,349 $2,074 $872Total Assets 5,730 6,527 15,058 23,271 Total Debt 1,290 214 4,354 7,351 Net Debt 573 (2,135) 2,280 6,479 Total Liabilities 2,331 1,111 10,309 16,153 Minority Interest 14 1,018 3 1,328 Total Shareholders' Equity 3,385 5,416 4,744 5,790
Credit RatiosTotal Debt / EBITDA 0.5x 0.1x 0.6x (0.66x)N t D bt / EBITDA 0 20 (0 7) 0 3 (0 6)
32
Net Debt / EBITDA 0.20 (0.7) 0.3 (0.6) EBITDA / Interest Expense 22.0 186.6 32.1 (19.2)
Source: Companies filings

Summary of Reserves Data 1
The table below details SCC’s copper and molybdenum reserves as of December 31, 2007 Cuajone Toquepala Cananea La Caridad Total Immsa 2
Mineral Reserves (Peru) (Peru) (Mexico) (Mexico) Open-Pit Mines (Mexico)
Mineral Reserves
Metal Prices:
Copper ($/lb.) $1.20 $1.20 $1.20 $1.20 $1.20 $1.20
Molybdenum ($/lb.) $9.00 $9.00 $9.00 $9.00 $9.00 $9.00
Sulfide ore reserves (000's of tons) 1,594,589 1,940,206 2,511,484 932,191 6,978,470 40,781
Average Grade:
Copper 0.566% 0.598% 0.577% 0.348% 0.550% 0.490%
Molybdenum 0.020% 0.036% - 0.026% 0.028% -
Leachable Materials
R i t k (000' f t ) 20 701 940 502 704 587 513 291 2 179 081 Reserves in stock (000's of tons) 20,701 940,502 704,587 513,291 2,179,081 -
Average copper grade 0.482% 0.143% 0.127% 0.252% 0.167% -
In-pit reserves (000's of tons) 10,902 2,117,946 1,670,689 1,189,125 4,988,662 -
Average copper grade 0 584% 0 195% 0 267% 0 161% 0 212% - Average copper grade 0.584% 0.195% 0.267% 0.161% 0.212%
Total leachable reserves (000's of tons) 31,603 3,058,448 2,375,276 1,702,416 7,167,743 -
Average copper grade 0.517% 0.179% 0.225% 0.188% 0.198% -
Copper contained in ore reserves (000's of tons) 39,089 15,732 18,952 5,159 48,932 200
33
Source: SCCNotes:1 Reserves based on long-term price assumptions of US$1.20 per pound of copper and US$9.00 per pound of molybdenum.2 The Immsa Unit includes the Charcas, Santa Bárbara, San Martin, Santa Eulalia and Taxco mines. 3 Copper contained in ore reserves for open-pit mine is (I) the product of sulfide ore reserves and the average copper grade plus (ii) the product of in-pit leachable reserves
and the average grade of copper. Copper contained in ore reserves for underground mines is the product of sulfide ore reserves and the average copper grade.
pp ( ) 9,089 15,732 18,952 5,159 48,932 200

Debt Breakdown
US$ MM as of December 31, 2008 Type Maturity Amount Interest Rate
Yankee Bonds9.25% Senior Unsecured Bonds Unsecured 2028 / bullet $56 9.25%
Sub-total $56
Unsecured Notes6.375% Notes due 2015 1 Unsecured 2015 / bullet $200 6.375%7.50% Notes due 2035 1 Unsecured 2035 / bullet $1,000 7.50%
Sub-total $1,200
OtherS / $ O % %Mitsui bank credit agreement Secured 2013 / amortizing $50 LIBO + 1.250%=aprox. 3.57%
Sub-total $50
Total Debt $1,306
34Source: SCC1 At face value