southeast alaska 2020 economic plan...developed a strategic blueprint for regional collaboration....
TRANSCRIPT

Southeast Alaska by the Numbers, 2017 Prepared by Rain Coast Data Page 1
Southeast Alaska 2020 Economic Plan
Southeast Conference’s Comprehensive Economic Development Strategy
2016-2020
Updated June 2017
Prepared byRain Coast Data
SOUTHEAST CONFERENCE

Southeast Alaska 2020 Economic Plan: Updated 2017 Prepared by Rain Coast Data Page 1
Southeast Conference is a designated Economic Development District (EDD) through the US Economic Development Administration (EDA). As the region’s EDD, Southeast Conference is responsible for developing a Comprehensive Economic Development Strategy (CEDS) for Southeast Alaska designed to identify regional priorities for economic and community development. This plan follows the new guidelines released by the US Economic Development Administration in February 2015. The CEDS is a strategy-driven plan developed by a diverse workgroup of local representatives from private, public, and nonprofit sectors. The following sections form the basis for the Southeast Conference CEDS:
One page Strategic Plan Summary page 2;
Summary Background of economic conditions in the region pages 3-14;
SWOT Analysis to identify regional Strengths, Weaknesses, Opportunities, and Threats page 15;
Economic Resilience map detailing how Southeast Alaska communities intend to respond to the looming State fiscal crisis page 16;
Strategic Direction Action Plan incorporating tactics identified through planning process, other plans, and stakeholder feedback to develop the priority strategies for the region pages 17-29;
Strategic Direction Action Plan Part II Priority Objective Descriptions and Evaluation Framework to identify and monitor performance measures associated with the plan pages 30 to 39;
Economic Plan Steering Committee roster of names page 40;
Appendices page 41.
Southeast 2020 Strategic Plan Introduction
Southeast Alaska Comprehensive Economic Development Strategy Meeting Schedule
Month Transportation Energy Timber Maritime Seafood Tourism Other CEDS
March 2015
August 2015
September 2015
October 2015
November 2015
January 2016
February 2016
March 2016
April 2016
!
!
!!
! !
!
!
!
!
!
!
!
!
!
!
!
!
!
!
!
!
!
!!
!
!
!
!
!
!
!
!
!
The CEDS process began in March 2015 to ensure maximum input from the Southeast Conference membership. This process engaged community leaders, leveraged the involvement of the private sector, and developed a strategic blueprint for regional collaboration. More than 400 people representing small businesses, tribes, native organizations, municipalities, and nonprofits were involved in various elements of the planning process. The following timeline shows meetings that took place in developing the five year plan. The plan was updated in June of 2017.

Southeast Alaska 2020 Economic Plan: Updated 2017 Prepared by Rain Coast Data Page 2
Transportation Priority Minimize Impacts of
Budget Cuts to AMHS and Develop Sustainable Operational Model.
Road Development. Move Freight to and from Markets
More Efficiently. Ensure the Stability of Regional Transportation
Services Outside of AMHS.
Energy Priority Promote Priorities Of The Regional Energy
Plan Including Infrastructure and Diesel Displacement
Support Community Efforts to Create Sustainable Power Systems That Provide Affordable/Renewable Energy.
Complete Regional Hydrosite Evaluation for Southeast Alaska.
Maritime Maritime Industrial Support
Priority Maritime Industrial Support Sector Talent Pipeline: Maritime Workforce Development Plan.
Continue to Grow the Regional Maritime Sector. Increase Access to Capital for the Regional Maritime
Industrial Support Sector. Support Capital Investments in
Expanded Marine Industry Support Infrastructure.
Harbor Improvements. Examine Arctic Exploration
Opportunities That the Region as a Whole Can Provide.
Seafood Industry Priority Mariculture Development. Priority Full Utilization and Ocean
Product Development. Increase Energy Efficiency and
Reduce Energy Costs. Regional Seafood Processing. Seafood Markets. Sea Otter Utilization and
Sustainable Shellfish. Maintain Stable Regulatory
Regime. Seafood Workforce Development.
Visitor Industry Priority Market Southeast Alaska to
Attract More Visitors. Improve Access to Public Lands. Increase Flexibility in Terms of
Permit Use. Increase Yacht and Small Cruise
Ship Visitations. Improve Communications
Infrastructure. Advocate for Funding to Maintain Existing
Recreational Infrastructure. Grow Cultural and Arts Tourism.
Timber Industry Priority Provide an Adequate,
Economic and Dependable Supply of Timber from the Tongass National Forest to Regional Timber Operators.
Stabilize the Regional Timber Industry.
Work with USFS to Direct Federal Contracts Toward Locally-Owned Businesses.
Support Small-Scale Manufacturing of Wood Products in Southeast Alaska.
Continue Old-Growth Harvests Until Young-Growth Supply is Adequate.
Community-Based Workforce Development. Update Young Growth Inventory.
Other Objectives Housing: Support Housing
Development. Food Security: Increase
Production, Accessibility, and Demand of Local Foods.
Communications: Improved Access to Telemedicine in Southeast Alaska.
Marketing: Market Southeast Alaska as a Region.
Solid Waste: Regional Solid Waste Disposal. Education: Partner with University & K-12 to Meet
Workforce Needs Arts: Increase Recognition of Southeast Alaska’s
Thriving Arts Economy. Mining: Minerals & Mining Workforce Development. Research: Attract Science and Research Jobs to
Southeast Alaska. Cultural Wellness: Support Activities and
Infrastructure That Promote Cultural Wellness Healthcare: Meet Regional Needs.
SOUTHEAST 2020 STRATEGIC PLAN SUMMARY In June 2017, Southeast Conference updated the Southeast Alaska 2020 Economic Plan, a five-year strategic plan for the region. The membership worked together to develop an overall vision statement, 46 objectives, and 7 priority objectives, along with regional and industry specific SWOT analyses. More than 400 people representing small businesses, tribes, Native organizations, municipalities, and nonprofits were involved in various elements of the planning process. The Plan’s objectives are listed below.

S O U T H E A S T C O N F E R E N C E
Southeast Alaska 2020 Economic Plan: Updated 2017 Prepared by Rain Coast Data Page 3
5
Yakutat
HainesSkagway
Juneau
Gustavus
Metlakatla
Ketchikan
SitkaAngoon
Kake
Wrangell
Petersburg
Hoonah
Tenakee
Hyder
Port Alexander
Elfin Cove
Point Baker
Edna BayPort Protection
Whale Pass
KlawockCraig
Naukati
Hydaburg Hollis
Thorne Bay
Klukwan
Pelican
Kasaan
Coffman Cove
SOUTHEAST ALASKA Summary Background 2017
CHANGES IN THE REGION 2014 TO 2016
REGIONAL POPULATION DECREASED BY 648 PEOPLE TO 73,812 -1%
LABOR FORCE DECREASED BY 434 JOBS TO 45,260 JOBS -1%
STATE GOVERNMENT JOBS DECREASED BY 565 JOBS TO 4,940 -10%
PASSENGER ARRIVALS FROM OUTSIDE THE REGION INCREASED BY 110,425 PEOPLE +8%
TOTAL POUNDS OF SEAFOOD LANDED IN THE REGION DECREASED BY 77 MILLION POUNDS A LOSS OF -26%
Last year was a tough year for the Southeast Alaska economy. Jobs and workforce earnings were down for the first time since 2007. Population dropped for the second year in a row, the first losses in a decade as well.
The reason for this economic decline is clear. Dropping oil prices combined with falling oil production have drastically reduced the state’s share of oil earnings. Southeast Alaska is uniquely dependent on state government, which directly provides 14% of all wages in the region. In the last two and a half years, the region has lost 14% of all state jobs. We are not nearing the end of this economic disruption, we are merely at the beginning of it.
Unfortunately, it is not only state government that is struggling. Last year was also the worst year for our seafood sector in over a decade. The visitor industry surpassed seafood as being the top private sector industry in terms of both jobs and wages for the first time, ever. In fact, tourism is booming, and 2017 will be a record year for the industry. Alaska’s popularity is growing, and Southeast Alaska is the most visited region of the state. The visitor industry is slated to grow another six percent in 2018.
Despite so many falling economic indicators, Southeast Alaska business leaders are generally optimistic. While 99% say they are concerned about the region overall, two-thirds say they expect their own business or industry to remain stable or to improve in the upcoming year, and they have invested accordingly.
Map of Southeast Alaska
and the AMHS ferry route 2 017

Southeast Alaska 2020 Economic Plan: Updated 2017 Prepared by Rain Coast Data Page 4
16% OTHERFEDERALHOLDINGS
MAKEUPNEARLYALLTHEREST(MOSTLYGLACIERBAY)
ALASKANATIVEORGANIZATIONS
ARETHEREGION’SNEXTLARGEST
LANDOWNER
3.4%
2.5%STATEOFALASKA
LANDSINCLUDETHOSEMANAGEDAS
PARTOFTHEMENTALHEATHTRUST
0.25% MUNICIPALLANDHOLDINGS
0.05% PRIVATELANDOWNERS
Sout
heas
t Ala
ska
Land
Ow
ners
hip
Circ
le si
ze =
Num
ber o
f Acr
es
THE REGION The Southeast Alaska Panhandle extends 500 miles along the coast from Metlakatla to Yakutat, encompassing approximately 33,500 square miles of land and water. The full saltwater shoreline of Southeast Alaska is approximately 18,500 miles. More than 1,000 islands make up 40 percent of the total land area. The region is home to 34 communities. The three largest communities—Juneau, Ketchikan, and Sitka—together are home to 75 percent of the regional population.
CULTURE The dominant culture in the region is indigenous.
Alaska Natives—the Tlingit, Haida, and Tsimshian—make up nearly a quarter (22.4%) of the region’s population. The
Tlingit have resided in the region for 11,000 years. The region’s mild climate, abundant food and raw materials
supported the development of highly organized and culturally advanced societies with extensive trade routes.
ECONOMIC TRENDS Beginning in the 1880s, the economy of Southeast Alaska experienced a century of growth that intensified after statehood in 1959. From statehood into the 1990s, population and employment levels in Southeast more than doubled as the workforce expanded in the areas of mining, government, fishing, tourism, and timber. In the beginning of the 1990’s seafood and timber directly accounted for a fifth of the regional economy. However, over that next decade pulp mills and sawmills in the region closed, laying off 3,200 workers. During the same period, the value of salmon declined and catch levels fell. Total Southeast Alaska wages hit bottom in 1997. Population continued to decline through 2007. Between 2008 and 2015 the region staged an economic recovery, rebounding to record numbers of jobs, wages, and residents. However, the recent state budget crisis has changed the economic trajectory of the region. Population and employment levels are once again declining, and the adverse economic consequences of state job and budget cuts will continue.
LAND OWNERSHIP The lack of privately owned land and land available for development is unique in Southeast Alaska and impedes the ability of the region to nurture the private sector. (See infographic on the left.) Southeast Alaska’s land ownership is dominated by the federal government, which manages 94 percent of the land base. Most of this (78%, or 16.75 million acres) is the Tongass National Forest. The remaining federal lands are mostly in Glacier Bay National Park. The State manages 2.5 percent of the total land base (511,500 acres), including the Alaska Mental Health Trust Authority and University of Alaska lands. Boroughs and communities own 53,000 acres—a quarter of one percent of the entire regional land base. Alaska Native organizations, including village, urban, and regional corporations and the Annette Island Reservation, own 3.4 percent (728,100 acres) of the land base. Other private land holdings account for 0.05 percent of the remaining land base.
SOUTHEAST ALASKA REGIONAL OVERVIEW
Sources: Personal communications with Kyle Moselle, State of Alaska; Susan Jennings, US Forest Service; Brian Kleinhenz, Sealaska. Economies in transition: An assessment of trends relevant to management of the Tongass National Forest, USDA 1998. Photo Credit: Canoe by Annie Caufield.
78%THEFEDERALLY-MANAGEDTONGASSMAKESUPNEARLY
4/5THOFALLSOUTHEASTALASKA

S O U T H E A S T C O N F E R E N C E
SOUTHEAST ALASKA BY THE NUMBERS 2017 A SOUTHEAST CONFERENCE PUBLICATION BY RAIN COAST DATA
DEMOGRAPHICS 2014 2016% CHANGE 2014-2016
CHANGE 2014-2016
Population 1 74,460 73,812 -1% -648 Ages 65 and older 2 9,243 10,144 10% 901 Under Age Five 2 4,622 4,368 -5% -254 Twenty somethings 2 9,398 8,866 -6% -532 K-12 School District Enrollment 3 11,804 11,571 -2% -233GENERAL ECONOMIC CONDITIONS
Total Labor Force (jobs, includes self-employed & USCG)1,5,6 45,694 45,260 -1% -434 Total Job Earnings1, 5, 6 $2.174 billion $2,178 billion 0.2% 4,067,261 Total Private Sector Payroll 1, 6 $1.408 billion $1.407 billion -0.1% -1,140,735 Average Annual Wage 1 $47,593 $48,673 2.3% 1,080 Annual Unemployment Rate 1 7.10% 6.10% -1% -1%TOP ECONOMIC SECTORS 2014 2016 % CHANGE CHANGE
GOVERNMENT PUBLIC SECTOR: 35% OF ALL EMPLOYMENT EARNINGS
Total Government Employment 1, 5 13,602 13,052 -4% -550 Federal Employment 1, 5 (8% of all employment earnings) 2,110 2,108 -0.1% -2 State Employment 1 (14% of all job earnings) 5,504 4,939 -10% -565 City and Tribal Employment 1 (14% of all job earnings) 5,988 6,005 0.3% 17 Total Government Payroll (includes USCG) 1, 5 $765.8 million $771.0 million 1% $5.2 million Total State of Alaska Payroll $311.3 million $301.6 million -3% -$9.7 millionVISITOR INDUSTRY KEY INDUSTRY: 11% OF ALL EMPLOYMENT EARNINGS
Total Visitor Industry Employment 1, 6 6,923 7,752 12% 829 Total Visitor Industry Wages/Earnings 1, 6 $188.5 million $229.4 million 22% $40.9 million Total Southeast Alaska Passenger Arrivals 1,362,737 1,473,162 8% 110,425
Cruise Passengers 10 967,500 1,025,900 6% 58,400Total Air Passenger Arrivals from Outside SE 11 372,197 425,939 14% 53,742Total AMHS Passengers from Outside SE 12 23,040 21,323 -7% -1,717
COMMERCIAL FISHING & SEAFOOD INDUSTRY KEY INDUSTRY: 10% OF ALL EMPLOYMENT EARNINGS
Total Seafood Employment (includes fishermen) 1, 6 4,372 3,854 -12% -518 Total Seafood Employment Earnings 1, 6 $259.0 million $209.7 million -19% -$49.3 million Pounds of Seafood Processed7 232.9 million 168.4 million -28% -64.5 million Pounds Landed (commercial seafood pounds by SE residents) 8 300.9 million 223.4 million -26% -77.5 million Estimated Gross Earnings (ex-vessel value of pounds landed) 8 $275.7 million $221.0 million -20% -$54.7 million Shared Fish Taxes13 $5.8 million $2.7 million -53% -$3.1 millionHEALTH CARE INDUSTRY (PUBLIC & PRIVATE HEALTH) KEY INDUSTRY: 9% OF ALL EMPLOYMENT EARNINGS
Health Care Employment 1, 6 3,323 3,344 1% 21 Health Care Wages 1, 6 $174.5 million $189.3 million 8% $14.8 millionMARITIME ECONOMY (Includes employment from all industries) TOP SECTOR: 27% OF PRIVATE SECTOR EMPLOYMENT EARNINGS
Private Maritime plus USCG Employment 1,5,6 6,768 6,386 -6% -382 Private Maritime plus USCG Wages 1,5,6 $395.5 million $354.3 million -10% -$41.2 millionOTHER SELECTED STATISTICS 2014 2016 % CHANGE CHANGE
Construction Employment 1, 6 (6% all employment earnings) 2,168 2,033 -6% -135 Mining Employment 1 (4% of all employment earnings) 783 798 2% 15 Price of Gold 15 $1,266 $1,251 -1% -15 Cost of Living: Consumer Price Index1 215.805 217.83 1% 2 Housing Starts: Housing Permitted /Completed 4,1 321 369 15% 48 Avg. Daily Volume ANS Oil Production (mbbls/day)14 513,318 517,191 1% 3,873 Annual Avg. Domestic Crude WTI Oil Prices (in $/Barrel)14 $52.08 $43.34 -17% -$9
Table tracks key Southeast indicators over the past 2 years, along with associated changes.
Sources: 1Alaska Department of Labor (ADOL); 2ADOL Southeast Alaska Population by Age, 2014 to 2016; 3Alaska Department of Education and Early Development; 4Based on the quarterly Alaska Housing Unit Survey, a survey of local governments and housing agencies; 5 US Coast Guard; 6 2015 US Census Nonemployer (self-employment) Statistics; 7ADF&G Seafood Production of Shorebased Plants in Southeast Alaska, 2004 and 2016; 8ADF&G Southeast Alaska Commercial Seafood Industry Harvest and Ex-Vessel Value Information, 2014-2016; 10McDowell Group & Cruise Line Agencies of Alaska; 11US Bureau of Transportation Statistics (RITA); 12Alaska Marine Highway System data for 2015; 13Shared Taxes and Fees Annual Report FY16, ADOR; 14Alaska Department of Revenue Revenue Sources Book; 15Kitco Metals Inc.
TWO YEARS OF CHANGE: 2014 to 2016
Southeast Alaska 2020 Economic Plan: Updated 2017 Prepared by Rain Coast Data Page 6
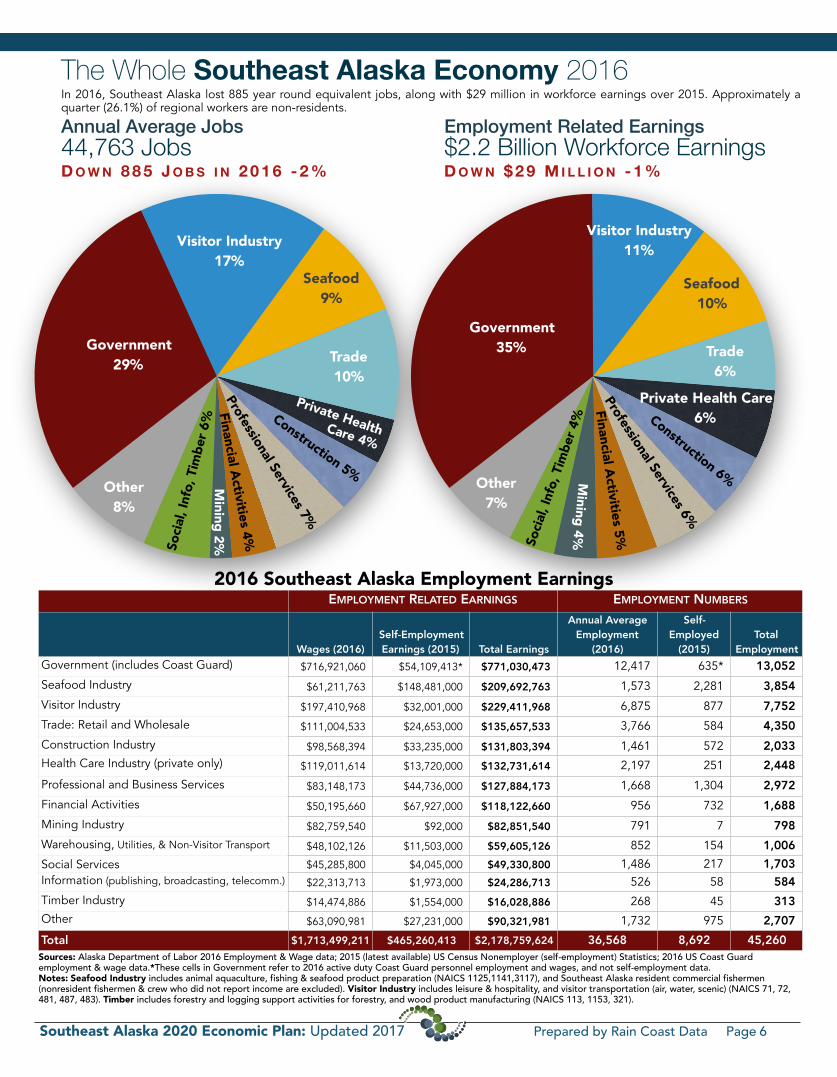
The Whole Southeast Alaska Economy 2016 In 2016, Southeast Alaska lost 885 year round equivalent jobs, along with $29 million in workforce earnings over 2015. Approximately a quarter (26.1%) of regional workers are non-residents.
44,763 Jobs $2.2 Billion Workforce Earnings D O W N 8 8 5 J O B S I N 2 0 1 6 - 2 % D O W N $ 2 9 M I L L I O N - 1 %
EMPLOYMENT RELATED EARNINGS EMPLOYMENT NUMBERS
Wages (2016)Self-Employment Earnings (2015) Total Earnings
Annual Average Employment
(2016)
Self-Employed
(2015)Total
EmploymentGovernment (includes Coast Guard) $716,921,060 $54,109,413* $771,030,473 12,417 635* 13,052Seafood Industry $61,211,763 $148,481,000 $209,692,763 1,573 2,281 3,854Visitor Industry $197,410,968 $32,001,000 $229,411,968 6,875 877 7,752Trade: Retail and Wholesale $111,004,533 $24,653,000 $135,657,533 3,766 584 4,350Construction Industry $98,568,394 $33,235,000 $131,803,394 1,461 572 2,033Health Care Industry (private only) $119,011,614 $13,720,000 $132,731,614 2,197 251 2,448Professional and Business Services $83,148,173 $44,736,000 $127,884,173 1,668 1,304 2,972Financial Activities $50,195,660 $67,927,000 $118,122,660 956 732 1,688Mining Industry $82,759,540 $92,000 $82,851,540 791 7 798Warehousing, Utilities, & Non-Visitor Transport $48,102,126 $11,503,000 $59,605,126 852 154 1,006Social Services $45,285,800 $4,045,000 $49,330,800 1,486 217 1,703Information (publishing, broadcasting, telecomm.) $22,313,713 $1,973,000 $24,286,713 526 58 584Timber Industry $14,474,886 $1,554,000 $16,028,886 268 45 313Other $63,090,981 $27,231,000 $90,321,981 1,732 975 2,707Total $1,713,499,211 $465,260,413 $2,178,759,624 36,568 8,692 45,260
2016 Southeast Alaska Employment Earnings
Sources: Alaska Department of Labor 2016 Employment & Wage data; 2015 (latest available) US Census Nonemployer (self-employment) Statistics; 2016 US Coast Guard employment & wage data.*These cells in Government refer to 2016 active duty Coast Guard personnel employment and wages, and not self-employment data. Notes: Seafood Industry includes animal aquaculture, fishing & seafood product preparation (NAICS 1125,1141,3117), and Southeast Alaska resident commercial fishermen (nonresident fishermen & crew who did not report income are excluded). Visitor Industry includes leisure & hospitality, and visitor transportation (air, water, scenic) (NAICS 71, 72, 481, 487, 483). Timber includes forestry and logging support activities for forestry, and wood product manufacturing (NAICS 113, 1153, 321).
Annual Average Jobs Employment Related Earnings
Other 7%
Private Health Care 6%
Trade 6%
Seafood 10%
Visitor Industry 11%
Government 35%
Construction 6%
Financial Activities 5%
Professional Services 6%
Mining 4%So
cial,
Info
, Tim
ber 4
%
Other 8%
Trade 10%
Seafood 9%
Visitor Industry 17%
Government 29%
Construction 5%
Financial Activities 4%
Professional Services 7%
Mining 2%So
cial,
Info
, Tim
ber 6
%
Private Health Care 4%

Southeast Alaska 2020 Economic Plan: Updated 2017 Prepared by Rain Coast Data Page 7
Government wages made up 35% of all
regional employment earnings ($771 million) and 29% of the region’s jobs (13,050) in 2016, but this sector is on the decline, especially at the state government level.
STATE GOVERNMENT LOSSES The biggest economic story of the year in the region is the decline in state government employment and spending. In Southeast Alaska, 14% of all direct wages come from the State. From 2014 through July 2017, more than 750 State of Alaska jobs were lost, along with associated annual wages of $46 million. This is a loss of 14% of all regional state jobs during that period. Three-quarters of these jobs came out of Juneau, with Ketchikan losing most of the rest. Declining oil production and prices have devastated the State of Alaska budget and are creating a
significant downward drag on the regional economy. State spending has nearly been cut in half over the last four years, but despite significant cuts the state still faces a $2.5 billion budget gap this year. The state has drawn $11.3 billion from state savings over the past four years. As these accounts are depleted, reductions will intensify, and fewer options for remediation remain. Public services across the region are being cut or paired back (such as the closure of public health centers in Wrangell and Haines). Reduced state spending also has a direct negative impact on the private sector since many local businesses provide the majority of their services to the public sector. Reduced government employment will therefore also decrease demand for goods and services across the region.
Moreover, because Alaska has not adopted a fiscal plan, its bond rating has been downgraded. Alaskans continue to receive an annual dividend from the state’s $60 billion Permanent Fund account.
FEDERAL GOVERNMENT Federal government employment losses are compounding state job cuts. Since 2004, jobs in this sector have fallen by 28%, translating into a loss of $48 million in wages across the region annually. Federal spending decline also means fewer projects and programs that support the region.
LOCAL GOVERNMENT Communities across the region are struggling financially, and relying on savings to cover unexpected shortfalls stemming from state budget cuts that have been passed onto municipalities. Despite these challenges, local government employment levels have remained flat, and total municipal and tribal wages were equivalent to the earnings of all state workers in 2016.
GOVERNMENT OUTLOOK Early job reports from 2017 are grim. Federal employment is predicted to decline by 2%, while State employment is expected to fall by another 4%. Since no legislative fiscal solution has been put in place and our savings are all but depleted, the negative impacts of the state fiscal crisis on our region will continue to intensify moving forward.
Sources: ADOL 2016 Employment and Wage data; U.S. Coast Guard; Alaska Department of Revenue. Photo Credit: Alaska Framed.
Government wages made up 35% of all Southeast Alaska employment earnings in
2016
State 14%
Local 12%
Coast Guard 3%
Federal 5%
(other)
Trib
al 2
%
4,500
5,100
5,700
2012
2013
2014
2015
2016
2017
Government 13,050 Jobs D O W N 4 5 0 J O B S I N 2 0 1 6 - 3 %
Southeast State Jobs State jobs in the region are down 200 in 2017 so far, for a total of 750 job lost since 2014, a decline of 14%
Local and Tribal 6,000 Jobs State 4,940 Jobs Federal 2,110 Jobs • 782 Coast Guard • 1,328 Other Federal
SOUTHEAST ALASKA GOVERNMENT
0
1100000
2200000
1977 1981 1985 1989 1993 1997 2001 2005 2009 2015 20170
27.5
55
82.5
110
1977 1981 1985 1989 1993 1997 2001 2005 2009 2013 2017
Avg. Daily Volume of the Trans Alaska Pipeline System and Inflation Adjusted Price Per Barrel, 1977-2017
Oil revenues historically accounted for 90 percent of the state’s unrestricted revenues
Average Daily Volume
Average Price per Barrel
How we got here

Southeast Alaska 2020 Economic Plan: Updated 2017 Prepared by Rain Coast Data Page 8
2007
2008
2009
2010
2011
2012
2013
2014
2015
2016
2017
2018
In 2016 the visitor industry took a giant step forward, replacing the seafood industry as the most important private sector industry, both in jobs (which it has been for a while) but also in total workforce earnings (see chart on page 4). The visitor industry accounted for 19% of regional employment (7,752 annual average jobs) and nearly a quarter (24%) of all private sector employment. Since 2010, visitor industry employment has grown by 32%, with 1,900 new jobs. Those working in the visitor industry earned $229 million in 2016—or 11 percent of all regional employment income.
In 2016, 1.5 million air, ferry, and cruise passengers came to Southeast Alaska from outside the region, a 3.7% increase over 2015. Airline passenger traffic was up 5%, and cruise passenger traffic to the region increased by 3%. Most visitors to the region (70%) come by cruise ship.
KEY ECONOMIC DRIVER Southeast Alaska is the most visited part of the state, with two-thirds of all tourists coming to the region. One-third of all Alaska visitor spending occurs in Southeast, where visitors spent an estimated $657 million in 2016 (excluding transportation to and from Alaska).
INCREASED JET SERVICE Southeast Alaska saw a record-breaking number of airline passengers in 2016 for the second year in a row. A total of 425,939 passengers arrived from outside the region, and 2017 is likely to break records as well. As of July 2017, airline passenger arrivals were up 1.4% over the first half of 2016. Delta Airlines began summer flight services between Juneau and Seattle in 2014, joining Alaska Airlines as a service provider for the first time since 1996, accounting for some of this increase.
CRUISE SHIP TRAFFIC Cruise passengers are also having a record year. In 2017, a projected 1,055,000 cruise ship passengers will visit the region, making 498 voyages on 33 cruise ships. Southeast Alaska is continuing to see larger ships replacing smaller vessels. To handle this change Juneau has built two new panamax docks that opened in 2016 and 2017, meaning Juneau has the capacity to host four 1,000-foot vessels at a time. Icy Strait Point completed a 400-foot floating dock, Adventure Center, and restaurant in 2016. Southeast Alaska is expected to receive 4.2% of all global cruise ship passengers in 2017.
The Alaska Tourism Marketing budget by the state was doubled in FY18, but still lags behind previous years and other states.
VISITOR OUTLOOKThe visitor industry has the strongest outlook of all Southeast Alaska industries, and 2017 will be the best year ever for this sector. As
the national economy grows stronger, Alaska’s popularity grows, and perceived security risks for international travel destinations increase, Southeast Alaska becomes even more attractive to visitors.
Cruise passenger arrivals will hit a new record in 2017—with a projected 25,000 more passengers than the current record set in 2008. In 2018, analysts are projecting an additional six percent increase in Southeast Alaska cruise passengers. Princess Cruises ship is adding a 7th ship, while Norwegian Cruises will add brand new Norwegian Bliss, the first cruise ship custom designed for Alaska waters. Windstar Cruises will begin service to the region in 2018, with Viking, Cunard and the upscale Azamara sending ships for the first time in 2019.
The number of cruise passengers coming to the region is expected to continue to rise as larger, higher capacity vessels visit the region. Airline passenger numbers are also expected to grow. Along with increased visitors, the number of jobs and related income in this sector will continue to improve.
Sources: Combination of ADOL 2016 Employment and Wage data and 2015 US Census Nonemployer (self-employment) Statistics; McDowell Group; US Bureau of Transportation Statistics (RITA); Alaska Marine Highway System; Cruise Line Agencies of Alaska; Cruise Market Watch; Juneau International Airport Passenger Statistics; Economic Impact of Alaska's Visitor Industry. Forecast 2020 U.S. Department of Commerce, US Office of Travel and Tourism Industries. OMB budgets.Note: In this analysis, the visitor industry includes leisure and hospitality businesses, along with air, water & scenic transportation companies.
Visitor Industry 7,752 Annual Avg. Jobs U P 3 5 0 J O B S I N 2 0 1 6 + 5 %
$0
$10
$20
FY14 FY15 FY16 FY17 FY18
Alaska Tourism Marketing Budget in Millions
$17.9 million
$1.5 million
$18.7 million
$12.0 million
THE VISITOR INDUSTRY
Chart: Southeast Alaska Cruise Passengers 2007-2018
$3 million
1,118,30
0 E
st.
1,055,0
00
Est.
1,025,9
00
99
4,00
0
96
7,500
99
9,6
00
937,0
00
88
3,00
0
876,00
0
1,018
,700
1,030
,100
1,017,0
00

Southeast Alaska by the Numbers, 2015 Prepared by Rain Coast Data Page 9
US Coast Guard Jobs: 782 (Active Duty and Civilian) Wages: $65.5 M Change in jobs 2014-16: +2%
Marine Transportation (Excluding Tourism) Jobs: 370 Wages: $25.6M Change in jobs 2014-16: -7%
Marine-Related Construction Jobs: 37 Wages: $3.9 M Change in jobs 2014-16: -45%
Fishing & Seafood Processing Jobs: 3,854 Wages: $209.7 M Change in jobs 2014-16: -19%
Marine Tourism Jobs: 1,034 Wages: $34.4 M Change in jobs 2014-16: +13%
Ship Building, Repair, Marinas Jobs: 309 Wages: $15.2 M Change in jobs 2014-16: +39%
SOUTHEAST MARITIME: 6,386 Jobs Private and US Coast Guard Maritime Employment & Workforce Earnings
24%
Maritime as a % of all private sector
earnings in SE
Total Jobs 2016: 6,386 Total Wages 2016: $354 Million Change in jobs since 2014: -354 Change in jobs by percent: -5% Change in earnings since 2014: -$41 Million Change in earnings by percent: -10%
Maritime icons created by graphic illustrator Averyl Veliz. Photo by Vigor Ketchikan.For methodology, notes, and sources, see www.raincoastdata.com/sites/default/files/Maritime by the Numbers.pdf
Southeast Alaska 2020 Economic Plan: Updated 2017 Prepared by Rain Coast Data Page 9
Southeast Private & USCG Maritime Economy 2014-2016

Southeast Alaska 2020 Economic Plan: Updated 2017 Prepared by Rain Coast Data Page 10
By most measures, 2016 was the worst fishing season in the region in more than a decade. The Southeast Alaska seafood harvest in 2016 was 223 million pounds with a total ex-vessel value of $221 million—a 40% decline in value and 53% decline in pounds landed from 2013—and 27% below the 10-year average.
THE SEAFOOD INDUSTRY IS A KEY ECONOMIC DRIVER Seafood harvests have been a critical part of the Southeast Alaska economy for thousands of years, and it was over Southeast Alaska salmon that statehood itself was fought. The regional seafood industry (including commercial fishermen and seafood processors) generated 3,854 annual regional jobs in 2016, making up 10% of all regional employment earnings and 9% of all jobs. Those working in our region’s seafood industry earned $45 million fewer dollars than in 2015. Nonresident commercial fishermen and crew members are excluded from these figures.
In 2016, the five salmon species represented 78% of the overall regional seafood catch in
terms of the volume—but only half of total ex-vessel value ($111 million). Halibut and blackcod—while just seven percent of the total pounds landed—accounted for more than one-third of the total catch value in 2016. (See double pie chart above).
The majority of the statewide catch of the chinook, coho, chum, shrimp, dunguness crab, and the dive fisheries occurs in Southeast Alaska; and Southeast Alaska generally accounts for more than three-quarters of all Alaska Chinook caught in the
state. However Southeast Alaska’s 2017 king salmon season has been the worst since 1975
resulting in an emergency order to stop both
commercial and sports fishing of kings.
SEAFOOD PROCESSING In 2016, shore-based seafood facilities in Southeast Alaska processed 168 million pounds of
seafood, with a wholesale value of $433 million, a 30%
decline in seafood pounds processed over 2015. State-shared
fisheries taxes for processing activity in FY16 generated $2.7 million for regional communities, a 53% drop from FY2014.
SEAFOOD INDUSTRY OUTLOOK The preseason forecast for 2017 predicted 51 million salmon. As of August 2017, 42 million had been captured. King and sockeye levels were far below expectations, while coho levels were up. Prices were up in 2017 including chums, which were garnering up to 85 cents a pound, compared to just 60 cents on average last year, due to demand for roe. However, uncertainty regarding commercial fisheries budget cuts, along with global advances in salmon farming, threaten the industry.
VALUE & POUNDS OF SEAFOOD LANDED SOUTHEAST ALASKA 2008 TO 2016
125250
375500
$270
$390
2008 2009 2010 2011 2012 2013 2014 2015 2016
Inflation AdjustedValue to Fishermen (millions)Landed Pounds (millions)
223301301479267396278283220
$221$237
$278
$367$335
$384
$305
$245$245$245 $245
$305
$384
$335$367
$278
$237$221
Other Salmon 45% Herring
10%Blackcod 4%Halibut 3%Crab 2%
Pink Salmon 33%
Other 4%
Southeast Seafood Industry 3,854 Jobs D O W N 5 0 0 J O B S - 1 2 % D O W N $ 4 5 M I L L I O N I N E A R N I N G S I N 2 0 1 6 - 1 8 %
Sources: Combination of ADOL 2015 Employment and Wage data; 2014 US Census Nonemployer (self-employment) Statistics; ADF&G Seafood Production of Shorebased Plants in Southeast Alaska; ADF&G Southeast Alaska Commercial Seafood Industry Harvest and Ex-Vessel Value Information; Run Forecasts and Harvest Projections for 2016 Alaska Salmon Fisheries and Review of the 2015 Season; ADF&G April 2015; ADF&G 2016 Preliminary Alaska Commercial Salmon Harvest - Blue Sheet Updated August 29, 2016; Shared Taxes and Fees Annual Report FY15, ADOR; Alaska Commercial Salmon Harvests and Ex-vessel Values, ADF&G. Seafood price source Laine Welch. Seafood Industry includes animal aquaculture, fishing, & seafood product preparation (NAICS 1125,1141,3117) and Southeast Alaska resident commercial fishermen (nonresident fishermen & crew who did not report income are excluded). Photo Credits: Top: FV Obsession taken near Hoonah by Debbie Douglass. Right: Helen Decker on the MV McCrea near Wrangell by Gig Decker.
SEAFOOD LANDED IN SE ALASKA BY SPECIES, 2016 Outer ring = % of harvest by dollar value: $221 million
Inner pie = % of harvest by pounds landed: 223 million pounds
THE SEAFOOD INDUSTRY
43%
16%
20%8%
5%
7%
% Pounds
% Value
2%

Southeast Alaska 2020 Economic Plan: Updated 2017 Prepared by Rain Coast Data Page 11
Southeast Healthcare Industry 3,344 Jobs U P 4 5 J O B S I N 2 0 1 6 + 1 . 4 %
When both private and local hospital healthcare services are taken into account, Southeast Alaska’s 3,344 healthcare workers earned 9% ($182 million) of all regional wages in 2016. Regional healthcare employment grew for the first time in five years last year. Healthcare needs in the region have been increasing due to an aging populace. Regional providers are experiencing increasing patient volumes, and healthcare is one of the fastest growing sectors of the state; but regionally growth has stalled.
There appear to be several reasons for this. The healthcare sector faces uncertainty due to the state’s continued budget shortfall and the debate over healthcare on a national level. Regional medical institutions have been conservative in replacing departing staff as they wait to see how the state will resolve its budget distress, along with monitoring Affordable Care Act replacement efforts. Also, as healthcare becomes more expensive, providers are pressured to contain costs and consolidate “shared services”— meaning that jobs like accounting, payroll, and human resources that used to be local are increasingly being done outside of Southeast Alaska in places where the cost of living is less. Another contributing factor is the influence of medical tourism, as travel to Anchorage and the lower-48 for medial care becomes more common. Finally, there has been intense demand for medical workers at all levels nationwide, which makes local retention and recruitment for regional medical industry jobs more difficult than it had been in the past, leading to fewer hires.
HEALTHCARE INDUSTRY OUTLOOK Early employment numbers for 2017 show job gains; and the forecast for this industry is for slow growth in 2017 and 2018 as demand increases. However, the pressures that have limited growth will continue to hinder the healthcare industry.
Southeast MiningIndustry 798 Jobs U P 3 J O B S I N 2 0 1 6
In 2016, there were 798 annual average mining jobs in Southeast Alaska, with a payroll of $83 million. The two large mines operating in the region account for nearly all mining employment. In August 2017 Hecla Greens Creek employed 423 full-time permanent employees, while Kensington had a staff of 368. With an average annual wage of $104,000, mining jobs pay the highest wages in the region of any sector.
Hecla Greens Creek is one of the largest silver mines in the world, while the Coeur owned Kensington is exclusively a gold mine. At Hecla Greens Creek silver production was up by 9% to 9.3 million ounces in 2016. This increase was driven by higher grade and an increase in recovery. The mine also produces zinc, gold, and lead. Production at Kensington was similar to last year, with 124,331 ounces of gold produced in 2016.
After several years of downward trends, metal prices are rising, most notably for zinc, which is at its highest value in more than a decade following supply cuts and continued strong demand out of China. Mike Satre of Greens Creek notes, “The latest zinc increases are encouraging. However, metals prices are very volatile and it is too soon to tell if this trend is indicative of any fundamental long term changes in the market.” Regionally, mineral exploration has remained dormant, with the exception of Constantine’s copper-zinc-silver-gold Palmer Project near Haines, which is in the exploration stage.
The mining sector is expected to grow in 2017 and 2018.
$1,500
$2,000
$2,500
$3,000
$750
$1,000
$1,250
$1,500
$1,750
$2,000
2008 2009 2010 2011 2012 2013 2014 2015 2016 Aug 2017
GoldZinc
Gold per ounce
Zinc per metric ton
AVERAGE GOLD AND ZINC PRICES 2008-2017
Sources: ADOL 2016 Employment and Wage data; Kitco Metals Inc; Coeur Mining Inc. 2016 Annual Report; Hecla Mining Company 2016 Annual Report. Photo credits: Peter Metcalfe and Hecla Greens Creek Mine.

Southeast Timber Industry 315 Jobs D O W N 8 J O B S I N 2 0 1 6 - 2 %
Regional timber jobs were down again in 2016 by 2%. This comes
on top of significant recent job losses. In the past five years, employment in this industry has been reduced by 10%. In 1991, there were 3,543 year-round timber jobs in the region, peaking in that year with 4,200 timber workers. In 2016 dollars, those job losses represent $258 million in annual direct wages, a reduction that represents more lost wages than all the workers in the seafood or visitor industry earned last year. The number of board feet harvested annually has fallen by 96% from peak levels.
Today, most of the regional timber jobs are divided between two organizations: Sealaska, the regional Alaska Native corporation, and Viking Lumber on Prince of Wales Island—the last remaining mid-sized sawmill in the region. Alcan Forest Products is another key employer. Timber workforce earnings were $17.3 million for 2016.
TIMBER OUTLOOK Timber industry employment will continue to decline into 2017 and beyond for the following reasons:
•The Forest Service’s pending Tongass Transition Plan to substitute old growth with young growth will reduce, and
then terminate, access to old-growth timber before young growth timber becomes economic;
• Litigation over nearly every timber sale has made log deliveries to Viking Lumber uncertain and is a barrier to potential new mills obtaining the financing needed to join the Southeast industry;
• Timber available for sale is often uneconomic, thereby constraining supply to mills; and
• The poor outlook for future economic timber is a disincentive for continued participation in the Southeast timber industry.
Southeast Construction Industry 2,030 Jobs D O W N 9 0 J O B S I N 2 0 1 6 - 4 %
For the third year in a row construction employment is down. Jobs
fell by 90 last year to 2,030, a combined loss of 240 jobs over three year. Early employment data from 2016 indicates that construction related employment will drop another 50 jobs in 2017. Construction workers in the region earned $132 million in 2016—or 6% of all Southeast Alaska employment earnings.
CONSTRUCTION OUTLOOK High-profile publicly-funded projects created a construction boom. Unfortunately, the contraction of the State capital budget and decreased federal spending meant that future projects were no longer being added to the lists of planned activity. Large-scale endeavors are unable to obtain funding, construction projects will be put on hold, and employment levels will continue to drop. Legislative capital appropriations in the region dropped 88% from $385 million in FY13 to just $47 million in the FY17 budget. In FY18, just $8.7 million has been directly appropriated to Southeast in addition to DOT Public Facilities funding that can no longer be broken out in a way that adequately compares to previous years.
On a positive note, home construction was up 87% from the year before, with 369 new housing units permitted or completed in 2016, mostly due to an increase in multi-family unit construction in Juneau.
$0
$200
$400
FY12 FY13 FY14 FY15 FY16 FY17
$47$107
$183$215
$385
$260
State Budget Capital Appropriations in Southeast Alaska
Mill
ions
App
ropr
iate
d
Sources: Combination of Alaska Department of Labor 2016 Employment and Wage data and 2015 US Census Nonemployer (self-employment) Statistics; State of Alaska Capital Budget FY12-17. Photography credit: Peter Metcalfe.
Southeast Alaska 2020 Economic Plan: Updated 2017 Prepared by Rain Coast Data Page 12

Southeast Alaska 2020 Economic Plan: Updated 2017 Prepared by Rain Coast Data Page 13
Between 2014 and 2016 Southeast
Alaska’s population decreased by 648 people after two years of consecutive decline. These losses were more significant in 2016 and centered in Juneau, where the cuts to State jobs led to a reduction of nearly 300 residents. But the losses were region-wide, with six of the region’s seven boroughs reporting population decline (only the Borough of Wrangell was spared).
SCHOOL ENROLLMENT UP Despite population losses, school enrollment was up in 2017 over 2016. While the size of the increase was tiny (half a percent, 90 kids) it was the largest increase in more than two decades, during which time annual enrollment shrank by 3,250 K-12 students.
AGING CONTINUES Despite relatively flat trends, there were some significant shifts in the region since 2010. The number of people in their 40s shrank by 1,700 (-16%) and we ended up with 600 fewer teenagers (-6%). As expected, the most pronounced shift was the continued explosion of baby boomers into their older years. Those aged 60 plus grew by 4,100 people (+8%) simply through aging in place, meaning 27% of all adults in the region are over the age of 60, a percentage that is growing.
COMMUNITY CHANGE Gustavus continues to have the most pronounced growth of any community. Since 2010 that community has grown by 26% for a total gain of 116 people. Factors influencing this growth include new ferry service and lower cost hydro power electricity displacing diesel. Significant population growth (of 19% or higher) was experienced by some of our smaller communities over the past two years, including Port Alexander, Hollis, and Kasaan.
Among communities with over 1,000 residents, only Wrangell and Skagway grew, both experiencing moderate growth (2% and 3% respectively). The island of Prince of Wales grew by nearly 6%, thanks to strong growth in places like Klawock, Thorne Bay, and Coffman Cove. Places with double-digit percentage population losses since 2010 include Pelican and Elfin Cove.
POPULATION OUTLOOK As long as the state continues to reduce jobs, payments to communities, and infrastructure investments in the region, job losses will continue, and these will continue to be paired with population declines.
2000
2001
2002
2003
2004
2005
2006
2007
2008
2009
2010
2011
2012
2013
2014
2015
2016
POPULATION CHANGE 2014 TO 20162014 2016 Change
Juneau Borough 33,022 32,739 -1% Ketchikan Borough 13,871 13,758 -1% Sitka Borough 9,084 8,920 -2% Petersburg Borough 3,206 3,179 -1% Haines Borough 2,550 2,466 -3% Wrangell Borough 2,415 2,458 2% Metlakatla 1,485 1,467 -1% Craig 1,205 1,102 -9% Skagway Municipality 1,034 1,065 3% Klawock 806 814 1% Hoonah 790 793 0% Kake 627 605 -4% Yakutat City & Borough 631 594 -6% Gustavus 519 558 8% Thorne Bay 533 532 0% Angoon 417 408 -2% Hydaburg 407 404 -1% Coffman Cove 176 204 16% Tenakee Springs 127 140 10% Hollis 93 112 20% Naukati Bay 120 104 -13% Klukwan 84 95 13% Kasaan 75 89 19% Hyder 93 84 -10% Pelican 76 78 3% Port Alexander 45 58 29% Port Protection 54 51 -6% Whale Pass 40 45 13% Edna Bay 47 41 -13% Game Creek 18 21 17% Point Baker 13 14 8% Elfin Cove 16 13 -19%Other (POW, H/A CA) 781 801 3%Total 74,460 73,812 -1%
73,812 74,306 74,460 74,255 74,194 73,644
71,664 71,141 70,504 70,219 71,399
71,712 71,546 72,250 72,214 71,853
73,082
Population 73,812 D O W N 5 0 0 P E O P L E I N 2 0 1 6 - 1 %
DEMOGRAPHICS
Sources: Alaska Department of Labor (ADOL); ADOL Southeast Alaska Population by Age, Sex and Borough/Census Area, 2010 to 2016; Alaska Department of Education and Early Development; Alaska Population Projections

Southeast Alaska 2020 Economic Plan: Updated 2017 Prepared by Rain Coast Data Page 14
Overall Quality of Life
Recreational Opportunities
Cultural Opportunities
Arts & Entertainment
0% 20% 40% 60% 80%
Moderate benefit Significant benefit
Overall Cost of Business
Cost of Transportation: Freight
Cost of Transportation: People
Cost of Real Estate
Availability of a Skilled Professional Workforce
Housing Costs
Availability of Worker Pool
Federal Regulations
Suppliers in Southeast Alaska for Your Business
0% 25% 50% 75% 100%
Moderate barrier Significant barrier
How Significant Are These Elements to Operating Your Business in Southeast Alaska?
Top Benefits
Top Barriers
82%
79%
67%
62%
62%
56%
74%
63%
54%
49%
In the spring of 2015, 416 Southeast Alaska business owners and top managers from 29 communities in the region responded to the Southeast Alaska Business Climate Survey, answering 45 questions about their experience operating businesses in Southeast Alaska. We asked business owners and operators about the top barriers and benefits to having their businesses in Southeast Alaska. The overall quality of life and recreational opportunities stood out as elements that provided overall advantages. The top two categories of barriers centered around business costs (overall, freight, transportation, real estate, and housing), and the lack of qualified candidates available for hire.
65%
57%
56%
Business Climate Survey Results
To see the full results of the Southeast Alaska Business Climate Survey analysis see Appendix II.

Southeast Alaska 2020 Economic Plan: Updated 2017 Prepared by Rain Coast Data Page 15
Industry specific SWOT analyses for each of Southeast Alaska’s key economic sectors can be found in the 2020 Economic Plan. A star signifies that one of the eight priority objectives in the regional economic plan addresses this “top opportunity.”
At Southeast Conference’s March 2015 Mid-Session Summit, 180 people representing small businesses, tribes, native corporations, municipalities, and community organizations generated nearly 1,200 individual written comments that became part of this analysis.
• Top Strength: Our people & our Southeast Alaskan spirit • Top Weakness: Transportation costs • Top Opportunity: Seafood & product development • Top Threat: Federal government regulations & overreach
People & Southeast Alaskan Spirit
Region Collaboration
Seafood Industry
Tourism SectorBeauty & Recreation
OpportunitiesNatural Resources
Culture & Heritage
12.5 25 37.5 50
Top Strengths Top WeaknessesTransportation Costs
Energy CostsRegulations & Overreach of
Federal GovernmentCost of Living & Doing Business
Our Geography & Isolation
Aging Population
Lack of Access to Our Lands
12.5 25 37.5 50
Top Opportunities Top ThreatsSeafood & Ocean
Product DevelopmentTourism
Energy
Mining
Promoting Region
Timber
Maritime
0 10 20 30 40
Federal Regulations & Overreach
Declining Oil Prices/State Budget
Capital Move/Capital Creep
Declining/Aging PopulationNatural Disasters/Extreme WeatherFisheries Declines
Climate Change
0 12.5 25 37.5 50
Southeast Alaska SWOT Analysis: Strengths, Weaknesses, Opportunities & Threats

Southeast Alaska 2020 Economic Plan: Updated 2017 Prepared by Rain Coast Data Page 16
Southeast Alaska Resiliency MappingWeatherizing for the Economic Storm
During the economic planning process, one of the top threats to the Southeast Alaska economy materialized. Oil, which once accounted for 90% of the state’s unrestricted revenues, dropped from $127 a barrel in February of 2012 to just $27 per barrel January of 2016, leaving the state with a $4 billion budget gap. The current economic outlook from this situation ranges from worrisome to devastating. Nearly all members surveyed (99%) said they are concerned how this will impact the regional economy, with 84% saying they are “significantly concerned” or have “maximum concern.” In order to understand how our community and business leaders plan to ensure the economic resilience of their businesses, industries, and communities, Southeast Conference asked the membership to define a collective vision for resilience. Economic resilience is the ability to withstand and recover quickly from a disruption to the economic base. More than 200 Southeast Conference members from 23 communities and 24 sectors across the region participated, explaining what they plan to do or need in order to keep their businesses and communities economically stable.
1. Reduce private business expenses. The most frequent response was
from business leaders preparing to reduce their expenses in order to remain viable through an economic downturn. Businesses are planning on cutting costs, reducing employees, delaying investments, reassessing operations, refocusing resources on core businesses functions, and increasing savings.
2. Increase long term economic development planning. The second key
strategy regional leaders intend to employ is to increase economic development through long-term strategies, collaboration, and support of local
businesses. The development of the CEDs was specifically mentioned as an important resource.
3.Reduce government spending & services. The next most frequent response was
to reduce the size of both state and municipal government through budget cuts, service reduction, reduced spending, and employee cuts.
4. Implement taxes. The fourth area of
change Southeast Conference members think is needed to address the fiscal situation is an increase in taxes, specifically implementation of an income tax.
5.Maintain ferry services. In the face of
impending cuts, members noted that a strong ferry-focused transportation system is critical. A ferry-focused transportation priority objective is responsive to this.
6. Increase communication with government officials. Provide cost-saving
ideas and support public officials as they make tough decisions on how to balance the budget. Southeast Conference provides members with a vehicle to increase their outreach to public officials.
7.Restructure PFD to address fiscal needs. A good fiscal strategy includes tapping
the dividend fund for public purposes.
Through this economic plan, Southeast Conference is responding to the state fiscal situation by undertaking efforts to broaden the economic base of the region, improve the overall business climate, support the development of industries that build on the region’s unique assets and competitive strengths, and grow a more resilient workforce.
To see the full results of the Southeast Alaska Resiliency Mapping analysis see Appendix IV.

Southeast Alaska 2020 Economic Plan Page 17
Strengths Weaknesses
• We are experienced with integrated multimodal transportation and partnerships.
• We have an emerging shipyard and skilled workforce.
• High transportation costs and aging infrastructure.
• Small populations spread out across long geographic distances.
Opportunities Threats
• Depoliticize transportation (funding and regulatory) while developing collaboration and partnerships.
• Develop new vessel classes for the Alaska Marine Highway System.
• State budget crisis. • Demographics: population losses, loss of political
power, economic center moving away from region.
Transportation Goal Statement: • Support a consistent, reliable regional transportation system that enables
predictable, financially sustainable, efficient transportation for a prosperous regional economy and access to medical care and cultural events.
Southeast Alaska Strategic Direction Action Plan Southeast Conference Vision Statement: Promote strong economies, healthy communities, and a quality environment in Southeast Alaska.
Transportation

Transportation Priority Objectives
Priority Objective #1: Minimize Impacts of Budget Cuts to AMHS, and Develop a Sustainable, Long-term Operational Model for AMHS
The Alaska Marine Highway System is at a critical juncture. To weather this storm of low oil prices, declining oil production and budget pressure it will need a carefully thought-out strategy that will provide essential transportation services to coastal communities. Since its first port of call, the Alaska Marine Highway has provided access to rural communities and generated substantial economic growth and improved quality of life for Alaskans. It has become a vital socio-economic engine even more now than when it was conceived half a century ago. Southeast Conference is actively taking steps to update the system into a responsive and predictable marine highway that will transcend political and administration shifts, a system that will partner with communities and have shared responsibility and accountability for the success of that system. This transportation corridor for Alaska operates in an environment with market, political and operational challenges unlike anywhere else in the world. Its service mandate is broad; its markets are small and diverse. Success over the long-term will require a carefully crafted combination of management, operations and funding strategies. Elements of this objective include: • Design a new strategic operating
plan for AMHS • Lower State’s general fund
subsidy percentage • Fleet Renewal Plan • Empowerment of the
Marine Transportation Advisory Board
• AMHS Value Outreach
Other Transportation Objectives: Objective #2: Road Development
Expand use of the existing road network. The region has the same transportation options that were available in the late ‘60s, and roads are difficult and
costly to build in the region. Several roads in the region are not being used in an intermodal fashion, and other roads are under utilized. We need to improve utilization of existing road systems while maximizing use of ferries.
Develop new roads and expanded access. This includes “roads to resources” that will provide access to resources that are important for economic development. Continue and complete design on access corridor.
Objective #3: Move freight to and from markets more efficiently.
Freight barges are critical to the regional economy, supplying the region with 90 to 95% of its freight. Determine best way to move perishables to and from markets in Southeast Alaska. Includes moving fish to markets outside Alaska more quickly, and moving perishable groceries to regional stores. Reduce the cost of transporting goods into, out of and within the region. In the Southeast Alaska Business Climate Survey, four out of five respondents identified the cost of freight as a barrier or a significant barrier to their business operations, and prices are increasing. Work with the transportation industry to find creative ways to reduce the costs for the transportation of goods, especially for less-than-container loads. Explore freight forwarding at the international border.
Objective #4: Ensure the stability of the existing regional transportation services outside of AMHS.
Support transportation services in the region. Water and air transportation are vital to the lives of most
residents and to commerce between communities in and beyond the region. Only three communities (Haines, Skagway and Hyder) are directly connected to highways outside of the region. Alaska and Delta Airlines provide jet
service to the region, and many smaller airlines provide connectivity and passenger service between
the communities. The Inter-Island Ferry Authority is a public ferry system that provides daily service between Prince of Wales Island and Ketchikan. These transportation networks are an economic engine for the region, generating jobs, commerce, and tourism - while also increasing community wellbeing.
Southeast Alaska 2020 Economic Plan Page 18Note: Detailed steps and evaluation framework for priority objectives are at the end of this section.

Priority Objective #1: Promote priorities of the regional energy plan including infrastructure and diesel displacement During these times of fiscal austerity, educate and communicate with the federal government regarding the value and importance of regional energy projects, especially small community-based projects. There are a number of projects that help meet renewable energy goals of the state and federal agencies. Partner with federal agencies to advocate for renewable energy development and advance energy technologies in order to promote economic development and jobs to contribute to a resilient tax base.
Work with the federal government to increase investments. Support efforts to set aside the Roadless Rule as a barrier to renewable energy development. Increase access to renewable resources within the Tongass National Forest. Identify federal regulations that hamper energy development. Reduce barriers to increase new investments in energy.
The majority of energy costs paid by residents goes toward space heat. Opportunities abound for alternative energy heat to displace diesel, especially biomass. Educate people regarding energy use. Provide diesel displacement through improved incremental delivery of conservation and efficiency measures to businesses and residences in order to reduce energy costs. There are many opportunities for energy efficiency in generation, transmission and demand-side management. Facilitate technical expertise for utilities and educate consumers regarding energy use.
Other Energy Objectives: Objective #2: Support community efforts that create sustainable power systems that provide affordable/renewable energy.
Objective #3: Complete a Regional Hydrosite Evaluation for Southeast Alaska. Build upon the existing work to catalog critical information necessary to determine the highest value hydropower projects to meet the growing needs of our region.
Southeast Alaska 2020 Economic Plan Page 19
Strengths Weaknesses• Hydro, biomass and renewable energy resources. • Technical expertise for biomass and other energy
resource development. • Funding opportunities for renewable and other
energy.
• We are diesel dependent in many of our rural communities.
• Funding opportunities for renewable and other energy. • There is a low economy of scale and lack of economic
industry, and limited inter-connectivity of communities and energy resources.
Opportunities Threats• Tongass land management amendments to support
energy development. • Develop resources in close proximity to our loads. • Regulatory reform (RCA, FERC, EPA, etc.) • Partnering with other industry groups, come together
and show unified positions.
• Changing and increased regulations and Federal land use restrictions (Roadless Rule, etc.)
• Permitting obstacles (long permitting time and bureaucratic process; increased litigation).
• Limited financing options (especially for projects with a long payback period).
Energy Goal Statement: • To create long term energy security, support energy infrastructure
development, and promote efficient use of existing energy-related resources within Southeast Alaska.
Energy

Southeast Alaska 2020 Economic Plan Page 20
Maritime Industrial Support Sector Goal Statement:
• Support the industry-led efforts to enhance the capacity of Alaska’s maritime economy; create a comprehensive, robust maritime support services sector that will meet current and growing demands of the businesses within the Alaska maritime economy; and continue to promote the understanding of the values of the maritime sector within Alaska.
Strengths Weaknesses
• We are a maritime region. Our shoreline is approximately 18,500 miles and we have over 1,000 islands.
• We have many location-based opportunities, access to our fishing fleet, and are in close proximity to the ocean’s resources.
• The maritime sector represents Southeast Alaska’s largest private sector employer.
• We do not have a large, highly-trained maritime workforce. Our workforce is greying and often lacks industrial skills.
• We lack a mature, durable industrial base and supply chain. Distance from the existent supply chain makes ship building and repair more costly, and repairs take longer due to the slower speed of shipping to Alaska.
• The combination of elevated labor and shipping costs often places Alaska at a competitive disadvantage with service providers in other regions.
Opportunities Threats
• Because current demand outpaces supply, Alaska and our region have the opportunity to capture much of the burgeoning stateside/local demand for maritime support services.
• We can increase the number of federal maritime jobs in our region for marine researchers, members of the United States Coast Guard, etc.
• We have a workforce ready to be trained. • We are already developing niche and specialized
markets in shipbuilding and repair.
• Our state is facing economic decline; less investment in human and physical infrastructure is a reality.
• Outside competition is growing. • State management and enforcement of fisheries and
maritime resources is decreasing; this includes reductions to publicly owned maritime transportation assets due to fiscal deficit.
Maritime Maritime includes all jobs directly tied to the ocean. In this plan, we focus on two elements of this sector: Marine Industrial Support & Seafood.

Marine Industry Support Sector Priority Objective
Priority Objective #1 Implement the Alaska Maritime Workforce Development Plan and Create a Maritime Industrial Support Sector Talent Pipeline
Support implementation of the Alaska Maritime Workforce Development Plan through focusing on the Southeast Alaska elements of that plan. Establish an innovative regional public-private-philanthropic “Workforce Investment System” to develop local capacity to meet the needs for the growing Maritime Industry Support Sector. Utilize a coordinated workforce development approach to create a standard of achievement. Develop a delivery system with industry-trained technical advisors located throughout the region.
Other Marine Industry Support Sector Objectives Objective #2 Continue to Grow Regional Maritime Sector with an Increase in Maritime Industrial Employment Opportunities.
Advocate for policies that lead to more homeporting of vessels in Southeast Alaska. Market Southeast Alaska as a base for offshore oil and gas support vessels, as well as to fishing boats that work in the region each summer but do not stay here. Create marketing information regarding homeporting information for commercial fleets. Develop sector specific information for those looking for a place to homeport. About 95% of maritime businesses that operate in Southeast Alaska are based out of state in Puget Sound. Make Southeast Alaska a desirable place for these boats to stay. Examine Arctic exploration opportunities that the region as a whole can provide (considering the fact that Shell transported their rig all the way to the Port of Seattle). What infrastructure and expertise is needed in the region to be able to provide those needs?
Objective #3 Increase Access to Capital for the Regional Maritime Industrial Support Sector.
Financing can be difficult, especially for fishermen with older vessels. Work with banks to put finance packages in place to allow fishermen to be successful. Allow fishermen to service their debt and get older boats serviced/financed so that we can take care of our aging fleet.
Objective #4: Support Capital Investments in New/Expanded Marine Industry Support Infrastructure Throughout the Region Existing infrastructure varies from non-existent to outdated. Investment in expanded infrastructure will make sector more efficient and better able to work on modern vessels.
Objective #5: Regional Vessel Repair. Increase vessel repairs and maintenance completed within the region, which reduces economic leakage.
Objective #6: Harbor Improvements.
Improve local harbors so that they can meet transportation needs. Continue to advocate
for port and harbor infrastructure funding opportunities. Port and harbor
infrastructure needs are numerous and vary from aging facilities to inadequate capacity to communities with little or no port and harbor infrastructure.
Objective #7: Examine Arctic exploration opportunities that the
region as a whole can provide.
Alaska is an “Arctic” state, and the world is looking to the arctic as a
developing opportunity. What is it that Southeast has now, what is needed, and how can we provide those needs as a region?
Southeast Alaska 2020 Economic Plan Page 21Note: Detailed steps and evaluation framework for priority objectives are at the end of this section.

Southeast Alaska 2020 Economic Plan Page 22
Strengths Weaknesses
• We have a pristine environment. • Alaska’s harvest of seafood is more than 50% of the
harvest of seafood in the United States in both value and poundage. Southeast Alaska’s fishery harvest is approximately 20% of the statewide total economic value.
• There is seasonal diversity according to species. • Fisheries are sustainable and well managed,
including ASMI’s sustainability certification program.
• We have a well-established and successful marketing organization (Alaska Seafood Marketing Institute), which has built worldwide recognition of the Alaska Seafood brand.
• Seafood is an economic driver for coastal communities, both large and small.
• Successful, large-scale salmon enhancement program.
• Workforce – local workforce is aging and much of our temporary workforce is non-local.
• Decreasing state budget, which impacts fisheries management. • Lacking state leadership to develop mariculture industry. • Diesel-dependent fleet. • Ocean warming/acidification. • Lack of recognition of potential positive economic impact from
enhancement of wild shellfish. • Under-utilization of the whole fish, although this is trending down
in recent years. • Lack of recognition of the maritime sector as a whole (including
seafood harvesters, seafood processors, marine support services, research/managers).
• Access to ice and other supplies. • Access to repair and maintenance during fishing season. • Lack of diversification of markets for seafood products, especially
roe products at this time.
Opportunities Threats
• Develop mariculture industry, including enhancement, farming and restoration of shellfish and aquatic plants.
• 100% utilization of resource (including fish waste). • Develop new products: pet food, pharmaceuticals,
nutraceuticals and health food products. • Reduce reliance on diesel for fishing vessels & fish
plants. • Supporting implementation of the Alaska Maritime
Workforce Development Plan in Southeast. • Increase vessel repairs and maintenance completed
within the region, which reduces economic leakage. • Develop markets for otter products.
• Marine mammals: Sea otters, whales, orcas, etc. • Negative perception of hatchery fish. • Regulatory oversight / federal regulations. • “Not in my backyard” public sentiments which impede
development of aquatic farms. • Reduced access to the resource by reallocation, federal
overreach, ballot initiatives, and lack of research/management funds.
• Sustainability certification programs which either require changes in management or do not certify certain fisheries/regions.
• Climate change and ocean acidification. • Ecological threats (downstream effects of mining in British
Columbia). • State budget cuts
Seafood & Ocean Products Industry Goal Statement:
• Create jobs and wealth by advocating for a well-managed, sustainable and resilient seafood sector, and develop higher-value ocean products that reach more markets.

Seafood Priority Objective
Priority Objective #1: Mariculture Development. Support the development of the mariculture industry, including production enhancement, aquatic farming and restoration of invertebrates and aquatic plants. Support the Governor’s Alaska Mariculture Task Force. Increase shellfish production and the number of species from aquatic farms. Increase number of mariculture operations. Financially stabilize OceansAlaska to increase seed production, quality and species. Support increased capacity for shellfish safety testing in the SE region.
Objective 2: Full Resource Utilization & Ocean Product Development. Increase total revenue from existing commercial fisheries in the region by developing new, higher value products and markets from parts of the fish that are currently either thrown away or that go to lower relative value markets. Work with seafood processors to develop new products and identify businesses or entrepreneurs not currently in the seafood industry who can contribute to this effort. Collaboration with private, state, federal and university researchers needs to be encouraged to identify and accelerate opportunities for commercialization of improved or new products. Support the development of new specialty products that utilize 100% of harvested seafood resources in order to create value-added products with the same resource, reduce discharge into waterways, and provide additional economic benefits to local economies.
Other Seafood Objectives: Objective 3: Increase Energy Efficiency and Reduce Energy Costs. Support programs that aim to increase energy efficiency of vessels and processing plants. Reduction of reliance on diesel for both boats and processing plants. Move commercial fishing fleet away from
diesel dependency using concepts such as diesel/electric hybrid vessels, hydrogen, or
other energy alternatives. Find alternatives to reduce use of diesel for
fish plants and cold storage facilities that could include increased energy efficiency or hydropower.
Objective 4: Regional Seafood Processing. Support continued and increased
processing / manufacturing within region. Increase the number of firms
producing high-value products. Increase value-added activities in the
region and to improve product quality. Support development of necessary
infrastructure for these activities. Update processing plants and update/improve transportation routes to get products to market. Make it cheaper, faster, and fresher.
Objective 5: Seafood Markets. Support ASMI’s work to market Alaska Seafood. Support the expansion of markets both domestically and worldwide. Support integration of industry’s efforts to develop new products and ASMI’s efforts to develop new markets. Support diversification of roe markets.
Objective 6: Sea Otter Utilization & Sustainable Shellfish. Support development of new products and markets for otter products. Support sea otter garment making businesses and strategies for increasing value of these products.
Objective 7: Maintain Stable Regulatory Regime. Support state regulatory stability. Protect commercial fisheries by advocating for stable regulatory regimes at state and federal levels and educating policy makers. Retain access to resources.
Objective 8: Seafood Workforce Development. Engage in workforce development efforts to attract young Southeast Alaskans to participate in the seafood economy. The absence of young Southeast Alaskan fishermen is compounded by the rise in nonresident permit ownership in local fisheries.
Southeast Alaska 2020 Economic Plan Page 23Note: Detailed steps and evaluation framework for priority objectives are at the end of this section.

Southeast Alaska 2020 Economic Plan Page 24
Strengths Weaknesses
• Southeast Alaska has an abundance of natural beauty, wildlife, and recreation that provide unlimited opportunities for developing tour products and interest to a wide variety of visitors.
• SE is easily accessible from the Lower 48, and non-stop flights to Seattle are opening up new markets.
• The Alaska brand for tourism is strong. • There is great entrepreneurialism and spirit in the industry. • Southeast Alaska people, history, culture, and indigenous art are
great draws. • Cruise passengers want to return to SE and spend more time.
• There is a lack of access to public lands, which is a problem because 95% of the region is federally managed.
• Travel to and within the region can be expensive and logistics can be difficult.
• There is a lack of a cohesive planning tool to allow people to put together their own trips.
• Our visitor industry season is short. • Communications: Lack of internet and cell
phone presence.
Opportunities Threats
• Increase independent travelers. • Increase length of tourism season. • Increase percentage of returning visitors. • Diversify visitor activities. • Increase access to outlying communities. • Develop more infrastructure, providing access and ecotourism
opportunities, trails, and wildlife viewing. • Target Alaska residents for “stay-cations.” • Develop more ecotourism products. Examples include scuba
diving, surfing, glacier surfing, etc. • Increase cultural tourism through the promotion of Southeast as
the Northwest Coast Native sustainable arts capitol. • Wildlife viewing. Explore opportunities to make our world class
whales and bear viewing more accessible to independent travelers.
• Federal/state regulations and reducing visitor access to land-based excursions and sports fishing opportunities.
• Underfunded local infrastructure, i.e. communications, transportation, water usage, waste water treatment, etc.
• Reductions in ferry service. • Federal permitting, onerous federal
regulations and compliance. • Reduced funding to maintain existing
recreation programs at state and federal levels.
• Degradation of Northwest Coast Native art form through unauthorized mimicry.
Goal Statement: • Increase visitor-related opportunities; enhance Southeast Alaska as a destination for visitors; and
capitalize on the attributes of the region.
Visitor Industry
Phot
o by
Cla
rk J
ames
Mish
ler

Visitor Industry Priority Objective
Priority Objective #1 Market Southeast Alaska to Attract More Visitors
A collaborative regional visitor marketing effort to provide more marketing opportunities, improve brand awareness, strengthen the marketing reach, widen regional coverage of information, and leverage limited resources. Enhance current activities throughout SE Alaska and create new ones that would draw interest from families with children to travel around SE Alaska.
Other Visitor Industry Objectives Objective #2 Improve Access to Public Lands.
Provide more recreational opportunities, including developing more trails, increasing the number of permits available, providing more outfitter guide days, and development of new wildlife viewing options on federal lands. Work to change how federal land access and permitting works in Southeast Alaska. Support visitor industry permitting and development opportunities. Increase guided access to public lands by 20%. Protect our current resources and maintain infrastructure.
Objective #3 Increase Flexibility in Terms of Permit Use.
Permits are hard to obtain, and are non-transferrable – making it hard to expand, sell, or maintain business. For example, if a location has 12 permits per day but can’t use a day due to weather, that permit is lost. Because not all permits are used, the number of permits available for the next year get cut. The demand is there but providers don’t get access.
Objective #4 Increase Yacht and Small Cruise Ship Visitations.
Support the re-emergence of small cruise ships and yachts. Maintain port calls for providers
like Un-Cruise Alaska Cruises and Alaska Dream Cruises. Provide yacht services
in region. Track yachting numbers.
Objective #5 Improve Communications Infrastructure.
Improve broadband and cellphone access in region.
Objective #6 Advocate for Funding to Maintain Existing Recreational
Infrastructure
Recreational opportunities were cited in the Business Climate Survey as the #2 benefit to businesses who own and operate their businesses in the region. It is the reason people choose to live in Southeast, and the reason that tourists come to the area. The Forest Service is actively cutting funds to Tongass recreation programs resulting in campground, trail, and public cabin closures. Work
collaboratively to reverse this trend.
Objective #7 Grow Cultural and Arts Tourism Opportunities.
Southeast Alaska has a rich and vibrant Alaska Native culture that traces its roots back 10,000 years. It has art forms that evolved with each region developing distinct features. The visitor industry is incorporating some of this culture, art, and history
into its products, but in many ways cultural and indigenous arts tourism is
underdeveloped. In the regional business climate survey, when asked about benefits to
their businesses, those in the visitor industry were less likely to recognize culture as a benefit to their industry than five other sectors. Support efforts to grow cultural tourism.
Southeast Alaska 2020 Economic Plan Page 25Note: Detailed steps and evaluation framework for priority objectives are at the end of this section.

Southeast Alaska 2020 Economic Plan Page 26
Strengths Weaknesses
• We have abundant, high-quality wood resources in our region
• We are continuing to develop markets for our wood. For example, Red Cedar is preferred but was previously an undesired species. Now there is a strong demand for it.
• Sitka spruce has a strong established market • Our industry provides year-round family jobs and wages • Timber is a renewable resource • International markets: We are in high demand in Asian
markets (as well as domestic) • Our industry contributes to rural communities and rural
economies • We have cross-industry infrastructure in place • Activity in our industry takes place outside urban centers • There is good marine access to our timber resources • Carbon Sequestration in wood
• There is much government ownership of the regional land-base (95%)
• There are too many federal government regulations imposed upon our wood products industry
• Transportation costs of the wood is high • The Tongass has become the poster child in the US
for outside to use as a fundraising mechanism • Our trained, high-quality workforce is aging/in-
decline while the new workforce does not appear to have the same work ethic or interest in physical work
• We are losing our infrastructure • Power costs are high • The remote locations of our industry mean that the
overall costs of doing business are high • Logging has become a socially unacceptable
business to be in.
Opportunities Threats
• Showcase use of local woods • Create a small cottage industry • There is a great deal of opportunity for growth in the
regional timber industry • Increasing private and/or state land ownership would
create many new opportunities • Develop more niche markets • The regional wood products industry is one of our few
with primary production, meaning that the economic impact is much larger. By growing this industry we could replace budget gaps with timber jobs
• Biomass/carbon • Use growth of the timber industry to stabilize decline of
rural communities • Open more mills
• Conservation groups • Environmental litigation on every timber sale • Politics • Disease/aging trees • Endangered Species Act • Insects, invasive plants • High capital costs • Insufficient workforce • USFS bureaucracy
Timber Industry Goal Statement:
• Increase the timber industry workforce, increase economic timber supply levels and infrastructure.
Timber Industry

Timber Priority Objective:
Priority Objective #1: Provide an adequate, economic and dependable supply of timber from the Tongass National Forest to regional timber operators.
To be economically successful local mills must be provided an opportunity to accumulate a supply of purchased but unharvested economic timber (i.e. volume under contract) equal to approximately three years of timber consumption. This allows the industry ample time to plan an orderly and systematic harvest schedule that meets all timing restrictions and permit requirements. Second, it allows the industry to better manage its financial resources and to secure financing on the basis of longer term timber supply (banks don’t want to provide loans without multi-year plans in place). Third, it allows time for the necessary infrastructure to be maintained. Finally, an ample timber supply gives the industry more opportunity to sustain itself through market cycles. Support management, research, and legal efforts to assure access to adequate, consistent, and economic timber supply on federal and state forest lands.
Other timber industry objectives: Objective #2 Stabilize the regional timber industry. Increase and stabilize volume of timber sold and harvested to increase timber related employment in the region. Timber jobs in Southeast Alaska have been in decline since passage of the Tongass Timber Reform Act of 1990. There were approximately 4,200 timber jobs then, and there are 325 now. Increase volume of mmbf sold and harvested, and current number of jobs.
Objective #3 Work with USFS to direct federal contracts toward locally-owned businesses.
USFS spends millions each year on activities such as forest restoration contracts. However, the economic benefits of this spending is by and large awarded to outside firms from Oregon and Washington. There are several changes that can be made to help direct these contracts to local firms. USFS needs to break larger jobs into several smaller ones and work on bonding requirements, as small operators are not able to meet the federal minimum financial requirements.
Objective # 4 Support small scale manufacturing of wood products in Southeast Alaska.
There are many smaller manufacturing efforts in the regional forest. Continue to enable small business to produce wood products using Tongass wood by providing small sales, extending harvest schedules, allowing harvest of dead/down trees on road corridors, reducing bonding requirements, etc.
Objective #5 Continue old growth harvests until young growth supply is adequate.
Significant timber harvest did not occur on the Tongass until the 1960s. Since much of that harvest was along beach fringe and streams (and will not be available for young growth harvests), it will be at least another 30 to 50 years before later cuts have matured to the point where the Tongass can reasonably transition to a young growth timber industry. In the interim, allow economic old growth timber to be harvested in a volume sufficient to meet market demand for an integrated timber industry.
Objective #6 Community-Based Workforce Development.
Support workforce development in the local population for timber industry centered occupations. As the industry has contracted, it has become more difficult to attract outside skilled labor to work in the regional timber industry. However, this barrier provides an opportunity to recruit and train local candidates for these positions.
Objective # 7 Update young growth inventory.
Advocate for a thorough analysis of harvestable, economic young growth inventory at the stand level to more accurately predict the young growth supply of economic timber. Until those involved with the regional timber industry have a firm handle on the usable economic inventory, and the age of the inventory and how far along it is to the culmination of harvest, it is hard to predict an economic supply. The 2010 Economic Analysis of Southeast Alaska demonstrates that young growth timber that meets the necessary requirements and is capable of economic harvest is limited to 30-50 mmbf per year.
Southeast Alaska 2020 Economic Plan Page 27Note: Detailed steps and evaluation framework for priority objectives are at the end of this section.

Objectives outside the six sectors of focus:
Housing Objective: Support development of housing. Throughout Southeast Alaska there is evidence of concern about the lack of affordability and choice in housing. Lack of housing and the high cost is a deterrent to economic growth in several communities - most notably Skagway, Sitka, Juneau, and Yakutat - which have difficulty finding housing to attract or retain employees. Access to housing touches almost every aspect of a community’s well-being and affects all of its members. Communities with housing choices that meet the full range of their needs - including the needs of low and moderate income citizens - are more liveable, more economically competitive and resilient. Southeast Conference supports the development of new housing stock, targeted housing for an aging population, and an increase in the diversity of housing choices in the region. This includes fair market housing options for homeownership and private market rental, subsidized rentals through rental assistance or vouchers, public housing, and housing for seniors, veterans, the homeless, and other special needs populations.
Food Security Objective: Increase supply, accessibility, and demand of local foods. Highlight economic importance and opportunities for localizing the Southeast food system. Conduct assessment that illustrates economic opportunity in local production, processing, and distribution of foods, including cultivated (vegetables, fruits) and wild (berries, fish, etc.) foods for household, community and commercial market outlets. Create infrastructure to support local food producers and processors. Build local capacity to harvest wild foods. Increase number and variety of market outlets for local food producers. Identify regional agricultural land and steps to make it available for use. Provide regional and local opportunities for networking,
education, and skill development related to local food production, processing, and entrepreneurship.
Communications Objective: Improved access to telemedicine in Southeast Alaska. Enhance the existing system of physical and mental health telemedicine services by providing broader coverage to include small and rural communities in Southeast. Provide for expanded training opportunities for first responder/EMS staff and volunteers. The system will result in improved first responder/EMS care provided, improved triage, and improved outcomes for patients. There is a need for installation and improvement of internet services to rural communities that meet the standards for telemedicine and distance education.
Marketing Objective: Market Southeast Alaska as a region for product development. Developing marketing material to market Southeast Alaska as a whole. The goals will be to attract residents to the region as an incredible place to live and work; promote our regionally-manufactured local products (art, seafood, beer, wood, ships, etc.); promote our region as a visitor destination; and promote our culture and history.
Solid Waste Objective: Regional solid waste disposal. The Southeast Alaska Solid Waste Authority (SEASWA) was developed through the joint efforts of Southeast
Conference and Southeast Alaskan legislators. Cooperative solid waste benefits our regional
communities. Continue reducing the municipal solid waste stream in Southeast Alaska by enhanced recycling, scrap metal collection, waste reutilization and shared facilities and services. Continue to reach out to more communities in Southeast Alaska. For
many years, members of Southeast Conference and others in Southeast Alaska
studied the issue of consolidating solid waste disposal, recycling and scrap metal efforts across
the region. Economies of scale and regional benefits are achieved by cooperation between communities, consolidation of waste streams, and standardized contractual agreement.
Southeast Alaska 2020 Economic Plan Page 28
Other Objectives

Education Objective: Partner with University of Alaska Southeast and K-12 school districts to build career pathways and meet employer needs for a skilled workforce. Quality education and workforce training is critical to the development of a strong economy. The business climate survey identified that the insufficient pool of skilled employees with professional and technical degrees and credentials is a top barrier to economic development in the region. This barrier is expected to grow as the region’s population ages. Workforce development and support of career and technical education are included throughout this plan in the fisheries/maritime, mining, seafood, timber, and research sections. The healthcare industry is also growing and needs skilled local-trained employees. Support continued development of K-12 and post-secondary education opportunities and pathways in the region.
Arts Objective: Increase the recognition of Southeast Alaska’s thriving arts economy. The arts have played a meaningful role in the economy of our region for thousands of years. The totems, canoes, masks, regalia, and architecture of Tlingit, Haida and Tsimshian are as much a reflection of our area’s culture, ancestry, and collective histories as they are works of art. It is this rich art heritage that sets Southeast Alaska art and artists apart from other art communities. Altogether artist, arts organization, and audience spending in Southeast Alaska total approximately $60 million annually. In the Southeast Alaska Business Climate Survey, 49% of all business leaders said that arts in the region acts as a a benefit or significant benefits to their businesses. Support efforts by community arts organizations to make Southeast Alaska the Northwest Coast Native Arts Capitol of the world.
Mining Objective: Minerals and mining workforce development. Promote mineral and other resource development activities that increase regional wealth, are responsibly managed, and account for the greatest long-term
benefit to the region. Mining has been a part of the regional economy since the 1860s. In 2015, there were 800 annual average mining jobs in Southeast Alaska. With an average annual wage of $103,000, mining jobs pay the highest wages in the region of any sector. Southeast Conference will help insure that upcoming Initiatives and Designations do not impact or impede regional mining projects.
Research Objective: Attract science and research jobs to Southeast Alaska.
Science and innovation create critical commerce that can contribute to the economic health of our region. Southeast Alaska has a robust array of research facilities relative to its population including the federal research labs (NOAA/NMFS, USFS RD) state labs (UAF SFOS, UAS, ADFG) and nonprofit/private labs. Bring more fisheries science and management jobs to the region. Move the NOAA “Alaska Fisheries Science Center” jobs from Seattle to Alaska. Bring the UAF fisheries jobs to Southeast Alaska.
Cultural Wellness Objective: Support development of activities and
infrastructure that promote cultural wellness. “Cultural opportunities” was recognized as a top benefit for regional business operators in the business climate survey - 54% of
business leader respondents said that Southeast’s cultural opportunities are
beneficial to their business. Support efforts to construct buildings that will house and
promote Southeast Alaska culture and provide opportunities for education, economic development, social services, or cultural gatherings. Support efforts to expand cultural growth and wellness.
Healthcare Objective: Meet the medical needs of the region. Southeast Alaska’s healthcare industry is one of our largest sectors. Yet the regional healthcare industry is shrinking in spite of the fact that the health care needs in our region have been growing as our population ages. Healthcare industry officials responding to the business climate survey were among the most pessimistic about the future. Work with medical providers to maintain and expand regional health care workforce and services.
Southeast Alaska 2020 Economic Plan Page 29

Priority Objective #1 Project Title:
Minimize Impacts of Expected Budget Cuts to AMHS Over the Next 5 Years, and Develop a Sustainable, Long-term
Project Description:
The Alaska Marine Highway System is at a critical juncture. To weather this storm of low oil prices, declining oil production and budget pressure it will need a carefully thought out strategy that will provide essential transportation services to coastal communities. Since its first port of call, the Alaska Marine Highway has provided substantial economic growth and improved quality of life for Alaskans. It has become a vital socio-economic engine even more now than when it was conceived half a century ago. Southeast Conference is actively taking steps to update the system into a responsive and predictable marine highway that will transcend political and administration shifts, a system that will partner with communities and have shared responsibility and accountability for the success of that system. This transportation corridor for Alaska operates in an environment with market, political and operational challenges unlike anywhere else in the world. Its service mandate is broad, its markets are small and diverse. Success over the long term will require a carefully crafted combination of management, operations and funding strategies. Any new system will take significant time to develop and fully implement.
Outline of steps required for project to be completed. Design a new strategic operating plan for AMHS.
Engage technical expertise to assist with drafting an operational plan with a differing form of governance to provide a better model moving forward. Review the overall system. Understand what happens with less general funds and what assets have federal funding with a payback requirement. Review budget scenarios. Define community needs and
requirements to determine what constitutes basic essential service (information regarding frequency of service and capacity). Work to change the funding cycle and provide forward funding to eliminate uncertainty. Better understand what level of service is necessary for economic development, including frequency of service, capacity, and connectivity within the region. Use scenarios to envision how the system will look in 20 years. Recognize public process and extensive outreach as part of plan development. Timeline - Plan developed 10 months from commencement of Phase II.
Lower state’s general fund subsidy percentage: Increase farebox recovery rate. Monetize vessel and shore-side assets and opportunities. Optimize fleet configuration. Change the paradigm of how to move people and freight across the state, internationally, and to the Lower 48. Timeline - first year and ongoing.
Fleet Renewal Plan – Develop plan to replace aging vessels, such as the Tustumena. Having a viable fleet renewal plan is central to the viability of marine transportation. 20-year plan. Timeline - first year and ongoing.
Empowerment of the Marine Transportation Advisory Board. Establishment of an Empowered Board of Directors for AMHS. Originally created in 2003, the Marine Transportation Advisory Board (MTAB) consists of 12 members appointed by the Governor. It issues reports and recommendations, and reviews the strategic plan for the Alaska Marine Highway System (AMHS). However, because of the advisory nature of the board, MTAB’s input has not become an integral part of AMHS planning. Work to modify MTAB or create an Empowered Board of Directors with oversight responsibilities. Timeline – 1.5 years
AMHS Value Outreach – Use communication tools to better communicate the value of the ferry system to the public as well as to lawmakers. Communication tools include publications, letters, meetings with lawmakers, news stories, Facebook and website development.
Southeast Alaska 2020 Economic Plan Page 30
Priority Objective #1: Minimize Impacts of Expected Budget Cuts to AMHS Over the Next 5 Years, and Develop a Sustainable, Long-term Operational Model for
Action Plan Part II: Priority Objective Descriptions & Evaluation Framework

Timeline - first year and ongoing.
People and Organizations responsible for completing these steps
Southeast Conference, AMHS, Central Council, other ARDORS, Coastal Alaska communities, AML, state administration and legislature.
Cost Estimates $200K - $250K Southeast Conference, AMHS, Central Council, Coastal Alaska communities, Administration and Legislature.
Evaluation Measures • Southeast Conference meetings on AMHS
transportation • Numbers of letter and support for draft AMHS
Reform initiative • AMHS Farebox Recovery %, subsidy %, revenues
raised outside of farebox • New plan developed • Ongoing capital program that extends the life of the
current fleet while replacing vessels as they become obsolete
• AMHS ridership
Key Project Contact Who will be the project champion moving this
project forward? Name: Robert Venables Organization: Southeast Conference
Priority Objective #2 Project Title:
Work with federal and state government to promote regional energy projects.
Project Description: During these times of fiscal austerity, educate and communicate with the federal government regarding the value and importance of regional energy projects, especially small, community-based projects. There are a number of projects that help meet renewable energy goals of state and federal agencies. Partner with federal agencies to advocate for renewable energy development and advanced energy
technologies – to promote economic development and jobs that support a resilient tax base.
Most energy consumption and costs paid by most businesses and residences goes toward space heat. Opportunities abound for alternative energy heat to displace diesel, especially biomass. Educate people regarding energy use. Provide diesel displacement through improved incremental delivery of conservation and efficiency measures to businesses and residences to reduce energy costs. There are many opportunities for energy efficiency in generation, transmission and demand-side management. Facilitate technical expertise for utilities and educate consumers regarding energy use. Efficiency and conservation efforts should include the direct delivery of small measures like faucet aerators, shower heads, LED light bulbs, and programmable thermostats. Work with utilities and the state to identify standard cost effectiveness testing methods for conservation and efficiency measures to demonstrate which programs provide the greatest value. Measure the value of programs using the cost-testing methods (a standardized cost-testing method will help demonstrate which efforts generate the best results), and share the results between utilities and communities. Note: Anyone performing an audit should have whomever is responsible for building maintenance with them anytime they are in the building because several measures can be completed just while walking through, such as control issues or similar on-the-spot fixes.
Outline of steps required for project to be completed. Provide diesel displacement through improved
incremental delivery and efficiency measures to businesses and residences to reduce energy costs. Timeline - Year one and ongoing.
Facilitate technical outreach and expertise for utilities and efficient uses of energy. Timeline - Year one and ongoing.
Promote energy audits throughout the region. Timeline - 2017 to 2018.
SEC energy committee and coordinator will collaborate with federal and state agencies and project proponents to regularly communicate and advocate for project support. Specific advocacy
Southeast Alaska 2020 Economic Plan Page 31
Priority Objective #2: Promote priorities of the regional energy plan including infrastructure and diesel displacement.

includes: permitting (and re-permitting) of energy infrastructure projects, energy efficiency outreach, and energy audits. Energy coordinator will engage telephonically and electronically to maintain progress. Regional outreach to implement SE IRP, especially biomass and energy efficiency objectives.
Timeline: 2017 to 2020 - Conduct 2-4 energy committee meetings annually. 2016-2017 – Conduct energy efficiency outreach throughout region with site visits for energy audits. Assist with state efforts to identify biomass feasibility in Hoonah and Kake. Participate in biomass greenhouse handbook development.
Step 1: Work with the federal government to increase investments in the region. Timeline – ongoing.
Step 2: Support Efforts to Set Aside the Roadless Rule as a Barrier to Renewable Energy Development. Access to geothermal leases is prohibited by the Roadless Rule. Language in the Roadless Rule preamble indicates that access to new hydro projects is not allowed. There are 9.6 million acres of IRAs in the Tongass. The Roadless Rule is a significant barrier to renewable energy development in Southeast Alaska. Timeline – now through 2018.
Step 3: Increase access to renewable resources within the Tongass National Forest. A Renewable Energy Resource Plan, including a Renewable Energy Resource Development Land Use Designation (LUD), should be added to the Forest Plan to promote and support all forms of public and private renewable energy development (including geothermal) and related transmission lines within the Tongass. The current Transportation and Utility System (TUS) LUD should be amended to change the criteria to allow the TUS LUD to apply to hydropower projects and other renewable energy projects within TUS Avoidance Areas and to allow for public and private hydropower development in all LUDs. A great local example of the importance of access to renewable energy - when the Greens Creek Mine was connected to hydropower, it displaced 4.6 million gallons of diesel use annually. Timeline – now through January 2017.
Step 4: Identify federal regulations that hamper energy development and bring these to the attention of Sen. Lisa Murkowski (R-Alaska), the
U.S. Senate Energy and Natural Resources Committee, and the Alaska Congressional Delegation.
Step 5: Reduce barriers to increase new investments in energy. Given the lack of state grant money available, new investments are critical. Work to create a business climate that will promote new opportunities for funding new projects and initiatives
People/Organizations responsible for completing these steps Southeast Conference Energy committee, partnerships, US Forest Service, utilities, IPPs
Cost Estimates $350,000 Southeast Conference, US Forest Service, utilities,
IPPs
Evaluation Measures • Number of projects in development • Biomass greenhouse handbook developed • Development of a renewable energy land use
designation • Federal dollars invested in region for energy • Number of Southeast Alaska energy meetings • Installed BTU capacity for renewables • Number of biomass and heat pump projects • Technical assistance and community workshops
provided • Number of efficiency initiatives for utilities and
consumers • Number of energy audits • Number of Electric Vehicles in region • Industry Outlook • Total Amount of Private Investment reported • Total energy jobs
Key Project Contact Name: Alec Mesdag, Director of Energy Services, AEL&P and Robert Venables, Southeast Alaska Energy Coordinator
Southeast Alaska 2020 Economic Plan Page 32
Priority Objective #4 Project Title: Marine Industrial Support Sector Talent Pipeline: Implement the Alaska Maritime Workforce Development Plan in Southeast Alaska. Upgrade talent pipeline and incumbent workforce skills supporting the Southeast Alaska Marine Industrial Support Sector.
Project Description: Southeast Alaska resident workforce lacks awareness of and entry level skills required to fill openings that exist in the regional Marine Industrial Support (MIS) sector. Regional MIS employers are reporting successful outcomes in recruiting and training residents on the job for MIS job openings. Successful outcomes and findings include: • Residents are attracted to career opportunities
offering family supporting wages and stable, year-round employment.
• Motivated to learn and master new skills • Are tolerant of living in Southeast Alaska’s physical
and social environments. • Are advancing into supervisory and leadership
positions. Southeast Alaska’s MIS Sector talent pipeline draws from regional school districts, community and university campuses, tribal colleges and organizations, job centers, and career awareness activities. Southeast Alaska’s MIS Sector infrastructure exists in nearly every community in the region. Regional MIS capabilities range from small boat to mid-size ship building, repair, maintenance, and conversion projects. A number of communities have installed new MIS infrastructure, including boat and ship haul out facilities; land level, open and enclosed boat and ship repair, and new ship building production facilities. Development of the installed MIS infrastructure has occurred over the last 15 years, yet the regional MIS sector is confronted with significant competitive disadvantages preventing full utilization of installed capacity. Those disadvantages include absence of a knowledgeable and skilled MIS workforce and diverse subcontractor and vendor industrial supply base. The purpose of this project is to build on regional MIS sector workforce investment and development practices that are emerging in response to unmet demand for knowledgeable, skilled and qualified MIS workers. Development of an effective MIS sector
talent pipeline and incumbent worker skill upgrade practices will improve the competitiveness of existing MIS businesses and provide new MIS vendors and contractors the talent required to be successful. In May 2014, the University of Alaska (UA) published the Alaska Maritime Workforce Development Plan, followed in September 2014 by the Alaska Department of Commerce’s publication of the report titled, “Trends and Opportunities in the Alaska Marine Industrial Support Sector (Alaska MIS Sector report).” The Alaska MIS report provides baseline sector information about the supply and demand for MIS sector services in the region. The Alaska Maritime Workforce Plan identifies the MIS Sector’s need for a multi-skilled workforce and the family supporting wages that can be earned in this sector. In late 2014, Congress passed the Workforce Innovation and Opportunity Act (WIOA), a long awaited and much need reauthorization of the 1998 Workforce Investment Act (WIA). Key features of WIOA include recognition that successful workforce development initiatives are industry (demand) driven. Prior to WIOA, federal workforce investment funds were largely directed to investments on the supply side of workforce development. Following publication of the Alaska Maritime Workforce Plan, a small group of industry advisors engaged in development of the plan formed Maritime Works (MWs) to create an employer driven organization to direct implementation of the plan. MWs is funded by private, public and foundation funding, and is following the National Fund framework for creating flexible and patient workforce investment pools. MWs has engaged a National Fund for Workforce Solutions (National Fund) Technical Coach for guidance in pooling private, public, and philanthropic investments for workforce initiatives to establish employment and career advancement as the outcomes of training and education. The National Fund framework for industry-driven funding collaboratives was identified as a proven method for making informed, data-driven workforce investment decisions. Building on top of existing civic infrastructure, MWs recently affiliated with the Alaska Process Industry Careers Consortium (APICC), an industry-funded organization with 17 years of success in providing Alaska’s Oil and Gas sector with qualified, resident employees. APICC will provide MWs with organizational support services, avoiding the expense of creating a new, siloed organization. Alaska’s
Southeast Alaska 2020 Economic Plan Page 33
Priority Objective #3: Marine Industrial Support Sector Talent Pipeline: Implement the Alaska Maritime Workforce Development Plan in Southeast Alaska. Upgrade talent pipeline and incumbent workforce skills supporting the Southeast Alaska Marine Industrial Support Sector.
To read the full Alaska Maritime Workforce Plan see Appendix V.

Maritime and Energy sectors have many cross cutting occupations and skills. It is worth noting that representatives from Southeast Alaska’s MIS Sector have driven the efforts and initiatives described above. The following steps are now being recommended to create a talent pipeline in Southeast Alaska for bridging the school-to-work gap and upgrading the knowledge, skills, and abilities of the regional incumbent workforce. A safe, stable, and productive workforce will increase the competitiveness of regional MIS Sector employers, increasing the volume of contracts and creating new demand for MIS services. Outline of steps required for project to be completed. Improve MIS Talent Pipeline - Continuous
improvement over the 5-year planning horizon • Improve school to work employment outcomes • Expand Marine Industrial Pre-Apprentice Program
Develop presentation on Marine Industrial Pre-Apprentice Program
• NCCER Career Pathways • Present to school administrators and school boards • Coordinate school activities to facilitate visits to local
employers • Increase performance of NCCER practical
demonstrations in the workplace • Increase use of NCCER curriculum in regional school
systems • NCCER courses; Core, Marine Industry Fundamentals,
Welding, Electrical, Fundamentals of Crew Leadership
• Increase MIS career awareness for high school students
• Expand employer participation in ADOTPF Marine and Construction Career Day
- Managed by ADOTPF Civil Rights Office - MIS employer participation in 6 regional career
day events - Develop Marine Industrial Registered
Apprenticeship Program - Build on NCCER and industrial career pathways
Upgrade skills in regional adult and incumbent workforces
• Expand use of Adult Alaska Construction Academy in Southeast Alaska
• Establish communication and coordination with regional Alaska construction academies - Ketchikan – MIS businesses - Juneau SE Alaska Regional Resource Center
(SERRC), Jake Mason SERRC
• Advise UAS on MIS industry needs:
- UAS - Ketchikan – Priscilla Schulte and Wendy Miles
- UAS – KTN Regional Maritime Career and Training Center
- UAS - Juneau (Pete Traxler) - UAS – Sitka
Increase number of entry level employment openings by
• Advancing entry level incumbent workers to mid and journey level production skills
• Advancing mid to journey level production workers to supervisory and management positions
• Increase funding for MIS Sector Career and Technical Education
Support MIS enabling policy and legislation - Continuous activities over 5-year planning horizon
• Increase funding for MIS CT&E • Coordinate efforts between SEAMIC , KMIC, and
Maritime Works to create regional funding collaboratives
• Develop a communication plan to identify and distribute notices of funding availability.
• Support for the US Maritime and Energy Workforce Technical Training Enhancement Act (S. 2053/H.R. 2923), introduced by Sen. David Vitter (R-LA) and Rep. Gene Green (D-TX).
• Participate in Cross Industry skills identification with Business Education Compact
People/Organizations responsible for completing these steps Employers, UAS, Chambers of Commerce, KMIC, school boards and school administrators, regional High Schools and ADOTPF Civil Rights Office, construction academies, Maritime Works, Southeast Conference
Cost Estimates How much will this cost, and who will pay these costs? Total $2,795,000 1) Improve MIS Talent Pipeline $10,000 per year over 5 years totals $50,000 Who: Employers, Chambers of Commerce, KMIC, school boards and school administrators Employers, regional High Schools, and ADOTPF Civil Rights Office 2) Upgrade skills in regional adult and incumbent
workforces - $260,000 Who: MIS employers 3) Increase funding for MIS Sector Career and
Technical Education - $2.5 million Who: Regional and state MIS employers
Southeast Alaska 2020 Economic Plan Page 34

Evaluation Measures • Annual enrollments (Construction Academy
enrollment in MIS Pre-Apprentice Program, UAS MIS program enrollments, AkCA Enrollments, high school pre-apprentice program enrollment)
• College Certificates and degrees completed (includes HS students in enrolled in pre-apprentice program)
• Federal Registration of Apprenticeship
• Number of endorsement completed in SE Alaska
• Graduates finding employment in MIS • Registration for Maritime Career Day event
• Marine Industrial Pre-Apprentice program • UAS MIS program job placements
• Total Amount of Private Investment reported
• Ship and Boat building jobs
Key Project Contact Name: Doug Ward Title: Shipyard development director Organization: Vigor Alaska
Priority Objective #5 Project Title:
Alaska Mariculture Initiative
Project Description:
Grow a $1 billion industry in 30 years
Outline of steps required for project to be completed
1) Support an economic analysis of successful mariculture industries in other regions, how they relate to Alaska, and the impact of a fully developed mariculture industry in Alaska 2016-18
2) Support and participate in a strategic planning process inclusive of a broad spectrum of stakeholders and agencies (including coastal communities, industry, the State of Alaska, federal agencies, and interested conservation groups) with the directive to create a coordinated, deliberate and solutions-oriented plan to developing the industry 2016-2018
Examples of issues to be addressed:
• Legal authority to enable invertebrate enhancement and restoration
• Stabilize funding for shellfish hatcheries through existing loan funds
• Adjust Mariculture Revolving Loan Fund for increased utilization by farmers
• Long-term funding mechanisms (e.g. salmon enhancement public/private model)
• Other topics being covered by 5 different advisory committees in the mariculture task force
3) Help to engage federal agencies and private investors with interest and resources to help (e.g. CODEL, NOAA, USDA, EDA, NPRB, Native corporations, CDQ groups, Rasmuson Foundation, seafood processors, etc.) 2017-2020
Support integration of development efforts with national initiatives and strategies, such as:
USDA Investment Strategy in support of rural communities in Southeast Alaska 2011-2013
National Shellfish Initiative (NOAA) National Strategic Plan for Federal Aquaculture
Research (2014-2019)
4) Support increased capacity for shellfish safety testing in the SE region.
People/Organizations responsible for completing these steps
Southeast Conference, Alaska Fisheries Development Foundation, Alaska Shellfish Growers Association, OceansAlaska, SE AK municipalities, State of Alaska through Governor’s Mariculture Task Force.
Cost Estimates How much will this cost, and who will pay these costs?
$1.5 million+
AFDF is currently working under a $200,000 NOAA grant; private interests have donated approximately $20,000 additional funds to match an EDA grant of $46,425 grant for economics; Ocean’s Alaska loan; private industry may contribute additional matching funds; other interested funders may include: Rasmuson Foundation, USDA, NOAA, AIDEA, Alaska Growth Capital, Sealaska Spruce Root, The Nature Conservancy, and Alaska Dept. of Commerce loan funds.
Evaluation Measures • Number of meetings of the Alaska Governors
Mariculture Taskforce • Advisory Committees
Southeast Alaska 2020 Economic Plan Page 35
Priority Objective #4: Alaska Mariculture Initiative

• Number of stakeholders involved in planning process
• Annual aquatic farm production in Southeast Alaska (value, poundage and species)
• Number of businesses working either in aquatic farms or enhanced fisheries (non-salmon)
• Number of employees working either in aquatic farms or enhanced fisheries (non-salmon)
• Number of research projects funded for mariculture • Number of sites permitted in SE • Number of sites/acres applied for permitting in
Southeast Alaska • economic outlook for industry • Total Amount of Private SE Mariculture Investment
reported
Key Project Contact Name: Julie Decker Title: Executive Director Organization: Alaska Fisheries Development
Foundation
Priority Objective #6 Project Title:
Full Seafood Resource Utilization & Ocean By-Product Development.
Project Description: 350 million pounds of seafood are harvested in Southeast Alaska each year, but most of that product leaves the region with only primary processing (heading, gutting, and freezing) and the secondary processing is conducted in other states or countries. Additionally, a portion (5-40% depending upon the species) of the harvested resource is not utilized and instead is disposed of as waste in local waters. The objective of this initiative is to increase total revenue from existing commercial fisheries in the region by developing new, higher value products and markets from parts of the fish that are currently either thrown away or that go to lower relative value markets. In some cases this means working with seafood processors to develop new products, but we also need to identify businesses or entrepreneurs not currently in the seafood industry who can contribute to this effort. Collaboration with private, state, federal and university researchers needs to be encouraged to identify and accelerate opportunities for
commercialization of improved or new products. Support the development of new specialty products that utilize 100% of harvested seafood resources in order to create value-added products with the same resource, reduce discharge into waterways, and provide additional economic benefits to local economies. Examples include pet food, clothing and accessories, pharmaceuticals, nutraceuticals and health food products. Support growth of new businesses to develop these new products.
Outline of steps required for project to be completed Support identification of raw materials available for
product development Work with seafood processors and entrepreneurs to
develop new seafood products by connecting them with other necessary expertise (ongoing 2016-2020)
Support development of incentives to increase secondary processing in the region (ongoing 2016-2020)
Support “proof of concept” for new products by connecting businesses and entrepreneurs with resources
Work to get current processors to “think outside the can” through events like the annual Innovation Summit with a portion of the event targeted to new ocean products (ongoing 2016-2020) and in local events/festivals that celebrate the seafood industry in the region.
Encourage and promote value-added products made from Alaska seafood by hosting an annual competition for new products (ongoing 2016-2020)
Learn from other regions and countries through research and visits.
People/Organizations responsible for completing these steps Julie Decker, Alaska Fisheries Development Foundation. Brian Holst, Juneau Economic Development Council. Southeast Conference.
Cost Estimates How much will this cost, and who will pay these costs? $250,000 Costs (direct and in kind) will be paid by AFDF, JEDC, SEC and State of Alaska, and industry.
Southeast Alaska 2020 Economic Plan Page 36
Priority Objective #5: Full Seafood Resource Utilization & Ocean By-Product Development.

Evaluation Measures • Total pounds of seafood processed: • Count of Shorebased seafood processors: • Business licenses for seafood products: • Number of new products entered into the Alaska
Symphony of Seafood each year: • Total seafood manufacturing Jobs in Southeast: • economic outlook for industry • Total Amount of Private Investment reported
Key Project Contact Name: Julie Decker & Brian Holst Title: Executive Director Organization: Alaska Fisheries Development
Foundation and the Juneau Economic Development Council
Priority Objective #7 Project Title:
Market Southeast Alaska to Attract More Visitors
Project Description:
A collaborative regional visitor marketing effort to provide more marketing opportunities, improve brand awareness, strengthen the marketing reach, widen regional coverage of information, and leverage limited resources. Enhance current activities throughout SE Alaska and create new ones that would draw interest from families with children to travel around SE Alaska.
Outline of steps required for project to be completed Market Southeast Alaska through Travel Juneau, Visit
Ketchikan and the Southeast Alaska Tourism Council
Market region at trade shows, in publications, online etc. – annually
Tourism Departments work with local entities to identify 100 or more top attractions for families with children
Branding Southeast as the Northwest Coast Native Arts capitol promoting arts training, visitor education and procurement of arts.
Solicit additional communities and businesses to participate in SATC - 2016 and 2017
People/Organizations responsible for completing these steps Southeast Alaska Tourism Council (SATC) has a strong foundation for regional marketing and is willing to improve and build on the regional collaborative effort. Southeast Conference. Travel Juneau.The Ketchikan Convention and Visitors Bureau. Haines Tourism. Carol Tuynman, Alaska Arts Confluence. Tresham Gregg, MOMMYPOPPINS, Sealaska Heritage Institute.
Cost Estimates How much will this cost, and who will pay these costs?
$15,000
• Marketing Partner - $5000 (communities and key transportation)
• Associate Community Member - $600 (communities)
• Industry Affiliates (non-members – Advertisers) banners/narratives) – Beginning at $150
• Alaska Arts Confluence $5K for project coordination; monthly press releases statewide/national/international print and digital media through launch; paid for by advertising commissions; local coordinator/ad sales person supported by local directory ads, tourism department
• MOMMYPOPPINS–In kind donation of press trip write-ups and launch on MP (estimated value: $6,000)
Evaluation Measures • Number of passenger arrivals to SE Alaska • Number of AMHS riders in Southeast Alaska • Total visitor industry jobs • Total visitor industry wages
Key Project Contact Name: Carol Rushmore Southeast Alaska Tourism Council Board Member
Southeast Alaska 2020 Economic Plan Page 37
Priority Objective #6: Market Southeast Alaska to Attract More Visitors

Priority Objective #8 Project Title:
Provide an adequate, economic and dependable supply of timber from the Tongass National Forest to regional timber operators.
Project Description:
To be economically successful, local mills must be provided an opportunity to accumulate a supply of purchased but unharvested economic timber (i.e. volume under contract) equal to approximately three years of timber consumption. This allows the industry ample time to plan an orderly and systematic harvest schedule that meets all timing restrictions and permit requirements. Second, it allows the industry to better manage its financial resources and to secure financing on the basis of longer-term timber supply (banks don’t want to provide loans without multi year plans in place). Third, it allows time for the necessary infrastructure to be maintained. Finally, an ample timber supply gives the industry more opportunity to sustain itself through market cycles. Support management, research, and legal efforts to assure access to adequate, consistent, and economic timber supply on federal and state forest lands.
There are three main Tongass land management layers, adversely affecting the timber, the mining, and the renewable energy industries, that need to be removed: 1) the Transition Plan; 2) the Roadless Rule; and 3) the 2008 Tongass Land Management Plan. The Tongass Transition Plan and Roadless Rule are interlocked. Each prohibits the harvest of old growth timber in the unroaded portions of the Tongass. After 15 years the Transition Plan also prohibits the harvest of old growth timber on the roaded portions of the Tongass.
Outline of steps required for project to be completed.
Step 1 - Support Mental Health Trust land exchange with USFS. Work toward the successful completion of Alaska Mental Health Trust’s administrative land exchange with the USFS. The exchange of Trust Lands (18,066 acres) is adjacent to five SE communities. The exchange will be value-for-
value based on appraised value. There also has been 20,920 acres of USFS lands on Revillagigedo and Prince of Wales identified for the exchange. The process will take another three to five years to complete and will provide additional timber to aid in transitioning the industry.
Step 2 - Work to rescind the Tongass Transition Plan. The quickest way to rescind the Tongass Transition Plan is through the Congressional Regulatory Review Act (5 U.S.C. Sec. 801) (CRA). Assuming that the Tongass Transition Plan and Roadless Rule are rescinded, the 2008 Amended Tongass Forest Plan will again be in effect. The Southeast Conference brought suit against that Plan in 2010 because it administratively reduced the suitable commercial forest land base from the 1.74 million acres allowed by the Tongass Timber Reform Act (TTRA) to 773,000 acres – almost two-thirds below the 2.4 million acres that Congress found was needed to fix the balance between development and conservation described in the Alaska National Interest Lands Conservation Act (ANILCA) §101(d). Accordingly, the 2008 Amended Tongass Forest Plan will need to be amended once the Tongass Transition Plan and Roadless Rule are rescinded.
Step 3 - Continue to support state litigation to set aside the “Roadless Rule”. The 2001 Roadless Rule sets aside 9.6 million acres of the Tongass from timber harvest and road access to other resources. The state, joined by the timber industry, the Southeast Conference, the Ketchikan Gateway Borough, the City of Craig, the City and Borough of Wrangell, the City of Ketchikan and 15 other timber supportive entities, is currently litigating the application of the Roadless Rule to the Tongass. Continue to support this litigation.
Step 4 - Support the Sealaska five-year harvest plan. In response to the Sealaska land exchange that occurred earlier this year, Sealaska has developed a long term, economically sustainable timber harvest plan of 45 million mmbf. The plan maximizes economic benefits to rural communities, along with the duration of economic activity.
Step 5 - Support Tongass 2 million acre state forest land transfer. Pursue state ownership and/or management authority of two million acres of National Forest System lands in the Tongass to
Southeast Alaska 2020 Economic Plan Page 38
Priority Objective #7: Provide an adequate, economic and dependable supply of timber from the Tongass National Forest to regional timber operators.

support an integrated timber industry in Southeast Alaska. These lands would be for economic development and would support a timber industry in Southeast Alaska.
Step 6- Hire a regional timber coordinator. Engage the state, advocate for funding of state timber programs (earnings should go back to division rather than general fund), work with FS to maintain current timber supply.
People/Organizations responsible for completing these steps AFA, Southeast Conference, Viking Lumber, Sealaska, ALCAN
Cost Estimates How much will this cost, and who will pay these costs?
$500,000 – Southeast Conference, AFA
Evaluation Measures • Number of years of timber supply • Scope of timber supply • Total timber jobs • Total MMBF harvested • Total private sector funds invested
Key Project Contact Name: Bryce Dahlstrom Title: President Organization: Viking Timber
Southeast Alaska 2020 Economic Plan Page 39

Southeast Alaska 2020 Economic Plan Page 40
Economic Plan Steering CommitteePublic Officials • Jan Hill Haines Borough Mayor • Patricia Phillips City of Pelican Mayor • Ken Skafelsted City of Hoonah Mayor • Dennis Watson City of Craig Mayor
Community Leaders • Carol Rushmore City and Borough of
Wrangell Economic Development Manager
• Clarence Clark State of Alaska Forester • Norm Carson Pelican Chamber of
Commerce • Craig Dahl Chamber of Juneau Chief
Executive Officer • Garry White Sitka Economic
Development Association ED • Clay Koplin Cordova Electric Cooperative
Chief Executive Officer • Brian Holst Juneau Economic
Development Council Chief Executive Officer
• Juliene Miles Skagway Development Corporation Executive
• Glen Thompson Ketchikan Gateway Borough Assembly Member
• Liz Cabrera Petersburg Economic Development Executive
• Misty Fitzpatrick City of Coffman Cove Clerk
Representatives of Workforce Development Boards • Doug Ward Alaska Investment Workforce
Board Director
Representatives of Institutions of Higher Education • Rick Caulfield University of Alaska
Southeast Chancellor • Sheryl Weinberg Southeast Regional
Resource Center • Kim Szczatko University of Alaska
Southeast Regional Tech-Prep Coordinator
Labor Groups • Shannon Adamson Masters Mates and
Pilots Union • Corey Baxter IUOE 302
Tribal Representatives • Gary Williams Kake Tribal Executive • Bob Starbard Hoonah Indian Association
Tribal Administrator • Bert Adams Yakutat Tribe Council • Richard Peterson Central Council Tlingit
& Haida Indian Tribes of Alaska President • Myrna Gardner Central Council Tlingit &
Haida Indian Tribes of Alaska Economic Development
• William Ware Central Council Tlingit & Haida Indian Tribes of Alaska Transportation Director
Private Individuals & Companies • Dave Kensinger Chelan Produce Owner • Gordy Wrobel Ocean Market Gardens
Owner • Chelsea Goucher Alaska Marine Lines
Marketing • Merrill Sanford Former Juneau Mayor • Bryce Dahlstrom Viking Lumber Vice
President • Sylvia Lange Reluctant Fisherman Owner • Tim McLeod Alaska Electric & Power
President • Nolan Steiner Avista Director of Strategic
Planning • Tom Sullivan Northrim Bank President • Joe Jacobsen Huna Totem Business
Development • Sheila Kleinschmidt First Bank
Community Relations • Kathie Wasserman Alaska Municipal
League Executive Director • Tyler Maurer Alaska Marine Lines
Business Development • KC Hostetler Alaska Airlines Community
Relations • Mike Satre Hecla Greens Creek Mine
Community Relations • Julie Decker Alaska Fisheries
Development Foundation Development Director

Southeast Alaska 2020 Economic Plan Page 41
Appendices Available at www.seconference.org/strategy
Appendix I Southeast Alaska by the Numbers 2017
Appendix II Southeast Alaska Business Climate Survey Analysis 2015
Appendix III Analysis of Southeast Alaska's
Strengths, Weaknesses, Opportunities & Threats 2015
Appendix IV Southeast Alaska Resilience Mapping
Weatherizing for the Economic Storm 2016
Appendix V Alaska Maritime Workforce Plan
Appendix VI Alaska Mining Workforce Development Plan
Appendix VII Southeast Conference Board of Directors Resolutions
Appendix VIII Southeast Conference Board of Directors and Membership Roster
Reference Materials Sitka Economic Development Association Strategic Plan 2016
Juneau Economic Development Plan 2015 The Maritime Economy of Southeast Alaska 2015
Southeast Alaska Transportation PlanSoutheast Cluster Initiative
Southeast Alaska Food System Assessment CBJ Housing Action Plan 2016


Southeast Alaska 2020 Economic Plan Page 42
Southeast Conference612 W. Willoughby Ave. Suite BP.O. Box 21989Juneau, AK 99802 (907) 586-4360www.seconference.org
Publication by Rain Coast Data