south west hydrological information package
TRANSCRIPT

Research Library Research Library
Bulletins 4000 - Research Publications
2001
South west hydrological information package : understanding and South west hydrological information package : understanding and
managing hydrological issues on agricultural land in the south managing hydrological issues on agricultural land in the south
west of Western Australia west of Western Australia
Peter J. Tille
T W. Mathwin
Richard J. George Dr
Follow this and additional works at: https://researchlibrary.agric.wa.gov.au/bulletins
Part of the Environmental Monitoring Commons, Hydrology Commons, and the Water Resource
Management Commons
Recommended Citation Recommended Citation Tille, P J, Mathwin, T W, and George, R J. (2001), South west hydrological information package :
understanding and managing hydrological issues on agricultural land in the south west of Western Australia. Department of Primary Industries and Regional Development, Western Australia, Perth. Bulletin 4488.
This bulletin is brought to you for free and open access by the Research Publications at Research Library. It has been accepted for inclusion in Bulletins 4000 - by an authorized administrator of Research Library. For more information, please contact [email protected].

Bulletin No. 4488 ISSN 1326-415X Agdex 500
THE SOUTH-WEST HYDROLOGICAL
INFORMATION PACKAGE
Understanding and managing hydrological issues
on agricultural land in the south-west of Western Australia.

The authors: Peter Tille Soils Resources Officer Department of Agriculture Bunbury, Western Australia Tim Mathwin Hydrologist Department of Agriculture Katanning, Western Australia Richard George Senior Research Scientist Department of Agriculture Bunbury, Western Australia Disclaimer: The Chief Executive Officer of the Department of Agriculture and the State of Western Australia accept no liability whatsoever by reason of negligence or otherwise arising from the use or release of this information or any part of it. : The product trade names in this publication are supplied on the understanding that no preference between equivalent products is intended and that the inclusion of a product does not imply endorsement by Department of Agriculture over any other equivalent product from another manufacturer. Any omission of a trade name is unintentional. Recommendations were current at the time of preparation of this material. State of Western Australia, 2001 This publication may be reproduced in whole or part provided that acknowledgment to Department of Agriculture , citing full publication details (series information, author, title, year) is included.
ISSN 1326-415X
THE SOUTH-WEST HYDROLOGICAL
INFORMATION PACKAGE
Understanding and managing hydrological issues
on agricultural land in the south-west of Western Australia.
Compiled by P.J. Tille, T.W. Mathwin and R.J. George Agriculture Western Australia
Funded by the Natural Heritage Trust
Agriculture Western Australia Bulletin No. 4488 ISSN 1326-415X
Agdex 500
Cover photo: Landholders inspecting an alley farming system reclaiming saline flats at Duranillin.


Contents
i
TABLE OF CONTENTS FOREWORD.....................................................................................................................................................1
AGKNOWLEDGEMENTS..................................................................................................................................2
1. ABOUT THIS MANUAL ................................................................................................................................3 1.1 INTRODUCTION.....................................................................................................................................3 1.2 THE SOUTH-WEST HYDROLOGICAL REGION......................................................................................4 1.3 USING THIS MANUAL.............................................................................................................................8 1.4 UNITS OF MEASURE USED TO DESCRIBE SALINITY..........................................................................10
1.4.1 The nature of the problem ..............................................................................................................10 1.4.2 Dealing with the problem................................................................................................................11
1.5 REFERENCES......................................................................................................................................13
2. THE ENVIRONMENT OF THE SOUTH-WEST HYDROLOGICAL REGION ................................................14 2.1 CLIMATE...............................................................................................................................................14
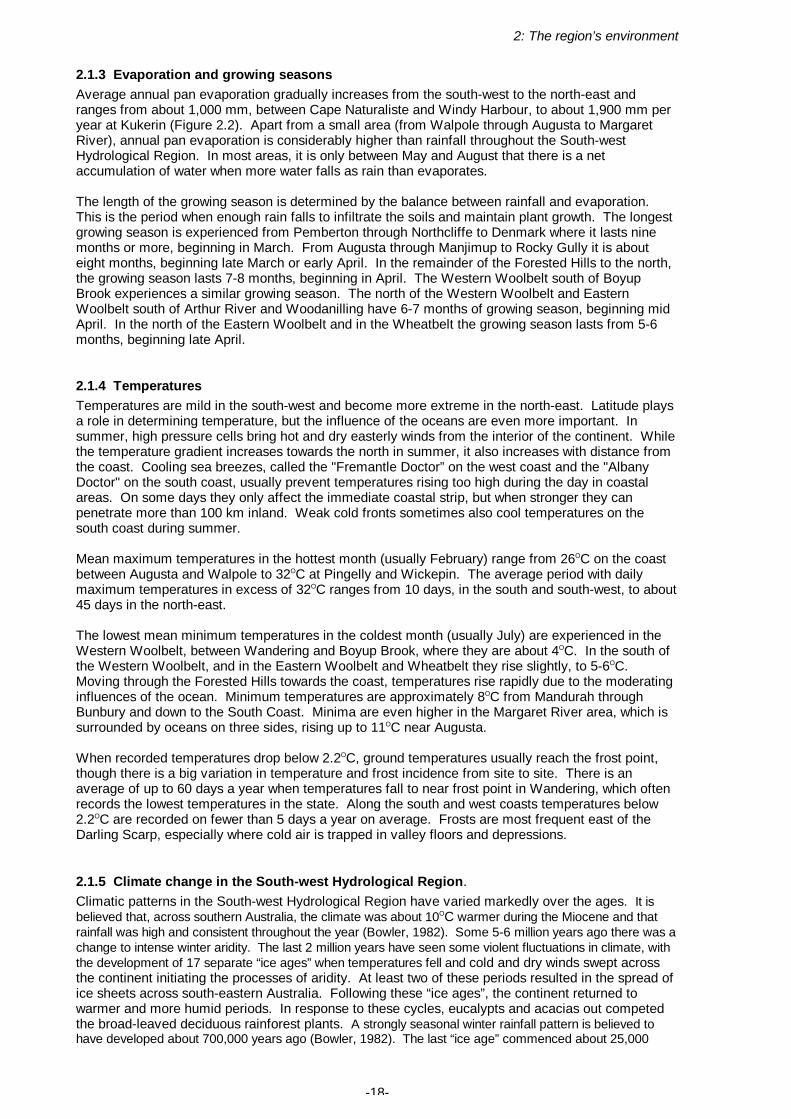
2.1.1 Global infl uences on the climate....................................................................................................14 2.1.2 Rainfall ..........................................................................................................................................15 2.1.3 Evaporation and growing seasons..................................................................................................18 2.1.4 Temperatures.................................................................................................................................18 2.1.5 Climate change in the South-west Hydrological Region. .................................................................18
2.2 GEOLOGY............................................................................................................................................22 2.2.1 Yilgarn Craton................................................................................................................................24 2.2.2 Collie, Wilga and Boyup Basins......................................................................................................24 2.2.3 Albany-Fraser Orogen....................................................................................................................26 2.2.4 Leeuwin Complex...........................................................................................................................26 2.2.5 Perth Basin ....................................................................................................................................26
2.3 LANDSCAPES AND SOILS ...................................................................................................................28 2.3.1 Southern Zone of Ancient Drainage................................................................................................28 2.3.2 Southern Zone of Rejuvenated Drainage ........................................................................................28 2.3.3 Eastern Darling Range Zone ..........................................................................................................30 2.3.4 Western Darling Range Zone .........................................................................................................30 2.3.5 Warren-Denmark Southland Zone..................................................................................................30 2.3.6 Donnybrook Sunkland Zone ...........................................................................................................31 2.3.7 Leeuwin Zone.................................................................................................................................31 2.3.8 Swan Coastal Plain........................................................................................................................31 2.3.9 Scott Coastal Zone.........................................................................................................................32 2.3.9 Soil groups.....................................................................................................................................32
2.4 HYDROLOGY .......................................................................................................................................42 2.5 REFERENCES......................................................................................................................................46
3. THE HYDROLOGICAL CYCLE...................................................................................................................48 3.1 INTRODUCTION...................................................................................................................................48
3.1.1 What is the hydrological cycle? ......................................................................................................48 3.1.2 How does the hydrological cycle work? ..........................................................................................48
3.2 FEATURES OF THE HYDROLOGICAL CYCLE IN THE SOUTH-WEST HYDROLOGICAL REGION .......56 3.2.1 Inputs ............................................................................................................................................56 3.2.2 Transportation................................................................................................................................58 3.2.3 Storage..........................................................................................................................................67 3.2.4 Output ...........................................................................................................................................68
3.3 THE IMPACTS OF LAND USE CHANGES ON THE HYDROLOGICAL CYCLE........................................71 3.3.1 The effect of clearing on the water balance.....................................................................................71 3.3.2 Other hydrological changes............................................................................................................74
3.4 REFERENCES......................................................................................................................................75

Contents
ii
4. THE HYDROLOGICAL ZONES.................................................................................................................. 77 4.1 THE WHEATBELT HYDROLOGICAL ZONE ...................................................................................................... 79
4.1.1 General description of the Wheatbelt ............................................................................................. 79 4.1.2 Hydrological characteristics of the Wheatbelt ................................................................................. 80
4.2 EASTERN WOOLBELT HYDROLOGICAL ZONE ................................................................................................ 83 4.2.1 General description of the Eastern Woolbelt .................................................................................. 83 4.2.2 Hydrological characteristics of the Eastern Woolbelt ...................................................................... 83
4.3 THE WESTERN WOOLBELT HYDROLOGICAL ZONE......................................................................................... 86 4.3.1 General description of the Western Woolbelt ................................................................................. 86 4.3.2 Hydrological characteristics of the Western Woolbelt ..................................................................... 86
4.4 THE FORESTED HILLS HYDROLOGICAL ZONE ................................................................................................ 89 4.4.1 General description of the Forested Hills........................................................................................ 89 4.4.2 Hydrological characteristics of the Forested Hills ........................................................................... 90
4.5 THE COASTAL PLAINS HYDROLOGICAL ZONE ................................................................................................ 93 4.5.1 General description of the Swan Coastal Plain............................................................................... 93 4.5.2 Hydrological characteristics of the Swan Coastal Plain................................................................... 94 4.5.3 General description of the Scott Coastal Plain................................................................................ 96 4.5.4 Hydrological characteristics of the Scott Coastal Plain ................................................................... 96
4.6 REFERENCES ..................................................................................................................................... 97
5. DRYLAND SALINITY ................................................................................................................................. 98 5.1 INTRODUCTION .................................................................................................................................. 98
5.1.1 What is dryland salinity?................................................................................................................ 98 5.1.2 What causes dryland salinity? ....................................................................................................... 98
5.2 DRYLAND SALINITY IN THE SOUTH-WEST HYDROLOGICAL REGION .............................................. 99 5.2.1 What is the extent of dryland salinity?............................................................................................ 99 5.2.2 What are the problems associated with dryland salinity?.............................................................. 103 5.2.3 Which areas are most susceptible to dryland salinity? ................................................................. 105 5.2.4 Dryland salinity research in the South-west Hydrological Region .................................................. 106
5.3 MANAGING DRYLAND SALINITY....................................................................................................... 107 5.3.1 How can dryland salinity be identified?......................................................................................... 110 5.3.2 What changes can be made to agricultural practices?.................................................................. 112 5.3.3 Engineering options ..................................................................................................................... 123
5.4 SOURCES OF FURTHER INFORMATION .......................................................................................... 129 5.4.1 Useful publications ...................................................................................................................... 129 5.4.2 Agencies and organisations to contact ......................................................................................... 134
5.5 REFERENCES ........................................................................................................................................ 135
6. IRRIGATION SALINITY ........................................................................................................................... 139 6.1 INTRODUCTION ................................................................................................................................ 139
6.1.1 What is irrigation salinity?............................................................................................................ 139 6.1.2 What are the causes of irrigation salinity?.................................................................................... 139
6.2 IRRIGATION SALINITY IN THE SOUTH-WEST HYDROLOGICAL REGION ........................................ 140 6.2.1 What is the extent of irrigation salinity?........................................................................................ 140 6.2.2 What are the problems associated with irrigation salinity?............................................................ 142 6.2.3 Which areas are most susceptible to irrigation salinity? ............................................................... 144 6.2.4 Irrigation salinity research in the South-west Hydrological Region ................................................ 144
6.3 MANAGING IRRIGATION SALINITY................................................................................................... 145 6.3.1 How can irrigation salinity be identified? ...................................................................................... 145 6.3.2 What changes can be made to agricultural practices?.................................................................. 146 6.3.3 Engineering options ..................................................................................................................... 147
6.4 SOURCES OF FURTHER INFORMATION .......................................................................................... 150 6.4.1 Useful publications ...................................................................................................................... 150 6.4.2 Agencies and organisations to contact ......................................................................................... 152
6.5 REFERENCES ........................................................................................................................................ 153

Contents
iii
7. WATERLOGGING AND INUNDATION.....................................................................................................154 7.1 INTRODUCTION.................................................................................................................................154
7.1.1 What are waterlogging and inundation?........................................................................................154 7.1.2 What causes waterlogging and inundation?..................................................................................154
7.2 WATERLOGGING IN THE SOUTH-WEST HYDROLOGICAL REGION ................................................156 7.2.1 What is the extent of waterlogging and inundation? ......................................................................156 7.2.2 What are the problems associated with waterlogging and inundation?..........................................156 7.2.3 Which areas are most susceptible to waterlogging and inundation?..............................................158 7.2.4 Waterlogging and inundation research in the South-west Hydrological Region..............................158
7.3 MANAGING WATERLOGGING AND INUNDATION.............................................................................159 7.3.1 How can waterlogging and inundation be identified?.....................................................................159 7.3.2 What changes can be made to agricultural practices? ..................................................................160 7.3.3 Engineering options .....................................................................................................................163
7.4 SOURCES OF FURTHER INFORMATION...........................................................................................168 7.4.1 Useful publications.......................................................................................................................168 7.4.2 Agencies and organisations to contact .........................................................................................170
7.5 REFERENCES.........................................................................................................................................171
8. FLOODING ..............................................................................................................................................172 8.1 INTRODUCTION.................................................................................................................................172
8.1.1 What is flooding? .........................................................................................................................172 8.1.2 What causes flooding?.................................................................................................................172
8.2 FLOODING IN THE SOUTH-WEST HYDROLOGICAL REGION...........................................................173 8.2.1 What is the extent of flooding? .....................................................................................................173 8.2.2 What are the problems associated with flooding? .........................................................................173 8.2.3 Which areas are most susceptible to flooding?.............................................................................173 8.2.4 Flooding research in the South-west Hydrological Region.............................................................173
8.3 MANAGING FLOODING......................................................................................................................174 8.3.1 How can flooding be identified?....................................................................................................174 8.3.2 What changes can be made to agricultural practices? ..................................................................175 8.3.3 Engineering options .....................................................................................................................175
8.4 SOURCES OF FURTHER INFORMATION...........................................................................................177 8.4.1 Useful publications.......................................................................................................................177 8.4.2 Agencies and organisations to contact .........................................................................................178
8.5 REFERENCES.........................................................................................................................................179
9. WATER EROSION...................................................................................................................................181 9.1 INTRODUCTION.................................................................................................................................181
9.1.1 What is water erosion?.................................................................................................................181 9.1.2 What causes water erosion? ........................................................................................................181
9.2 WATER EROSION IN THE SOUTH-WEST HYDROLOGICAL REGION................................................184 9.2.1 What is the extent of water erosion?.............................................................................................184 9.2.2 What are the problems associated with water erosion?.................................................................184 9.2.3 Which areas are susceptible to erosion? ......................................................................................185 9.2.4 Water erosion research in the South-west Hydrological Region ....................................................186
9.3 MANAGING WATER EROSION ..........................................................................................................187 9.3.1 How can water erosion be identified? ...........................................................................................187 9.3.2 What changes can be made to agricultural practices? ..................................................................187 9.3.3 Engineering options .....................................................................................................................190
9.4 SOURCES OF FURTHER INFORMATION...........................................................................................196 9.4.1 Useful publications.......................................................................................................................196 9.4.2 Agencies and organisations to contact .........................................................................................198
9.5 REFERENCES.........................................................................................................................................199

Contents
iv
10. MASS MOVEMENT................................................................................................................................ 200 10.1 INTRODUCTION .............................................................................................................................. 200
10.1.1 What is mass movement? ......................................................................................................... 200 10.1.2 What causes mass movement? ................................................................................................. 200
10.2 MASS MOVEMENT IN THE SOUTH-WEST HYDROLOGICAL REGION ............................................ 202 10.2.1 What is the extent of mass movement? ..................................................................................... 202 10.2.2 What are the problems associated with mass movement? ......................................................... 202 10.2.3 Which areas are most susceptible to mass movement? ............................................................. 202 10.2.4 Mass movement research in the South-west Hydrological Region .............................................. 203
10.3 MANAGING MASS MOVEMENT ....................................................................................................... 203 10.3.1 How can mass movement be identified? .................................................................................... 203 10.3.2 What changes can be made to agricultural practices?................................................................ 204 10.3.3 Engineering options ................................................................................................................... 204
10.4 SOURCES OF FURTHER INFORMATION ........................................................................................ 206 10.4.1 Useful publications .................................................................................................................... 206 10.4.2 Agencies and organisations to contact ....................................................................................... 206
10.5 REFERENCES ...................................................................................................................................... 207
11. NUTRIENT LOSS AND EUTROPHICATION........................................................................................... 208 11.1 INTRODUCTION .............................................................................................................................. 208
11.1.1 What are nutrient loss and eutrophication? ................................................................................ 208 11.1.2 What are the causes of nutrient loss and eutrophication?........................................................... 208
11.2 NUTRIENT LOSS AND EUTROPHICATION IN THE SOUTH-WEST HYDROLOGICAL REGION........ 212 11.2.1 What is the extent of nutrient loss and eutrophication?............................................................... 212 11.2.2 What are the problems associated with nutrient loss and eutrophication?................................... 218 11.2.3 Which areas are most susceptible to nutrient loss and eutrophication? ...................................... 219 11.2.4 Nutrient loss and eutrophication research in the South-west Hydrological Region ....................... 221
11.3 MANAGING NUTRIENT LOSS AND EUTROPHICATION................................................................... 222 11.3.1 How can nutrient loss and eutrophication be identified?.............................................................. 222 11.3.2 Which farm management practices need to be changed?........................................................... 225 11.3.3 Engineering options and other management techniques............................................................. 229
11.4 SOURCES OF FURTHER INFORMATION ........................................................................................ 232 11.4.1 Useful publications .................................................................................................................... 232 11.4.2 Agencies and organisations to contact ....................................................................................... 235
11.5 REFERENCES ...................................................................................................................................... 237
12. ON-FARM WATER SUPPLIES AND WATER SHORTAGES .................................................................. 240 12.1 INTRODUCTION .............................................................................................................................. 240
12.1.1 What systems are used for on-farm water supplies? .................................................................. 240 12.1.2 What causes water shortages? .................................................................................................. 240
12.2 WATER SUPPLIES IN THE SOUTH-WEST HYDROLOGICAL REGION............................................. 243 12.2.1 Water resources and shortages in the South-west Hydrological Region...................................... 243 12.2.2 What are the problems associated with water shortages? .......................................................... 248 12.2.3 Which areas are most susceptible to water shortages? .............................................................. 248 12.2.4 Water supply research in the South-west Hydrological Region ................................................... 248
12.3 MANAGING WATER SHORTAGES .................................................................................................. 249 12.3.1 How can water shortages be identified and predicted? ............................................................... 249 12.3.2 What changes can be made to agricultural practices?................................................................ 249 12.3.3 Engineering options ................................................................................................................... 250
12.4 SOURCES OF FURTHER INFORMATION ........................................................................................ 254 12.4.1 Useful publications .................................................................................................................... 254 12.4.2 Agencies and organisations to contact ....................................................................................... 257
12.5 REFERENCES ...................................................................................................................................... 257
APPENDIX 1: CONTACT DETAILS FOR ORGANISATIONS AND AGENCIES............................................. 259
APPENDIX 2: GLOSSARY OF TERMS........................................................................................................ 265
APPENDIX 3: COMMONLY USED ABBREVIATIONS AND SYMBOLS......................................................... 285

Contents
v
BOXES
BOX 2.1: THE LATERITIC PROFILE..................................................... ERROR! BOOKMARK NOT DEFINED.
BOX 3.1: SOME SUB-SURFACE AND GROUNDWATER TERMINOLOGY ....................................................50
BOX 3.2: SOME MORE SUB-SURFACE AND GROUNDWATER TERMINOLOGY.........................................55
BOX 3.3: GROUNDWATER FLOW VELOCITY AND VOLUMES ....................................................................57
BOX 3.4: PREHISTORICAL GROUNDWATER FLUCTUATIONS ...................................................................73
BOX 5.1: IS THERE ONLY ONE WAY TO SOLVE THE SALINITY PROBLEM? ...........................................107
BOX 5.2: IS THE SALINITY ON MY LAND CAUSED BY RECHARGE ON SOMEONE ELSE’S PROPERTY?.....................................................................................................................................................................108
BOX 5.3: HOW QUICKLY DO GROUNDWATER LEVELS RESPOND TO CHANGES IN THE HYDROLOGICAL BALANCE?.......................................................................................................................109
BOX 5.4: IS A HIGH SALT STORE THE SAME THING AS A HIGH SALINITY RISK?...................................111
BOX 5.5: DO PERENNIALS USE MORE WATER THAN ANNUALS DURING WINTER?..............................112
BOX 5.6: DOES RECHARGE OCCUR MAINLY IN DISCRETE AREAS?.......................................................113
BOX 5.7: ARE PERENNIAL SPECIES CAPABLE OF DRYING OUT SALINE FLATS?..................................116
BOX 5.8: DO TREES ACT AS NATURAL GROUNDWATER PUMPS? .........................................................117
BOX 5.9: HAVE TREE PLANTINGS FOR SALINITY CONTROL PROVED TO BE A FAILURE? ...................118
BOX 5.10: WHAT PROPORTION OF THE LANDSCAPE REQUIRES REPLANTING?..................................122
BOX 5.11: CHANGES TO THE STATUTORY ASSESSMENT PROCESS FOR ENGINEERING OPTIONS..123
BOX 5.12: CAN A CATCHMENT CAN BE DRIED UP WITH DRAINS AND PUMPS? ....................................126
BOX 6.1: MOLE DRAINS IN THE SOUTH-WEST.........................................................................................150
BOX 12.1: WATER LAW REFORM IN WESTERN AUSTRALIA ....................................................................244

Contents
vi
1: About this manual
-1-
FOREWORD
Along with a few select areas of the world, including the countries surrounding the Mediterranean Sea, California, Chile and the Cape region of South Africa, the south-west of Western Australia enjoys a so called “Mediterranean climate” which is dominated by wet winters and dry summers. This climate, with its relatively steady and predictable nature, presents distinct benefits for agricultural industries. The relatively reliable winter rainfall provides a regular growing season for annual crops and pastures. Rain and warmer temperatures in the spring enable crops and pastures to mature, while drier conditions towards the end of spring assist crops to ripen and produce a suitable environment for harvesting. The warm, dry summers allow for the retention of dry fodder in paddocks. They also provide excellent conditions for irrigated horticulture, fed by water captured and stored during the preceding winter. In addition, summer crops are less likely to be damaged by rain or disease. However, the “Mediterranean climate” also presents special challenges to agriculture. Because of the annual cycle of alternating wet and dry conditions, farmers frequently have to face the contradictory problems of too much water and a seasonal drought within the same year. In July and August the growth of crops and pastures is often retarded if the soils become saturated by the persistent rainfall, paddocks become boggy and untrafficable while the moist conditions can also affect the health of livestock. But by February, livestock may be running out of feed because pasture growth is so restricted in the dry soils. The supply of drinking water may also be running short. During summer and autumn, significant flooding and erosion can be caused by episodic rainfall events that result from the incursion of warm, humid air from the tropics. Farming systems in the south-west have been developed to take advantage of the “Mediterranean climate”, and cope with the challenges it presents. However, some of the biggest problems facing agriculture in this region relate directly to the interactions between the climate, water and these farming systems. The widespread reliance on annual plants, which only grow during part of the year when water is freely available, has had a major impact on the water balance that had developed under the native vegetation. The agricultural crops and pastures use less water than the native bush and this reduction in plant water use has led to rising water tables. As a result, the area affected by salinity and waterlogging continues to increase each year. Not only does this trend adversely affect agricultural productivity, it also presents a major threat to natural ecosystems, water supplies, roads, buildings and the future of rural communities. Other forms of land and water degradation such as water erosion and eutrophication are also a consequence of agricultural practices and hydrological changes. Major changes in the way that we manage the land are required if we wish to address these problems and slow or reverse the hydrological trends that are responsible for the degradation of our resources. Implementing of some of these changes has already begun, but much remains to be done. We hope this manual will provide helpful information to people working towards improving the way our farming systems are adapted to our environment, and help them access other sources of knowledge and ideas.

1: About this manual
-2-
AGKNOWLEDGEMENTS
This manual is one output of the project “Hydrological information package for catchment planning in the south-western river catchments”, funded by the Natural Heritage Trust (formerly National Landcare Program). The project was initiated by Dr Richard George and Dr Don McFarlane, with Dr George overseeing the progress of the project throughout. Tim Mathwin worked on the project for two years (1993-1995), undertaking much of the groundwork and compiling the first draft of the manual. In 1997, Peter Tille took over responsibility for completing the manual. This manual has had a long gestation and has received valuable assistance from many people. Unfortunately the names of some of these people may have been lost in the mists of times, especially those who provided input in the early years. Apologies to anyone who made a contribution but has not been acknowledged here. The following farmers shared their experiences and knowledge with Tim Mathwin in the early stages of the project: Alan Anderson (Kojonup), Ken Blaker (Manjimup), Donald Cochrane (Duranillin), Peter Coffey (Boyup Brook), Ben Darbyshire (Donnybrook) , Daryll Dent (Yornaning), Owen Eastcott (Merredith Catchment), Michael Gelmi (Waterloo), John Hicks (Scott River), Basil and Joe Martella (Kirup), Rupert Richardson (Serpentine), Bob Rose (Darkan), Roclea South (Darkan) and Graham Steele (Narrogin). In the early stages, information and ideas were also received from the following Land Conservation District Committees: Boyup Brook, Capel, Collie, Katanning, Kojonup, Manjimup and Wagin. Similar assistance was provided by the following Agriculture Western Australia staff: Trina Bignell, Peter Dawson, Tim Eckersley, Kerry Hawley, Geoff Moore, Bob Nulsen, Heather Percy, Jacqui Richarson, Bill Russell, Bill Smart, Tony Smith and John Silcock. Richard Pickett, Catherine Hardcastle and Robyn Paice from the Water and Rivers Commission in Bunbury supplied data on flow rates and salinity levels in the south-west rivers. Ed Barrett-Lennard from Agriculture Western Australia in Perth supplied information on saltland agronomy. Alan Lymbury from Agriculture Western Australia in Bunbury provided information on saline aquaculture. Mic Andacich from Agriculture Western Australia in Perth provided some of the figures. The following staff from Agriculture Western Australia reviewed sections of the manual, providing a wealth of useful comments as well as some of the data and ideas: Don Bennett (irrigation salinity and mass movement), Mike Bolland (nutrient loss and eutrophication), David Chester (mass movement), Neil Coles (water supplies and flooding), Nick Cox (water erosion), Neil Lantzke (nutrient loss and eutrophication), Macushla Prasser-Jones (water supplies and flooding), Paul Raper (hydrological cycle, waterlogging, dryland salinity and glossary), Ben Rose (hydrological cycle and dryland salinity), Rob Summers (nutrient loss and eutrophication), Peter Taylor (hydrological cycle, hydrological zones and dryland salinity) and Ben Whitfield (dryland salinity). Don Cochrane form Duranillin reviewed the waterlogging section. Don McFarlane, Mark Rivers and Ben Whitfield reviewed the penultimate draft of the document. John Papallia assisted in preparing the maps in Section 2. Kus Kuswardiyanto assisted in preparing many of the other figures. Jon Warren provided much needed administrative support in the latter stages of completing the manual. Jacqui Mallard arranged editing and publication. Jo McFarlane edited the manual.
1: About this manual
-3-
1. ABOUT THIS MANUAL
1.1 INTRODUCTION
Salinity, waterlogging, flooding, water erosion, water shortages and eutrophication are now recognised as major issues related to hydrology in the south-west. It is only recently that the full importance of hydrological processes, and their effect on the land and water resources of south-western Western Australia, have been realised by the wider community. While all the issues are interrelated, salinity is currently the cause of greatest concern. Statewide, salinity has already caused the loss of 50% of the region’s fresh water resources and 18,000 km2 of productive agricultural land. It also presents a major threat to biological diversity (450 plant species and 75% of water birds are at risk of extinction) and regional infrastructure (e.g. 23 rural towns). In addition, other processes are taking place in many seasons. Waterlogging associated with high water tables can greatly reduce agricultural productivity. Water erosion limits agricultural production, by removing fertile topsoil and at the same time causes the sedimentation of rivers and streams. Flooding can cause crop and livestock losses as well as infrastructure damage in rural and urban areas although it is infrequent and less widespread. The downstream impact of these processes is often eutrophication, which leads to a decline in the quality of waterways and threatens aquatic ecosystems. Finally, despite the abundance of saline water, a lack of fresh water restricts the growth of a wide range of established and new industries. The costs of salinity and the other issues mentioned are enormous in financial, ecological and social terms. These costs have developed largely as a result of the way that we manage water in the landscape. The development of agriculture in the south-west has led to significant hydrological changes which for a long time have gone largely unheeded. It is becoming increasingly obvious that we can no longer ignore these changes and that major adaptations are required. In the rural areas of Australia, the authorities responsible for managing water resource have traditionally concentrated on ways of storing freshwater (e.g. in dams or reservoirs) or draining “excess” water. They largely neglected to develop farming systems that reduce the negative impacts of the “excess” water in the agricultural landscape. It is now being better appreciated what a precious resource the rain is, and interest in using or integrating this water where it falls in the landscape (rather than capturing a fraction and disposing of the rest) is developing. As a consequence there has been an increasing demand for information on hydrological topics. This is especially the case in south-western Western Australia. Various government agencies, mining companies, consultants, universities, landholders and other individuals in the south-west have been researching hydrological issues related to agriculture for several decades and a wealth of information is now available. However, this information is often incomplete, poorly integrated or difficult to interpret so that professional officers and landholders alike experience problems in accessing and using it. This lack of accessible information highlighted the need for a publication that contained a comprehensive overview of the basics of hydrology in the south-west and its relationship with agricultural and land and water management. To meet this need, Agriculture Western Australia has prepared the South-west Agricultural Catchment Hydrology Manual using funds from the Natural Heritage Trust. The manual reviews our current knowledge of the hydrological issues that affect, or are affected by, agriculture in the catchments of the south-west of Western Australia. It is designed to provide a summary of numerous management options that have been developed by farmers, government departments, private industries and individuals to make use of “excess” water while combating problems such as water shortages, water erosion, waterlogging, eutrophication, flooding, dryland salinity and irrigation salinity. Where information is not provided, extensive reference is made to more detailed sources. A wide range of people will be able to use this manual. As well as providing a benchmark for future research, it aims to provide landholders, landcare workers, water resource planners, agricultural extension officers and students with a more thorough understanding of the hydrological processes operating in the region so that they may make a difference in the paddock, where it really counts.

1: About this manual
-4-
1.2 THE SOUTH-WEST HYDROLOGICAL REGION
The South-west Hydrological Region covers almost 60,000 km2 situated to the south of Perth and west of Albany (Figure 1.1), lying mostly between the latitudes of 32O S and 35O S and the longitudes of 115O E and 118 O E.
Figure 1.1: Location of the South-west Hydrological Region
1: About this manual
-5-
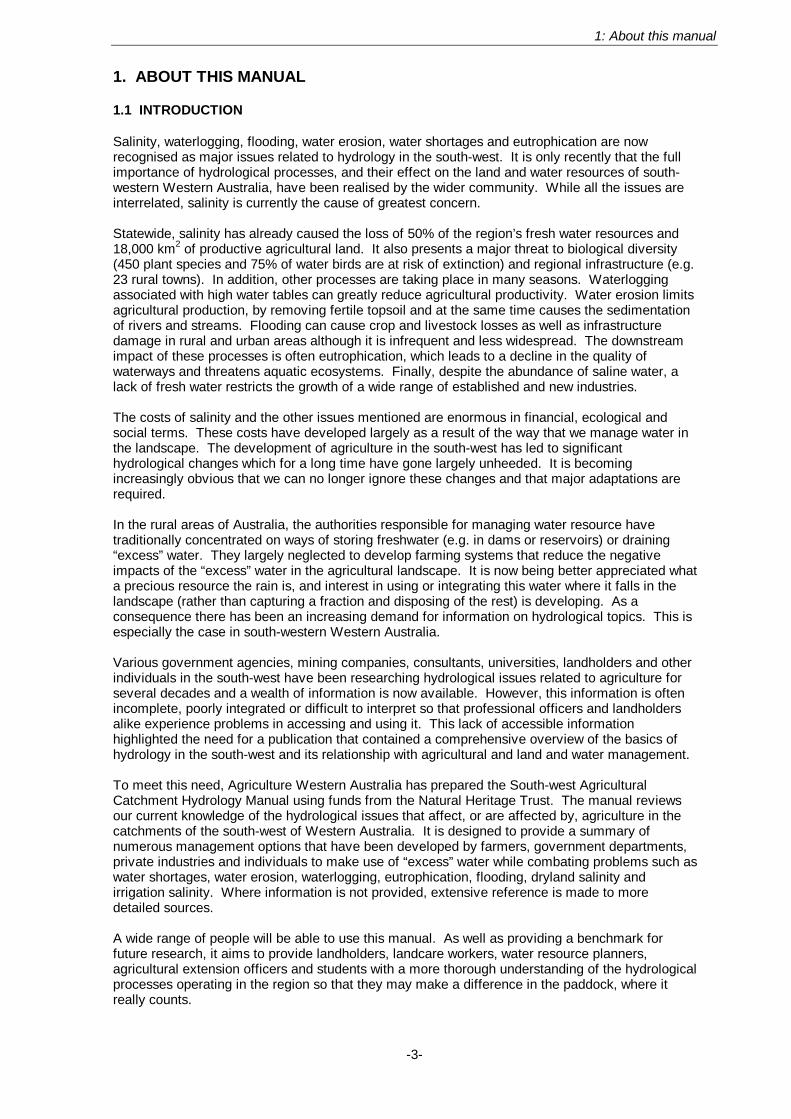
Figure 1.2: Hydrological zones of the south-west

1: About this manual
-6-
Runoff following heavy rain in the Ferguson Valley (Forested Hills).
Eroded saline flat in the Wheatbelt.

1: About this manual
-7-
Tree planting around discharge area at Darkan (Western Woolbelt).
Gully wall dam in orchards near Balingup (Forested Hills).

1: About this manual
-8-
The boundary of the South-west Hydrological Region follows the northern catchment divide of the Serpentine River east from Kwinana to Byford, then south-east to North Bannister. Then it follows the catchment divide of the Murray River east to Pingelly, and south-east to Wickepin where it joins the edge of the upper Blackwood River Catchment. It follows this boundary east to Harrismith and then south, just inland from Kukerin and Nyabing before turning west, passing to the north of Gnowangerup. Close to Broomehill it picks up the eastern boundary of the Gordon River catchment, then turns south past Tambellup to Cranbrook after which the Kent River catchment divide is followed south-west to Pardelup. From here the eastern boundary of the Denmark River catchment is followed south to the Irwin Inlet. The Meckering Line is a major hydrological boundary in the agricultural districts of Western Australia (Mulcahy 1967; Bettenay and Mulcahy, 1972) and in the South-west Hydrological Region it runs from Wickepin through Katanning and to the east of Broomehill. To the east of the Meckering drainage is very sluggish water rarely flows along the entire length of the drainage systems. To the west of the Meckering Line, rejuvenated drainage has resulted in the formation of more recent valleys with creeks and rivers that flow in defined courses every winter. The South-west Hydrological Region has been divided into five hydrological zones for the purposes of this manual (Figure 1.2). These zones were identified by their similarities in geology, landform, soil, climate and land use. Each zone has its own hydrological characteristics and its own set of hydrological issues and solutions. The zones are: • The Wheatbelt Hydrological Zone which encompasses the upper Blackwood Catchment east of
the Meckering Line. Towns include Harrismith, Kukerin, Dumbleyung and Nyabing; • The Eastern Woolbelt Hydrological Zone which lies to the West of the Meckering Line, and is
situated predominantly between the Great Southern Highway and the Albany Highway. This zone stretches from Pingelly in the north, through Narrogin, Wagin and Kojonup to Tambellup and Cranbrook;
• The Western Woolbelt Hydrological Zone lies inland from the main areas of State Forest and
stretches from Bannister through Boddington, Darkan and Boyup Brook to Frankland and Rocky Gully;
• The Forested Hills Hydrological Zone which extends from Jarrahdale, through Dwellingup,
Collie, Donnybrook, Bridgetown, Nannup, Margaret River, Manjimup, Pemberton, Northcliffe and Walpole to Denmark;
• The Coastal Plains Hydrological Zone includes the Swan Coastal Plain (on the West Coast
from Kwinana to Dunsborough) and the Scott Coastal Plain (on the South Coast stretching east from Augusta).
Table 1.1 presents the areas of these zones along with the proportion of each zone that has been cleared for agriculture. The Forested Hills occupy almost 40% of the total area of the South-west Hydrological Region, but accounts for only about 10% of the cleared land in the region. More than half of the cleared land lies in the Wheatbelt and Eastern Woolbelt. Table 1.1: The hydrological zones of the South-west Hydrological Region.
Zone Area (km2)
Area cleared (km2)
Proportion cleared (%)
Wheatbelt 7,000 6,800 97% Eastern Woolbelt 12,000 10,800 90% Western Woolbelt 13,000 8,300 64% Forested Hills 23,000 3,200 14% Coastal Plains 4,100 3,600 88% South-west Hydrological Region
59,100
32,700
55%
1.3 USING THIS MANUAL
The South-west Agricultural Catchment Hydrology Manual is divided into twelve sections. The first is an introduction. The next three sections provide a background to the South-west Hydrological Region and hydrological principles. The background information includes details on
1: About this manual
-9-
the climate, geology, landscapes, soils and river systems (Section 2). Section 3 covers the general principles of the hydrological cycle, introduces terms and concepts and examines the impacts of land use changes on the cycle. The five hydrological zones are described in Section 4. Specific hydrological issues (or forms of degradation related to hydrology) that affect agriculture in the south-west are detailed in the following sections of the manual: • Dryland salinity (Section 5), • Irrigation salinity (Section 6), • Waterlogging and inundation (Section 7), • Flooding (Section 8), • Water erosion (Section 9), • Mass movement (Section 10), • Nutrient loss and eutrophication (Section 11), • On farm water supplies and water shortages (Section 12). Sections 5-12 are designed to stand alone as far as possible, containing most of the information relevant to the issue. However there is some cross referencing to other sections to avoid unnecessary repetition. An understanding of the hydrological cycle and how water moves with respect to the ground is necessary to understand hydrological issues faced in the south-west. For this reason it is recommended that Section 3 should be read before any of the later chapters unless the reader already has a prior knowledge of hydrological processes. In sections 5-12 the information is presented in a consistent format to make it easy to access the details: • The first subsection is always an introduction. It deals with definitions, terms and causes of
the issue being discussed (e.g. “What is dryland salinity?”; “What causes dryland salinity?”). • The second subsection gives information about the extent of issue, problems associated with
the issue and which areas are most susceptible. It then summarises research conducted in the South-west Hydrological Region.
• The third subsection is about managing the issue. It provides information on how to recognise the particular form of degradation and discusses the changes that can be made to agricultural practices and engineering options.
• The forth subsection lists relevant publications and provides a brief summary of government agencies and other groups that can provide information, advice and services.
There are two appendices at the end of the manual: • Appendix 1 gives contact details for organisations and agencies. It is arranged alphabetically and
contains the postal address, e-mail address and telephone numbers of the various agencies, publishers and organisations mentioned in the text. Where applicable, addresses for their internet websites have also been provided.
• Appendix 2 is a glossary of terms. It provides definitions and explanations of most of the terminology used in the manual.

1: About this manual
-10-
1.4 UNITS OF MEASURE USED TO DESCRIBE SALINITY
Few units of measure cause as much confusion and misunderstanding as those that relate to salinity. In this manual it has been necessary to use these units frequently to indicate the amounts of various types of salt present in soil or water, because both the amount and type of salt can degrade land and water resources. In south-western Australia, sodium chloride (NaCl) is usually dominant, typically comprising 75-90% of the salt present. Other salts including calcium and magnesium bicarbonates, chlorides, phosphates and sulphates make up the remainder. 1.4.1 The nature of the problem With the large variety of units and terms in use, the different methods of analysing or estimating salt content and the diversity of situations in which salinity is assessed, it is hardly surprising that even experts in this field experience difficulties when comparing data from different sources. To the layman, this degree of complexity can appear overwhelming. One is likely to find measures of salinity quoted in a wide variety of units including milliSiemens per metre (mS/m), milliSiemens per centimetre (mS/cm), deciSiemens per metre (dS/m), microSiemens per centimetre (µS/cm), percent sodium chloride (%NaCl), percent chloride (%Cl-), percent total soluble salts (%TSS), percent total dissolved solids (%TDS), grains per gallon, parts per million (ppm), moles per litre (mol/L), millimhos per centimetre (mmho/cm), kilograms per hectare (kg/ha), milligrams per litre (mg/L) and milliequivalents per litre (meq/L). To help put things in perspective, most of these units of measure fall into two basic categories: • those relating to the actual amount of salt (salt content) such as mg/L, %NaCl, %TSS, kg/ha,
ppm, meq/L. • those relating to inferred salt content based on measures of electrical conductivity (EC) such as
mS/m, mS/cm, dS/m and mmho. EC is a relatively simple and cheap measurement and can be correlated with salinity because the conductivity of a solution generally increases as its salt content increases.
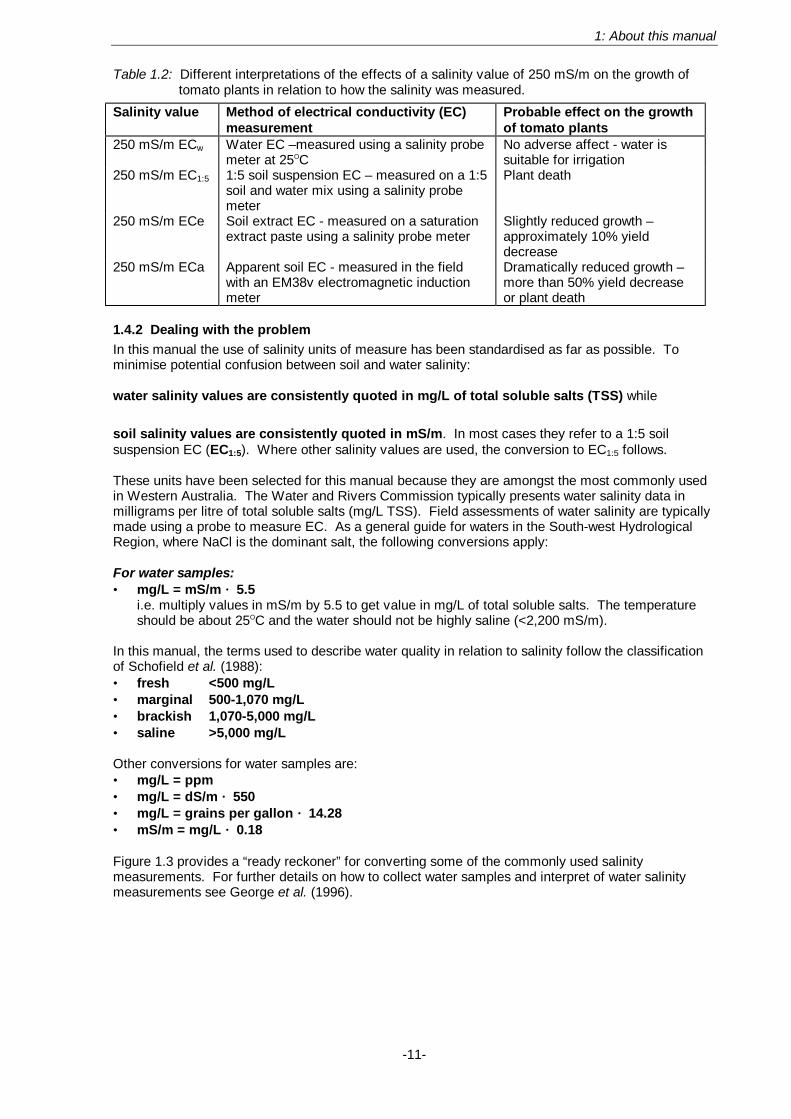
Within each of these two categories, some of the units are interchangeable (e.g. 1 dS/m = 1 mmho/cm and 1 mg/L = 1 ppm) while others can be quickly converted (e.g. 1 grain per gallon = 14.28 ppm and 1 mmho/cm = 100 mS/m). To convert values from one category to the other, it is necessary to know the types of salts present. For example the conversion factor from dS/m to ppm can range between 530 and 900 depending on whether purely sodium chloride or a mixture of several salts is present. To further complicate matters, significant variability can occur even within one unit of measure. This is especially the case with EC measures. One has to take into account the medium in which salinity is being assessed, the technique used and the conditions (e.g. temperature) under which the measurement was made before interpreting values. In fact, highly variable EC values will be produced for the same soil using three common methods of measurement. For example, a sandy soil profile may have an ECe value of 150 mS/m while its EC1:5 value is 10 mS/m and its ECa value is 27 mS/m. The saturation extract (ECe) method involves taking a sample from a soil profile to a laboratory, mixing it with enough distilled water to produce a paste that glistens in the light (US Salinity Laboratory, 1954), filtering the paste and using a probe metre to measure the conductivity of the resultant extract. The 1:5 soil suspension method (EC1:5) is cheaper and quicker, and involves using the same meter to measure the conductivity of a mixture of one part soil and five parts distilled water. The third method measures apparent soil electrical conductivity (ECa) and involves passing an EM38v electromagnetic induction meter over the land surface. This allows soil salinity to be assessed quickly over relatively large areas in the field. There are a variety of other methods of measuring EC and they will produce different values yet again, so it is very important to specify the method when quoting EC values. Table 1.2 demonstrates this point by showing how tomato plants were affected by an EC value of 250 mS/m depending on which method was used to measure the salinity.
1: About this manual
-11-
Table 1.2: Different interpretations of the effects of a salinity value of 250 mS/m on the growth of tomato plants in relation to how the salinity was measured.
Salinity value
Method of electrical conductivity (EC) measurement
Probable effect on the growth of tomato plants
250 mS/m ECw
Water EC –measured using a salinity probe meter at 25OC
No adverse affect - water is suitable for irrigation
250 mS/m EC1:5
1:5 soil suspension EC – measured on a 1:5 soil and water mix using a salinity probe meter
Plant death
250 mS/m ECe
Soil extract EC - measured on a saturation extract paste using a salinity probe meter
Slightly reduced growth – approximately 10% yield decrease
250 mS/m ECa
Apparent soil EC - measured in the field with an EM38v electromagnetic induction meter
Dramatically reduced growth – more than 50% yield decrease or plant death
1.4.2 Dealing with the problem In this manual the use of salinity units of measure has been standardised as far as possible. To minimise potential confusion between soil and water salinity: water salinity values are consistently quoted in mg/L of total soluble salts (TSS) while soil salinity values are consistently quoted in mS/m. In most cases they refer to a 1:5 soil suspension EC (EC1:5). Where other salinity values are used, the conversion to EC1:5 follows. These units have been selected for this manual because they are amongst the most commonly used in Western Australia. The Water and Rivers Commission typically presents water salinity data in milligrams per litre of total soluble salts (mg/L TSS). Field assessments of water salinity are typically made using a probe to measure EC. As a general guide for waters in the South-west Hydrological Region, where NaCl is the dominant salt, the following conversions apply: For water samples: • mg/L = mS/m × 5.5
i.e. multiply values in mS/m by 5.5 to get value in mg/L of total soluble salts. The temperature should be about 25OC and the water should not be highly saline (<2,200 mS/m).
In this manual, the terms used to describe water quality in relation to salinity follow the classification of Schofield et al. (1988): • fresh <500 mg/L • marginal 500-1,070 mg/L • brackish 1,070-5,000 mg/L • saline >5,000 mg/L Other conversions for water samples are: • mg/L = ppm • mg/L = dS/m × 550 • mg/L = grains per gallon × 14.28 • mS/m = mg/L × 0.18 Figure 1.3 provides a “ready reckoner” for converting some of the commonly used salinity measurements. For further details on how to collect water samples and interpret of water salinity measurements see George et al. (1996).

1: About this manual
-12-
Figure 1.3: Salinity measurement conversions For soil samples: For most soil samples analysed in the laboratory, the 1:5 soil suspension method (EC1:5) is used. This method is preferred over the soil extract method (ECe) because EC1:5 is easier and cheaper to measure. However, ECe more closely replicates field conditions and is often quoted in the international literature. George and Wren (1985) demonstrated that for soils in the agricultural areas of Western Australia, EC1:5 = (ECe × SP) ÷ 364 where SP is the saturation percentage, which varies according to soil texture. They used the following formulae to convert soil extract EC to 1:5 soil suspension EC: • EC1:5 = (ECe × 25) ÷ 364 if soil texture ranges from sand to sandy loam • EC1:5 = (ECe × 32) ÷ 364 if soil texture ranges from sandy loam to sandy clay loam • EC1:5 = (ECe × 45) ÷ 364 if soil texture ranges from sandy clay to heavy clay Agriculture Western Australia and the Government Chemistry Centre usually use milliSiemens per metre (mS/m) for soil salinity measurements. However, CSBP presents soil salinity results in deciSiemens per metre. These two units are easily converted: • dS/m = mS/m × 0.01 • mS/m = dS/m × 100 Laboratory measurement of soil salinity are sometimes presented as a percentage of sodium chloride (%NaCl). McArthur (1991) showed that for soils in the south-west of Western Australia, %NaCl can be converted into EC1:5 (measured in mS/m) by the following formula: • EC1:5=(%NaCl + 0.024) ÷ 0.0023 (where EC1:5 is measures in mS/m). Bennett et al. (1995) describe the correct operating, surveying and calibration of the EM38v electromagnetic induction meter. Calibrations between actual and measured salinity levels indicate that the EM38 is able to predict the root-zone salinity with 90% accuracy under Western Australian conditions. EC1:5 can be estimated from the measured ECa values using the formula: • EC1:5 = (0.42 × ECa) - 1.74
i.e. multiply machine reading by 0.42 and subtract 1.74 to estimate 1:5 soil suspension EC. For further details on collecting soil samples and interpreting soil salinity measurements see Peverill et al. (1999).
1: About this manual
-13-
1.5 REFERENCES
Bennett, D.L., George, R.J. and Ryder, A. (1995). Soil salinity assessment using the EM38: Field operating instructions and data interpretation. Western Australian Department of Agriculture, Miscellaneous Publication No. 4/95.
Bettenay, E. and Mulcahy, M.J. (1972). Soil and landscape studies in Western Australia. (2). Valley form and surface features in the South-west Drainage Division. Journal of the Geological Society of Australia 18: 359-369.
George, P.R. and Wren, B.A. (1985). Crop tolerance to soil salinity. Western Australian Department of Agriculture, Technote No. 6/85.
George, R.J., Weaver, D. and Terry, J. (1996). Environmental water quality - a guide to sampling and measurement. Agriculture Western Australia, Miscellaneous Publication No. 16/96.
McArthur, W.M. (1991). ‘Reference soils of south-western Australia’. Australian Society of Soil Science Inc. (Western Australian Branch). pp. 19-21.
Mulcahy, M.J. (1967). Landscapes, laterites and soils in south-western Australia. In: ‘Landform studies in Australia and New Guinea’. (eds J.N. Jennings and J.A. Mabbutt), Australian National University Press, Canberra.
Peverill, K.I., Sparrow, L.A. and Reuter, D.J. (editors) (1999). ‘Soil analysis, an interpretation manual’. CSIRO and the Australian Soil and Plant Analysis Council, Melbourne.
Schofield, N.J., Ruprecht, J.K. and Loh, I.C. (1988). The impact of agricultural development on the salinity of surface water resources of south-west Western Australia. Surface Water Branch Report No. WS27, Water Authority of Western Australia.
US Salinity Laboratory Staff (1954). ‘Diagnosis and improvement of saline and alkaline soils’. (ed. L.A. Richards). United States Department of Agriculture Handbook No. 60.
2: The region’s environment
-14-
2. THE ENVIRONMENT OF THE SOUTH-WEST HYDROLOGICAL REGION
2.1 CLIMATE
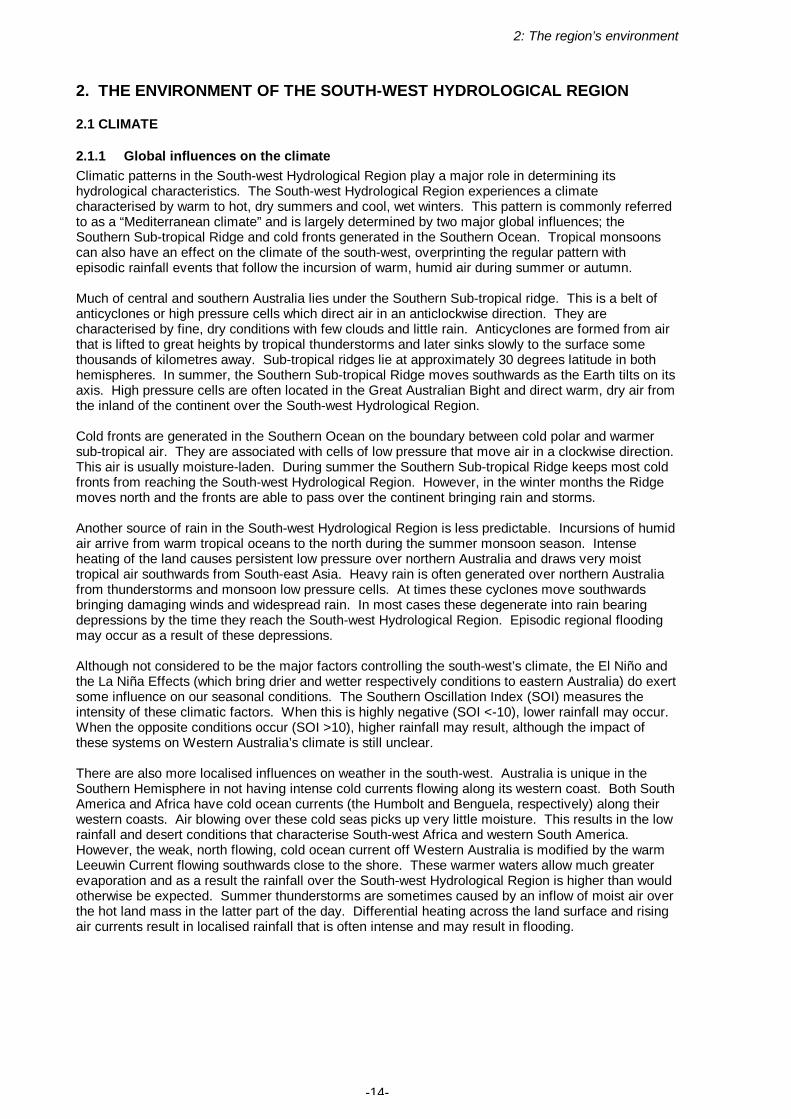
2.1.1 Global influences on the climate Climatic patterns in the South-west Hydrological Region play a major role in determining its hydrological characteristics. The South-west Hydrological Region experiences a climate characterised by warm to hot, dry summers and cool, wet winters. This pattern is commonly referred to as a “Mediterranean climate” and is largely determined by two major global influences; the Southern Sub-tropical Ridge and cold fronts generated in the Southern Ocean. Tropical monsoons can also have an effect on the climate of the south-west, overprinting the regular pattern with episodic rainfall events that follow the incursion of warm, humid air during summer or autumn. Much of central and southern Australia lies under the Southern Sub-tropical ridge. This is a belt of anticyclones or high pressure cells which direct air in an anticlockwise direction. They are characterised by fine, dry conditions with few clouds and little rain. Anticyclones are formed from air that is lifted to great heights by tropical thunderstorms and later sinks slowly to the surface some thousands of kilometres away. Sub-tropical ridges lie at approximately 30 degrees latitude in both hemispheres. In summer, the Southern Sub-tropical Ridge moves southwards as the Earth tilts on its axis. High pressure cells are often located in the Great Australian Bight and direct warm, dry air from the inland of the continent over the South-west Hydrological Region. Cold fronts are generated in the Southern Ocean on the boundary between cold polar and warmer sub-tropical air. They are associated with cells of low pressure that move air in a clockwise direction. This air is usually moisture-laden. During summer the Southern Sub-tropical Ridge keeps most cold fronts from reaching the South-west Hydrological Region. However, in the winter months the Ridge moves north and the fronts are able to pass over the continent bringing rain and storms. Another source of rain in the South-west Hydrological Region is less predictable. Incursions of humid air arrive from warm tropical oceans to the north during the summer monsoon season. Intense heating of the land causes persistent low pressure over northern Australia and draws very moist tropical air southwards from South-east Asia. Heavy rain is often generated over northern Australia from thunderstorms and monsoon low pressure cells. At times these cyclones move southwards bringing damaging winds and widespread rain. In most cases these degenerate into rain bearing depressions by the time they reach the South-west Hydrological Region. Episodic regional flooding may occur as a result of these depressions. Although not considered to be the major factors controlling the south-west’s climate, the El Niño and the La Niña Effects (which bring drier and wetter respectively conditions to eastern Australia) do exert some influence on our seasonal conditions. The Southern Oscillation Index (SOI) measures the intensity of these climatic factors. When this is highly negative (SOI <-10), lower rainfall may occur. When the opposite conditions occur (SOI >10), higher rainfall may result, although the impact of these systems on Western Australia’s climate is still unclear. There are also more localised influences on weather in the south-west. Australia is unique in the Southern Hemisphere in not having intense cold currents flowing along its western coast. Both South America and Africa have cold ocean currents (the Humbolt and Benguela, respectively) along their western coasts. Air blowing over these cold seas picks up very little moisture. This results in the low rainfall and desert conditions that characterise South-west Africa and western South America. However, the weak, north flowing, cold ocean current off Western Australia is modified by the warm Leeuwin Current flowing southwards close to the shore. These warmer waters allow much greater evaporation and as a result the rainfall over the South-west Hydrological Region is higher than would otherwise be expected. Summer thunderstorms are sometimes caused by an inflow of moist air over the hot land mass in the latter part of the day. Differential heating across the land surface and rising air currents result in localised rainfall that is often intense and may result in flooding.

2: The region’s environment
-15-
The other localised weather pattern commonly experienced during summer is caused by the differential heating of the sea and land. During the day the land mass heats up faster than the sea. By about midday the cool air begins to move in from the ocean to replace the hot air rising over the land. This creates the sea breezes that moderate temperatures. These have their greatest impact within 80-90 km of the coast, but the cooling influence often extends much further inland. In the evening, the land mass cools, the sea breeze stops, and air movement returns to the prevailing direction, usually from the east. These easterly winds are often quite warm, especially to the north of the South-west Hydrological Region, and can have a significant drying effect. Turbulent conditions often result as the easterlies cross the Darling Scarp, resulting in localised, high speed winds. 2.1.2 Rainfall Average annual rainfall ranges from almost 1,400 mm at Northcliffe to about 400 mm at Dumbleyung and Nyabing (Figure 2.1). Between 65% and 80% of the Region’s annual rain falls between May and September, while only 10-20% falls between November and March (Table 2.1). Although the rainfall patterns throughout the South-west Hydrological Region are strongly seasonal, they are generally reliable and rarely vary by more than 20% from the annual mean. This high degree of reliability is attributed partly to the frequency of winter cold fronts and partly due to the effects of the Leeuwin Current. The Forested Hills are the best watered part of the South-west Hydrological Region, receiving between 800 and 1,400 mm per annum. This is due to a combination of the relative proximity to the ocean and the orographic effects of warm, moist air being lifted above the hills and condensing. The highest falls occur within 50 km of the coast. Over 1,100 mm is received along the western Darling Range between Jarrahdale and Collie, when air from the Indian Ocean is suddenly forced up some 100-200 m by the Darling Scarp. Similar rainfalls are experienced between Margaret River and Augusta where air directly off the Indian Ocean is forced up 150-200 m by the Gracetown Ridge. The highest falls are experienced in the south of the Forested Hills. Between Northcliffe and Walpole the rainfall exceeds 1,300 mm. Here, air off the Southern Ocean rises 100-200 m. The rise may be more gradual than elsewhere, but being further south this area receives fronts that miss other areas. This area also receives about 200 mm of summer rain (14-18% of the total) falling between November and March. Most of this rain is brought by onshore southerly winds generated by cold fronts moving to the south of the continent. Elsewhere in the Forested Hills, rainfall is mostly above 800 mm, with summer rain in the range of 100-140 mm (8-14% of the annual total). From the Forested Hills rainfall decreases gradually inland, dropping from 750 to 550 mm per annum in the Western Woolbelt and from 500 to 450 mm in the Eastern Woolbelt. Furthest inland, the Wheatbelt receives between 450 and 400 mm. The highest rainfall in summer is received in the south of both Woolbelts which are sometimes influenced by the passage of cold fronts during this period. Here, 90-125 mm (15-20% of the annual total) falls between November and March. From Kojonup and Boyup Brook, summer rainfall gradually decreases from just under 90 mm to about 75 mm at Darkan and Wagin. Further north it increases again to approximately 80 mm at Wandering and Cuballing where the influence of summer thunderstorms is greater. In the Wheatbelt, 85-90 mm are received between November and March. This comprises about 20% of the average annual rainfall and once again humid air drawn down from the north is a significant component. Despite their proximity to the ocean, the Coastal Plains receive less rain than adjoining areas in the Forested Hills due to their flat terrain. The Swan Coastal Plain receives 850-1,000 mm while the Scott Coastal Plain receives 1,100-1,300 mm each year. Rainfall around Busselton is lower than in other areas of the Swan Coastal Plain due to the influence of Cape Naturaliste, which creates a moderate rain shadow ridge. On the Swan Coastal Plain, 75-100 mm of rain is received in summer, about 10% of the annual total. The Scott Coastal Plain receives over 200 mm, or up to 20% of the average annual rainfall, between November and March.

2: The region’s environment
-16-
Figure 2.1: Average annual rainfall in the South-west Hydrological Region (from Clewett et al. 1997)

2: The region’s environment
-17-
Table 2.1: Average monthly rainfall (mm) in the South-west Hydrological Region COASTAL PLAIN (Swan)
JAN FEB MAR APR MAY JUN JUL AUG SEP OCT NOV DEC TOTAL NOV to MAR
Brunswick 12 15 23 51 143 209 198 147 99 64 32 15 1009 97 10% Bunbury 11 12 22 45 126 178 168 121 79 52 26 13 853 84 10% Busselton 9 11 21 42 118 176 167 117 75 52 24 13 826 78 9% Harvey (Yarloop) 13 15 21 51 146 208 197 150 100 67 31 15 1014 95 9% Mandurah Park 9 13 19 44 126 190 176 126 88 51 23 12 879 76 9% Medina* 1 21 19 46 119 181 165 132 72 28 45 14 843 100 12% Pinjarra 10 14 19 49 134 199 186 145 92 61 27 14 951 84 9% Waroona 13 17 24 56 149 216 207 157 100 68 33 15 1053 102 10% FORESTED HILLS JAN FEB MAR APR MAY JUN JUL AUG SEP OCT NOV DEC TOTAL NOV to
MAR Bridgetown 14 15 26 46 111 149 149 122 88 64 32 19 836 106 13% Cape Leeuwin 17 17 29 62 144 185 187 139 92 68 37 22 1,000 122 12% Cape Naturaliste 11 12 23 46 118 174 164 112 75 53 26 14 826 86 10% Collie 15 16 24 49 129 183 183 141 99 67 32 16 953 103 11% Denmark 28 28 47 78 136 156 174 148 116 100 52 35 1101 190 17% Donnybrook 12 16 25 50 137 198 191 146 101 67 33 16 993 102 10% Dwellingup 15 25 26 69 163 255 246 194 126 83 47 21 1272 134 11% Greenbushes 15 17 27 51 127 170 171 141 100 72 36 19 947 114 12% Jarrahdale 12 16 24 61 162 235 232 186 126 84 34 19 1193 105 9% Manjimup 20 20 30 62 135 171 180 148 108 79 48 25 1025 143 14% Margaret River 15 16 29 64 163 222 222 156 104 75 39 20 1127 119 11% Nannup 14 15 25 53 127 174 177 141 98 74 38 21 955 113 12% Northcliffe 24 23 41 93 177 222 240 193 140 104 64 35 1358 187 14% Pemberton 21 20 35 75 156 195 217 168 121 94 61 35 1202 172 14% Walpole (Nornalup) 30 30 47 87 162 185 202 170 128 98 59 37 1236 203 16% Windy Harbour* 11 15 39 75 149 142 173 168 84 71 61 35 1023 161 16% WESTERN WOOLBELT
JAN FEB MAR APR MAY JUN JUL AUG SEP OCT NOV DEC TOTAL NOV to MAR
Boyup Brook 13 17 21 38 88 122 120 95 64 46 27 13 665 91 14% Darkan 11 15 17 31 74 104 102 81 54 38 20 10 559 73 13% Boddington 12 17 18 38 89 135 130 97 60 41 19 10 666 76 11% Frankland (Wonnenup)
14 16 20 34 64 83 85 66 50 39 26 14 512 90 18%
Marradong 11 17 18 39 100 145 143 109 71 48 23 12 739 81 11% Rocky Gully* 18 20 25 50 92 106 114 92 72 61 43 20 713 126 18% Wandering 10 15 20 34 79 116 115 92 61 43 19 14 619 78 13% EASTERN WOOLBELT
JAN FEB MAR APR MAY JUN JUL AUG SEP OCT NOV DEC TOTAL NOV to MAR
Arthur River 11 17 20 29 61 86 81 65 46 34 18 12 482 78 16% Broome Hill 13 17 22 29 56 71 70 57 47 36 21 14 452 87 19% Cranbrook 15 17 23 33 60 73 77 65 52 45 27 17 504 99 20% Katanning 13 17 22 30 61 79 77 63 47 36 21 16 484 89 18% Kojonup 13 15 22 32 68 90 89 74 53 41 23 15 535 88 16% Narrogin 11 17 21 30 65 90 89 68 47 33 18 13 504 80 16% Tambellup 17 17 20 33 56 65 70 56 46 39 25 16 459 95 21% Wagin 11 17 20 29 56 76 73 57 41 30 17 12 439 77 18% Williams 10 17 18 32 71 101 98 78 51 35 20 13 544 78 14% Woodanilling 11 17 18 29 62 81 74 61 43 31 22 13 463 81 18% WHEATBELT JAN FEB MAR APR MAY JUN JUL AUG SEP OCT NOV DEC TOTAL NOV to
MAR Dumbleyung 13 19 20 29 49 61 60 48 35 28 20 14 397 86 22% Kukerin 14 19 20 27 52 64 60 51 36 28 20 14 406 87 21% Nyabing 13 19 19 26 52 52 64 62 49 36 28 14 403 93 21% Adapted from: Clewett et al. (1997) *Data from Bureau of Meteorology (1962 and 1965)
2: The region’s environment
-18-
2.1.3 Evaporation and growing seasons Average annual pan evaporation gradually increases from the south-west to the north-east and ranges from about 1,000 mm, between Cape Naturaliste and Windy Harbour, to about 1,900 mm per year at Kukerin (Figure 2.2). Apart from a small area (from Walpole through Augusta to Margaret River), annual pan evaporation is considerably higher than rainfall throughout the South-west Hydrological Region. In most areas, it is only between May and August that there is a net accumulation of water when more water falls as rain than evaporates. The length of the growing season is determined by the balance between rainfall and evaporation. This is the period when enough rain falls to infiltrate the soils and maintain plant growth. The longest growing season is experienced from Pemberton through Northcliffe to Denmark where it lasts nine months or more, beginning in March. From Augusta through Manjimup to Rocky Gully it is about eight months, beginning late March or early April. In the remainder of the Forested Hills to the north, the growing season lasts 7-8 months, beginning in April. The Western Woolbelt south of Boyup Brook experiences a similar growing season. The north of the Western Woolbelt and Eastern Woolbelt south of Arthur River and Woodanilling have 6-7 months of growing season, beginning mid April. In the north of the Eastern Woolbelt and in the Wheatbelt the growing season lasts from 5-6 months, beginning late April. 2.1.4 Temperatures Temperatures are mild in the south-west and become more extreme in the north-east. Latitude plays a role in determining temperature, but the influence of the oceans are even more important. In summer, high pressure cells bring hot and dry easterly winds from the interior of the continent. While the temperature gradient increases towards the north in summer, it also increases with distance from the coast. Cooling sea breezes, called the "Fremantle Doctor” on the west coast and the "Albany Doctor" on the south coast, usually prevent temperatures rising too high during the day in coastal areas. On some days they only affect the immediate coastal strip, but when stronger they can penetrate more than 100 km inland. Weak cold fronts sometimes also cool temperatures on the south coast during summer. Mean maximum temperatures in the hottest month (usually February) range from 26OC on the coast between Augusta and Walpole to 32OC at Pingelly and Wickepin. The average period with daily maximum temperatures in excess of 32OC ranges from 10 days, in the south and south-west, to about 45 days in the north-east. The lowest mean minimum temperatures in the coldest month (usually July) are experienced in the Western Woolbelt, between Wandering and Boyup Brook, where they are about 4OC. In the south of the Western Woolbelt, and in the Eastern Woolbelt and Wheatbelt they rise slightly, to 5-6OC. Moving through the Forested Hills towards the coast, temperatures rise rapidly due to the moderating influences of the ocean. Minimum temperatures are approximately 8OC from Mandurah through Bunbury and down to the South Coast. Minima are even higher in the Margaret River area, which is surrounded by oceans on three sides, rising up to 11OC near Augusta. When recorded temperatures drop below 2.2OC, ground temperatures usually reach the frost point, though there is a big variation in temperature and frost incidence from site to site. There is an average of up to 60 days a year when temperatures fall to near frost point in Wandering, which often records the lowest temperatures in the state. Along the south and west coasts temperatures below 2.2OC are recorded on fewer than 5 days a year on average. Frosts are most frequent east of the Darling Scarp, especially where cold air is trapped in valley floors and depressions. 2.1.5 Climate change in the South-west Hydrological Region. Climatic patterns in the South-west Hydrological Region have varied markedly over the ages. It is believed that, across southern Australia, the climate was about 10OC warmer during the Miocene and that rainfall was high and consistent throughout the year (Bowler, 1982). Some 5-6 million years ago there was a change to intense winter aridity. The last 2 million years have seen some violent fluctuations in climate, with the development of 17 separate “ice ages” when temperatures fell and cold and dry winds swept across the continent initiating the processes of aridity. At least two of these periods resulted in the spread of ice sheets across south-eastern Australia. Following these “ice ages”, the continent returned to warmer and more humid periods. In response to these cycles, eucalypts and acacias out competed the broad-leaved deciduous rainforest plants. A strongly seasonal winter rainfall pattern is believed to have developed about 700,000 years ago (Bowler, 1982). The last “ice age” commenced about 25,000

2: The region’s environment
-19-
years ago and saw widespread desertification across Australia. About 15,000 years ago the ice caps began to melt and our current climate had taken shape about 9,000 years ago. In more recent times, historic records show both long and short-term cycles. In the south-west, rainfall has fallen since the 1950s, while mean summer temperatures have increased slightly. These changes have not been consistent throughout the Region. Table 2.2 shows the change in the average annual rainfall calculated from data available in 1965 to that calculated in 1997 for the locations shown in Table 2.1. While rainfall has decreased for most towns, approximately a quarter have recorded increased rainfall (including Cape Leeuwin in the far west and Nyabing in the far east).
Figure 2.2: Average annual pan evaporation in the South-west Hydrological Region (from
Luke et al. 1988) Figure 2.3 shows the residual monthly rainfall mass for the town of Williams which lies on the boundary between the Eastern and Western Woolbelts. The residual monthly rainfall mass is a cumulative sum of the difference (residual value) between the rainfall received each month and the long-term average for that month. Over the past century (1885-1996), annual rainfall in Williams has ranged from as low as 292 mm in 1940 to as high as 960 mm in 1955, with at least three major cycles of increasing and decreasing rainfall. In the first cycle, rainfall increased between 1885 and 1895 and then tended to decrease over the following 20 years. The second cycle occurred between 1915 and 1946. The third cycle was characterised by generally above average rainfall from 1946 to 1965, average rainfall from 1965 to1978 and a below average rainfall from 1978 until 1995.

2: The region’s environment
-20-
Table 2.2: Change in average annual rainfall calculated in 1997in comparison with 1965 data Location Rainfall change Location Rainfall change (mm) (%) (mm) (mm) (%) Walpole -108 -8.7% Tambellup -2 -0.4% Margaret River -29 -2.6% Arthur River -2 -0.4% Bunbury -18 -2.1% Williams -2 -0.4% Nannup -13 -1.4% Bridgetown -3 -0.4% Northcliffe -18 -1.3% Cape Naturaliste -2 -0.2% Darkan -6 -1.1% Greenbushes -2 -0.2% Manjimup -11 -1.1% Narrogin -1 -0.2% Kukerin -4 -1.0% Dwellingup -2 -0.2% Boyup Brook -5 -0.8% Cranbrook 0 0.0% Donnybrook -7 -0.7% Marradong +1 +0.1% Wandering -4 -0.6% Collie +3 +0.3% Brunswick -6 -0.6% Jarrahdale +4 +0.3% Kojonup -3 -0.6% Harvey +4 +0.4% Denmark -6 -0.5% Katanning +2 +0.4% Pinjarra -5 -0.5% Busselton +4 +0.5% Dumbleyung -2 -0.5% Nyabing +3 +0.7% Pemberton -6 -0.5% Cape Leeuwin +10 +1.0% Wagin -2 -0.5% Waroona +19 +1.8% Broome Hill -2 -0.4% Woodanilling +15 +3.2% Data sources: Bureau of Meteorology (1965) and Clewett et al. (1997)
-600
-400
-200
0
200
400
600
800
1000
1200
1885 1895 1905 1915 1925 1935 1945 1955 1965 1975 1985 1995
YEAR
RES
IDU
AL
VALU
E (m
m)
Figure 2.3: Residual monthly rainfall mass for Williams between 1885 and 1996 (from
Smith et al. 1998a). Figure 2.4 shows the residual monthly rainfall mass for the town of Frankland in the south of the Western Woolbelt. This shows only one major cycle between 1928 and 1996, with above average rainfall being recorded between 1934 and 1948, followed by well below average rainfall in the early 1950s. More stable, but generally below average, rainfall patterns were experienced from 1955 to the present. Minor cycles have seen small increases in rainfall during 1955-1958, 1965-1970 and 1988. Below average rainfall periods occurred in 1958-1960, 1972-1973, 1982, 1986-1988 and 1994-1995.
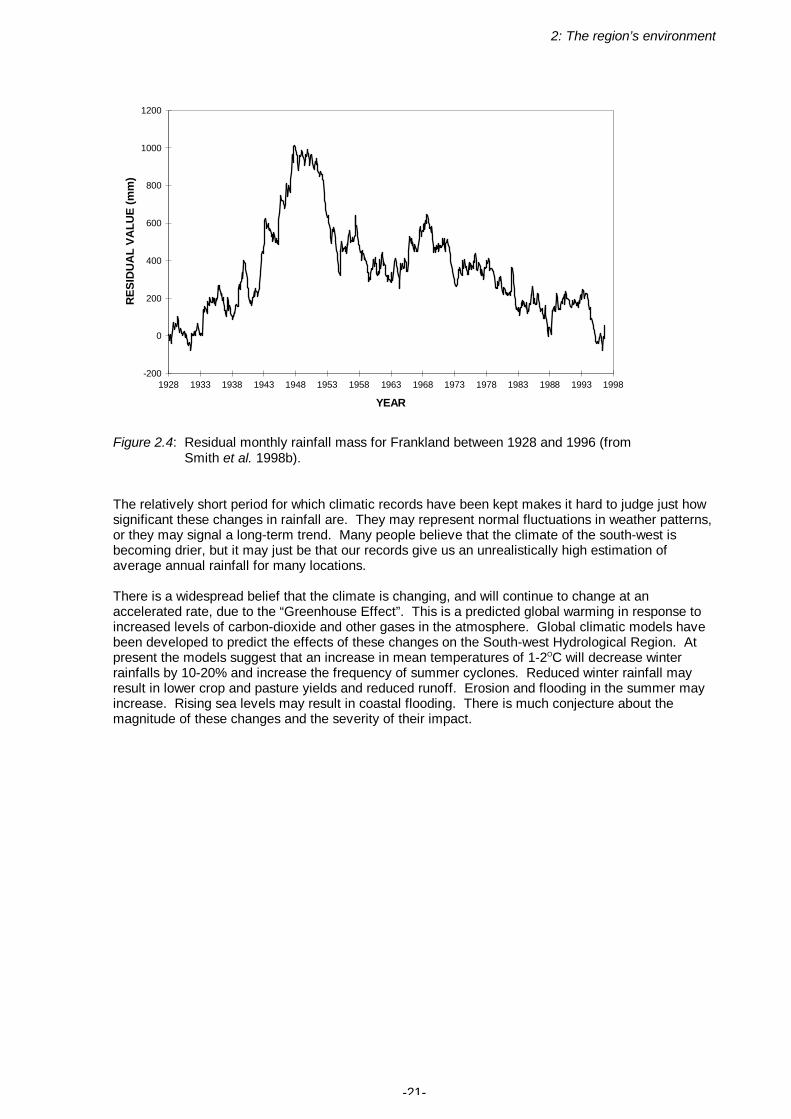
2: The region’s environment
-21-
-200
0
200
400
600
800
1000
1200
1928 1933 1938 1943 1948 1953 1958 1963 1968 1973 1978 1983 1988 1993 1998
YEAR
RES
IDU
AL
VALU
E (m
m)
Figure 2.4: Residual monthly rainfall mass for Frankland between 1928 and 1996 (from
Smith et al. 1998b). The relatively short period for which climatic records have been kept makes it hard to judge just how significant these changes in rainfall are. They may represent normal fluctuations in weather patterns, or they may signal a long-term trend. Many people believe that the climate of the south-west is becoming drier, but it may just be that our records give us an unrealistically high estimation of average annual rainfall for many locations. There is a widespread belief that the climate is changing, and will continue to change at an accelerated rate, due to the “Greenhouse Effect”. This is a predicted global warming in response to increased levels of carbon-dioxide and other gases in the atmosphere. Global climatic models have been developed to predict the effects of these changes on the South-west Hydrological Region. At present the models suggest that an increase in mean temperatures of 1-2OC will decrease winter rainfalls by 10-20% and increase the frequency of summer cyclones. Reduced winter rainfall may result in lower crop and pasture yields and reduced runoff. Erosion and flooding in the summer may increase. Rising sea levels may result in coastal flooding. There is much conjecture about the magnitude of these changes and the severity of their impact.

2: The region’s environment
-22-
2.2 GEOLOGY
The South-west Hydrological Region can be divided into five broad geological areas. These are the Yilgarn Craton, Albany-Fraser Orogen, Perth Basin, Collie Basin and Leeuwin Complex (Geological Survey of Western Australia, 1990). These areas are shown in Figure 2.5 and Table 2.3 provides a summary of the geological history.
Figure 2.5: Major geological units of the South-west Hydrological Region (from Geological Survey of
Western Australia 1990)

2: The region’s environment
-23-
Table 2.3: Geological history of the South-west Hydrological Region
PERIOD EON ERA Epoch
Millions of years before
present
GEOLOGICAL EVENTS IN THE SOUTH-WEST
Quater- Holocene <0.01 Tamala Limestone
nary Pleistocene 0.01-1.8 Guildford Formation (Perth Basin)
Cainozoic Pliocene 1.8-5.0 Yoganup Formation (Perth Basin)
Miocene 5.0-23.5 Continuing laterite formation
Tertiary Oligocene 23.5-37.0 Continuing laterite formation
Eocene
37-58
Sea level rises Formation of laterite begins Eocene sedimentary deposits
Palaeocene 58-66
66-95 Nakina Formation (Collie Basin) Australia and Antarctica separate
Phanero- zoic
Cretaceous 95-131 Leederville Formation (Perth Basin) Donnybrook Sandstone Bunbury Basalt (Perth Basin)
Mesozoic Jurassic 131-178 Gondwanaland begins to break up Yarragadee Formation (Perth Basin)
178-204 Cockleshell Gully Formation (Perth Basin)
Triassic 204-250 Major uplift along Darling Fault Lesueur Sandstone (Perth Basin)
Permian 250-295 Collie Coal Measures and Stockton Formation (Collie, Wilga and Boyup Basins) Sue Coal Measures (Perth Basin)
Carboniferous 295-354
Palaeozoic Devonian 354-410
Silurian 410-434 Uplift along Darling Fault begins
Ordovician 434-505
Cambrian 505-580
Neopro-
Neoproterozoic III 580-650 Boyagin dyke swarm (Yilgarn Craton) Kojonup Fault (Yilgarn Craton)
terozoic Cryogenian 650-850
Tonian 850-1,000
Stenian 1,000-1,200
Nornalup complex (Albany-Fraser Orogen) Leeuwin Complex (Pinjarra Orogen) Biranup Complex (Albany-Fraser Orogen)
Proterozoic Mesopro- terozoic
Ectasian 1,200-1,400
Formation of Albany Fraser Orogen begins Gnowangerup dyke swarm (Yilgarn Craton)
Calymmian 1,400-1,600
Statherian 1,600-1,800
Palaeopro-terozoic
Orosirian 1,800-2,050
Rhyacian 2,050-2,300
Sideran 2,300-2,500
Widgiemooltha dyke swarm (Yilgarn Craton) Formation of Darling Fault
2,500-2,650
Yilgarn Craton granite and metagranite (underlying Woolbelts)
Archaean 2,650-2,750
Yilgarn Craton metagranite (underlying Wellington Dam-Boyup Brook)
2,750-2,900
Yilgarn Craton gneiss (underlying Wheatbelt)
2,900+ Balingup Gneiss Complex (Yilgarn Craton) Source data: Geological Survey of Western Australia (1990)

2: The region’s environment
-24-
2.2.1 Yilgarn Craton The Yilgarn Craton is the central building block of the south of Western Australia. A craton is a part of the Earth's crust that has stabilised and has not been altered significantly for a long period (Bates and Jackson, 1987). The Yilgarn Craton is a Precambrian Shield and is one of the oldest portions of the Earth’s surface. It underlies over 60% of the South-west Hydrological Region, including all of the Wheatbelt and Eastern Woolbelt, almost all of the Western Woolbelt and a large area of the Forested Hills. The western boundary of the Yilgarn Craton is the Darling Fault which passes close to Byford, Harvey, Donnybrook and Nannup. This fault is one of the largest lineaments on the Earth’s surface being 1,000 km long with a current topographical expression of up to 200 m (Middleton et al., 1995). Vertical displacement of up to 15 km has occurred along the fault (Myers, 1990c). The South-west Hydrological Region lies in a portion of the Yilgarn Craton known as the Western Gneiss Terrane which is comprised of a variety of crystalline rocks. The oldest of these lie in the Balingup Gneiss Complex which is over 3.1 billion years old (Myers, 1990a) and stretches southwards from Harvey along the Darling Scarp beyond Nannup and then west towards Bridgetown and Manjimup (Figure 2.5). It is dominated by metasedimentary rocks, including gneiss, quartzite, schist and amphibolite. To the west of this lies a belt of metagranite about 2.7 billion years old, stretching southwards from Wellington Dam beyond Boyup Brook. Most of both Woolbelts is underlain by granite and metagranite that is approximately 2.6 billion years old (Table 2.3). Underlying the Wheatbelt are granites and gneiss that are approximately 2.4-2.8 billion years old (Table 2.3). The rocks of the Yilgarn Craton contain numerous faults and shear zones. Some, like the Kojonup Fault which is two kilometres wide and over 200 km long, are major features. Others are much smaller and localised. The Yilgarn Craton is also cut by a large number of dykes. The dykes are long, thin intrusions of basic rocks, most commonly dolerite. Most dykes are 2-20 m wide but may be in excess of ten kilometres long (and occasionally up to 500 km long). Quartz veins are also present in places. There are some extensive sedimentary deposits overlying the crystalline rocks of the Yilgarn Craton. The most prominent of these are the Collie, Wilga and Boyup Basins, which are dealt with below. Elsewhere there are localised occurrences of Donnybrook Sandstone, Kirup Conglomerate and Kojonup Sandstone that may be up to 30 m thick. There are also widespread deposits of Eocene sediments; the most extensive are found between Collie and Harvey, Wilga and Moodiarrup, Manjimup and Yornup, Dinninup and Qualeup. As a result of the long history of stability, much of the Craton was subjected to deep weathering during the Cainozoic. This weathering has resulted in the formation of a 2-50 m deep regolith which blankets the Craton and is often associated with the development of the lateritic profile (see Box 2.1). The crystalline rocks of the Yilgarn Craton have a low permeability to water. In most cases they form a major barrier to the movement of water, although faults, shear zones, localised fractures and quartz veins form limited pathways for the lateral movement of water. The mantle of regolith has quite different hydrological properties to the underlying crystalline bedrock. While permeability in the upper levels of the lateritic profile is often low, pathways for the movement of water often exist in the form of old tree root channels and relic bedrock structures. Deep in the profile there is usually a zone containing poorly weathered minerals (gritty sands referred to as saprock) which often has a higher permeability. This is a major zone for the movement and storage of groundwaters. Dolerite dykes may form barriers to water movement through the saprock, but in other situations they may be transmissive, with water flowing along fractures or along the contact with the surrounding material. 2.2.2 Collie, Wilga and Boyup Basins Three sedimentary basins, called the Collie, Wilga and Boyup Basins, exist on the western margin of the Yilgarn Craton. The Basins are contained in troughs formed by subsidence of the Yilgarn Craton between fault lines (Wilson, 1990). The sequences of sediments contained within the Basins date from the Permian and Cretaceous and range between 300 m thick (Wilga and Boyup Brook Basins) to over 1,000 m thick (Collie Basin). The rocks of the basins include sandstone, shale, siltstone and coal. In places these are overlain by surficial deposits of sand. There has also been extensive lateritic development on the near-surface sediments. Some of these sediments are moderately permeable and the Basins contain considerable groundwater resources.
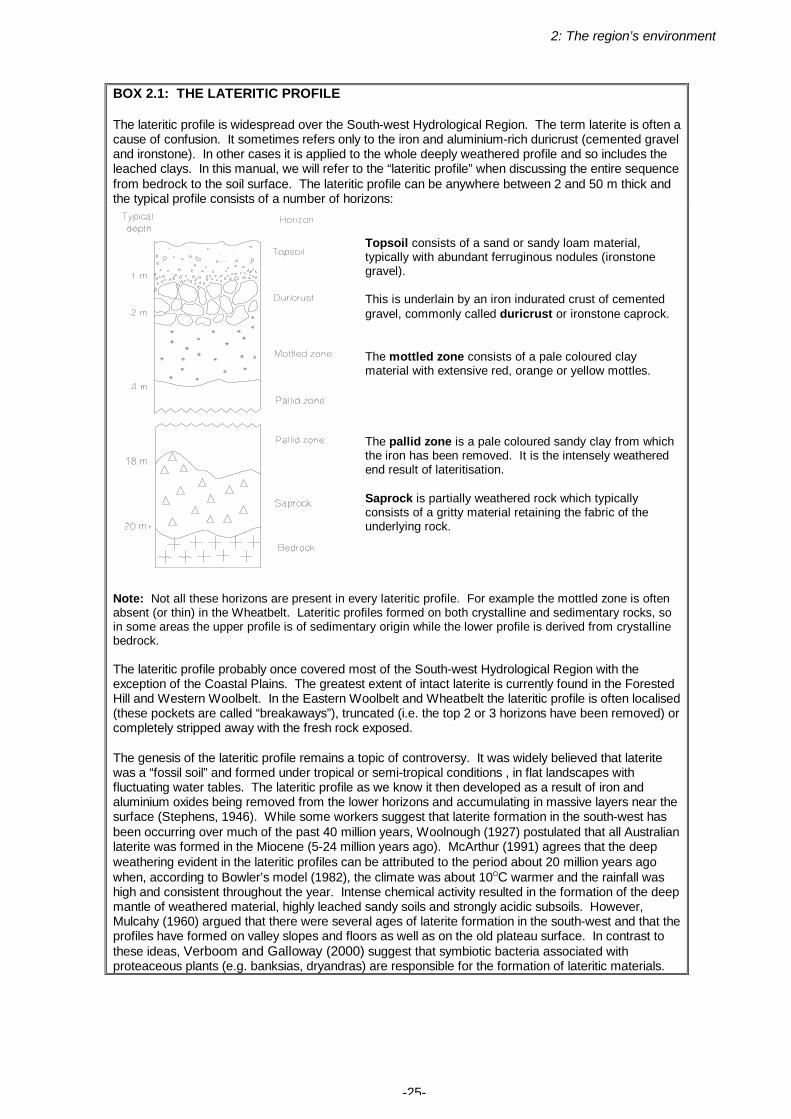
2: The region’s environment
-25-
BOX 2.1: THE LATERITIC PROFILE
The lateritic profile is widespread over the South-west Hydrological Region. The term laterite is often a cause of confusion. It sometimes refers only to the iron and aluminium-rich duricrust (cemented gravel and ironstone). In other cases it is applied to the whole deeply weathered profile and so includes the leached clays. In this manual, we will refer to the “lateritic profile” when discussing the entire sequence from bedrock to the soil surface. The lateritic profile can be anywhere between 2 and 50 m thick and the typical profile consists of a number of horizons:
Topsoil consists of a sand or sandy loam material, typically with abundant ferruginous nodules (ironstone gravel). This is underlain by an iron indurated crust of cemented gravel, commonly called duricrust or ironstone caprock. The mottled zone consists of a pale coloured clay material with extensive red, orange or yellow mottles. The pallid zone is a pale coloured sandy clay from which the iron has been removed. It is the intensely weathered end result of lateritisation. Saprock is partially weathered rock which typically consists of a gritty material retaining the fabric of the underlying rock.
Note: Not all these horizons are present in every lateritic profile. For example the mottled zone is often absent (or thin) in the Wheatbelt. Lateritic profiles formed on both crystalline and sedimentary rocks, so in some areas the upper profile is of sedimentary origin while the lower profile is derived from crystalline bedrock. The lateritic profile probably once covered most of the South-west Hydrological Region with the exception of the Coastal Plains. The greatest extent of intact laterite is currently found in the Forested Hill and Western Woolbelt. In the Eastern Woolbelt and Wheatbelt the lateritic profile is often localised (these pockets are called “breakaways”), truncated (i.e. the top 2 or 3 horizons have been removed) or completely stripped away with the fresh rock exposed. The genesis of the lateritic profile remains a topic of controversy. It was widely believed that laterite was a “fossil soil” and formed under tropical or semi-tropical conditions , in flat landscapes with fluctuating water tables. The lateritic profile as we know it then developed as a result of iron and aluminium oxides being removed from the lower horizons and accumulating in massive layers near the surface (Stephens, 1946). While some workers suggest that laterite formation in the south-west has been occurring over much of the past 40 million years, Woolnough (1927) postulated that all Australian laterite was formed in the Miocene (5-24 million years ago). McArthur (1991) agrees that the deep weathering evident in the lateritic profiles can be attributed to the period about 20 million years ago when, according to Bowler’s model (1982), the climate was about 10OC warmer and the rainfall was high and consistent throughout the year. Intense chemical activity resulted in the formation of the deep mantle of weathered material, highly leached sandy soils and strongly acidic subsoils. However, Mulcahy (1960) argued that there were several ages of laterite formation in the south-west and that the profiles have formed on valley slopes and floors as well as on the old plateau surface. In contrast to these ideas, Verboom and Galloway (2000) suggest that symbiotic bacteria associated with proteaceous plants (e.g. banksias, dryandras) are responsible for the formation of lateritic materials.

2: The region’s environment
-26-
2.2.3 Albany-Fraser Orogen The Albany-Fraser Orogen lies to the south of the Yilgarn Craton (Figure 2.5), stretching southwards from Manjimup and Frankland to the coast of the Southern Ocean. It underlies a significant portion of the southern Forested Hills and the southern margin of the Western Woolbelt. An orogen is a zone of weakness in the Earth's crust along which movement and deformation has taken place during a period of tectonic plate movement. The rocks of an orogen may include deformed and reworked parts of older cratons as well as new volcanic and sedimentary rocks (Trendall, 1990). The Albany Fraser Orogen is characterised by crystalline rocks, including high grade gneiss and granitic intrusions. From chemical dating undertaken on the rocks it is thought that the Orogen may have developed about 1.8 billion years ago, although the main activity in the Orogen appears to have occurred between 1.3 and 1.1 billion years ago (Myers, 1990b). In a belt along the northern and western boundaries of the Orogen lies the Biranup Complex. This is comprised mainly of gneiss inter-layered with small amounts of metasedimentary rocks, such as quartzite and metagabbro. Within the South-west Hydrological Region, the major portion of the Albany-Fraser Orogen is occupied by the Nornalup Complex, comprised of gneiss and granite. The Nornalup Complex lies to the south of the Biranup Complex, and is less strongly deformed. There are some sedimentary deposits overlying crystalline bedrock. These include Pallinup Siltstone to the east, broad tracts of sandy Tertiary alluvium around Lake Muir and estuarine deposits along the coast. Calcareous and non-calcareous sand dunes are also found along the coast; these sometimes contain aeolian limestone. Intact lateritic profiles are found to the north and east of the Orogen. Between Pemberton and Bow River, the laterite has been stripped extensively, and the deeply weathered profiles are usually poorly developed. 2.2.4 Leeuwin Complex The Leeuwin Complex is a narrow strip of land lying between Cape Naturaliste and Cape Leeuwin. It is a small area on the western edge of the Forested Hills. It forms part of the Pinjarra Orogen (Myers, 1990c), which lies to the west of the Yilgarn Craton and is mostly overlain by the Perth Basin or is underneath the ocean. The Leeuwin Complex is a “horst”, a block raised up along the Dunsborough Fault and is probably about 1.1 billion years old. It comprises a range of metamorphic rocks, including granite gneiss, porphyritic granite and anorthosite, that have been intensely deformed. Lateritic profiles are found over much of the Complex. A ridge of dunes of calcareous and non-calcareous sand underlain by Tamala limestone are found along the coast. 2.2.5 Perth Basin The Perth Basin overlies the Pinjarra Orogen to the west of the Yilgarn Craton. The Darling Fault forms its eastern boundary while in the west it extends to the edge of the continental shelf. The Basin is a deep linear trough of sedimentary rocks underlying the Coastal Plains and a portion of the Forested Hills (known as the Donnybrook Sunklands). The depth to the bedrock ranges from 2,000 m east of Augusta to about 9,000 m north of Mandurah (Cockbain, 1990). The Basin sediments vary from outwash derived from the Wheatbelt to marine sediments derived from incoming shallow seas. The Sue Coal Measures, which include sandstone, siltstone and coal lie near the bottom of the Basin. They are overlain by the Sabina and Lesueur Sandstones and above these lie the Cockleshell Gully and Yarragadee Formations containing sandstones, siltstones, shale, mudstones and coal. These deeper rocks are strongly faulted throughout the basin. They are overlain by Warnbro Group sediments which includes the South Perth Shale and the Leederville Formation (comprising of sandstone, shale, siltstone and claystone). Between Bunbury and the South Coast, the Bunbury Basalt lava flow is found between the Warnbro Group and Yarragadee Formation. In the Donnybrook Sunklands there has been an extensive development of the lateritic profile on Cretaceous sedimentary rocks. On the Coastal Plains these rocks are overlain by Tertiary and Quaternary sediments. There are extensive deposits of sand on the Scott Coastal Plain. On the Swan Coastal Plain there are calcareous sands on the coast, backed by estuarine deposits. Inland from these lie the Tamala Limestone and Bassendean Sands. The Guildford Formation covers the inland portion of the Swan Coastal Plain and includes clay and sand. The Yoganup

2: The region’s environment
-27-
Formation sands lie on the inland boundary of the Plain and represent a relict shoreline. Ridge Hill Sandstone is found along the Darling Fault. The Perth Basin contains sediments ranging from highly permeable to impermeable. Many of the surficial deposits on the Coastal Plains are highly permeable sands. Major aquifers are located in the sandstones of Leederville, Yarragadee and Cockleshell Gully Formations, with deposits of clay and shale acting as confining layers. The Yoganup Formation and the Donnybrook Sunklands are major recharge areas for these aquifers.

2: The region’s environment
-28-
2.3 LANDSCAPES AND SOILS
The South-west Hydrological Region has been divided into nine soil-landscape zones (Tille et al., 1998). These are shown in Figure 2.6. The major soils have been identified by Schoknecht (1997) and are summarised in Table 2.4. 2.3.1 Southern Zone of Ancient Drainage The Southern Zone of Ancient Drainage covers approximately 7,000 km2 (12% of the Region) and lies on the Yilgarn Craton east of the Meckering Line and encompasses the upper Blackwood River Catchment. The Meckering Line is a major hydrological boundary in the agricultural districts of Western Australia (Mulcahy 1967; Bettenay and Mulcahy, 1972) and in the South-west Hydrological Region it runs from Wickepin through Katanning and to the east of Broomehill. To the east of the Meckering Line, the valley floors are occupied by palaeochannels (i.e. the current drainage depressions still follow the old river courses). Although these rivers used to flow regularly when the climate was wetter, water rarely flows along the entire drainage system in our current climate. Now, rivers only flow out of the Southern Zone of Ancient Drainage in exceptionally wet years, probably 3-4 times per century on average. To the west of the Meckering Line, rejuvenated drainage (Section 2.3.2) has resulted in the formation of more recent valleys with creeks and rivers that flow in defined courses every winter. The Southern Zone of Ancient Drainage is a gently undulating plateau (local relief is typically 10-40 m), lying between 280 and 400 m above sea level. It is a subdued landscape characterised by wide divides, long gentle sideslopes and broad valley floors. These valley floors, which are up to 7 km wide and contain chains of salt lakes, are in-filled by alluvium and colluvium. The valley floors have very low gradients, typically in 1:500-1:1,500 or less (Bettenay and Mulcahy, 1972), resulting in sluggish drainage. In most years the runoff flows only as far as the lakes on the valley floors. Soils are formed mainly on laterite, truncated lateritic profiles, parna (from lake beds), bedrock weathering in situ, colluvium and alluvium. On the catchment divides soils are mainly sandy gravels with some pale deep sands. Alkaline grey shallow sandy duplex soils, grey shallow sandy duplex soils, and grey deep sandy duplex soils are found on the valley slopes while alkaline grey shallow loamy duplex soils, alkaline grey shallow sandy duplex soils, calcareous loamy earths and saline wet soils occur on the valley floors. Soil-landscape systems include; • Coblinine, Dongolocking, Datatine, East Katanning, Kukerin, Nyabing and Tieline in the
Katanning-Dumbleyung districts (Percy, 2000; Percy and Roberts, in prep), and • Coblinine, Dongolocking and Kukerin in the Toolibin district (Verboom and Galloway, in prep). 2.3.2 Southern Zone of Rejuvenated Drainage The Southern Zone of Rejuvenated Drainage covers approximately 12,500 km2 (21% of the Region) and lies on the Yilgarn Craton to the west of the Meckering Line. It includes the district surrounding Narrogin and Kojonup. The Zone consists of undulating terrain sitting 200-400 m above sea level. It is a more dissected landscape (local relief is typically 40-60 m) than in the Southern Zone of Ancient Drainage. The dissection of the lateritic profile has resulted in gently inclined rises and low hills, sometimes rounded but often containing small areas of lateritic remnants with breakaways. Valley floors, though typically narrower than in the Southern Zone of Ancient Drainage, are still relatively broad. Valley floor gradients are steeper than those to the east of the Meckering Line and are typically 1:250-1:650 or less (Bettenay and Mulcahy, 1972). The creeks and rivers flow every winter. The drainage lines do not necessarily follow the courses of the ancient rivers. Duplex sandy gravels, loamy gravels and pale deep sands are found on the lateritic remnants. Hillslopes formed on the mottled and pallid zones of the lateritic profile are dominated by grey deep sandy duplex soils, with some grey shallow sandy duplex soils. Red shallow loamy duplex soils and red deep sandy duplex soils are found on freshly weathered granite and metagranite. On valley floors there are saline wet soils and grey deep sandy duplex soils. Soil-landscape systems include: • Dellyanine, Dryandra, Pumphreys Bridge and Narrogin in the upper Murray Valley (adapted from
the mapping of McArthur et al., 1977),

2: The region’s environment
-29-
• Arthur River, Beaufort, Carrolup, Dellyanine, Farrar, Jingalup, Norring and Whimbin in the Wagin-Kojonup districts (Percy, 2000),
• Carrolup, Farrar, Gordon and Jingalup in the Gordon River catchment (Stuart-Street et al., in prep), and
• Arthur River, Dellyanine, Narrogin and Whimbin south east of Narrogin (Verboom and Galloway, in prep).
Figure 2.6: Soil-landscape zones of the South-west Hydrological Region

2: The region’s environment
-30-
2.3.3 Eastern Darling Range Zone The Eastern Darling Range Zone covers approximately 6,400 km2 (11% of the Region) and lies to the west of the Southern Zone of Rejuvenated Drainage on the Yilgarn Craton and forms an intergrade between the Western Darling Range Zone and the Southern Zone of Rejuvenated Drainage. It extends from Wandering through Darkan and Boyup Brook to Frankland. The Eastern Darling Range is undulating to rolling terrain formed by the dissection of a gently undulating lateritic plateau. Sizeable areas of plateau remain, often including broad, poorly drained flats on Eocene sediments. The rivers have dissected the plateau have formed major valleys 20-100 m deep, mostly with narrow valley floors. Many of the valleys have incised into the underlying granite, metagranite and gneiss. Soils are mainly formed on laterite (over granite), truncated laterite, rock weathering in situ (granite), colluvium and alluvium. The soil pattern is closely related to topography and degree of erosion. Sandy gravels, loamy gravels and pale deep sands are found over the plateau remnants. On the valley slopes there are a range of soils, with gravels and grey deep sandy duplex soils on truncated laterite and grey and red deep sandy duplex soils and red/brown deep loamy duplex soils on fresh rock. Soil-landscape systems include: • Marradong Uplands, Quindanning Valleys and Wundowie Plateau in the Murray Catchment
(adapted from the mapping of McArthur et al., 1977), and • Boscabel, Boyup Brook Valleys, Darkan and Eulin Uplands in the middle Blackwood Valley (Tille,
1996; Percy, 2000). 2.3.4 Western Darling Range Zone The Western Darling Range covers approximately 9,600 km2 (16% of the Region) and encompasses most of the intact Darling Plateau extending from Bridgetown in the south to Jarrahdale in the north. The Range lies on the western edge of the Yilgarn Craton with the Darling Scarp (the surface expression of the Darling Fault) forming its boundary. This zone is dominated by a gently undulating to undulating lateritic plateau mostly sitting at 250-400 m above sea level. Deeply incised valleys, up to 200 m deep, occur where the plateau has been dissected by major river systems. On the plateau surface duplex sandy gravels, loamy gravels and shallow gravels are found with pockets of pale deep sands and yellow deep sands. Friable red-brown loamy earths, brown loamy earths and brown deep loamy duplex soils have formed on freshly exposed gneiss and granite in the valleys. Soil-landscape systems include: • Cooke Hills, Darling Plateau and Murray Valleys in the Murray Catchment (adapted from the
mapping of McArthur et al., 1977), and • Coalfields, Darling Plateau and Lowden Valleys south of the Murray Catchment (Tille 1996;
Percy, 2000). 2.3.5 Warren-Denmark Southland Zone The Warren-Denmark Southlands cover approximately 13,000 km2 (23% of the Region) and are found south of the Darling Range. This zone rises gently from the coast of the Southern Ocean to about 300 m above sea level on the edge of the Blackwood River valley. North of Manjimup there is an intact lateritic plateau overlying the southern margin of the Yilgarn Craton. This plateau has with broad areas of poor drainage on Tertiary sediments. South of Manjimup there has been extensive dissection and stripping of the plateau leaving an undulating terrain of valleys and hills formed on the granite and gneiss of the Albany-Fraser Orogen. These are often interspersed by swampy plains. On the southern margin is a strip of coastal dunes backed by swampy plains. Soils are formed on laterite, colluvium (mainly from laterite), rock weathering in situ (gneiss, granite) and alluvium. Soils on the plateau include loamy gravels, sandy gravels and grey deep sandy duplex soils. Loamy gravels, friable red-brown loamy earths and brown deep loamy duplex soils are found in the dissected terrain. Pale deep sands, grey deep sandy duplex soils and semi-wet and wet soils are found on the swampy flats, with calcareous deep sands on the coastal dunes.
2: The region’s environment
-31-
Soil-landscape systems include: • Broke Plains, Caldyanup Flats, Kentdale, Kent Plateau, Manjimup Plateau, Northcliffe, Nullaki
Dunes, Perup Plateau, Pimelia Valleys, Pingerup Flats, Roe Hills, Walpole Hills and Wilgarup Valleys in the Northcliffe-Walpole-Denmark districts (adapted from the mapping of Churchward et al., 1988),
• Broke Plains, Manjimup Plateau, Northcliffe, Nullaki Dunes, Perup Plateau, Pimelia Valleys, and Wilgarup Valleys in the Manjimup-Pemberton districts (adapted from the mapping of Churchward, 1992), and
• Frankland Hills, Kent Plateau, Manjimup Plateau, Perup Plateau, Unicup Flats, Walpole Hills, and Yaraleena in the Frankland-Unicup districts (Stuart-Street, in prep).
2.3.6 Donnybrook Sunkland Zone The Donnybrook Sunkland covers approximately 3,800 km2 (6% of the Region) and overlies the Perth Basin south of the Whicher Scarp. It is located to the west of the Darling Range and Warren-Denmark Southlands. A gently undulating lateritic plateau dominates the northern portion of the Sunklands, rising 120-280 m above sea level. Shallow valleys occur where the plateau has been dissected by the major river systems. In the south the plateau grades into the Scott Coastal Plain. Duplex sandy gravels, along with deep sandy gravels, shallow gravels, grey deep sandy duplex soils, pale deep sands and yellow deep sands are found on the plateau and in the valleys. Soil-landscape systems include: • McLeod, Nillup Plain and Treeton Hills in the western Sunklands (Tille and Lantzke, 1990), • Blackwood Plateau, Goodwood Valleys and Nillup Plain in the south-east Sunklands (adapted
from the mapping of Churchward, 1992), and • Blackwood Plateau, Goodwood Valleys and Whicher Scarp in the north-east Sunklands (Tille,
1996). 2.3.7 Leeuwin Zone The Leeuwin Block covers approximately 1,000 km2 (2% of the Region) and is a narrow area west of the Donnybrook Sunkland. It extends between Capes Naturaliste and Leeuwin and overlies the Leeuwin Complex. The zone is dominated by a gently undulating lateritic plateau lying 20-80 m above sea level. This has been dissected in places to form a number of shallow valleys incised into the granite or gneiss bedrock. On the western margin a limestone ridge and coastal dunes rise to heights of 140-210 m above sea level. Soils on the plateau include loamy gravels, sandy gravels and grey deep sandy duplex soils. Some pockets of friable red-brown loamy earths occur in the valleys. Yellow deep sands overlie the limestone ridge while calcareous deep sands are found on the coastal dunes. Soil-landscape systems include Cowaramup Uplands, Gracetown Ridge, Glenarty, Kilcarnup Dunes, Metricup Scarp and Wilyabrup Valleys (Tille and Lantzke, 1990). 2.3.8 Swan Coastal Plain The Swan Coastal Plain covers approximately 4,000 km2 (7% of the Region) and is a level to gently undulating plain north of the Whicher Scarp. It has formed mostly on Quaternary sedimentary deposits overlying the Perth Basin. There are dune systems running parallel to the coast and alluvial plains lying inland. The Coastal Dune Zone (approximately 10 km2) consists of beach ridges and parabolic dunes of calcareous deep sands. These are backed by poorly drained estuarine deposits with saline wet soils and semi-wet and wet soils. Behind these lie low dunes of yellow deep sands overlying Tamala limestone. Further inland is the Bassendean Zone (approximately 9 km2), a complex of low dunes, sandplains, and swampy flats with pale deep sands and semi-wet and wet soils. The Pinjarra Zone (approximately 21 km2) covers the inland portion of the Coastal Plain and has formed on the Guildford Formation. It is a flat, often moderately saline and poorly drained alluvial plain with grey deep sandy duplex soils, grey shallow sandy duplex soils, brown shallow loamy duplex soils and wet soils. Cracking clays are found along the western margins and

2: The region’s environment
-32-
brown sandy earths and brown loamy earths have formed on recent alluvium. Sandy gravels, yellow deep sands and pale deep sands are found at the foot of the Darling and Whicher Scarps. Soil-landscape systems include: • Bassendean Dunes, Forrestfield, Pinjarra Plain, Quindalup Dunes, Spearwood Dunes and Vasse
to the north of Capel (Wells, 1989; van Gool, 1990; van Gool and Kipling, 1992; Barnesby and Proulx-Nixon, 2000), and
• Abba Plain, Bassendean Dunes, Jindong, Quindalup Dunes, Spearwood Dunes and Vasse in the Busselton district (adapted from Tille and Lantzke, 1990).
2.3.9 Scott Coastal Zone The Scott Coastal Zone covers approximately 900 km2 (1% of the Region) and overlies the Perth Basin between the Donnybrook Sunklands and the Southern Ocean. It lies in the catchment of the Scott River and consists of a swampy coastal plain and coastal dunes. On the plain there are pale deep sands and semi-wet and wet soils, while calcareous deep sands and pale deep sands are found on dunes along the coast. Soil-landscape systems include: • Blackwood River Alluvials, D’Entrecasteaux Dunes and Scott Coastal Plain (Tille and Lantzke,
1990), and • D’Entrecasteaux Dunes and Scott Coastal Plain (adapted from the mapping of Churchward,
1992). 2.3.9 Soil groups Table 2.4 identifies the major soil groups found in the South-west Hydrological Region as identified by Schoknecht (1997). For each soil group the common soil properties and hydrological properties are presented along with the relevant Australian Soil Classification/s (Isbell, 1996). The distribution of the soil within the Region is also outlined. The initial subdivision of the soils (super group) is based on: • the texture of topsoil, • the amount of gravel and stones in the topsoil, • changes in texture down the profile, and • how wet the soil becomes. The soils are further subdivided (soil group) according to other characteristics such as depth, colour and pH. For example the “grey deep sandy duplex” soil group belongs to the “sandy duplex” super group. All share the characteristics of a sandy topsoil with a texture or permeability contrast boundary to a heavy-textured subsoil at 3-80 cm. The grey deep sandy duplex soils differ from the other sandy duplex soils in that the sandy topsoil is deep (>30 cm), the colour of the topsoil is grey and the profile is not alkaline. They hydrological properties indicate that grey deep sandy duplex soils usually have good infiltration, but perched water often form over the clayey subsoil.

-33-
Table 2.4: Major soil groups of the South-west Hydrological Region (adapted from Schoknecht, 1997) Super group Soil Group and
area covered by soil
Description Common soil properties Australian Soil Classification (Isbell, 1996)
Distribution within the South-west Hydrological Region
Hydrological properties
Bare rock 1,000 km2 (2% of region)
Rock outcrop Bare rock exposed on surface Minimal soil development Excludes duricrust outcrop
Not applicable or Rudosol
Widespread, but rarely common on freshly weathered rock in the Forested Hills and Woolbelts.
Generates runoff, forms barriers to throughflow in surrounding soils.
Rocky or stony soils More than 50% coarse fragments (>20 mm) throughout the profile. These soils cover approximately 2,000 km2 (3% of the region).
Stony soil 700 km2 (1% of region)
Stony throughout Rocks or stones dominant throughout the profile Usually shallow with sandy, loamy, clayey or gravelly matrix
Rudosols Tenosols
Widespread, but rarely common on freshly weathered rock in the Forested Hills and Woolbelts.
Variable depending on soil texture and depth.
Shallow gravel 1,500 km2 (2% of region)
Ironstone gravel soil less than 80 cm deep over cemented gravels (duricrust)
Yellow/brown to grey (sometimes red) colour Neutral to acidic pH High gravel content Sandy or loamy matrix
Kandosols Tenosols
Widespread, but rarely common on lateritic plateau in the Forested Hills, Western Woolbelt and Wheatbelt.
Infiltration rates usually high though sometimes non-wetting. Cemented ironstone forms barrier to water movement. Preferred pathways through cracks in the duricrust. Reduced crop and pasture performance can lead to increased recharge.
Duplex sandy gravel 8,500 km2 (14% of region)
Sandy ironstone gravel soil 30-80 cm deep over clay or reticulite
Yellow, brown or grey colour topsoil Neutral to acidic pH High gravel content in topsoil Clay or reticulite at 30-80 cm
Kandosols Tenosols Chromosols
Common on lateritic plateau and remnants in the Forested Hills and Western Woolbelt.
Infiltration rates usually high though sometimes non-wetting. Clayey subsoil often forms barrier to water movement and perched groundwater may form. Preferred pathways through old tree roots are often present.
Deep sandy gravel 2,500 km2 (4% of region)
Sandy ironstone gravel soil greater than 80 cm deep over clay or cemented gravels
Yellow, brown or grey colour Neutral to acidic pH High gravel content throughout Usually overlies clayey subsoil or cemented gravels at more than 80 cm
Kandosols Tenosols Chromosols
Widespread, but rarely common on lateritic plateau and remnants in the Forested Hills, Woolbelts and Wheatbelt.
Infiltration rates usually high though sometimes non-wetting. Reduced crop and pasture performance leads to increased recharge and fresh seepage at the break of slope.
Ironstone gravelly soils Ironstone gravel (>20% and >20 cm thick), or duricrust, within the top 15 cm. Ironstone gravels a dominant feature of the profile. These gravels cover approximately 18,000 km2 (30% of the region).
Loamy gravel 6,000 km2 (10% of region)
Loamy ironstone gravel soil, often grading to clay at more than 30 cm
Yellow, red or brown colour Neutral to acidic pH High gravel content in topsoil Usually grading to clay by 30-80 cm but occasionally deeper
Kandosols Tenosols Chromosols Dermosols
Common on lateritic plateau and colluvium over truncated laterite in the Forested Hills and Western Woolbelt.
Infiltration rates usually high. Clayey subsoil may form barrier to water movement. Preferred pathways through old tree roots are often present.
-33-
2: The region’s environment
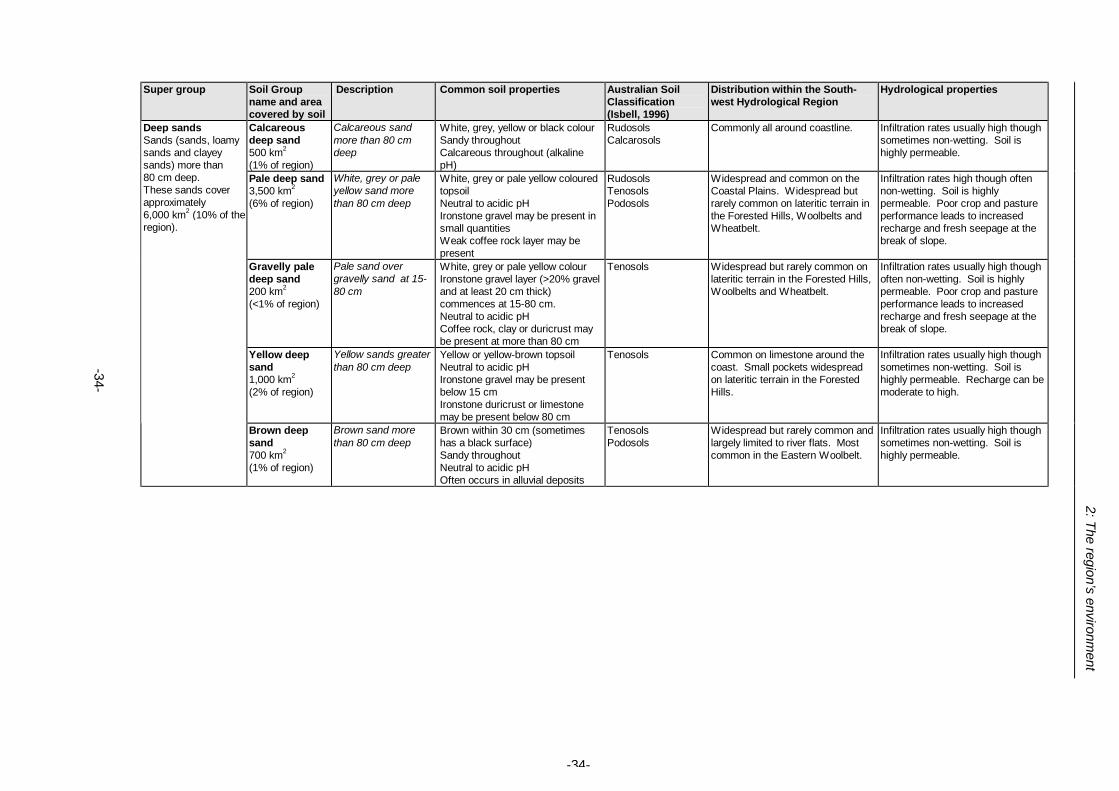
-34-
Super group Soil Group
name and area covered by soil
Description Common soil properties Australian Soil Classification (Isbell, 1996)
Distribution within the South-west Hydrological Region
Hydrological properties
Calcareous deep sand 500 km2 (1% of region)
Calcareous sand more than 80 cm deep
White, grey, yellow or black colour Sandy throughout Calcareous throughout (alkaline pH)
Rudosols Calcarosols
Commonly all around coastline. Infiltration rates usually high though sometimes non-wetting. Soil is highly permeable.
Pale deep sand 3,500 km2 (6% of region)
White, grey or pale yellow sand more than 80 cm deep
White, grey or pale yellow coloured topsoil Neutral to acidic pH Ironstone gravel may be present in small quantities Weak coffee rock layer may be present
Rudosols Tenosols Podosols
Widespread and common on the Coastal Plains. Widespread but rarely common on lateritic terrain in the Forested Hills, Woolbelts and Wheatbelt.
Infiltration rates high though often non-wetting. Soil is highly permeable. Poor crop and pasture performance leads to increased recharge and fresh seepage at the break of slope.
Gravelly pale deep sand 200 km2 (<1% of region)
Pale sand over gravelly sand at 15-80 cm
White, grey or pale yellow colour Ironstone gravel layer (>20% gravel and at least 20 cm thick) commences at 15-80 cm. Neutral to acidic pH Coffee rock, clay or duricrust may be present at more than 80 cm
Tenosols Widespread but rarely common on lateritic terrain in the Forested Hills, Woolbelts and Wheatbelt.
Infiltration rates usually high though often non-wetting. Soil is highly permeable. Poor crop and pasture performance leads to increased recharge and fresh seepage at the break of slope.
Yellow deep sand 1,000 km2 (2% of region)
Yellow sands greater than 80 cm deep
Yellow or yellow-brown topsoil Neutral to acidic pH Ironstone gravel may be present below 15 cm Ironstone duricrust or limestone may be present below 80 cm
Tenosols Common on limestone around the coast. Small pockets widespread on lateritic terrain in the Forested Hills.
Infiltration rates usually high though sometimes non-wetting. Soil is highly permeable. Recharge can be moderate to high.
Deep sands Sands (sands, loamy sands and clayey sands) more than 80 cm deep. These sands cover approximately 6,000 km2 (10% of the region).
Brown deep sand 700 km2 (1% of region)
Brown sand more than 80 cm deep
Brown within 30 cm (sometimes has a black surface) Sandy throughout Neutral to acidic pH Often occurs in alluvial deposits
Tenosols Podosols
Widespread but rarely common and largely limited to river flats. Most common in the Eastern Woolbelt.
Infiltration rates usually high though sometimes non-wetting. Soil is highly permeable.
-34-
2: The region’s environment

-35-
Super group Soil Group
name and area covered by soil
Description Common soil properties Australian Soil Classification (Isbell, 1996)
Distribution within the South-west Hydrological Region
Hydrological properties
Calcareous shallow sand 50 km2 (<1% of region)
Calcareous sand over rock, hardpan or other cemented layer at less than 80 cm
Sandy throughout Grey to black topsoil Calcareous throughout (alkaline pH) Often over limestone or clacrete
Rudosols Calcarosols Tenosols
Rare and restricted to the coastline. Infiltration rates usually high though sometimes non-wetting.
Pale shallow sand 300 km2 (1% of region)
White, grey or pale yellow sand over rock, hardpan or other cemented layer at less than 80 cm
Yellow or brown topsoil Neutral to acidic pH Ironstone gravel layer often present Includes gritty sands over granite and sands over duricrust
Tenosols Widespread but rarely common. Often associated with granite or laterite outcrops in the Forested Hills and Woolbelts.
Infiltration rates usually high though sometimes non-wetting. Underlying rock or pan may form a barrier to water movement.
Shallow sands Sands less than 80 cm deep over rock, hardpan or other cemented layer. These sands cover approximately 800 km2 (2% of the region).
Yellow/brown shallow sand 400 km2 (1% of region)
Yellow or brown sand over rock, hardpan or other cemented layer at less than 80 cm
White, grey or pale yellow topsoil Neutral to acidic pH Sometimes occurs over limestone in coastal areas
Rudosols Tenosols
Locally common over limestone near the coast. Widespread but rarely common in the Forested Hills and Woolbelts
Infiltration rates usually high though sometimes non-wetting. Underlying rock or pan may form a barrier to water movement.
Brown sandy earth 50 km2 (<1% of region)
Brown sand grading to loam by 80 cm
Brown topsoil Neutral to acidic pH Usually alluvial May grade to clay at depth
Kandosols Locally common on recent alluvium on Swan Coastal Plain. Elsewhere mainly restricted to valley floors in the Forested Hills.
Infiltration rates usually high though sometimes non-wetting. Soil is moderately permeable.
Sandy earths Soils with a sandy surface and grading to loam by 80 cm. May grade to clay at depth. These sands cover approximately 900 km2 (1% of the region).
Yellow sandy earth 800 km2 (2% of region)
Yellow sand grading to loam by 80 cm
Yellow topsoil Neutral to acidic pH Ironstone gravel may be present in subsoil Usually porous and massive or poorly structured May grade to clay at depth
Kandosols Largely restricted to the Forested Hills.
Infiltration rates usually high though sometimes non-wetting. Soil is moderately permeable.
-35-
2: The region’s environment

-36-
Super group Soil Group
name and area covered by soil
Description Common soil properties Australian Soil Classification (Isbell, 1996)
Distribution within the South-west Hydrological Region
Hydrological properties
Alkaline grey shallow sandy duplex 1,000 km2 (2% of region)
Grey sand less than 30 cm deep over alkaline clay
Grey surface, bleached sub-surface Various colours in subsoil, mottling is common Subsoil has alkaline pH (often calcareous) Usually sodic May include sandy loams Usually not hardsetting
Sodosols Common on slopes and valley floors on truncated laterite in the Wheatbelt. Minor soil in the Eastern Woolbelt.
Runoff quickly generated due to close proximity of clayey subsoil to surface. Perched groundwater can form above the clay. Surface sealing may occur under cultivation.
Grey shallow sandy duplex 1,500 km2 (3% of region)
Grey sand less than 30 cm deep over non-alkaline clay
Grey, bleached sub-surface Various colours in subsoil, mottling is common Neutral to acidic pH Non-sodic and sodic subsoils Ironstone gravel layer often present above the clay
Chromosols Sodosols
Widespread on slopes and valley floors on truncated laterite in the Wheatbelt and Eastern Woolbelts. Minor soil of the Western Woolbelt, Forested Hills and Swan Coastal Plain.
Runoff quickly generated due to close proximity of clayey subsoil to surface. Perched groundwater can form above the clay.
Red shallow sandy duplex 300 km2 (1% of region)
Red sand less than 30 cm deep over clay
Red surface Subsoil often red Neutral to alkaline pH Subsoil may be calcareous, sodic and/or saline
Chromosols Sodosols
Largely restricted to the Eastern Woolbelt.
Runoff quickly generated due to close proximity of clayey subsoil to surface. Perched groundwater can form above the clay.
Alkaline grey deep sandy duplex 500 km2 (1% of region)
Grey sand 30-80 cm deep over alkaline clay
Grey surface Various colours in subsoil Subsoil has alkaline pH (often calcareous) Subsoil often sodic
Chromosols Sodosols
Widespread on slopes and valley floors on truncated laterite in the Eastern Woolbelt and Wheatbelt. Minor soil on the Swan Coastal Plain.
Infiltration rates usually high. Clayey subsoil often forms barrier to water movement resulting in the formation of perched groundwater.
Sandy duplexes Soils with a sandy surface and a texture or permeability contrast at 3-80 cm. These sands cover approximately 13,000 km2 (20% of the region).
Grey deep sandy duplex 8,000 km2 (15% of region)
Grey sand 30-80 cm deep over non-alkaline clay
Grey, bleached sub-surface Various colours in subsoil, mottling is common Neutral to acidic pH Non-sodic and sodic subsoils Ironstone gravel layer often present above the clay
Chromosols Sodosols
Widespread and common on slopes and valley floors on truncated laterite, especially in the Eastern Woolbelt. Also common in the Wheatbelt, Western Woolbelt and Swan Coastal Plain.
Infiltration rates usually high though sometimes non-wetting. Clayey subsoil often forms barrier to water movement resulting in the formation of perched groundwater. Preferred pathways through old tree roots may be present.
-36-
2: The region’s environment

-37-
Super group Soil Group
name and area covered by soil
Description Common soil properties Australian Soil Classification (Isbell, 1996)
Distribution within the South-west Hydrological Region
Hydrological properties
Reticulite deep sandy duplex 100 km2 (<1% of region)
Grey to yellow or brown sand 30-80 cm deep over reticulite (mottled loamy sand to sandy clay loam)
Grey to yellow or brown topsoil Neutral to acidic pH Reticulite present at 30-80 cm Ironstone gravel layer often present above the clay
Tenosols Kandosols Chromosols
Mostly found in the Western Woolbelt and Wheatbelt.
Infiltration rates usually high though sometimes non-wetting. Soil is moderately to highly permeable
Yellow/brown deep sandy duplex 200 km2 (<1% of region)
Yellow or brown sand over clay at 30-80 cm
Yellow or brown surface Various colours in subsoil Typically neutral subsoil pH Non-sodic or sodic subsoil Ironstone gravel layer often present above the clay
Chromosols Sodosols
Mostly restricted to slopes and valley floors in the Western Woolbelt and Forested Hills.
Infiltration rates usually high though sometimes non-wetting. Clayey subsoil may form a barrier to water movement resulting in the formation of perched groundwater.
Sandy duplexes (cont.)
Red deep sandy duplex 700 km2 (1% of region)
Red sand over clay at 30-80 cm
Red (sometimes brown) Usually hardsetting Neutral subsoil pH Sometimes with a saline subsoil
Chromosols Sodosols
Found on slopes over fresh rock in the Eastern Woolbelt. Minor occurrences in Wheatbelt, Western Woolbelt and Swan Coastal Plain.
Infiltration rates usually high. Clayey subsoil or rocky substrate may form a barrier to water movement.
-37-
2: The region’s environment

-38-
Super group Soil Group
name and area covered by soil
Description Common soil properties Australian Soil Classification (Isbell, 1996)
Distribution within the South-west Hydrological Region
Hydrological properties
Shallow loams Loams less than 80 cm deep over rock or hardpan.
Red shallow loam 400 km2 (1% of region)
Red loams less than 80 cm deep over rock or hardpan
Red loam soil Rock or hardpan at <80 cm Usually neutral to acidic pH
Kandosol Minor soil of the Forested Hills, also found in both Woolbelts.
Moderate infiltration rate and soil permeability, hardpan or rock presents major barrier to water movement within top 80 cm.
Calcareous loamy earth 300 km2 (<1% of region)
Calcareous loam (may grade to calcareous clay at depth)
Usually calcareous throughout (sometime topsoil is non-calcareous) Red, brown or grey topsoil May grade to clay with depth May have limestone or calcrete at depth Hardsetting or fluffy surface Sometimes salty
Calcarosols Dermosols
Locally common on valley floors in the Wheatbelt.
Infiltration rates usually high though sometimes non-wetting. Clayey subsoils may slow water movement down the profile.
Brown loamy earth 1,200 km2 (2% of region)
Brown loam (may grade to a clay at depth)
Brown or grey-brown topsoil Neutral to acidic pH May be calcareous at depth Either loam throughout or grading to clay with depth Often formed in recent alluvium
Kandosols Tenosols
Found on slopes over fresh rock on alluvial flats in the Forested Hills, with minor occurrences in both Woolbelts. Also on recent alluvium on Swan Coastal Plain.
Infiltration rates high, moderate profile permeability. Good moisture storage and plant growth reduces recharge hazard.
Red loamy earth 300 km2 (<1% of region)
Red loam (may grade to clay at depth)
Red topsoil Neutral to acidic pH, sometimes calcareous and alkaline at depth Hardsetting or crusting surface Usually massive or poorly structured Ironstone gravel may be present
Kandosols Found on slopes over fresh rock in the Forested Hills. Minor soil of the Western Woolbelt.
Infiltration rates high, moderate profile permeability. Good moisture storage and plant growth reduces recharge hazard.
Loamy earths Soils with a loamy surface (sandy loam to clay loam) and either loamy throughout or grading to clay by 80 cm. These loams cover approximately 3,000 km2 (5% of the region).
Friable red/brown loamy earth 1,400 km2 (2% of region)
Red to brown loam (may grade to clay at depth). Soils are very friable and porous
Red to red-brown topsoil Neutral to acidic pH Friable topsoil Porous throughout Ironstone gravel may be present
Dermosols Kandosols Ferrosols
Common on fresh rock in the Forested Hills. Minor soil of the Western Woolbelt.
Infiltration rates high, moderate profile permeability. Good moisture storage and plant growth reduces recharge hazard.
-38-
2: The region’s environment
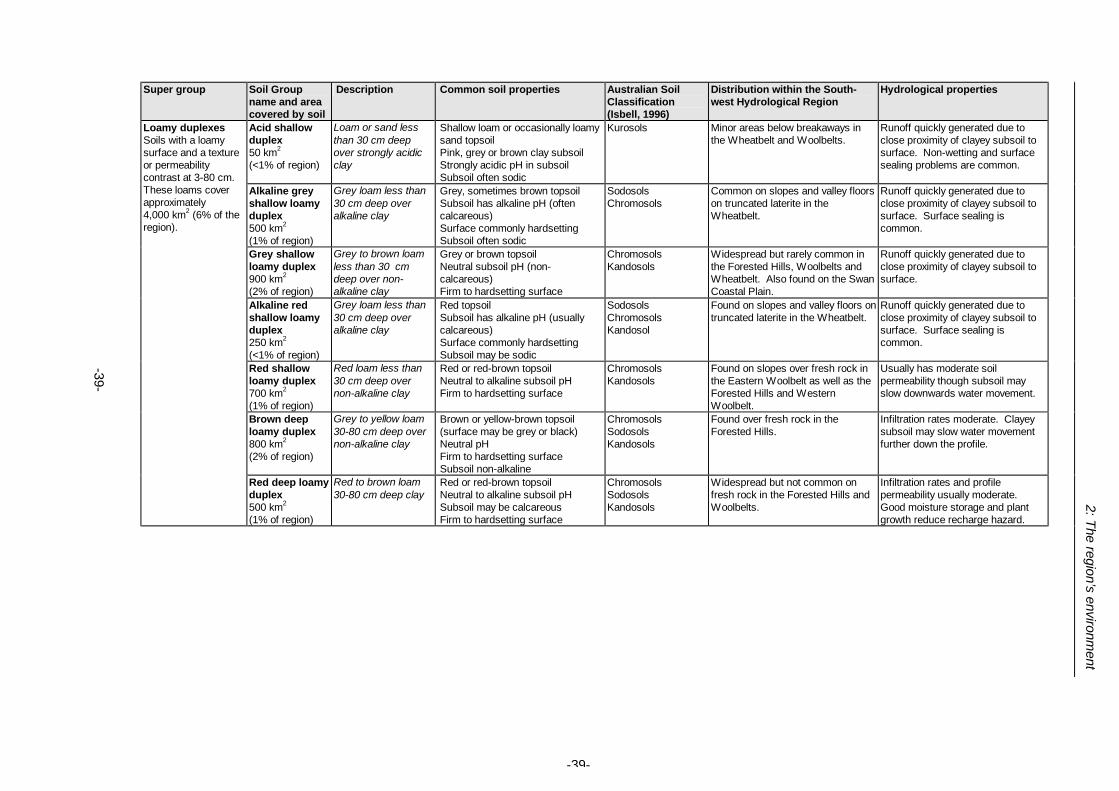
-39-
Super group Soil Group
name and area covered by soil
Description Common soil properties Australian Soil Classification (Isbell, 1996)
Distribution within the South-west Hydrological Region
Hydrological properties
Acid shallow duplex 50 km2 (<1% of region)
Loam or sand less than 30 cm deep over strongly acidic clay
Shallow loam or occasionally loamy sand topsoil Pink, grey or brown clay subsoil Strongly acidic pH in subsoil Subsoil often sodic
Kurosols Minor areas below breakaways in the Wheatbelt and Woolbelts.
Runoff quickly generated due to close proximity of clayey subsoil to surface. Non-wetting and surface sealing problems are common.
Alkaline grey shallow loamy duplex 500 km2 (1% of region)
Grey loam less than 30 cm deep over alkaline clay
Grey, sometimes brown topsoil Subsoil has alkaline pH (often calcareous) Surface commonly hardsetting Subsoil often sodic
Sodosols Chromosols
Common on slopes and valley floors on truncated laterite in the Wheatbelt.
Runoff quickly generated due to close proximity of clayey subsoil to surface. Surface sealing is common.
Grey shallow loamy duplex 900 km2 (2% of region)
Grey to brown loam less than 30 cm deep over non-alkaline clay
Grey or brown topsoil Neutral subsoil pH (non-calcareous) Firm to hardsetting surface
Chromosols Kandosols
Widespread but rarely common in the Forested Hills, Woolbelts and Wheatbelt. Also found on the Swan Coastal Plain.
Runoff quickly generated due to close proximity of clayey subsoil to surface.
Alkaline red shallow loamy duplex 250 km2 (<1% of region)
Grey loam less than 30 cm deep over alkaline clay
Red topsoil Subsoil has alkaline pH (usually calcareous) Surface commonly hardsetting Subsoil may be sodic
Sodosols Chromosols Kandosol
Found on slopes and valley floors on truncated laterite in the Wheatbelt.
Runoff quickly generated due to close proximity of clayey subsoil to surface. Surface sealing is common.
Red shallow loamy duplex 700 km2 (1% of region)
Red loam less than 30 cm deep over non-alkaline clay
Red or red-brown topsoil Neutral to alkaline subsoil pH Firm to hardsetting surface
Chromosols Kandosols
Found on slopes over fresh rock in the Eastern Woolbelt as well as the Forested Hills and Western Woolbelt.
Usually has moderate soil permeability though subsoil may slow downwards water movement.
Brown deep loamy duplex 800 km2 (2% of region)
Grey to yellow loam 30-80 cm deep over non-alkaline clay
Brown or yellow-brown topsoil (surface may be grey or black) Neutral pH Firm to hardsetting surface Subsoil non-alkaline
Chromosols Sodosols Kandosols
Found over fresh rock in the Forested Hills.
Infiltration rates moderate. Clayey subsoil may slow water movement further down the profile.
Loamy duplexes Soils with a loamy surface and a texture or permeability contrast at 3-80 cm. These loams cover approximately 4,000 km2 (6% of the region).
Red deep loamy duplex 500 km2 (1% of region)
Red to brown loam 30-80 cm deep clay
Red or red-brown topsoil Neutral to alkaline subsoil pH Subsoil may be calcareous Firm to hardsetting surface
Chromosols Sodosols Kandosols
Widespread but not common on fresh rock in the Forested Hills and Woolbelts.
Infiltration rates and profile permeability usually moderate. Good moisture storage and plant growth reduce recharge hazard.
-39-
2: The region’s environment

-40-
Super group Soil Group
name and area covered by soil
Description Common soil properties Australian Soil Classification (Isbell, 1996)
Distribution within the South-west Hydrological Region
Hydrological properties
Self-mulching cracking clay 250 km2 (<1% of region)
Cracking clay with a self-mulching surface
Often grey, but can be yellow, brown or red Clay texture throughout Deep cracks when dry Self-mulching surface condition ·
Vertosols Locally common on Swan Coastal Plain. Minor soil of valley floors in the Wheatbelt.
Low infiltration and permeability once soil has moistened up. Surface sealing is common. Cracks may provide pathways for rapid water percolation in summer.
Cracking clays Soils that have a clayey surface (light to heavy clay or sandy clay) at least 30 cm thick and crack strongly when dry. These clays cover approximately 550 km2 (<1% of the region).
Hard cracking clay 200 km2 (<1% of region)
Cracking clay without a self-mulching surface
Red, brown, yellow or grey topsoil Clay texture throughout Deep cracks when dry Variable pH Massive or pedal May have a crusting surface
Vertosols Locally common on Swan Coastal Plain and valley floors in the Wheatbelt.
Low infiltration and permeability once soil has moistened up. Surface sealing is common. Cracks may provide pathways for rapid water percolation in summer.
Red/brown non-cracking clay 25 km2 (<1% of region)
Red or brown non-cracking clay, usually with good structure
Red or brown topsoil Clay texture throughout Subsoil sometimes calcareous Does not crack seasonally Usually structured and friable Often has hardsetting surface
Dermosols Kandosols Ferrosols
Minor soil, most common in the Western Woolbelt.
Moderately slow infiltration and permeability.
Non-cracking clays Soils that have a clayey surface (light to heavy clay or sandy clay) at least 30 cm thick and do not crack strongly when dry. These clays cover approximately 75 km2 (<1% of the region).
Grey non-cracking clay 50 km2 (<1% of region)
Grey non-cracking clay
Often grey topsoil, sometimes yellow or brown Clay texture throughout Subsoil often calcareous Does not crack seasonally Often has hardsetting surface
Kandosols Dermosols
Minor soil throughout the region. Moderately slow infiltration and permeability.
-40-
2: The region’s environment
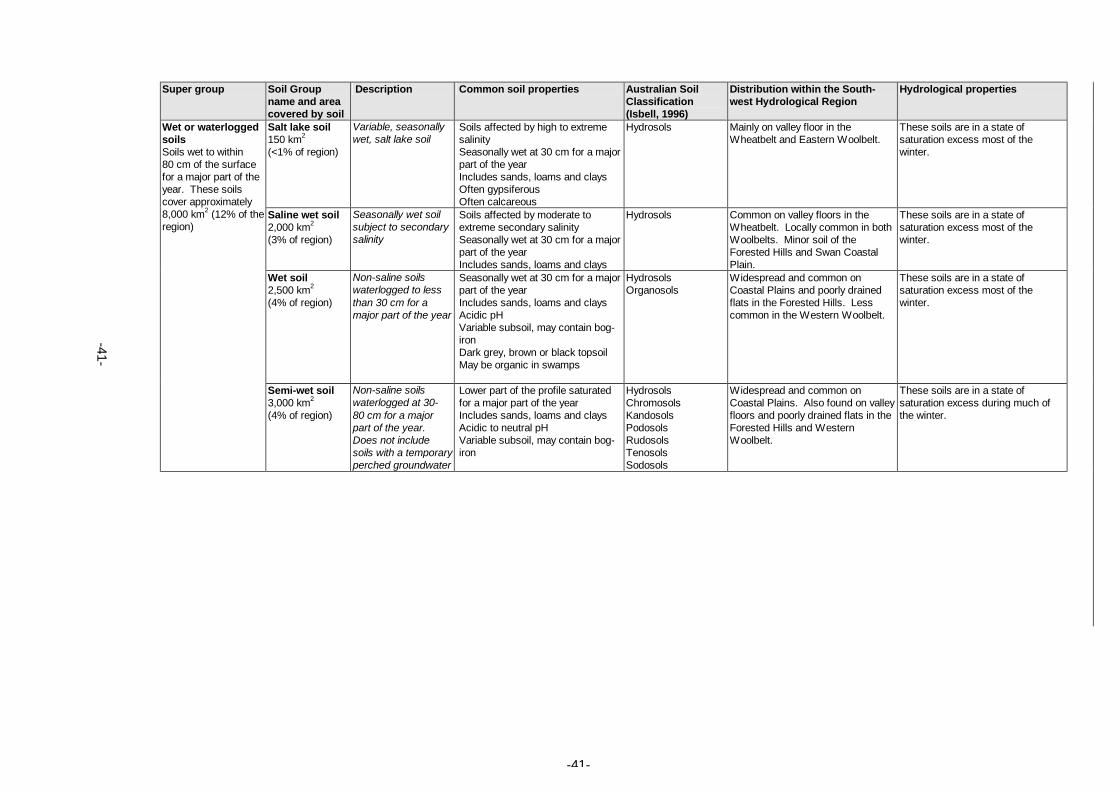
-41-
Super group Soil Group
name and area covered by soil
Description Common soil properties Australian Soil Classification (Isbell, 1996)
Distribution within the South-west Hydrological Region
Hydrological properties
Salt lake soil 150 km2 (<1% of region)
Variable, seasonally wet, salt lake soil
Soils affected by high to extreme salinity Seasonally wet at 30 cm for a major part of the year Includes sands, loams and clays Often gypsiferous Often calcareous
Hydrosols Mainly on valley floor in the Wheatbelt and Eastern Woolbelt.
These soils are in a state of saturation excess most of the winter.
Saline wet soil 2,000 km2 (3% of region)
Seasonally wet soil subject to secondary salinity
Soils affected by moderate to extreme secondary salinity Seasonally wet at 30 cm for a major part of the year Includes sands, loams and clays
Hydrosols Common on valley floors in the Wheatbelt. Locally common in both Woolbelts. Minor soil of the Forested Hills and Swan Coastal Plain.
These soils are in a state of saturation excess most of the winter.
Wet soil 2,500 km2 (4% of region)
Non-saline soils waterlogged to less than 30 cm for a major part of the year
Seasonally wet at 30 cm for a major part of the year Includes sands, loams and clays Acidic pH Variable subsoil, may contain bog-iron Dark grey, brown or black topsoil May be organic in swamps
Hydrosols Organosols
Widespread and common on Coastal Plains and poorly drained flats in the Forested Hills. Less common in the Western Woolbelt.
These soils are in a state of saturation excess most of the winter.
Wet or waterlogged soils Soils wet to within 80 cm of the surface for a major part of the year. These soils cover approximately 8,000 km2 (12% of the region)
Semi-wet soil 3,000 km2 (4% of region)
Non-saline soils waterlogged at 30-80 cm for a major part of the year. Does not include soils with a temporary perched groundwater
Lower part of the profile saturated for a major part of the year Includes sands, loams and clays Acidic to neutral pH Variable subsoil, may contain bog-iron
Hydrosols Chromosols Kandosols Podosols Rudosols Tenosols Sodosols
Widespread and common on Coastal Plains. Also found on valley floors and poorly drained flats in the Forested Hills and Western Woolbelt.
These soils are in a state of saturation excess during much of the winter.
-41-

2: The region’s environment
-42-
2.4 HYDROLOGY
The catchment areas of the Peel-Harvey Estuary, Leschenault Inlet, Geographe Bay, Margaret River, Blackwood River, Donnelly River, Warren River, Shannon River, Frankland River, Kent River and Denmark River are all within the South-west Hydrological Region (Figure 2.7). Table 2.5 presents the area of these catchments along with the mean annual basin flows (the sum of the mean annual flows of all the major rivers and tributaries within the catchment). Table 2.5: Area and mean annual flows of the catchments of
the South-west Hydrological Region. Catchment Area of
catchment (km2)
Mean annual basin flow (million m3)
Blackwood 22,550 1,060 Peel Harvey1 12,070 1,050 Frankland2 5,920 200 Leschenault3 4,780 560 Warren 4,360 640 Shannon 3,420 440 Geographe and Margaret4 2,995 470 Denmark 2,700 210 Kent 2,490 170 Donnelly 1,690 350 Total 62,975 5,150
Adapted from: Western Australian Water Resources Council (1984) and Schofield et al. (1988)
1 – Includes the Murray, Serpentine and Harvey River catchments 2 - Includes the Deep River catchment 3 - Includes the Collie, Brunswick and Preston River catchments 4 - Includes the Capel, Vasse, and Margaret River catchments
Combined, the rivers of the South-west Region yield over 5 billion m3 of water per year (Western Australian Water Resources Council, 1984). This represents approximately 75% of the mean annual basin flow of all the agricultural district (an area of almost 335,000 km2 from Geraldton to Esperance). The south-west rivers contain approximately 10% of Western Australia’s divertible water supplies that are fresh or marginal (usually less than 1,070 mg/L total soluble salt in the south-west of Western Australia - Section 1.4). The quality of the water in the south-west rivers ranges from fresh (<500 mg/L TSS - see Section 1.4) to saline (>5000 mg/L TSS). Table 2.6 presents a summary of salinity levels in the major rivers and their tributaries. As a general rule, salinity levels are lower close to the coast and increase inland where the rainfall is lower and extensive clearing of native vegetation has occurred. The Blackwood, with headwaters over 300 km to the north-east of its mouth, is the longest of the rivers and flows through the middle of the South-west Hydrological Region. It also has the largest catchment area and the greatest flow. The upper Blackwood Catchment lies in the Southern Zone of Ancient Drainage (Section 2.3.1). Here ancient drainage lines contain extensive chains of salt lakes which only have connected flow in exceptionally wet years. In normal years they act as sumps for runoff and salts which then accumulate in the lakes. Examples include Dumbleyung, Taarblin and Coyercup Lakes. West of the Meckering Line there is a distinct change in surface hydrology with connected winter flow in rejuvenated drainage lines – this is the Southern Zone of Rejuvenated Drainage (Section 2.3.2). Here, major tributaries of the Blackwood River, including the Arthur, Coblinine, Beaufort and Balgarup Rivers flow across broad valley floors. Drainage lines are not always clearly defined, and a chain of lakes is located on the flats of the Beaufort River. Average annual salinity levels in the rivers range from 3,000-8,000 mg/L. The Balgarup and Arthur Rivers meet to form the Blackwood River near Moodiarrup. From here downstream the river and its tributaries follow clearly defined drainage lines on narrow valley floors as they cut through the Darling Range. The average annual salinity level in the Blackwood remains
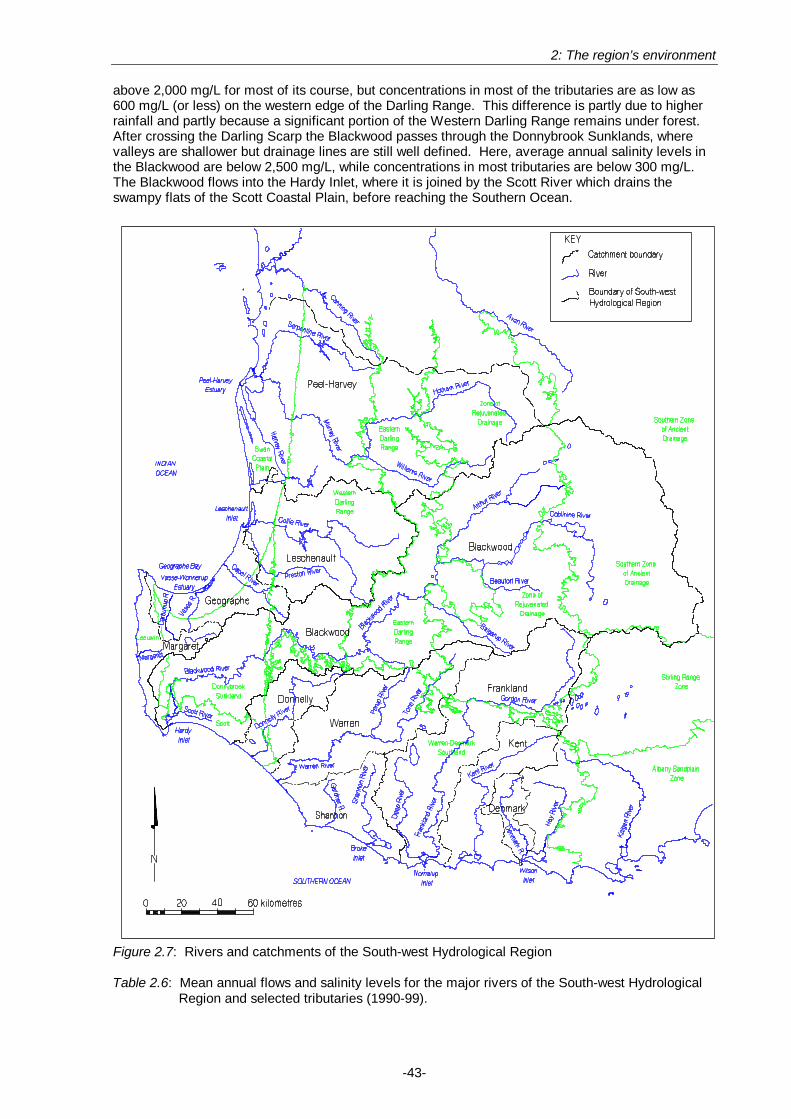
2: The region’s environment
-43-
above 2,000 mg/L for most of its course, but concentrations in most of the tributaries are as low as 600 mg/L (or less) on the western edge of the Darling Range. This difference is partly due to higher rainfall and partly because a significant portion of the Western Darling Range remains under forest. After crossing the Darling Scarp the Blackwood passes through the Donnybrook Sunklands, where valleys are shallower but drainage lines are still well defined. Here, average annual salinity levels in the Blackwood are below 2,500 mg/L, while concentrations in most tributaries are below 300 mg/L. The Blackwood flows into the Hardy Inlet, where it is joined by the Scott River which drains the swampy flats of the Scott Coastal Plain, before reaching the Southern Ocean.
Figure 2.7: Rivers and catchments of the South-west Hydrological Region Table 2.6: Mean annual flows and salinity levels for the major rivers of the South-west Hydrological
Region and selected tributaries (1990-99).

2: The region’s environment
-44-
River (sorted according to salinity level)
Mean annual salinity 1985-99 (mg/L)
Mean annual flow
(million m3/year)
Mean annual
salt load (t/year)
Salinity trend (mean annual increase* in mg/L/year)
Range of average annual
rainfall (mm/year)
Proportion of catchment
cleared (%)
Saline (>5000 mg/L) Hotham River1** 7,795 Increase 450-800 85% Upper Collie River East2
5,946 8 48,000 Increase 600-650 90%
Arthur River3** 5,500 58 Increase 400-500 >90% Upper Balgarup River3**
5,200 4 Increase 550 >90%
Brackish (1070-5000 mg/L)
Williams River1** 4,655 83 353,000 Increase 500-800 90% Middle Blackwood River (Winnejup)
3,720 309 1,038,000 400-700 >90%
Tone River4 3,501 46 144,000 Decrease 550-650 75% Beaufort River3** 3,300 40 Increase 400-500 >90% Upper Kent River 3,262 33 97,000 Decrease 550-850 80% Murray River** 3,143 278 843,000 Increase (+93) 450-1,250 75% Middle Blackwood River (Nannup) **
2,400 545 1,100,000 400-1,000
Lower Frankland River***
2,190 179 Increase (+74) 400-1,250 35%
Perup River4 2,179 18 36,000 Decrease 700-800 25% Collie River East2 2,009 53 87,000 Increase 600-900 40% Lower Blackwood River
1,845 684 1,190,000 Increase (+58) 400-1,050 85%
Lower Kent River 1,600 83 108,000 Decrease 550-1,100 40% Upper Denmark River
1,600 13 16,000 700-800 80%
Collie River (above Wellington Dam)
1,240 122 131,000 Increase (+24) 600-1,050 25%
Marginal (500-1070 mg/L)
Lower Warren River 880 319 267,000 Steady 550-1,400 40% Wellesley River2 800 62 1,000 >90% Wilgarup River4 747 32 23,000 Steady 800-1,000 30% Lower Denmark River
650 34 21,000 Decrease 700-900 20%
Fresh (<500 mg/L) Preston River** 480 124 56,000 Increase 850-1,100 50% Capel River** 374 54 21,000 Increase 850-1,050 50% Serpentine River 373 78 16,000 Steady 750-1,300 0% Lower Harvey River**
326 157 50,000 900-1,200 50%
Bingham River2 302 7 1,700 Decrease 650-900 <5% Scott River*** 220 104 Steady 1,100 60% Vasse River*** 200 11 Steady 900-1,000 60% Margaret River*** 200 103 Steady 950-1,200 20% Donnelly River** 194 122 23,000 Increase 800-1,200 30% Lefroy Brook5 190 35 8,000 Steady 1,100-1,200 25% Shannon River*** 180 84 Steady 1,000-1,400 0% Deep River*** 180 38 Steady 900-1,250 0% Gardner River*** 140 122 Steady 1,200-1,400 20% Carey Brook6** 107 7 700 Steady 1,400 0%
* - Mean annual increase data from Anon. (1996) ** - Data available are incomplete for the period 1990-1999 *** - Data presented are for the period 1980-85 (Schofield et al., 1988) 1 - Upper Murray Basin, 2 – Collie Basin, 3 – Upper Blackwood Basin, 4 – Upper Warren Basin, 5 - Tributary of the lower Warren River, 6 – Tributary of the lower Donnelly River Data supplied by: Catchment Support and Investigations, Water and Rivers Commission, Bunbury. The Blackwood River has a mean annual salt discharge of 1.2 million tonnes. This is a load comparable to that of the entire Murray-Darling Basin, which is 40 times larger than the Blackwood Basin and currently has a total flow 11 times greater. On average, the Blackwood discharges

2: The region’s environment
-45-
approximately 135 tonnes of salt per hour into the ocean, equivalent to the load of one large road-train every 20 minutes. This represents over 0.5 t/year of salt being exported from every cleared hectare of land in its middle to upper basin (or 10-30 t/year from every hectare of saline land). To the north of the Blackwood River, most rivers flow in a general westerly direction to the Indian Ocean. The Murray River has its headwaters in the Southern Zone of Rejuvenated Drainage where its tributaries, the Hotham and Williams Rivers, rise and flow into broad valley floors. They cut through the Eastern Darling Range in well defined courses and meet to form the Murray River on the edge of the Western Darling Range. From here the Murray forms a deep valley until it crosses the Darling Scarp and meanders across the flats of the Swan Coastal Plain before entering the Peel-Harvey Estuary. North of the Murray is the catchment of the Serpentine River, which rises on the surface of the Darling Plateau before cutting a deep valley into the edge of the Darling Range and flowing across the Coastal Plain to the Peel-Harvey Estuary. To the south of the Murray, the Harvey River once followed a similar pattern to the Serpentine River. Now much of the Harvey’s flow is carried directly though an artificial drain across the Coastal Plain to the Indian Ocean. Average annual salinity levels in the Murray River are about 3,000 mg/L because of clearing in the upper catchment. Salt concentrations in the Serpentine and Harvey Rivers, which have headwaters in forested areas, are considerably lower - about 200-300 mg/L. Between the Peel-Harvey and Blackwood Catchments, the Collie and Preston Rivers rise on the plateau surface before cutting deep valleys into the edge of the Darling Range and flowing across the Swan Coastal Plain to the Leschenault Inlet. Salinity levels in the Collie River are 6,000 mg/L in cleared portions of the upper catchment, but drop to 1,200 mg/L when it is joined by tributaries from forested catchments. It then flows into Wellington Dam. A number of relatively short rivers flow into Geographe Bay to the west of the Leschenault Inlet. The Capel River rises on the Western Darling Range, crosses through the Donnybrook Sunklands and Coastal Plain before flowing out to the Bay through an artificial drain. Originally it flowed into the Vasse-Wonerup Estuary, as did the Ludlow, Vasse and Carbunup Rivers, all of which rise in the Donnybrook Sunklands. Most of these now also flow through artificial drains into the Bay, and a gate prevents tidal flushing of the Estuary. A few rivers and creeks flow into the Indian Ocean on the coast of the Leeuwin Zone, the most significant of which is the Margaret River. Most rivers, from the Blackwood River northwards, have had to cut through or into the Western Darling Range which has been uplifted along the Darling Scarp. As a result they have formed deeply incised, steep-sided valleys and there is a high “drainage density” of small sub-catchments and high velocity flows. In contrast, rivers south of the Blackwood River generally flow in a southerly direction. Here the rivers have a more gentle gradient and are less deeply incised, following the gradual fall of the land to the Southern Ocean. Many of the rivers rise in swampy plains on the Jarrahwood axis, a major catchment divide running approximately parallel to the coast. The largest catchment in this southern area belongs to the Frankland River. The upper catchment is in the Southern Zone of Rejuvenated Drainage where the Gordon River flows across some broad palaeochannels. Where the Gordon River cuts across the Eastern Darling Range and Warren-Denmark Southland, it becomes the Frankland River and flows in a well defined channel, before finally enters the Nornalup Inlet. The Deep River, which rises on poorly drained flats on the plateau surface of the Warren-Denmark Southland, also flows into Nornalup Inlet. Average annual salinity levels in the Frankland River are over 2,000 mg/L, while in the Deep River they are less than 300 mg/L. Like the Frankland River, the Warren and Kent Rivers also have headwaters in cleared agricultural land. The Warren rises as the Tone River on the eastern edge of the Southern Zone of Rejuvenated Drainage, crossing the Eastern Darling Range and Warren Denmark Southland before reaching the Southern Ocean. Salinity levels in the Warren Basin range from 3,500 mg/L in the Tone River to 800 mg/L in the lower Warren River and <300 mg/L in the lower tributaries. The Kent, rising on the Warren-Denmark Southland and flowing into the Irwin Inlet, has concentrations over 3,000 mg/L in the upper catchment. The Denmark River, which flows into the Wilson Inlet, also has a trend for decreasing salinity downstream. The other southward flowing rivers have mainly forested catchments within the Southland and as a result, their salinity levels are below 500 mg/L. These include the Donnelly River, Gardner River and the Shannon River (which flows into the Broke Inlet).

2: The region’s environment
-46-
2.5 REFERENCES
Anon. (1996). Salinity - a situation statement for Western Australia. A report to the Minister for Primary Industry & Minister for the Environment November 1996 prepared by the Chief Executive Offices of; Agriculture Western Australia, Department of Conservation and Land Management, Department of Environmental Protection and Water and Rivers Commission.
Barnesby, B.A. and Proulx-Nixon, M.E. (2000). 'Land Resources from Harvey to Capel on the Swan Coastal Plain Western Australia'. Agriculture Western Australia Land Resource Maps 23/1 and 23/2.
Bates, R.L. and Jackson, J.A. (1987). ‘Glossary of geology’ (3rd edition). American Geological Institute, Falls Church, Virginia.
Bettenay, E. and Mulcahy, M.J. (1972). Soil and landscape studies in Western Australia. (2). Valley form and surface features in the South-west Drainage Division. Journal of the Geological Society of Australia 18: 359-369.
Bowler, J.M. (1982). Aridity in the late Tertiary and Quaternary of Australia. In: ‘Evolution of the flora and fauna of arid Australia’. (eds W.R. Barker and P.J.M. Greenslade), Peacock Publications.
Bureau of Meteorology (1962). ‘Climatic survey, Region 12 - Albany Western Australia’. Bureau of Meteorology, Melbourne.
Bureau of Meteorology (1965). ‘Climatic survey, Region 16 - South-west Western Australia’. Bureau of Meteorology, Melbourne.
Churchward, H.M. (1992). Soils and landforms of the Manjimup area, Western Australia. Western Australian Department of Agriculture, Land Resources Series No. 10.
Churchward, H.M., McArthur, W.M., Sewell, P.L. and Bartle, G.A. (1988). Landforms and soils of the south coast and hinterland, Western Australia - Northcliffe to Manypeaks. CSIRO Division of Water Resources Divisional Report No. 88/1.
Clewett, J.F., Clarkson, N.M., Owens, D.T. and Abrecht, D.G. (1997). Australian Rainman: Rainfall information for better management – Version 2.2 data update disk. Department of Primary Industries, Brisbane.
Cockbain, A.E. (1990). Perth Basin. In: ‘Geology and mineral resources of Western Australia’. Western Australia Geological Survey, Memoir 3. pp. 495-524.
Geological Survey of Western Australia (1990). ‘Geology and mineral resources of Western Australia’. Western Australian Geological Survey, Memoir 3.
Isbell, R.F. (1996). ‘The Australian soil classification’. CSIRO Australia. Luke, G.J., Burke, K.L. and O’Brien, T.M. (1988). Evaporation data for Western Australia. Western Australian
Department of Agriculture, Division of Resource Management Technical Report No. 65. McArthur, W.M. (1991). ‘Reference soils of south-western Australia’. Australian Society of Soil Science Inc.
(Western Australian Branch). pp. 19-21. McArthur, W.M., Churchward, H.M. and Hick, P.T. (1977). Landforms and soils of the Murray River catchment
area of Western Australia. CSIRO Division of Land Resources Management Series No. 3. Middleton, M.F., Wilde, S.A., Evans, B.J., Long, A., Dentith, M. and Morawa, M. (1995). Implications of a
geoscientific traverse over the Darling Fault Zone, Western Australia. Australian Journal of Earth Sciences 42: 83-93.
Mulcahy, M.J. (1960). Laterites and lateritic soils in south-western Australia. Journal of Soil Science 11: 206-225.
Mulcahy, M.J. (1967). Landscapes, laterites and soils in south-western Australia. In: ‘Landform studies in Australia and New Guinea’. (eds J.N. Jennings and J.A. Mabbutt), Australian National University Press, Canberra.
Myers, J.S. (1990a). Western Gneiss Terrane. In: ‘Geology and mineral resources of Western Australia’. Western Australia Geological Survey, Memoir 3. pp. 13-31.
Myers, J.S. (1990b). Albany-Fraser Orogen. In: ‘Geology and mineral resources of Western Australia’. Western Australia Geological Survey, Memoir 3. pp. 255-264.
Myers, J.S. (1990c). Pinjarra Orogen. In: ‘Geology and mineral resources of Western Australia’. Western Australia Geological Survey, Memoir 3. pp. 265-273.
Percy, H.M. (2000). Katanning area land resources survey. Agriculture Western Australia, Land Resources Series No. 16.
Percy, H.M. and Roberts, M. (in prep.). Nyabing-Kukerin land resources survey. Agriculture Western Australia. Schofield, N.J, Ruprecht, J.K. and Loh, I.C. (1988). The impact of agricultural development on the salinity of
surface water resources of south-west Western Australia. Surface Water Branch Report No. WS27, Water Authority of Western Australia.
Schoknecht, N. (1997). Soil Groups of Western Australia - A simple guide to the main soils of Western Australia. Agriculture Western Australia, Resource Management Technical Report No. 171.
Smith, A.D., George, R.J., Scott, P.R., Bennett, D.L., Rippon, R.J. and Orr, G.J. (1998a). Results of investigations into the groundwater response and productivity of high water use agricultural systems 1990-1997: 4. TKK Engineering’s catchment (Williams). Agriculture Western Australia, Resource Management Technical Report No. 177.
Smith, A.D., George, R.J., Scott, P.R., Bennett, D.L., Rippon, R.J. and Orr, G.J. (1998b). Results of investigations into the groundwater response and productivity of high water use agricultural systems 1990-1997: 3. Hunt’s catchment (Frankland). Agriculture Western Australia, Resource Management Technical Report No. 176.

2: The region’s environment
-47-
Stephens, C.G. (1946). ‘Pedogenesis following the dissection of lateritic regions in southern Australia’. Bulletin No. 206, Council for Scientific and Industrial Research, Melbourne.
Stuart-Street, A. (in prep.). Tonebridge-Frankland land resources survey. Agriculture Western Australia. Stuart-Street, A., Marold, R. and Roberts, M. (in prep.). Borden-Tambellup land resources survey. Agriculture
Western Australia. Tille, P.J. (1996). Wellington-Blackwood land resources survey. Agriculture Western Australia, Land
Resources Series No. 14. Tille, P.J. and Lantzke, N.C. (1990). Busselton-Margaret River-Augusta land capability study. Western
Australian Department of Agriculture, Land Resources Series No. 5. Tille, P.J., Moore, G. and Griffin, E. (1998). Soils and landscapes of south-western Australia. In: ‘Soilguide - A
handbook for understanding and managing agricultural soils’. (ed. G. Moore). Agriculture Western Australia, Bulletin No. 4343. pp. 31-42.
Trendall, A.F. (1990). Tectonic subdivisions and nomenclature. In: ‘Geology and mineral resources of Western Australia’, Western Australia Geological Survey, Memoir 3. pp. 3-4.
van Gool, D. (1990). Land resources in the northern section of the Peel-Harvey catchment, Swan Coastal Plain, Western Australia. Land Resource Map No. 15, Western Australian Department of Agriculture.
van Gool, D. and Kipling, B.A. (1992). Land resources in the southern section of the Peel-Harvey catchment, Swan Coastal Plain, Western Australia. Land Resource Map No. 13, Western Australian Department of Agriculture.
Verboom, W. H. and Galloway, P. D. (2000). The effect of a Proteaceous symbiote and its lateritic products on landscape evolution: Explanatory descriptions from southwestern Australia. Proceedings of the Australian Society of Soil Science, WA Branch Soils 2000 Conference.
Verboom, W. H. and Galloway, P. D. (in prep). Corrigin land resources survey. Agriculture Western Australia. Wells, M.R. (1989). Land capability study of the shires of Mandurah and Murray. Western Australian
Department of Agriculture, Land Resources Series No. 2. Western Australian Water Resources Council (1984). Water resource perspectives Western Australia: Report
1 - Water resources and water use. Western Australian Water Resources Council Publication No. 1/84. Wilson, A.C. (1990). Collie Basin. In: ‘Geology and mineral resources of Western Australia’, Western Australia
Geological Survey, Memoir 3. pp. 525-531. Woolnough, W.G. (1927). The duricrust of Australia. Journal and Proceedings of the Royal Society of New
South Wales 61: 24-53.

3: Hydrological cycle
-48-
3. THE HYDROLOGICAL CYCLE
3.1 INTRODUCTION
3.1.1 What is the hydrological cycle? Water is distributed across our globe in a variety of both forms and locations. Most of this water is not static, being endlessly on the move and changing its form. Water is most commonly found in liquid form in oceans, lakes, rivers and groundwater, and also in all living organisms. In the solid form water exists as ice and snow, most commonly in the polar regions. Water may also exist in a gaseous form as water vapour in the atmosphere. Estimates of the amount and distribution of water in the world vary. Speidel and Agnew (1982) present figures which indicate the world’s total to be about 1,386 million cubic kilometres. At any given time, approximately 97% of this water is found in the oceans and another 2% is locked in ice caps and glaciers. Less than 1% exists as groundwater, freshwater lakes, salt water lakes, inland seas, soil water and rivers. Only a tiny portion (less than 0.0001%) is found in the biosphere (i.e in plants and animals). The hydrologic cycle is a term used to describe the continuous exchange of water between ocean, atmosphere and land. Solar energy, air currents and gravity are the main forces driving the hydrological cycle. Figure 3.1 shows a simplified example of the hydrological cycle. Heat from the sun evaporates water from the ocean. In the atmosphere, water vapour forms clouds which are transported over the land by winds. Cooling of these clouds results in condensation and the water falls to Earth as rain. Some water flows across the land as surface runoff and is eventually transported back to the oceans by streams and rivers. Other water infiltrates into the ground and moves downslope as throughflow in soils or as groundwater flow in deeper zones before seeping out on the ground surface or running out into the ocean. 3.1.2 How does the hydrological cycle work? As the vast bulk of the world’s water is found in the oceans, this provides a convenient starting point to explain the process of the hydrological cycle. Nace (1971) estimated that water spends an average of 4,000 years resident in the oceans between stages of the cycle. The hydrological cycle is powered by energy derived from the sun. Heat generated by solar radiation evaporates water from the oceans. It also causes evaporation from other water bodies, the land surface and the soil. The process of evaporation transforms water from a liquid state into a gaseous state which enters the atmosphere as water vapour. Humidity is a measure of the amount of water vapour in the atmosphere. Condensation due to cooling or high humidity levels results in the t water vapour changing back into the liquid form as small droplets, which often remain suspended in the atmosphere as clouds or mist. Differential heating of the Earth’s surface by the sun is the driving force for air currents which control the distribution of atmospheric water around the Earth. Winds and air currents transport water vapour and clouds thousands of kilometres. When the moist air is cooled as a result of uplifting or interaction with a cold front, the water condenses into larger droplets or freezes into ice crystals. When these become large enough and heavy enough, the force of gravity causes them to fall to Earth as precipitation such as rain, hail, sleet or snow. Nace (1971) estimated that water spends an average of 10 days in the atmosphere before becoming precipitation. More than 80% of precipitation falls directly back into the ocean (Ward and Robinson, 1990), but a significant volume falls over land. Some precipitation may be evaporated before it reaches the ground, returning to the atmosphere as water vapour. Over land, the remaining precipitation usually falls on the ground surface or on vegetation. When rain falls on the leaves or branches of plants, some adheres to these surfaces as water droplets or as a thin film. A proportion will drip or flow down stems to the ground, with the remainder evaporating from the plant surface before it reaches the soil. The process of precipitation being returned to the atmosphere from these surfaces is called interception. Leaf litter and mulch on the ground can also intercept large volumes of precipitation. The amount of rain required to wet vegetation and leaf litter before the rain begins to drip off is called the interception storage capacity. During a particular rainfall event the amount of water intercepted and returned to the atmosphere by evaporation is known as the interception loss.

3: Hydrological cycle
-49-
Figure 3.1: Simplified example of the hydrological cycle
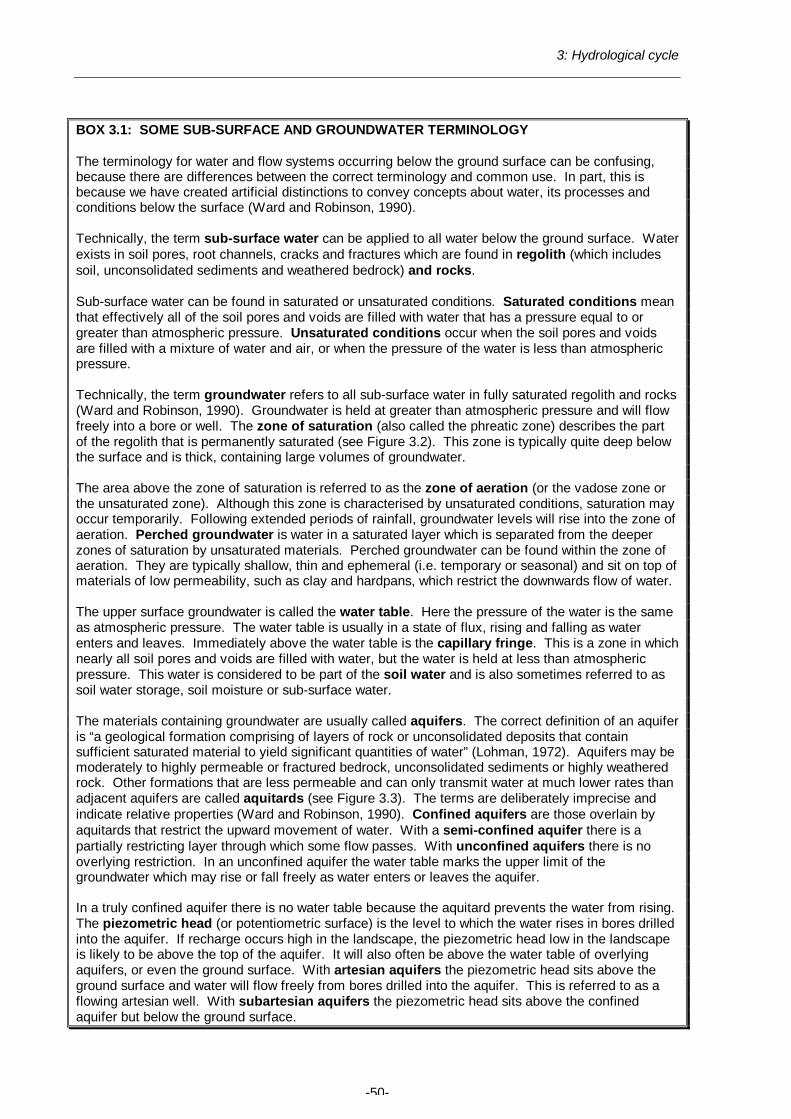
3: Hydrological cycle
-50-
BOX 3.1: SOME SUB-SURFACE AND GROUNDWATER TERMINOLOGY
The terminology for water and flow systems occurring below the ground surface can be confusing, because there are differences between the correct terminology and common use. In part, this is because we have created artificial distinctions to convey concepts about water, its processes and conditions below the surface (Ward and Robinson, 1990). Technically, the term sub-surface water can be applied to all water below the ground surface. Water exists in soil pores, root channels, cracks and fractures which are found in regolith (which includes soil, unconsolidated sediments and weathered bedrock) and rocks. Sub-surface water can be found in saturated or unsaturated conditions. Saturated conditions mean that effectively all of the soil pores and voids are filled with water that has a pressure equal to or greater than atmospheric pressure. Unsaturated conditions occur when the soil pores and voids are filled with a mixture of water and air, or when the pressure of the water is less than atmospheric pressure. Technically, the term groundwater refers to all sub-surface water in fully saturated regolith and rocks (Ward and Robinson, 1990). Groundwater is held at greater than atmospheric pressure and will flow freely into a bore or well. The zone of saturation (also called the phreatic zone) describes the part of the regolith that is permanently saturated (see Figure 3.2). This zone is typically quite deep below the surface and is thick, containing large volumes of groundwater. The area above the zone of saturation is referred to as the zone of aeration (or the vadose zone or the unsaturated zone). Although this zone is characterised by unsaturated conditions, saturation may occur temporarily. Following extended periods of rainfall, groundwater levels will rise into the zone of aeration. Perched groundwater is water in a saturated layer which is separated from the deeper zones of saturation by unsaturated materials. Perched groundwater can be found within the zone of aeration. They are typically shallow, thin and ephemeral (i.e. temporary or seasonal) and sit on top of materials of low permeability, such as clay and hardpans, which restrict the downwards flow of water. The upper surface groundwater is called the water table. Here the pressure of the water is the same as atmospheric pressure. The water table is usually in a state of flux, rising and falling as water enters and leaves. Immediately above the water table is the capillary fringe. This is a zone in which nearly all soil pores and voids are filled with water, but the water is held at less than atmospheric pressure. This water is considered to be part of the soil water and is also sometimes referred to as soil water storage, soil moisture or sub-surface water. The materials containing groundwater are usually called aquifers. The correct definition of an aquifer is “a geological formation comprising of layers of rock or unconsolidated deposits that contain sufficient saturated material to yield significant quantities of water” (Lohman, 1972). Aquifers may be moderately to highly permeable or fractured bedrock, unconsolidated sediments or highly weathered rock. Other formations that are less permeable and can only transmit water at much lower rates than adjacent aquifers are called aquitards (see Figure 3.3). The terms are deliberately imprecise and indicate relative properties (Ward and Robinson, 1990). Confined aquifers are those overlain by aquitards that restrict the upward movement of water. With a semi-confined aquifer there is a partially restricting layer through which some flow passes. With unconfined aquifers there is no overlying restriction. In an unconfined aquifer the water table marks the upper limit of the groundwater which may rise or fall freely as water enters or leaves the aquifer. In a truly confined aquifer there is no water table because the aquitard prevents the water from rising. The piezometric head (or potentiometric surface) is the level to which the water rises in bores drilled into the aquifer. If recharge occurs high in the landscape, the piezometric head low in the landscape is likely to be above the top of the aquifer. It will also often be above the water table of overlying aquifers, or even the ground surface. With artesian aquifers the piezometric head sits above the ground surface and water will flow freely from bores drilled into the aquifer. This is referred to as a flowing artesian well. With subartesian aquifers the piezometric head sits above the confined aquifer but below the ground surface.

3: Hydrological cycle
-51-
Precipitation that reaches the ground surface either infiltrates or becomes runoff or depression storage. Infiltration is the downward movement of water into the soil profile. The nature of the soil and its initial moisture status play an important role in determining the rate of infiltration. When the rate of precipitation exceeds the rate of infiltration, the excess water remains on the ground surface. Surface storage is the term used to describe the water that remains on the ground surface either as surface moisture or accumulated in depressions. Depression storage describes the situation where water accumulates in pools or puddles formed in depressions. Surface runoff (also known as overland flow) is the term used to describe water that flows downslope over the ground surface. Once water reaches the Earth’s surface it may be evaporated and returned to the atmosphere, held in storage or transported by one of three flow systems. These flow systems are: surface flows, temporary sub-surface flows and permanent groundwater flows. Gravity is the driving force behind these flow systems as water is guided down to the lowest point along the path of least resistance. Surface flow is the most visible of these processes because water is transported across the ground surface. This usually begins as runoff which occurs when surface storage areas have been filled. The patterns of the surface flow are determined by the shape and steepness of the land surface. Rills form where water begins to accumulate in small depressions. The rills often join together generating stream flow in creeks and rivers which may flow into lakes, swamps or inland seas, but often transport the water back to the oceans. Nace (1971) estimated that on average water spends about two weeks in river systems, but a period of months would be common in major river systems. Along the way some water will be lost by evaporation and there is likely to be some water entering and leaving from underlying groundwater. Streams are said to be gaining streams when there is a net flow of groundwater entering them. Where water is flowing from the stream into groundwater they are called losing streams. Temporary sub-surface flow describes the transport of soil water within the zone of aeration (see Box 3.1). This is water that has infiltrated into the ground but has not yet reached the zone of saturation. The water moves along pathways such as pores between soil particles, root channels and cracks and the flow may be saturated or unsaturated. Water flows in the zone of aeration are driven by gravity and degree of soil wetness. The permeability (see Box 3.2) of the soil determines the rate of flow. Texture is a major feature governing the permeability of a soil. Sandy soils generally have a high permeability (saturated hydraulic conductivity is >2.50 m/day) while clayey soils typically have a low permeability (saturated hydraulic conductivity is <0.25 m/day). Other factors such as soil structure, soil compaction and the presence of macropores, such as root channels, also play a major role in determining permeability. Percolation is water movement down through the profile. This water is often transported down to the water table. Throughflow is a lateral movement associated with perched groundwater. Here, water flows through a moderately to highly permeable soil material which is lying above an impeding layer and so the flow usually follows the slope of the ground surface. Where perched groundwater intersect the ground surface, throughflow can become return flow or seepage and can then evaporate or contribute to runoff. Where it intersects a stream, it becomes part of the stream flow. Unsaturated flows in the zone of aeration often occur in response to matric tension, or matric suction, which results from capillary forces (surface tension between water and air in the soil) and adsorption forces (which hold a thin film of water onto soil particles). These forces are independent of gravity and movement may be upwards, downwards or sideways, the water moving from areas of high potential to areas of low potential. They are more effective in fine-grained materials, like clay, than in coarse-grained materials such as sand.

3: Hydrological cycle
-52-
Figure 3.2: The zones of aeration and saturation Nace (1971) estimated that on average water spends between two weeks and a year as soil water. Plants play a major role in returning soil water to the atmosphere. Transpiration is the process by which water absorbed by the roots of a plant and transported through the plant is removed from the leaf surfaces by evaporation. Nace (1971) estimates that on average water spends less than a week in the biosphere (plants and animals). The term evapotranspiration is used to describe the transfer of soil water to the atmosphere from vegetated land through a combination of evaporation from soils and transpiration from plants. Direct energy from sunlight and the vapour pressure deficit are the two main forces driving evapotranspiration. Vapour pressure deficit is the evaporative demand of the atmosphere. Water vapour will move from areas of high concentration (or low deficit), such as inside the leaves of plants, to those areas of low concentration (or high deficit), such as air with low humidity. Permanent groundwater flow occurs in the zone of saturation. Water being added to the groundwater is called recharge. Recharge usually enters aquifers via the zone of aeration but can also enter directly where the groundwater is present at the ground surface. Leakage from surface water bodies such as lakes and rivers is another pathway of groundwater recharge. Unconfined aquifers are usually well connected with the surface and rainfall can recharge them relatively quickly. In confined aquifers recharge may occur a considerable distance away from the main body of water.
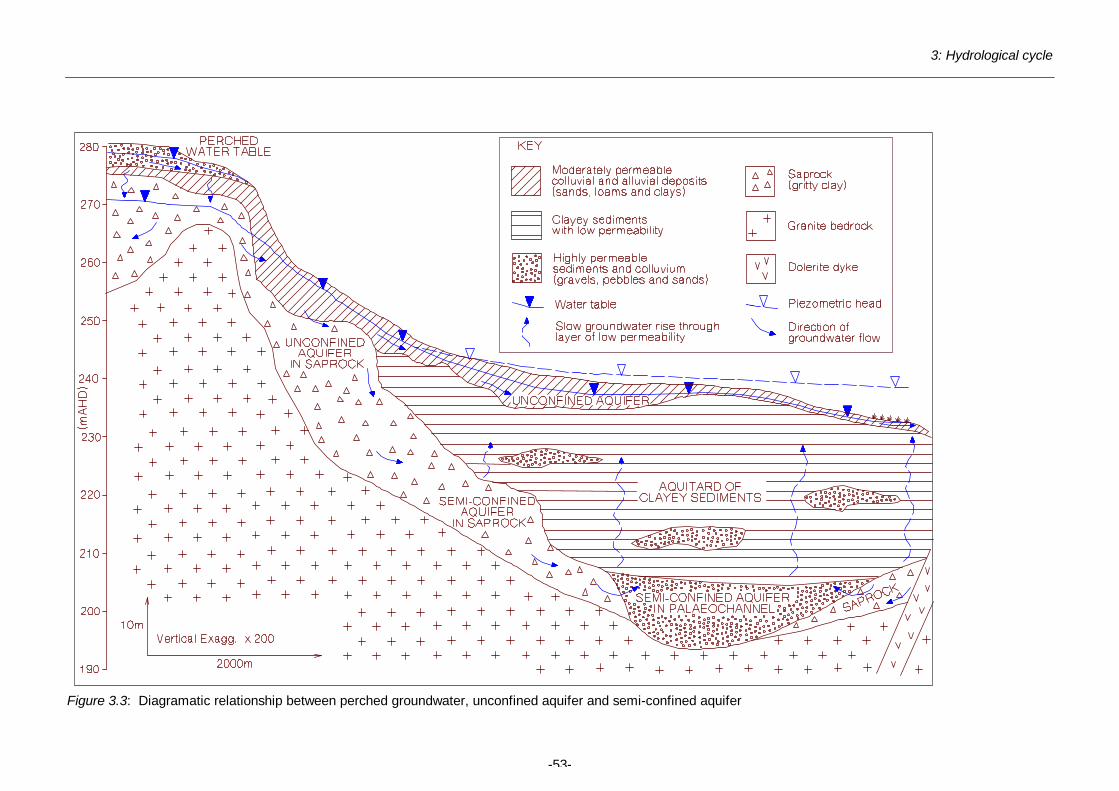
3: Hydrological cycle
-53-
Figure 3.3: Diagramatic relationship between perched groundwater, unconfined aquifer and semi-confined aquifer

3: Hydrological cycle
-54-
Groundwater may move vertically between aquifers within the saturated zone. Semi-confined aquifers are often recharged from overlying aquifers through pathways in an aquitard. Where the piezometric head of a confined aquifer is above the aquitard, this process can work in reverse with water flowing up into the overlying aquifer. Gravity is the major force driving the movement of groundwaters. In unconfined aquifers the effect of gravity may be indirect, with water moving horizontally or even upwards due to hydraulic pressure from water sitting in elevated parts of the aquifer. Lateral groundwater flow occurs where groundwater moves in a non-vertical direction (i.e. sideways instead of straight up or down). Lateral groundwater flows are typically more or less parallel to the ground surface, though this is not always the case. Water leaving a groundwater body is called discharge. Where the water returns to the surface as saturated flow driven by the hydraulic gradient it is referred to as active discharge or seepage (sometimes referred to as return flow or direct discharge). Examples of active discharge include areas where the aquifer intersects the ground surface such as springs, soaks, saline flats and some coastal lakes. Passive discharge (sometime referred to as diffuse discharge) describes the situation where groundwater rises to the surface indirectly via the capillary fringe. This upwards movement is called capillary rise and is due to matric suction maintained by evapotranspiration from the soil surface. Baseflow occurs where groundwater discharges directly into a stream or river. Groundwater may also discharge directly into the ocean, though the amount of discharge is very low compared to the outflow of rivers (Ward and Robinson, 1990). Although water in some aquifers can be millions of years old, Nace (1971) estimated that on average water spends between two weeks and 10,000 years in aquifers. Every component of the hydrological cycle around the globe is interconnected, either directly or indirectly. There are numerous complex pathways and interactions involved in the hydrological cycle. For example water may be lost from stream flow by evaporation, transpiration and percolation to groundwater. Seepage can be a major contributor to stream flow. Evaporation which returns surface waters to the atmosphere is a continual process, and water that falls on the land may go through a number of cycles of evaporation before it is returned to the ocean.
Discharge area on a valley floor near Boyup Brook (Western Woolbelt).

3: Hydrological cycle
-55-
BOX 3.2: SOME MORE SUB-SURFACE AND GROUNDWATER TERMINOLOGY The following terms describing relationships between sub-surface water and groundwater and the materials they inhabit are often used incorrectly, leading to confusion: Porosity is the degree to which a material is permeated with pores or cavities (i.e. how holey it is). The porosity of a soil, rock or aquifer is expressed as a ratio of the volume of the open pore spaces divided by the total volume of the material. This is usually written as a decimal fraction or a percentage. It indicates how much space is not occupied by solids and could be filled by water. There are two types of porosity. Primary porosity is controlled by the arrangement and sorting of the soil particles or rock matrix. The primary porosity of clay is about 0.6 and the primary porosity of sand is about 0.4. Secondary porosity is caused by cavities forming as the soil or rock dissolves (secondary solution) or fractures when it is intruded by roots and animals (macropores). Permeability is the capacity of a material to transmit a fluid such as water. A material that is highly permeable will have few restrictions to the passage of water, while a material with low permeability will provide major restrictions to the movement of water. However, it is important to remember that a material with a high porosity will not necessarily have a high permeability (for example, even though clays generally have a higher porosity than sands, they are less permeable because their pores are not interconnected and there are limited pathways for the flow of water). Permeability is a characteristic of the soil or rock only, and is not a measure of the speed at which water passes through the material (see hydraulic conductivity below). Hydraulic conductivity is the measure of the potential rate of flow of a fluid through soil or rock. As such it takes into account the nature of the fluid, the degree of saturation and the permeability of the material the fluid passes through. Hydraulic conductivity is expressed in units of length per unit of time, typically millimetres per hour (mm/hour) or metres per day (m/day), and can be used to measure the volume of fluid that can pass through a cross-sectional area of soil or rock. The hydraulic conductivity of a material can be measured in either the saturated or unsaturated states. Unsaturated hydraulic conductivity changes as a material becomes wetter, but the saturated hydraulic conductivity of a material remains constant. The hydraulic conductivity of a material with low porosity and high permeability will be high. Transmissivity is the rate at which water is transmitted through a one metre wide slice across the entire depth of an aquifer. It is recorded as square metres per day (m2/day). As it takes into account the thickness of the aquifer it provides a better comparison of possible yields of aquifers than saturated hydraulic conductivity. For example, an aquifer that is one metre thick with a saturated hydraulic conductivity of 1 m/day will have a transmissivity of 1 m2/day, while an aquifer that is five metres thick and has the same saturated hydraulic conductivity will have a transmissivity of 5 m2/day. Hydraulic gradient is the slope of a water table or piezometric head (see Box 3.1) and provides a measure of the force of gravity driving the movement of water within aquifers. Hydraulic gradient can be measured by comparing the water level in two or more piezometers that have been drilled into the same groundwater system and is expressed in metres per metre (m/m) obtained by dividing the difference in water level by the distance between the piezometers. The hydraulic gradient is usually lower than the slope gradient of the overlying land surface. The amount of water moved within an aquifer is a function of the transmissivity of the aquifer and its hydraulic gradient. For example an aquifer with a transmissivity of 5 m2/day and a hydraulic gradient of 0.01 m/m (i.e 1 metre fall over 100 metres) will have a flow of 0.05 m3/day (18.25 m3/year). Infiltration rate is the rate at which water enters soil. Like hydraulic conductivity, the infiltration rate of a soil is expressed in units of depth and time (usually mm/hour) and, like unsaturated conductivity, it will vary over time as the rate of application of water and the degree of saturation of the soil change. Infiltration capacity is the maximum rate at which water can soak into, or be absorbed by, a soil. It assumes that the rate of water application is not limiting infiltration, but will vary with the degree of saturation of the soil. Saturated (or steady state) infiltration is the rate at which water can enter a fully saturated soil. If there are no surface barriers to infiltration, such as surface crusts or non-wetting properties, and no drainage impediments it will be the same as the saturated hydraulic conductivity of the topsoil. Infiltration excess runoff occurs when the amount of water falling on the ground exceeds the infiltration capacity. Saturation excess runoff occurs under conditions of restricted drainage when the soil is already saturated preventing further infiltration.
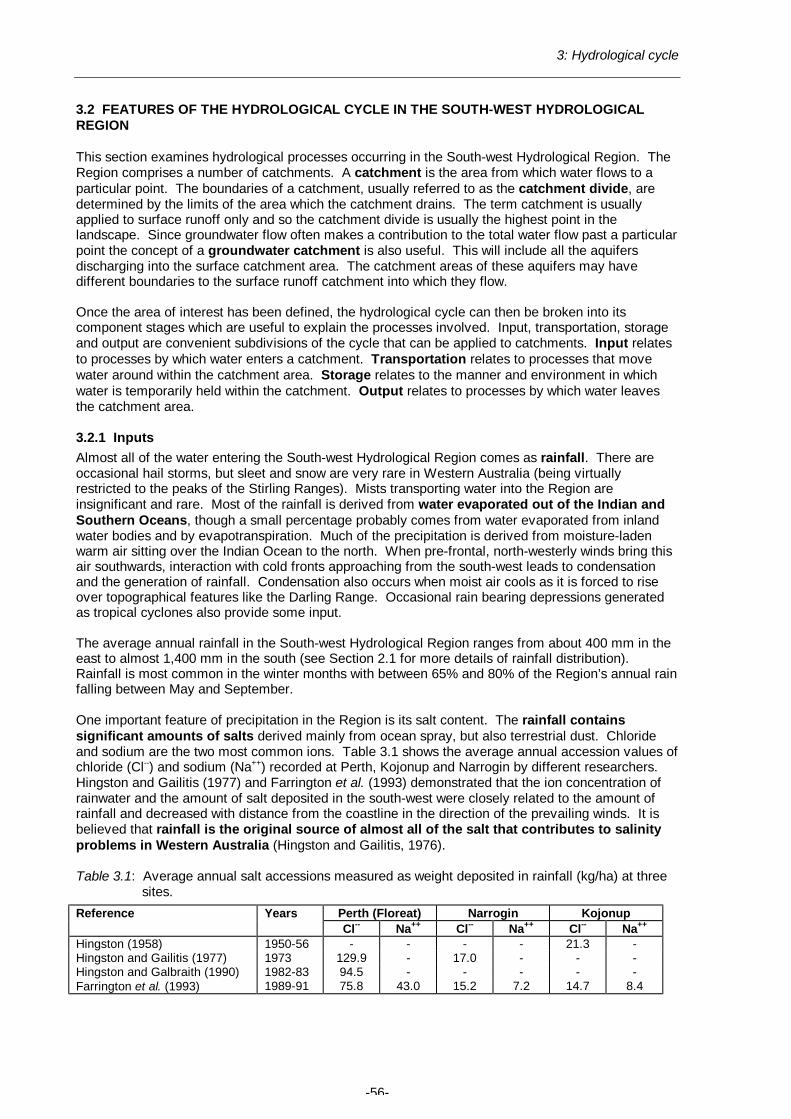
3: Hydrological cycle
-56-
3.2 FEATURES OF THE HYDROLOGICAL CYCLE IN THE SOUTH-WEST HYDROLOGICAL REGION
This section examines hydrological processes occurring in the South-west Hydrological Region. The Region comprises a number of catchments. A catchment is the area from which water flows to a particular point. The boundaries of a catchment, usually referred to as the catchment divide, are determined by the limits of the area which the catchment drains. The term catchment is usually applied to surface runoff only and so the catchment divide is usually the highest point in the landscape. Since groundwater flow often makes a contribution to the total water flow past a particular point the concept of a groundwater catchment is also useful. This will include all the aquifers discharging into the surface catchment area. The catchment areas of these aquifers may have different boundaries to the surface runoff catchment into which they flow. Once the area of interest has been defined, the hydrological cycle can then be broken into its component stages which are useful to explain the processes involved. Input, transportation, storage and output are convenient subdivisions of the cycle that can be applied to catchments. Input relates to processes by which water enters a catchment. Transportation relates to processes that move water around within the catchment area. Storage relates to the manner and environment in which water is temporarily held within the catchment. Output relates to processes by which water leaves the catchment area. 3.2.1 Inputs Almost all of the water entering the South-west Hydrological Region comes as rainfall. There are occasional hail storms, but sleet and snow are very rare in Western Australia (being virtually restricted to the peaks of the Stirling Ranges). Mists transporting water into the Region are insignificant and rare. Most of the rainfall is derived from water evaporated out of the Indian and Southern Oceans, though a small percentage probably comes from water evaporated from inland water bodies and by evapotranspiration. Much of the precipitation is derived from moisture-laden warm air sitting over the Indian Ocean to the north. When pre-frontal, north-westerly winds bring this air southwards, interaction with cold fronts approaching from the south-west leads to condensation and the generation of rainfall. Condensation also occurs when moist air cools as it is forced to rise over topographical features like the Darling Range. Occasional rain bearing depressions generated as tropical cyclones also provide some input. The average annual rainfall in the South-west Hydrological Region ranges from about 400 mm in the east to almost 1,400 mm in the south (see Section 2.1 for more details of rainfall distribution). Rainfall is most common in the winter months with between 65% and 80% of the Region’s annual rain falling between May and September. One important feature of precipitation in the Region is its salt content. The rainfall contains significant amounts of salts derived mainly from ocean spray, but also terrestrial dust. Chloride and sodium are the two most common ions. Table 3.1 shows the average annual accession values of chloride (Cl--) and sodium (Na++) recorded at Perth, Kojonup and Narrogin by different researchers. Hingston and Gailitis (1977) and Farrington et al. (1993) demonstrated that the ion concentration of rainwater and the amount of salt deposited in the south-west were closely related to the amount of rainfall and decreased with distance from the coastline in the direction of the prevailing winds. It is believed that rainfall is the original source of almost all of the salt that contributes to salinity problems in Western Australia (Hingston and Gailitis, 1976). Table 3.1: Average annual salt accessions measured as weight deposited in rainfall (kg/ha) at three
sites. Reference Years Perth (Floreat) Narrogin Kojonup Cl-- Na++ Cl-- Na++ Cl-- Na++ Hingston (1958) 1950-56 - - - - 21.3 - Hingston and Gailitis (1977) 1973 129.9 - 17.0 - - - Hingston and Galbraith (1990) 1982-83 94.5 - - - - - Farrington et al. (1993) 1989-91 75.8 43.0 15.2 7.2 14.7 8.4

3: Hydrological cycle
-57-
BOX 3.3: GROUNDWATER FLOW VELOCITY AND VOLUMES
Terms such as “groundwater flows” often form a misleading impression, creating visions of “underground rivers” behaving in a comparable way to the major river systems on the surface. Images of water moving rapidly in the ground below our feet are further enhanced when people attend field days and see water gushing out of old root channels in freshly dug soil pits. It needs to be understood that conditions underneath the land surface are very different to those on top. The movement of groundwater is rarely comparable to water flow in pipes - it is typically much slower (Table 3.4). The amount of water contained in aquifers far exceeds the volume of water stored on the surface. However, while it is quite common for runoff to flow down a slope from a hilltop to the valley floor within a couple of hours or less, it will take a few years to a number of centuries for groundwater which is 10 m below the ground surface to travel the same distance (see Table 3.6) . Estimates suggest that, over the entire Blackwood Basin, average annual runoff is four times as great as annual groundwater recharge (Schofield et al., 1988 and Western Australian Water Resources Council, 1984). The rate and velocity of groundwater flow are controlled by aquifer conductivity and the hydraulic gradient. The saturated hydraulic conductivity (see Box 3.2) of aquifers is generally low (Table 3.3) because they are composed mostly of solid particles, and groundwater flow is restricted to pores that are interconnected. In clayey materials the pores are extremely small, while in sands they are several orders of magnitude larger. In all cases the pores are arranged in such a way as to form a narrow twisting pathway for the water to follow. Not only is there a lot of surface drag slowing the water molecules down, but they must make many diversions and detours instead of flowing in a straight line. The flow rate is limited by the most restricting sections of the pathway (i.e. the parts of the aquifer with the lowest saturated hydraulic conductivity), which can form blockages similar to a dam on a river. Water in the old tree root channels is often virtually stationary, as the root channel is a “dead end” if it does not extend into a highly permeable material. Cutting through the root channel in a backhoe pit is like “bursting the dam wall”. It is important to realise that the groundwater flow rate in an aquifer is usually considerably less than the saturated hydraulic conductivity of that aquifer would suggest. This is because flows in the aquifer are lateral rather than vertical and the hydraulic gradient (the slope of the water table - see Box 3.2) is usually very low. For example, groundwater in a saprock aquifer with a saturated hydraulic conductivity of 0.5 m/day (and a porosity of 0.2) will only flow 0.025 m/day if the hydraulic gradient is 0.01, or 0.013 m/day if the hydraulic gradient is 0.005. The hydraulic gradient is typically less than the ground slope gradient (see Figure 3.4) so the force driving groundwater flow is usually smaller than that driving surface water flows. Estimates of lateral groundwater flow velocity in the various zones of the South-west Hydrological Region are presented in Table 3.4. Flows are generally much faster in macropores such as old tree roots channels than in the primary pores in the soil or aquifer, because the root channels offer a more direct pathway and less surface drag. With the exception of solution channels in limestone, macropores are more likely to carry percolating water and recharge than lateral flows in aquifers. The flows through macropores are often short lived. The fact that groundwater flows are usually very slow does not necessarily mean that it will take a long time for a hydrological change upslope to have an impact downslope. Additional recharge at the top of the flow system will increase the hydraulic pressure on water lower in the landscape by increasing the hydraulic gradient. This can lead to more discharge on a valley floor, even though the recently recharged water will remain near the top of the hill for many years. This is, in many ways, similar to what happens when briefly turning on a tap connected to a full garden hose. The water that first flows out of the end of the hose is not the water that has just come out of the tap. It is the water that was sitting in the hose before the tap was turned on, and it was displaced by the additional water entering the hose.

3: Hydrological cycle
-58-
There is also some input of water to the Region directly from the oceans. Tidal flows ensure a regular exchange of water between the ocean and estuaries such as the Peel-Harvey, Leschenault and Hardy Inlet. Sea water may also penetrate into aquifers following extended periods of low recharge or heavy extraction of groundwater. 3.2.2 Transportation Transport of water within the South-west Hydrological Region can be divided into surface and sub-surface processes. Figure 3.4 is a schematic representation of some of these processes operating on a hypothetical hillslope in the Western Woolbelt (average rainfall 600 mm, slope gradient 5% and sandy duplex soil). It provides an indication of the relative volumes of water involved in the various processes, as well as a comparison of maximum rates of water movement. The volumes will change from year to year depending on the timing and intensity of rainfall. Significant variation between slopes within an area can also be expected.
Figure 3.4: Surface and groundwater flow rates and velocities1 on a typical hillslope receiving
600 mm of rainfall in the Western Woolbelt
1 The comparative runoff and recharge volumes for this hillslope differ from the estimate in Box 3.3 of runoff in the Blackwood Basin being four times as great as annual groundwater recharge. This is partly due to the fact that a significant area of the Blackwood Basin lies in higher rainfall districts. The different scale of the flow systems involved is also an important factor. The figure above only shows part of a local flow system on a hillslope and does not includes valley floors where discharge is occurring and runoff quickly generated. The Blackwood basin is a large regional flow system.

3: Hydrological cycle
-59-
Surface processes Infiltration occurs to some extent over most the landscape during rainfall. High rates are experienced on certain areas such as sand patches and gravelly plateau remnants. Infiltration rates in these areas are often reduced early in the season due to the hydrophobic (non-wetting) nature of the sandy topsoils. Areas of depression storage where surface water ponds also often experience significant infiltration. Surface water movement is commonly initiated as runoff. The rate of overall catchment runoff currently ranges between 4% of rainfall in the Wheatbelt to 15% of rainfall in parts of the Forested Hills (George and Bennett, 1998). Runoff rates can be higher than 50% of rainfall on individual sites such as poorly drained clays on the Swan Coastal Plain or rock outcrops. On hill slopes, runoff typically only transports water for short distances (up to a couple of hundred metres) and has a limited duration (a few minutes up to a few hours) until the water either enters a surface storage, evaporates, infiltrates or converges in drainage lines to become stream flow. On the valley floors that have no defined drainage lines in the east of the Region, broad sheets of water can move tens of kilometres over a period of several days. Runoff is most common during winter when high rainfall results in infiltration excess runoff and waterlogging leads to saturation excess runoff (see Box 3.2). The intensity and duration of rainfall events has a significant influence on the amount of runoff generated. The amount of water that falls during a brief, light shower may not be enough to exceed the infiltration rate, but a longer event of the same intensity can saturate the ground and start runoff. A short event of high intensity can generate a similar volume of runoff within a shorter period. Infiltration excess runoff also occurs when rain falls on surfaces with low permeability such as rock outcrops, heavy clays and compacted soils. Non-wetting sands also limit infiltration early in the season in many parts of the Region. Runoff is also more likely on steep or long slopes than on short, gentle ones. Surface roughness influences the speed at which runoff moves and the time available for infiltration. Extreme cases of infiltration excess runoff can occur during summer storms because of the intense rainfall and reduced infiltration rates on hardsetting or non-wetting soils. The relative lack of vegetation in paddocks is also a factor in summer runoff as there is little surface roughness to slow water movement and allow time for infiltration. Stream flow occurs where runoff converges in drainage lines. Streams and rivers rapidly transport the large volumes of water (over 5 billion m3 of water per year) long distances (sometimes more than 200 km) through the South-west Hydrological Region. Somewhere between 0.2-0.5% of the total rainfall across the Region ends up in the rivers resulting in an average runoff rate of 20 mm/year (Schofield et al., 1988). Most of the stream flow is ephemeral, drying up in the summer months. Permanent stream flow is restricted to: the larger rivers, streams in high rainfall coastal areas and watercourses fed by groundwater. Sub-surface processes As discussed above, the rate at which water infiltrates the soil profile can vary markedly depending on the nature of the topsoil and terrain. The rate of water percolation down the profile is also variable. Rapid percolation is experienced in deep sands and gravels. Tables 3.2 and 3.3 provide an indication of the saturated hydraulic conductivity, which determines percolation rates, of a variety of soil and regolith materials common in the South-west Hydrological Region. In the duplex soils which cover much of the Region, clayey subsoils form a major barrier to percolation and so water movement is often restricted to preferred pathways, such as old root channels or quartz seams. In areas that supported jarrah forest there is often an extensive network of root channels feeding water deep into the profile and recharging aquifers in the saprock (Johnson et al., 1983). In lateritic profiles (see Box 2.1) formed on granite, the saturated hydraulic conductivity is usually in the range of 0.05-0.25 m/day in the mottled zone (depending on the soil structure and presence of root channels), around 0.08 m/day in the pallid zone and around 0.7 m/day in the underlying saprock (due to its gritty nature).
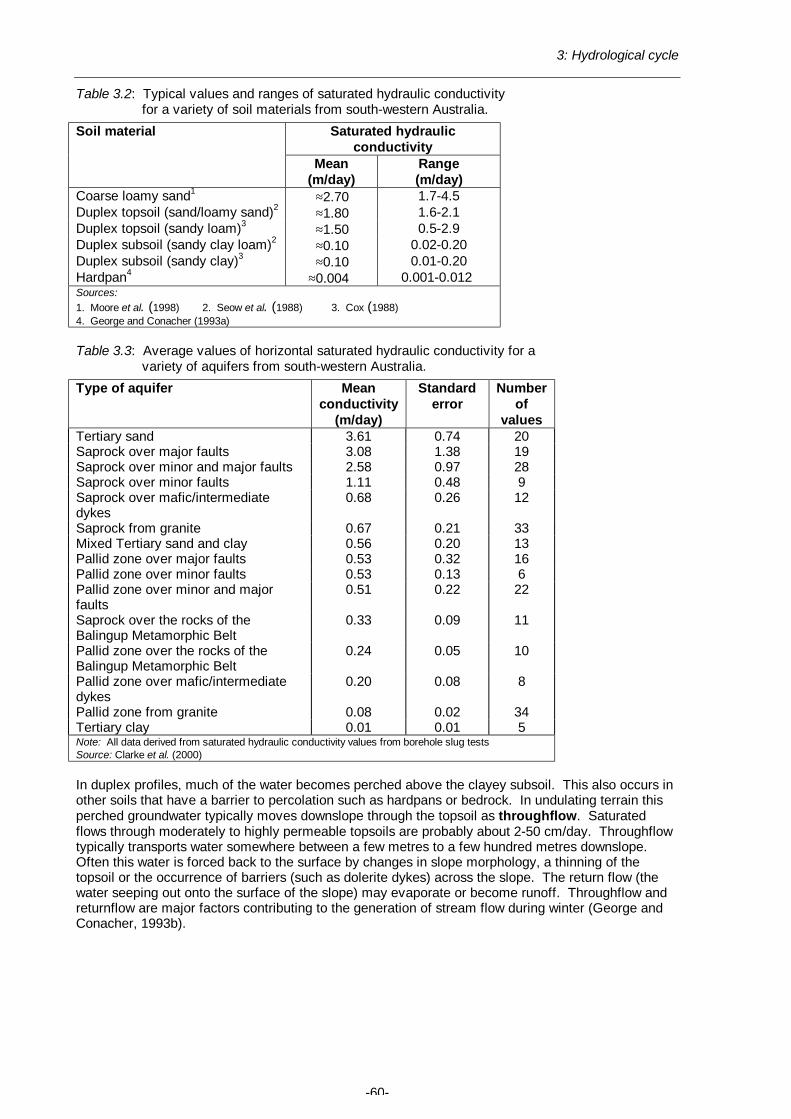
3: Hydrological cycle
-60-
Table 3.2: Typical values and ranges of saturated hydraulic conductivity for a variety of soil materials from south-western Australia.
Saturated hydraulic conductivity
Soil material
Mean (m/day)
Range (m/day)
Coarse loamy sand1 ≈2.70 1.7-4.5 Duplex topsoil (sand/loamy sand)2 ≈1.80 1.6-2.1 Duplex topsoil (sandy loam)3 ≈1.50 0.5-2.9 Duplex subsoil (sandy clay loam)2 ≈0.10 0.02-0.20 Duplex subsoil (sandy clay)3 ≈0.10 0.01-0.20 Hardpan4 ≈0.004 0.001-0.012 Sources: 1. Moore et al. (1998) 2. Seow et al. (1988) 3. Cox (1988) 4. George and Conacher (1993a) Table 3.3: Average values of horizontal saturated hydraulic conductivity for a
variety of aquifers from south-western Australia. Type of aquifer Mean
conductivity (m/day)
Standard error
Number of
values Tertiary sand 3.61 0.74 20 Saprock over major faults 3.08 1.38 19 Saprock over minor and major faults 2.58 0.97 28 Saprock over minor faults 1.11 0.48 9 Saprock over mafic/intermediate dykes
0.68 0.26 12
Saprock from granite 0.67 0.21 33 Mixed Tertiary sand and clay 0.56 0.20 13 Pallid zone over major faults 0.53 0.32 16 Pallid zone over minor faults 0.53 0.13 6 Pallid zone over minor and major faults
0.51 0.22 22
Saprock over the rocks of the Balingup Metamorphic Belt
0.33 0.09 11
Pallid zone over the rocks of the Balingup Metamorphic Belt
0.24 0.05 10
Pallid zone over mafic/intermediate dykes
0.20 0.08 8
Pallid zone from granite 0.08 0.02 34 Tertiary clay 0.01 0.01 5 Note: All data derived from saturated hydraulic conductivity values from borehole slug tests Source: Clarke et al. (2000) In duplex profiles, much of the water becomes perched above the clayey subsoil. This also occurs in other soils that have a barrier to percolation such as hardpans or bedrock. In undulating terrain this perched groundwater typically moves downslope through the topsoil as throughflow. Saturated flows through moderately to highly permeable topsoils are probably about 2-50 cm/day. Throughflow typically transports water somewhere between a few metres to a few hundred metres downslope. Often this water is forced back to the surface by changes in slope morphology, a thinning of the topsoil or the occurrence of barriers (such as dolerite dykes) across the slope. The return flow (the water seeping out onto the surface of the slope) may evaporate or become runoff. Throughflow and returnflow are major factors contributing to the generation of stream flow during winter (George and Conacher, 1993b).

3: Hydrological cycle
-61-
Lateral groundwater flow within the zone of saturation occurs at regional, intermediate and local scales (Coram, 1998): • Regional flow systems (Figure 3.5) transport permanent groundwater long distances, typically
through confined or semi-confined aquifers in sedimentary deposits which can be several hundred metres thick. Regional flow systems in the South-west Hydrological Region are confined to the major sedimentary basins. Large volumes of water travel up to 50 km through aquifers in the Perth Basin from recharge areas in the Donnybrook Sunklands to groundwater discharge areas on the Swan Coastal Plain behind Busselton.
Figure 3.5: Discharge from a regional flow system (from George et al. 1997)

3: Hydrological cycle
-62-
• Intermediate flow systems (Figures 3.6-3.8) transport water shorter distances, typically about 5-
10 km, and may cross surface catchment boundaries. Intermediate flow systems are typically found in areas of lower relief with long slopes and broad valley floors, such as the Wheatbelt where they commonly occur in saprock aquifers. In both Woolbelts, intermediate flow systems also occur in sedimentary aquifers of palaeochannels, such as in the Towerrinning-Darlingup sub-catchments (George et al. 1994), and fractured rock aquifers where faults and shear zones in the bedrock can act as pipelines or channels such as in the Date Creek sub-catchment (Clarke et al., 1998).
Figures 3.6-3.8: Discharge from typical intermediate flow systems in the South-west Hydrological
Region (from George et al. 1997) Note: Although, the flow system shown in Figure 3.8, occurs at a intermediate scale (mostly in the Wheatbelt and Eastern Woolbelt) it is more common at a local scale.
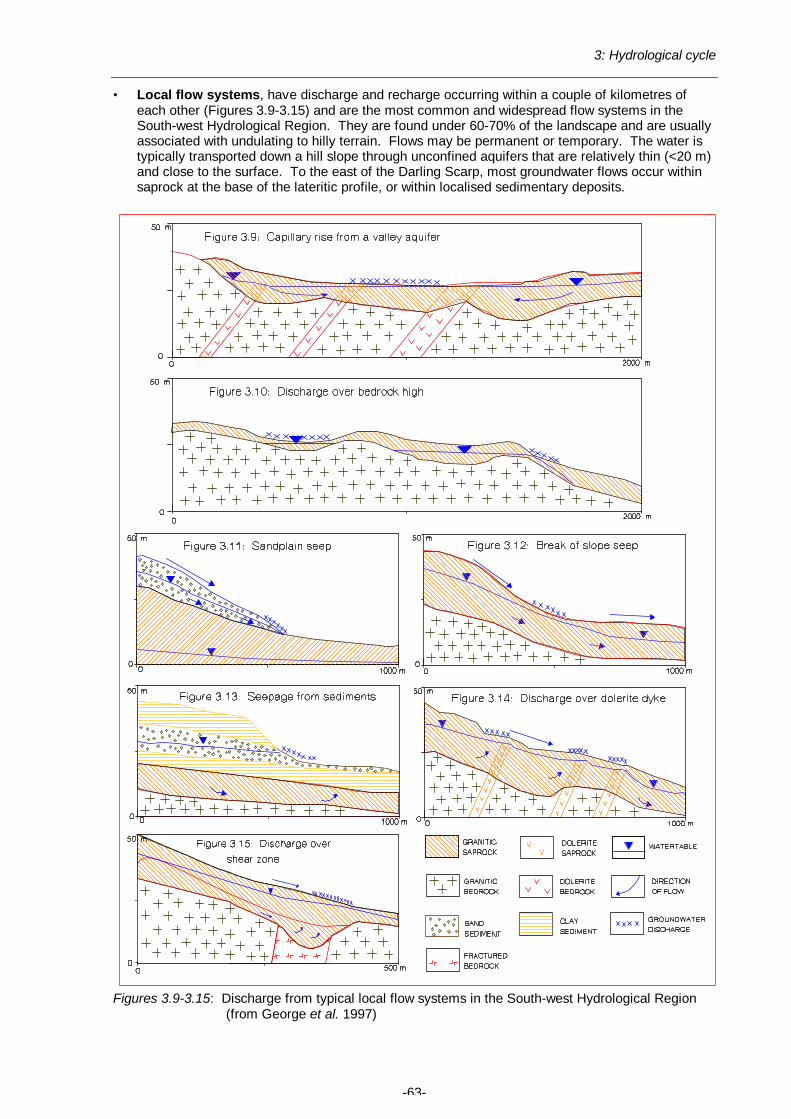
3: Hydrological cycle
-63-
• Local flow systems, have discharge and recharge occurring within a couple of kilometres of each other (Figures 3.9-3.15) and are the most common and widespread flow systems in the South-west Hydrological Region. They are found under 60-70% of the landscape and are usually associated with undulating to hilly terrain. Flows may be permanent or temporary. The water is typically transported down a hill slope through unconfined aquifers that are relatively thin (<20 m) and close to the surface. To the east of the Darling Scarp, most groundwater flows occur within saprock at the base of the lateritic profile, or within localised sedimentary deposits.
Figures 3.9-3.15: Discharge from typical local flow systems in the South-west Hydrological Region
(from George et al. 1997)

3: Hydrological cycle
-64-
Within any given area, all three groundwater flow systems may be operating at the same time. Local flow systems often overlie intermediate or regional systems, and intermediate systems often overlie regional systems. Table 4.2, in the following section, summarises the flow systems prevalent in the different hydrological zones. The velocity of lateral groundwater flow is generally slow but can be quite variable, being influenced by aquifer hydraulic conductivity (Table 3.3) and the hydraulic gradients (see Box 3.3). Estimates of lateral groundwater flow velocity (based on typical saturated conductivities and hydraulic gradients) through the various flow systems in the region are presented in Table 3.4. Flow velocity is quickest in aquifers with high conductivity (Tertiary sand or saprock formed over major faults). Flow velocities are also generally quicker in the valleys of the Forested Hills and Western Woolbelt where the steeper slopes result in higher hydraulic gradients. Table 3.4: Estimated velocities of lateral groundwater flow in some typical flow
systems in the zones of the South-west Hydrological Region. Flow system Velocity of lateral groundwater flow (m/year) Wheatbelt Eastern
Woolbelt Western Woolbelt
Forested Hills
Coastal Plains
Discharge from semi-confined aquifers (Figure 3.6)
0.01-1.00 0.01-1.00 0.02-2.00 n.a. 0.01-1.00
Capillary rise from valley aquifers (Figures 3.8 and 3.9)
0.01-1.00 0.02-2.00 0.03-2.5 0.03-2.5 n.a.
Break of slope seep (Figure 3.12)
0.2-2.0 0.3-2.5 0.5-5.0 1-10 n.a.
Discharge over bedrock highs (Figure 3.10)
0.2-2.0 0.3-2.5 0.5-5.0 1-10 n.a.
Discharge over dolerite dykes (Figure 3.14)
0.2-2.0 0.3-2.5 0.5-5.0 1-10 n.a.
Seepage from sediments (Figure 3.13)
n.a. n.a. 0.5-25.0 0.5-25.0 n.a.
Discharge over shear zones (Figure 3.15)
2.0-7.5 2.5-15.0 0.5-35.0 1-100 n.a.
Sandplain seep (Figure 3.11) 2-10 5-20 5-25 5-50 5-50 Discharge from fractured rock aquifers (Figure 3.7)
2-20 5-40 5-50 5-50 n.a.
Discharge from regional flow systems (Figure 3.5)
n.a. n.a. n.a. 5-50 5-50
Most groundwater flowing to the east of the Darling Scarp is eventually returned to the surface as discharge. Discharge is most active following winter rains, but can occur throughout the year. In many cases capillary rise above water tables results in passive discharge. An interesting phenomenon in the Region is the suppression of the capillary fringe due to high atmospheric pressure during summer. Towards the end of summer, as the barometric pressure begins to fall, the fringe is able to rise to the surface once more. At the same time, evaporation rates begin to decline so that water leaves the soil as liquid rather than vapour and so seeps commence flowing before the onset of winter rains. Discharge from hillside seeps is common and widespread throughout both Woolbelts, the Forested Hills, and to a lesser extent, the Wheatbelt. The discharge is usually associated with local flow systems and often occurs where the groundwater flow is forced to the surface by a barrier , such as: • bedrock highs (Figure 3.10), • dolerite dykes (Figure 3.14), • shear zones (Figure 3.15), and • quartz veins.

3: Hydrological cycle
-65-
Other hillside seeps include: • seepage from sediments (where valleys have cut through the contact between an aquifer with
high permeability and the underlying sediments with low permeability– Figure 3.13), • sandplain seeps (where water flows from the base of sandy or gravelly deposits upslope - Figure
3.11) and • break of slope seeps (where water is forced to the surface by a thinning of the aquifer near the
foot of the slope - Figure 3.12). Discharge on valley floors is also associated with local flow systems, but it is often the discharge from intermediate flow systems that results in the extensive waterlogging and salinity found on valley flats in the Wheatbelt and both Woolbelts. Discharge on valley floors includes: • capillary rise from valley aquifers (Figures 3.8 and 3.9) in sediments or saprock, • seepage and flows from semi-confined sedimentary aquifers (Figure 3.6) and • flows, seepage and passive discharge from fractured rock aquifers (Figure 3.7). While discharge associated with the local flow systems is the most widespread and common form of discharge, it generally affects relatively small, discrete areas. Discharge from the intermediate flow systems tends to cover larger areas. For example, in a catchment there may be ten small hillside seeps covering a total of 15 ha, but there may be a single groundwater discharge area of 35 ha on the valley floor. Table 3.5 presents estimates of agricultural land in the South-west Hydrological Region that is affected by each type of discharge. Passive discharge, in the form of capillary rise and subsequent evaporation from valley aquifers, accounts for over half of the total area of discharge in the South-west Hydrological Region. Most of the capillary rise from valley aquifers would be driven by flow systems operating over distances of 1-2 km. The capillary fringe can be less than 50 cm thick in sandy materials, but over 200 cm thick in clays. Break of slope seeps and discharge from semi-confined aquifers are the most common forms of active discharge. It should be remembered that two or more types of discharge may be operating simultaneously on the same piece of land. Table 3.5: Estimates of the proportional area of discharge on agricultural land in the South-
west Hydrological Region. Type of discharge Proportion of total
area of discharge Capillary rise from valley aquifers – intermediate flow system (Figure 3.9)
40-60%
Capillary rise from valley aquifers – regional flow system (Figure 3.8)
5-15%
Discharge from semi-confined aquifers (Figure 3.6)
5-15%
Break of slope seep (Figure 3.12) 5-15% Discharge from regional flow systems (Figure 3.5) 2-5% Discharge over bedrock highs (Figure 3.10) 2-5% Sandplain seep (Figure 3.11) 2-5% Seepage from sediments (Figure 3.13) 2-5% Discharge over dolerite dykes (Figure 3.14) 2-5% Discharge from fractured rock aquifers (Figure 3.7)
<2%
Discharge over shear zones (Figure 3.15) <2% Table 3.6 shows of how long it takes for water to flow the entire length of flow systems. These calculations are based on the flow velocity estimates presented in Table 3.4 and estimates of the typical lengths of the flow systems. This table is intended as a general guide only and there will be greater variations than shown. However, the figures indicate that water is likely to remain in the most common flow systems for hundreds or thousands of years. The main exception is in the Forested Hills, where water travels through the systems more quickly due to a combination of the shorter distances and higher flow velocity. Table 3.6: Estimated time (in years) for groundwater to travel the entire length of some typical flow
systems in the South-west Hydrological Region. Time (in years)

3: Hydrological cycle
-66-
Flow system Wheatbelt Eastern Woolbelt
Western Woolbelt
Forested Hills Coastal Plains
Capillary rise from valley aquifers – intermediate flow system (Figure 3.9)
1,000-10,000+ 500-10,000+ 200-10,000+ 10-10,000+ n.a.
Capillary rise from valley aquifers – regional flow system (Figure 3.8)
3,000-10,000+ 1,000-10,000+ 300-10,000+ 300-10,000+ n.a.
Discharge from semi-confined aquifers (Figure 3.6)
10,000+ 8,000-10,000+ 1,000-10,000+ n.a. 10,000+
Break of slope seep (Figure 3.12)
500-5,000 250-2,500 150-1,500 30-300 n.a.
Discharge from regional flow systems (Figure 3.5)
n.a. n.a. n.a. 250-3,000 250-3,000
Discharge over bedrock highs (Figure 3.10)
400-4,000 200-2,000 150-1,500 20-200 n.a.
Sandplain seep (Figure 3.11)
30-150 15-75 10-35 5-25 1-5
Seepage from sediments (Figure 3.13)
n.a. n.a. 75-3,000 75-3,000 n.a.
Discharge over dolerite dykes (Figure 3.14)
400-4,000 200-2,000 150-1,500 20-200 n.a.
Discharge from fractured rock aquifers (Figure 3.7)
50-500 15-150 10-100 5-55 n.a.
Discharge over shear zones (Figure 3.15)
150-500 50-250 15-1,500 5-500 n.a.
Water as a transport medium The importance of the processes described above extends beyond just the movement of water. The water provides the medium by which a variety of materials are transported and redistributed around the South-west Hydrological Region. Section 3.2.1 discusses how solutes such as salt are brought into the Region by rainfall. Salts already present in the landscape are dissolved by water and carried by runoff, streams or sub-surface flows, resulting in a net movement of salt towards areas of water storage. Where rainfall is high and soils are highly permeable, as is the case in coastal sand dunes, salts are rapidly leached away. Where water flows into and out of storages (such as aquifers and lakes) at similar rates the salinity levels of the water remain fairly constant. However, where there is significant output of water through evaporation, as tends to be the case in low rainfall districts, more salt enters the storages than leaves and so high concentrations of salts can accumulate. In the Wheatbelt and both Woolbelts especially, salt is being redistributed from recharge areas and is accumulating on valley floors. The salt lakes of the Wheatbelt are a good example of this process. There is less the potential for the accumulation of salt in the groundwater where water passes quickly through flow systems. The most saline groundwater is found in regional and intermediate flow systems in the Wheatbelt. Water takes thousands of years to cycle through these systems (Table 3.6). Fresher groundwater is characteristic of the local flow systems, such as sandplain seeps with quicker flows and shorter distances to travel (Tables 3.5 and 3.6). Other solutes such nitrates and phosphates are also transported by water. Non-soluble materials such as sediment are transported in suspension, mainly by runoff and stream flow. Not only does this play a major role in the redistributing materials around the landscape, but it also plays a major role in shaping the landscape through erosion and deposition. Water also plays a major role in the distribution of living organisms such as algae and bacteria.

3: Hydrological cycle
-67-
3.2.3 Storage Water is stored in a variety of environments in the South-west Hydrological Region: Sub-surface storage Groundwater (occurring in the zone of saturation - see Box 3.1) comprises the greatest volume of stored water in the Region and storages are situated throughout the Region. Aquifer thickness, storage volumes and water quality vary greatly. The Western Australian Water Resources Council (1984) recognised three types of aquifers. Aquifers in unconsolidated sediments cover about 10% of the Region. They are most extensive on the Coastal Plains and are typically 5-50 m thick. Many of these aquifers are unconfined or semi-confined and occur in sandy sediments found in dune systems, valley floors and alluvial plains throughout the Region. Water salinity in these sediments is typically in the range of 250-2,500 mg/L but can be much higher, exceeding 15,000 mg/L. Storage in these aquifers fluctuates with seasonal conditions. Aquifers in consolidated sedimentary rocks cover about 15% of the Region and can be more than 1,000 m thick. They are found mostly to the west of the Darling Scarp in the Perth Basin underlying the Coastal Plains and western Forested Hills. These aquifers are often confined and there may be a sequence of aquifers and aquitards. Water salinity is typically in the range 250-10,000 mg/L. Some of the water in these aquifers may be 10,000 years old. Aquifers in fractured and weathered rocks cover about 85% of the Region. They are most common in the crystalline rocks of the Yilgarn Block, Albany Fraser Orogen and Leeuwin Complex underlying the Wheatbelt, Woolbelt and Forested Hills. On a regional scale, fractured rock aquifers are found in metamorphic and gneissic bedrock. Locally, they are found in geological structures such as faults, shear zones and dykes. The distribution of these fractures is scattered and relatively small amounts of water are stored. Weathered rock aquifers are more extensive and contain a large proportion of the groundwater east of the Darling Fault. Water is stored in both the saprock and weathered pallid zone of the lateritic profile or its remnants, however most water is transported in the lower saprock aquifer. The saprock aquifers are typically about 0.5-5.0 m thick and located beneath as much as 20 m of pallid zone materials. Storage in the upper aquifers fluctuates with seasonal conditions. Water salinity in both types of aquifers is often in the range of 2,000-25,000 mg/L, with a general trend towards increasing salinity with decreasing rainfall. Fresh water aquifers are found in high rainfall districts close to the coast. While the total volume of soil water stored in the South-west Hydrological Region would be small compared to groundwater storage, the ratio between the two varies greatly from place to place. On the Swan Coastal Plain, the volume of soil water is minute in comparison to the groundwater stored in the Perth Basin sediments and surficial aquifers. In contrast, soil water may comprise the majority of the sub-surface storage on a rocky hill in the Woolbelt. The amount of soil water stored will depend on profile depth (to bedrock or a water table), soil texture (Table 3.7) and vegetative cover (affecting water use). Deeply weathered lateritic profiles may hold substantial amounts of water. A 20 m deep profile in the Darling Range may hold as much as 8,000 litres of soil water under each square metre of land (in both saturated and unsaturated conditions) if not dried out by deep-rooted vegetation (Paul Raper, pers. comm.). The amount of soil water stored in the top few metres of the profile fluctuates, being depleted by evapotranspiration during summer and increasing with infiltration following the onset of the winter rains. This trend is less pronounced under annual pastures than under deep-rooted trees, where many metres of soil may be dried out. Table 3.7: Water storage and potential recharge in different soil materials.
Soil texture Saturated water storage (mm/m)
Field capacity1
(mm/m)
Potential recharge contribution2
(mm/m) Sands 330-420 100-200 200-300 Loams 320-460 300-430 20-30
3: Hydrological cycle
-68-
Clays 380-460 375-450 5-10 1. The amount of water remaining after a saturated soil is allowed to drain freely. 2. The difference between saturated water storage and field capacity. This is the amount of water that will
contribute to groundwater recharge if not otherwise intercepted. Data supplied by: Paul Raper, Agriculture Western Australia, Bunbury Surface water storage The amount of surface water stored in the South-west Hydrological Region is relatively small when compared to the combined volume of groundwater and soil water. Surface storages range from small temporary puddles, which last only a few hours after rainfall, to major water bodies such as estuaries or permanent lakes. There are a number of lakes scattered throughout the Region, most being relatively shallow. The largest, natural inland water body is Lake Muir (approximately 4,500 ha). Most of the larger natural water bodies are either saline (e.g. Lake Dumbleyung) or becoming saline (e.g. Lake Toolibin). Water and salinity levels in the lakes fluctuate seasonally, and there are many ephemeral lakes which dry out completely over the summer. While permanent coastal lakes are usually fresh (e.g. Lake Jasper), some (e.g. Lake Clifton) are quite saline. There are also numerous swamps scattered throughout the Region, most commonly in coastal areas. Artificial water bodies, reservoirs, have been created by damming rivers and creeks. Most of the larger reservoirs have catchment areas in the Forested Hills and so the water is fresh. These include Lake Banksiadale (South Dandalup Dam), Serpentine Reservoir and Stirling Dam. Wellington Dam has a catchment area extending well into the Western Woolbelt and stores water of marginal quality. There are also numerous small farm dams throughout the Region ranging in capacity from 1,000-350,000 m3. The coastal inlets and estuaries contain significant volumes of water, with the Peel-Harvey Estuary being the largest surface water body in the South-West Hydrological Region. Water in the estuaries is saline in summer due to tidal influences. Some estuaries become brackish or fresh in winter as the input from rivers increase. The biota Water storage in plants and animals is minor and temporary when compared to the amount of water present in surface and sub-surface storages. According to Nace (1971) and Ward and Robinson (1990), the biosphere accounts for approximately 0.01% of all water stored on land (i.e. all water excluding that present in oceans, icecaps and the atmosphere). Trees and shrubs in the Forested Hills contain a large proportion of the water stored in the biota in the South-West Hydrological Region. 3.2.4 Output Much of the water leaving the South-west Hydrological Region is lost by evaporation. Average annual pan evaporation ranges from 1,000 mm in the south-west to 1,900 mm in the north-east and is considerably higher than rainfall over much of the Region (see Section 2.1). Evaporative losses can be subdivided into three categories; Interception loss Some of the water entering the Region is lost even before it reaches the soil surface because it is intercepted. Williamson et al. (1987) found that interception accounts for 10-13% of the rain falling on areas of eucalypt forest at Collie. Greenwood et al. (1985) recorded interception losses of 16-37% from 5 year old eucalypt plantations at Bannister, the higher value due to the denser canopy cover of young trees. Nulsen et al. (1986) recorded interception losses of 3% in mallee woodlands in the Wheatbelt. Under farming systems the interception rates are lower and seasonally variable. They usually range between 5 and 10% depending on the nature of the crop or pasture and its performance. Evapotranspiration Evapotranspiration plays an important role in removing water from the South-west Hydrological Region. Evapotranspiration rates vary greatly depending on interactions between vegetative cover, climatic conditions and sub-surface water storage. Evaporation is greatest in the Wheatbelt, which experiences low rainfall, few rainy days, many hours of sunshine and high summer temperatures. An additional factor increasing evaporation in the Wheatbelt is the long wind runs due to the low

3: Hydrological cycle
-69-
topographic relief and extensive clearing of native vegetation. In areas of high rainfall, such as the southern Forested Hills, the greater soil water stores and extensive forests contribute to high evapotranspiration rates. In soils with a good water stores in the root zone, transpiration can take place throughout the year. However, only limited summer transpiration is possible from soils with poor water holding capacities, or where water tables are beyond the reach of plant roots. Conversely, evapotranspiration rates are often low where plant growth is restricted by excess soil water, especially in winter when waterlogging is most severe and evaporative demand is at its lowest. Poor plant growth further reduces evapotranspiration when waterlogging and salinity are combined. Table 3.8: Comparative evapotranspiration rates. Vegetation Evapotranspiration
(mm/year) Rainfall
(mm/year) Annual pasture1 159-501 650 Barley1 211-554 650 Wheat1 229-450 650 Lupins1 230-580 650 Canola1 254-585 650 Phalaris1 261-553 650 Oats1 264-583 650 Lucerne1 281-608 650 Eucalyptus microcarpa2 710-873 771 Sources: 1. Scott and Sudmeyer, 1993 2. Hookey et al., 1987 The nature of the vegetative cover is a crucial factor in evapotranspiration rates. Not only are there significant variations in the amount of water that different plants are able to transpire, but plant densities, rooting depths and seasonal growth patterns all play an important role. Native trees and shrubs have a perennial canopy and are able to extract soil water from deep in the profile due to their well developed root systems. This results in a greater potential evapotranspiration than is common from agricultural plants. Evapotranspiration from the canopies of tall trees is driven by vapour pressure deficits more than direct solar radiation. Solar energy is the major force driving evapotranspiration in low, dense agricultural pastures where poor ventilation constrains the transfer of water vapour to the atmosphere. Nulsen et al. (1986) concluded that annual evapotranspiration rates from Wheatbelt mallee and heath vegetation were similar to the amounts of rainfall received. Marshall (1993) estimated that evapotranspiration over a year from an intact jarrah forest at Dwellingup was 1,368 mm, which was 108% of the rainfall during the period measurements were taken. The evapotranspiration comprised: • 191 mm (14%) intercepted by trees, • 542 mm (40%) transpired by trees, • 432 mm (32%) of evapotranspiration from understory species, litter and soil, and • 203 mm (15%) of evapotranspiration from midstorey species. Farrington et al. (1992) demonstrated that evapotranspiration rates from a native heath/shrubland community in the Wheatbelt were lower than those from a lupin crop during the growing season. However, after mid-spring the lupins ceased to transpire while evapotranspiration continued from the native vegetation throughout the summer and autumn. Greenwood and Beresford (1982) found that evapotranspiration rates from regenerating wandoo woodland at Collie were almost twice as high as those from annual pastures. According to Raper (1998), the values obtained by Greenwood et al. (1985) at Bannister which suggested that 5 year old eucalypt plantations had evapotranspiration rates more than three times higher than annual rainfall and seven times the evapotranspiration rate of annual pastures are likely to be significant overestimates. Hookey et al. (1987) calculated eucalypt water use at Collie to mostly be in the range of 500-900 mm/year. A summary of evapotranspiration rates of trees, crops and pastures in the Collie district are presented in Table 3.8. Surface water evaporation The evaporation of surface waters is a significantly smaller component of output than evapotranspiration, because surface waters cover only a fraction of the Region’s landscape. Evaporation takes place from water bodies including lakes (e.g. Lakes Muir, Dumbleyung, Towerrinning, Preston and Jasper), reservoirs (e.g. Wellington Dam, Serpentine Reservoir), estuaries

3: Hydrological cycle
-70-
(Walpole, Broke and Hardy Inlets, Leschenault and Peel-Harvey Estuaries), rivers and farm dams. Just under a half of this water loss takes place during the three summer months, and 75-80% of evaporation occurs from October to April. Outflow The other main form of water output from the South-west Hydrological Region is via outflow. Surface drainage systems discharge into the oceans either directly or indirectly. South of Cape Naturaliste, most rivers drain into the ocean through natural river mouths or inlets. The Margaret, Donnelly, Warren and Gardner Rivers enter the Indian or Southern oceans directly, while the Blackwood, Scott, Shannon, Deep, Frankland, Kent and Denmark Rivers enter the Southern Ocean indirectly via estuaries and inlets. On the Swan Coastal Plain many of the rivers enter the Indian Ocean through a mixture of natural and artificial outlets. Some or all of the flows of the Harvey, Capel, Carbunup and Vasse Rivers have been diverted and enter the ocean via artificial drains. The Serpentine, Murray, Collie and Preston Rivers enter the ocean indirectly via the inlets (sometimes through artificial cuts). A number of aquifers discharge water into the ocean. The most significant groundwater discharge areas are west of the coastlines of the Swan and Scott Coastal Plains. Urban water supply and treatment schemes are another form of outflow. In towns like Bunbury and Busselton, water is pumped from the Yarragadee aquifer for domestic and industrial use. Much of this water is eventually discharged into the ocean via waste water outfalls.

3: Hydrological cycle
-71-
3.3 THE IMPACTS OF LAND USE CHANGES ON THE HYDROLOGICAL CYCLE
The impact of land use practices on the hydrological cycle have resulted in major environmental changes in south-western Australia. We can only make conjectures about the hydrological changes that resulted tens of thousands of year ago when the first aboriginal settlers, the Noongars, altered the ecological balance through their hunting activities and widespread use of fire. The effects of the past 150 years of European settlement are much more obvious. 3.3.1 The effect of clearing on the water balance The water balance The water balance relates to the relationship between input, storage and output within a hydrological system. If the amount of water entering the system as input is the same as the amount leaving as output, then storage remains constant and the system can be considered to be in balance. Where input exceeds output, the water balance becomes altered and the amount of water storage in the system increases. The balance can also be altered if storage decreases in response to output exceeding input. The water balance of a system (e.g. a catchment area) can be expressed as an equation for a volume of water over a given time period: DW+DG=R-(Q+A+E+I) where: • DW is the change in water storage in the unsaturated zone, • DG is the change in water storage in the saturated zone. • R is rainfall entering the system, • Q is stream flow leaving the system, • A is groundwater flow leaving the system, • E is all other evaporation from surface water and evapotranspiration from soil and plants, and • I is water lost through interception. If DW+DG is a positive value, the volume of groundwater is increasing and there is net recharge. If DW+DG is a negative value, there is a net depletion or drawdown of groundwater. The effect of clearing One of the first activities undertaken by the European settlers was clearing the native vegetation to allow for agricultural development. This clearing commenced with the establishment of settlements at Augusta and Mandurah in 1830 and has continued, at varying rates, to the present day. With the exception of the Forested Hills, which are dominated by State Forest, the native forests, woodlands and heaths which once covered the South-west Hydrological Region have largely been replaced by agricultural pastures and crops. There are insufficient data available to state conclusively that widespread clearing has reduced rainfall in the Region. However, although they only store a small fraction of the total water present in the South-west Hydrological Region, plants play a major role in determining water distribution through the process of evapotranspiration (E in the equation above) and significant hydrological changes result when native vegetation is replaced by agricultural plants. The introduced crops and pastures use significantly less water than native species (see Section 3.2.4 and Table 3.8). Not only is the total biomass present on agricultural land dramatically smaller than that in native bushland, but most agricultural crop and pastures in the Region have annual life cycles and do not use water during summer. Their root systems are also very shallow when compared to native trees and shrubs and so they are unable to access water from great depths. The reduction in evapotranspiration since clearing has resulted in increased recharge rates. Recharge in forests receiving 750-1,250 mm/year rainfall increased from 0.05-3.70 mm/year before clearing to 23-65 mm/year after clearing (Peck and Hurle, 1976; Williamson et al., 1987). Where average rainfall is 350 mm/year recharge rates have increased from <0.01-0.1 mm/year to at least 6-10 mm/year (George, 1992). Figure 3.16 shows results from 60 case studies documenting the magnitude of recharge change due to clearing in Western Australia. Recharge rates under native vegetation are considerably lower than

3: Hydrological cycle
-72-
under agricultural lands, irrespective of the rainfall. In fact there is 1 mm or less recharge under native bush in areas that receive less than 500 mm of rain per year, but 10-50 mm in agricultural areas with similar rainfall.
Figure 3.16: The relationship between annual rainfall and recharge under native vegetation and agriculture in Western Australia (from: Hatton and George, in press)
The higher recharge rates have resulted in increased groundwater storage. Groundwater levels away from discharge areas are rising at 0.05-0.50 m/year in the Wheatbelt and Eastern Woolbelt and 0.15-1.50 m/year in the Western Woolbelt (Ferdowsian et al., 1996). Rises of 2 m/year have been recorded on upland plateaux in the Western Woolbelt (George and Bennett, 1998). Elsewhere, saturated zones now exist in soil profiles that contained no groundwater before clearing. One consequence of rising water tables has been an increase in discharge, with rates of existing discharge increasing, passive groundwater discharge areas becoming active and an expansion of the area affected by discharge. This trend is most noticeable on valley floors and as many of the water tables are saline, the extent and severity of dryland salinity has increased dramatically. Clearing the native vegetation has also led to a decrease in interception, by dramatically reducing the total surface area of plants available to intercept rainfall before it reaches the ground. This decrease in interception loss is partly compensated for by higher soil evaporation rates. Increased runoff rates are a result of the reduction in the ground cover that slows the movement of surface water and promotes infiltration. Clearing and cultivation have also resulted in soil compaction which contributes to runoff (Nulsen, 1993). Higher runoff has resulted in increased rates of erosion and greater stream flow following rain leading to a greater incidence of flooding.
Relationship between annual rainfall and recharge
y = 7.8619e0.0025x
R2 = 0.5554
y = 0.0336e0.0059x
R2 = 0.8705
0.01
0.1
1
10
100
1000
200 400 600 800 1000 1200 1400
Annual Rainfall (mm)
Recharge agricultureRecharge nativeExpon. (Recharge agriculture)Expon. (Recharge native)

3: Hydrological cycle
-73-
BOX 3.4: PREHISTORICAL GROUNDWATER FLUCTUATIONS
The recent rise in water table levels caused by clearing the natural vegetation equates with previous changes that occurred well before European settlement. Throughout prehistory, climatic changes in southern Australia (see Section 2.1.5) have resulted in significant alterations to the water balance and, as a result, in changes to vegetation patterns (George et al., 1999). Periods of ‘aridity’ lead to the development of a sparser vegetative cover (e.g. changing from forest to woodland, woodland to semi-arid shrubland or from shrubland to desert) which uses less water than the previous vegetation. In addition, as a result of sporadic wet phases during arid cycles (or the onset of wetter ‘pluvial’ periods) the amount of recharge increases until the plant’s use of water catches up. The resultant rise in the saline water tables during these phases further changes the vegetation communities in low lying areas. The effect of climatic changes on groundwaters in Australia over the past 60,000 years has been studied in some detail in southern Australia. For example, reconstructions of the palaeo-hydrology of north-western Victoria by Bowler et al. (1976) and Bowler and Teller (1986) suggest that there have been at least four periods of high water tables, occurring 36,000, 24,000, 6,000 and 1,000 years ago. The pollen record shows that during these periods the distribution of vegetation changed across southern Australia (Bowler et al., 1976). Lithologic evidence shows that during periods of elevated groundwater levels salinity developed across land previously covered by perennial woody vegetation (Macumber, 1978). Today we see the consequences of these previous climate cycles expressed in geomorphic features such as salt lakes, lunettes and saline ‘plains’, as are found on the Beaufort and Coblinine Rivers. We also see them in ‘fresh’ ecological islands of endemic species on the rises and rocky outcrops and by the existence of some of the world’s most salt tolerant ‘valley loving’ plant communities. All of these are in some way connected to periods of high water tables in the past. Changes to the water balance resulting from clearing are demonstrated by two experimental catchments in the Collie River Catchment area. Clearing took place in both catchments in 1976 and water balance parameters were monitored (Williamson et al., 1987). The results presented in Table 3.9 show data for two year of similar rainfall, the first before clearing, and the second five years after clearing. In both catchments interception decreased dramatically, evaporation increased slightly and recharge in the saturated zone increased significantly. Table 3.9: The effect of clearing on the water balance.
Measurements in Wight’s Catchment Lemon’s Catchment Mm/year Two years
before clearing
Five years after
clearing
Change Two years before
clearing
Five years after
clearing
Change
Rainfall (R) 1326 1347 +2%* 976 990 +1% Interception (I) 170 0 -100% 98 46 -50% Evaporation (E) 779 822 +6% 844 886 +5% Stream flow (Q) 320 481 +50% 48 46 -4% Groundwater flow (A) <1 <1 - <0.05 <0.05 - Recharge in the: unsaturated zone (DW) 30 NA - -14 NA - saturated zone (DG) 27 44 +63% >-1 12 +1,300% * This change is statistically insignificant. Adapted from: Williamson et al., 1987

3: Hydrological cycle
-74-
3.3.2 Other hydrological changes There are a variety of other hydrological changes that have occurred in the South-west Hydrological Region since European settlement: Stream flows Increased runoff rates have resulted in increased stream flows. The damming of water courses to form artificial water storages has had a significant effect on stream flows. Dams range from small earthen tanks of 1,000 m3 capacity to major reservoirs such as Wellington Dam (184,900,000 m3 capacity). A proportion of the water stored in these dams is diverted away from the water course. While small dams are typically used for on-farm irrigation or stock watering, water from the larger reservoirs is often transported great distances for irrigation or urban water supplies. For example, up to 70 million m3 of water from Serpentine Reservoir and Lake Banksiadale (South Dandalup) is piped to the Perth Metropolitan area each year. Artificial drainage systems have altered where water flows within the region. Irrigation channels at the foot of the Darling Scarp transport water from river systems to farms, sometimes crossing catchment boundaries. Much of the water flowing down the Harvey River is carried to the Indian Ocean at Myalup, via the irrigation system and a diversion drain, rather than following the original river course to the Harvey Estuary. A network of drains on the Swan Coastal Plain have largely replaced the original watercourses. Sedimentation resulting from erosion has also altered the nature of natural water courses and stream flows. Freshwater aquifer supplies The use of bores to supply water for agriculture, industry and domestic use has resulted in the drawdown of freshwater aquifers where extraction exceeds recharge rates. The drawdown of surficial aquifers on the coastal plain sometimes results in wetlands drying up. Over-pumping coastal aquifers can result in saltwater intrusion. In the Collie Basin, subsidence has resulted when aquifers have been over-pumped. Water quality The most significant effect on water quality has been increasing salinity levels that have resulted from increased recharge rates and rising saline water tables (Schofield et al., 1988). Previously fresh streams, lakes, wells and soaks throughout the South-west Hydrological Region are now too saline for irrigation or stock use, with the Wheatbelt and Woollbelt being worst affected. Wood (1924) documents increasing salinity levels in the Blackwood River at Bridgetown in the early part of the 20th century. In 1904, the salinity level was about 150 mg/L. Between 1914 and 1917 the levels had increased (ranging from 300-1,500 mg/L, mostly over 700 mg/L) as a result of widespread clearing in the catchment. Salinity levels in the Blackwood are now about 3,000 mg/L. Other problems include the eutrophication of water bodies due to leaching of fertilisers and addition of nutrients from other sources, and contamination of water supplies from chemicals added to the environment. Microbial pollution of surface and groundwater has also resulted from the disposal of effluent.
3: Hydrological cycle
-75-
3.4 REFERENCES
Bowler, J.M. and Teller, J.T. (1986). Quaternary evaporites and hydrological change, Lake Tyrrell, north-west Victoria. Australian Journal of Earth Sciences 33: 43-63.
Bowler, J.M., Hope, G.S., Jennings, J.N., Singh, G, and Walker, D. (1976). Late Quaternary climates of Australia and New Guinea. Quaternary Research 6: 359-394.
Clarke, C.J., George, R.J., Bell, R.W. and Hobbs, R.J. (1998). Major faults and the development of dryland salinity in the western wheatbelt of Western Australia. Hydrology and Earth System Sciences 2: 77-91.
Clarke, C.J., George, R.J., Bennett, D.L., Bell, R.W. (2000). Geologically related variations in saturated hydraulic conductivity in the regolith of the western wheatbelt of Western Australia and its implications for the development of dryland salinity. Australian Journal of Soil Research 38: 555-568.
Coram, J. (editor) (1998). National classification of catchments for land and river salinity control. Water and salinity issues in Agroforestry No. 3, Rural Industries Research and Development Corporation Publication No. 98/78.
Cox, J. W. (1988). Seepage interceptor drainage on duplex soils in south-western Australia. Ph.D. Thesis, Geology Department, The University of Western Australia.
Farrington, P., Salama, R.B., Bartle, G.A. and Watson, G.D. (1992). Water use of agricultural and native plants in a Western Australian wheatbelt catchment. Agricultural Water Management 22: 357-367.
Farrington, P., Salama, R.B., Bartle, G.A. and Watson, G.D. (1993). Accession of major ions in rainfall in the South Western Region of Western Australia. CSIRO Division of Water Resources Divisional Report No. 93/1.
Ferdowsian, R., George, R.J., Lewis, M.F., McFarlane, D., Short, R. and Speed, R. (1996). The extent of dryland salinity in Western Australia. In: Proceedings of the National Workshop on the productive use and rehabilitation of saline lands, 4th, Albany, Western Australia, 1996. Canning Bridge, Promac Conventions Pty. Ltd. pp. 89-98.
George, R.J. (1992). Estimating and modifying the effects of agricultural development on the groundwater balance of large wheatbelt catchments. Applied Hydrology 1/92: 42-54.
George, R.J. and Bennett, D.L. (1998). South-West and Upper Great Southern Region. In: ‘Groundwater trends in the agricultural area of Western Australia’ (ed. R. Nulsen), Agriculture Western Australia, Resource Management Technical Report No. 173.
George, R.J. and Conacher, A.J. (1993a). Interactions between perched and saprolite aquifers on a small, salt affected and deeply weathered hillslope. Earth Surface Processes and Landforms 18: 91-108.
George, R.J. and Conacher, A.J. (1993b). Mechanisms responsible for streamflow generation on a small, salt affected and deeply weathered hillslope. Earth Surface Processes and Landforms 18: 291-309.
George, R.J., Cochrane, D.L. and Bennett, D.L. (1994). Groundwater systems responsible for dryland salinity in the Lake Towerrinning catchment, Western Australia. In: ‘Water Down Under ’94 - Volume 2: Groundwater Papers’. Institution of Engineers Australia, Canberra.
George, R.J., McFarlane, D.J. and Nulsen, R.A. (1997). Salinity threatens the viability of agriculture and ecosystems in Western Australia. Hydrogeology Journal 5: 6-21.
George, R.J., Nulsen, R.A., Ferdowsian, R., and Raper, P. (1999). Interactions between trees and groundwaters in recharge and discharge areas - A survey of Western Australian sites. Agricultural Water Management 39: 91-113.
Greenwood, E.A.N. and Beresford, J.D. (1982). Evaporation from vegetation in landscapes developing secondary salinity using the ventilated chamber technique. 4. Evaporation from regenerating forest of Eucalyptus wandoo on land formerly cleared for agriculture. Journal of Hydrology 58: 357-366.
Greenwood, E.A.N., Klein, L., Beresford, J.D. and Watson, G.D. (1985). Differences in annual evaporation between grazed pasture and Eucalyptus species in plantations on a saline farm catchment. Journal of Hydrology 78: 261-278.
Hatton, T. and George, R.J. (in press) The role of afforestation in managing dryland salinity. In: Plantations, Farm Forests and Water. CSIRO Forestry and Forest Products, Agriculture, Fisheries and Forestry - Australia (AFFA), Joint Venture Agroforestry Program (JVAP). E.K.S. Nambiar (ed.). Proceedings of Workshop held on 20-21 July 2000.
Hingston, F.J. (1958). The major ions in Western Australian rainwaters. CSIRO Division of Soils, Divisional Report No. 1/58.
Hingston, F.J. and Gailitis, V. (1976). The geographic variation of salt precipitated over Western Australia. Australian Journal of Soil Research 14: 319-335.
Hingston, F.J. and Gailitis, V. (1977). Salts in the rainfall in Western Australia. CSIRO Division of Land Resources Management, Technical Memorandum No. 77/1.
Hingston, F.J. and Galbraith (1990). Salt impaction at near coastal locations and possible effects on grapevines in south-west of Western Australia. Agricultural Ecosystems Environment 32: 199-212.
Hookey, G.R., Loh, I.C. and Bartle, J.R. (1987). Water use of Eucalypts above saline groundwater. Water Authority of Western Australia, Hydrology Branch Report No. WH 32, Perth.
Johnson, C.D., Hurle, D.H., Hudson, D.R. and Height, M.I. (1983). Water movement through preferred paths in lateritic profiles of the Darling Plateau, Western Australia. CSIRO Division of Groundwater Research, Technical Paper No. 1.

3: Hydrological cycle
-76-
Lohman, S.W. (chairman) (1972). Definition of selected groundwater terms – revisions and conceptual refinements: Report of the Committee on the redefinition of groundwater terms. United States Geological Survey Water Supply Paper 1988.
Macumber, P.G. (1978). Interrelationships between physiography, hydrology, sedimentation and salinisation of the Loddon River plains, Australia. Journal of Hydrology 7: 39-57.
Marshall, J.K. (1993). Year long water uptake by jarrah (Eucalyptus marginata) in intact jarrah forest. In: Water issues in forests today, International Symposium on Forest Hydrology, Canberra.
Moore, G., Hall, D. and Russell, J. (1998). Soil water. In: ‘Soilguide - A handbook for understanding and managing agricultural soils’. (ed. G. Moore). Agriculture Western Australia, Bulletin No. 4343. pp. 80-93.
Nace, R.L. (editor) (1971). Scientific framework of world water balance. UNESCO Technical Papers on Hydrology 7.
Nulsen, R.A. (1993). Changes in soil properties. In: ‘Reintegrating fragmented landscapes - towards sustainable production and nature conservation’. (eds R.J. Hobbs and D.A. Saunders), Springer-Verlag, New York. pp. 107-145.
Nulsen, R.A., Bligh, K.J., Baxter, I.N., Solin, E.J. and Imrie, D.H. (1986). The fate of rainfall in a mallee and heath vegetated catchment in south-western Australia. Australian Journal of Ecology 11: 361-371.
Peck, A.J. and Hurle, D.H. (1976). Chloride balance of some farmed and forested catchments in south-western Australia. Water Resources Research 3: 648-657.
Raper, G.P. (1998). Agroforestry water use in Mediterranean regions of Australia. Water and salinity issues in Agroforestry No. 2, Rural Industries Research and Development Corporation Publication No. 98/63.
Schofield, N.J, Ruprecht, J.K. and Loh, I.C. (1988). The impact of agricultural development on the salinity of surface water resources of south-west Western Australia. Surface Water Branch Report No. WS27, Water Authority of Western Australia.
Scott, P.R. and Sudmeyer R.A. (1993). Evapotranspiration from agricultural plant communities in the high rainfall zone of the south-west of Western Australia. Journal of Hydrology 146: 301-319.
Seow, J.E.H., Gilkes, R.J., Alymore, L.A.G. and Mulcahy, M.J. (1988). Textural and hydraulic properties of some soils in the Narrogin area of south-western Australia. In: ‘Management of Western Australian Soils’. Australian Society of Soil Science (W.A. branch) Wembley, Western Australia. pp. 61-71.
Speidel, D.H. and Agnew, A.F. (1982). Water. In: ‘The natural geochemistry of our environment’. Westview Press, Boulder, Colorado.
Ward, R.C. and Robinson, M. (1990). ‘Principles of hydrology’ (3rd edition). McGraw-Hill, Maidenhead, England.
Western Australian Water Resources Council (1984). Groundwater resources of Western Australia. In: ‘Water resources and water use’ – Appendix B. Western Australian Water Resources Council Publication No. WRC 1/84.
Williamson, D.R., Stokes, R.A. and Ruprecht, J.K. (1987). Response of input and output of water and chloride to clearing for agriculture. In: ‘Hydrology and salinity in the Collie River Basin, Western Australia’. (eds A.J. Peck and D.R. Williamson). Journal of Hydrology 94: 1-28.
Wood, E.W. (1924). Increase in salt in soil and streams following the destruction of the native vegetation. Journal of Royal Society, Western Australia 10: 35-47.

4: Hydrological zones
-77-
4. THE HYDROLOGICAL ZONES
The South-west Hydrological Region has been divided into five hydrological zones (Figure 1.2 repeated as Figure 4.1) for the purposes of this manual. These zones were identified based on geology, landforms, soils, climate and land use. Each zone has its own hydrological characteristics and its own blend of hydrological problems and solutions. Table 4.1 provides a brief summary of the hydrological characteristics of each, and Table 4.2 presents a summary of the occurrence of discharge from flow systems operating in each zone. The zones are described in more detail in sections 4.1-4.5. Table 4.1: Comparative hydrological characteristics of the zones. Zone Wheatbelt Eastern
Woolbelt Western Woolbelt
Forested Hills
Coastal Plains
Area (km2)
7,000 12,000 13,000 23,000 4,100
Proportion cleared
97% 90% 64% 14% 88%
Rainfall (mm/year)
350-450 450-550 500-800 800-1,350 800-1,300
Salt deposition (kg/ha/year of chloride)
20 20-30 30-50 50-100+ 100+
Evaporation (mm/year)
1,800 1,600-1,900 1,500-1,700 1,000-1,700 1,000-1,700
Surface runoff (mm/year)
20 40 60 150 150
Proportion of rainfall as runoff
4% 7-9% 8-12% 10-20% 0-30%
Runoff salinity (mg/L)
4,500 3,500 2,500 400 500
Increase in stream salinity (mg/L/year)
n.a. 50-90 50-90 <20 0
Valley floor gradients
<1:1,500 1:250-1:650
Depth of regolith (m)
20-60 10-40 10-50 10-40 >5,000
Groundwater recharge rates (mm/year)
10-50 10-100 10-150 10-200 10-300
Salt store (t/ha)
2,000-30,000 400-2,000 400-2,000 100-1,000 200-1,000/ n.a.
Water table rises (cm/year)
10 20 30 50 0
Groundwater salinity (mg/L)
5,000-30,000 500-15,000 500-15,000 200-5,000 100-20,000
* Two values given for Coastal Plains, sandy and clay areas
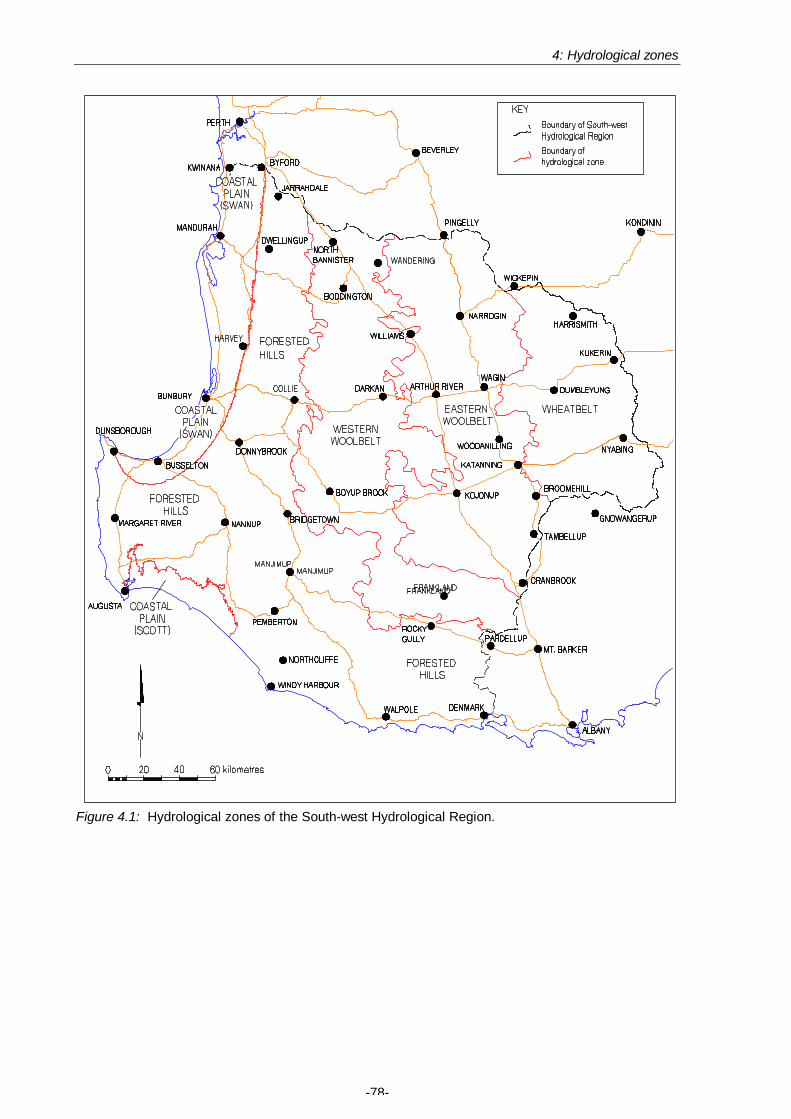
4: Hydrological zones
-78-
Figure 4.1: Hydrological zones of the South-west Hydrological Region.
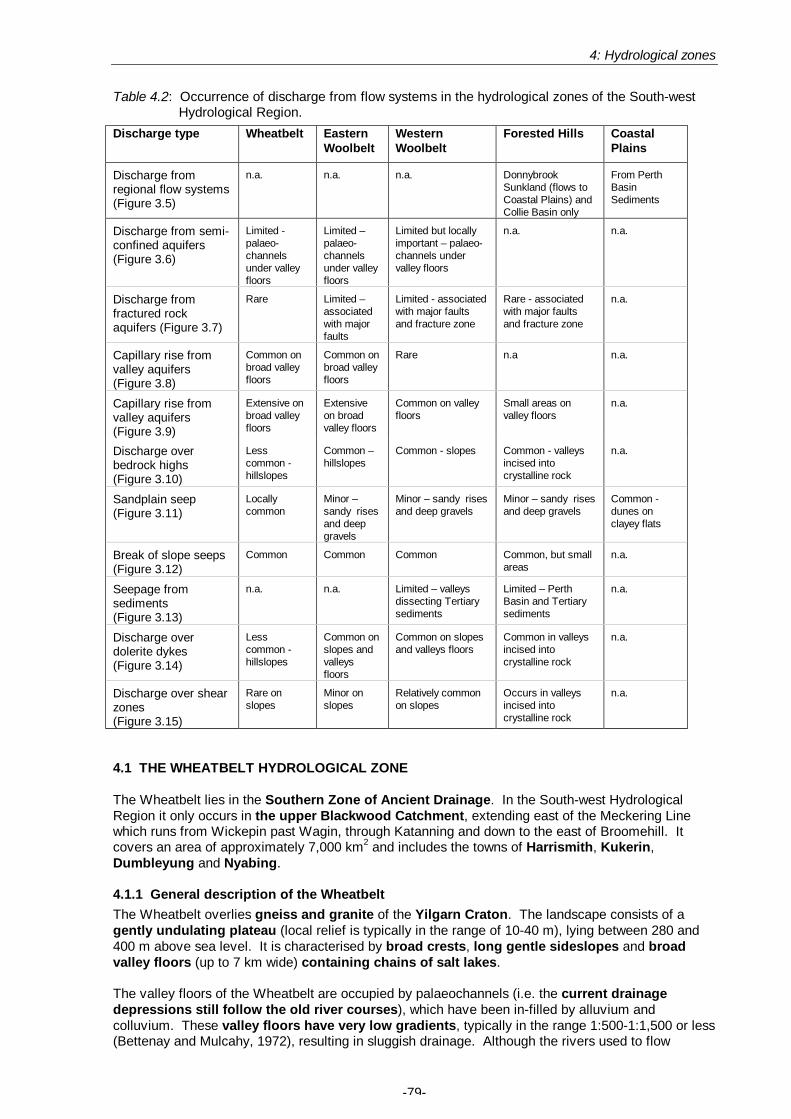
4: Hydrological zones
-79-
Table 4.2: Occurrence of discharge from flow systems in the hydrological zones of the South-west
Hydrological Region. Discharge type Wheatbelt Eastern
Woolbelt Western Woolbelt
Forested Hills Coastal Plains
Discharge from regional flow systems (Figure 3.5)
n.a. n.a. n.a. Donnybrook Sunkland (flows to Coastal Plains) and Collie Basin only
From Perth Basin Sediments
Discharge from semi-confined aquifers (Figure 3.6)
Limited - palaeo-channels under valley floors
Limited – palaeo-channels under valley floors
Limited but locally important – palaeo-channels under valley floors
n.a. n.a.
Discharge from fractured rock aquifers (Figure 3.7)
Rare Limited – associated with major faults
Limited - associated with major faults and fracture zone
Rare - associated with major faults and fracture zone
n.a.
Capillary rise from valley aquifers (Figure 3.8)
Common on broad valley floors
Common on broad valley floors
Rare n.a n.a.
Capillary rise from valley aquifers (Figure 3.9)
Extensive on broad valley floors
Extensive on broad valley floors
Common on valley floors
Small areas on valley floors
n.a.
Discharge over bedrock highs (Figure 3.10)
Less common - hillslopes
Common – hillslopes
Common - slopes Common - valleys incised into crystalline rock
n.a.
Sandplain seep (Figure 3.11)
Locally common
Minor – sandy rises and deep gravels
Minor – sandy rises and deep gravels
Minor – sandy rises and deep gravels
Common - dunes on clayey flats
Break of slope seeps (Figure 3.12)
Common Common Common Common, but small areas
n.a.
Seepage from sediments (Figure 3.13)
n.a. n.a. Limited – valleys dissecting Tertiary sediments
Limited – Perth Basin and Tertiary sediments
n.a.
Discharge over dolerite dykes (Figure 3.14)
Less common - hillslopes
Common on slopes and valleys floors
Common on slopes and valleys floors
Common in valleys incised into crystalline rock
n.a.
Discharge over shear zones (Figure 3.15)
Rare on slopes
Minor on slopes
Relatively common on slopes
Occurs in valleys incised into crystalline rock
n.a.
4.1 THE WHEATBELT HYDROLOGICAL ZONE
The Wheatbelt lies in the Southern Zone of Ancient Drainage. In the South-west Hydrological Region it only occurs in the upper Blackwood Catchment, extending east of the Meckering Line which runs from Wickepin past Wagin, through Katanning and down to the east of Broomehill. It covers an area of approximately 7,000 km2 and includes the towns of Harrismith, Kukerin, Dumbleyung and Nyabing. 4.1.1 General description of the Wheatbelt The Wheatbelt overlies gneiss and granite of the Yilgarn Craton. The landscape consists of a gently undulating plateau (local relief is typically in the range of 10-40 m), lying between 280 and 400 m above sea level. It is characterised by broad crests, long gentle sideslopes and broad valley floors (up to 7 km wide) containing chains of salt lakes. The valley floors of the Wheatbelt are occupied by palaeochannels (i.e. the current drainage depressions still follow the old river courses), which have been in-filled by alluvium and colluvium. These valley floors have very low gradients, typically in the range 1:500-1:1,500 or less (Bettenay and Mulcahy, 1972), resulting in sluggish drainage. Although the rivers used to flow

4: Hydrological zones
-80-
regularly when the climate was wetter, water rarely flows along the entire drainage system in our current climate. Soils are mainly formed on laterite, truncated lateritic profiles, parna (mainly from lake beds), gneiss weathering in situ, colluvium and alluvium. On the catchment divides soils are predominantly sandy gravels with some pale deep sands. Alkaline grey shallow sandy duplex soils, grey shallow sandy duplex soils and grey deep sandy duplex soils are found on the valley slopes while alkaline grey shallow loamy duplex soils, alkaline grey shallow sandy duplex soils, calcareous loamy earths and saline wet soils occur on the valley floors. The native vegetation includes woodlands of salmon gum (Eucalyptus salmonophloia), moort (E. platypus), red morrel (E. longicornis), flat topped yate (E. occidentalis), York gum (E. loxophleba) and white gum (E. wandoo) with some swamp sheoak (Casuarina obesa) and rock sheoak (Allocasuarina huegeliana). Patches of mallee and heath shrubland also occur. The Wheatbelt has been cleared extensively for agriculture, with less than 5% remaining under natural vegetation. The main crops are wheat, barley, lupins, canola and field peas. Sheep are grazed on legume based pastures to produce wool. The average length of the growing season is 5-6 months, beginning late April. Land degradation problems include widespread salinity. This is due to rising water tables, and is most common on valley floors. Waterlogging may be widespread in wetter years. Wind erosion occurs on sandy surfaced soils, especially after cultivation or if pastures are overgrazed. Subsoil acidification is also a problem on sandy surfaced soils. Water erosion can also occur, especially during summer thunderstorms. Soil structure decline is a common problem on the heavier soils and traffic pans form in the deep sands. 4.1.2 Hydrological characteristics of the Wheatbelt The hydrology of the Wheatbelt is greatly influenced by the relatively low rainfall, subdued landscape (local relief is less than 40 m, slope gradients are usually less than 5% and valley floor gradients are less than 1:1,500) and relatively deep weathering profile (20-60 m to bedrock). Rainfall is in the range of 350-450 mm/year and deposits chloride at a rate of about 20 kg/ha/year (Hingston and Gailitis, 1976). Just over 80% of the rain falls between April and October, with the summer rain often coming with the thunderstorms that result from the incursion of warm tropical air. Average annual pan evaporation is about 1,800 mm. Annual surface runoff is about 20 mm, which is about 4% of the annual rainfall (George and Bennett, 1998). The low runoff rate is due to a combination of the gentle slopes, sandy surfaced soils and sluggish drainage. With the exception of the occasional summer thunderstorm, water only flows in drainage lines during winter. In most years, the broad valley floors act as a sump for both runoff and salts, which accumulate in lakes and swampy depressions. Water in the drainage lines only flows westwards across the Meckering Line in very wet years, probably 3-4 times per century on average. Runoff has an average salinity level of about 4,500 mg/L (George et al., 1994). Water in drainage lines higher in the landscape can be marginal (e.g. the Lake Toolibin inflow has a mean annual salinity level of 765 mg/L), but they are typically highly saline on the lower valley floors (well in excess of 5,000 mg/L). The major surface water storages are in the circular lakes which have formed on the valley floors. These include Lakes Taarblin, Toolibin, Dumbleyung and Coyercup and a number of other smaller lakes and swamps. These water bodies are either saline (e.g. Lake Dumbleyung) or becoming saline (e.g. Lake Toolibin). Water and salinity levels in the lakes fluctuate seasonally and many of the smaller lakes regularly dry out completely over the summer. Lakes Dumbleyung and Toolibin fill once every 3-5 years. Figure 4.2 presents a stylised cross-section of the Wheatbelt. The remnants of the lateritic profile that cover much of the zone are up to 60 m deep and have formed mainly over a basement of gneiss. Profiles formed from a granitic basement are mostly restricted to the western edge of the Wheatbelt. Although sedimentary rocks are largely absent, Quaternary and Cainozoic alluvial and lacustrine deposits are common on the valley floors. These consist of highly variable layers of sand, silt and clay. The alluvial deposits often overlie pallid zone and saprock from the lateritic profile. The lateritic profiles in the higher parts of the landscape store approximately 2,000 t/ha of salt (George and Bennett, 1998), with up to 30,000 t/ha being stored under the valley floors.

4: Hydrological zones
-81-
Figure 4.2: Simplified cross-section of the Wheatbelt Hydrological Zone.

4: Hydrological zones
-82-
In the Wheatbelt, there are relatively low rates of groundwater recharge because the low rainfall. However, recharge has increased dramatically, from less than 0.2 mm/year before clearing, to the current rate of 10-50 mm/year (George and Bennett, 1998). Recharge occurs throughout the landscape, with major contributions coming via gravelly and sandy soils on the broad hill crests and divides. Valley floors are also a major area of recharge (when discharge is not occurring). Water bearing aquifers are found in both the saprock and pallid zone of the lateritic profile or its remnants. The pallid zone may hold more water than the underlying saprock, despite the fact that the saprock can store up to 10 times as much water per cubic metre, because the pallid zone is often considerably thicker. The saprock aquifers are typically 0.5-5.0 m thick and are semi-confined or unconfined by the overlying pallid zone and so most of the lateral groundwater flow occurs in this porous material. Small amounts of water are contained in fractured rock aquifers below the lateritic profile. The aquifers in the sedimentary deposits on the valley floors may be surficial, semi-confined or confined. Groundwater salinity ranges from about 300 mg/L in the higher parts of the landscape to 30,000 mg/L or more on the valley floors. Water table levels are rising at 5-50 cm/year (George and Bennett, 1998) and are not expected to reach an equilibrium until the year 2060. Fresh to brackish water may occur in small unconfined aquifers in the deeper sandy deposits of the sandplains. Temporary perched groundwater forms in the sandy topsoils during wet years (perhaps 4-5 years in 10). Groundwater movement is dominated by intermediate flow systems (see “Sub-surface processes” in Section 3.2.2) with the water being transported several kilometres. Local flow systems also operate either in perched aquifers or where the saprock is found close to the surface. Lateral groundwater flow velocities are slow (generally 0.01-2.0 mm/year with the exception of fractured rock and sand aquifers) because of the low hydraulic gradients (often below 1%). Groundwater discharge is common on the broad valley floors and results in large areas (hundreds to thousands of hectares) being waterlogged or inundated throughout winter. Because the discharge is typically saline (>35,000 mg/L), dryland salinity is a big problem. These areas are left bare and eroded, or covered by barley grass and samphire, during summer. Capillary rise from valley aquifers (Figures 3.8 and 3.9) is the most common form of discharge in these areas, with discharge from semi-confined aquifers (Figure 3.6) occurring in areas where palaeochannels are present (e.g. Lake Toolibin). Discharge from local flow systems includes that associated with break of slope seeps (Figure 3.12) and sandplain seeps (Figure 3.11). The discharge from the sandplain seeps is often relatively fresh. Discharge over bedrock highs (Figure 3.10), dolerite dykes (Figure 3.14) and shear zones (Figure 3.15) is less common than in the Woolbelt.
Lake Toolibin from the air.

4: Hydrological zones
-83-
4.2 EASTERN WOOLBELT HYDROLOGICAL ZONE
The Eastern Woolbelt lies to the west of the Wheatbelt in the Southern Zone of Rejuvenated Drainage. It covers an area of approximately 12,000 km2, mostly situated between the Great Southern Highway and the Albany Highway, forming a strip of land 50-70 km wide stretching from Pingelly in the north, through Narrogin, Arthur River, Woodanilling, Kojonup, Muradup and down to Tambellup and Cranbrook. Wagin, Katanning and Broomehill occur on its eastern boundary, while Williams sits on its western boundary. The Eastern Woolbelt includes the upper Murray River and Frankland River Catchments as well as part of the middle Blackwood Catchment. 4.2.1 General description of the Eastern Woolbelt The Eastern Woolbelt overlies the granite and metagranite of the Yilgarn Craton. Sitting to the west of the Meckering Line, this Zone has experienced rejuvenated drainage resulting in a more dissected landscape than found in the Wheatbelt. An undulating terrain (local relief is typically in the range of 40-60 m), sitting 200-400 m above sea level, has formed following the dissection of the lateritic profile. Gently inclined rises and low hills, sometimes rounded but often containing small areas of lateritic remnants with breakaways, are found in the upper parts of the landscape. Valley floors are relatively broad, although they are typically narrower than those in the Wheatbelt. Valley floor gradients are 1:250-1:650 or less and so are steeper than those to the east of the Meckering Line (Bettenay and Mulcahy, 1972). The creeks and rivers flow every winter in defined courses that do not necessarily follow the courses of the ancient rivers. The flow of major rivers, such as the Beaufort and Arthur Rivers, is sometimes impeded by lakes and dunes in palaeochannels. Duplex sandy gravels, loamy gravels and pale deep sands are found on intact lateritic profiles on crests. Hillslopes formed on the mottled and pallid zones of the lateritic profile are dominated by grey deep sandy duplex soils, with some grey shallow sandy duplex soils. Red shallow loamy duplex soils and red deep sandy duplex soils are found over fresh rock. On valley floors there are saline wet soils and grey deep sandy duplex soils. The natural vegetation includes white gum (Eucalyptus wandoo), York gum (E. loxophleba) and jam (Acacia acuminata) woodland. Other trees include salmon gum (E. salmonophloia), flooded gum (E. rudis), marri (E. calophylla) and flat topped yate (E. occidentalis). Mallet (E. astringens) and jarrah (E. marginata) are found on lateritic hills. Rock sheoak (Allocasuarina huegeliana) is associated with rock outcrops while swamp sheoak (Casuarina obesa) is found on valley floors. Approximately 90% of the land has been cleared for grazing (mostly sheep with some beef cattle) and cropping (barley, oats, wheat, lupins, canola and field peas). The average length of the growing season is 5-6 months (beginning late April) in the north and is 6-7 months (beginning mid April) south of Arthur River and Woodanilling. Waterlogging associated with perched groundwater in the sandy duplex soils is a widespread problem. Many of the valley floors have become saline because of the rising groundwater levels. Saline seeps are found on hillsides and are associated with faults, dykes and other geological structures. There is a risk of water erosion on the steeper slopes and wind erosion in some areas. 4.2.2 Hydrological characteristics of the Eastern Woolbelt The hydrology of the Eastern Woolbelt is influenced by the moderately low rainfall, an undulating landscape (local relief is 40-60 m, slope gradients range up to 10% and valley floor gradients are 1:250-1:650 or less) and the relatively shallow weathering profile (typically less than 40 m to bedrock). Average annual rainfall is in the 450-550 mm/year range (being highest in the south) and deposits chloride at a rate of 20-30 kg/ha/year (Hingston and Gailitis, 1976). About 80-85% of the rain falls between April and October. Falls between November and March range from 75 mm in the north to 100 mm in the south. Average annual pan evaporation ranges from 1,900 mm in the north to 1,600 mm in the south.

4: Hydrological zones
-84-

4: Hydrological zones
-85-
Annual surface runoff is about 40 mm, which is about 8% of the annual rainfall. The major rivers (the Hotham, Williams, Arthur, Beaufort, Balgarup and Gordon Rivers) flow each winter, mostly in clearly defined courses. Flows in the Beaufort catchment are sometimes impeded by lakes and dunes on the valley floor. Runoff has an average salinity level of about 3,500 mg/L and stream salinity is increasing at a rate of 50-90 mg/L/year (McFarlane and George, 1994). Water in minor drainage lines higher in the landscape is often marginal or fresh, but is typically brackish to saline (3,000-8000 mg/L) in the major streams and rivers. The major surface water storages are the circular lakes that have formed upstream from the Beaufort River (including Lakes Parkeyerring, Norring and Queerarrup) and at the eastern end of the Arthur River (Lakes White and Nomans). There are also a number of smaller lakes and swamps throughout the zone. The lakes were originally fresh but are becoming saline. Water and salinity levels in the lakes fluctuate seasonally and many of the smaller lakes dry out completely over the summer. Figure 4.3 presents a stylised cross-section of the Eastern Woolbelt. The degree of dissection that accompanied the rejuvenated drainage is the reason that the lateritic profile is not as extensive as in the Wheatbelt. Rock outcrops and soils formed from freshly weathered rock are found in many places. Where the lateritic profile is present, it is often truncated. The resulting shallower profile has formed mainly from a granite or metagranite basement. This basement contains more extensive faulting and dolerite dyke activity than is found in the Wheatbelt. Salt stores in the regolith are typically in the range of 400-2,000 t/ha. Quaternary and Cainozoic alluvial and lacustrine deposits are common on the valley floors. Tertiary sediments associated with palaeochannels are present on some valley floors and can traverse low lying divides. The Darkan Palaeochannel, which runs 20 km east from the Albany Highway, is at least 500 m wide, 45 m deep and contains thick layers of sand (Rockwater Pty Ltd, 1990). Groundwater recharge rates are often higher (10-100 mm/year) than in the Wheatbelt. Recharge occurs throughout the landscape, as well as in the valley floors (when discharge is not occurring). Water bearing aquifers are found in the saprock and pallid zone of the lateritic profile or its remnants. The valley floor sediments also contain important aquifers. Only small amounts of water are found in fractured rock aquifers below the lateritic profile. Rates of groundwater rise are typically about 20 cm/year in the mid to lower slopes. The higher rainfall and relatively shallow regolith means that water tables are closer to equilibrium than those in the Wheatbelt. Groundwater salinity levels also tend to be lower than in the Wheatbelt. Salinity levels are generally in the 500-10,000 mg/L range, although levels up to 15,000 mg/L can occur in aquifers in the deeper regolith. Large quantities of fresh water are believed to be present in the Darkan Palaeochannel aquifers. During winter, temporary perched groundwater is common in the topsoils of the sandy and loamy duplex soils found on hillslopes and valley flats. Groundwater movement is dominated by local flow systems (see “Sub-surface processes” in Section 3.2.2) with the water being transported a couple of kilometres. Intermediate flow systems occur where sedimentary aquifers are present. Long (50-300 km), wide (20-800 m) faults are also capable of transmitting groundwater across catchment divides. Lateral groundwater flow velocity is usually slightly higher than in the Wheatbelt (generally 0.02-2.2 mm/year in the saprock) because of steeper hydraulic gradients (often up to 1.5%). The relatively shallow regolith results in less severe discharge than occurs in the bordering zones to the east and west. Capillary rise from valley aquifers (Figures 3.8 and 3.9) occurs on the broad floors of the Gordon, Balgarup, Beaufort, Arthur, Williams and Hotham valleys. Discharge from semi-confined aquifers (Figure 3.6) is associated with the Beaufort and Darkan Palaeochannels. There are also restricted areas of discharge from fractured rock aquifers associated with major faults. Discharge from local flow systems can be extensive (>10 ha in area) and is usually associated with dolerite dykes (Figure 3.14), bedrock highs (Figure 3.10) and break of slope seeps (Figure 3.12). Sandplain seeps (Figure 3.11) are smaller and less common than in the Wheatbelt. Similar seeps occur on hillslopes with areas of deep gravels.

4: Hydrological zones
-86-
4.3 THE WESTERN WOOLBELT HYDROLOGICAL ZONE
The Western Woolbelt lies on the Eastern Darling Range Zone. It also incorporates an inland portion of the Darling Plateau belonging to the Western Darling Range Zone. This portion of the Western Darling Range has been included because of similar salinity problems on the valley floors and the prominence of strongly discharging saline seeps on valley slopes. The Western Woolbelt covers an area of approximately 13,000 km2 and forms a strip of land 40-70 km wide stretching from Bannister and Wandering through Boddington, Quindanning, Darkan, Bowelling, Moodiarrup, Boscabel, McAlinden, Boyup Brook, Chowerup and Unicup through to Frankland and Rocky Gully. Included are the middle sections of the Blackwood, Murray and Frankland Catchments, as well as the upper Collie, Warren and Kent Catchments. The Western Woolbelt is bounded to the west and south by the main blocks of State Forest. 4.3.1 General description of the Western Woolbelt The Western Woolbelt overlies the granite, metagranite and gneiss of the Yilgarn Craton. It is a gently undulating to rolling terrain formed by the dissection of a gently undulating lateritic plateaux sitting at about 260-360 m above sea level. Significant areas of plateau remain, often including broad flats on Eocene sediments with restricted surface drainage and lakes. The rivers that have dissected the plateaux have formed major valleys that are 30-120 m deep. Many of the valleys have incised the underlying bedrock. Valley floors are broad and flat in the east, becoming narrower downstream. The upper Collie River flows through relatively broad palaeochannels. The Western Woolbelt forms an intergrade between the Eastern Woolbelt and the Forested Hills. Adjoining areas of the Forested Hills are dominated by lateritic plateau with major valleys being deep and distinct. The Eastern Woolbelt is a largely dissected terrain with only small scattered lateritic remnants. Soils are mainly formed on laterite (over granite), truncated laterite, rock weathering in situ (granite), colluvium and alluvium. The soil pattern is closely related to the topography and degree of erosion. Sandy gravels, loamy gravels and pale deep sands are found over the plateau remnants. On the valley slopes there are a range of soils, with gravels and grey deep sandy duplex soils on truncated laterite and grey and red deep sandy duplex soils and red/brown deep loamy duplex soils on fresh rock. The native vegetation consists mainly of forests and woodlands of jarrah (Eucalyptus marginata), marri (E. calophylla) and white gum (E. wandoo), with pockets of flooded gum (E. rudis), jam (Acacia acuminata), rock sheoak (Allocasuarina huegeliana) and bull banksia (Banksia grandis). Approximately 65% of the native vegetation has been cleared for agriculture. The land is used for grazing sheep and beef cattle. The crops grown are mostly oats, barley, lupins and canola. Other crops like faba beans, wheat and field peas are also grown but are less common. The average length of the growing season is 6-7 months (beginning mid April) in the north and is 7-8 months (beginning early April) south of Boyup Brook. There are some small scattered horticultural plantings with potential for future expansion. Some areas, especially in the south, have been planted to pines for sawlogs and Tasmanian blue gums for wood chips. A variety of other species for salinity control and other conservation purposes have also been planted. Gold is mined at Boddington. The sloping terrain is subject to soil erosion if the soils are disturbed or the ground cover is not maintained. Waterlogging and salinity problems are widespread, especially on the valley floors. 4.3.2 Hydrological characteristics of the Western Woolbelt The hydrology of the Western Woolbelt is influenced by the moderate rainfall, undulating to rolling landscape (local relief 10-100 m, slope gradients 3-30%) and variable geology. Average annual rainfall is in the 500-800 mm range (being highest in the south) and deposits chloride at a rate of 30-50 kg/ha/year (Hingston and Gailitis, 1976). The majority of the rain (80-90%) falls between April and October. Falls between November and March range from 80 mm in the north to 75 mm around Darkan and up to 120 mm in the south-east. The average annual pan evaporation ranges from 1,700 mm in the north to 1,500 mm in the south.
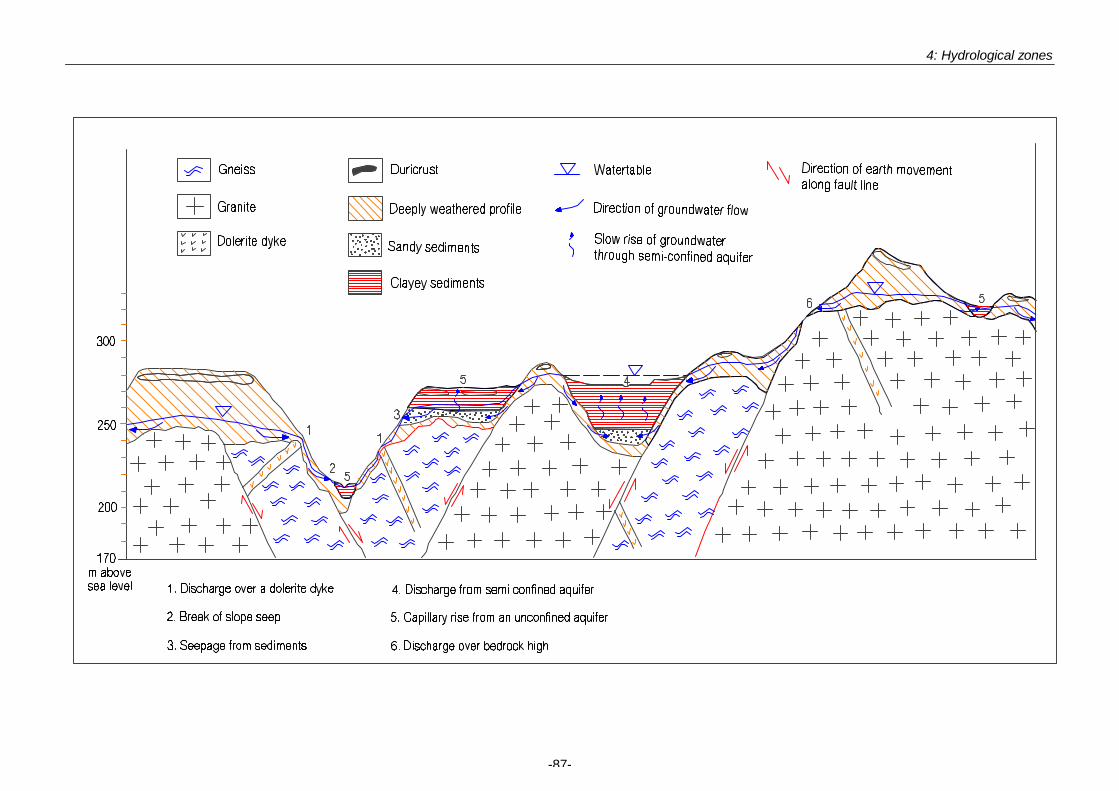
4: Hydrological zones
-87-

4: Hydrological zones
-88-
Annual surface runoff is about 60 mm, which is about 10% of rainfall (George and Bennett, 1998). Stream flow is mostly seasonal, with the major streams and rivers flowing in clearly defined courses each winter. These include the Hotham, Williams, Collie (East and South), Blackwood, Tone, Frankland and Kent Rivers. Runoff has an average salinity level of about 2,500 mg/L (George and Bennett, 1998) and stream salinity is increasing at a rate of 50-90 mg/L/year (McFarlane and George, 1994). Water in minor drainage lines higher in the landscape may be marginal or fresh, but the major streams and rivers are typically brackish to saline (1,500-6,000 mg/L). The major surface water storages are the fresh to marginal lakes found on valley floors (including Lakes Muir, Unicup and Towerrinning), smaller circular lakes found on plateau remnants (including Lakes Poorrarecup, Qualeup, Kulikup and Ngartiminny) and in pools in the major rivers. Water and salinity levels in the lakes fluctuate seasonally and many of the smaller lakes dry out completely over the summer. Figure 4.4 presents a stylised cross-section of the Western Woolbelt. The depth of regolith is highly variable and Tertiary sediments associated with palaeochannels are a feature. Deep (up to 50 m), intact lateritic profiles are common on the plateau remnants, and the upper part of the profile has formed in Tertiary sedimentary deposits in many cases. Thinner remnants of the lateritic profile are found on the slopes of hills and valleys. In some of the deeper valleys, the lateritic profile has been largely stripped and the underlying bedrock is often exposed. Extensive faulting and dolerite dyke activity is present in the bedrock, which is a mixture of granite and gneiss. Salt stores in the regolith are typically in the range of 400-2,000 t/ha. Quaternary and Cainozoic alluvial deposits and Tertiary sediments are common on the valley floors. The Tertiary sediments are exposed at about the 240-260 m contour line and palaeochannels on this level can be followed from the valley floor to the plateau surface. The Beaufort Palaeochannel (Waterhouse et al., 1994) is at least 60 km long and 13-55 m thick. It contains alternating layers of clay and sand, and runs from Boscabel, through Towerrinning and west towards the Collie catchment divide. Groundwater recharge rates tend to be higher (10-150 mm/year) than in the Eastern Woolbelt because of the higher rainfall. Recharge occurs throughout the landscape, with major contributions coming from the gravelly divides and poorly drained upland flats. Some of the broader valley floors are also significant recharge areas (when discharge is not occurring). Tertiary sediments are important water bearing aquifers in this Zone. Other aquifers are found in the saprock and pallid zone of the lateritic profile or its remnants. Small amounts of water are contained in fractured rock aquifers below the lateritic profile. Rates of groundwater rise are typically about 30 cm/year in the mid to lower slope positions, however rises of 100-200 cm/year have been recorded high in the landscape (George and Bennett, 1998). These rapid increases are probably due to a combination of the higher rainfall and relatively short period of time since clearing (over much of the area). Groundwater salinity levels range from 500-1,500 mg/L, but over much of the landscape they tend to be lower than in areas to the east. This is due to the extent of leaching and salt removal that result from a combination of the better defined drainage systems and higher rainfall. Some of the Tertiary aquifers are confined or semi-confined and contain fresh (500 mg/L) water. The aquifer in the Beaufort palaeochannel is brackish to saline (1,000-7,500 mg/L) at Boscabel (Prangley, 1994). Long (50-300 km), wide (20-800 m) faults, such as the Kojonup and Darkan Faults are capable of transmitting groundwater across catchment divides (Clarke et al., 1998). During the winter months, temporary perched groundwater is common in the sandy and loamy topsoils of duplex soils found on hillslopes. Waterlogging is also common on the flat surfaces of the plateau remnants. Over much of the zone, groundwater movement is dominated by local flow systems (see “Sub-surface processes” in Section 3.2.2) with the water being transported a couple of kilometres. Intermediate flow systems occurring in the sedimentary aquifers and major faults are highly significant in some areas. Lateral groundwater flow velocities are higher than in the Wheatbelt (generally 0.5-5.0 mm/year in the saprock) due to the greater hydraulic gradients (often 1-2%). Discharge over dolerite dykes (Figure 3.14) and bedrock highs (Figure 3.10) is common on hillslopes as well as valley floors. Break of slope seeps (Figure 3.12) are also common on the edges of valley floors, while discharge over shear zones is relatively common. Seeps from patches of deep gravel (Figure 3.11) and Tertiary sediments (Figure 3.13) are found on slopes below lateritic hills and plateaux. These seeps tend to be large and can be responsible for significant soil erosion. Capillary rise from valley aquifers (Figures 3.8 and 3.9) occurs on the broad floors of the Towerrinning, Gordon,

4: Hydrological zones
-89-
Kent and upper Collie River catchments. Deep incision has confined discharge on the narrow valley floors over much of the Blackwood and Murray River catchments. Discharge from semi-confined aquifers (Figure 3.6) is associated with palaeochannels at Towerrinning and Qualeup, while discharge from fractured aquifers occurs from the Kojonup and Darkan Faults. 4.4 THE FORESTED HILLS HYDROLOGICAL ZONE
The Forested Hills cover an area of approximately 23,000 km2 extending from Jarrahdale, through Dwellingup, Collie, Donnybrook, Kirup, Greenbushes, Balingup, Nannup, Bridgetown, Margaret River, Augusta, Pemberton, Manjimup, Northcliffe and Walpole to Denmark. 4.4.1 General description of the Forested Hills The Forested Hills incorporates a variety of geological areas and soil-landscape zones. These are: • most of the Western Darling Range Zone on the gneiss and granite of the Yilgarn Craton, • the Warren-Denmark Southland Zone on the gneiss and granite of the Yilgarn Craton and Albany-
Fraser Orogen, • the Donnybrook Sunkland Zone on the sedimentary rocks of the Perth Basin, and • the Leeuwin Zone on the granite gneiss of the Leeuwin Complex. These areas have been grouped as one because they share a number of characteristics. All receive relatively high rainfall, in excess of 800 mm, and most remain under forest. As a result, the incidence of salinity problems is usually low but waterlogging is common on cleared flats. Lateritic plateaux with gravels and sands dominate the landscape, but moderately to deeply incised valleys with gravels and loams are also a feature. It is in these valleys that most agricultural development has taken place. The area of agricultural land is limited and land use tends to be intense and diversified. Finally, there is not enough agricultural land within each of the zones for them to be treated separately. The Forested Hills are dominated by a gently undulating to undulating lateritic plateaux mostly sitting between 200 and 400 m above sea level, but it can be as low as 20 m in the south-west. On the plateau surfaces there are broad areas of restricted drainage, often underlain by Tertiary sediments. A rolling to undulating terrain of valleys and hills have been formed by the incision by rivers and stripping of the plateaux. Fresh rock has often been exposed by these processes. To the north of Manjimup these valleys can be up to 200 m deep and cut through large areas of intact plateau. To the south of Manjimup much of the plateau has been stripped away leaving an undulating terrain of valleys and hills formed on the granite and gneiss. Coastal dune systems (rising to heights of up to 250 m above sea level) containing limestone are found between Cape Naturaliste and Cape Leeuwin and along the South Coast. Virtually all the rivers in the South-west Hydrological Region pass through the Forested Hills and many have their headwaters here. The latter include the Denmark, Deep, Shannon, Gardner, Donnelly, Margaret, Ludlow, Capel, Preston, Brunswick, Harvey, Dandalup and Serpentine Rivers. Soils are formed on laterite, colluvium (mainly from laterite), rock weathering in situ (gneiss, granite) and alluvium. On the plateau surfaces duplex sandy gravels, loamy gravels, deep sandy gravels and shallow gravels are found with pockets of pale deep sands and yellow deep sands. Grey deep sandy duplex soils, semi-wet and wet soils and pale deep sands are often found on poorly drained flats. Friable red\brown loamy earths, brown loamy earths and brown loamy duplex soils have formed on freshly exposed gneiss and granite in the valleys. Yellow deep sands, pale deep sands and calcareous deep sands are found in dune systems on the Leeuwin-Natural and South Coasts The native vegetation consists mainly of forests and woodlands of jarrah (Eucalyptus marginata) and marri (E. calophylla) with significant areas of karri (E. diversicolor) south of Manjimup. Blackbutt (E. patens), flooded gum (E. rudis), bullich (E. megacarpa) and white gum (E. wandoo) are also present in some areas. Almost 85% of the zone is uncleared natural vegetation used for timber production, conservation and water catchments.

4: Hydrological zones
-90-
Cleared land is used for the grazing of beef cattle, dairy cattle and sheep. The average length of the growing season is 7-8 months (beginning early April) in the north and is 9 months (beginning in March) on the south coast. There is also some fodder cropping. The Forested Hills in the South-west Hydrological Region produce approximately a quarter of Western Australia’s horticultural crops, including potatoes and other vegetables, apples and stone fruit and wine grapes. Significant areas of farmland have been converted to plantations of pine trees and Tasmanian blue gums. The mining of bauxite for alumina production is an important land use on the Darling Plateau and coal is mined at Collie. There is increasing pressure for urban and special rural development. The slopes of the valleys are subject to soil erosion if the soil is disturbed, especially under vegetable cropping, or if the ground cover is not maintained. Landslips have occurred on some of the steeper slopes. Large areas of the uplands are affected by waterlogging. Salinity, while not as widespread or severe as in the Wheatbelt and Woolbelt, is a problem in some areas. Relatively low salinity levels in groundwater discharge may cause severe yield reductions in horticultural crops. 4.4.2 Hydrological characteristics of the Forested Hills The hydrology of the Forested Hill is influenced by the moderately high to high rainfall, large areas of uncleared land (over 80% of the zone) and undulating to rolling landscape (local relief and slope gradients can be up to 200 m and 30% respectively). The average annual rainfall ranges from 700 mm in the upper Perup River Catchment to 1,350 mm at Northcliffe. The rain deposits chloride at a rate of 50-100+ kg/ha/year (Hingston and Gailitis, 1976). The majority of the rain (85-90%) falls between April and October with falls between November and March ranging from 100 mm in the north to 200 mm in the south. The average annual pan evaporation ranges from 1,000 mm in the south-west to 1,700 mm in the north. Annual surface runoff is about 150 mm, which is about 15% of rainfall (George and Bennett, 1998). Although stream flow is seasonal in most of the minor drainage lines, many of the larger rivers maintain some flow throughout the year. These rivers include the Serpentine, Murray, Harvey, Preston, Collie, Capel, Margaret, Blackwood, Scott, Donnelly, Warren, Shannon, Frankland and Kent Rivers. Runoff is usually fresh and has an average salinity level of about 400 mg/L (George and Bennett, 1998). Many of the rivers that have headwaters in forested catchments have levels of 200 mg/L or less. Salinity levels in the rivers are summarised in Table 2.6. Higher salinity levels are found in the larger rivers because their headwaters are further inland. These include the Murray (3,143 mg/L), Collie (1,240 mg/L), Warren (880 mg/L), Frankland (2,190 mg/L) and Kent (1,600 mg/L) Rivers. The salinity of many of these rivers is increasing at a rate of about 50 mg/L/year (Anon., 1989). Average readings from three locations along the Blackwood River demonstrate the effect of the input of fresh water from tributaries flowing into the middle and lower reaches of the river from high rainfall, forested sub-catchments. The Blackwood River’s salinity levels drop from 3,700 mg/L/year at Winnejup (where it enter this the Forested Hills) down to 2,400 mg/L/year by Nannup and 1,800 mg/L/year in the Donnybrook Sunklands. The most prominent of the surface water storages have been created by the construction of dams and include Serpentine Reservoir (Serpentine River), Lake Banksiadale (South Dandalup River), Stirling Dam (Harvey River) and Wellington Dam (Collie River). Swamps (most common and extensive near the south coast), pools in rivers and farm dams are other significant surface water stores. Water held in plants of the jarrah, marri and karri forests would account for a major proportion of the biotic water stored in the South-west Hydrological Region. Figure 4.5 presents a stylised cross-section of the Forested Hills. The geology is more varied than in the other Zones. Though largely dominated by crystalline rocks (a mixture of granite and gneiss with extensive faulting and dolerite dyke activity), there are two major sedimentary basins (the Perth Basin and the Collie Basin). There are also scattered areas of thinner sedimentary rocks (e.g. Kirup Conglomerate and Donnybrook Sandstone), and extensive deposits of Tertiary and Quaternary sediments on the Darling and Manjimup Plateaux. Large areas of Quaternary deposits are situated on the plains of the south coast. The depth of regolith is highly variable. Deep (up to 40 m), intact lateritic profiles are common in the uplands, especially the Darling Plateau where the upper part of the profile has sometimes formed in the Tertiary sedimentary deposits. In the Donnybrook Sunkland the entire profile has formed on sedimentary rocks. Because of the deep dissection of many of the valleys, the partially stripped lateritic profile is limited in extent. In many cases there is only a short

4: Hydrological zones
-91-
distance from the fully intact profile on the plateau surface to the shallow (<2 m) colluvium or freshly weathered rock on the valley slope. Salt stores in the regolith are typically in the range 10-1,000 t/ha.

4: Hydrological zones
-92-

4: Hydrological zones
-93-
Recharge occurs throughout the landscape, with major contributions coming from the gravelly plateaux, poorly drained upland flats and swampy plains on the South Coast. Groundwater recharge rates are often lower than elsewhere because much of the zone remains forested. In cleared areas recharge rates of up to 200 mm/year can occur. Under forest, recharge is negligible in low rainfall districts on the western margin of the Zone, but can be up to 30 mm/year in higher rainfall districts (Williamson et al., 1987). Aquifers in consolidated sedimentary rocks contain the most significant amounts of groundwater in the Forested Hills. Under the Donnybrook Sunkland, the Leederville aquifer of the Perth Basin is typically 150 m thick and confined. The underlying Yarragadee aquifer is more than 1,200 m thick in places. Water salinity in these aquifers is typically fresh (<500 mg/L). Some of the water in these aquifers may be 10,000 years old. Water bearing aquifers are found in both the saprock and pallid zone of the lateritic profile, the Tertiary sediments on the plateaux and Quaternary deposits of the Warren-Denmark Southland. Small amounts of water are contained in fractured rock aquifers below the lateritic profile. Centuries of water movement through fractures and faults, as well as groundwater flow in regolith on steep slopes have limited the accumulation of salts. As most of the land remains under native forest, rising water tables are also less prevalent than in the zones further inland. Rates of groundwater rise under agricultural land are typically about 50 cm/year. The sandy Quaternary deposits on the South Coast contain permanent unconfined aquifers with fresh water (<500 mg/L) which rise to the ground surface in the winter. During the winter months, perched groundwater is common on low lying flats on the plateau surfaces. Groundwater movement in areas with crystalline geology is dominated by local flow systems (see “Sub-surface processes” in Section 3.2.2) due to the undulating landscape. Some intermediate flow systems may occur in the Tertiary aquifers. The south-eastern Donnybrook Sunkland is a major recharge area for a regional flow system in the Perth Basin Sediments. Thorpe and Baddock (1994) estimated recharge rates of 200 mm/year for the Yarragadee aquifer here. Lateral groundwater flow velocity is higher, generally 1-10 mm/year in the saprock, than to the east due to the steeper hydraulic gradients (up to 5% or more). Regional flow may also occur in the Collie Basin. Discharge from local flow systems is common and is associated with dolerite dykes (Figure 3.14), bedrock highs (Figure 3.10) and shear zones (Figure 3.15) found valleys incised into crystalline rocks (including the Blackwood Valley upstream from Nannup, the Preston Valley, and hillslopes in the Pemberton District). Although this discharge is typically fresh (<500 mg/L), there are some marginal to brackish seeps (up to 3,000 mg/L), especially around Bridgetown. Break of slope seeps (Figure 3.12) and capillary rise from valley aquifers also occur in this terrain, but do not affect large areas because of the narrow valley floor. Seepage from sandy rises and deep gravels (Figure 3.11) is minor but widespread. Seepage from sediments (Figure 3.13) is most common in the Donnybrook Sunklands, but also occurs in restricted areas elsewhere. There is some discharge from the Warnbro and Yarragadee aquifers (Figure 3.5) in the lower Blackwood Valley. 4.5 THE COASTAL PLAINS HYDROLOGICAL ZONE
The Coastal Plains include two discrete areas, the Swan Coastal Plain covering an area of approximately 3,200 km2 on the west coast, and the Scott Coastal Zone covering an area of approximately 900 km2on the south coast. Both have formed on Quaternary sediments overlying the Perth Basin. 4.5.1 General description of the Swan Coastal Plain The Swan Coastal Plain is 10-35 km wide and extends from Mundijong through Serpentine, Pinjarra, Mandurah, Waroona, Yarloop, Harvey, Brunswick, Australind, Bunbury, Dardanup, Boyanup, Capel and Busselton to Dunsborough. The Darling Scarp forms its eastern boundary while the Whicher Scarp forms its southern boundary. The Swan Coastal Plain is a level to gently undulating plain, most of which lies less than 50 m above sea level. There are three dune systems running parallel to the coast, and alluvial plains lying inland. Along the coast are beach ridges and parabolic dunes of calcareous deep sands (Quindalup system). Behind these dunes lies a strip of poorly drained estuarine deposits with saline wet soils

4: Hydrological zones
-94-
and semi-wet and wet soils (Vasse system). Low dunes of yellow deep sands overlying Tamala limestone (Spearwood system) are found inland from these estuarine deposits. A complex of low dunes, sandplains, and swampy flats with pale deep sands and semi-wet and wet soils (Bassendean system) occur behind these dunes. Further inland are flat, and often poorly drained, alluvial plains with grey deep sandy duplex soils, grey shallow sandy duplex soils, grey shallow loamy duplex soils and wet soils (Pinjarra and Abba systems). Cracking clays are found along the western margins and brown sandy earths and brown loamy earths have formed on recent alluvium. Sandy gravels, yellow deep sands and pale deep sands are found at the foot of the Darling and Whicher Scarps (Forrestfield system). The vegetation is varied. Coastal heath shrublands are found on the calcareous dunes. Tuart (Eucalyptus gomphocephala) forests and woodlands are common on the yellow deep sands. Banksia woodlands are common on the pale deep sands. Jarrah (E. marginata) and marri (E. calophylla) woodland occurs on the plains with paperbarks (Melaleuca spp.) in poorly drained areas. White gum (E. wandoo) is also found on these plains. On the Swan Coastal Plain almost 90% of the land has been cleared for agriculture. Dairy cattle, beef cattle and sheep are grazed on non-irrigated and irrigated pastures. The average length of the growing season is about 7 months and begins in April. Over 50% of Western Australian’s milk production comes from this area. Horticultural crops including potatoes and other vegetables are also significant. Citrus fruit, and table and wine grapes are also grown. The vast majority of the South-west Hydrological Region’s population lives on the Swan Coastal Plain, mostly congregated in and around the urban centres of Mandurah, Bunbury and Busselton. There is heavy competition for land for non-agricultural uses. Waterlogging is widespread across the Swan Coastal Plain. Salinity problems are encountered on heavy-textured soils in low lying areas, which are also prone to soil structure decline. Approximately 20-30% of irrigated pastures are salt-affected. Nutrient export into waterways is a major issue. 4.5.2 Hydrological characteristics of the Swan Coastal Plain The hydrology of the Swan Coastal Plain is influenced by the moderately high rainfall, predominantly flat topography and discharge from the Perth Basin sediments. The average annual rainfall ranges from 820 mm at Busselton to 1,000 mm along the base of the Darling Scarp. Rainfall deposits more than 100 kg of chloride/ha/year (Hingston and Gailitis, 1976). The majority of the rain (90%) falls between April and October. The average annual pan evaporation ranges from 1,000 mm in the south to 1,700 mm in the north. Annual surface runoff ranges from 0 mm on the dunes to about 330 mm (30% of rainfall) on heavy clay flats. While major rivers such as the Serpentine, Murray, Collie, Preston and Capel cut across the Plain, much of the stream flow now occurs in artificial drainage channels. Elsewhere drainage is sluggish due to the low relief. Swampy depressions are common. Runoff ranges from fresh (200 mg/L) to marginal (up to 1,000 mg/L) on the heavier soils of the irrigation area. The most prominent surface water storages are the Peel-Harvey Estuary, Leschenault Estuary, Vasse-Wonnerup Estuary, Lake Clifton and Lake Preston. Swamps and pools in the rivers are other significant water stores. Figure 4.6 presents a stylised cross-section of the Swan Coastal Plain. Groundwater is stored in surficial aquifers in Quaternary sediments and the underlying confined aquifers of the Perth Basin. Some of the water in the lower aquifers may be 10,000 years old. Perched groundwater is widespread in the surface horizon of sandy and loamy duplex soils in winter months when much of the Swan Coastal Plain is waterlogged or inundated. The surficial aquifers, which include the Guildford Formation, are typically 5-50 m thick and storage fluctuates with seasonal conditions. Water in the surficial aquifers to the south of Bunbury are generally brackish (900-1,000 mg/L) with some areas of saline water near the coast (WAWA, 1995). To the north of Bunbury, fresh to marginal (<1,000 mg/L) water is found under the sand dunes that cover much of the western half of the Plain. The water under the Pinjarra Plain to the east of these dunes is often brackish (Deeney, 1988) with some saline areas (up to 25,000 mg/L). The higher salinity levels in these surficial aquifers is often associated with salt water intruding from the coast, a concentration of salts following evaporation in groundwater discharge areas or heavier textured
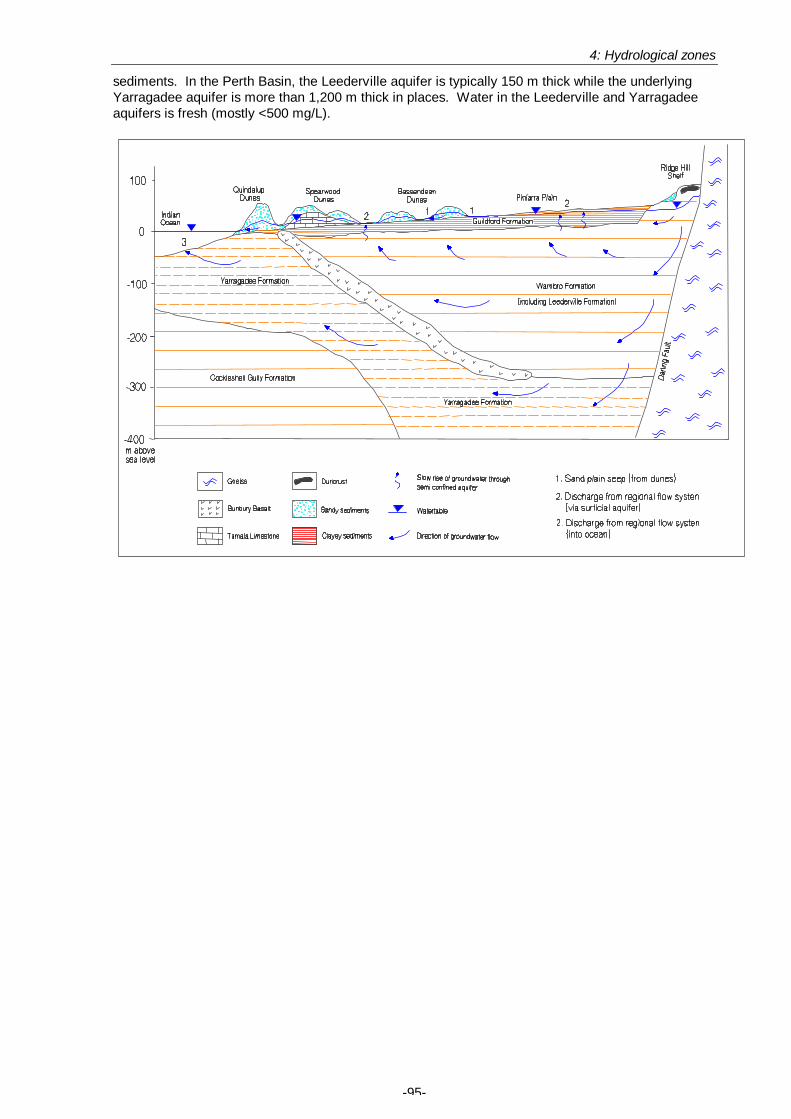
4: Hydrological zones
-95-
sediments. In the Perth Basin, the Leederville aquifer is typically 150 m thick while the underlying Yarragadee aquifer is more than 1,200 m thick in places. Water in the Leederville and Yarragadee aquifers is fresh (mostly <500 mg/L).

4: Hydrological zones
-96-
Groundwater movement is dominated by regional flow systems (see “Sub-surface processes” in Section 3.2.2) with discharge from the Leederville aquifer via surficial aquifers (Figure 3.5) at locations such as Ambergate Road to the south of Busselton, Waterloo to the east of Bunbury and Hopelands Road to the west of Serpentine. Some of this discharge may have originated in the Yarragadee aquifer. Local flow systems are common in the sand dunes, with discharge from sandplain seeps (Figure 3.11) found at the base of the dunes where they overlie clayey flats. 4.5.3 General description of the Scott Coastal Plain The Scott Coastal Plain is approximately 15 km wide and stretches east from Augusta to the mouth of the Warren River. It lies south of the Donnybrook Sunkland Zone. A thin strip of similar coastal dunes and swampy plain extend east towards Denmark, but these overlie a granitic bedrock and have little agricultural significance. Most of the Plain lies within the catchment of the Scott River. The area consists largely of a flat swampy plain lying less than 50 m above sea level. It has pale deep sands and semi-wet and wet soils, with pale deep sands found on rises. Coastal dunes, up to 150 m high, are found along the Southern Ocean. The dunes consist of calcareous deep sands and pale deep sands. Heath shrubland, sedge communities and paperbark (Melaleuca spp.) woodland occur on the plain, with peppermint (Agonis flexuosa) thickets on the coastal dunes. There has been extensive clearing for grazing beef and dairy cattle. The average length of the growing season is about 8-9 months, and begins in March. Large areas are now being planted to Tasmanian blue gums. The last few years have seen the introduction of potato cropping using centre pivot irrigation. Mining for mineral sands is another land use. Waterlogging is a widespread problem. There is also a risk of nutrient leaching from the sandy soils. Sand dunes in the area are prone to wind erosion. 4.5.4 Hydrological characteristics of the Scott Coastal Plain The hydrology of the Scott Coastal Plain is influenced by the high rainfall and predominantly flat topography. Rainfall is in the 1,100-1,300 mm/year range and deposits more than 100 kg/ha of chloride each year (Hingston and Gailitis, 1976). The average annual pan evaporation is about 1,000-1,200 mm. While little or no surface runoff originates on the dunes, the Scott River has a mean annual runoff of almost 180 mm which is largely generated from waterlogged flats. The Scott River maintains some flow throughout the year. Drainage is sluggish due to the low relief and swampy depressions are common. Runoff is usually fresh and the Scott River has an average salinity level of 210 mg/L. The most prominent surface water storages are the Hardy Inlet and Lake Jasper. Swamps and pools along the river are other significant surface stores. Groundwater is stored in surficial aquifers in Quaternary sediments, which are typically 10 m thick, and also in the underlying confined aquifers of the Perth Basin. Storage in the surficial aquifers fluctuates with seasonal conditions, but water tables are close to the ground surface for much of the year (except under the sand dunes near the coast). The quality of this surface water is fresh (200-530 mg/L). In the Perth Basin, the Leederville aquifer is typically 150 m thick while the underlying Yarragadee aquifer is more than 1,200 m thick in places. Water in the Leederville and Yarragadee aquifers is fresh (mostly <500 mg/L). Groundwater movement is dominated by regional flow systems (see “Sub-surface processes” in Section 3.2.2) in the Perth Basin aquifers (Figure 3.5). These aquifers discharge into the Southern Ocean. Local flow systems operate in the surficial aquifers which also recharge the underlying Perth Basin. Much of the Scott Coastal Plain is waterlogged or inundated in the winter and early spring.

4: Hydrological zones
-97-
4.6 REFERENCES
Anon. (1989). Stream salinity and its reclamation in south-west Western Australia. Report of the Steering Committee for Research on Land Use and Water Supply. Water Authority of Western Australia.
Bettenay, E. and Mulcahy, M.J. (1972). Soil and landscape studies in Western Australia. (2). Valley form and surface features in the South-west Drainage Division. Journal of the Geological Society of Australia 18: 359-369.
Clarke, C.J., George, R.J., Bell, R.W. and Hobbs, R.J. (1998). Major faults and the development of dryland salinity in the western wheatbelt of Western Australia. Hydrology and Earth System Sciences 2: 77-91.
Deeney, A.C. (1988). Geology and groundwater resources of the surficial formations of the coastal plain between Pinjarra and Bunbury. Geological Survey of Western Australia, Hydrogeology Report No. 1988/5, Perth. (unpub).
George, R.J. and Bennett, D.L. (1998). South-West and Upper Great Southern Region. In: ‘Groundwater trends in the agricultural area of Western Australia’ (ed. R. Nulsen), Agriculture Western Australia, Resource Management Technical Report No. 173.
George, R.J., McFarlane, D.J. and Speed, R.J. (1994). The consequences of a changing hydrological environment for native vegetation in south-western Australia. In: ‘Proceedings of the Role of Networks in Nature Conservation Conference, Geraldton, 1994.
Hingston, F.J. and Gailitis, V. (1976). The geographic variation of salt precipitated over Western Australia. Australian Journal of Soil Research 14: 319-335.
McFarlane, D.J. and George, R.J. (1994). How sustainable is grazing sheep on annual pastures in the Woolbelt? Journal of Agriculture Western Australia 35: 16-21.
Prangley, C.J. (1994). Boscabel palaeochannel bore completion report. Western Australian Geological Survey Hydrology Report 1994/1 (unpublished).
Rockwater Pty Ltd (1990). ‘Proposed tannery site at Daradine – Results of groundwater investigations’. Unpublished report to Kinhill Engineers Pty. Ltd.
Thorpe, P.M. and Baddock, L.J. (1994). Groundwater resources of the Busselton-Walpole region. Western Australian Geological Survey Hydrology Report 1994/29 (unpublished).
Waterhouse, J.D., Commander, D.P., Prangley, C. and Backhouse, J. (1994). Newly recognized Eocene sediments in the Beaufort River Palaeochannel. Western Australian Geological Survey Annual Review, 1993-94.
WAWA (1995). Busselton-Capel groundwater management plan. Water Authority of Western Australia, Perth. Williamson, D.R., Stokes, R.A. and Ruprecht, J.K. (1987). Response of input and output of water and chloride
to clearing for agriculture. In: ‘Hydrology and salinity in the Collie River Basin, Western Australia’. (eds A.J. Peck and D.R. Williamson). Journal of Hydrology 94: 1-28.

5: Dryland salinity
-98-
5. DRYLAND SALINITY
5.1 INTRODUCTION
5.1.1 What is dryland salinity? The term salinity is used to describe an accumulation of soluble salts in the root zone, at levels where plant growth or land use is adversely affected (Houghton and Charman, 1986). Sodium chloride (NaCl) is usually the dominant salt, although other salts including calcium and magnesium bicarbonates, chlorides and sulphates may be present in some soils. Land is usually identified as being saline when concentrations of soluble salts in the root zone are high enough to exceed the tolerance limits of crops, pastures or native vegetation. Agricultural land can be considered to be severely salt-affected when salinity levels reduce yields of preferred crops and pastures by more than 50%. Moderate salinity is defined as yields being reduced by 10-50% (Anon., 1988). In Australia, soils are usually considered to be saline when they contain more than 0.1-0.2% NaCl (EC1:5 approximately 50-100 mS/m) in the topsoil or 0.3% NaCl (EC1:5 approximately 150 mS/m) in the subsoil (Northcote and Skene, 1972). In practice the identification of salinity as a form of land degradation is to a large degree influenced by current land use. For example, salinity levels that may have negligible impact on the productivity of pastures and crops in the Wheatbelt can render land unsuitable for sensitive horticultural crops. Dryland salinity describes the salinisation of areas that are not irrigated. The term “dryland” to signifies that the salinity has developed on land where dryland agriculture is practiced. It is a term that can cause confusion, as it may be mistaken as referring only to salinity found on dry or well drained land. This is definitely not the case, because in Western Australia soils affected by dryland salinity are commonly also affected by waterlogging. In fact, groundwater discharge is an the most important component in the development of dryland salinity. Irrigation salinity is dealt with separately in Section 6. There are two types of dryland salinity. Primary salinity occurs where soils are inherently saline as a result of natural processes. As a general rule, areas affected by primary salinity do not get developed for agriculture. Secondary salinity is a form of land degradation. It describes the situation where salinity levels have increased as a result of human activities changing the water balance and can be responsible for taking large areas of agricultural land out of production. In Western Australia the area affected by secondary dryland salinity is increasing, with both agricultural and non agricultural land being affected. As suggested above, there is a relationship between dryland salinity and waterlogging. In the agricultural area of Western Australia, secondary salinity usually occurs when there is a saline water table within 1.2-1.8 m of the ground surface (Nulsen, 1981). The critical depth may be greater in some loams, and less in coarse to medium sands and some heavy clays. Severe salinity usually occurs when a saline water table is present within 0.5 m of the ground surface in late spring. Stream salinity refers to the situation where there is a concentration of dissolved salts in stream (or river) water. Although most current examples of stream salinity are directly associated with secondary salinity in the catchment area, there were streams that were saline before clearing commenced (Schofield et al., 1988). 5.1.2 What causes dryland salinity? Salt in the local environment There are three main sources of salt in the South-west Hydrological Region: • Salts derived from the weathering of minerals in the underlying bedrock, • Salts in alluvium originating as marine sediments, • Salts deposited over tens of thousands of years by rainfall. In most cases, salt deposited by rainfall is the most significant. Hingston and Gailitis (1976) showed that 20-200 kg/ha/year of salt is deposited in rainfall each year (see Section 3.2.1). The salt enters the soil and regolith through continuous infiltration and percolation. Tree roots extract significant volumes of water from the soil, but typically take up very little salt. As a result large concentrations of salt can accumulate in the regolith over tens of thousands of years. Salt storage figures in the range of 8-2,300 t/ha were reported in Western Australian soils by

5: Dryland salinity
-99-
Bettenay et al. (1964). In the Wheatbelt, McFarlane and George (1992) found salt stores of 210-2,260 t/ha under hill slopes, 1,170-5,750 t/ha under valley floors and up to 21,310 t/ha under flats adjacent to salt lakes. High salt storage in the profile has led to the development of saline water tables. Changes to the water balance In Western Australia secondary dryland salinity results primarily from changes to the water balance that follow the clearing of native vegetation for agriculture (see Section 3.3.1). Most of the current agricultural area was once covered by forests, woodlands or shrublands of deep-rooted perennial vegetation. This native vegetation has been replaced mainly by shallow-rooted annual pastures and crops. Native perennials use much more water than conventional pastures and crops, which have a smaller biomass, shorter growing season and shallower root systems. This reduction in water use has changed the water balance of the whole landscape. Much of the rainfall that was previously returned to the atmosphere by evapotranspiration now infiltrates the soil past the root zone and becomes groundwater recharge. Year by year, the increased recharge results in rising groundwater levels and the remobilisation of salt stored in the soil profile (see figure 5.1). When saline water tables approach the ground surface (usually to within 1-2 metres), capillary rise can transport the salt into the root zone and this salt restricts plant growth. In many cases the water table reaches the ground surface and saline water is discharged. It is these groundwater discharge areas that become the areas affected by dryland salinity. Groundwater discharge areas are found in a variety of situations, ranging from broad flats affected by discharge from regional flow systems to small hillside seeps associated with local flow systems (see “Sub-surface processes” in Section 3.2.2 for more details). Surface salt concentration due to evaporation Salinity can also develop in situations where saline groundwater is not involved. For example, the continual evaporation of relatively fresh surface water or surficial groundwater can result in the salts becoming concentrated in the soil. Over time, salinity can develop in the topsoil if there is a continual input of small amounts of salt in rainfall and runoff, but limited removal in runoff or sub-surface flows. This situation is most common in localised areas that are waterlogged due to a combination of their low lying position and the presence of a drainage restriction in the soil profile (e.g. duplex soils in closed drainage depressions). It can also occur in some areas where fresh groundwater is discharged. As only the top of the soil profile is affected, this form of salinity is much less severe in comparison with salinity associated with saline water tables. 5.2 DRYLAND SALINITY IN THE SOUTH-WEST HYDROLOGICAL REGION
5.2.1 What is the extent of dryland salinity? Dryland salinity is a major concern in the South-west Hydrological Region. Groundwater levels are rising at rates of 0.15-1.50 m/year in the >500 mm rainfall zone, and 0.05-0.50 m/year in the 350-500 mm rainfall zone (Anon., 1996). Ferdowsian et al. (1996) estimated that approximately a quarter of a million hectares of land in the south-west (about 8% of the cleared area) was affected by secondary dryland salinity in 1994. They projected that this area would increase to 18% by the year 2020 and that almost a quarter of cleared land is under threat of salinity in the long-term.
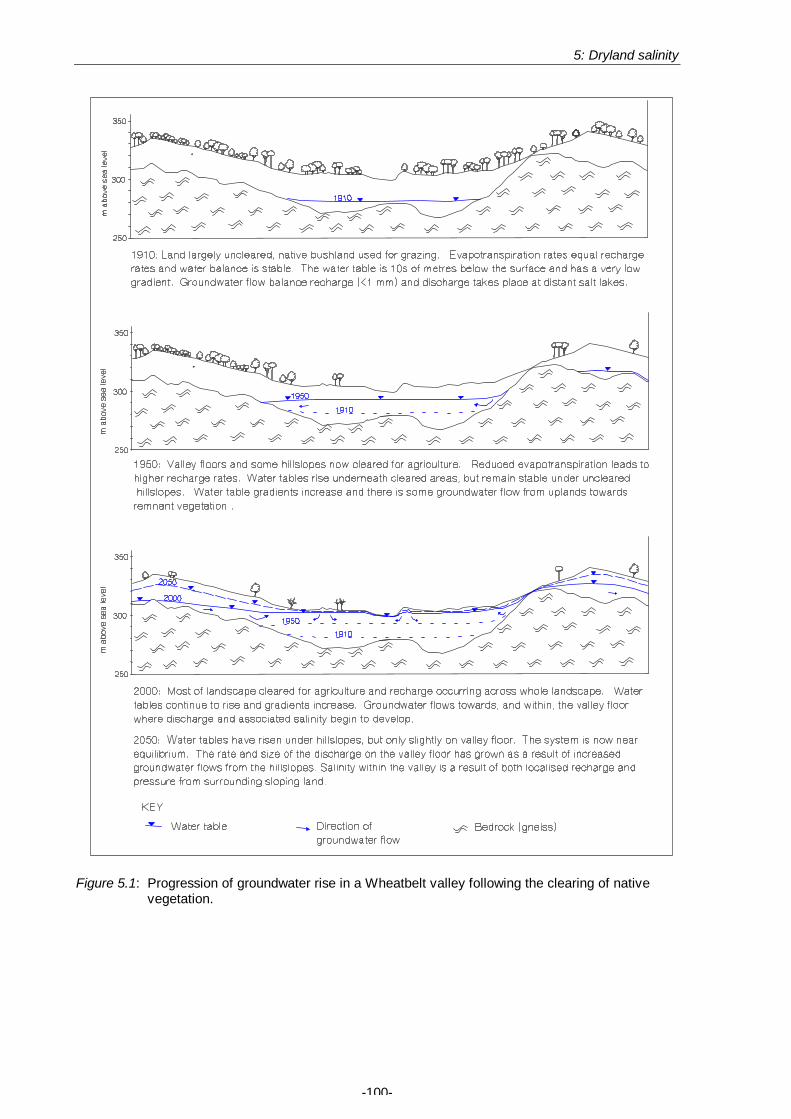
5: Dryland salinity
-100-
Figure 5.1: Progression of groundwater rise in a Wheatbelt valley following the clearing of native
vegetation.
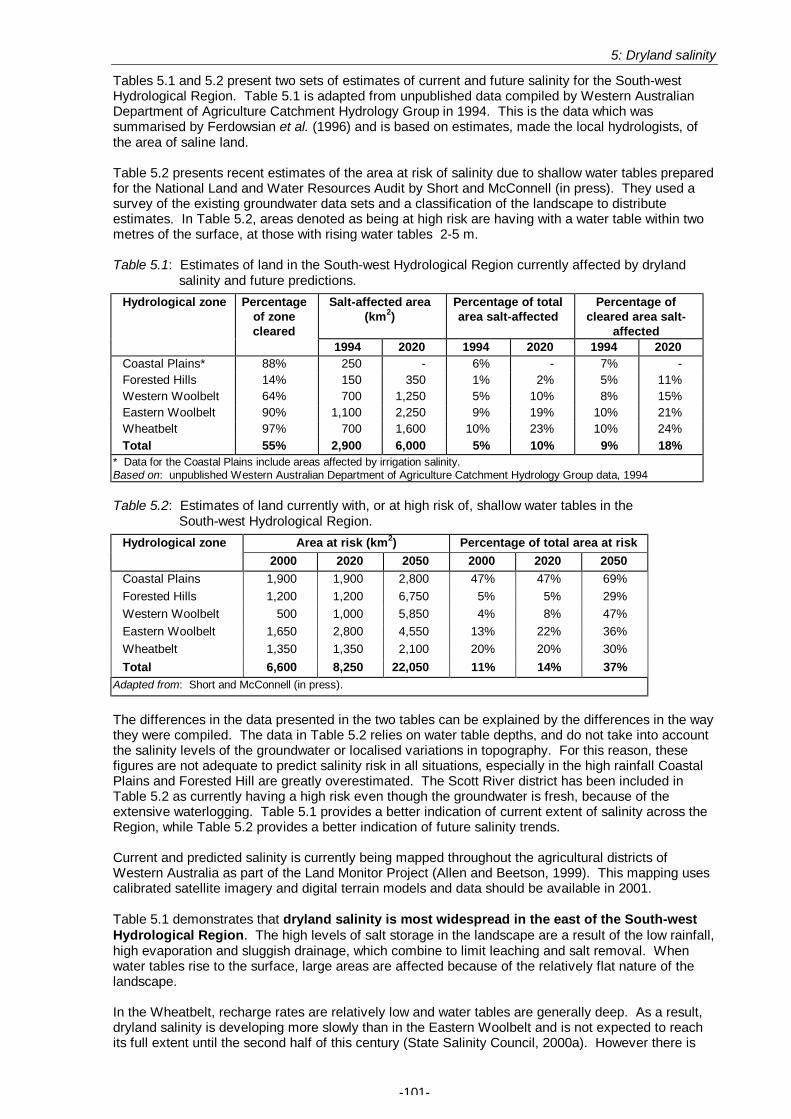
5: Dryland salinity
-101-
Tables 5.1 and 5.2 present two sets of estimates of current and future salinity for the South-west Hydrological Region. Table 5.1 is adapted from unpublished data compiled by Western Australian Department of Agriculture Catchment Hydrology Group in 1994. This is the data which was summarised by Ferdowsian et al. (1996) and is based on estimates, made the local hydrologists, of the area of saline land. Table 5.2 presents recent estimates of the area at risk of salinity due to shallow water tables prepared for the National Land and Water Resources Audit by Short and McConnell (in press). They used a survey of the existing groundwater data sets and a classification of the landscape to distribute estimates. In Table 5.2, areas denoted as being at high risk are having with a water table within two metres of the surface, at those with rising water tables 2-5 m. Table 5.1: Estimates of land in the South-west Hydrological Region currently affected by dryland
salinity and future predictions. Hydrological zone Percentage
of zone cleared
Salt-affected area (km2)
Percentage of total area salt-affected
Percentage of cleared area salt-
affected 1994 2020 1994 2020 1994 2020 Coastal Plains* 88% 250 - 6% - 7% - Forested Hills 14% 150 350 1% 2% 5% 11% Western Woolbelt 64% 700 1,250 5% 10% 8% 15% Eastern Woolbelt 90% 1,100 2,250 9% 19% 10% 21% Wheatbelt 97% 700 1,600 10% 23% 10% 24% Total 55% 2,900 6,000 5% 10% 9% 18%
* Data for the Coastal Plains include areas affected by irrigation salinity. Based on: unpublished Western Australian Department of Agriculture Catchment Hydrology Group data, 1994 Table 5.2: Estimates of land currently with, or at high risk of, shallow water tables in the
South-west Hydrological Region. Area at risk (km2) Percentage of total area at risk Hydrological zone
2000 2020 2050 2000 2020 2050 Coastal Plains 1,900 1,900 2,800 47% 47% 69% Forested Hills 1,200 1,200 6,750 5% 5% 29% Western Woolbelt 500 1,000 5,850 4% 8% 47% Eastern Woolbelt 1,650 2,800 4,550 13% 22% 36% Wheatbelt 1,350 1,350 2,100 20% 20% 30% Total 6,600 8,250 22,050 11% 14% 37%
Adapted from: Short and McConnell (in press).
The differences in the data presented in the two tables can be explained by the differences in the way they were compiled. The data in Table 5.2 relies on water table depths, and do not take into account the salinity levels of the groundwater or localised variations in topography. For this reason, these figures are not adequate to predict salinity risk in all situations, especially in the high rainfall Coastal Plains and Forested Hill are greatly overestimated. The Scott River district has been included in Table 5.2 as currently having a high risk even though the groundwater is fresh, because of the extensive waterlogging. Table 5.1 provides a better indication of current extent of salinity across the Region, while Table 5.2 provides a better indication of future salinity trends. Current and predicted salinity is currently being mapped throughout the agricultural districts of Western Australia as part of the Land Monitor Project (Allen and Beetson, 1999). This mapping uses calibrated satellite imagery and digital terrain models and data should be available in 2001. Table 5.1 demonstrates that dryland salinity is most widespread in the east of the South-west Hydrological Region. The high levels of salt storage in the landscape are a result of the low rainfall, high evaporation and sluggish drainage, which combine to limit leaching and salt removal. When water tables rise to the surface, large areas are affected because of the relatively flat nature of the landscape. In the Wheatbelt, recharge rates are relatively low and water tables are generally deep. As a result, dryland salinity is developing more slowly than in the Eastern Woolbelt and is not expected to reach its full extent until the second half of this century (State Salinity Council, 2000a). However there is
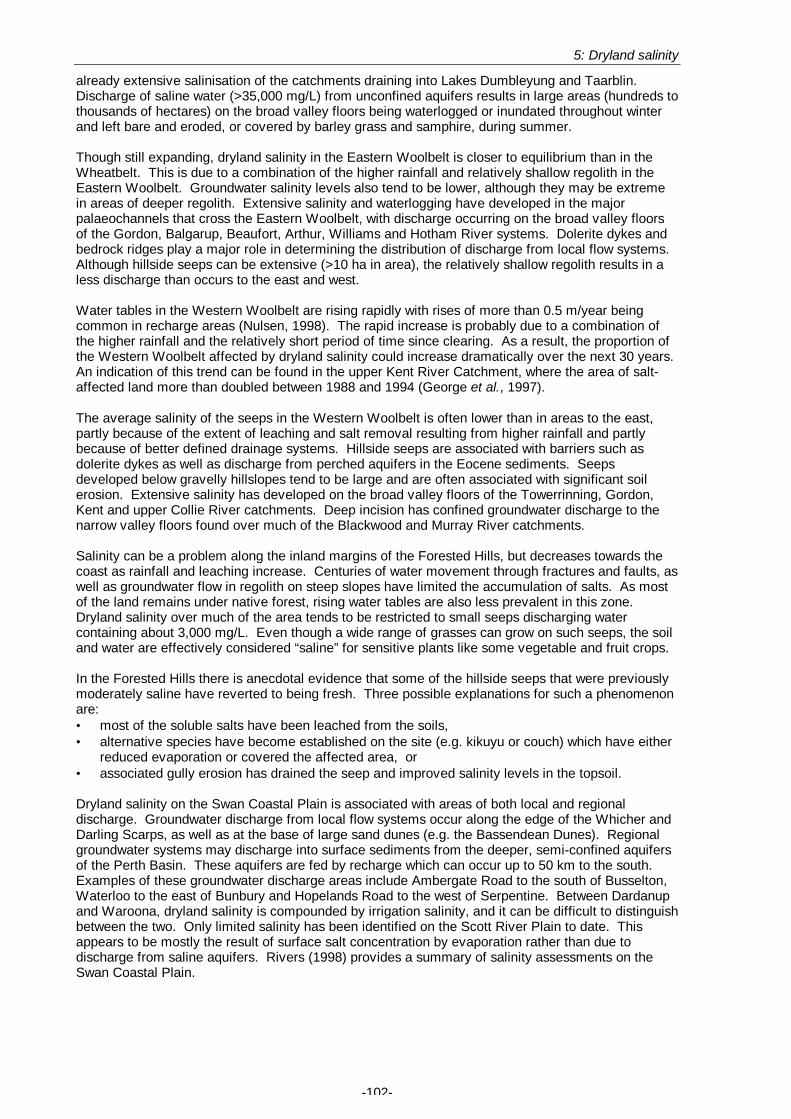
5: Dryland salinity
-102-
already extensive salinisation of the catchments draining into Lakes Dumbleyung and Taarblin. Discharge of saline water (>35,000 mg/L) from unconfined aquifers results in large areas (hundreds to thousands of hectares) on the broad valley floors being waterlogged or inundated throughout winter and left bare and eroded, or covered by barley grass and samphire, during summer. Though still expanding, dryland salinity in the Eastern Woolbelt is closer to equilibrium than in the Wheatbelt. This is due to a combination of the higher rainfall and relatively shallow regolith in the Eastern Woolbelt. Groundwater salinity levels also tend to be lower, although they may be extreme in areas of deeper regolith. Extensive salinity and waterlogging have developed in the major palaeochannels that cross the Eastern Woolbelt, with discharge occurring on the broad valley floors of the Gordon, Balgarup, Beaufort, Arthur, Williams and Hotham River systems. Dolerite dykes and bedrock ridges play a major role in determining the distribution of discharge from local flow systems. Although hillside seeps can be extensive (>10 ha in area), the relatively shallow regolith results in a less discharge than occurs to the east and west. Water tables in the Western Woolbelt are rising rapidly with rises of more than 0.5 m/year being common in recharge areas (Nulsen, 1998). The rapid increase is probably due to a combination of the higher rainfall and the relatively short period of time since clearing. As a result, the proportion of the Western Woolbelt affected by dryland salinity could increase dramatically over the next 30 years. An indication of this trend can be found in the upper Kent River Catchment, where the area of salt-affected land more than doubled between 1988 and 1994 (George et al., 1997). The average salinity of the seeps in the Western Woolbelt is often lower than in areas to the east, partly because of the extent of leaching and salt removal resulting from higher rainfall and partly because of better defined drainage systems. Hillside seeps are associated with barriers such as dolerite dykes as well as discharge from perched aquifers in the Eocene sediments. Seeps developed below gravelly hillslopes tend to be large and are often associated with significant soil erosion. Extensive salinity has developed on the broad valley floors of the Towerrinning, Gordon, Kent and upper Collie River catchments. Deep incision has confined groundwater discharge to the narrow valley floors found over much of the Blackwood and Murray River catchments. Salinity can be a problem along the inland margins of the Forested Hills, but decreases towards the coast as rainfall and leaching increase. Centuries of water movement through fractures and faults, as well as groundwater flow in regolith on steep slopes have limited the accumulation of salts. As most of the land remains under native forest, rising water tables are also less prevalent in this zone. Dryland salinity over much of the area tends to be restricted to small seeps discharging water containing about 3,000 mg/L. Even though a wide range of grasses can grow on such seeps, the soil and water are effectively considered “saline” for sensitive plants like some vegetable and fruit crops. In the Forested Hills there is anecdotal evidence that some of the hillside seeps that were previously moderately saline have reverted to being fresh. Three possible explanations for such a phenomenon are: • most of the soluble salts have been leached from the soils, • alternative species have become established on the site (e.g. kikuyu or couch) which have either
reduced evaporation or covered the affected area, or • associated gully erosion has drained the seep and improved salinity levels in the topsoil. Dryland salinity on the Swan Coastal Plain is associated with areas of both local and regional discharge. Groundwater discharge from local flow systems occur along the edge of the Whicher and Darling Scarps, as well as at the base of large sand dunes (e.g. the Bassendean Dunes). Regional groundwater systems may discharge into surface sediments from the deeper, semi-confined aquifers of the Perth Basin. These aquifers are fed by recharge which can occur up to 50 km to the south. Examples of these groundwater discharge areas include Ambergate Road to the south of Busselton, Waterloo to the east of Bunbury and Hopelands Road to the west of Serpentine. Between Dardanup and Waroona, dryland salinity is compounded by irrigation salinity, and it can be difficult to distinguish between the two. Only limited salinity has been identified on the Scott River Plain to date. This appears to be mostly the result of surface salt concentration by evaporation rather than due to discharge from saline aquifers. Rivers (1998) provides a summary of salinity assessments on the Swan Coastal Plain.

5: Dryland salinity
-103-
5.2.2 What are the problems associated with dryland salinity? The most obvious effect of salinity is poor growth or death of plants. In the South-west Hydrological Region there are extensive areas that once supported healthy native vegetation or productive crops and pastures, but are now bare salt scalds or are covered by only patchy, salt tolerant vegetation. Valley floors in the east of the region, originally the most productive farming land in the district, now have little agricultural value. In 1998 it was estimated that about $70 million per year of agricultural production was lost due to salinity (State Salinity Council, 1998). The current Salinity Strategy (State Salinity Council, 2000a) predicts that, if no effective management is developed and implemented, the proportion of cleared land in the agricultural region affected by secondary salinity will increase from 10% to 30% resulting in annual production losses of $300-400 million by 2050. These production losses would be reflected in lost capital value of farm land, estimated at $3-4 billion. Soil salinity by itself has a detrimental effect on plants, but the greatest impact occurs from the combination of salinity and waterlogging which are typical of saline areas in the South-west Hydrological Region. Barrett-Lennard (1986a) demonstrated that while increased salinity levels decreased the growth of a cereal crop such as wheat, it was only when the plant became waterlogged that it actually died (see Plate 5.1). If salinity levels are not high, many plants grown in well drained soils can keep salt out of their roots. However, the lack of oxygen leads to reduced root cell respiration in waterlogged conditions. This prevents the roots from being able to exert sufficient energy to keep the salt out, at the same time as reducing their water and nutrient uptake, and often results in plant death (Barrett-Lennard et al., 1990). This is evident on valley floors of the Wheatbelt and both Woolbelts, where crops die and pasture gives way to scalds and low feed value grasses (e.g. barley grass) as soon as the soil becomes saturated. Crops have yielded well on salt-affected areas when early rains leached salt from the topsoil, and a dry winter resulted in no waterlogging (McFarlane, 1985).
(a) (b) (c) Plate 5.1: Effects of waterlogging on wheat grown with (a) no salt, (b) salt equivalent to 4% sea water, and (c) salt equivalent to 20% sea water. In each photo the two pots on the left are waterlogged, the two pots on the right are drained. Source: Barrett-Lennard (1986b). Lower levels of salinity and waterlogging can still reduce crop and pasture production over extensive areas without necessarily causing plant death, and the tolerance of different species varies greatly (Table 5.3). Some horticultural crops (avocados, lettuce, onions, oranges, plums and strawberries) will have yield reductions of 50% in soils with a relatively lows levels of salinity (loam with an EC1:5 of 40 mS/m) while some crops and grasses (barley, couch grass, perennial ryegrass, tall wheatgrass and wheat) show no yield decline at these levels. The effect of salinity is more severe in sandy soils than in clayey soils. For example tomatoes grown in sand with an EC1:5 of 30 mS/m will have a yield reduction of 25%, but in a clay with the same salinity there will be no yield decline. For yield declines with water salinity see Table 6.3.

5: Dryland salinity
-104-
Table 5.3: The effect on pasture and crop yields of soil salinity in the root zone. Crops Salinity (EC1:5 mS/m) at
which yield in sandy soil is reduced by:
Salinity (EC1:5 mS/m) at which yield in loamy soil is reduced by:
Salinity (EC1:5 mS/m) at which yield in clayey soil is reduced by:
0% 25% 50% 0% 25% 50% 0% 25% 50% Apple 10 20 25 15 30 40 20 40 60 Avocado 5 15 20 10 20 35 15 30 45 Barley (grain) 45 70 100 70 115 160 100 160 225 Couch grass 40 60 80 60 95 130 85 135 185 Grapes 10 25 35 15 35 60 20 50 85 Lettuce 5 20 30 10 30 45 15 40 65 Lucerne 10 30 50 20 50 80 25 65 110 Olive 15 30 45 25 50 75 35 70 105 Onion 5 15 25 10 25 40 15 35 55 Orange 10 20 25 15 30 40 20 40 60 Perennial ryegrass 30 50 65 50 80 110 70 110 150 Phalaris 25 45 60 40 70 100 55 100 140 Plum 10 15 25 15 25 40 20 35 55 Potato 10 20 35 15 35 50 20 45 75 Strawberry 5 10 15 10 15 20 10 20 30 Subterranean clover 10 20 30 15 30 50 20 45 70 Tall wheatgrass 40 75 105 65 10 170 95 165 240 Tomato 15 30 40 20 45 65 30 60 95 Wheat 35 50 70 55 85 115 75 120 160 This table summarises data originally presented by Maas and Hoffman (1977) and later adapted to Western Australian conditions by George and Wren (1985). The data does not consider the influence of waterlogging. Salinity also poses a great threat to natural ecosystems and biodiversity. Many bushland remnants and wetlands have been damaged by rising saline water tables, leading to habitat loss and a decrease in biodiversity. Examples include the Capercup Reserve south of Darkan, Qualeup Lake east of Boyup Brook and Lake Toolibin east of Narrogin. George et al. (1995) estimate that without remedial action up to 80% of susceptible remnants on farms and 50% of public reserves in agricultural areas could be lost during the twenty first century. State-wide, 450 endemic plant species are under threat due to rising water tables and salinity (State Salinity Council, 2000a). The number of birds and invertebrates in the woodlands and wetlands of the Wheatbelt and both Woolbelts have also been reduced by salinity. Stream salinity has resulted in major degradation of many river ecosystems and a loss of water that can be used for drinking (see Table 2.6 for current salinity levels in the major rivers). More than one third of the south-west’s previously divertible water has become brackish or saline and can no longer be used, while a further 16% is marginal (State Salinity Council, 2000a). This trend is demonstrated by the largest river in the South-west Hydrological Region, the Blackwood River, which was once used for irrigation and drinking water but is now unsuitable as a water source. Figure 5.2 graphs the increasing salinity trend in the lower Blackwood River since 1940 and provides a prediction of its salinity in the year 2050. Average annual increase in salinity levels of major rivers include 58 mg/L in the Blackwood, 74 mg/L in the Frankland and 93 mg/L in the Murray (Anon., 1996). On a local scale, spreading salinity has resulted in many farm dams becoming useless for irrigation and marginal for livestock watering. This is the major factor restricting the development of horticultural industries in the Woolbelt, where there are large areas of suitable soils but farm water supplies are limited due to increasing salinity. For further discussion on water supplies see Section 12.2. Salinity also presents a major threat to rural townships in low lying positions such as Cranbrook, Dumbleyung, Katanning, Narrogin, Nyabing, Tambellup, Wagin and Woodanilling. Apart from affecting water supplies and vegetation, rising saline water tables can also damage roads, buildings, foundations, waste disposal systems and other infrastructure. The spread of salinity also increases the incidence of water erosion. Denuded and waterlogged topsoil is more susceptible to detachment and transport. In addition, because saturation increases the rate of runoff (see Section 9.1.2) and so increases the risk of flooding (see Section 8.1.2).

5: Dryland salinity
-105-
Figure 5.2: Changes in salinity levels in the lower Blackwood River since 1940 and predicted salinity
level for 2050 (from Ruprecht and Bowman 1999) 5.2.3 Which areas are most susceptible to dryland salinity? As discussed in Section 5.2.1, it is the inland areas, where rainfall is low, evaporation high and drainage sluggish, that are most susceptible to dryland salinity. Although the spread of salinity is currently advanced in the Eastern Woolbelt (Table 5.1), the area affected is likely to increase significantly by 2050 (Table 5.2). The spread of salinity in the Wheatbelt is expected to continue steadily throughout the 21st. century (State Salinity Council, 2000a). The Western Woolbelt (along with cleared land in the eastern margins of the Forested Hills) is likely to experience the most rapid increase in the area of salt-affected land during the next few decades (Table 5.2). Based on information currently available, predictions of future dryland salinity on the Swan Coastal Plain are less certain. Over much of the Plain, irrigation salinity is likely to be a compounding factor of equal or greater importance. Future salinity problems in the higher rainfall districts are likely to reflect the expanding area planted to crops that have low salt tolerance, as much as any increase in the severity of dryland salinity. Land use and vegetation cover within the catchment are important factors determining salinity risk. Typically, the area affected by salinity increases with the proportion of land cleared for pasture or cropping in comparison to land supporting native vegetation or tree plantations. Over most of the South-west Hydrological Region, the largest areas affected by dryland salinity are associated with discharge from intermediate flow systems (see “Sub-surface processes” in Section 3.2.2 for more details). Low lying land, such as broad valley floors, tend to be the most susceptible areas as they are often the first areas to be affected by rising water tables. Extensive areas of flat, poorly drained land, even when found in elevated positions, can also be highly susceptible. Discharge from local flow systems tends to affect smaller areas on sloping land, but is widespread throughout both Woolbelts and can have significant impacts on water resources and land use. An understanding of the geology and hydrology of a district is essential to successfully predict the location and extent of future salinity outbreaks. It is important to have some knowledge about the distribution, depth, size, salinity and status of the groundwater bodies, and to know how water table levels are changing. As discussed in Section 3.2.2, dryland salinity often develops where bedrock highs, weathered dolerite dykes or quartz veins form barriers that intercept groundwater flows and force them to the surface (Lewis, 1991). Large faults (most common in the Yilgarn Block) and shear zones (most common in the Albany-Fraser Orogen) also play a major role in determining the position
Prediction
0500
100015002000250030003500400045005000
1940 1960 1980 2000 2020 2040 2060
Year
Ann
ual F
low
-Wei
ghte
d Sa
linity
(m
g/L
TDS)
Salinity Data 10 Yr Backward Moving AverageIndicative Range of Salinity Increase

5: Dryland salinity
-106-
of salt-affected areas (Clarke et al., 1998). The distribution of sedimentary deposits within the landscape is another important factor as seepage occurs where permeable sediments are exposed. Salinity is also more likely in soils containing layers with low permeability (such as heavy clays or hardpans) because these layers restrict drainage and so limit leaching and cause salts to accumulate. It is important to remember that although soil type at a site contributes to the salinity hazard, the hydrological process are often more important. For example, although well drained, highly permeable soils (such as deep sands and deep gravels) tend to have low salt stores, they often play a major role in providing recharge which then affects areas downslope. In addition, a deep sand located on the discharge area of a saline aquifer often has a much higher salinity risk than a heavy clay on a ridge crest. 5.2.4 Dryland salinity research in the South-west Hydrological Region The link between land clearing and salinity was becoming evident by the end of the 19th century. Despeissis (1895) observes that salt patches were not uncommon in hollows or at the base of sloping ground, and generally followed up the clearing of the land. However it is Wood (1924) that is generally credited with recognising the hydrological link between clearing and salinity, based on his observations in the Great Southern in the 1890s. Teakle (1938) investigated salt movement in soil profiles at Wagin and Broomehill. Bennett and McPherson (1983) provide a good summary of much of the earlier work and extensive research into the causes and mechanisms of dryland salinity has been conducted in the South-west Hydrological Region since the 1980s. Significant research to be undertaken in the Region includes: • Long-term studies of the effect of clearing on the water balance and salinity in five small
catchments in the Collie district (Peck and Williamson, 1987). These were initiated in 1973 in response to concerns about water quality in Wellington Dam and demonstrated conclusively that the water table responses to clearing. These studies also provided information on the processes involved.
• Investigations into the impacts of agricultural development on surface water resources (Schofield et al., 1988) and vegetation strategies to reduce stream salinity (Schofield et al., 1989).
• The influence of clearing and land use on stream salinity in the Manjimup area (Trotman, 1974). • Investigations of sub-surface salinity in relation to landforms and the depth of weathering in the
eastern part of the Murray River catchment area (Johnston and McArthur, 1981) • Studies of salt stores in soil profiles in the Manjimup district (Johnston et al., 1980). • Studies on the amount of water used by various vegetation types and the potential for trees to
lower saline groundwater, summarised by Greenwood (1986) and Greenwood et al. (1985). • Investigations to identify the role of dolerite dykes in the development of saline seeps and the use
of magnetometers to identify the location of dykes (Engel et al., 1987; 1989). • Detailed investigations of hydrological processes and salinity in the catchments of Lakes
Towerrinning (George et al., 1994) and Toolibin (McFarlane et al., 1987; De Silva, 1999). • Long-term studies in a number of catchments on the effect on groundwater levels of tree planting
and farming systems that reduce recharge (Smith et al., 1998; George et al., 1999a).

5: Dryland salinity
-107-
5.3 MANAGING DRYLAND SALINITY
As the hydrological processes that result in dryland salinity are complex and mostly happen below the ground surface where they cannot be seen, they are often very difficult to conceptualise. This is the case even for people with solid technical backgrounds. In trying to convey the concepts to others, these people are usually forced to make simplifications to get the message across. This is one of the reasons that a number of misconceptions have developed in the general community regarding salinity and related hydrological processes. Throughout the remainder of this section, a series of boxes will be used to explore some of these misconceptions. Modelling by George et al. (1999a) revealed that in the future we must expect to cope with significantly more saline land in Western Australia and we need to plan for the consequences. Salinity management is more realistic than salinity control. Finding ways of adapting our farming systems to recover, contain or “live with” dryland salinity will be a major challenge (see Box 5.1). In the lower rainfall districts, reversing the current trend of rising saline water tables while maintaining agricultural productivity may not be a realistic option in the short to medium term. First, however, we first need to focus on changing the water balance created by our present farming systems. Our approach to dryland salinity needs to incorporate methods of reducing groundwater recharge and accelerating groundwater discharge. We also need to develop farming systems that incorporate salt tolerant species to make productive use of the land that is already salt-affected. BOX 5.1: IS THERE ONLY ONE WAY TO SOLVE THE SALINITY PROBLEM?
Ever since dryland salinity was first recognised as a problem in Western Australia, people have been searching for a simple, straightforward solution which will provide all the answers in one quick hit. Unfortunately there is no such thing. At various times, concepts such as interceptor banks, commercial tree plantations, groundwater pumping, perennial pastures, water divining, electromagnetic surveys, deep drainage and other “large” engineering works have all been promoted as the solution for “salinity salvation”. The promotions were not due to the proponents (both in government and the private sectors) having a deliberate intention to mislead, it was just the result of their enthusiasm for something that they truly believed in. While the existence of a simple, single solution is very attractive, it is not realistic and can be very counter productive. Salinity is a complex problem and the environment and hydrological processes are highly varied, as can be seen in Section 4. A solution that works for a local flow system in a high rainfall area may have little relevance to regional aquifer discharge in a low rainfall district. Each situation involving dryland salinity has its own peculiarities. Sometimes these differences are only minor, however in other cases they are highly significant. So it is crucially important to realise that there is no a single, overall solution to salinity problems just waiting to be found. Solutions will require a blend of approaches tailored to meet local conditions. The desire for a simple answer can distract us from developing the complex solutions that are necessary. When false hopes are built up by a touted solution and then dashed, people become discouraged and less willing to put in the effort required to combat salinity using a blend of approaches. It is a waste of effort arguing whether or not deep drainage or tree planting are the way to go - both will be necessary and we need to ensure that they are applied in the right context. Adopting farming systems that lower recharge should be considered an essential part of any approach to reduce groundwater recharge. Strategies that do not tackle the root cause of extra water in the catchment can only provide "band-aid" solutions to dryland salinity. The objective of lower recharge farming systems is to replace our current agronomic practice with alternative, economically viable systems that reduce the amount of water percolating below the root zone (Nulsen and Baxter, 1982). The approach involves incorporating crops, pastures and other vegetation that increase evapotranspiration, while maintaining or increasing monetary returns. Plants that can play a role in lower recharge farming systems include: • Trees, which combine the advantages of deep root systems and year round growth with higher
water use due to their large leaf area, • perennial pastures capable of growing throughout the year (e.g. Phalaris and lucerne), and • to a minor extent, deeper rooted and longer persisting annual crops and pastures. Protecting and enhancing existing remnant vegetation (to maintain existing water use) can also contribute to reducing groundwater recharge.

5: Dryland salinity
-108-
Reducing recharge by increasing water use alone is unlikely to be a viable solution for managing the salinity on agricultural land in the short-term. Over most of the agricultural area, it is unlikely to lower groundwater levels sufficiently. Surface drainage (to divert or remove surface water) as well as accelerating discharge through groundwater drainage and pumping (to intercept in-flowing groundwater and lower water tables) also have important roles to play. BOX 5.2: IS THE SALINITY ON MY LAND CAUSED BY RECHARGE ON SOMEONE ELSE’S
PROPERTY?
Since the mid 1980s there has been a strong emphasis on developing a “catchment focus” for salinity control. Although this type of approach is very important when dealing with hydrological processes related to land degradation, it tends to reinforce the message that individuals have little influence acting by themselves. These messages, while promoting co-operation amongst neighbours, can be particularly negative and discouraging for people farming at the lower ends of catchments. Landholders on low lying flats are often highly concerned about rising water tables and salinity. When they get the message that their problems are due to groundwater flows resulting from recharge in the upper catchment, they can feel powerless to act. However, the situation is rarely this hopeless. It is a mistake to think that all recharge comes from hilly terrain a long way away. Upslope recharge may be an important factor, but most salinity is driven by local groundwater flows. Recharge normally accumulates where it occurs and, where local flow systems are involved, it is usually a case of “your recharge, your salt”. The water that falls or ponds on valley floors is a major source of recharge. Even if the flats receive discharge from intermediate or regional flow systems (transported through faults or sediments), localised recharge remains an important factor. This recharge even occurs on areas that are already saline. On flats with shallow water tables, there is only a short distance for the water to travel from the ground surface before it recharges the groundwater. This is a much more direct pathway for recharge than infiltrating high in the landscape and moving slowly downslope through aquifers. Recharge on the flats may occur in the space of hours or days. Although recharge from upslope usually takes many years to arrive, the pressure effects can result in much more immediate water table rises on the valley floor (see Box 3.3). The large volumes of water that accumulate on the valley floors through surface runoff also contribute to the high rates of recharge in this part of the landscape. However, once the water table has reached the ground surface, any additional water will either become runoff or will pond and eventually evaporate. Landholders in the valleys can do something to combat salinity for themselves. Perennial vegetation can be established in well drained areas to minimise recharge. In poorly drained areas (or in those which are already saline) surface drainage can be installed to remove water quickly if there is a suitable disposal area. Groundwater management options include deep drainage and pumping. It is still important that neighbours co-operate to fight salinity together and that those in the upper catchment bear some responsibility for what is occurring downstream. Surface water management needs to be coordinated on a catchment basis and groundwater needs to be managed at the scale of the whole flow system - be it a regional, intermediate or local flow system. Strategies to combat salinity often need to be undertaken on a catchment basis to be successful. The hydrological cycle pays absolutely no regard to property boundaries. While many landholders have outbreaks of dryland salinity that relate to local flow systems operating under hillslopes within their property, the discharge of saline groundwater is also associated with intermediate or regional flow systems (see Section 3.2.2). Discharge from local flow systems can often be managed by landholders on their own property. In some cases, the local flow system may originate on an adjoining property and co-operation with the neighbour may be necessary. Many properties will be affected by a combination of local and intermediate flows. A number of landholders (and other interested parties) will need to develop a coordinated catchment approach where intermediate or regional flow systems are involved. In these systems, much of the recharge originates on properties further away and landholders trying to manage the problem in isolation from each other will be much less effective. A whole catchment approach is also important where surface drainage is involved. The fact that any water drained from that property is likely to have an effect downstream needs to be

5: Dryland salinity
-109-
addressed. It is only by working together that landholders can hope to have any lasting impact on the problem of dryland salinity. BOX 5.3: HOW QUICKLY DO GROUNDWATER LEVELS RESPOND TO CHANGES IN THE
HYDROLOGICAL BALANCE?
When people discuss the way that groundwater responds to hydrological changes, they often give the impression that things will happen relatively quickly. The effects of clearing the native vegetation are usually presented as a “before and after scenario”, with a diagram showing low water tables under bushland followed by a diagram showing high water tables and saline discharge under farmland. The unintended implication is that the water tables in the lower catchment rose almost as soon as the bush was cleared. Reports of water table levels beneath tree plantings (especially in upper slope positions) falling significantly within a few years of establishment further add to the impression of rapid groundwater responses. Localised rapid responses often occur, but they are only part of the story. There may be a considerable lag time between the changes to the hydrological balance and the resultant changes in water table levels throughout the catchment. Altering the amount of recharge occurring on a piece of land may influence the groundwater directly below that land relatively rapidly, but it will take much longer for the full effects to be felt in the groundwater system further away. Although much of the Wheatbelt has been cleared for many decades now, the full effects of the removal of the native vegetation are still to be experienced. It is expected that water tables in the Wheatbelt will not come close to an equilibrium until after 2060 (State Salinity Council, 2000a), and the changes are expected to continue for centuries. Close to the coast, where rainfall is high and the landscape more undulating, lag times are in the order of decades and some areas have already reached their new equilibrium. A discharge area will not expand until the rate of water flow into the area exceeds the rate of discharge (including lateral groundwater flow away from that area). In the Wheatbelt and both Woolbelts, many of the groundwater systems are incapable of discharging any more water without increasing the size of salt-affected area. This situation is comparable to a bathtub with very small plug hole and both taps fully on. The water is flowing in faster than it can drain out and in time the bath will overflow. Even if we could turn the taps off completely (i.e. reduce recharge to pre-clearing levels), it is going to take a long time for the bathtub to empty. However, all we are likely to achieve is to slow the rate at which the water comes out of the taps (i.e. slow recharge rates a little). The bathtub analogy contains one major flaw. It implies that water will move very quickly from the recharge areas to the valley floor (just as water flows from the tap into the tub). Nothing could be further from the truth. A major reason for the lengthy lag times mentioned is that, as a result of the low permeability rates of aquifers and low hydraulic gradients, lateral groundwater flows are usually incredibly slow (see Tables 3.4 and 3.5). The movement of water under the ground should not be compared to water flow in pipes (see Box 3.3). The hydraulic pressure exerted by increased groundwater recharge upslope will affect piezometric head lower in the landscape well before the extra water can travel downslope. But this increase in hydraulic pressure is only the “first instalment” of the changes to come, as the rising water tables upslope will eventually lead to increased flows to the lower landscape (until discharge and recharge rates reach an equilibrium). Because of these lag time, it is unreasonable to expect a quick response to any steps taken to reduce recharge. By itself, upslope recharge management cannot lower water table levels on the valley floor. What it can achieve is a reduction of hydraulic gradients, thereby slowing the rise of the water table downslope. For this reason recharge management in the upper landscape is essential for long-term salinity management, but the problem also needs to be addressed in the lower parts of the landscape (see Box 5.2). Treatments in the lower landscape will often need to involve a combination of increased water use, surface drainage and groundwater management.

5: Dryland salinity
-110-
5.3.1 How can dryland salinity be identified? Extreme examples of dryland salinity are highly visible, but it is not always easy to recognise areas affected by milder salinity or identify areas where salinity problems are still developing. Even when there are obvious signs of salinity, it is usually a good idea to make a few simple measurements to confirm the presence of salts. The “Farm Monitoring Handbook” (Hunt and Gilkes, 1992) provides detailed discussion of various ways to identify salinity. For details on comparing the various units of measure for salinity see Section 1.4. Visual identification Typically, changes in the health, performance and composition of vegetation are the initial indicators of a developing salinity problem. The first plants to be affected by rising saline water tables are usually deep-rooted species such as trees. Signs to watch out for include slow tree growth and the yellowing of leaves with scorching around the leaf margins. As salinity increases the tree will start to lose leaves and die. Naturally susceptible species, such as karri (Eucalyptus diversicolor) will be affected sooner than tolerant species such as swamp oak (Casuarina glauca). Trees under stress due to salt are also more susceptible to diseases and attack by pests. Species with shallower root systems, such as annual crops and pastures, do not show indications of developing salinity until saline water tables rise closer to the surface. Slow growth, stunting, yellowing of leaves and scorching of leaf margins are once again indicators. Growth rates of crops and pastures may be reduced by up to 30% before there is any sign of plant damage. Changes in pasture composition are also a good indicator of salinity. As salinity develops, susceptible species such as subterranean clovers and capeweed begin to die out and become replaced by tolerant species such as barley grass (Hordeum spp.) and button weed (Cotula spp.). Rye grass (Lolium spp.) is also likely to disappear, but may persist in moderately saline conditions where nitrogen is available. It needs to be remembered that the signs of salinity discussed above may also be indicative of other factors such as waterlogging, nutrient deficiencies or soil structure changes. In cases of severe salinity there is widespread plant death with only highly tolerant species, such as samphire, being present. In the worst affected areas the land surface becomes bare and scalded with only the “skeletons” of dead trees present. White salt crystals may also be visible on the surface when it becomes dry, although the crystals are hard to see because they are very small. Surface waters can provide another visual clue to the presence of salinity problems. Soils in salt-affected areas often remain moist or boggy well into summer as groundwater continues to discharge. Water in dams or streams that is usually cloudy or muddy can become quite clear when salinity levels rise. Soil testing Accurate site assessment of salinity from soil samples is time consuming, expensive and results can be highly variable. Salt stores in the soil can vary greatly over short distances as well as with time of season, making comparisons between measured levels of soil salinity and plant performance difficult. Despite these limitations, measuring the salinity of a few soil samples from an area can provide a relatively quick indication of salinity problems. It is best to sample the soils in summer or autumn when they are relative dry and salinity levels are highest. Samples can be sent to a laboratory for analysis, or a field measurement can be made with a pocket salinity meter on a mixture of one part soil and five parts distilled water. Soil salinity readings (EC1:5) of over 20 mS/m in sands and over 40 mS/m in clays indicate salinity problems. Observation wells or piezometers Observation wells and piezometers can be installed to monitor the salinity and level of water tables and can provide advance warnings of developing salinity problems. Both consist of tubing (usually PVC) sunk into the ground, typically to depths of 2-10 m. In piezometers, the lower 1-2 m of the pipe are slotted to allow water to enter and the level of the water in the pipe will reflect the water table level or piezometric head of the aquifer at that depth. In observation wells, the whole length of the pipe is slotted. Observation wells are typically used to monitor unconfined aquifers while piezometers are typically used to monitor confined aquifers (see Box 3.1). Salinity levels in groundwater are less variable than salinity levels in soil and provide another indication of the severity of the salinity problem. Water salinity levels of over 550 mg/L indicate potential salinity problems, especially if the water table rises to within 2 m of the surface. By monitoring how quickly the water tables is rising over a period of 2-10 years, it is possible to predict

5: Dryland salinity
-111-
when problems are likely to be experienced on the surface. In the longer term the effectiveness of any treatments used to control salinity can be assessed. Hunt and Gilkes (1992) provide details on installing and monitoring observation wells and piezometers. Geophysical surveys Geophysical surveys can be used to assess and monitor dryland salinity as well as to identify geological structures contributing to salinity outbreaks. Electromagnetic induction meters are portable instruments that provide reliable estimates of soil salinity without intensive soil sampling and analysis. The EM38 measures salinity in the top 0.5-2.0 m of the soil, the EM31 measures to 6 m and the EM34 measures to 60 m. Surveys can be undertaken at paddock or farm scale using a hand held or vehicle mounted meters. For larger areas, surveys can be conducted from an aircraft. Bennett et al. (1995) describe the correct operating, surveying and calibration of the EM38 under Western Australian conditions. Calibrations between apparent and measured salinity levels indicate that the EM38 is able to accurately predict salinity in the root-zone with 90% accuracy. As a general guide to assessing readings on the EM38, ECa values of: 0-50 mS/m indicate low salinity, 50-100 mS/m indicate moderate salinity, 100-150 mS/m indicate high salinity, >150 mS/m indicate severe salinity. Section 1.4 discusses the relationship between ECa values and other measures of soil salinity. Table 5.6 presents a guide to the salinity tolerance of some tree and pasture species based on EM38 measurements. Geophysical surveys for salinity analysis may include: • magnetics, which are used to map geological structures such as faults and dolerite dykes that
influence groundwater flows, and • radiometrics, which show patterns that assist with the mapping of soil properties, such as
mineralogy and texture, which in turn may help to identify areas of high recharge. Interpreted together with electromagnetic surveys, and other information collected in the field, these surveys can be very helpful in building a picture of the hydrological processes occurring in an area. This enables experienced hydrologists to identify areas at risk of dryland salinity (George, 1998). BOX 5.4: IS A HIGH SALT STORE THE SAME THING AS A HIGH SALINITY RISK?
With the increasing use of geophysical surveys, more and more landholders are being presented with a series of coloured maps of their property or district. These maps show a variety of themes and some of the maps show areas coloured red to denote high salt stores. Where these red areas cover a large proportion of an individual’s property, it typically causes that individual a great deal of concern. Often this concern is unnecessary, as it is the result of the interpretation of the map being poorly explained. It is important to check the actual values of the salt store on the map legend. On many maps the full range of colours (from blue for salt stores at the lower end of the range to red for salt stores at the higher end of the range) has been used regardless of the range of the values. Areas with the same salt store will often appear as different colours on different maps, depending on the salt values in the surrounding area. An area that appears red on a map of a property with very low salt stores, may be coloured blue if it occurs on a property with very high salt stores. Salt stores are high throughout Western Australia and if the weathering profile under the property is deep, then high salt store values can be expected. Two profiles may have similar salt stores per cubic metre, but if one profile is five times as deep as the other, its salt store will be five times greater. It is also important to remember that areas with high salt stores will not necessarily become saline. If the water table is a long way below the surface, then the risk of that piece of land becoming saline is very low because there is no mechanism to carry the salt upwards. This is the situation under many of the gravelly hills and uplands in the Forested Hills and both Woolbelts. However, this salt can be leached and transported laterally by the groundwater, through saprock aquifers to discharge areas.

5: Dryland salinity
-112-
5.3.2 What changes can be made to agricultural practices? Lower recharge farming systems Increasing the amount of water used by plants present in the farming system is crucial to reducing recharge to combat salinity. Table 3.8 in the previous section gives an indication of the relative water use by a variety of species, and Table 5.4 below provides an estimation of the effect of different farming systems on recharge. Although most rain falls during winter, water use in the warmer, drier months has the most significant effect on reducing water tables (see Box 5.5). Only the deeper rooted perennials continue to use water into the late summer, so rooting depth is the key to reducing recharge. BOX 5.5: DO PERENNIALS USE MORE WATER THAN ANNUALS DURING WINTER?
Because perennial grasses, shrubs and trees are referred to as high water use species, it is often assumed that they always use more water than annual species. This is not the case. Little water is used by either perennial or annual species during the wet months of winter. Large volumes of water infiltrate into the soil during winter, but the plants’ water demand is reduced due to low temperatures which slow growth and evaporation. For this reason, there is no significant difference in water use by perennial and annual species during the winter months. Ward et al. (1981) showed both lucerne and clover at Katanning using water at rates indistinguishable from potential evapotranspiration during winter and early spring. In this part of the year, most water returns to the atmosphere through evaporation rather than transpiration. However, perennials do use more water than annual species in the late spring, summer and autumn. With rising temperatures, declining rainfall and higher vapour pressure deficits in the spring, there is an increase in both plant growth and evaporation rates, so the plants’ need more water. By the end of spring many of the annual species are no longer transpiring because they have flowered seeded and dried off. However, perennial species continue to grow and transpire and often well into summer. It is worth noting that many perennial pastures effectively act as long season annuals only. An example is Phalaris, which uses water until the soil profile is dried out. From then on, this grass ceases to grow until rains fall and the soils moisten up again. The deeper rooted perennials are the highest water users. Trees, for example, are able to access subsoil moisture from greater depths and continue growing well into the summer. Even through to autumn, they continue to transpire significant amounts of water. Systems designed solely to increase the water use of annual crops and pastures are only likely to result in minor changes to recharge (Nulsen and Baxter, 1982). However, it remains important to address water use by annual crops and pastures since they remain the predominant land use over much of the South-west Hydrological Region. Crops and pastures that develop deeper roots and persist longer into the spring will use more water than those that grow poorly and senesce early. Selecting species or varieties matched to the environmental conditions (e.g. oats or lupins rather than wheat or barley on acidic deep sands) and good management of fertilisers and grazing will all help extend the period of water use by annuals. The user friendly computer package, AgET (Argent and George, 1997), available from Agriculture Western Australia, can be used to predict the effect of agronomic manipulation (including the use of trees) on recharge rates at a specified site. Table 5.4 presents estimates calculated for a number of small catchments in both of the Woolbelts. It can be seen that serradella, continuous cereal cropping and a 1:5 cropping rotation would have small impact on recharge, while tagasaste and lucerne are likely to reduce recharge significantly. These trials highlight the relative amounts of recharge only. It is likely that the true impact of recharge control on a paddock scale would be less than shown because of variations in crop and pasture establishment and performance, as well as the effects of grazing pressures.

5: Dryland salinity
-113-
Table 5.4: Estimated recharge occurring under various land uses at five trial catchments.
Land use Estimated recharge (expressed as a percentage of the recharge under clover based
pastures) Catchment location Williams Kojonup Darkan Frankland Dinninup Average annual rainfall 543 mm 465 mm 560 mm 512 mm 620 mm Serradella based pasture 90% 100% 100% 100% 100% 1:5 cropping rotation 90% 100% 100% 100% 100% Continuous cereal cropping 85% 90% 90% 90% 90% 4 years lucerne: 3 years cereals 35% 45% 60% 60% 60% Perennial grasses 35% 35% 55% 45% 50% Tagasaste 0% 45% 30% 30% 50% Lucerne 15% 25% 40% 40% 40% Native vegetation (pre-clearing) 0% 0% 0% 0% 0% Note: The model was run over the period 1956-1993 using the dominant soil type for each catchment. Adapted from: Smith et al. (1998)
Adopting farming systems that lower recharge requires careful planning. Good site selection and management are essential when incorporating higher water use plants into a farming system. If plants are established on unsuitable sites they will not grow well and will make little contribution to reducing recharge or improving farm profitability. A good example is the Tasmanian blue gum plantings established in the Western Woolbelt in the late 1980s and early 1990s around the edges of saline groundwater discharge areas. It was hoped that these plantings would contain the salt outbreak and provide timber for wood chips, but many trees did not survive because they were planted directly over rising saline water tables and this species has a low salinity tolerance (Bennett and George, 1995). It would have been better to locate the plantings further upslope. Even away from groundwater discharge areas, many Tasmanian blue gum plantations have been unsuccessful because the trees are sensitive to drought and high summer temperatures. Many of the perennial pastures established in the Region have also failed because appropriate grazing management has not been adopted. It is also important to understand the economic ramifications of changing farm management practices. Many of the species are costly to establish and there is often a short-term loss in productivity and income. In some cases (e.g. tree plantings) it can take years before economic benefits are realised. BOX 5.6: DOES RECHARGE OCCUR MAINLY IN DISCRETE AREAS?
The concept of recharge areas has been promoted heavily over the past 20 years. Unfortunately there is often the implication that there are certain identifiable parts of the landscape which contribute the bulk of the water responsible for raising water tables. This encourages perceptions such as “that sand patch in the top paddock up there is the main problem” or “I can’t do anything about rising water tables on my property because all of the water is coming from my neighbours further up the catchment”. Water use needs to be improved across the entire catchment. Even heavy clay soils should be viewed as a recharge risk. It is important to understand that nearly all of the landscape acts as a recharge area, but at varying rates. In low lying areas that are already badly affected by salinity, recharge and discharge often alternate depending on the season (see Box 5.2). Some areas, such as patches of deep sand or gravelly hills and ridges, do make a disproportionately high contribution to recharge. These areas of high recharge should have top priority for treatment. However, it is a mistake to think that recharge can be controlled purely by concentrating purely on small, higher recharge areas. The rate of recharge on a deep sand may be at a rate seven times as high as on the duplex soils covering the remainder of a catchment. However, if that sand covers only 5% of the catchment, it will only contribute less than 30% of the recharge occurring over the entire catchment. In this case, concentrating recharge control on the area of sand alone would mean doing nothing about 70% of the water responsible for raising the water tables. If that deep sand covered 30% of the catchment, then it would contribute about 75% of the entire recharge. This demonstrates the importance of identifying the rates and extent of recharge areas.

5: Dryland salinity
-114-
Crop and pasture management Sedgley et al. (1981) suggested that water use can be increased by improving crop and pasture management to maximise productivity. Nulsen (1993) calculated that cereal crops growing on degraded (acidic and compacted) sandplain soils could potentially use an additional 17-56 mm of water each year through appropriate fertiliser applications, deep tillage and the addition of lime. It is now widely believed that there is only a limited potential for increasing the water use of conventional annual crops and pastures. Hall (1998) showed that crop yields and the leaf area of canola could be significantly increased through fertiliser applications, but these had little impact on water use. Even when crop water use is increased, this is often balanced out by a decrease in evaporation from the soil, so that overall rate of evapotranspiration (and the total amount of water leaving the soil) stays the same. On a heavier soil in a low to medium rainfall district, doubling crop yield may only reduce recharge by 5% (State Salinity Council, 2000a). Keeping these limitations in mind, it is still worthwhile aiming for maximum productivity from crops and pastures. Given the large proportion of the landscape that will remain under annual crops and pastures, a minor increase in water use is better than nothing. Even if there is no significant reduction in recharge, the increased production should help improve profitability and can reduce the risk of other forms of degradation such as erosion. The selection of suitable species for soil and site conditions is an important step to improving plant performance. In many cases improved plant productivity can be achieved through improved fertiliser and pest control practices. Steps taken to combat soil structure decline, soil acidity and non-wetting problems will also help. Section 7.3.2 provides information on ways to improve crop and pasture growth on waterlogged land. Section 7.3.3 covers the drainage of waterlogged areas, which is another way of improving productivity. Cropping options As is the case with improving plant productivity, it is doubtful whether recharge can be significantly reduced by replacing pastures or cereal crops with “high water use” crops, such as canola (Brassica napus) and lupins (Lupinus spp.). Gregory (1998) and Ward et al. (in press) found that it is unlikely that annual crops would perform significantly better than annual pasture in terms of water use on duplex soils, because of the physical and/or chemical restrictions to root growth. However, the “high water use” crops are often more profitable, even if they make a marginal contribution to recharge management. It is the species which are deep-rooted, or have a longer growing season, that are more likely to have some impact on the water balance. These “high water use” crops are more effective on soils where there are no limitations to rooting depth (i.e. on the deeper sands and gravels where water can percolate quickly beyond the reach of shallow-rooted species). Warm season crops such as maize (Zea mays), sorghum (Sorghum spp.), sunflower (Helianthus spp.) and millet (Panicum mileaceum) may have more potential to reduce recharge, as they continue to transpire into the summer. So far their effectiveness in Western Australian conditions has been variable. These crops are most likely to be successful where there is a sufficient storage of good quality (non-saline) water within the rooting zone during the summer months. Growing a warm season crop may extend the rooting depth of the following crop. Other benefits from planting these crops include improved nutrient recycling and weed control. Pasture options Higher water use annual pastures that are suitable for well drained sites include the deep-rooted yellow serradella (Ornithopus compressus) and arrowleaf clover (Trifolium vesiculosum). Balansa clover (Trifolium michelianum) is suited to waterlogged sites. Perennial pasture species, which continue to live from year to year and produce new shoots from underground storage structures at the beginning of each growing season, have potential to reduce the spread of dryland salinity in higher rainfall districts (>600-700 mm/year) because they have deeper root systems and a longer growing period than annual pastures. Ward et al. (in press) showed that lucerne used 50 mm more water than clover pasture in a year, mostly in late spring and early summer, at a site in the Eastern Woolbelt. Perennial pastures usually consist of a mixture of perennial species and annual species (such as subterranean clover and various grasses). If they are established successfully in suitable locations, managed well and fertilised adequately, perennial

5: Dryland salinity
-115-
pastures have the potential to provide a more even pattern of green feed throughout the year as well as reducing weed growth, soil structure decline, acidification and erosion. Greathead et al. (1998) showed an average benefit of $45-65/ha from introducing perennial species into pastures grazed by cattle at three high rainfall sites. Biddiscombe et al. (1982) considered perennial pastures to be a viable proposition across all landscape positions south of a line joining Busselton, Bridgetown, Lake Muir and Mt Barker. This line has become known as the “Biddiscombe Line” and the area south of this line is the part of the South-west Hydrological Region least affected by dryland salinity. Here, suitable perennial species include tall fescue (Festuca arundinacea), kikuyu (Pennisetum clandestinum), perennial ryegrass (Lolium perenne), cocksfoot (Dactylis glomerata) and phalaris (Phalaris aquatica). Greathead et al. (1998) provide information on the establishment, management and economics of these pastures and emphasise that grazing management has to be suited to the needs of the plants. Over grazing pastures in summer/autumn can lead to the loss of perennial species. To the north of the “Biddiscombe Line”, where salinity problems are widespread, areas that are currently considered suitable for establishing perennial pastures are more limited. The productivity and persistence of perennials are less certain, especially in drier upper slope positions. As a result careful site selection, finding the right “niche” for the pasture, is especially important. Table 5.5 summarises some perennial pasture species potentially suitable for areas receiving less than 800 mm rainfall. Table 5.5: Perennial pasture species potentially suitable for areas receiving less than 800 mm
rainfall. Species Minimum
rainfall needed (mm)
Water-logging
tolerance
Soil salinity tolerance
(maximum EC1:5 mS/m)
Drought tolerance
Preferred soils
Chicory 500 Nil 20 High Deep sands/gravels Cocksfoot* 450 Nil 20 Moderate Sandy/loamy earths & gravels Consol lovegrass 550 Nil 20 High Sands, gravels & loams Couch 350 Moderate 35 Moderate Deep sands Lucerne 400 Nil 20 Moderate Sands, loams and gravels*** Kikuyu 700** Moderate 20 Moderate Sandy/loamy earths & gravels** Phalaris* 400 Moderate 35 High Sandy/loamy duplex & clays Puccinellia* 350 Moderate 150+ Moderate Sandy/loamy duplex Rhodes grass 400 Nil 70 Slight Sands and loams Salt-water couch 300** Very high 150+ Nil Wet soils Sheep’s burnet* 350 Nil 20 High Deep sands Strawberry clover 500** Very high 35 Moderate Clays & shallow duplexes Tall fescue 500 Moderate 70 Moderate Loams and clays Tall wheatgrass 350 Moderate 70 High Sandy/loamy duplex & clays Veldt grass 300 Nil 20 Moderate Deep sands & sandy earths *Active growing season is between autumn and spring with minimal water use in summer. ** Requires profile to be moist during summer months. *** Requires profile to be well drained. Adapted from: Sudmeyer et al. (1994). Lucerne (Medicago sativa) is one perennial species with a potential to be useful on many recharge areas. A planting established at Kojonup on a hill slope underlain by fresh groundwater produced significant quantities of out-of-season feed and appeared to be reducing recharge (Smith et al., 1998). Other species with potential for recharge areas include chicory (Cichorium intybus), consol lovegrass (Eragrostis curvula), couch (Cynodon dactylon), cocksfoot, veldt grass (Ehrharta calycina) and sheep’s burnet (Sanguisorba minor). Phalaris has been shown to have good persistence in a variety of areas, but prefers heavier soils and so is often better on the lower slopes. Care has to be taken when grazing phalaris pastures because toxicity problems sometimes occur. Rhodes grass (Chloris gayana) and tall fescue are also best on the lower slopes where summer moisture is available. Tall wheatgrass (Thinopyrum elongatum) consistently produced 4-10 kg/ha of feed between November and April on brackish to saline valley floors at Kojonup (Smith et al., 1998). Puccinellia (Puccinellia ciliata), salt-water couch (Paspalum vaginatum) and strawberry clover (Trifolium fragiferum) are other species that can be grown on saline groundwater discharge areas. Native perennial grasses that could be included into grazing systems include kangaroo grass (Themeda spp.), wallaby grass (Danthonia spp.) and meadow rice grass (Microlaena stipoides).

5: Dryland salinity
-116-
Little is known about the establishment, nutrition and management of these grasses under Western Australian conditions. BOX 5.7: ARE PERENNIAL SPECIES CAPABLE OF DRYING OUT SALINE FLATS?
People are often tempted to establish perennial pastures, shrubs or trees on (or around the edges of) land that is already saline only. This is seen as a way of tackling the problem of salinity without sacrificing too much of the productive land” on the property. The hope is that these plants will lower the water table while also producing some return from the land. In most cases these hopes are dashed. The plantings either fail to establish, produce stunted unhealthy growth or start growing strongly and then die after a couple of years. In most cases the effect on water tables is negligible and the cost of establishment has been wasted. It is important to remember that most species cannot use saline groundwater. As was pointed out in Box 5.8, very few species are capable of extracting water directly from the water table. Plants will also make little use of the water in the capillary fringe, which will have high concentrations of salt if the underlying aquifer is saline. The exceptions are salt tolerant species such as salt river gum (Eucalyptus sargentii) and salt-water couch (Paspalum vaginatum). Even these species have limits on the salinity of the water they can use. As part of their strategy for dealing with saline conditions, salt tolerant species tend to transpire less than plants with access to fresh water, so they are less effective in lowering water tables. A common mistake is to plant non-tolerant perennials too close to the margins of saline areas where the land appears to be unaffected by salinity. Shallow-rooted annual pasture may be performing well here, but the deeper rooted species are likely to have their growth stunted when their roots reach the underlying saline water table. As these water tables are often rising, the success of any plants may be short lived. It is important understand the salinity level, water table depth and rate of rise before attempting to revegetate such areas. Trees, shrubs and perennial pastures do have an important role to play in combating dryland salinity, but they need to be used intelligently. Instead of expecting perennials to dry up saline water tables, they should be used to reduce recharge, intercepting fresh groundwater before it reaches the saline aquifers. The plants need to be established where they will grow well and have maximum effectiveness. Suitable locations are over fresh water aquifers or in well drained recharge areas or where strong lateral groundwater flows occur. Areas just above the break of slope, where hydraulic gradients are relatively steep, are often good locations for planting perennials. Planting on saltland or its margins should be limited to salt tolerant species. While these plantings alone are unlikely to achieve major water table drawdowns, they can improve conditions in the topsoil allowing for the establishment of less salt tolerant pastures. Fodder shrub options Fodder shrubs have the potential to have a major impact on reducing recharge rates due to their relatively large leaf area and deep root systems. Patabendige et al. (1992) cover some of the species that may be suitable for the South-west Hydrological Region. Tagasaste (Chamaecytisus palmensis) is the fodder shrub most widely planted in recharge areas and can provide an important source of feed in late summer and autumn. There are numerous small scale plantings within the South-west Hydrological Region, though the most extensive plantations in Western Australia are located to the north of Perth. Tagasaste will grow in areas with as little as 300 mm annual rainfall and performs best on well drained soils such as deep sands and gravels where its roots can extend 10 m below the ground. As a result it is well suited to areas currently contributing large amount recharge, areas with poor conventional crops and pastures for example. Wiley et al. (1994) recorded water table falls of 0.5 m/year under a tagasaste planting at New Norcia, although further investigation is required to establish water use by this species under heavy grazing pressure and as the tree ages. Tagasaste is an important component of stock feed on some properties, filling the summer and autumn feed gap. It can also be grazed heavily in spring. With sheep, the shrubs have to be slashed or cut off every so often to make sure they do not grow out of reach. Cattle seem to be able to prune the tagasaste trees themselves. To date, few other fodder shrubs have demonstrated such a high potential for inclusion in south-west farming systems. Among the native species, golden wreath wattle (Acacia saligna) has been

5: Dryland salinity
-117-
established on some properties. Shrubs such as waterbush (Bossiaea aquifolia) and bookleaf (Dovecia cordata) provided feed for livestock during the early days of European settlement. Shrubs suitable for planting on salt-affected land are discussed under the heading “Saltland agronomy” below. Commercial farm forestry Introducing trees into a farming system is one of the best ways to increase water use. The effect of tree plantings on water table levels are well documented. For example, significant water table reductions of up to 2.5 m were achieved (in areas of the Wellington Catchment with a rising groundwater trend) by planting entire valleys or sub-catchments (30-80% of cleared area) to trees (Schofield et al., 1989). In areas receiving more than 800 mm there is a large variety of trees that can be planted for commercial timber production. The two species most widely planted on farmland are Monterey pine (Pinus radiata), producing softwood sawlogs, and Tasmanian blue gum (Eucalyptus globulus), mostly producing wood chips for paper pulp. Plantings for hardwood sawlog production are currently less common, but they are likely to increase in the future as the success of species like Sydney blue gum (E. saligna), bangalay gum (E. botryoides), spotted gum (E. maculata), rose gum (E. grandis) and blackwood (Acacia melanoxylon) is demonstrated. Many other species could also be considered. Opportunities for commercial timber production are a bit more limited in the Western Woolbelt, but there are still many suitable area, especially in the southern half where evaporation rates are lower. Many of the species mentioned above can be grown if site conditions are suitable. Other species that could be considered include wandoo (E. wandoo), river red gum (E. camaldulensis), sugar gum (E. cladocalyx), swamp mahogany (E. robusta), yellow box (E. melliodora), red box (E. polyanthemos), grey box (E. microcarpa) and red iron bark (E. sideroxylon). BOX 5.8: DO TREES ACT AS NATURAL GROUNDWATER PUMPS?
Trees, shrubs and perennial pastures are often talked about as if they act as some sort of natural pumping systems, extracting water from below the water table and disposing of it into the air. This concept may paint a nice image, but it can be quite misleading. The roots of a few species, such as Eucalyptus camaldulensis, can operate in saturated conditions, but the vast majority of plants do not directly access the groundwater stored in aquifers. Their roots do not grow or function well in the saturated conditions below the water table (see Section 7.2.2). The ability of roots to utilise groundwater is further reduced by high salinity levels. However, most plants do use water from above the capillary fringe (see Box 3.1) where there is a mixture of water and air which enables the roots to respire and grow. Once this water is extracted, more water to drawn up from the aquifer. This process can lead to a gradual lowering of the water table. Because of this indirect pathway of water extraction, it is more appropriate to think of the plants acting as wicks rather than as pumps. The other way in which deep-rooted perennial plants contribute to combating rising water tables is by their activity in the zone of aeration during summer. Plants reduce recharge by using soil water stored above the water table. By drying out the zone of aeration, they increase the volume of water needed to infiltrate and ‘wet up’ the soil profile once the winter rains begin. This provides a buffering effect, increasing the time period before recharge of the aquifers begins and thus reduces the total amount of recharge occurring that year. The potential of the Eastern Woolbelt and Wheatbelt for commercial timber production is yet to be demonstrated. The Department of Conservation and Land Management is currently promoting plantings of maritime pine (P. pinaster) for sawlogs in areas receiving 400-600 mm of annual rainfall. Jam tree (A. acuminata), brown mallet (E. astringens), York gum (E. loxophleba) and swamp oak (Casuarina obesa) could be grown for timber. A number of oil mallee species (E. horistes, E. plenissima and E. kochii) are currently being grown for oil and activated charcoal production. Sandalwood (Santalum spicatum) is a native of this region which produces a high value timber.

5: Dryland salinity
-118-
Tree plantings unlikely to produce commercially viable timber crops can still provide many benefits apart from increased water use. These include: firewood and fence posts for on-farm use, windbreaks, shade and shelter for livestock, visual enhancement and wildlife habitat. The extensive revegetation considered necessary by water resource managers to significantly reduce salinity may result in at least half of the area of a catchment being planted to trees (see Box 5.10). This approach is considered inappropriate by most farmers who view strategic planting on a smaller scale (e.g. 5-20% of catchment area) more favourably. Additional benefits may be obtained from integrating trees into the farming system (Lefroy et al., 1992). Planting 5-20% of the catchment may halt or slow the spread of salinity, but it is unlikely to return a catchment to its previous water balance without an additional reduction in recharge. BOX 5.9: HAVE TREE PLANTINGS FOR SALINITY CONTROL PROVED TO BE A FAILURE?
There is a small but growing perception that tree plantings have proved a waste of time when it comes to managing dryland salinity. This is partly due to unrealistic expectations of what the trees can achieve (see Box 5.1), and partly due to the wrong trees being planted in the wrong places. In most cases, tree plantings alone should not be expected to dry up a catchment any more than engineering options (see Box 5.12). Other reasons for tree plantings being viewed as failures include; • different areas have different flow systems operating, so what works in one area will not
necessarily work in the next, • the limited effect when only small, restricted areas are replanted (a small block of trees cannot be
expected to make a huge difference - see Box 5.6), • an expectation that decreased recharge in the upper catchment will have an immediate effect
lower in the landscape (see Box 5.3), and • trees being planted where they have a limited chance of success. The importance of matching the planting strategy to the site hydrology, and of matching species to site conditions, cannot be stressed enough. It is a waste of time planting trees where they are unlikely to grow. It is essential to ensure that the soil type, climate and rooting depth are suitable for the particular species being planted. Water table depth and salinity are also crucial considerations (see Box 5.7). After an analysis of over 80 sites in Western Australia, George et al. (1999b) suggest that trees are most effective when used to manage salinity derived from local flow systems. Trees planted in recharge areas are most likely to lead to significant reductions in water levels if considerable areas of the catchment are planted. Generally there was little drawdown of water tables more than 10-30 m away from the planted area. In groundwater discharge areas, trees were less able to lower water tables than they were in recharge areas (maximum drawdown of 2.5 m). Trees were particularly ineffective where the discharging groundwater was saline (more than 5,000 mg/L). That trees do not reduce water tables far beyond the extent of their root systems is hardly surprising and they should not be expected at act as groundwater pumps (see Box 5.8). The main role of trees and other perennial species is to relieve hydraulic pressure by reducing recharge, while pumps and drains reduce the hydraulic pressure on flow systems by increasing discharge,. The generally slow lateral movement of groundwater means that any fall in water tables underneath trees is highly unlikely to be spread rapidly across the whole aquifer. It is also unrealistic to expect water table drawdowns under recharge areas high in the landscape to be reflected in aquifers on the valley floor for some time (see Box 5.3). However, the rise of valley floor water tables can be slowed, or even halted, as the hydraulic pressure is relieved following drawdowns under upslope by tree planting. This may not occur immediately, but it can be crucial in the long-term as it is likely to take many years for the effects of the extra recharge occurring upslope to be felt downslope. If we wait until the impact of current recharge fully develops, it will be far too late to act.

5: Dryland salinity
-119-
Agroforestry is the integration of tree crops with the traditional agricultural practices of grazing livestock and cropping. The layout of trees on farmland is flexible. This means that trees can be planted in ways that fit the overall requirements of the farm. The most common ways of incorporating trees into farming systems are: • widely-spaced plantations, • block plantings - small plantations of closely placed trees, • alley farming - belts of trees alternating with strips of land used for cropping or pasture, and • tree belts - rows of one to several trees. Widely-spaced plantations or scattered trees also allow for some pasture or crops growth in intervening spaces. The arrangement can vary from a parkland style single trees to clumps of trees separated by wide open bays. The latter arrangement is more suited to farmers involved with cropping activities. Block plantings can be quite effective at lowering water tables on a localised scale (i.e. directly under the trees) but usually has a limited effect on groundwater under the remainder of the catchment. Block plantings of salt and waterlogging tolerant trees can be planted in groundwater discharge areas in some cases. Block plantings suit situations where: • there are high rates of recharge, • fresh groundwater flows can be intercepted before they reach saline aquifers, • there is only a limited extent of suitable soil for trees to be planted, and • the impact of trees on management practices over the remainder of the property needs to be
minimal. • Alley farming belts typically range from one to several trees wide, and the alleys are usually wide enough to allow access for machinery. Orientation of the alleys is determined by a combination of topography, prevailing wind direction and maximum sunlight exposure to the alleys. Where the alleys are broadly spaced, they will probably be more effective if they are situated across the slope to intercept throughflow. As well as producing timber and increasing water use across the landscape, the trees provide shelter and shade while allowing the continuation of conventional agricultural production. Alley farming has proved successful at Bridgetown, Duranillin and Boundain (east of Narrogin). Tree belts can be planted for specific purposes such as intercepting groundwater moving downslope, forming windbreaks around the edges of paddocks, protecting drainage lines and providing wildlife corridors. Again, the belts planted along the contour should be more effective at intercepting water than those running up and down the slope. Native vegetation management and revegetation Protecting and enhancing areas of remnant native vegetation on a property will contribute to overall water use as well as protecting wildlife habitat and biodiversity. Hussey and Wallace (1993) provide a good guide to managing remnant vegetation. Management can include fencing to exclude stock and allow for natural regeneration, controlling weeds, avoiding fertiliser drift and fire management. Native vegetation has particular value for salinity control where remnants are large enough to reduce recharge at a catchment or sub-catchment scale. Smaller remnants are also useful on high recharge areas such as deep sands, gravelly rises and around rocky outcrops, as well as in drainage lines, swamps and lakes that act as both recharge and discharge zones. Another option on these areas is native revegetation - through planting seeds or seedlings to regenerate the bush. Productive use of saline lands (saltland plants) Successful revegetation of saline areas with salt and waterlogging tolerant species will increase water usage, and may help to lower water tables. Saltland plants can also provide some production from what had become agricultural wasteland. While the productivity of saltland pastures may not compare favourably with that in non-saline areas, saltland plants can provide some valuable out-of-season feed. It can also improve the aesthetics of a property by removing an eyesore. Barrett-Lennard and Ewing (1998) suggest that successful saltland pastures can be developed using a combination of perennial and annual species. The main function of the perennials is to increase water use and thus decrease surface salinity and waterlogging, while the annuals provide the bulk of the fodder and nutrition. The success of saltland plants depends on a number of factors including: the degree of waterlogging and inundation, soil texture, the current severity of the salinity problem, the rate of water table rise,

5: Dryland salinity
-120-
species selection, establishment techniques and grazing management. Few species are tolerant of inundation or extended waterlogging. Salts are more likely to accumulate in the root zone and damage plants in soils with heavy textures than in deep sands. Table 5.6 presents a guide to some of the species that can be used in saltland agronomy. The salt tolerant plants are arranged into three groups based on the potential productivity of generalised land types. Future conditions also need to be considered in areas where saline water tables are rising and salinity is spreading. Table 5.7 comments on the justification of investing in saltland plants in a variety of situations. Table 5.6: Potential species for saltland agronomy. Generalised land type Potential species Non-saline: Fresh (EM38 reading of <50 mS/m, water table <5,000 mg/L) Water table 2 m or more below surface.
Pastures and crops: Annual clovers, annual ryegrass, perennial ryegrass, medics, chicory, wheat, canola, barley Trees: Jam (Acacia acuminata) Monterey pine (Pinus radiata), Tasmanian blue gum (Eucalyptus globulus), Sydney blue gum (E. saligna), spotted gum (E. maculata), rose gum (E. grandis), red box (E. polyanthemos), red iron bark (E. sideroxylon), maritime pine (Pinus pinaster), brown mallet (E. astringens)
High productivity potential: Some waterlogging but never inundated. Deep sands/gravels, sandy/loamy earths. Mild salinity (EM38 reading of 50-100 mS/m, water table <11,000 mg/L). Supports mixed pasture (no subterranean clover) often including some button weed and barley grass
Pastures and crops: Balansa clover, fescue, Rhodes grass, Phalaris, Kikuyu, oats Fodder shrubs: Golden wreath wattle(A. saligna) Trees: River red gum (E. camaldulensis), sugar gum (E. cladocalyx), yellow box (E. melliodora), grey box (E. microcarpa), swamp mahogany (E. robusta), flooded gum (Eucalyptus rudis), York gum (E. loxophleba), salt river gum (E. sargentii), wandoo (E. wandoo), moort (E. platypus var heterophylla), paperbark (Melaleuca preissiana), western myrtle (M. nesophila)
Moderate productivity potential: Waterlogged but rarely inundated. Deep sandy/loamy duplexes, duplex gravels and loamy earths. Moderate salinity (EM38 reading of 100-150 mS/m) Supports pastures
Pastures: Tall wheatgrass, Paspalum Fodder shrubs: River saltbush, old man saltbush, grey saltbush, quailbrush, wavy leaf saltbush Trees: Swamp oak (Casuarina obesa), river oak (C. cunninghamia), salt tolerant clones of river red gum (E. camaldulensis), flat topped yate (E. occidentalis), swamp mallet (E. spathulata), E. vegrandis, swamp paperbark (M. raphiophylla).
Low productivity potential: Regular inundation and severe waterlogging. Clays and shallow sandy/loamy duplexes. Severe salinity (EM38 reading of >150 mS/m) Bare salt scalds
Pastures: Salt-water couch, Puccinellia Fodder shrubs: Samphire Trees: Swamp oak (C. obesa), Eastern States swamp oak (C. glauca), salt paperbark (M. cuticularis)
Adapted from: Ed Barrett-Lennard (pers. comm.) and Don Bennett (pers. comm.) Table 5.7: Potential species for saltland agronomy. Present productivity potential*
Future productivity potential*
Comment on justification of investment
Low Low Minimise expenditure Moderate Moderate Modest investment justified Low Minimise expenditure High Substantial investment justified High Moderate Modest investment justified. Avoid over-optimism Low Invest for short-term profits only. * see Table 5.6 Source: Ed Barrett-Lennard (pers. comm.) Salt tolerant pastures must be managed differently to annuals and grazed carefully to ensure that the stock do not eat the crowns out. Tall wheatgrass (Thinopyrum elongatum) is suitable for land with a moderate productive potential and grows well in all landscape positions, but performs best in valleys. Tall wheatgrass has a high salt tolerance and moderate waterlogging tolerance and will grow on any barley grass country as well as some mild scalds. It grows well in summer and autumn, but very slowly in the first year. Puccinellia (Puccinellia ciliata) is suitable for land with a low productive potential. It has excellent salt and waterlogging tolerance. It grows slowly at first, but stands will

5: Dryland salinity
-121-
thicken in time if managed correctly. Puccinellia has been grown successfully on scalds, is highly palatable and more easily managed than tall wheatgrass. Other suitable species include phalaris (Phalaris aquatica) and salt-water couch (Paspalum vaginatum). Balansa clover (Trifolium michelianum) and strawberry clover (Trifolium fragiferum) can be grazed in winter or can be cut for hay. Paspalum (Paspalum dilatatum) and kikuyu (Pennisetum clandestinum) seem to tolerate saline conditions in irrigated areas and may have potential on saline seeps further inland. Salt tolerant shrubs such as salt bush and blue bush have been successfully established on saline flats in the Wheatbelt and Eastern Woolbelt where annual rainfall is less than 450 mm/year. Potential saltbush species for land with moderate productive potential (Table 5.6) include river saltbush (Atriplex amnicola), old man saltbush (A. nummularia), grey saltbush (A. cineria), quailbrush (A. lentiformis) and wavy leaf saltbush (A. undulata). Small leafed bluebush (Maireana brevifolia) is only suited to reasonably well drained sites. Samphire (Halosarcia spp.) is tolerant of waterlogging and salinity and will often establish naturally if protected from grazing. While the feed value of these shrubs has been questioned recently (Warren et al., 1995), stock grazed on them can maintain their body weight for four to five weeks. Advantages of establishing pastures of salt tolerant shrubs can include: • a slight lowering of water tables allowing establishment of other salt tolerant (and some sensitive)
pastures, • the stabilisation of degraded and eroded saline scalds, • the provision of shelter for stock and wildlife. Mounding may be required to establish salt tolerant shrubs where waterlogging is severe and careful grazing management is required to ensure persistence. Barrett-Lennard and Malcolm (1995) provide more information on saltland pastures. Trees that can be incorporated into saltland agronomy include golden wreath wattle (Acacia saligna) and swamp oak (Casuarina obesa) which provide some forage for livestock. Salt tolerant clones of river red gum (Eucalyptus camaldulensis), salt river gum (E. sargentii), salt paperbark (Melaleuca cuticularis), swamp paperbark (M. raphiophylla), river oak (C. cunninghamia), Eastern States swamp oak (C. glauca), flat topped yate (E. occidentalis), swamp mallet (E. spathulata) and E. vegrandis are other trees that can be established on salt-affected sites. Tree establishment in salt-affected areas is often difficult and careful species selection and site preparation are essential. Marcar et al. (1995) describe tree species suitable for planting on saltland. Bennett and George (1996) provide more details about the performance of river red gums on saline land in the South-west Hydrological Region. Soil management Any soil management which achieves a reduction of waterlogging will help combat salinity as it is the combination of high salinity levels and saturated conditions which adversely affect plant growth (see Plate 5.1. There is some potential to reduce salinity by increasing infiltration and percolation rates in the soil and so leach salt. This approach is unlikely to remove salt entirely, but by reducing the amount of salt in the root zone, plant growth and water use can be encouraged. Deep ripping (to depths of >30 cm) is sometimes proposed as a method of salinity control. The aim is to break through hardpans and other barriers in the subsoil and so improve water movement down the profile. This may improve crop performance and rooting depth in recharge area and aid leaching in salt-affected areas. However, the effectiveness of this approach is yet to be demonstrated in Western Australia. In salt-affected areas, deep ripping is most likely to work if the salinity is associated with perched aquifers well separated from deeper groundwater. Covering salt-affected areas with a mulch, such as hay, can also help improve topsoil conditions by reducing the amount of salt brought to the surface by evaporation and capillary rise. In some sodic soils, where surface sealing and inundation are problems, soil structure and infiltration may be improved by gypsum applications.
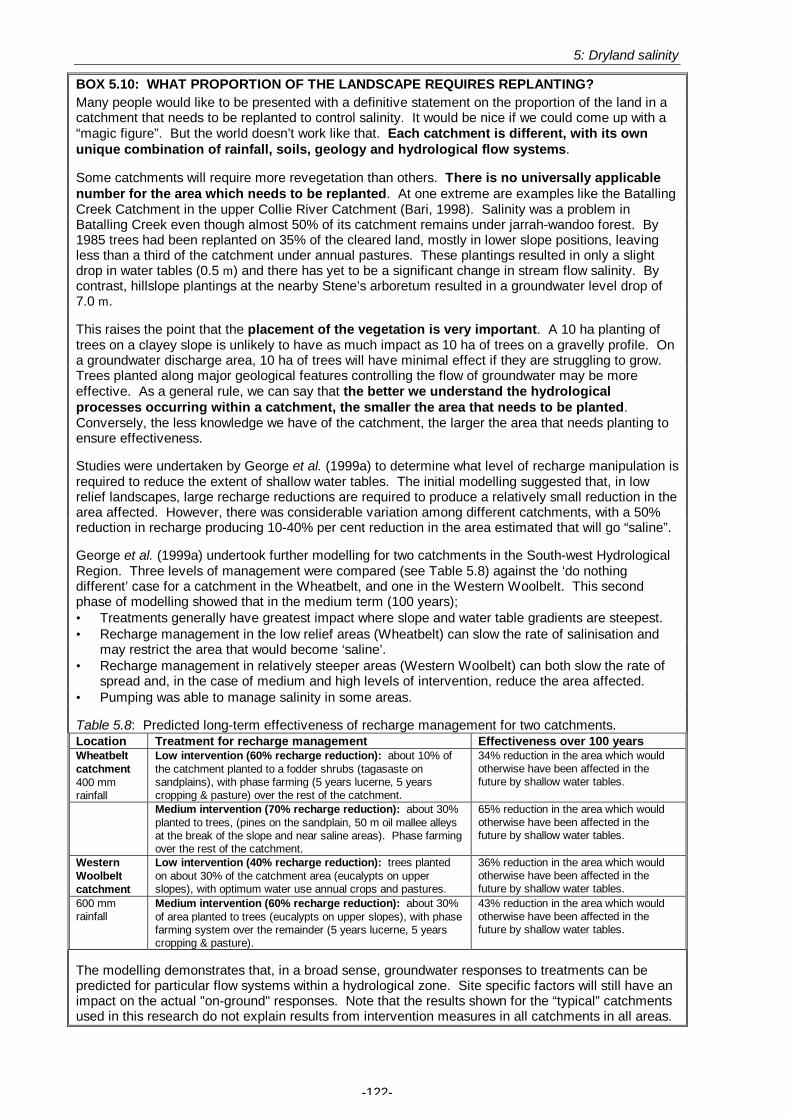
5: Dryland salinity
-122-
BOX 5.10: WHAT PROPORTION OF THE LANDSCAPE REQUIRES REPLANTING? Many people would like to be presented with a definitive statement on the proportion of the land in a catchment that needs to be replanted to control salinity. It would be nice if we could come up with a “magic figure”. But the world doesn’t work like that. Each catchment is different, with its own unique combination of rainfall, soils, geology and hydrological flow systems. Some catchments will require more revegetation than others. There is no universally applicable number for the area which needs to be replanted. At one extreme are examples like the Batalling Creek Catchment in the upper Collie River Catchment (Bari, 1998). Salinity was a problem in Batalling Creek even though almost 50% of its catchment remains under jarrah-wandoo forest. By 1985 trees had been replanted on 35% of the cleared land, mostly in lower slope positions, leaving less than a third of the catchment under annual pastures. These plantings resulted in only a slight drop in water tables (0.5 m) and there has yet to be a significant change in stream flow salinity. By contrast, hillslope plantings at the nearby Stene’s arboretum resulted in a groundwater level drop of 7.0 m. This raises the point that the placement of the vegetation is very important. A 10 ha planting of trees on a clayey slope is unlikely to have as much impact as 10 ha of trees on a gravelly profile. On a groundwater discharge area, 10 ha of trees will have minimal effect if they are struggling to grow. Trees planted along major geological features controlling the flow of groundwater may be more effective. As a general rule, we can say that the better we understand the hydrological processes occurring within a catchment, the smaller the area that needs to be planted. Conversely, the less knowledge we have of the catchment, the larger the area that needs planting to ensure effectiveness. Studies were undertaken by George et al. (1999a) to determine what level of recharge manipulation is required to reduce the extent of shallow water tables. The initial modelling suggested that, in low relief landscapes, large recharge reductions are required to produce a relatively small reduction in the area affected. However, there was considerable variation among different catchments, with a 50% reduction in recharge producing 10-40% per cent reduction in the area estimated that will go “saline”. George et al. (1999a) undertook further modelling for two catchments in the South-west Hydrological Region. Three levels of management were compared (see Table 5.8) against the ‘do nothing different’ case for a catchment in the Wheatbelt, and one in the Western Woolbelt. This second phase of modelling showed that in the medium term (100 years); • Treatments generally have greatest impact where slope and water table gradients are steepest. • Recharge management in the low relief areas (Wheatbelt) can slow the rate of salinisation and
may restrict the area that would become ‘saline’. • Recharge management in relatively steeper areas (Western Woolbelt) can both slow the rate of
spread and, in the case of medium and high levels of intervention, reduce the area affected. • Pumping was able to manage salinity in some areas. Table 5.8: Predicted long-term effectiveness of recharge management for two catchments. Location Treatment for recharge management Effectiveness over 100 years Wheatbelt catchment 400 mm rainfall
Low intervention (60% recharge reduction): about 10% of the catchment planted to a fodder shrubs (tagasaste on sandplains), with phase farming (5 years lucerne, 5 years cropping & pasture) over the rest of the catchment.
34% reduction in the area which would otherwise have been affected in the future by shallow water tables.
Medium intervention (70% recharge reduction): about 30% planted to trees, (pines on the sandplain, 50 m oil mallee alleys at the break of the slope and near saline areas). Phase farming over the rest of the catchment.
65% reduction in the area which would otherwise have been affected in the future by shallow water tables.
Western Woolbelt catchment
Low intervention (40% recharge reduction): trees planted on about 30% of the catchment area (eucalypts on upper slopes), with optimum water use annual crops and pastures.
36% reduction in the area which would otherwise have been affected in the future by shallow water tables.
600 mm rainfall
Medium intervention (60% recharge reduction): about 30% of area planted to trees (eucalypts on upper slopes), with phase farming system over the remainder (5 years lucerne, 5 years cropping & pasture).
43% reduction in the area which would otherwise have been affected in the future by shallow water tables.
The modelling demonstrates that, in a broad sense, groundwater responses to treatments can be predicted for particular flow systems within a hydrological zone. Site specific factors will still have an impact on the actual "on-ground" responses. Note that the results shown for the “typical” catchments used in this research do not explain results from intervention measures in all catchments in all areas.

5: Dryland salinity
-123-
5.3.3 Engineering options While increasing water use by plants is essential to the management of dryland salinity, in many cases this approach will require complimentary and/or supplementary engineering approaches. These involve using banks, drains or pumps to divert surface waters and artificially discharge groundwater. The aim is to prevent fresh water from becoming recharge and to remove saline water from the catchment. It must be remembered that these techniques are most effective when integrated into an overall salinity control plan. Any structures installed are likely to affect farm management and so changes to fencing and paddock layout may be required. The preparation of a farm or catchment plan is recommended before undertaking any major constructions. Excess water should only be drained from land after making a careful assessment of the effect on properties downstream. It is currently not acceptable for a landowner to increase the volume of water or salt leaving their property if this water then significantly contributes to waterlogging, salinity or flooding problems on neighbouring properties. Currently, the Commissioner of Soils and Land Conservation must be notified at least 90 days before a new drainage or pumping scheme is set up if the scheme will discharge saline water onto other land, into water or in a water course. For further information contact the Land Conservation Officer at the local office of Agriculture Western Australia. Potential changes to this process are discussed in Box 5.11. BOX 5.11: CHANGES TO THE STATUTORY ASSESSMENT PROCESS FOR ENGINEERING
OPTIONS
The current Salinity Strategy (State Salinity Council, 2000a) foreshadows changes that will be made to the statutory process for assessing drainage or pumping proposals from landholders. The aim will be to give priority to proposals that are comprehensively and carefully thought out on a catchment basis. This is what will be required: • the proposal will improve the condition of relevant assets in the catchment with acceptable offsite
impacts, • all private and public stakeholders directly affected will be consulted, and • engineering proposals meet the Government’s aim of integrating engineering options with other
essential water management practices to increase water use and reduce groundwater recharge. The proposals that are most likely to be viewed favourably are those designed according to the following principles: • calculating the increase in catchment discharge of salt and water involved, • evaluating and selecting water management for different areas of the catchment, • considering the cumulative impacts of all engineering proposals on the catchment, • selecting the engineering design with the lowest risk, and • demonstrating that all impacts on the environment downstream have been fully considered and
will be minimised, monitored and remediated if necessary. Where one area is sacrificed to save another, a process will be need to be developed for referring proposals to relevant agencies for assessment. Surface water management Water harvesting usually involves the capture, diversion and storage of fresh water occurring as surface or sub-surface flows. In most cases, water harvesting by itself is not likely to have a major impact on water table levels. However, the severity and impact of salinity is diminished if waterlogging is reduced as a result of water harvesting. Grade banks and seepage interceptor drains (see Sections 7.3.3 and 9.3.3 for more details and diagrams) can be constructed to capture this water and divert it into dams or earthen tanks. Stored supplies can be used to water stock or to irrigate fodder or horticultural crops during summer. Where natural drainage lines are too saline to be suitable for farm water supplies, these banks and drains enable the construction of dams or earthen tanks on hillslopes by providing an artificially enlarged catchment. WISALTS (Whittington Salt Affected Land Treatment Society) interceptor banks (see Sections 7.3.3 for more details and diagram) have been installed to combat salinity problems on a number of

5: Dryland salinity
-124-
properties in the South-west Hydrological Region. They are designed to intercept both runoff and shallow sub-surface flow. In most cases the banks store the runoff and shallow seepage that they intercept in their channel (George and McFarlane, 1993). WISALTS banks are occasionally effective in controlling salinity but often add to recharge. In a study of 11 level banks over a 14 year period, topsoil salinity increased at four sites, decreased at one site and was not affected at the remaining six sites (Negus, 1987). Henschke (1989) found that while pasture production and site conditions had improved near the banks due to control of waterlogging, the water tables and salinity had remained almost unchanged. WISALTS banks can remove up to 14% of the land from production and contribute about 20 mm of extra recharge (McFarlane et al., 1990). In most cases, smaller grade interceptor drains are much more economical and reduce, rather than increase, recharge (McFarlane and Cox, 1990). Water harvesting can also involve extracting water from fresh aquifers, such as those sometimes present in sandy deposits occurring high in the landscape, for on-farm use. This water can also be obtained by pumping from bores or soaks. Surface drainage plays an important role in combating salinity. Installing surface drains in waterlogged or inundated areas removes water which has the potential to become recharge, and also contribute to increasing total plant water use by improving conditions for the growth of trees, crops and pastures. In cereal cropping areas the drains may pay for themselves within a few years of installation. Both spoon drains and W-drains are suitable for connecting low lying areas and providing a path for removal of surface water (see Sections 7.3.3 for more details and diagrams). If the waterlogged area is not affected by salinity, it may be possible to incorporate the drains into a water harvesting system. This is most practical in the case of poorly drained upland flats, or hillside seeps fed by fresh aquifers. From these areas, the water can be gravity fed into a earthen tank or dam. Water drained from low lying or saline waterlogged areas is usually discharged into creeks and rivers. While this can result in the water being removed from the catchment, it can also contribute to recharge in areas downstream. In some situations drainage may result in increased flooding downstream if large volumes of water are involved. In other cases, well designed drainage systems can actually reduce the flood risk by creating a greater water retention capacity in the surface soils. Groundwater management The principal aim of groundwater drainage is to lower water tables, preventing the additional accumulation of salts while allowing rainfall to leach salt from the upper soil profile. Some systems include single or multiple bores with pumps extracting the water. Drains designed to lower water tables tend to be deep and either open or back-filled after some sort of perforated piping (e.g. tyres or a slot drain) has been placed in them. The low permeability of materials on much of the salt-affected land in the South-west Hydrological Region can reduce the effectiveness of groundwater drainage. In some areas this can be In many situations, a combination of surface and groundwater management is required. Deep open drains used for groundwater management are usually constructed with an excavator. These drains are more than 60 cm deep, typically 1.2-2.5 m deep or more. In duplex soils they extend more than 20 cm into the clayey subsoil. In leveed deep open drains (also called “closed” deep drains), the spoil is formed into levee banks on either side of the drain to exclude surface flows. Deep open drains are relatively expensive to construct, remove areas of land from production and their effectiveness is variable. Careful site assessment and drain design are required to increase effectiveness. Our understanding of the way in which deep drains affect water tables is still developing. In many cases, the installation of deep drainage results in rapid improvements in saline areas. In others cases little response is seen. These improvements may be because of more rapid surface drainage and an associated reduction in waterlogging rather than the lowering of water tables. It is possible that the same results could have been achieved by constructing spoon or W-drains which are cheaper. However, deep drains do appear to lower water tables of surficial aquifers in many cases. This can result in salt leaching from the soil at a faster rate than it re-accumulates through capillary rise. Figure 5.3 show a typical response to deep drainage. To the left of the figure is an area unaffected by deep drainage. Capillary rise and throughflow transport salt into the topsoil in low lying areas near the water table. Evaporation results in an accumulation of salt in these areas. Without artificial drainage, only flooding and cultivation will induce leaching to remove the salt.

5: Dryland salinity
-125-
To the right of the figure the a deep drain has been constructed. Throughflow is directed towards the drain and the water table is lowered 20-100 m on either side of the drain. This allows for the leaching to take place and the stored salt is moved to depth or into the drain. The majority of the flow occurs in permeable lenses in the soil.
Figure 5.3: Possible effects of deep drains on groundwater and salinity. Soil permeability plays a very important role in determining drain effectiveness, and a survey of hydraulic conductivity of the site is advisable before installing deep drainage. Deep open drains are most effective in highly permeable soils, such as deep sands, where they can affect water table levels up to 80 m away (Coles et al., 1999). However even in these conditions they may not be cost effective (Ferdowsian et al., 1997). George (1991) showed that saline areas in sandplain seeps (saturated hydraulic conductivity >0.2 m/day) could also be reclaimed successfully using drains, but their use was short lived because the drains slumped and collapsed unless well designed and lined with a slotted pipe. In materials with low permeability, such as the heavy clay subsoils often found on valley floors, the drains tend to have a significant effect on a narrow strip of land only. Speed and Simons (1992) found negligible impact on water tables more than 10 m away from the drains in such conditions. Deep drains can be effective where they cut through shallow clay and expose the underlying saprock or sediments or clays which contain preferred pathways (e.g. well connected sand seams). In clayey soils the depth of the drain may be critical, as most of the flow will occur through thin permeable layers, and the more of these that are intersected, the greater the flow. Slope and hydraulic gradient are also important considerations when installing deep open drains. On the broad flats of the Wheatbelt, where hydraulic gradients are typically low, a drain may need to be more than 2 km in length if it is to have sufficient fall to enable outflow of groundwater lying at a depth of 2 m (Coles et al., 1999). Current indications are that deep open drains tend to be more effective in controlling waterlogging and salinity when installed at the break of slope, over structures such as dykes or on sloping areas. The success of deep drains situated at the break of slope may be because there are often stronger upward groundwater flows in these locations (Coles et al., 1999). The relatively small discharge in such areas and interactions with geological features such as dykes may be other factors. Other reasons for the failure of deep drainage can include: poor design leading to erosion and/or sedimentation, the inability of the drain to handle peak flows during floods, batter collapse due to unstable soils or high groundwater flows and iron oxide precipitation causing blockages of pores on the drain walls. For these reasons, deep open drains should be designed by a professional engineer, soil conservationist or professional contractor with previous experience. The drainage systems needs

5: Dryland salinity
-126-
to be designed to incorporate the management surface water sediment and salt flows. The risk of the drain contributing to soil erosion or flooding requires special consideration. BOX 5.12: CAN A CATCHMENT CAN BE DRIED UP WITH DRAINS AND PUMPS?
Just as it is unrealistic to expect to “dry up” every catchment using trees (see Box 5.9), the spread of salinity cannot be reversed purely through the use of pumps and drains in the lower catchment. Engineering solutions can be highly effective in many situations, but may be of little use in others. It is important to understand the principles of groundwater flow velocity covered in Box 3.3. Drains and pumps will only “flow” at the rate at which water can be delivered to them. In many cases the water flow in the soil or aquifer is slow, limiting the areas which can be influenced by an individual pump or drain. In aquifers with faster flows, drains can be much more effective. Draining and pumping groundwater discharge areas will not prevent the accumulation of water higher in the landscape. If recharge is allowed to continue at high rates across the catchment, the hydraulic pressure may continue to build. Over time, as the amount of water entering the aquifer increases, the number of pumps and drains would have to be increased to cope with the extra load. It would be necessary to continue increase until their discharge exceeded recharge. Deep drainage and pumping definitely have important roles to play in salinity control. They are highly valuable tools which can be used to increase discharge rates and relieve hydraulic pressure. By doing this they “buy time” for recharge control strategies to take effect, but they do not provide a “stand alone” solution. Tube drains (tile or slotted pipe drains) (see Section 6.3.3) can be used for sub-surface drainage. They may be more expensive to install than open drains, but take virtually no land out of production and can be used where there is a risk of bank collapse in unstable soils or flooding leading to drain failure. There is a risk of fine soil particles or iron precipitates blocking the slots in pipes. Pumping can be a costly method of removing groundwater, but it is effective in some situations. Pumping involves drilling bores down to bedrock into permeable aquifers. Water is then extracted with the aid of electric or compressed air pumps. Usually a number of bores and pumps are required to have any effect on water tables in a particular area. Pumping systems are most commonly installed on valley floors or lower parts of the landscape, but they can also be used to control hillside seeps. Although expensive to install and operate, pumping systems are less intrusive than drains. The pumps also take less land out of production, do not interfere with surface water flows and are less of an impediment to vehicles. There will be situations where pumping provides the only effective option to reduce water tables that are contributing to salinity. Such situations include those where: • salinity occurs due to rising water tables in intermediate and regional flow systems, • trees planted in groundwater discharge areas have limited effectiveness and life-spans, • high permeability aquifers are present, and • soils are unsuitable for the construction of open drains. The effectiveness of a pumping system will rely on a number of factors and it is essential to have a good understanding of the hydrogeology of an area before installing pumps. A successful pumping system requires the aquifer to have high permeability and a good hydraulic connection to the soil surface. Some materials have a permeability that is too low to deliver water readily to a bore. In these cases pumping should not be considered as a management alternative. Local experience, hydrogeology maps, airborne and ground-based geophysics can be used to locate suitable aquifers to facilitate successful pumping (George and McFarlane, 1993). In many situations a single pump will have minimal effect on groundwater levels. There may be a need for several different pumping systems if there are hydraulic barriers that break up groundwater systems into separate cells, or if the pumping system is required to be effective over large areas. To date, pumping has proved most effective on valley floors above aquifers in palaeochannels, in the Wheatbelt and Woolbelt. A single pump typically reduces water tables within a 300 m diameter in to pump suitable sites in the Wheatbelt, and up to several hundred meters in highly permeable sediments. Pumping can also be effective higher in the landscape where supplies of reasonable

5: Dryland salinity
-127-
quality stock water can be drawn from local aquifers at depths of up to 30 m, relieving the hydraulic pressure on aquifers downslope. In some cases fresh, or even brackish, water pumped from aquifers can be used for off-site irrigation and stock water supplies. In both Woolbelts, pumps located around the break of slope may also prove effective. Modelling undertaken by Sinclair Knight Merz (2000) predicted that the pumping system currently being established at Lake Toolibin (with pumps operating at eight bores in an area of approximately 150 ha) should be capable of keeping the water tables below 2.0 m on occasions when no recharge is coming from the lake. They also found that it will take up to three years before the system becomes fully effective. Further modelling using data from tests conducted in the palaeochannel indicate that pumping bores at 1,000 kL/day for five years could drawdown water tables beneath the whole lake. The use of relief wells to remove excess groundwater is an option in some locations. Relief wells are artesian wells driven by hydraulic pressure in lower (often semi-confined) aquifers. Groundwater is discharged under hydraulic pressure into a bore. The bore is connected to a pipe to dispose of the water into a waterway or holding pond. In suitable locations, relief wells are capable of doing a similar job to a pumping system without the costs of purchasing, running and maintaining the pumps. However, they will only work in situations where there is an aquifer with a piezometric head above the ground surface and can only reduce that head to ground level. Such situations are more common in both Woolbelts than in the Wheatbelt, where the local relief is lower. To date, relief wells have proved effective where hillside seeps occur on slopes with a reasonable gradient (>3%). Combined solar pump and relief well systems are currently being investigated to increase flow rates. The disposal of excess water from groundwater management is a consideration as the water is often highly saline and may degrade the environment downstream. In some regions the disposal of saline groundwater may have little regional impact (e.g. where salt lakes are common), but problems are likely to occur if the drainage system downstream or the disposal area has a: • lower salinity level than the groundwater being drained, • limited capacity to take increased volumes of water (e.g. lakes or flood prone areas), • susceptibility to increased nutrient or sediment inputs, • high conservation value. At present there is a legal requirement to notify the land Conservation Officer at the local office of Agriculture Western Australia if water is to be discharged from the property. Any drain more than 1.5 m deep is also notifiable under the Soil Conservation Act. Evaporation basins or ponds can be constructed in some situations to store water until it evaporates. They need to be shallow and have a large surface area for evaporation to be effective. The ponds also need to be carefully designed, located and constructed to ensure that they have adequate capacity, are not at risk of damage from flooding and do not leak and recharge the aquifers. Areas of low relief where the basin can be located away from flood waters are usually the most suitable. See JDA and Hauck (1999) and Singh and Christen (1999) for more details on the siting, design and construction of evaporation basins. Saline aquaculture There is some potential, as yet unproven, for aquaculture ponds using groundwater drainage from salt-affected areas of the South-west Hydrological Region. Species currently farmed in the Region, such as marron and yabbies, have limited tolerance to water salinity. There is potential for species which can adapt to marine conditions such as black bream, silver perch, Atlantic salmon, abalone, rainbow trout and prawns. Where water salinity levels are significantly higher than in sea water, options such as brine shrimps and seaweed could be considered. Table 5.9 provides water salinity and temperature tolerances for a selection of species. For some species, such as rainbow trout and salmon, production in many areas would be limited to farming yearlings during winter months the summers are too hot. Species such as abalone would probably need to be grown indoors using sophisticated technology. Trendall and Pitman (1998) provide more information on the possibilities for saline aquaculture in Western Australia. A major requirement for any aquaculture operation is a thorough investigation of the market opportunities and production costs. The Water and Rivers Commission (1996) has produced guidelines for the acceptability of aquaculture projects. Table 5.9: Temperature and salinity requirements of saline aquaculture species Species Minimum salinity
of water (mg/L)
Maximum salinity of water (mg/L)
Water temperature range (0C)

5: Dryland salinity
-128-
Marron (Cherax tenuimanus) 0 6,000 0-30 Yabby (Cherax albidus) 0 8,000 0-36 Giant tiger prawn (Penaeus monodon) 13,000 33,000 10-25 Black bream (Acanthopagrus butcheri) 3,000 35,000 8-33 Rainbow trout (Oncorhynchus mykiss) 0 35,000 10-22 Groper (Epinephelus tauvina) 2,500 45,500 18-31 Barramundi (Lates calcarifer) 0 50,000 16-35 Brine shrimp (Artemia salina) 31,300 340,000 6-35 Source: Lawrence (1996) Salt harvesting There is at least one farmer in Victoria who is harvesting salt commercially on his property, by pumping groundwater from saline areas into evaporation basins (Quinlan, 1999). He is selling the salt for $100-$300 per tonne. The feasibility of establishing such an enterprise in the South-west Hydrological Region is unknown. High transport costs may prove a problem.
Constructing a deep drain on a sandpalin seep in the Wheatbelt.

5: Dryland salinity
-129-
5.4 SOURCES OF FURTHER INFORMATION
5.4.1 Useful publications See Appendix 1 for contact details of the publishing organisations. Available from Agriculture Western Australia: Wheatbelt salinity - A review of the salt land problem in south-western Australia (Malcolm, 1983) provides a very comprehensive summary of the causes of dryland salinity, measures to prevent salinisation and methods of saltland reclamation. Salinity: A guide for land managers (State Salinity Council, 2000b) forms part of the Sate Salinity Strategy and provides an overview of the tools available for land managers to combat salinity at a farm and catchment scale. Topics covered are: changing agricultural practices, freshwater aquaculture, commercial farm forestry, using saline lands productively, native vegetation management and engineering options. For each option covered, the benefits, requirements/conditions, technical resources and initial contacts are summarised. Soilguide. A handbook for understanding and managing agricultural soils contains a chapter titled Soil salinity (Moore, 1998) which provides a good summary of salinity in the agricultural districts of Western Australia with discussions on measuring soil salinity and management options. Other chapters in the publication cover the soil and climatic requirements of perennial legumes (pp. 302-304), perennial grasses (pp. 305-307) and pasture shrubs (pp. 308-312). Soil salinity assessment using the EM38: Field operating instructions and data interpretation (Bennett et al., 1995) describes the correct operating, surveying and calibration of the EM38 terrain conductivity meter. This is a portable instrument designed to take in situ field measurements of soil conductivity which can then be used to make reliable estimates of soil salinity. AgET- Water Balance Calculator is a simple water balance computer package designed to help farmers and their advisers understand how differing climates, plants, soils and crop/pasture rotations influence components of the water balance (i.e. evapotranspiration, runoff and deep flow ). Calculations can be done for a range of annual or perennial plants used within current farming systems to produce an estimate of their effect on groundwater recharge. Low recharge farming systems – Case studies from the South Coast (Ryder et al., 2000) presents a two page summary of 27 different examples of how farmers from the southern agricultural districts have incorporated low recharge farming systems. Seven of the case studies are located in, or on the edge of, the South-west Hydrological Region. These include; oil mallee farming to combat waterlogging, revegetation of a highly saline valley floor, a pine-salt tolerant pasture system, blue gum planting, tagasaste and saltbush alley systems. Perennial grasses for animal production in the high rainfall areas of Western Australia (Greathead et al., 1998) provides assessments of the economics, establishment and management of perennial pastures using case examples from sites on the Swan Coastal Plain and the south of the Forested Hill and Western Woolbelt. Perennial grasses for areas receiving less than 800 mm annual rainfall (Sudmeyer et al., 1994) provides information on the general characteristics, site selection, establishment and management of a variety of perennial species suitable for specific niches in lower rainfall districts. A series of keys in the appendix assist in identifying potentially suitable species for a variety of situations. Much of the information in this publication is equally relevant for areas receiving higher rainfall. Perennial pasture establishment technique for the South Coast of WA (Buchanan et al.,1993), although written specifically for the Esperance District, contains much relevant information about seedbed preparation, sowing, insect and weed control, nutrition and grazing management for perennial pastures. Note: Not an Agriculture Western Australia publication, but copies may be available from Jamie Bowyer in the Esperance District Office. Tagasaste (Wiley et al., 1994) provides a guide for incorporating tagasaste into farming systems covering topics including planning, establishment, pest control, grazing management and feed value. Tagasaste and Acacia saligna establishment using bare rooted seedlings (Angell and Glencross, 1993) provides a guide for establishing and managing plantings of these two species on farmland.

5: Dryland salinity
-130-
Though written mainly for conditions on the Swan Coastal Plain, much of the information is relevant to sandy soils throughout the agricultural region. Trees for farms (Howes, 1991) covers a wide range of topics related to growing trees on farmland in Western Australia, including management of remnant vegetation, propagating trees, fencing, pest control, taxation issues and share farming schemes. It contains sections on trees for specific niches and purposes and also a list of suitable species. Some of the information is a bit dated. Agroforestry with widely spaced pines (Moore et al., 1991) provides a guide to incorporating pine trees into a farming system, concentrating mainly on the establishment and management of the trees. Toolibin Catchment Revegetation Manual (Baxter and Bicknell, 1996) is relevant to much of the Eastern Woolbelt and Wheatbelt, although it was written specifically for the catchment area of Lake Toolibin. It makes use of numerous case studies and has chapters covering revegetation options for different soil/landscape situations and products from trees and shrubs. Saltland pastures in Australia, a practical guide (Barrett-Lennard and Malcolm, 1995) is heavily influenced by the authors’ experiences in Western Australia and covers suitable shrub and grass species as well as containing chapters on establishment and productivity of pastures. Forage shrubs and grasses for revegetating saltland (Runciman and Malcolm, 1989) provides individual descriptions of species suitable for saltland reclamation. It describes each plant’s potential uses and outlines establishment considerations. Guidelines for those considering drainage for waterlogging and salinity management (Anon., 2000) is a seven page pamphlet covering the different types of drainage options and the process of planning a drainage system. Common conservation works used in Western Australia (Keen, 1998) provides notes on design, construction and variables leading to risk of degradation or failure for a variety of conservation works including banks, drains and pumping. Evaporation basin guidelines for disposal of saline water (JDA and Hauck, 1999) provides information concerning evaporation basin systems designed to manage saline water and store the disposed salts in the Wheatbelt of Western Australia. It presents guidelines to be used in the planning, design, construction, monitoring and maintenance of these systems. Soil conservation earthworks design manual (Bligh, 1989) has sections covering level and absorption banks, seepage interceptor drains and water spreading structures. NOTE: this Earthworks Design Manual is listed as being for use by staff of Agriculture Western Australia only. A revised version of this manual should be available in 2001.

5: Dryland salinity
-131-
Relevant Agriculture Western Australia Farmnotes include: General information
133/84 Saltland management - the catchment approach 15/86 An introduction to conservation farm planning 21/91 Landcare at low or no cost 35/91 A simple way to monitor your saltland 36/91 Combating salinity – checklist 97/91 Taxation and the control of land degradation 25/94 Managing saline, high rainfall valleys and flats 4/99 Regulation 4, covering land clearing
71/99 Tolerance of plants to salty water 8/2000 Salinity at a glance
Drainage 45/86 Drainage of saline and waterlogged soils 79/86 Legal aspects of land drainage 1/88 Reclaiming saline and waterlogged soils on the Swan Coastal Plain 9/91 Responsibilities of landholders under agricultural Acts: Water and drainage
47/93 Notification of draining or pumping saline land Banks and drains
66/85 Controlling surface water flows above salt-affected areas 27/89 The hose level – how to make and use one 70/89 Reverse-bank seepage interceptor drains 71/89 Surveying and construction of reverse-bank seepage interceptor drains 73/89 Waterways 62/91 Banks and drains for sloping land
106/91 Spoon and W-drains Soil management
32/85 Gypsum improves soil stability 57/90 Identifying gypsum responsive soils
Trees, perennials and higher water use plants
46/88 Controlling saltland with trees 102/88 Fitting trees into the farm plan 116/88 Reclaiming sandplain seeps with small blocks of trees 36/89 Trees for replanting the wheatbelt 61/90 Balansa clover 31/91 Tree planting for erosion and salt control 8/93 Establishing perennials in areas with less than 700 mm rainfall
11/95 Kikuyu – the forgotten pasture? 12/96 Farmer to farmer - Landcare case studies: Tagasaste at East Toolibin 26/96 Farmer to farmer - Landcare case studies: Revegetation - clothing the landscape 59/96 Green feed in summer 62/96 Farmer to farmer - Landcare case studies: Don’t wait - revegetate 76/96 Harvesting balansa clover for seed 8/97 Farmer to farmer - Landcare case studies: Woolbelt options for high water use 4/98 Dryland lucerne: establishment and management
27/98 Southern sandalwood: an introduction 34/98 Farmer to farmer – Landcare case studies: Direct seeding native trees and shrubs 49/98 Eucalyptus oil mallees 60/99 Preventing tree damage by livestock 80/99 Speciality timbers for the Western Australian wheatbelt

5: Dryland salinity
-132-
Saltland agronomy 43/83 Seeding shrub pastures on saltland 83/85 Spray.Seed for Puccinellia establishment 44/86 Saltland management - revegetation 28/87 Salt-water couch - for salty seepages and lawns 56/88 Samphire for waterlogged saltland
110/88 Trees for saltland 55/89 Collecting and treating bluebush seed 81/91 Calculating saltbush seeding rates 7/93 Growing saltbush seedlings and cuttings
75/96 Harvesting tall wheatgrass and Puccinellia for seed 1/99 Puccinellia – for productive saltland pastures
26/99 Establishing balansa and Persian clovers on waterlogged, mildly saline soils Remnant vegetation
32/89 Simple electric fencing to protect bush areas on farms 36/98 Site assessment for successful revegetation: for regions with less than 600 mm rainfall 37/98 Site preparation for successful revegetation: for regions with less than 600 mm rainfall 40/98 Direct seeding of native plants for revegetation 47/98 Weed control for successful revegetation: for regions with less than 600 mm rainfall
38/2000 Vegetation buffer zones Relevant TreeNotes (available from Agriculture Western Australia or the Department of Conservation and Land Management) include; No. 1 Growing eucalypts for high grade sawlogs No. 2 Preparing sites for tree planting in the greater than 600 mm rainfall zone No. 3 Thinning for sawlogs No. 10 Farm forestry definitions and designs No. 11 Benefits of farm forestry No. 12-16 Farmer experiences in farm forestry No. 17 Tree planting - in the medium to high rainfall zone of Western Australia No. 18 Growing pines for wood products No. 19 Harvesting farm grown trees: three growers’ experiences No. 20 Weed control in eucalypts and pines in the greater than 450 mm rainfall zone No. 21 Insect pests of eucalypts and pines in the greater than 450 mm rainfall zone No. 22 Windbreak design and management in the greater than 450 mm rainfall zone No. 23 Timber production from windbreaks in the greater than 450 mm rainfall zone No. 24-25 Farmer experiences in farm forestry No. 26 Parrot damage in agroforestry in the greater than 450 mm rainfall zone No. 27 Growing Tasmanian blue gum - overview in the greater than 600 mm rainfall zone No. 28 Growing Tasmanian blue gum for pulpwood – the profit potential in the greater than 600 mm
rainfall zone No. 29 Rectifying parrot damage in eucalypts in the greater than 450 mm rainfall zone Available from the Land Management Society or The University of Western Australia: The farm monitoring handbook (Hunt and Gilkes, 1992) contains a chapter providing a good summary of the causes, monitoring and management of salinity. Available from the Land and Water Resources Research and Development Corporation: Assessing the causes, impacts, costs and management of dryland salinity (Martin and Metcalfe, 1998) is a detailed publication addressed to landholders and managers covering the causes, assessment, management and costs of dryland salinity containing case studies from the South-west Hydrological Region. Available from the Queensland Department of Natural Resources: Salinity management handbook (Shaw and Gordon, 1997) is a comprehensive handbook (over 200 pages) covering the nature, causes, measurement and management of salinity. While it is prepared from a Queensland perspective, much of the information is practical and relevant to Western Australian conditions. Available from the CSIRO Division of Forestry:

5: Dryland salinity
-133-
Trees for saltland; a guide to selecting native species for Australia (Marcar et al., 1995) provides detailed descriptions of suitable species along with their uses and site requirements. Also has some general information on the use of trees to control salinity and notes on tree establishment and management. Commercial forest plantations on saline land (Lambert and Turner, 2000) is a comprehensive technical book covering the growing of commercial tree crops on saline land. Chapters include: • Tree crop physiology, • Species selection and productivity, • Products, quality and marketing, and • Plantation management in saline environments. This book also deals with the potential for carbon trading. Available from Rural Industries Research and Development Corporation (RIRDC): Design principle for farm forestry – a guide to assist farmers to decide where to place trees and farm plantations on farms (Abel et al., 1997) provides a very good resource for landholders considering agroforestry options. Chapters include: • Trees for wood products, • Trees for controlling dryland salinity and waterlogging, • Trees and shrubs for fodder, • Capturing multiple benefits from agroforestry, • Establishment, and • Is the design you have selected viable on your farm? Available from Fisheries Western Australia: The Outback Ocean – Aquaculture in inland salt water (Trendall and Pitman, 1998) provides an overview of the potential for inland saline aquaculture in Western Australia and includes details of production overseas and in the eastern states, an assessment of local resources, some local case studies and potential species. Available from Blackwood Basin Group: Repairing farm waterways – Blackwood stories (Karafilis, 2000) contains a collection of case studies on the rehabilitation of saline creeks from landholders in the Blackwood Catchment. Other publications: Using trees on the farm in south-western Australia (Thamo, 1992) provides a guide to incorporating trees into farming systems with chapters covering trees in relation to livestock fodder, shelter, the hydrological cycle and wood production. While there is an emphasis on salinity, many of the species mentioned are more applicable to higher rainfall districts. Soil and water conservation engineering (Schwab et al., 1981) is an American text that provides technical guidelines for designing surface and sub-surface drainage and it includes a chapter on pumps and pumping.

5: Dryland salinity
-134-
5.4.2 Agencies and organisations to contact The following agencies and organisations can be contacted for more information (postal address, phone numbers, e-mail address and Internet websites of each organisation are listed in Appendix 1): The local district office of Agriculture Western Australia or Community Agriculture Centres (CAC) can provide information, publications and suitable contacts for specific topics relating to dryland salinity. Some offices will test the salinity of soil and water samples for a fee. Information on computer models such as “AgET”, “Pumps”, “Drains” and “Banks” should also be available. The local Land Conservation Officer (LCO) at Agriculture Western Australia should be contacted regarding regulations covering land clearing or drainage. AGWEST Land Management Services and other agricultural consultants can assist with the preparation of farm plans and dam design for a fee. Consultants are listed on the Australian Association of Agricultural Consultants website. The Blackwood Basin Group, located at Boyup Brook, operates in the Blackwood River Catchment Area and can help provide local contacts and information about funding sources. The Chemistry Centre (WA) and a number of commercial laboratories can analyse soil and water samples for a fee. The local Community Landcare Coordinator (CLC) will be able to provide advice or suitable contacts for most issues related to dryland salinity. They will also be able to help with the preparation of submissions for grants for land conservation works. CLCs can be contacted via the Shire Office or through Agriculture Western Australia. Community Landcare Technicians (CLT) can provide assistance designing and surveying earthworks and drains for a fee. The local office of Agriculture Western Australia or the Community Landcare Technician Association should be able to provide contact numbers for local CLTs. The Farm Forestry Advisory Service is a joint initiative between the Department of Conservation and Land Management (CALM) and Agriculture Western Australia. It provides information to assist landholders integrate tree farming with agriculture. They produce a number of publications and decision making tools. Contact CALM in Busselton and Bunbury, or Agriculture Western Australia in Bunbury, Manjimup and Narrogin. Fisheries Western Australia have a program to help landholders establish fresh and saline aquaculture enterprises and an extensive website covering aquaculture options in Western Australia. The local Landcare Group or Land Conservation District Committee (LCDC) could provide contact with landholders who have local experience in tackling dryland salinity and good information about approaches that have proved successful in the district. The Land Management Society can help provide information and establish contact with other landholders who have practical experience in tackling these issues. They also sell farm monitoring kits. The Water and Rivers Commission plays a leading role in the Water Resource Recovery Catchments where there is a coordinated strategy is being developed to combat dryland salinity in public water supply catchments. Landholders in the upper Collie River Catchment (above Wellington Dam) and the upper Warren River Catchment (Tone-Perup Catchments) can contact the Bunbury Office of Water and Rivers Commission for assistance with matters relating to dryland salinity. Landholders in the upper Kent Catchment and Denmark Catchments should contact the Albany Office.
5: Dryland salinity
-135-
5.5 REFERENCES
Abel, N., Baxter, J., Campbell, A., Cleugh, H., Fargher, J., Lambeck, R., Pinsley, R., Prosser, M., Ried, R., Revell, G., Schmidt, C., Stirzaker, R. and Thorburn, P. (1997). ‘Design principle for farm forestry – a guide to assist farmers to decide where to place trees and farm plantations on farms’. Rural Industries Research and Development Corporation, Canberra.
Allen, A. and Beetson, B. (1999). The Land Monitor Project; A Multi-agency project of the Western Australian Salinity Action Plan supported by the Natural Heritage Trust. Proceedings of WALIS Forum 1999, Perth, WA, March 1999. pp. 74-77.
Angell, K. and Glencross, R. (1993). Tagasaste and Acacia saligna establishment using bare rooted seedlings. Department of Agriculture Western Australia, Bulletin No. 4262.
Anon. (1988). Salinity in Western Australia - a situation statement. Western Australian Department of Agriculture, Division of Resource Management Technical Report No. 81.
Anon. (1996). Salinity - a situation statement for Western Australia. A report to the Minister for Primary Industry & Minister for the Environment, November 1996, prepared by the Chief Executive Officers of; Agriculture Western Australia, Department of Conservation and Land Management, Department of Environmental Protection and the Water and Rivers Commission.
Anon. (2000). Natural resource management in Western Australia – Catchment water management: Guidelines for those considering drainage for waterlogging and salinity management. Agriculture Western Australia Bulletin No. 4464.
Argent, R.M. and George, R.J. (1997). AgET - A water balance calculator for dryland salinity management. In: MODSIM 97, International Congress on Modeling and Simulation, Hobart 8-11 December, 1997.
Bari, M.A. (1998). Reafforestation reduces groundwater level and stream salt load. In: Managing saltland into the 21st Century: Dollars and cents from salt. Proceedings of the 5th National Conference on the Productive Use and Rehabilitation of Saline Land, Tamworth, NSW, 9-13 March 1998. pp. 38-46.
Barrett-Lennard, E.G. (1986a). The effects of waterlogging on the growth and sodium chloride uptake by vascular plants under saline conditions. Reclamation and Revegetation Research 5: 241-261.
Barrett-Lennard, E.G. (1986b). Wheat growth on saline waterlogged soils. Journal of Agriculture Western Australia 27: 118-119.
Barrett-Lennard, E.G. and Ewing, M (1998). Saltland pastures? They are feasible and sustainable – we need a new design. In: Managing saltland into the 21st Century: Dollars and cents from salt. Proceedings of the 5th National Conference on the Productive Use and Rehabilitation of Saline Land, Tamworth, NSW, 9-13 March 1998. pp. 160-161.
Barrett-Lennard, E.G. and Malcolm, C.V. (1995). Saltland pastures in Australia, a practical guide. Western Australian Department of Agriculture, Bulletin No. 4312.
Barrett-Lennard, E.G., Davidson, N. and Galloway, R. (1990). Plant growth and survival in saline, waterlogged soils. Journal of Agriculture Western Australia 31: 56-57.
Baxter, A and Bicknell, D. (1996). ‘Toolibin catchment revegetation manual’. Agriculture Western Australia. Bennett, D. and McPherson, D.K. (1983). A history of salinity in Western Australia. CSIRO Division of
Groundwater Research, Technical Memorandum 83/1. Bennett, D.L. and George, R.J. (1995). Using the EM38 to measure the effect of soil salinity on Eucalyptus
globulus in south-western Australia. Agricultural Water Management 27: 69-86. Bennett, D.L. and George, R.J. (1996). River red gums (E. camaldulensis) for farm forestry on saline and
waterlogged land in south-western catchments of Western Australia. In: Proceedings of the 4th National Workshop on the Productive Use and Rehabilitation of Saline Lands, Albany, March 1996. pp. 345-358.
Bennett, D.L., George, R.J. and Ryder, A. (1995). Soil salinity assessment using the EM38: field operating instructions and data interpretation. Western Australian Department of Agriculture, Miscellaneous Publication No. 4/95.
Ryder, A., Bowyer, J, Skinner, G. and McCarron, C. (2000). Low recharge farming systems – Case studies from the South Coast. Agriculture Western Australian, Miscellaneous Publication No. 22/2000
Bettenay, E., Blackmore, A.V. and Hingston, F.J. (1964). Aspects of the hydrological cycle and related salinity in the Belka Valley, Western Australia. CSIRO Division of Soil Divisional Report No. 10/62.
Biddiscombe, E.F., Rogers, A.L., Anderson, G.W., Arkell, P.T., Glencross, R.N., Nicholas, D.A. and Paterson, J.G. (1982). Perennial pasture grasses in south-western Australia - 4. Potential areas of use. Department of Agriculture Western Australia, Technical Bulletin No. 57.
Bligh, K.J. (1989 - unpublished). ‘Soil conservation earthworks design manual’. Division of Resource Management, Department of Agriculture Western Australia, South Perth.
Buchanan, N., Lemon, J. and Saunders, C. (1993). ‘Perennial pasture establishment technique for the south coast of WA’. Esperance Land Conservation District Committee.
Clarke, C.J., George, R.J., Bell, R.W. and Hobbs, R.J. (1998). Major faults and the development of dryland salinity in the western wheatbelt of Western Australia. Hydrology and Earth System Sciences 2: 77-91.
Coles, N.A., George, R.J. and Bathgate, A.D. (1999). An assessment of the efficacy of deep drains constructed in the wheatbelt of Western Australia. Part 1 - A discussion paper on drainage implementation in the wheatbelt: A case study review summary, conclusions and recommendations. Agriculture Western Australia, Bulletin No. 4391.
De Silva, J. (1999). Evaluation of airborne geophysics for investigating land and water salinisation in the Toolibin Catchment. Water and Rivers Commission Hydrogeology Report 133.
Despeissis, A. (1895). ‘The handbook of horticulture and viticulture of Western Australia’. Bureau of Agriculture, Perth.

5: Dryland salinity
-136-
Engel, R., McFarlane, D.J. and Street, G. (1987). The influence of dolerite dykes on saline seeps in Western Australia. Australian Journal of Soil Research 25: 125-136.
Engel, R., McFarlane, D.J. and Street, G. (1989). Using geophysics to define recharge and discharge areas associated with saline seeps in south-western Australia. In: ‘Groundwater recharge’. (ed. M.L. Sharma). A.A. Balkema Publish Co., Rotterdam/Boston. pp. 25-39.
Ferdowsian, R., George, R., Lewis, F., McFarlane, D., Short, R. and Speed, R. (1996). The extent of dryland salinity in Western Australia. In: Proceedings of the 4th National Workshop on the Productive Use and Rehabilitation of Saline Lands, Albany, March 1996. pp. 89-98.
Ferdowsian, R., Ryder, A. and Kelly, J. (1997). Evaluation of deep, open drains in the North Stirlings area. Agriculture Western Australia, Natural Resource Management Services Technical Report No. 161.
George, R.J. (1991). Management of sandplain seeps in the wheatbelt of Western Australia. Agricultural Water Management 18: 85-104.
George, R.J. (1998). Toolibin, Western Australia – Evaluation of airborne geophysics for catchment management. The National Airborne Geophysics Project produced for Agriculture, Fisheries and Forestry Australia and the National Dryland Salinity Program.
George, R.J. and McFarlane, D.J. (1993). Managing dryland salinity with drains and pumps. In: Proceedings of the National Conference on Land Management for Dryland Salinity Control, Bendigo, September, 1993. pp. 81-88.
George, P.R. and Wren, B.A. (1985). Crop tolerance to soil salinity. Western Australian Department of Agriculture, Technote No. 6/85.
George, R.J., Cochrane, D.L. and Bennett, D.L. (1994). Groundwater systems responsible for dryland salinity in the Lake Towerrinning catchment, Western Australia. In: ‘Water Down Under ’94 - Volume 2: Groundwater Papers’. Institution of Engineers Australia, Canberra.
George, R.J., McFarlane, D.J. and Speed, R.J. (1995). The consequences of a changing hydrological environment for native vegetation in south-western Australia. In: ‘Nature conservation 4 - The role of networks’. (eds D.A. Saunders, J.L. Craig and E.M. Mattiske). Surrey-Beatty, Sydney. pp. 9-21.
George, R.J., McFarlane, D.J. and Nulsen, R.A. (1997). Salinity threatens the viability of agriculture and ecosystems in Western Australia. Hydrogeology Journal 5: 6-21.
George, R.J., Clarke, C., Reggiani, P and Hatton, T. (1999a). Groundwater modelling. In: The effect of recharge management on the extent and timing of dryland salinity in the wheatbelt of Western Australia. Results of a six week modelling study carried out for the State Salinity Council.
George, R.J., Nulsen, R.A., Ferdowsian, R. and Raper, G.P. (1999b). Interactions between trees and groundwaters in recharge and discharge areas – A survey of Western Australian sites. Agricultural Water management 39: 91-113.
Greathead, K., Sanford, P. and Cransberg, L. (1998). Perennial grasses for animal production in the high rainfall areas of Western Australia. Agriculture Western Australia, Miscellaneous Publication No. 2/98.
Greenwood, E.A.N. (1986). Water use by trees and shrubs for lowering saline groundwater. Reclamation Revegetation Research 5: 324-434.
Greenwood, E.A.N., Klein, L., Beresford, J.D. and Watson, G.D. (1985). Differences in annual evaporation between grazed pasture and Eucalyptus species in plantations on a saline farm catchment. Journal of Hydrology 78: 261-278.
Gregory, P.J. (1998). Alternative crops for duplex soils: growth and water use of some cereal, legume, and oilseed crops, and pastures. Australian Journal of Agricultural Research 49: 21-32.
Hall, D.J.M. (1998). Project DAW414. In: Grains Research and Development Corporation Annual Repot – 1998.
Henschke, C.J. (1989). Review of Wisalts bank installations. Western Australian Department of Agriculture, Division of Resource Management Technical Report No. 62.
Hingston, F.J. and Gailitis, V. (1976). The geographic variation of salt precipitated over Western Australia. Australia Journal of Soil Research 14: 319-335.
Houghton, P.D. and Charman, P.E.V. (1986). ‘Glossary of terms used in soil conservation’. Soil Conservation Service of New South Wales.
Howes, K.M.W. (editor) (1991). Trees for farms. Department of Agriculture Western Australia, Bulletin No. 4206.
Hunt, N and Gilkes, R. (1992). ‘The farm monitoring handbook: a practical down to earth manual for farmers and other land users’. The University of Western Australia.
Hussey, B.J.M. and Wallace, K.J. (1993). ‘Managing your bushland’. Department of Conservation and Land Management, Perth.
JDA Consultant Hydrologists and Hauck, E. (1999). Evaporation basin guidelines for disposal of saline water. Agriculture Western Australia, Miscellaneous Publication No. 21/99.
Johnston, C.D. and McArthur, W.M. (1981). Sub-surface salinity in relation to weathering depth and landforms in the eastern part of the Murray River catchment area, Western Australia. CSIRO Division of Land Resource Management, Technical Paper No. 25.
Johnston, C.D., McArthur, W.M. and Peck, A.J. (1980). Distribution of soluble salts in soils in the Manjimup Woodchip License Area, Western Australia. CSIRO Division of Land Resource Management, Technical Paper No. 5.
Karafilis, A. (2000). ‘Repairing farm waterways – Blackwood stories’. Blackwood Basin Group, Boyup Brook. Keen, M.G. (1998). Common conservation works used in Western Australia. Agriculture Western Australia,
Resource Management Technical Report No. 185.

5: Dryland salinity
-137-
Lambert, M.J. and Turner, J. (2000). ‘Commercial forest plantations on saline land’. CSIRO Publishing, Melbourne.
Lawrence, C. (1996). Aquaculture options for saline lands. In: Proceedings of the 4th National Workshop on the Productive Use and Rehabilitation of Saline Lands, Albany, March 1996. pp. 89-98.
Lefroy, E.C., Salerian, J. and Hobbs, R. J. (1992). Integrating economic and ecological considerations: A theoretical framework. In: ‘Reintegrating fragmented landscapes: towards sustainable production and nature conservation’. (eds R.J. Hobbs and D.A. Saunders). Springer-Verlag, New York. pp. 209-244.
Lewis, M.F. (1991). Lineaments and Salinity in Western Australia - carriers or barriers? In: Proceedings of the International Hydrology and Water Resources Symposium, 1991/92. Institute of Engineers, Australia, Perth pp. 202-209.
Short, R. and McConnell, C. (in press). The extent and impacts of dryland salinity in Western Australia, National Land and Water Resources Audit. Agriculture Western Australia, Resource Management Technical Report No. 202.
McFarlane, D.J. (1985). Controlling surface water flow above salt-affected areas. Western Australian Department of Agriculture, Technote No. 66/85.
McFarlane, D.J. and Cox, J. (1990). Seepage interceptor drains for reducing waterlogging and salinity. Journal of Agriculture Western Australia 31: 66-69.
McFarlane, D.J. and George, R.J. (1992). Factors affecting dryland salinity in two wheatbelt catchments in Western Australia. Australian Journal of Soil Research 30: 85-100.
McFarlane, D.J., Engel, R. and Ryder, A.T. (1987). The location of recharge areas associated with valley floor salinity in the Lake Toolibin catchment, Western Australia. In: ‘Groundwater recharge’. (ed. M.L. Sharma). A.A. Balkema Publish Co., Rotterdam/Boston. pp. 255-268.
McFarlane, D.J., Engel, R., Ryder, A. and Eales, M. (1990). Level banks used to decrease waterlogging can increase salinity. Journal of Agriculture Western Australia 31: 74-77.
Maas, E.V. and Hoffman, G.J. (1977). Crop salt tolerance-current assessment. Journal of the Irrigation and Drainage Division: Proceedings of the American Society of Civil Engineering 103: 115-134.
Malcolm, C.V. (1983). Wheatbelt salinity - A review of the salt land problem in south-western Australia. Western Australian Department of Agriculture, Technical Bulletin No. 52 (revised edition).
Marcar, N., Crawford, D., Leppert, P., Jovanovic, T., Floyd, R. and Farrow, R. (1995). Trees for saltland; a guide to selecting native species for Australia. CSIRO Division of Forestry.
Martin, L. and Metcalfe, J. (1998). Assessing the causes, impacts, costs and management of dryland salinity. LWRRDC Occasional Paper 20/98, Land and Water Resources Research and Development Corporation, Canberra.
Moore, G. (1998). Soil salinity. In: ‘Soilguide - A handbook for understanding and managing agricultural soils’. (ed. G. Moore). Agriculture Western Australia, Bulletin No. 4343. pp. 146-158.
Moore, R., Jenkins, P., Anderson, G. and Scott, P. (1991). Agroforestry with widely-spaced pine trees. Department of Agriculture Western Australia, Bulletin No. 4176.
Negus, T.R. (1987). Seepage interceptor drains and topsoil salinity. Journal of Agriculture Western Australia 28: 44-49.
Northcote, K.H. and Skene, J.K.M. (1972). Australian soils with saline and sodic properties. CSIRO Soil Publication No. 27.
Nulsen, R.A. (1981). Critical depth to saline groundwater in non-irrigated situations. Australian Journal of Soil Research 19: 83-86.
Nulsen, R.A. (1985). Hillside seepages. Journal of Agriculture Western Australia 26: 128-129. Nulsen, R.A. (1993). Changes in soil properties. In: ‘Reintegrating fragmented landscapes - towards
sustainable production and nature conservation’. (eds R.J. Hobbs and D.A. Saunders). Springer-Verlag, New York. pp. 107-145.
Nulsen, R.A. (editor) (1998). Groundwater trends in the agricultural areas of Western Australia. Agriculture Western Australia, Resource Management Technical Report No. 173.
Nulsen, R.A. and Baxter, I.N. (1982). The potential of agronomic manipulation for controlling salinity in Western Australia. Journal of the Australian Institute of Agricultural Science 48: 222-226.
Patabendige, D.M., Scott, P.R. and Lefroy, E.C. (1992). Fodder trees and shrubs for the high rainfall areas of south-western Australia. Western Australian Department of Agriculture, Division of Resource Management Technical Report No. 135.
Peck, A.J. and Williamson, D.R. (editors) (1987). Hydrology and salinity in the Collie River Basin, Western Australia. Journal of Hydrology. 94 (1/2). Special Issue.
Quinlan, J. (1999). From salinity to salt. Agricultural Science 12: 26-29. Rivers, M. (1998). Salinity on the Swan Coastal Plain: Part 1 - Review. Western Australian Department of
Agriculture, Miscellaneous Publication No. 21/98. Runciman, H.V. and Malcolm, C.V. (1989). Forage shrubs and grasses for revegetating saltland. Western
Australian Department of Agriculture, Bulletin No. 4153. Ruprecht, J. and Bowman, S. (1999). Flood risk analysis. In: The effect of recharge management on the
extent of dryland salinity, flood risk and biodiversity in Western Australia: Preliminary computer modelling, assessment and financial analysis. Results of a two week modelling contract carried out for the State Salinity Council.
Schofield, N.J., Ruprecht, J.K. and Loh, I.C. (1988). The impact of agricultural development on the salinity of surface water resources of south-western Australia. Water Authority of Western Australia, Report No. WS 27.

5: Dryland salinity
-138-
Schofield, N.J., Loh, I.C., Scott, P.R., Bartle, J.R., Ritson, P., Bell, R.W., Borg, H., Anson, B. and Moore, R. (1989). Vegetation Strategies to reduce stream salinities of water resource catchments in south-west Western Australia. Water Authority of Western Australia, Water Resources Directorate Report No. WS33.
Schwab, G.O., Frevert, R.K., Edminster, T.W. and Barnes, K.K. (1981). ‘Soil and water conservation engineering’ (3rd edition). John Wiley and Sons, New York.
Sedgley, R.H., Smith, R.E. and Tennant, D. (1981). Management of soil water budgets of recharge areas for control of salinity in south-western Australia. Agricultural Water Management 4: 313-334.
Shaw, R. and Gordon, I. (1997). ‘Salinity management handbook’. Queensland Department of Natural Resources.
Sinclair Knight Merz Pty. Ltd. (2000). Lake Toolibin numerical groundwater model – Project Report – Final, October 2000. Report to the Department of Conservation and Land Management WA.
Singh, J. and Christen, E.W. (1999). Minimising the cost of evaporation basins: Siting, design and construction factors. CSIRO Land and Water Technical Report No. 12/99.
Smith, A.D., George, R.J., Scott, P.R., Bennett, D.L., Rippon, R.J., Orr, G.J. and Tille, P.J. (1998). Results of investigations into the groundwater response and productivity of high water use agricultural systems 1990-1997: 6. Summary of all sites. Agriculture Western Australia, Resource Management Technical Report No. 179.
Speed, R.J. and Simons, J.A. (1992). Deep drains - a case study and discussion. Western Australian Department of Agriculture, Division of Resource Management Technical Report No. 133.
State Salinity Council (1998). ‘Western Australian salinity action plan - Draft update, 1998’. Government of Western Australia.
State Salinity Council (2000a). ‘The salinity strategy’. Government of Western Australia. State Salinity Council (2000b). ‘Salinity: A guide for land managers’. Government of Western Australia. Sudmeyer, R.A., Saunders, C., Maling, I. and Clark, T. (1994). Perennial grasses for areas receiving less than
800 mm annual rainfall. Agriculture Western Australia, Bulletin No. 4253. Teakle, L.J.H. (1938). Soil salinity in Western Australia – Preliminary investigations into movement of salt in
the RED Brown Earth Zone under a 15 to 25 inch annual rainfall. Journal of Agriculture Western Australia 15: 434-452.
Thamo, A. (1992). ‘Using trees on the farm in south-western Australia’, Small Tree Farm, Balingup. Trendall, J. and Pitman, D.R. (1998). ‘The outback ocean – Aquaculture in inland salt water’. Fisheries
Western Australia. Trotman, C.H. (editor) (1974). The influence of land use on stream salinity in the Manjimup area. Western
Australian Department of Agriculture, Bulletin No. 27. Ward, P.R., Dunin, F.X. and Micin, S.F. (in press). Water balance of annual and perennial pastures on a duplex
soil in a Mediterranean environment. Australian Journal of Agricultural Research. Warren, B., Casson, T. and Barrett-Lennard, E. (1995). Value of saltbush questioned? Journal of Agriculture
Western Australia 36: 24-27. Water and Rivers Commission (1996). General guidelines for the acceptability of aquaculture projects. Water
and Rivers Commission, Perth. Wiley, T.J., Oldham, C.M., Allen, G.M. and Wiese, T. (1994). Tagasaste. Department of Agriculture Western
Australia, Bulletin No. 4291. Wood, E.W. (1924). Increase in salt in soil and streams following the destruction of the native vegetation.
Journal of Royal Society, Western Australia 10: 35-47.

6: Irrigation salinity
-139-
6. IRRIGATION SALINITY
6.1 INTRODUCTION
6.1.1 What is irrigation salinity? The term irrigation salinity is used to describe the salinisation of land that is artificially irrigated. Irrigation salinity is similar to dryland salinity (Section 5.1.1) in many respects; it involves an accumulation of soluble salts in the root zone; these salts restrict plant growth and sodium chloride (NaCl) is the dominant salt involved. The main difference between the two types of salinity is the way they are caused - the application of irrigation water is the major cause of irrigation salinity, not changes to the vegetation. The surface expression of irrigation salinity may be similar to that of dryland salinity (see Section 5.3.1) with plant death and scald being apparent. However it is more typically characterised by changes in pasture composition, reduced pasture yield, slow or poor pasture germination, crop failures and excessive waterlogging. 6.1.2 What are the causes of irrigation salinity? Irrigation salinity has appeared in nearly every irrigation area developed throughout history and the primary cause is the application of irrigation water. Although hydrological changes similar to those described for dryland salinity (Section 5.1.2), such as reduced water usage by vegetation, may also be occurring on irrigated land, the addition of water and salts through irrigation plays the dominant role. Water used for irrigation almost always contains some dissolved salts and as a result the amount of salt in the soil is increased. Because irrigation water is applied regularly and in periods of high evaporation, the water supply does not have to be highly saline for the incremental build up of salts to eventually become significant. It follows that the higher the salinity levels in the water supply, the quicker the build up will be. Similarly the rate of application is important. Salt levels will accumulate much quicker under flood irrigation, where large volumes of water are applied, than under trickle irrigation. The characteristics of the soils are also factors to be considered. In heavy-textured soils with low infiltration rates some of the salts may be lost through flushing by runoff water. Where little runoff occurs on clays the salt build up in the surface soil will be relatively rapid because of the slow percolation. In sandy soils, salts are more able to leach beyond the root zone. However, where the water tables are shallow, the leaching and flushing effects are minor compared to the concentration effect due to evaporation from the water table. In most irrigation systems, the rate of water supply exceeds the requirements of the crops and pastures. A significant proportion of this excess water contributes to groundwater recharge. This additional recharge causes the water table to rise closer to the soil surface, dissolving and transporting any salts within the soil material and irrigation water. When this saturated zone comes within the critical distance from the soil surface (approximately 2 m), salts within the groundwater can move to the surface by capillary rise. When this water evaporates from the soil surface, the dissolved salts are left behind in the root zone. Again the rate of water application is important in determining the rate of groundwater recharge. If the application rate is higher than the rate of evapotranspiration, then recharge into the groundwater system is likely. This lifts the water table to a critical depth and allows evaporation to concentrate salts near the surface, in the root zone. The proximity of the water table to the ground surface and the amount of salt contained in the groundwater are important factors in determining the severity of irrigation salinity. In some irrigated soils a layer of low permeability, such as thick clay sediments or hardpans, can result in perched groundwater forming. Salt levels building up in these perched groundwaters can lead to irrigation salinity. Where the irrigation water is drawn from aquifers underlying the land being irrigated, the recycling of salts by evaporative concentration can be a problem, particularly in highly permeable, sandy soils. This is because salinity levels can build up in the groundwater when water is lost by

6: Irrigation salinity
-140-
evapotranspiration during irrigation. Over time, the volume of the aquifer may either decrease or the concentration of salts increase, until it reaches a level where the water is too saline for irrigation. Salts added by leaching from applied fertilisers may also contribute to this effect. 6.2 IRRIGATION SALINITY IN THE SOUTH-WEST HYDROLOGICAL REGION
6.2.1 What is the extent of irrigation salinity? Irrigation salinity is primarily a problem on the South-western Irrigation Area located on the Swan Coastal Plain. The South-western Irrigation Area The South-western Irrigation Area is located on the Swan Coastal Plain between Waroona and Dardanup and covers approximately 35,000 ha of irrigable area, though not all of this area is irrigated at the same time. During 1998/99, 83,000 megalitres of water were used to irrigate 9,780 ha of land. The break up of water allocations within this area were: • 58% to land supporting perennial pastures for grazing dairy cattle, • 25% to land supporting perennial pastures for grazing beef cattle, • 10% to land used for the early germination of annual pastures, • 3% to land used for fodder crops, and • 3% to land used for horticultural crops which included vegetables, citrus and vines. The South-western Irrigation Area is serviced from storages located in the Darling Range. These include Logues Brook, Stirling and Wellington Dams. The water from the northern reservoirs is generally of a suitable quality for pasture and crop irrigation (<500 mg/L). In the late 1980s, water from Wellington Dam (on the Collie River) had a mean salinity in excess of 1,070 mg/L and a rising salinity trend of 42 mg/L/year (Schofield et al., 1988). In recent years, following the construction of the Harris Reservoir upstream, salinity levels in Wellington Dam water have remained between 1,000 and 1,100 mg/L. These levels are high enough to reduce pasture production directly. Salinity in the South-western Irrigation Area is most commonly associated with flood irrigated pastures on clays and shallow loamy duplex soils. A reconnaissance survey in 1986 estimated that about 33% of the Irrigation Area was salt-affected (Middlemas and Green, 1986). It divided the Irrigation Area into 3 zones: • The western zone, comprising 17% of the Irrigation Area, was assessed to be severely salt-
affected with a 50% reduction in clover yield. • The central zone, comprising 16% of the Irrigation Area, was moderately affected with a 25%
reduction in clover yield. • The eastern zone, comprising the remaining 67% of the Irrigation Area was free of salinity. The Australian Bureau of Statistics (1990) conducted its sixth agricultural census in 1989 and asked farmers to identify the amount of land that had become saline on their properties. A total of 40 farmers reported that 821 ha of land was salt-affected in the three shires covering South-western Irrigation Area (Table 6.1). These figures appear to suggest that over the period of a decade, salt-affected land increased by 960% in the Waroona Shire, 120% in the Harvey Shire and 310% in the Dardanup Shire. Another explanation is that the farmers had become more aware of salinity over that period. Table 6.1: The area of land considered saline in the South-western Irrigation Area. Shire Area saline
(ha) Number of farms
affected Average
affected area (ha/farms)
1979 1989 1979 1989 1989 Waroona 12 115 5 7 16 Harvey 412 491 18 23 17 Dardanup 69 215 5 10 21 Total 493 821 28 40 18

6: Irrigation salinity
-141-
It is interesting to note the considerable difference between the estimates provided by farmers for the Australian Bureau of Statistics and those estimated by Middlemas and Green (1986). In 1993 the Wellesley and Dardanup Land Conservation District Committees initiated salinity surveys of the South-western Irrigation Area. The four transect EM38 surveys were designed to estimate the extent of salinity more accurately and provide benchmarks from which to measure future changes (George et al., 1994). These surveys revealed that: • about 10% of the surveyed area had soil salinity levels likely to result in the death of most clover
species (EM38 in excess of 185 mS/m, EC1:5 >75 mS/m), • 22% of the area had soil salinity levels likely to result in a 50% reduction in white clover
production (EM38 in excess of 125 mS/m, EC1:5 50 mS/m), • 36% of the area had soil salinity levels likely to result in a 50% reduction in subterranean clover
production (EM38 in excess of 80 mS/m, EC1:5 >30 mS/m), and • more than 80% of the area would incur some (approximately 10%) yield reduction of both annual
and perennial clovers. George and Bennett (1999) conducted a salinity survey across 20 irrigated and dryland farms (2,200 ha) using ground based EM38 and EM 31 electromagnetic sensors mounted on a quad bike. This survey revealed that: • over about 35% of the surveyed area, the soil in the root zones was mildly salt-affected (EM38
50-100 mS/m, EC1:5 20-40 mS/m). In this condition, the salt could reduce production by 25-50%, • over about 20% of the surveyed area, the soil in the root zones was highly salt-affected (EM38
>100 mS/m, EC1:5 >40 mS/m). In this condition, the salt could reduce production by more than 50%,
• over about 40% of the surveyed area, subsoil were highly salt-affected (EM31 100-200 mS/m, EC1:5 50-100 mS/m), and
• over about 10% of the surveyed area, subsoils were extremely salt-affected (EM31 >200 mS/m, EC1:5 >100 mS/m).
In general, the soils on the western margins of the South-western Irrigation Area are most prone to salinisation because they tend to have heavier textures, are lower lying and have shallower water tables. They remain nearly saturated for much of the year and are therefore subject to almost continual evaporation which concentrate salt in the topsoil. The major groundwater bearing aquifers in the upper 30 m of the coastal plain are the Guildford Formation in the west and the Yoganup Formation in the east. Deeney (1988) found that water in the upper 5-10 m of the unconfined aquifers throughout the Irrigation Area were brackish (1,000-4,000 mg/L) to very saline (4,000-14,000 mg/L). More recent drilling showed that salinity in the upper 2-5 m exceeds 25,000 mg/L in many areas. Water tables are closer to the surface on the western edge of the Irrigation Area, where groundwater discharge is more common. The most saline waters are found in the Guildford Formation to the north and south. Excess irrigation water contributes to the recharge of these aquifers. Irrigation salinity in other areas Irrigation salinity in other areas is not as widely recognised as that occurring within the South-western Irrigation Area. Salinity problems tend to be fairly localised. In these other areas, irrigation water is mainly applied to horticultural crops by sprinkler or trickle systems which apply much smaller amounts of salt than flood irrigation does. The low tolerance of horticultural crops to salt means that salinity levels do not have to be very high before they begin to affect production. In the Myalup district on the Swan Coastal Plain, local surficial groundwater has become too saline for irrigating some of the sensitive horticultural crops. At first, this problem was believed to be due to salt water intrusion from underlying saline aquifers after heavy extraction from the fresh aquifer. However, it now appears that the recycling of salts by evaporative concentration is the major cause. Irrigation sometimes leads to groundwater discharge and salinity problems in horticultural areas within the Forested Hills and Western Woolbelt zones. This has been observed in the Donnybrook, Bridgetown, Frankland and Manjimup districts where irrigated waters recharge weathered bedrock and minor sedimentary aquifers. Although they may create seeps with sufficient salinity and/or waterlogging effects to reduce plant growth, only small areas are affected. Salinity problems

6: Irrigation salinity
-142-
associated with rising water tables under centre pivot irrigation systems have also been recorded near Manjimup. Salinity problems are also experienced when farm dams used to store irrigation water for horticultural crops are becoming saline due to dryland salinity. This has been observed in the southern Western Woolbelt and, in the future, may present major problems for vineyards in the district. It has also been observed in dams in the Forested Hills, where even quite small but brackish seepages discharging into dams have caused significant problems for water supplies. 6.2.2 What are the problems associated with irrigation salinity? The effects of irrigation salinity are similar to those described for dryland salinity (see Section 5.2.2). It is usually the interaction of salinity and waterlogging which is most detrimental to plants, leading to a reduction in yield and quality of pastures and crops. Table 6.2 summarises the effect of soil salinity in the root zone on pasture and crop yields. These data were originally presented by Maas and Hoffman (1977) and later adapted to Western Australian conditions by George and Wren (1985). Annual legumes such as subterranean clover are affected at lower salinities than the summer active perennial grasses such as kikuyu. The table also emphasises that the effect of salinity is more severe in sandy soils than in clayey soils. Figure 6.1 demonstrates the effect of soil salinity in the South-western Irrigation Area (as measured with the EM38) on the yield of clover/ryegrass, millet, kikuyu and maize.
Figure 6.1: Yield response to salinity (from George and Bennett 1999)
0
10
20
30
40
50
60
70
80
90
100
0 50 100 150 200
Soil salinity measured by the EM38 (ECa mS/m)
Yie
ld (%
of m
axim
um)
KikuyuMaizeMilletClover/Ryegrass

6: Irrigation salinity
-143-
Table 6.2: The effect of salinity (EC 1:5) in the root zone on pasture and crop yields. Crops Salinity (EC1:5 mS/m) at
which yield in sandy soil is reduced by:
Salinity (EC1:5 mS/m) at which yield in loamy soil is reduced by:
Salinity (EC1:5 mS/m) at which yield in clayey soil is reduced by:
0% 25% 50% 0%. 25% 50% 0% 25% 50% Avocado 5 15 20 10 20 35 15 30 45 Couch grass 40 60 80 60 95 130 85 135 185 Grapes 10 25 35 15 35 60 20 50 85 Kikuyu n.d. n.d. 145 n.d. n.d. 190 n.d. n.d. 265 Lettuce 5 20 30 10 30 45 15 40 65 Maize (forage) 10 30 45 15 45 75 20 65 105 Onion 5 15 25 10 25 40 15 35 55 Orange 10 20 25 15 30 40 20 40 60 Paspalum n.d. n.d. 50 n.d. n.d. 65 n.d. n.d. 90 Perennial ryegrass 30 50 65 50 80 110 70 110 150 Phalaris 25 45 60 40 70 100 55 100 140 Potato 10 20 35 15 35 50 20 45 75 Sorghum 20 40 60 35 65 95 40 90 135 Strawberry 5 10 15 10 15 20 10 20 30 Subterranean clover 10 20 30 15 30 50 20 45 70 Tall wheatgrass 40 75 105 65 10 170 95 165 240 Tomato 15 30 40 20 45 65 30 60 95 n.d. – no data available Adapted from: George and Wren (1985) The quality of irrigation water also affects yield. For example, in the south of the Irrigation Area, water from Wellington Dam can reduce yields of subterranean clover by between 10% (at 600 mg/L) and 25% (at 1,300 mg/L). Ryegrass, kikuyu, lucerne, Paspalum, couch and balansa clover are not usually considered to be greatly affected by these levels of salinity. Many horticultural crops have a low tolerance to saline irrigation water. Table 6.3 presents the tolerance of some local crops and pastures to the salinity of irrigation water, expressed as a percentage yield loss. The values presented are guides only because absolute tolerances can vary depending on climate, soil conditions and cultural practices. Table 6.3: Tolerance of crops and pastures to irrigation with saline water.
Crop or pasture 0% yield loss (mg/L TSS)
10% yield loss (mg/L TSS)
25% yield loss (mg/L TSS)
Apple n.a. 800 n.a. Apricot 600 700 1,000 Beetroot 1,500 1,900 2,500 Carrot 400 600 1,000 Celery 700 1,300 2,100 Grapes 600 900 1,500 Lettuce 500 800 1,200 Lucerne 700 1,200 2,000 Maize 600 900 1,400 Onion 400 700 1,000 Orange 600 900 1,200 Peach 600 700 1,000 Perennial ryegrass 2,000 2,500 3,200 Phalaris 1,700 2,100 2,900 Plum 600 800 1,000 Potato 600 900 1,400 Sorghum 2,500 2,800 3,100 Strawberry 400 500 700 Strawberry clover 600 900 1,300 Subterranean clover 500 600 1,300 Sweet corn 600 900 1,400 Tall wheatgrass 2,800 3,600 5,000 Tomato 900 1,300 1,900 Watermelon 800 1,300 2,100 • n.a. Not available Adapted from: Ayres and Westcote (1985)

6: Irrigation salinity
-144-
Salinity in the South-western Irrigation Area is believed to contribute increasing levels of soil sodicity leading to soil-structural decline (e.g. pugging). 6.2.3 Which areas are most susceptible to irrigation salinity? As discussed above one of the areas most susceptible to irrigation salinity is the western and central sections of the South-western Irrigation Area. The risk of irrigation salinity is also high in any area where there are shallow water tables, especially if these are already saline. Areas of poor drainage and heavy-textured soils are also susceptible. Irrigation management has a major impact on determining the risk of irrigation salinity. Where water application significantly exceeds the requirements of the irrigated crops and pastures the likelihood of salinity developing is especially high. The large volumes of water used in flood irrigation contribute to salinity risks, but even over-watering when using sprinklers can be a problem. In flood irrigation areas, risks are greatest close to the tail drains of the irrigation bays. The salinity of irrigation water may double between the head ditch and tail drain due to a combination of evaporative losses and the addition of salts previously stored in the topsoil. If the tail drain is not functioning properly, the resultant water ponding greatly increases the risk of salinity at the bottom of the bay. 6.2.4 Irrigation salinity research in the South-west Hydrological Region Most of the research into irrigation salinity in the South-west Hydrological Region relates to pastures and drainage of flood irrigated paddocks. George and Furness (1979) investigated the area’s groundwater hydrology, while George (1991) summarised research into soil salinity and groundwater in the Irrigation Area. George et al. (1994) and George and Bennett (1999) used ground electromagnetic systems to relate the severity and extent of soil salinity to pasture production. Rivers (1998) summarised investigations into salinity on the Swan Coastal Plain. Recent research (Anon., 1999) is based on developing effective drainage systems and studying their impact off-site.
Surface and sub-surface drainage of irrigated pastures at Benger.

6: Irrigation salinity
-145-
6.3 MANAGING IRRIGATION SALINITY
Management techniques to control irrigation salinity include irrigation scheduling, agronomic manipulation, cultivation and drainage. Farmers can chose to adapt their pastures for the higher salinity levels by selecting varieties that are more salt tolerant, adopt new tillage practices or adopt new farm layouts which include major surface and sub-surface drains. 6.3.1 How can irrigation salinity be identified? There are a variety of techniques for identifying irrigation salinity problems; Pasture performance The composition, density and productivity of pastures can provide a good indicator of salinity problems. Bare ground may be found where salt problems are severe. Even when salinity levels are relatively high, pastures may be green but the species composition changes as salt tolerant species take over from those that are more sensitive. Species such as barley grass (Hordeum leporinum), beard grass and yellow button weed (Cotulla spp.) are often present in salt-affected areas. Subterranean clover and white clover (Trifolium repens) are amongst the first pastures to be affected by salinity, and their absence from pastures is a warning sign. Rye grass (Lolium spp.) is also likely to disappear, but may hold on in moderately saline conditions where nitrogen availability is good. Kikuyu will also tolerate moderately saline conditions, as will Paspalum, though its growth will be reduced. Couch may be found in areas too salty for these species. The presence or absence of these indicator species is not always correlated with levels of soil salinity (Nulsen, 1981). Other factors including waterlogging and agricultural management practices such as tillage can also influence pasture performance. Signs that plants may be salt-affected are a yellowing of the leaves with scorching around the leaf margins. Horticulturists should be especially vigilant for these signs. Plants suffering salt stress are also more susceptible to disease and attack by pests. Soil testing Accurate site assessments using soil samples is time consuming, expensive and can be highly variable (Slavich and Read, 1984). Salt stores in the soil can vary greatly over short distances as well as with time of season, so making comparisons between measured levels of soil salinity and plant performance is difficult. In irrigation bays, samples from the bottom of the bay, where salinity levels are usually highest, should be compared with those from the top of the bay. Samples taken in the spring and autumn should also be compared. Soil salinity readings (laboratory analysis of EC1:5) of over 20 mS/m in sands and 40 mS/m in clays are indications of salinity problems. Water quality In flood irrigated paddocks the salinity of water entering and leaving bays can be compared. When levels increase by a factor of two or more it is a good indication of salinisation in the bay. Water salinity levels of over 550 mg/L indicate salinity problems. Observation wells can be installed to monitor water table height and salinity in flood irrigated paddocks as well as under other forms of irrigation. The levels of salinity in water are less variable than in soil, and wells help the landowner assess the effect of water tables on the salinity problem. Ideally, a 40-50 mm PVC pipe should be sunk to 2 metres. Only the bottom metre should be slotted, as salinity of water near the surface can vary rapidly depending on timing of irrigation and rainfall. Water salinity levels higher than 550 mg/L indicate potential salinity problems, especially if the water table rises to within 2 metres of the surface. Using the EM38 for salinity assessment The EM38 is a portable instrument designed to take in situ field measurements of soil salinity and it has the ability to non-destructively sample and resample soils. Norman and Heslop (1991) have successfully used the EM38 for large soil salinity surveys, while Slavich and Read (1984) used the EM38 to develop a response curve (effect of soil salinity on grain yield) for barley (Hordeum vulgare). They found that the EM38 provided reliable estimates of soil salinity without intensive soil sampling.
6: Irrigation salinity
-146-
Work in the South-western Irrigation Area has shown that the EM38 can be used as a field tool to assess the severity of salinity, and its effects on pastures, on the irrigated soils along the Coastal Plain. In order to obtain relationships between actual soil samples and measurements from the machine, the EM38 should be calibrated in each new environment. Bennett et al. (1995) describe the correct operating, surveying and calibration of the EM38 under Western Australian conditions. Calibrations between actual and measured levels of salinity indicate that the EM38 is able to accurately predict the root-zone salinity (90% accuracy). Soil salinity (EC1:5) can be estimated from the measured values (ECa) using the formula: EC1:5 = 0.42ECa - 1.74. As a general guide to assessing readings on the EM38, ECa values of: • 0-50 mS/m indicate low salinity, • 50-100 mS/m indicate moderate salinity, • 100-150 mS/m indicate high salinity, • >150 mS/m indicate severe salinity. Farm scale surveys using this EM38 system are available on a commercial basis. Farmers are using the salinity maps produced from these surveys as an aid to current farm management and future farm planning. They highlight less saline areas where inputs, such as reseeding and fertilisers, should be concentrated. The maps are also useful when deciding where fences should be re-aligned (to separate saline and fresh soils), where drains should be placed, which new areas could be irrigated, and which pasture or tree species can be planted. For example, salt-waterlogging tolerant species such as balansa clover may be sown on areas identified as being moderately saline. Drainage, tree planting and other works can be targeted to areas of most need. Areas of land that have a low salinity risk and are suitable for horticultural or other intensive pursuits can also be identified. George and Bennett (1999) further discuss the use of ground electromagnetic systems (EM38 and EM31 instruments) as a planning and decision support tool for farmers and irrigation managers. 6.3.2 What changes can be made to agricultural practices? Irrigation scheduling Efficient use of water is one of the keys to managing salinity under irrigation. Over-watering of crops and pasture is a major cause of salinity. Flood irrigation bays: The aim should be to irrigate more often using smaller amounts of water. Water should be applied each time the cumulative evaporation from a “class A” pan reaches 70 mm. This figure can range from 65 mm on heavy clays to 90 mm on loamy earths with good soil structure. Following this strategy, watering may be required every 6-8 days in mid summer and result in up to 15 waterings a year. It is important to get the water onto the bay quickly and ensure that excess water is removed efficiently. The longer the water takes to move down an irrigation bay, the greater the opportunity for percolation and recharge. To reduce this time, one to three bays only should be irrigated at a time, using the whole flow of the Detheridge wheel. The watering of each bay should be completed in 1-4 hours. This will require well designed head ditches (with a clean flat bottom about a metre wide), bay outlets 60-100 cm wide and adequate tail drains. Sprinkler and trickle irrigation: Using micro-irrigation systems rather than overhead sprinklers is likely to markedly reduce water use and the risk of salinity. Irrigation scheduling to match crops requirements, soil types and climatic conditions is important. The Crop Irrigation Requirement Program (Aylmore et al., 1994) can be used to estimate crop water requirements. Soil moisture sensors such as tensiometers can be used to determine when irrigation is required. Designing irrigation systems to cope with topographic variations and monitoring soil moisture levels, providing windbreaks and avoiding the use of sprinklers in windy conditions can also reduce water requirements. Pasture management The further pasture roots penetrate the soil, the more efficient the plants will be at using applied water and therefore reducing the rate of recharge contributing to irrigation salinity. Poor soil structure is often a cause of poor root penetration. To prevent further soil compaction, stock should be kept off pastures when they are waterlogged. Some farmers have opted to

6: Irrigation salinity
-147-
remove cattle from parts of the farm that become excessively wet and that are degraded easily. “Runoff” blocks and feed-lots are options that may be used to prevent damage to the winter and spring pastures. Deep ripping may be necessary to improve soil structure by fragmenting the compacted soil to allow better root penetration. It also allows the initial rains to flush the surface salts out allowing a fresh root zone for newly germinating pastures. The ideal ripping depth is 80 cm but the horsepower limitations of tractors usually only make it possible to get down to 40-50 cm. Lime and gypsum applications may help pasture performance. Lime can be used where soil acidity inhibits growth. While the application of gypsum to combat soil structural problems is widely practised in the Wheatbelt, there is currently no conclusive evidence that it is effective on sodic soils in the South-western Irrigation Area. Positive pasture responses to gypsum applications may result from increased sulphur availability to plants rather than improved soil structure. Pasture Selection: To maximise productivity, pasture species can be matched to salinity levels within paddocks. Establishing salt tolerant species such as balansa clover on areas of saline soil provides a more even distribution of feed and a higher total production. In practice the lack of trial data on yield and quality changes, the uneven distribution of salinity and the considerable expense in developing irrigated pastures have restricted the adoption of this strategy. Revegetation In most of the South-western Irrigation Area, incorporating trees into the farming system will have little effect on the groundwater levels, especially in winter. For example, trees established at Waterloo have lowered the water table for a distance of <5m from the planting (George et al., 1994). However, there will be benefits from shade and shelter, though commercial species are unlikely to perform well in heavy clay soils and saline areas. Table 6.4 gives some examples of the best trees to plant in saline and waterlogged areas. An EM38 reading of 50 mS/m (EC1:5 20 mS/m) is usually considered the cut off mark for planting commercial trees of low salt tolerance. Table 6.4: Suitable trees for waterlogged and/or saline conditions on Coastal Plains
Waterlogged soils Waterlogged and saline soils Clays and shallow loamy duplex soils
Eucalyptus rudis E. ovata E. robusta E. camaldulensis
Acacia saligna E. occidentalis E. camaldulensis Melaleuca raphiophylla M. cuticularis Casuarina obesa M. preissiana
Loamy earths and deep loamy duplex soils
E. rudis E. ovata E. botryoides E. grandis E. nesophila E. camaldulensis Melaleuca armillaris
E. wandoo E. camaldulensis E. occidentalis Callistemon phoenicius Casuarina obesa M. preissiana
6.3.3 Engineering options Drainage is one of the major techniques available for combating irrigation salinity and associated waterlogging problems. The deeper and more elaborate the drainage system being contemplated, the more expensive it will be. So with economics in mind, salinity management should be based around first managing surface water and then tackling deeper waters later. There are now various legislative controls on the drainage of land. Agriculture Western Australia should be contacted before commencing any major drainage works. Farmnotes that explain these regulations are listed below.

6: Irrigation salinity
-148-
Surface drainage Flood irrigation bays: The design of the irrigation bays is important. There should be an adequate slope gradient (0.2-0.5%) down each irrigation bay. The bays should be less than 300 m long. If they are longer than this it takes too long for water to runoff. Bay inlets should be 60-100 cm wide and it is important to have deep, clear tail drains that do not pond water. Laser levelling was introduced to enable the even watering of irrigated pastures and to attempt to conserve water. Laser levelling helps to prevent water being wasted and produces a more even pasture growth by removing undulations in the ground surface. When laser levelling, it is important to achieve an even spread of the topsoil. If this is not done clayey subsoils can be exposed, creating further drainage problems. Note that laser levelling does not solve the problem of excess winter water, especially where the water tables are shallow, and it is often necessary to install other forms of surface drainage. Deepened tail drains allow excess summer and winter flows to be easily removed. With the exception of the major drainage channels, deep tail drains are the cornerstone of effective management of irrigation waters. However, deep tail drains can cause problems of accessibility and side wall slumping etc. Where these problems exist a shallow open tail drain can be used in conjunction with a deep enclosed tube drain (see below), backfilled with gravel to the surface. Water can be moved more efficiently from the paddock to the tail drain using spinner drains. These consist of small rills that are 5-10 cm deep and 2-3 m apart. They are constructed with rotating steel blades and can be installed cheaply. Their effectiveness is limited by the “pugging” of the soil by cattle, the growth of the grass “thatch” and lack of gradient on the bays. Several years ago, farmers in the irrigation area began to experiment with raised beds (“lands”) and the ridge and furrow systems. The raised beds were adopted widely in dryland areas. Ridge and furrow systems have recently been revised and trialed. The Bach ridge and furrow system increases the ability of the paddock to drain water by increasing the effective gradient on the bay. Water is moved laterally from the ridge to the adjoining furrow on a gradient. Significant increases in pasture growth have been observed using this system for the first 1-2 years, then it was found that salinity levels built up dramatically on the ridges due to capillary rise. It is no longer a method recommended for saline irrigation areas. Sub-surface drainage There are two types of sub-surface drainage systems available. Mole drains (with or without collector systems) are potentially less expensive than tube (slotted pipe) drainage systems. Both systems have been tried, or are being tried, in the South-western Irrigation Area at present. Table 6.5 presents preliminary results from a study of the effectiveness of surface and sub-surface drainage conducted at Benger (Anon., 1999). The study involved two adjoining flood irrigation paddocks, one with no additional drainage apart from the usual tail drains at the ends of the irrigation bays, and the other with improved surface and sub-surface drainage. The results suggest that while the surface drainage system was ineffective in controlling waterlogging, the sub-surface drainage system being installed was extremely efficient at removing excess water and salt. This was leading to a net reduction in soil salt storage and salinity. Table 6.5: The effectiveness of drainage in irrigated paddocks.
Water flow (cubic metres)
Water removed (mm)
Salt removed (t/ha)
Paddock without drainage 28,000 390 6.3 Surface drainage 3,000 45 0.2 Sub-surface drainage 38,000 510 11.0 Total for paddock with drainage 41,000 550 11.2 Adapted from: Anon. (1999)
In Europe over 100 years ago, conventional mole drains were developed to drain heavy-textured and low permeability soils. Initially they were installed with horses and steam driven tractors. More recently, the advent of high powered tractors, laser levelling equipment and the expense of alternative methods for draining heavy-textured soils, has led to a resurgence of interest in the technique.

6: Irrigation salinity
-149-
Mole drains are tubular holes (50-100 mm diameter) created by pulling a metal foot and trailing expander through the soil. The foot and expander create a cavity that may conduct water rapidly to a nearby drain. The effectiveness of the mole depends on the water’s ability to pass through the soil, enter the channel without causing roof collapse and flow without degrading the walls of the channel (Leeds-Harrison et al., 1982; Spoor and Ford, 1987). This system suits heavy-textured soils. In the 1960s and 1970s, gravel mole drains were developed in Denmark and Ireland as an alternative to the conventional mole channels for unstable soils. The gravel-filled mole drains collect water in the same way as the conventional moles, but have lower flow capacities. The main advantages of the gravel moles are that they last for many years (15-20 years), can be used where conventional moles are unstable, are relatively easy to construct and are substantially cheaper than tube drains if conditions are right. The following technical specifications for successful gravel mole drains are taken from Galvin (1983) and Mulqueen (1985). They should be: • installed about 1.5-3.0 m apart, • have a minimum depth of 0.4 m (optimum = 0.5 m), • be completely filled with gravel or stone chips (5-20 mm diameter; saturated hydraulic
conductivity greater than 1,000 m/day), • be constructed over collector channels spaced about 40-100 m apart, and • be constructed on gradients of more than 0.1% (1:1,000). While these conditions could be met in the South-western Irrigation Area, poor access to cheap gravel at a reasonable price limits their practicality. World-wide, the most common method of controlling sub-surface water is the use of tube drains (tile or slotted pipe drains). However, while they are used widely, they can be the most difficult system to design and the most expensive to install. Most deep drainage systems these days use perforated PVC or Poly pipe. These are either installed directly into the soil (e.g. ripped in with a laser controlled bulldozer), are installed in a geotextile “sock” with a fine-aperture, or are laid into an excavated trench and covered with highly permeable gravel or blue-metal. In 1994, trial strips installed with red sand and blue-metal indicated that the red sand is only appropriate as a filter medium for slotted pipes (underlay blue-metal) because its low permeability produced poor flow rates. However, even in these circumstances, iron precipitate may shorten the life of the tube drain. Blue-metal alone and blue-metal with slotted pipes were more effective, however the flow rates were low owing to the low hydraulic conductivities of the heavy-textured subsoils. Tube drainage systems can be very expensive if the drains are closely spaced. For this reason, they are only used as collectors for mole drainage systems in the South-western Irrigation Area. However, tube drains are being used under horticultural crops of high value. Drain spacings (5-50 metres) are dependent on inflows, the hydraulic conductivity of the soil and drain depth. Installing pumping systems to lower water tables is another option which can be considered in the case of high value crops (see Section 5.3.3 for more details on pumping).

6: Irrigation salinity
-150-
BOX 6.1: MOLE DRAINS IN THE SOUTH-WEST
In our environment, the life expectancy of mole drains is variable and depends on soil type and moling technique. Several farmers have reported that channels made while subsoiling or ripping have remained open for several seasons, although many others report failure soon after construction. The results of this research so far suggest that: • The brown and yellow clay and clay-loam soils are quite stable for mole drainage (drains have
remained open and flowing for at least 2 years so far). • Sodic clays and shallow duplex soils are unsuitable for mole drainage as they are unstable and
collapse. These are locally referred to as “Bungham” clays and are typically blue or grey coloured and are salt-affected.
• The maximum effective length of mole drains is 50-100 m. In most situations, this means that gravel-backfilled collector pipe systems be installed. These effectively shorten the mole run length.
• The best type of machine for the South-western Irrigation Area is the Srubbing Beam type of mole drainer. This type of machine has sufficient weight and leverage to penetrate hardpans.
• Moling should be done when the subsoil is quite moist and plastic but before the topsoil becomes too wet which causes traction problems. This usually means just after the break of the season in autumn.
• The ideal mole spacing is about 2 m. • Moling depth should not be too deep. 400-450 mm depth is sufficient. • The ideal size of the mole bullet is 55-65 mm followed by an expander of 65-75 mm. • The thickness of the mole leg should be less than 20 mm and it should have a closing wedge
attached. • Pasture and trafficability responses are clearly evident. 6.4 SOURCES OF FURTHER INFORMATION
6.4.1 Useful publications See Appendix 1 for contact details of the publishing organisations. Available from Agriculture Western Australia: Crop Irrigation Requirement Program (Aylmore et al., 1994) describes a program that estimates seasonal irrigation requirements for annual and perennial horticultural crops. This should assist horticulturists to minimise water use and reduce salinity risks. Relevant crop specific data is supplied for Albany, Armadale, Manjimup, Margaret River, Medina, Mt Barker and Wokalup. Soil salinity assessment using the EM38: Field operating instructions and data interpretation (Bennett et al., 1995) describes the correct operating, surveying and calibration of the EM38 terrain conductivity meter. This is a portable instrument designed to take in situ field measurements of soil conductivity which can then be used to make reliable estimates of soil salinity. Mole drainage for increased productivity in the South West Irrigation Area (Bennett et al., 1999) provides a guide to draining heavy-textured soils in the South West Irrigation Area, the principles of mole drainage, appropriate soil types, mole plough design, collector drains, system designs and costs. Tree planting on the high rainfall coastal plain (Bennett and George, 1993) was specifically prepared for the Swan Coastal Plain and provides a guide to species selection, planting design, site preparation, planting and weed and pest control.

6: Irrigation salinity
-151-
Relevant Agriculture Western Australia Farmnotes include: General information
97/91 Taxation and the control of land degradation 79/93 Managing waterlogging and inundation in pastures 46/99 Water salinity and crop irrigation 71/99 Tolerance of plants to salty water
Flood Irrigation 119/83 Flood irrigation in the south-west of Western Australia 134/84 Land-forming for flood irrigation
82/85 Summer fodder crops for the South-West irrigation areas Efficient water use 102/85 Watering requirements of vegetables grown on sandy soils 52/88 Irrigation guide for maize, sorghum and sweet corn 22/90 Scheduling for trickle, sprinkler and flood irrigation 23/90 Irrigation scheduling - how and why 24/90 Interpreting tensiometer readings 25/90 Tensiometers – preparation and installation 26/90 Soil moisture monitoring equipment 35/90 Evaluating sprinkler and trickle irrigation systems 43/90 Salt accumulation and leaching under trickle irrigation 99/90 Irrigating table grapes
107/91 Using tensiometers for potato irrigation scheduling 30/92 Design guidelines for fixed sprinklers and micro-irrigation systems 48/92 Efficiency of irrigation systems 79/94 Soil moisture sensors for sandy soils 66/95 Irrigating vegetables on sandy soils 66/99 Irrigation techniques for wine grapes
131/99 Irrigation of summer fruit in Western Australia 107/00 Scheduling irrigation of potatoes using tensiometers on light/medium to heavy soils Drainage
45/86 Drainage of saline and waterlogged soils 79/86 Legal aspects of land drainage 1/88 Reclaiming saline and waterlogged soils on the Swan Coastal Plain 9/91 Responsibilities of landholders under agricultural Acts: Water and drainage
47/93 Notification of draining or pumping saline land 26/94 Notification of intention to drain or pump water in the Peel-Harvey Catchment
Available from the Queensland Department of Natural Resources: Salinity management handbook (Shaw and Gordon, 1997) contains a short chapter on irrigation management.

6: Irrigation salinity
-152-
6.4.2 Agencies and organisations to contact The following agencies and organisations can be contacted for more information (postal address, phone numbers, e-mail address and Internet websites of each organisation are listed in Appendix 1): The local district office of Agriculture Western Australia or Community Agriculture Centres (CAC) can provide information, publications and suitable contacts for specific topics relating to irrigation salinity. Some offices will test the salinity of soil and water samples for a fee. Information on computer models such as “Pumps” and “Drains” should also be available. The local Land Conservation Officer (LCO) at Agriculture Western Australia should be contacted regarding regulations covering land clearing or drainage. AGWEST Land Management Services and other agricultural consultants can assist with the preparation of farm plans and irrigation designs for a fee. The Chemistry Centre (WA) and a number of commercial laboratories can analyse soil and water samples for a fee. The local Community Landcare Coordinator (CLC) will be able to provide advice or suitable contacts for most issues related to irrigation salinity. They will also be able to help with the preparation of submissions for grants for land conservation works. CLCs can be contacted via the Shire Office or through Agriculture Western Australia. Community Landcare Technicians (CLT) can provide assistance in designing and surveying earthworks and drains for a fee. The local office of Agriculture Western Australia or Community Landcare Technician Association should be able to provide contact numbers for local CLTs. The Farm Forestry Advisory Service is a joint initiative between the Department of Conservation and Land Management (CALM) and Agriculture Western Australia providing information to assist landholders integrate tree farming with agriculture. They produce a number of publications and decision making tools. Contact CALM in Busselton or Bunbury, or Agriculture Western Australia in Bunbury, Manjimup or Narrogin. Horticultural consultants can provide advice on crop water requirements and irrigation scheduling. Contact the Irrigation Association of Australia for a list of certified irrigation designers. Local Landcare Groups or Land Conservation District Committee (LCDC), such as Wellesley and Dardanup LCDC could provide contact with landholders who have local experience in tackling irrigation salinity and good information about approaches that have proved successful in the district. The Land Management Society can help provide information and establish contact with other landholders who have practical experience in tackling these issues. They also sell farm monitoring kits. South-west Irrigation can provide advice on water management in the South-west Irrigation Area

6: Irrigation salinity
-153-
6.5 REFERENCES
Anon. (1999). Drainage of irrigated pastures – Project update. Dairy Note No. 7, Agriculture Western Australia Dairy and Apiculture Program, Bunbury.
Australian Bureau of Statistics. (1990). Agricultural land use and selected inputs: Western Australia – Season 1988-1989. Australian Bureau of Statistics Western Australian Office.
Aylmore, P.M., Luke, G.J. and Hauck, E.J. (1994). Crop irrigation requirement program. Western Australian Department of Agriculture, Resource Management Technical Report No. 125.
Ayres, R.S. and Westcot, D.W. (1985). Water quality for agriculture. FAO Irrigation and Drainage Paper No. 29. Food and Agriculture Organisation, Rome.
Bennett, D.L. and George, R.J. (1993). Tree planting on the high rainfall coastal plain. Western Australian Department of Agriculture, Bulletin No. 4274.
Bennett, D.L., George, R.J. and Ryder, A. (1995). Soil salinity assessment using the EM38: Field operating instructions and data interpretation. Western Australian Department of Agriculture, Miscellaneous Publication No. 4/95.
Bennett, D.L., George, R.J. and Russel, W.K. (1999). Mole drainage for increased productivity in the South West Irrigation Area. Agriculture Western Australia, Bulletin No. 4354.
Deeney, A.C. (1988). Geology and groundwater resources of the surficial formations of the coastal plain between Pinjarra and Bunbury. Geological Survey of Western Australia, Hydrogeology Report No. 1988/5, Perth. (unpub).
Galvin, L.F. (1983). The drainage of impermeable soils in high rainfall areas. Irish Journal of Agricultural Research 22: 161-187.
George, P.R. (1991). Environmental impact of past and possible future public irrigated agriculture in the region. In: Background Papers to the Water Authority of Western Australia’s south-west irrigation district strategy. Department of Agriculture Western Australia, Division of Resource Management Technical Report No. 106.
George, P.R. and Furness, L.J. (1979). Groundwater hydrology in the Harvey Irrigation Area. In: Proceedings of the Australian National Council of Irrigation Development 26th Annual Meeting, Public Works Department, Western Australia.
George, P.R. and Wren, B.A. (1985). Crop tolerance to soil salinity. Western Australian Department of Agriculture, Technote No. 6/85.
George, P.R., Gillespie, D.J. and Green, M. (1982). Tube drainage of irrigated pastures. Department of Agriculture, unpublished research report, File 81HA2 (4090EX).
George, R.J. and Bennett, D.L. (1999). Root-zone electromagnetic systems explain variations in soil salinity and productivity. In: ‘Irrigation 99’, CD of International Irrigation Conference, Perth, April 1999.
George, R.J., Bennett, D.L., Arkell, P.T. and Vukelic, B. (1994). Soil salinity in the south-west irrigation area: Extent and Management options. In: ‘Soils 94’ - Proceedings of the Third Triennial Western Australian Soil Science Conference. pp. 199-205.
Leeds-Harrison, P., Spoor, G. and Godwin, R.J. (1982). Water flow to mole drains. Journal of Agricultural Engineering Research 27: 81-91.
Maas, E.V. and Hoffman, G.J. (1977). Crop salt tolerance-current assessment. Journal of the Irrigation and Drainage Division: Proceedings of the American Society of Civil Engineering 103: 115-134.
Middlemas, J.P. and Green, M.D. (1986 - unpublished). Reconnaissance survey of salinity in the South-western Irrigation Area. Western Australian Department of Agriculture, Bunbury.
Mulqueen, J. (1985). The development of gravel mole drainage. Journal of Agricultural Engineering Research 32: 143-151.
Norman, C.P. and Heslop, K. (1991). Soil salinity survey of the Boort/West of Loddon Salinity Management Plan Area. Victorian Department of Agriculture, Research Report No. 125.
Nulsen, R.A. (1981). Critical depth to saline groundwater in non-irrigated situations. Australian Journal of Soil Research 19: 83-86.
Rivers, M. (1998). Salinity in the Swan Coastal Plain: Part One – Review. Agriculture Western Australia Miscellaneous Publication 21/98.
Schofield, N.J., Ruprecht, J.K. and Loh, I.C. (1988). The impact of agricultural development on the salinity of surface water resources of south-west Western Australia. Surface Water Branch Report No. WS27, Water Authority of Western Australia.
Shaw, R. and Gordon, I. (1997). ‘Salinity management handbook’. Queensland Department of Natural Resources.
Slavich, P.G. and Read, B.J. (1984). Assessment of electromagnetic induction measurements of soil salinity for indication of crop response. In: ‘Root-zone limitations in clay soils’. (ed. E. Humphries). Soil Science Society, Riverina Branch. pp. 33-40.
Spoor, G. and Ford, R.A. (1987). Mechanisms for mole drainage deterioration. Journal of Soil Science 38: 369-382.

7: Waterlogging
-154-
7. WATERLOGGING AND INUNDATION
7.1 INTRODUCTION
7.1.1 What are waterlogging and inundation? Waterlogging is a condition whereby soil becomes saturated to the extent that most or all of the soil’s air is replaced with water. Waterlogging occurs beneath the soil surface and restricts gas exchange between the root zone and the atmosphere. A total or partial saturation of the root-zone is associated with the development of anaerobic (oxygen deficient) conditions and can lead to plant death. Inundation, or surface ponding, describes the situation where water lies above the soil surface. Waterlogging is often confused with inundation because both processes involve and excess of water and they may be present at the same time. However, it is common for some soils to be waterlogged without being inundated. In certain situations, the reverse can happen - soils can become inundated without being waterlogged. In these situations the soil surface seals and water lies on the ground but does not infiltrate. Inundation differs from flooding in that the water lying on the ground surface is stationary. During flooding, the water moves across the ground surface (see Section 8.1.1). Waterlogging and inundation can vary greatly over short distances, often with a complex pattern of saturated and non saturated soils occurring across a paddock. The degree of waterlogging and inundation often changes throughout the year, and may vary markedly from year to year. An area which is waterlogged during a wet winter may be well drained throughout the rest of the year if rainfall is low. Waterlogging can take a number of forms. Sub-surface waterlogging describes the situation where the topsoil is draining freely but the subsoil is saturated. Hillside seeps occur where water is forced to the surface by a barrier such as shallow bedrock on a slope. Discharge on valley floors occur where drainage lines have incised to the level of regional water tables or where water collects at the bottom of the landscape. Perched groundwater occurs where part of a soil profile is saturated because drainage is restricted by an layer of low permeability in or below the subsoil. 7.1.2 What causes waterlogging and inundation? Waterlogging and inundation occur when the amount of water added to a site exceeds its ability to accept or shed that water. Factors which determine this balance are the rate of water input, external drainage, profile drainage and water use. Water input Waterlogging and inundation are almost always directly or indirectly related to rainfall. The extent and degree of waterlogging and inundation are generally greatest in areas receiving a high annual rainfall, increasing in years of higher than average rainfall and decreasing in years of lower than average rainfall. The timing of rainfall is also important. Waterlogging and inundation are most likely in areas where most rain falls at certain times of the year because there is less opportunity for the water to be used or shed before the next shower. The South-west Hydrological Region has a “Mediterranean climate” and so the concentrated rain falling in winter coincides with low evaporation rates. Rainfall intensity can also play an important role. Inundation is most likely when rainfall intensity exceeds the rate at which water can infiltrate the soil. While rainfall contributes directly to waterlogging and inundation at a site, it is often its indirect contribution which is most important. Water often enters as runoff (via overland flows)or seepage (via sub-surface flows) from elsewhere in the catchment. Runoff usually enters a site relatively quickly after a rainfall event, but seepage can take days or weeks. An even less direct pathway in which rainfall causes waterlogging is through rising water tables resulting from recharge elsewhere within a catchment. Decreased water usage due to clearing of native vegetation is a major contribution to recharge. It can take years or decades before the waterlogging becomes evident under this process.

7: Waterlogging
-155-
Excess water at a site can also result from human activity. Artificial drainage systems often result in increased runoff lower down in a catchment. Irrigation is another process whereby water is artificially added to a site and can lead to waterlogging and inundation. Site drainage Landforms play a major role in determining site drainage. Sites with low gradients and those in low lying positions are most likely to be affected by waterlogging and inundation. Gentle slopes reduce runoff and give time for water to infiltrate the soil. Once the water enters the profile, throughflow will be slower where if gradients are low. Where landforms are flat (or almost flat) drainage can be severely retarded and ponding is likely. Sites in low lying positions are likely to receive seepage and runoff from higher up in the catchment. They are also most likely to be affected by rising water tables. Areas towards the bottom of long slopes often receive prolonged inflows of seepage water from upslope. The shape of a slope is also important. Concave slopes concentrate seepage waters and can result in waterlogging where the slope gradient decreases abruptly (Cox and McFarlane, 1990). In low lying areas, the surrounding topography usually acts as a barrier and prevents water from leaving the site or retards its departure. Other barriers retarding drainage can include rock outcrops and artificial structures such as roads and earthworks. Profile drainage Profile drainage, or soil permeability, refers to properties of the soil profile that affect the rate of water movement through the profile. Fine-textured soils, such as heavy clays, usually have a low permeability and restricted drainage while coarse-textured soils, such as sands, tend to drain rapidly. Duplex soils typically have a highly permeable sandy or loamy topsoil overlying a clay subsoil with low permeability. Infiltration into the topsoil is therefore rapid, but it becomes saturated as the water perches on top of the clayey subsoil. Soil structure can also play an important role with water moving most rapidly through well structured and porous soils. Some soils have other characteristics that restrict permeability. In sodic soils the clay particles disperse when wet and clog up soil pores, restricting the movement of water. This can lead to surface sealing and ponding of water on the surface, or perched groundwater in the topsoil. In cracking clays the topsoil can swell and seal when wet preventing infiltration and leading to ponding. Other features that can act as a barrier to water movement in the soil profile include hardpans and bedrock. Hillside seeps are often found where bedrock rises close to the surface on a slope. The rock acts as an impermeable barrier, damming the groundwater and causing it to rise to the surface. The soil’s storage capacity, or the amount of water it can hold, can also determine whether a soil becomes waterlogged. Sands have more pore space than clays, so more water is required to saturate the soil. However, this is usually a minor factor when considering the amounts of water involved. Clays may be better at trapping air pockets when saturated than sands, delaying the effects of waterlogging on plants. Reduced water usage Plants using soil water can limit the extent and degree of waterlogging. The removal of native vegetation which uses considerable amounts of water, and its replacement by shallow-rooted crops and pastures, can have a major effect on the water balance and can lead to an increase in waterlogging and inundation. The amount of water used by plants during periods of high rainfall has little impact on the volume water of water stored in the soil, but water used during dry periods reduces the water store. This means that the capacity of the profile to take up water during the next wet period is greatly enhanced. Removing vegetation has a major impact on groundwater recharge and rising water tables leading to waterlogging.

7: Waterlogging
-156-
7.2 WATERLOGGING IN THE SOUTH-WEST HYDROLOGICAL REGION
7.2.1 What is the extent of waterlogging and inundation? Waterlogging is common throughout the South-west Hydrological Region, especially in the Coastal Plains, Forested Hills and both Woolbelts where average annual rainfall is above 400-450 mm. Waterlogging is most common in the winter and early spring when rainfall is high and evaporation is low. Many soils are only affected by subsoil waterlogging which is not readily visible and so the true extent of waterlogging is often underestimated. Inundation is often associated with severe waterlogging. Waterlogging is a significant problem on the Coastal Plains. The authors have estimated that approximately 40% of the Swan Coastal Plain and 85% of the Scott River Plain are affected by waterlogging and inundation. The flatness of these Plains combined with the relatively high rainfall are major factors contributing to the problem. Much of this waterlogging is natural and predates European settlement, but clearing of native vegetation has no doubt contributed to the problem. An extensive network of drains has been constructed on the Swan Coastal Plain to combat waterlogging problems. Almost 20% of the Forested Hills is estimated as being affected by waterlogging each year, with a further 20% probably being affected in wet years. Although this region receives the highest rainfall in the South-west Hydrological Region, clearing has taken place predominantly on well drained slopes, reducing the likelihood of waterlogging. Extensive areas of plateau (where drainage is more restricted) remain under forest. The most extensive areas of waterlogging are found where these plateau areas have been cleared in the Yornup, Wilga, Cowaramup and Witchcliffe districts. Waterlogging is also found in some valley floors and small, isolated hillside seeps are common. Almost 25% of the Western Woolbelt is estimated as being affected by waterlogging, with a further 25% probably being affected in wet years. Here, waterlogging is prominent on flats on the plateau remnants, on footslopes and in valley floors. Hillside seeps are more common than in the Forested Hills. Approximately 60% of the Eastern Woolbelt has been estimated as being affected by waterlogging. Waterlogging is found on broad valley floors as well as on gentle slopes with duplex soils. In the eastern Murray River Catchment about two-thirds of these duplex soils were found to have perched groundwater within 30 cm of the soil surface during two years of average rainfall (McFarlane and Wheaton, 1990). These data suggest that waterlogging in these areas is often greatly underestimated. In the Wheatbelt waterlogging is most common on the broad valley floors where it is usually associated with salinity. In years with heavy rains, waterlogging can be more widespread. McFarlane and Wheaton (1990) estimated that, in the Upper Great Southern during August, wheat yields decline by about 150 kg/ha for every 10 mm of rain received above the monthly average. Waterlogging plays a major role in this decline. In crops on moderately to severely waterlogged sites in the Yornaning Catchment, they estimated average grain yield losses of 83%. 7.2.2 What are the problems associated with waterlogging and inundation? Waterlogging and inundation can have major effects on crops, pastures and other plants because they deprive the roots of oxygen. As a result growth is severely restricted and death can occur. Waterlogging is especially a problem when combined with salinity. The combination of waterlogging and salinity is highly damaging to plants (see Section 5.2.2). Unless salt levels are very high, most plants can keep salt out of their roots in well drained soils. However, waterlogging reduces the plant’s ability to exclude salt and as a result salt enters the roots and the plants die. Waterlogging is a major limitation to productivity in the South-west Hydrological Region. For example in 1988, cereal losses in four Shires were estimated at $23 million. Losses of pasture production are also very high and waterlogging is a major limitation to horticultural expansion in some districts. Other effects of waterlogging and inundation include soil structure decline, an increase in the risk of soil erosion and a loss of trafficability.

7: Waterlogging
-157-
The effect on plant growth In most species, parts of the plant that are covered by water are prevented from exchanging gases with the atmosphere. A loss of oxygen is the major cause of limited plant growth in waterlogged soils. Without oxygen the roots are unable to respire and produce the energy required for growth. Other gases, such as carbon dioxide, hydrogen sulphide and ethylene, may accumulate around the roots and become toxic to the plants. Increased toxin levels may also result from the activity of anaerobic bacteria which proliferate in the oxygen poor conditions. Germinating seeds and young seedlings are most affected by waterlogging and inundation because plants are most susceptible when they are undergoing rapid growth. When plants are growing actively, root tips begin to be killed after only a few days of waterlogging. In this way waterlogging creates an effective barrier to plant roots and leads to the development of shallow root systems which are limited in their ability to take up nutrients (particularly nitrogen) and water. The most common symptom of waterlogging, the premature yellowing of old leaves, is the result of nitrogen deficiency caused by leaching and de-gassing. The shallow-rooted plants often suffer moisture stress as the soil dries out in late spring and early summer. In addition, waterlogging increase the stress on plants and render them more susceptible to pests and diseases. Undesirable weeds may also gain a competitive advantage under these conditions. Waterlogging promotes the growth of weed species such as toad rush (Juncus bufonius.), dock (Rumex spp.), button weed (Cotula spp.), penny royal (Mentha pulegium) and barley grass (Hordeum spp.) which compete with productive crops and pastures. Inundation has similar effects to waterlogging but the leaves and shoots that are submerged are also prevented from exchanging gases with the atmosphere. Short plants, such as young crops or heavily grazed pastures, may be completely submerged and usually die. Tolerance of plants to waterlogging The depth of waterlogging is a crucial factor in determining the effect of subsoil saturation on plants. Where free water is located more than 50 cm below the ground surface the effect on most crops and pastures will be minimal. However, water tables within the top 50 cm of the soil profile can cause major problems for deep-rooted plants such as fruit trees. In broadacre crops, significant damage is common if the water is within 30 cm of the soil surface and the crop is growing rapidly. For most pastures, 20 cm is the crucial depth. The duration of waterlogging is also an important factor, as is the season in which it occurs. Evergreen crops such as citrus and avocados tend to have little tolerance to waterlogging at any time of the year. Deciduous crops such as grape vines will be more tolerant of waterlogging in mid-winter when they are dormant than in the spring when a new burst of growth commences. Waterlogging and inundation in the coldest months may do little damage to some dormant perennial pastures such as kikuyu but can have significant effects on seed set, persistence and production of annual pasture such as subterranean clover. In some soils, restricted growth in mid-winter due to waterlogging is compensated for by moist conditions in spring and early summer with pastures performing well and lasting longer than on surrounding, well drained soils. Most horticultural crops are highly susceptible to waterlogging. This is especially the case with root crops such as potatoes which can rot if grown on poorly drained land. Orchards suffer large yield reductions and tree death if water tables are within 0.5 m of the soil surface in spring or when the sap begins to flow after winter dormancy. Pears are the most tolerant of waterlogging, while apples and stone fruit are highly susceptible. Increased degradation risks Waterlogging and inundation lead to increased risks of other forms of land degradation. They result in reduced water use because they limit plant growth. This lead to further to waterlogging and can also contribute to salinity problems by increasing groundwater recharge, thereby raising water tables. Restricted plant growth also results in less ground being covered by vegetation, making the soil more vulnerable to water erosion. The soils also have a higher erodibility when saturated. Waterlogging further contributes to water erosion by increasing the amount of runoff generated. This can also contribute to flooding. When the soil dries out, wind erosion can occur on waterlogged soils that have poor ground cover.
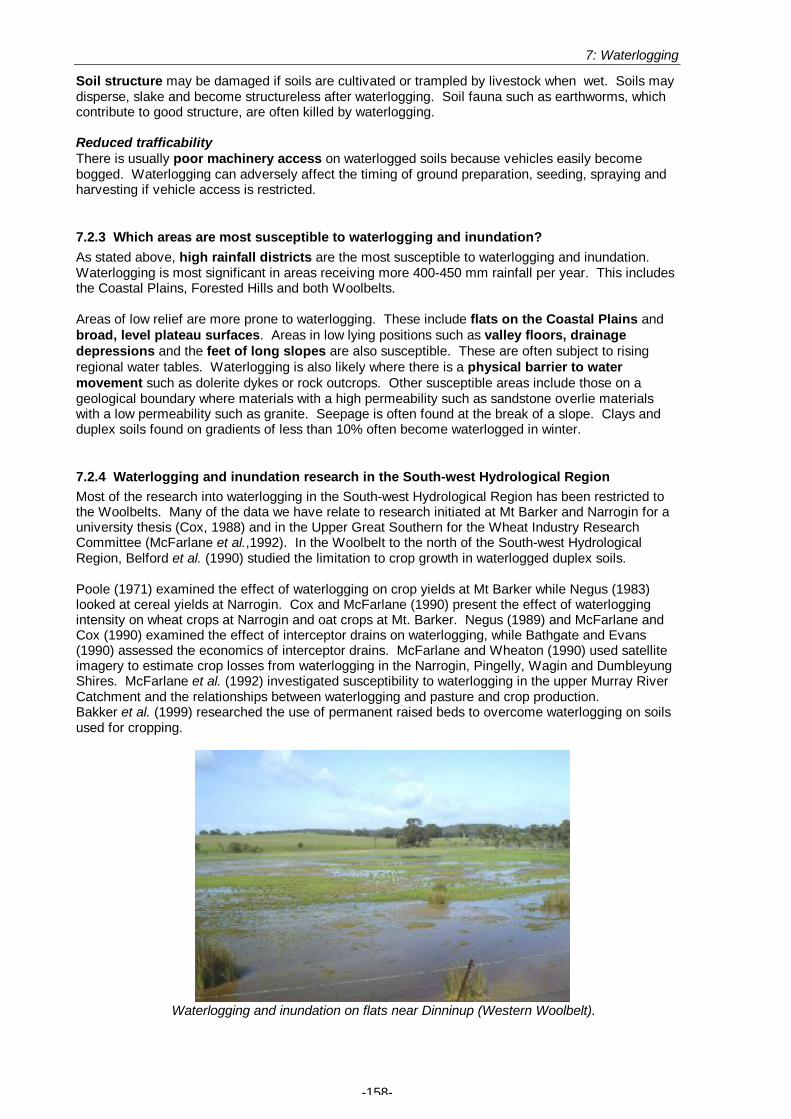
7: Waterlogging
-158-
Soil structure may be damaged if soils are cultivated or trampled by livestock when wet. Soils may disperse, slake and become structureless after waterlogging. Soil fauna such as earthworms, which contribute to good structure, are often killed by waterlogging. Reduced trafficability There is usually poor machinery access on waterlogged soils because vehicles easily become bogged. Waterlogging can adversely affect the timing of ground preparation, seeding, spraying and harvesting if vehicle access is restricted. 7.2.3 Which areas are most susceptible to waterlogging and inundation? As stated above, high rainfall districts are the most susceptible to waterlogging and inundation. Waterlogging is most significant in areas receiving more 400-450 mm rainfall per year. This includes the Coastal Plains, Forested Hills and both Woolbelts. Areas of low relief are more prone to waterlogging. These include flats on the Coastal Plains and broad, level plateau surfaces. Areas in low lying positions such as valley floors, drainage depressions and the feet of long slopes are also susceptible. These are often subject to rising regional water tables. Waterlogging is also likely where there is a physical barrier to water movement such as dolerite dykes or rock outcrops. Other susceptible areas include those on a geological boundary where materials with a high permeability such as sandstone overlie materials with a low permeability such as granite. Seepage is often found at the break of a slope. Clays and duplex soils found on gradients of less than 10% often become waterlogged in winter. 7.2.4 Waterlogging and inundation research in the South-west Hydrological Region Most of the research into waterlogging in the South-west Hydrological Region has been restricted to the Woolbelts. Many of the data we have relate to research initiated at Mt Barker and Narrogin for a university thesis (Cox, 1988) and in the Upper Great Southern for the Wheat Industry Research Committee (McFarlane et al.,1992). In the Woolbelt to the north of the South-west Hydrological Region, Belford et al. (1990) studied the limitation to crop growth in waterlogged duplex soils. Poole (1971) examined the effect of waterlogging on crop yields at Mt Barker while Negus (1983) looked at cereal yields at Narrogin. Cox and McFarlane (1990) present the effect of waterlogging intensity on wheat crops at Narrogin and oat crops at Mt. Barker. Negus (1989) and McFarlane and Cox (1990) examined the effect of interceptor drains on waterlogging, while Bathgate and Evans (1990) assessed the economics of interceptor drains. McFarlane and Wheaton (1990) used satellite imagery to estimate crop losses from waterlogging in the Narrogin, Pingelly, Wagin and Dumbleyung Shires. McFarlane et al. (1992) investigated susceptibility to waterlogging in the upper Murray River Catchment and the relationships between waterlogging and pasture and crop production. Bakker et al. (1999) researched the use of permanent raised beds to overcome waterlogging on soils used for cropping.
Waterlogging and inundation on flats near Dinninup (Western Woolbelt).

7: Waterlogging
-159-
7.3 MANAGING WATERLOGGING AND INUNDATION
There are a variety of approaches which can be used to tackle waterlogging and inundation problems. These include adopting waterlogging tolerant crops and pastures, constructing drainage and trying to increase water usage. The adoption of lower recharge farming systems can make a significant contribution to tackling the causes of waterlogging and inundation. By incorporating trees, fodder shrubs, perennial grasses and higher water use crops into the farming system it is possible to increase water use across a property. By using as much water as possible where it falls, the landholder reduces the amount that flows or seeps to waterlogged areas. Lower recharge farming is especially effective in combating waterlogging that results from rising groundwater levels. However, lower recharge systems will only reduce waterlogging problems, they are unlikely to remove them completely. This is because in mid-winter there is more rainfall than the plant’s need and so there is still an excess water. Other tactics therefore need to be incorporated. These can include constructing drainage systems to remove excess water and using waterlogging tolerant pastures and crops on affected areas. The variability of waterlogging both across a paddock and from season to season creates uncertainty. It can be difficult to decide which areas of a paddock should be cropped in a particular year, so farm planning is important when tackling waterlogging problems. With a farm layout and fencing that reduce variation in drainage characteristics across a paddock, it is much easier to develop and implement suitable management options. Planning enables the landholder to incorporate drains and banks with minimal disruption to other farming activities. It will also allow for developing strategies for controlling surface water. It is important to involve neighbouring properties in developing a catchment plan to manage the disposal of excess water. 7.3.1 How can waterlogging and inundation be identified? Inundation is easily identified by the presence of ponded water, but it is often difficult to recognise that a site is waterlogged unless the soil surface is saturated. Waterlogging often occurs below the ground surface and may be best identified by observing the performance of crops and pastures. In areas where the remnants of native vegetation occur, the onset of dieback in jarrah, banksias and dryandras is often an indication of waterlogging. Surface signs of waterlogging In the South-west Hydrological Region, soils that are inundated for considerable periods can usually be assumed to be waterlogged as well. Temporary ponding not linked to waterlogging does also occur occasionally after heavy rain, but the appearance of water on the surface for extended periods is a good indicator of soil saturation. Even without ponding, the severely waterlogged soils will usually have a wet and slushy surface when walked or driven on. In some cases water, can be clearly seen seeping from a waterlogged area. Sometimes waterlogging is only be identified after attempting to drive across a paddock with the vehicle’s wheels sinking into what appeared to be a firm, dry surface. By the time signs of waterlogging are obvious on the surface, it is likely that considerable damage has already been done to the roots of crops and pastures and that yields have been affected severely (McFarlane, 1990). Plant responses to waterlogging With subsoil waterlogging the first indications of a problem are usually plant responses. Reduced growth rates can sometimes be seen in crops and pastures. This is particularly evident where only part of a paddock is affected and poor performance on waterlogged areas can be compared directly with good growth on well drained areas. Uneven germination and survival are often observed on waterlogged sites. In pastures, subterranean clover is more sensitive to waterlogging than most grasses, so a waterlogged sites usually have less clover. Wilting, downward curvature of leaves, leaf droop and chlorosis (the yellowing or reddening of older leaves) are other indicators of plant stress due to waterlogging. It should be remembered that some of these symptoms may indicate nutrient deficiencies rather than waterlogging.

7: Waterlogging
-160-
Weeds that tolerate poor drainage conditions, such as dock (Rumex spp.), toad rush (Juncus bufonius), button weed (Cotula spp.) and barley grass (Hordeum spp.), are often found in waterlogged crops and pastures. In cropped paddocks, areas of suspected waterlogging can be marked out with pegs so that yields can be compared with those from other parts of the paddock at harvest time. Water table monitoring and soil indicators One of the best ways to investigate the possibility of waterlogging is to dig a shallow hole or well. This can be done with a spade, hand auger, fence post digger or excavator. The hole should be dug down into the bottom of the root zone, so its depth will depend on what is growing in the paddock. For pastures, 50 cm will suffice but 100 cm would be preferable. If the site is currently waterlogged, water will seep or flow in from the sides of the hole and fill it up to the level of the water table. In sandy soils the flow is likely to be quite rapid, while in clayey soils it may be quite slow. In clayey soils it may be advisable to leave the hole open for several hours to see what level the water rises to. If a soil pit is dug it is often possible to observe whether or not the water table is perched, as the clay subsoil will be dry. If the water has a pungent smell (like sulphur or rotten egg gas) it is likely that there are anaerobic conditions associated with the waterlogging. By inserting a piece of slotted poly-pipe (PVC storm water pipe) in the hole and then backfilling the hole outside the pipe, water table levels can be monitored throughout the season. Even if the holes are dug in summer when there is no waterlogging present, there are soil characteristics that can indicate whether waterlogging is likely during winter. A bluish or greenish grey soil colour usually signifies poor drainage, as does the presence or yellow, red, orange brown or grey mottles. In duplex soils a pale colour in the lower topsoils is an indication that water perches above the subsoil. 7.3.2 What changes can be made to agricultural practices? Lower recharge farming systems Using water on well drained sites is just as important as using it on poorly drained sites when combating waterlogging and inundation. This can be achieved by incorporating trees, fodder shrubs, perennial grass and higher water use crops into the farming system. The adoption of lower recharge farming systems is discussed in Section 5.3.2. Cropping poorly drained areas Areas susceptible to waterlogging should only be cropped if there is a good chance of getting a reasonable yield. This is not only because it is a waste of time, money and resources sowing a crop that will produce low returns, but also because a poorly performing crop will use very little water and exacerbate waterlogging problems. Variety selection: Few crops will grow in severely waterlogged conditions, but some crops perform reasonably under mild waterlogging conditions. In general, cereals and faba beans are less susceptible to waterlogging than grain legumes and canola (Table 7.1). High tillering varieties of barley, such as Franklin, are more susceptible than low tillering varieties, such as Onslow (which has a similar susceptibility to wheat). Of the lupins, Lupinus angustifolius is the most susceptible while white lupins (Lupinus albus) are the most tolerant (Table 7.2). Table 7.1: Susceptibility of major crops to waterlogging.
Most tolerant Faba beans Oats Barley Wheat
↓ Canola Lupins Peas Chickpeas
Least tolerant Lentils

7: Waterlogging
-161-
Table 7.2: Susceptibility of lupin species to waterlogging Most tolerant Lupinus albus
Lupinus pilosus ↓ Lupinus atlantica
Least tolerant Lupinus angustifolius Seeding time and fertiliser requirements: Sowing long-season varieties early increases the chance that the crop is at an advanced stage before the onset of waterlogging. Those paddocks most susceptible to waterlogging should be planted first. Seeding rates should be increased in waterlogging-susceptible areas to reduce the amount of tillering and to reduce the number of weeds that take advantage of stressed crops. The crop will handle poorly drained conditions better if it has a high nitrogen status before the onset of waterlogging. Late applications of nitrogen can be an advantage if nitrogen has been lost by degassing and leaching. However it is often not possible, or environmentally appropriate, to apply any nitrogen when the soils are waterlogged. Note that ammonium is less likely to leach than nitrate, so ammonium forms of nitrogen (e.g. Agras, DAP) are preferable to nitrate forms (e.g. Agran). Ammonium forms may increase soil acidity. Weed and disease control: The ability of crops to recover after waterlogging is greatly affected by the number of weeds in the crop. Weeds compete for the reduced amount of nitrogen available and can also shade the crop if they get large. Weedy areas should be sprayed with a post-emergent herbicide if the paddock is dry enough to allow access. If ground-based boomsprays cannot be used, aerial spraying should be considered. Another option is to reduce the number of weed seeds in the soil by pasture topping the year before cropping. Root and leaf diseases are often more severe in waterlogged areas because the crop is already under stress and the humid conditions favour the growth of pathogens. Spraying may be an option after the site has dried. However, it is probably better to drain away as much of the excess water as possible, reduce weed competition and correct any nutrient deficiencies. Pastures on poorly drained areas With the exception of areas only affected by mild waterlogging, pastures are usually a more suitable option than crops in areas of poor drainage. Perennial pastures generally handle waterlogging and inundation better than annual pastures. For annual pastures the onset of waterlogging often coincides with germination and seedling growth which are when the plants are most susceptible. Perennial pastures are able to take full advantage of the summer moisture which is often available in winter waterlogged soils. Suitable species include the grasses kikuyu (Pennisetum clandestinum), phalaris (Phalaris aquatica), tall fescue (Festuca arundinacea), Paspalum (Paspalum dilatatum), salt-water couch (Paspalum vaginatum) and tall wheatgrass (Thinopyrum elongatum). Legumes with potential for waterlogged areas include the perennials white clover (Trifolium repens), strawberry clover (Trifolium fragiferum), and the annual lotus (Lotus spp.), balansa clover (Trifolium michelianum), Persian clover (Trifolium resupinatum) and yanninnicum cultivars of subterranean clover (Trifolium subterraneum) such as Yarloop. The susceptibility of pastures to waterlogging in non-saline conditions is shown in Table 7.3. The susceptibility of pastures to salinity in waterlogged areas is shown in Table 7.4. Table 7.3: Susceptibility of pastures to waterlogging in non-saline conditions. Pasture Highly tolerant Moderately tolerant Susceptible Grasses Kikuyu, phalaris, fescues,
Paspalum Perennial ryegrass cocksfoot, veldt grass
Legumes Lotus, white clover, Persian clovers, balansa clovers, yanninnicums
subterranean clovers, medics
lucerne

7: Waterlogging
-162-
Table 7.4: Susceptibility to salinity of pasture plants suited to waterlogged areas. Pasture Highly tolerant Moderately tolerant Grasses Salt-water couch, Puccinellia,
tall wheatgrass Paspalum, phalaris, fescue, kikuyu
Legumes strawberry clover balansa clovers Grazing management and weed control: Heavy grazing pressure increases the susceptibility of pastures to inundation because the shorter the pasture is, the less water it takes to completely submerge it. Even short periods of inundation can kill some pasture species. The risk is greatest with sheep because they graze pastures very close to the ground. Care needs to be exercised when grazing waterlogged soils because trampling by livestock can lead to soil structure decline and pugging. This can further restrict water infiltration and increase inundation problems. Cattle usually do more damage than sheep on wet soils. Having pastures that are still green in late spring and early summer can result in a greater incidence of worms and footrot in sheep. Rotational grazing with cattle can help overcome these problems. Fencing off wet areas enables them to be spelled in winter, when close grazing and pugging can be a problem. These areas can be grazed heavily in late spring and summer when other pastures have hayed off. Fertiliser requirements: Strategic applications of nitrogen in late-break seasons can stimulate grass response and provide early feed. The pasture will be less stressed if it has a high nitrogen status before it gets waterlogged. This also increases the likelihood that the pastures will enter a period of waterlogging with sufficient dry matter and nitrogen to continue growing. Late applications of nitrogen can be an advantage if nitrogen has been lost by degassing and leaching. However, it is often not possible to apply any nitrogen when the soils are waterlogged. As ammonium is less likely to leach than nitrate, ammonium forms of nitrogen (e.g. Agras, DAP) are preferable to nitrate forms (e.g. Agran which contains both nitrate and ammonium and urea). The application of ammonium forms of nitrogen may contribute to acidity problems. Sulphur is also leached from waterlogged pastures that have shallow roots. Sulphur can be replaced by adding superphosphate but this is an expensive option if phosphate levels are already adequate and is likely to contribute to eutrophication. Gypsum may be added in spring to provide sulphur for the period of maximum growth. It may be necessary to add potassium to sandy soils to increase the seed set of legumes. Weed and disease control: The ability of pastures to recover after waterlogging is greatly affected by the number of weeds such as dock and toad rush with which they have to compete for the reduced amount of nitrogen available. Weed seed banks can be reduced by selective spraying before seed set and by managing grazing pressures to encourage the seeds of desirable species to set. Further weed kills in autumn may be necessary. Root and leaf diseases are often more severe in waterlogged areas because the pasture is already under stress and the humid conditions favour the growth of pathogens. Spraying after the site has dried out may be an option (e.g. for clover scorch where the pasture will be used for hay). However, it is probably better to drain away as much of the excess water as possible, reduce weed competition and correct any nutrient deficiencies. Soil management Waterlogging and inundation may be the result of poor infiltration properties due to soil structure decline. The risks of soil structure decline can be reduced by minimising tillage and stock trampling, especially when the soil is wet. In some sodic soils, where surface sealing and inundation are problems, soil structure and infiltration may be improved by applying gypsum.

7: Waterlogging
-163-
7.3.3 Engineering options The construction of artificial drainage will be necessary to overcome waterlogging and inundation in many areas. In some cases, land which only supported poor pasture cover can become productive cropping country as a result of artificial drainage. In cereal cropping areas the drains may pay for themselves within a few years of installation. Excess water should only be drained from land after making a careful assessment of the effect on properties downstream. Where possible, water should be diverted to storages and used during summer. The Commissioner of Soils and Land Conservation must be notified at least 90 days before a new drainage or pumping scheme is set up if the scheme will discharge saline water onto other land, into water or in a water course. Further information is available at Agriculture Western Australia. Shallow surface drains Shallow surface drains (Figure 7.2) can be used on poorly drained flats with heavier soils such as clays and shallow duplexes. They should be constructed with gradients of up to 0.2% (2:1,000). The drains connect low lying areas and provide a path for the movement of surface water. Removing surface water not only reduces inundation, it also prevents the water from infiltrating and contributing to waterlogging. Shallow surface drains can also be used to intercept runoff entering flats from upslope. Spoon drains are 3-4 metres wide and approximately 30 cm deep and can be constructed with a grader. The spoil is spread on either side of the channel. They are suitable for land which is cropped. In W-drains the spoil is mounded in between two channels so that there is nothing impeding water flow from the surrounding flats. These are approximately 3 m wide and 30 cm deep and can be built with a grader or bulldozer. Spinner drains can be used to efficiently move water from the paddock into spoon drains or W-drains. They consist of small rills which are 5-10 cm deep constructed with the rotating steel blades of a spinner-ditcher and can be installed cheaply.
Figure 7.2: Cross-sections of shallow surface drains (from McFarlane et al. 1990b) Bedding and mounding In areas with poor surface drainage it is possible to create a slope towards drain channels using "beds" or "lands" formed from soil taken out of the channels. The channels are aligned in the direction of maximum fall and the beds are made by a grader, disk plough or mouldboard plough removing soil from the channel and placing it in a raised bed between the channels. Early results from Bakker et al. (1999) show increased crop yields on raised beds installed at five sites in the South-west Hydrological Region.

7: Waterlogging
-164-
Larger cropping machines and more intensive practices, such as increased hay and silage cutting, have reduced opportunities for this type of drainage. In the irrigated areas, Bachs ridges and furrow systems have been trialled to reduce the effects of winter waterlogging and salinity (see Section 6.3.3) Mounding, combined with surface drainage, can be effective in overcoming waterlogging problems where tree crops are being established, especially in duplex soils. By creating a 10-30 cm mound of topsoil, the effective depth of highly permeable soil can be increased while raising the surface roots above the zone of waterlogging. Grade banks Grade banks are built across a slope to collect and direct runoff water. They consist of a bank (25-50 cm high with a base width of 2.5-3 m) and an uphill channel (15-30 cm deep and 2.5-3.5 m wide). The bank should have a gradual fall with gradients of 0.2-0.5% (2:1,000-5:1,000). Banks can be built with a grader, plough or bulldozer at a downslope spacing of 50-250 m. Grade banks can be installed on slopes that generate runoff contributing to waterlogging problems downslope. The intercepted runoff can then be diverted away from the waterlogged areas or stored in dams for use later in the season. It is essential that the banks discharge runoff into a stable waterway. Seepage interceptor drains Seepage interceptor drains (Figure 7.1) are sub-surface drains suited to duplex soils and can be built with a grader or a bulldozer. A channel is dug through the topsoil into the clayey subsoil. This channel collects water seeping through the highly permeable topsoil. Seepage interceptor drains can be used to both drain waterlogged slopes and to intercept water moving towards waterlogged areas. The drains are suitable for slopes where the gradient exceeds 1.5% and should be placed immediately above affected sites. The bottom on the drain should be cut at least 20-30 cm into the clayey subsoil. It is important to have a safe outlet, such as a grassed waterway, for drain discharge. About three-quarters of waterlogged soils in both the Woolbelts are on slopes which can be drained by seepage interceptor drains. In conventional seepage interceptor drains, the spoil (the earth removed from the channel) is mounded on the downslope side of the channel where both runoff and seepage are collected. This can lead to silting of the channel. The channel is usually 75 cm deep and about 3 m wide while the bank is up to 100 cm high with a base width of about 3 m. These drains can be built safely on gradients of up to 0.5% (5:1,000). In reverse seepage interceptor drains (Figure 7.1) the spoil is placed upslope and acts as a grade bank intercepting runoff, while seepage enters the channel. This reduces the risk of the channel silting and decreases the volume and depth of channel flows. A grassed strip upslope from the bank carries the runoff. The channel downslope from the bank is usually 50 cm deep and about 3 m wide while the bank 50 cm high with a base width of about 3 m. These drains can be built safely on gradients of up to 2% (2:100). WISALTS level interceptor banks WISALTS (Whittington Salt Affected Land Treatment Society) level interceptor banks (Figure 7.1) differ from seepage interceptor drains in that they are built on the contour, or on a very low gradient (0.03%) and the channel is dug deeper into the clayey subsoil. A bulldozer is used for construction and the spoil is formed into a high bank downslope and lined with clay on the channel side. In WISALTS banks both runoff and seepage flow into the channel where they are stored. WISALTS banks will reduce waterlogging immediately downslope but can contribute to groundwater recharge and waterlogging and salinity problems lower in the catchment (McFarlane et al., 1990a). Water can be discharged by constructing the banks on a slight gradient, or using pipes through the bank to allow a slow release of water. In many areas WISALTS banks have been constructed in inappropriate locations. Like other level banks, WISALTS banks are only really suitable where there is no safe place in a paddock to discharge water.

7: Waterlogging
-165-
Figure 7.1: Cross-sections of seepage interceptor drains and a WISALTS interceptor bank (from
McFarlane and Cox 1990) Levee banks Levee banks can be situated outside flow lines to confine surface water flows that are contributing to waterlogging and inundation. Double leveed waterways can be constructed to divert or dispose of flows entering waterlogged areas and with careful planning can be constructed on land sloping up to gradients of 10%. Flow volumes and rates need to be carefully considered before installing levee banks (see Section 8.3.3).
7: Waterlogging
-166-
Groundwater management Deep open drains used for groundwater management are constructed with a bulldozer or excavator. They are more than 60 cm deep and are typically 1.2-2.5 m deep. They should be constructed with gradients of up to 0.2% (2:1,000). In leveed deep open drains (also called “closed” deep drains), the spoil is formed into levee banks on either side of the drain to exclude surface flows. Deep open drains are relatively expensive to construct, remove areas of land from production and their effectiveness is highly variable. Careful site assessment and drain design is required to ensure their effectiveness. Soil permeability is a very important factor in determining drain effectiveness, and a survey of hydraulic conductivity of the site is advisable before installing deep drains Deep open drains are most effective in highly permeable soils, such as deep sands, where they can affect water table levels as far as 80 m away (Coles et al., 1999). However, even in these conditions they may not be cost effective (Ferdowsian et al., 1997). George (1991) showed that saline areas in sandplain seeps (saturated hydraulic conductivity of >0.2 m/day) could also be reclaimed successfully using drains, but their use was short lived as the drains slumped and collapsed unless well designed and lined with a slotted pipe. In materials with low permeability, such as the heavy clay subsoils often found on valley floors, the drains tend to have a significant effect on a narrow strip of land only. Speed and Simons (1992) found negligible impact on water tables more than 10 m away from the drains in such conditions. Deep drains can be effective if they cut through a shallow clay and expose the underlying saprock. Slope and hydraulic gradient are also important considerations when installing deep open drains. On the broad flats of the Wheatbelt, where hydraulic gradients are typically low, a drain may need to be over 2 km in length if it is to have sufficient fall to enable outflow of groundwater occurring at a depth of 2 m (Coles et al., 1999). Current indications are that deep open drains tend to be more effective in controlling waterlogging and salinity when installed at the break of slope, over structures such as dykes or on sloping areas. Deep drains situated at the break of slope may be successful because there are often stronger upward groundwater flows in these locations (Coles et al., 1999). The relatively small discharge in such areas and interactions with geological features such as dykes may be other factors. Other reasons for the failure of deep drainage can include: poor design leading to erosion and/or sedimentation, the inability of the drain to handle peak flows during floods, batter collapse due to unstable soils or high groundwater flows and iron oxide precipitation causing poor blockage on drain walls. For these reasons, deep open drains should be designed by a professional engineer, soil conservationist or professional contractor with previous experience. The risk of the drain contributing to soil erosion or flooding requires special consideration. In areas of intensive land use, such as horticultural crops and irrigated pastures, sub-surface drainage is often required to manage waterlogging. Shallow collector drains (less than 1 m deep), mole channels and “tube” drains can be used (see Section 6.3.3 for more details) Sub-surface “tube” drains are usually constructed in areas with gradients up to 10% (1:100). They are dug by small excavators and installed with agricultural drainage pipe and then back-filled with a highly permeable filter (sand or crushed rock). They may be more expensive to install than open drains, but take virtually no land out of production and can be used where there is a risk of banks collapsing in unstable soils or flooding. There is a risk of fine soil particles or iron precipitates blocking the slots in pipes. In orchards on sloping land, sub-surface drainage can be used in combination with surface cut-off or “interceptor drains”. Here drains typically have a herringbone design, are installed on a 30 m spacing and have a maximum depth of about 1 m. In flat areas and flood irrigated pastures, sub-surface drainage can be complemented with W-drains and spoon drains. Drainage waters from orchards may be high in nitrogen and so waters should be carried to storage dams for re-use and/or denitrification. Careful application of nitrogen is required to prevent high losses and acidification of subsoils. Fertigation is often practiced to ensure minimum leakage and leaching to groundwaters.

7: Waterlogging
-167-
Pumping is an expensive method of removing water but it can be effective in some cases, for example, where the water table is too deep to be reached by drains or on land used for high value horticulture. Although expensive to install and operate, pumping systems are less intrusive than open drains. In some cases, pumping is the only option for removing excess water. The effectiveness of a pumping system will rely on a number of factors and it is essential to have a good understanding of the hydrogeology of an area before installing pumps. A successful pumping system requires the aquifer to have high permeability. Groundwater pumping systems have also been established on many orchards. However these systems may have the dual ability to supply additional water and reduce winter and spring water tables. Drilling and equipping bores may have a similar cost to establishing tube-drainage systems on large areas. See Section 5.3.3 for more information on pumping. At present there is a legal requirement to notify the land Conservation Officer at the local office of Agriculture Western Australia if water is to be discharged from the property. Any drain more than 1.5 m deep is also notifiable under the Soil Conservation Act.

7: Waterlogging
-168-
7.4 SOURCES OF FURTHER INFORMATION
7.4.1 Useful publications See Appendix 1 for contact details of the publishing organisations. Available from Agriculture Western Australia: The Journal of Agriculture Western Australia (Ayling, 1990) devoted an entire issue to waterlogging topics. Articles cover the extent of waterlogging, the effects of waterlogging on crops and pastures, the causes of waterlogging, seepage interceptor drains, shallow drains and level banks. The Journal of Agriculture Western Australia (Ayling, 1985) also devoted an entire issue to drainage topics. Articles cover drainage and the law, assessing waterlogged sites, drainage to control waterlogging, interceptor drains, drainage in irrigation areas and sub-surface drainage. Soilguide. A handbook for understanding and managing agricultural soils contains a chapter titled Waterlogging (Moore and McFarlane, 1998) which provides a good summary of the principles of waterlogging, methods for assessing and predicting waterlogging and it discusses management options. Effects of waterlogging on crop and pasture production in the Upper Great Southern, Western Australia (McFarlane et al., 1992) discusses the extent, effects and costs of waterlogging in the north-east of the South-west Hydrological Region. It also investigates using remote sensing to assess waterlogging. Guidelines for those considering drainage for waterlogging and salinity management (Anon., 2000) is a seven page pamphlet covering the different types of drainage options and the process of planning a drainage system. DRAINS: a method of financially assessing drains used to mitigate waterlogging in south-western Australia (Salerian and McFarlane, 1987) details a method and computer package for determining the long-term cost-effectiveness of installing seepage interceptor drains and surface drains to mitigate waterlogging. Common conservation works used in Western Australia (Keen, 1998) provides notes on design, construction and variables leading to risk of degradation or failure for a variety of conservation works including banks, drains and pumping. Soil conservation earthworks design manual (Bligh, 1989) has sections covering level and absorption banks, seepage interceptor drains and water spreading structures. NOTE: this Earthworks Design Manual is listed as being for use by staff of Agriculture Western Australia only. A revised version of this manual should be available in 2001.

7: Waterlogging
-169-
Relevant Agriculture Western Australia Farmnotes include: General information
15/86 An introduction to conservation farm planning 21/91 Landcare at low or no cost 97/91 Taxation and the control of land degradation 73/93 Waterlogging and inundation: why they could be costing you money 79/93 Managing waterlogging and inundation in pastures 80/93 Managing waterlogging and inundation in crops
Drainage 45/86 Drainage of saline and waterlogged soils 79/86 Legal aspects of land drainage 1/88 Reclaiming saline and waterlogged soils on the Swan Coastal Plain 9/91 Responsibilities of landholders under agricultural Acts: Water and drainage
47/93 Notification of draining or pumping saline land 26/94 Notification of intention to drain or pump water in the Peel-Harvey Catchment
Banks and drains 51/85 How to build contour banks with a disc plough 53/85 How to build contour banks with a road grader 27/89 The hose level – how to make and use one 70/89 Reverse-bank seepage interceptor drains 71/89 Surveying and construction of reverse-bank seepage interceptor drains 73/89 Waterways 62/91 Banks and drains for sloping land
106/91 Spoon and W-drains Other
32/85 Gypsum improves soil stability 57/90 Identifying gypsum responsive soils 8/93 Establishing perennials in areas with less than 700 mm rainfall
11/95 Kikuyu - the forgotten pasture? 26/96 Farmer to farmer - Landcare case studies: Revegetation - clothing the landscape 63/96 Farmer to farmer - Landcare case studies: Farming with environmental benefits 75/96 Harvesting tall wheatgrass and Puccinellia for seed 76/96 Harvesting balansa clover for seed 26/99 Establishing balansa and Persian clovers on waterlogged, mildly saline soils
Available from the Land Management Society or The University of Western Australia: The farm monitoring handbook (Hunt and Gilkes, 1992) contains chapters dealing with waterlogging, soil structure and drainage. It provides a good summary of the causes of waterlogging and how to monitor and manage it. Other publications: Soil and water conservation engineering (Schwab et al., 1981) is an American text which provides technical guidelines for the design of surface and sub-surface drainage and a chapter on pumps and pumping.

7: Waterlogging
-170-
7.4.2 Agencies and organisations to contact The following agencies and organisations can be contacted for more information (postal address, phone numbers, e-mail address and Internet websites of each organisation are listed in Appendix 1): The local district office of Agriculture Western Australia or Community Agriculture Centres (CAC) can provide information, publications and suitable contacts for specific topics relating to waterlogging. Some offices will test the salinity of soil and water samples for a fee. Information on computer models, such as “Pumps”, “Drains” and “Banks” should also be available. The local Land Conservation Officer (LCO) at Agriculture Western Australia should be contacted regarding regulations covering land clearing or drainage. AGWEST Land Management Services and other agricultural consultants can assist with the preparation of farm plans and dam design for a fee. Consultants are listed on the Australian Association of Agricultural Consultants website. The Blackwood Basin Group, located at Boyup Brook, operates in the Blackwood River Catchment Area and can help provide local contacts and information about funding sources. The Chemistry Centre (WA) and a number of commercial laboratories can analyse soil and water samples for a fee. The local Community Landcare Coordinator (CLC) will be able to provide advice or suitable contacts for most issues related to waterlogging. They will also be able to help with the preparation of submissions for grants for land conservation works. CLCs can be contacted via the Shire Office or through Agriculture Western Australia. Community Landcare Technicians (CLT) can provide assistance in designing and surveying earthworks and drains for a fee. The local office of Agriculture Western Australia or Community Landcare Technician Association should be able to provide contact numbers for local CLTs. The Farm Forestry Advisory Service is a joint initiative between the Department of Conservation and Land Management (CALM) and Agriculture Western Australia providing information to assist landholders to integrate tree farming with agriculture. They produce a number of publications and decision making tools. Contact CALM in Busselton or Bunbury, or Agriculture Western Australia in Bunbury, Manjimup or Narrogin. The local Landcare Group or Land Conservation District Committee (LCDC) could provide contact with landholders who have local experience in tackling waterlogging and good information about approaches that have proved successful in the district. The Land Management Society can help provide information and establish contact with other landholders who have practical experience in tackling these issues. They also sell farm monitoring kits. The Water and Rivers Commission plays a leading role in the Water Resource Recovery Catchments where a coordinated strategy is being developed to combat dryland salinity in public water supply catchments. Landholders in the upper Collie River Catchment (above Wellington Dam) and the upper Warren River Catchment (Tone-Perup Catchments) can contact the Bunbury Office of the Water and Rivers Commission for assistance with matters relating to waterlogging and dryland salinity. Landholders in the upper Kent Catchment and Denmark Catchments should contact the Albany Office.

7: Waterlogging
-171-
7.5 REFERENCES
Ayling, G. (editor) (1985). Journal of Agriculture Western Australia Volume 26 (4). Ayling, G. (editor) (1990). Journal of Agriculture Western Australia Volume 31 (2). Anon. (2000). Natural resource management in Western Australia – Catchment water management: Guidelines
for those considering drainage for waterlogging and salinity management. Agriculture Western Australia Bulletin No. 4464.
Bakker, D., Hamilton, G., Tipping, P., Spann, C. and Rowe, D. (1999). Results of improved soil management and cropping systems for waterlog-prone soils - 1998 season. Agriculture Western Australia Resource Management Report 191.
Bathgate, A. and Evans, I. (1990). Economics of interceptor drains. Journal of Agriculture Western Australia 31: 78-79.
Belford, B., Dracup, M. and Tennant, D. (1990). Waterlogging limits crop growth on duplex soils. Journal of Agriculture Western Australia 31: 62-65.
Bligh, K.J. (1989 - unpublished). ‘Soil conservation earthworks design manual’. Division of Resource Management, Western Australian Department Agriculture, South Perth,
Coles, N.A., George, R.J. and Bathgate, A.D. (1999). An assessment of the efficacy of deep drains constructed in the wheatbelt of Western Australia. Part 1 - A discussion paper on drainage implementation in the wheatbelt: A case study review summary, conclusions and recommendations. Agriculture Western Australia, Bulletin No. 4391.
Cox, J. W. (1988). Seepage interceptor drainage on duplex soils in south-western Australia. Ph.D. Thesis, Geology Department, The University of Western Australia.
Cox, J. and McFarlane, D.J. (1990). The causes of waterlogging. Journal of Agriculture Western Australia 31: 58-61.
Ferdowsian, R., Ryder, A. and Kelly, J. (1997). Evaluation of deep, open drains in the North Stirlings area. Agriculture Western Australia, Natural Resource Management Services Technical Report No. 161.
George, R.J. (1991). Management of sandplain seeps in the wheatbelt of Western Australia. Agricultural Water Management 18: 85-104.
Hunt, N. and Gilkes, R. (1992). ‘The farm monitoring handbook: a practical down to earth manual for farmers and other land users’. The University of Western Australia.
Keen, M.G. (1998). Common conservation works used in Western Australia. Agriculture Western Australia, Resource Management Technical Report No. 185.
McFarlane, D.J. (1990). Agricultural waterlogging - a major cause of poor plant growth and land degradation in Western Australia. Land and Water Research News 7: 5-11.
McFarlane, D.J. and Cox, J. (1990). Seepage interceptor drains for reducing waterlogging and salinity. Journal of Agriculture Western Australia 31: 66-69.
McFarlane, D.J. and Wheaton, G.A. (1990). The extent and cost of waterlogging. Journal of Agriculture Western Australia 31: 44-47.
McFarlane, D.J., Engel, R., Ryder, A. and Eales, M. (1990a). Level banks used to decrease waterlogging can increase salinity. Journal of Agriculture Western Australia 31: 74-77.
McFarlane, D.J., Negus, T. and Ryder, A. (1990b). Shallow drains for reducing waterlogging and salinity on clay flats. Journal of Agriculture Western Australia 31: 70-73.
McFarlane, D.J., Wheaton, G.A., Negus, T.R and Wallace, J.F. (1992). Effects of waterlogging on crop and pasture production in the Upper Great Southern, Western Australia. Western Australian Department of Agriculture, Technical Bulletin No. 86.
Moore, G. and McFarlane, D.J. (1998). Waterlogging. In: ‘Soilguide - A handbook for understanding and managing agricultural soils’. (ed. G. Moore). Agriculture Western Australia, Bulletin No. 4343. pp. 94-108.
Negus, T.R. (1983). The effect of waterlogging on cereal yields. Department of Agriculture Western Australia, Farmnote 60/83.
Negus, T.R. (1989). The effect of seepage interceptor drains on crop yields. Department of Agriculture Western Australia, Farmnote 69/89.
Poole, M.L (1971). Don’t crop areas liable to waterlogging. Journal of Agriculture Western Australia 12: 108-109.
Salerian, J.S. and McFarlane, D.J. (1987). DRAINS: a method of financially assessing drains used to mitigate waterlogging in south-western Australia. Western Australian Department of Agriculture, Division of Resource Management Technical Report No. 54.
Schwab, G.O., Frevert, R.K., Edminster, T.W. and Barnes, K.K. (1981). ‘Soil and water conservation engineering’ (3rd edition). John Wiley and Sons, New York.
Speed, R.J. and Simons, J.A. (1992). Deep drains - a case study and discussion. Western Australian Department of Agriculture, Division of Resource Management Technical Report No. 133.
8: Flooding
-172-
8. FLOODING
8.1 INTRODUCTION
8.1.1 What is flooding? Flooding describes the situation where a large volume of water flows across the ground surface. It usually occurs along drainage lines and on valley floors. Localised flooding is restricted to small catchments. Regional flooding affects large areas, such as when major rivers break their streambanks. Although flooding is a different process from inundation, waterlogging and sheet flow, there are cases where these processes overlap and distinguishing between them is difficult. Inundation describes the situation where water lies ponded on the ground surface –the water is stationary rather than moving (see Section 7.1.1). Inundation may occur as a precursor to, or as a result of, flooding. Waterlogging is the total or partial saturation of subsoils (root-zone) and is associated with the development of anaerobic conditions and plant death. Sheet overland flow describes a form of runoff where a thin veneer of water moves down a slope. Where sheet flow meets in drainage lines flooding may be initiated. Flood events can be described in terms of peak flows and return periods. A peak flow describes the greatest volume of water flowing past a given point at any time during a flood event. This is when water levels will be at their highest and flood water will cover the broadest area. A return period (or recurrence interval) describes the severity of a peak flow and is used to predict the risk of a certain area being flooded. A flooding event with a 1:100 return period is one with a peak flow which is likely to occur on average once in every hundred years. This is not to say that there will always be a 100 years separating each event of this magnitude. Rather it is a measure of probability telling us that in any given year the chances of an event of the same (or greater) peak flow is 1:100. While our current records stretch back far enough to predict 1:5, 1:10 and 1:20 return periods with reasonable confidence, centuries of data would be needed to accurately predict 1:100 year events. 8.1.2 What causes flooding? Flooding is usually in response to intense or extended rainfall events, during which large volumes of runoff are generated. The runoff is concentrated in drainage lines and valleys where the capacity of stream and river channels is exceeded and flood waters spread out across the surrounding land. There are two types of runoff that contribute to flooding. Infiltration excess runoff normally occurs when the rainfall intensity exceeds the infiltration capacity of the soil (See Box 3.2), for example during sudden summer thunderstorms or severe storms in winter. Infiltration excess runoff is most likely in catchments containing soils with low permeability such as clays (especially cracking clays which swell when they are wet), dispersive soils which develop a surface seal, non-wetting sands and soils with a compacted surface due to land management practices. The second type of runoff, saturation excess runoff, occurs in response to less intense rainfall events and happens mostly in winter when infiltration is prevented by waterlogging conditions. Saturation excess runoff is most likely on duplex soils, in low lying areas or where groundwater is discharging. Groundwater discharge areas are often also affected by secondary salinity. Although flooding is a natural process, flooding regimes have been altered by human activities. The clearing of native vegetation has resulted in more runoff, significantly contributing to a higher incidence of flooding (Flavell, 1987). Rising water tables and waterlogging, resulting from land use changes, add to this increase in runoff. Modelling carried out in the Blackwood River Basin indicates that when the groundwater level reaches the surface of the valley floor in a significantly large part of the catchment, there will be increases in flood discharges of between two and four times the previously observed levels (Ruprecht and Bowman, 1999). This is because of the larger volumes of runoff in waterlogged areas rather than because of groundwater directly contributing to flooding. Soil structure decline caused by cultivation practices or soil becoming compacted by livestock is another contributor (Hauck and Coles, 1991). Constructing of artificial drainage systems may increase the speed at which water moves into drainage lines and so cause higher peak flows. The drainage of wetlands, which previously acted as retention basins absorbing large amounts of water, can be a major factor in increased flooding. The straightening and clearing of natural drainage lines (sometimes referred to as river calming) can result in increased peak flows downstream. In some

8: Flooding
-173-
situations the construction of artificial barriers such as roads and railway lines has restricted the natural flow of water and add to flooding problems. On the other hand, some human activities have resulted in decreased flood frequencies. Constructing of reservoirs on rivers allows peak flows to be absorbed and can reduce the risk of flooding. Levee banks along rivers prevent floodwaters from spreading out across floodplains. Banks, channel and water management systems may also reduce flood risk if well designed. Flood risk may be lowered if the time to concentration is lengthened. For example, grade banks increase the length of time water takes to reach a stream, thereby allowing the initial flood peak to pass. Poorly designed drainage systems may cause peaks to converge, exacerbating flood damage. This can happen at both hill slope and catchment scales. 8.2 FLOODING IN THE SOUTH-WEST HYDROLOGICAL REGION
8.2.1 What is the extent of flooding? Regional flooding occurs along the major rivers in the South-west Hydrological Region. In the deep, narrow valleys of the Forested Hills and Western Woolbelt the flood waters are relatively confined, but dramatic rises in river levels can be experienced. Cyclone Errol caused a 1:120 year event on the Blackwood and Gordon Rivers in January 1982 and severe flooding was experienced in Tambellup, Boyup Brook, Bridgetown and Nannup. On the Coastal Plains, flood waters can spread over large areas because the terrain is so flat. In 1964, 1:100 year flows on the Collie and Preston Rivers flooded parts of Collie, Eaton, Australind and Bunbury. Reservoirs on the Collie and Harvey Rivers may mitigate flooding when their water levels are low, but have minimal effect if the dams are full. Improved levee banks now protect urban areas on the lower reaches of these rivers. Drains in the Vasse-Wonerup Catchment cut through directly to the sea and levee banks have reduced the risk of major flooding in this catchment. In spite of these works, Busselton narrowly escaped serious flooding in the winter of 1997 and was not so lucky in 1999 when flood waters inundated parts of the town. In the Wheatbelt and Eastern Woolbelt, floods are a problem where waters spread out on the broad valley floors because the drainage lines are poorly defined. Roads and railway lines often play a major role in restricting the flow of water and the resultant flooding can affect sizeable areas of agricultural land. One example is the catchment of Lake Toolibin where flooding and silt deposition have occurred. Flooding has also affected sections of towns located on valley floors, such as Wagin and Katanning. 8.2.2 What are the problems associated with flooding? Moving floodwater damages infrastructure, such as fence lines, roads, railway lines and buildings. Damage can be especially costly in towns and built up areas. Flooding also often cuts roads and transport routes, but fortunately this is usually for a short time only. There have been cases where people have died while trying to ford flooded crossings. Flooding can result in damage to crops, stock losses and erosion leading to the loss of valuable topsoil. Erosion contributes to sedimentation problems along drainage lines and floodplains as well as in water reservoirs and estuaries downstream. Waterlogging and inundation problems often occur on valley flats following flooding and may result in significant crop losses or yield reductions. 8.2.3 Which areas are most susceptible to flooding? Rivers and drainage lines located in catchments which that been cleared for agriculture are more prone to flooding than those in catchments where the natural vegetation remains. Catchments where land is cultivated regularly have an even higher risk. Catchments with increasing areas of salinity and waterlogging experience higher flood peaks from relatively smaller rainfall events, because of the proportion of the catchment already saturated. 8.2.4 Flooding research in the South-west Hydrological Region Research measuring and testing predictive models for runoff and flooding from small agricultural catchments in the South-west Hydrological Region and adjacent areas includes work by Bligh (1989), Coles (1993), Coles et al. (1997), Davies and McFarlane (1986; 1987) and McFarlane and Davies (1988). Most of this research has been conducted on agricultural land in the Wheatbelt. Flavell et al.

8: Flooding
-174-
(1983) and Flavell and Belstead (1986) investigated parameters for predicting regional flooding. The Water and Rivers Commission and Water Corporation have conducted extensive work in the south-west (see References and Section 8.4.2). 8.3 MANAGING FLOODING
Many of the measures taken to reduce the risks of water erosion, waterlogging and dryland salinity can also help to reduce the risk of floods. These include adopting lower recharge farming systems and maintaining good ground cover. Earthworks that reduce the risk of erosion by minimising runoff, and sub-surface drains that combat waterlogging and salinity can also help to decrease the likelihood of flooding. However, poorly designed drainage systems may actually increased the risk of flooding if excess surface water from low lying areas is carried directly into existing flow lines. There may be some potential for disposal into wetlands (natural or artificial) and retention basins to reduce peak flows. 8.3.1 How can flooding be identified? Flooding is an obvious process which is readily identified when it is actually occurring. At other times, identifying flood prone land requires historical knowledge or mathematical predictions based on stream gauging and rainfall. Historical records are often a good source of information, though it should be noted that flooding regimes are often altered by land use changes. Debris in trees and damage to fence lines can provide a measure of the extent and depth of flood waters if no records are available. Flood risk maps of heavily populated areas on major rivers in the South-west Hydrological Region have been compiled by the Water and Rivers Commission (details are provided in Section 8.4.2). There are various mathematical models for predicting storm runoff and peak flows in catchments. Most require the user to have a good understanding of catchment hydrology and adequate data. The Institute of Engineers, Australia, have published several references and calculation systems for estimating stream flow and flooding. Australian Rainfall and Runoff (Pilgrim, 1987) contains descriptions of these techniques based on the Index Flood Method and Rational Method. Another example is the RORB model (Laurenson and Mein, 1983) which was applied to Western Australian agricultural catchments by Davies et al. (1988). Coles et al. (1997) investigated the suitability of adapting TOPMODEL (Bevan and Kirkby, 1979) for predicting runoff and flooding in small Wheatbelt catchments. The models proved capable of simulating catchment response for many events, but do not cover all aspects of variability (particularly the effects of land management).

8: Flooding
-175-
8.3.2 What changes can be made to agricultural practices? Lower recharge farming systems designed to combat salinity and waterlogging problems (see Sections 5.3.2 and 7.3.2) may reduce the risk of flooding. Incorporating trees, shrubs, perennial grass and higher water use crops into farming systems in catchment areas will help to lower water tables and increase the soil’s water storage capacity. This has the potential to reduce runoff caused by saturation excess. Management practices that reduce soil erosion by managing runoff (see Section 9.3.2) will also help. Maintaining ground cover through careful grazing management will increase infiltration and reduce runoff rates. Flooding risks are usually lower in catchments used for pasture rather than cropping because of the increased ground cover. Contour cropping instead of cultivating straight up and down the slope has also been shown to reduce runoff (Davies et al., 1988). No-till systems in preference to conventional cultivation also have a similar effect (Bligh, 1998). Where surface sealing of soils is a problem gypsum applications may be beneficial, however applications on saline land may be unsuitable. While most of these practices are likely to reduce runoff in small and moderate storms, they may not have much effect during severe storms. In some cases, revegetating drainage lines may help reduce flow rates and, at the same time, stabilises streambanks by reducing the risk of erosion and collapse. However, care needs to be taken when revegetating drainage lines because plants orientated across flow lines may cause blockages and further contribute to flooding, inundation and erosion. There have been hundreds of successful attempts at minor flood mitigation on a farm scale. However, few major flood mitigation works have been constructed in the South-west Hydrological Region, apart from coastal towns (e.g. Busselton 1999-2000). Outside the Region, experimental flood mitigation sites are situated at Merredin and Cowcowing (Davies et al., 1988). Drainage works to reduce waterlogging and inundation (W-drains, deep drains) have been installed in many locations. While these are often successful and cause few off-site problems, poorly designed drainage systems can actually increase flooding lower down in the catchment. Within the South-west Hydrological Region, earthworks constructed in the catchments of Lakes Towerrinning and Toolibin are designed to harness floodwaters to help manage salinity in the lakes. The initial flows at the break of season (which contain high levels of salt) are directed away from the lakes. Peak flows that are fresh (<500 mg/L) are directed into the lakes to flush out the salts. Lower flows later in the season are again directed away from the lakes. Both schemes were implemented by local landholders, through catchment groups, in cooperation with government agencies. 8.3.3 Engineering options The risk of flooding may be reduced by installing earthworks to control runoff in catchment areas (see Section 9.3.3 and Keen, 1998). While grade banks reduce and delay runoff from small and moderate storms, they may have no effect on runoff during major storms or could even lead to increased runoff (Davies et al.,1988). Level and absorption banks will hold water on the slope and lead to increased infiltration, helping to reduce peak flows significantly. However, they may fail in severe storm events and can make significant contributions to groundwater recharge and salinity problems. Dams are another option for flood mitigation and have the added benefit of increasing on-farm water supplies. Systems that capture runoff and store it in dams on hill slopes are more likely to be effective than gully wall dams. Dams are only likely to be really effective when their water levels are low and once the dams are full they have little impact on flooding. Retention basins built along drainage lines may have significant effects on reducing peak flows, but are expensive to construct and require careful design. The failure of such structures can have severe impacts downstream.
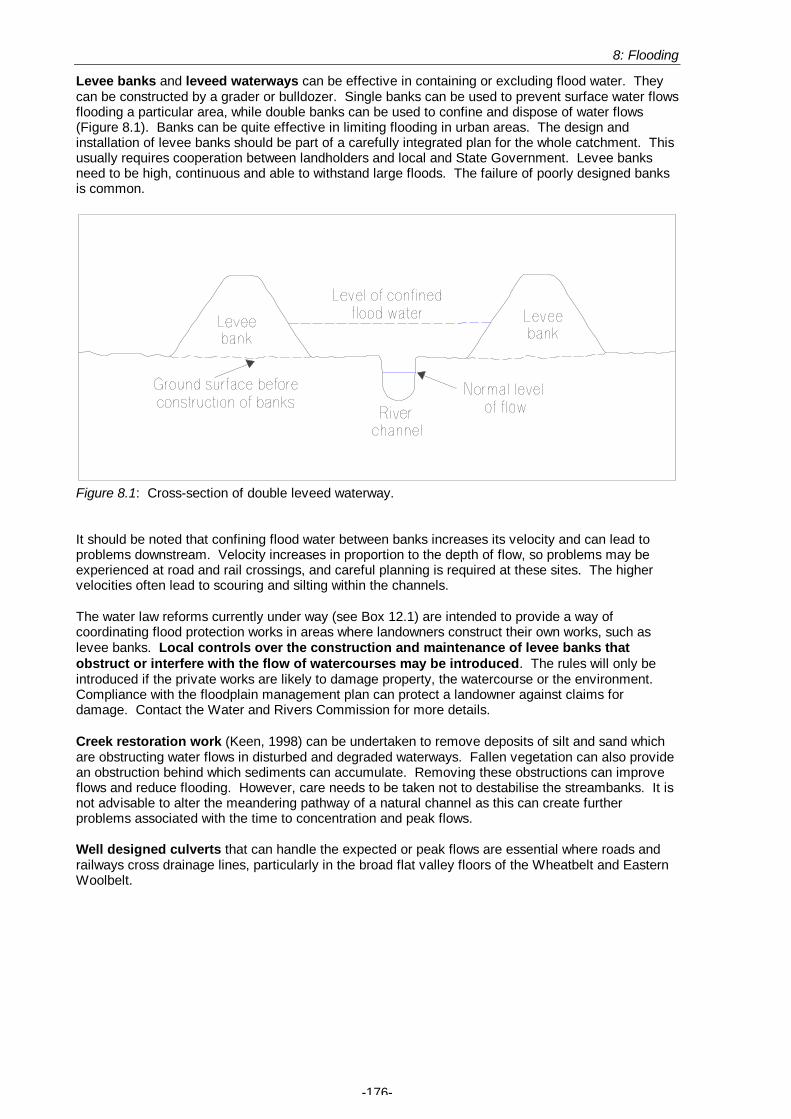
8: Flooding
-176-
Levee banks and leveed waterways can be effective in containing or excluding flood water. They can be constructed by a grader or bulldozer. Single banks can be used to prevent surface water flows flooding a particular area, while double banks can be used to confine and dispose of water flows (Figure 8.1). Banks can be quite effective in limiting flooding in urban areas. The design and installation of levee banks should be part of a carefully integrated plan for the whole catchment. This usually requires cooperation between landholders and local and State Government. Levee banks need to be high, continuous and able to withstand large floods. The failure of poorly designed banks is common.
Figure 8.1: Cross-section of double leveed waterway. It should be noted that confining flood water between banks increases its velocity and can lead to problems downstream. Velocity increases in proportion to the depth of flow, so problems may be experienced at road and rail crossings, and careful planning is required at these sites. The higher velocities often lead to scouring and silting within the channels. The water law reforms currently under way (see Box 12.1) are intended to provide a way of coordinating flood protection works in areas where landowners construct their own works, such as levee banks. Local controls over the construction and maintenance of levee banks that obstruct or interfere with the flow of watercourses may be introduced. The rules will only be introduced if the private works are likely to damage property, the watercourse or the environment. Compliance with the floodplain management plan can protect a landowner against claims for damage. Contact the Water and Rivers Commission for more details. Creek restoration work (Keen, 1998) can be undertaken to remove deposits of silt and sand which are obstructing water flows in disturbed and degraded waterways. Fallen vegetation can also provide an obstruction behind which sediments can accumulate. Removing these obstructions can improve flows and reduce flooding. However, care needs to be taken not to destabilise the streambanks. It is not advisable to alter the meandering pathway of a natural channel as this can create further problems associated with the time to concentration and peak flows. Well designed culverts that can handle the expected or peak flows are essential where roads and railways cross drainage lines, particularly in the broad flat valley floors of the Wheatbelt and Eastern Woolbelt.
8: Flooding
-177-
8.4 SOURCES OF FURTHER INFORMATION
8.4.1 Useful publications See Appendix 1 for contact details of the publishing organisations. Available from Agriculture Western Australia: Soilguide. A handbook for understanding and managing agricultural soils contains a chapter titled Runoff and Water Erosion (Coles and Moore, 1998) covering factors affecting runoff generation and provides methods for estimating runoff and flood frequency. Common conservation works used in Western Australia (Keen, 1998) provides notes on a variety of conservation works including banks, drains, leveed waterways and creek restoration. Issues like design, construction and variables leading to risk of degradation or failure are discussed. The effect of small earth structures and channel improvements on the flooding of agricultural land in south-western Australia (Davies et al., 1988) summarises information on flooding and flood mitigation. Analysis is given of flood mitigation in three Wheatbelt catchments located outside the South-west Hydrological Region. Soil conservation earthworks design manual (Bligh, 1989) has sections detailing the estimation of peak runoffs, the estimation of runoff volumes and designing the various earthworks. NOTE: Earthworks Design Manual is listed as being for use by staff of Agriculture Western Australia only. A revised version of this manual should be available in 2001. Relevant Agriculture Western Australia Farmnotes include: General
45/86 Drainage of saline and waterlogged soils 79/86 Legal aspects of land drainage 9/91 Responsibilities of landholders under agricultural Acts: Water and drainage
21/91 Landcare at low or no cost 97/91 Taxation and the control of land degradation 47/93 Notification of draining or pumping saline land
Trees, perennials and higher water use plants 102/88 Fitting trees into the farm plan 36/89 Trees for replanting the wheatbelt 31/91 Tree planting for erosion and salt control 8/93 Establishing perennials in areas with less than 700 mm rainfall 8/97 Farmer to farmer - Landcare case studies; Woolbelt options for high water use
Land management for runoff prevention 99/84 Direct drilling on the contour to control erosion 32/85 Gypsum improves soil stability 57/90 Identifying gypsum responsive soils 15/86 An introduction to conservation farm planning 4/95 No-tillage sowing minimises water erosion
65/96 Crop establishment series: Soil management options to control land degradation 66/96 Crop establishment series: Stubble management to control land degradation 29/97 Earthworms in wheatbelt farms
Earthworks for runoff prevention 31/81 Sites for new dams 51/85 How to build contour banks with a disc plough 53/85 How to build contour banks with a road grader 41/86 Dimensions and volumes of farm dams 70/89 Reverse-bank seepage interceptor drains 71/89 Surveying and construction of reverse-bank seepage interceptor drains 73/89 Waterways 82/89 Roaded interceptor catchments 83/89 Selecting dam sites in the Upper Great Southern 62/91 Banks and drains for sloping land 84/91 Absorption and level banks
Available from Blackwood Basin Group:

8: Flooding
-178-
Repairing farm waterways – Blackwood stories (Karafilis, 2000) contains a collection of case studies of riverbank restoration from landholders in the Blackwood Catchment. Other publications: Soil and water conservation engineering (Schwab et al., 1981) is an American text which provides technical guidelines for flood control structures. 8.4.2 Agencies and organisations to contact The following agencies and organisations can be contacted for more information (postal address, phone numbers, e-mail address and Internet websites of each organisation are listed in Appendix 1): The local district office of Agriculture Western Australia or Community Agriculture Centres (CAC) can provide information, publications and suitable contacts for specific topics relating to flooding. Some offices will test the salinity of soil and water samples for a fee. Information on computer models, such as “Banks” and “Drains” , or suitable contacts should also be available. The local Land Conservation Officer (LCO) at Agriculture Western Australia should be contacted regarding regulations covering land clearing and drainage. AGWEST Land Management Services and other agricultural consultants can assist with the preparation of farm plans and dam design for a fee. Consultants are listed on the Australian Association of Agricultural Consultants website. The local Community Landcare Coordinator (CLC) will be able to provide advice or suitable contacts for issues related to flooding. They will also be able to help with the preparation of submissions for grants for land conservation works. CLCs can be contacted via the Shire Office or through Agriculture Western Australia. Community Landcare Technicians (CLT) can provide assistance in designing and surveying earthworks and drains for a fee. The local office of Agriculture Western Australia or Community Landcare Technician Association should be able to provide contact numbers for local CLTs. The local Landcare Group or Land Conservation District Committee (LCDC) may be able to provide contact with landholders who have local experience in tackling flooding and good information about approaches that have proved successful in the district. The Water and Rivers Commission provides advice on the development of floodplains and supports flood forecasting activities. They have also prepared floodplain maps of urban areas showing which areas are flood prone. Maps of land prone to flooding in 1:100 year events have been prepared at scales of 1:5,000 to 1:25,000. They cover the following areas; Balingup townsite Blackwood River at Nannup, Bridgetown and Boyup Brook townsites Blackwood River from Augusta to Warners Glen Brunswick River from Collie River to Brunswick Junction Busselton region Collie River at Collie townsite Collie River between Leschenault Inlet and South West Highway Denmark townsite East Bunbury Ferguson River between Preston River and Dardanup Glen Iris Gordon River at Tambellup townsite Leschenault Estuary Murray River between Peel Inlet and Ravenswood Bridge Peel Inlet entrance channel Preston River between Leschenault Inlet and Riverlands Quindalup townsite Serpentine River between the Peel Inlet and South West Highway These maps are available from the relevant Local Government Authorities or the Water and Rivers Commission in Perth. The Water and Rivers Commission also plays a leading role in the Water Resource Recovery Catchments where a coordinated strategy is being developed to combat dryland

8: Flooding
-179-
salinity in public water supply catchments. Landholders in the upper Collie River Catchment (above Wellington Dam) and the upper Warren River Catchment (Tone-Perup Catchments) can contact the Bunbury Office of the Water and Rivers Commission for assistance with matters relating to surface water management and dryland salinity. Landholders in the upper Kent Catchment and Denmark Catchments should contact the Albany Office. 8.5 REFERENCES
Bevan, K.J. and Kirkby, M.J. (1979). A physically based variable contributing area model of basin hydrology. Hydrological Sciences Bulletin 24: 43-96.
Bligh, K.J. (1989). Small farmland experimental catchments in Western Australia. Western Australian Department of Agriculture, Division of Resource Management Technical Report No. 82.
Bligh, K. (1998). Contour no-till sowing minimises water erosion. In: ‘Soilguide - A handbook for understanding and managing agricultural soils’. (ed. G. Moore). Agriculture Western Australia, Bulletin No. 4343. p. 239.
Coles, N.A. (1993). Soil factors affecting runoff in the south-west of Western Australia. Ph.D. Dissertation, Department of Soil Science, The University of Western Australia, Nedlands.
Coles, N.A. and Moore, G. (1998). Runoff and water erosion. In: ‘Soilguide - A handbook for understanding and managing agricultural soils’. (ed. G. Moore). Agriculture Western Australia, Bulletin No. 4343. pp. 223-242.
Coles, N.A., Sivapalan, M., Larsen, J.E., Linnet, P.E. and Fahrner, C.K. (1997). Modelling runoff generation on small agricultural catchments: Can real world runoff responses be captured? Hydrological Processes 11: 111-136.
Davies, J.R. and McFarlane, D.J. (1986). Runoff volume estimation for agricultural catchments in Western Australia. In: Proceedings of Institute of Engineers Australia Hydrology and Water Resources Symposium, Brisbane.
Davies, J.R. and McFarlane, D.J. (1987). Estimation of runoff volumes for ungauged catchments in the agricultural areas of Western Australia. Western Australian Department of Agriculture, Division of Resource Management Technical Report No. 43.
Davies, J.R., McFarlane, D.J. and Ferdowsian, R. (1988). The effect of small earth structures and channel improvements on the flooding of agricultural land in south-western Australia. Western Australian Department of Agriculture, Division of Resource Management Technical Report No. 77.
Flavell, D.J. and Belstead, B.S. (1986). Losses for design flood estimation in Western Australia. In: Proceedings of Institute of Engineers Australia Hydrology and Water Resources Symposium, Brisbane.
Flavell, D.J., Belstead, B.S., Chivers, B. and Walker, M.C. (1983). Runoff routing model parameters for catchments in Western Australia. In: Proceedings of Institute of Engineers Australia Hydrology and Water Resources Symposium, Hobart.
Hauck, E.J. and Coles, N. (1991). The role of soils in the surface hydrology of small agricultural catchments. In: International Hydrology and Water Resources Symposium – Volume 3. Institute of Engineers, Australia National Conference Publication No. 91/22. pp. 886-891.
Karafilis, A. (2000). ‘Repairing farm waterways – Blackwood stories’. Blackwood Basin Group, Boyup Brook. Keen, M.G. (1998). Common conservation works used in Western Australia. Agriculture Western Australia,
Resource Management Technical Report No. 185. Laurenson, E.M. and Mein, R.G. (1985). ‘RORB - Version 3 runoff routing program users manual’. Monash
University, Melbourne. McFarlane, D.J. and Davies, J.R. (1988). Soil factors affecting flood runoff on agricultural catchments in
Western Australia. Western Australian Department of Agriculture, Division of Resource Management Technical Report No. 18.
Negus, T.R. (1968 - unpublished). Preliminary report on the Lake Toolibin flood mitigation survey, Wickepin Shire. Western Australian Department of Agriculture Report.
Negus, T.R. (1970 - unpublished). Report on flood control works in the Wogalin Creek catchment, Wickepin Shire. Western Australian Department of Agriculture Report.
Pilgrim, D.H. (1987). Estimations of peak flows for small to medium sized catchments. In: ‘Australian rainfall and runoff: a guide to flood estimation - Vol. 1’. (ed. D.H. Pilgrim). Institute of Engineers Australia, Barton, ACT.
Ruprecht, J. and Bowman, S. (1999). Flood risk analysis. In: The effect of recharge management on the extent of dryland salinity, flood risk and biodiversity in Western Australia: Preliminary computer modelling, assessment and financial analysis. Results of a two week modelling contract carried out for the State Salinity Council.
Schwab, G.O., Frevert, R.K., Edminster, T.W. and Barnes, K.K. (1981). Soil and water conservation engineering (3rd edition). John Wiley and Sons, New York.
Other relevant publications Belstead, B.S., Glenister, T.R. and Goh, J.J. (1984). Flooding in the Great Southern, January 1982. Main
Roads Department of Western Australia, Technical Report No. 82.

8: Flooding
-180-
Carder, D.J. (1971). Flooding problems on farmland in Western Australia. In: Proceedings of the Australian Soil Conservation Conference, Melbourne.
Flavell, D.J. (1983). Design flood estimation in Western Australia. In: BEC Seminar on Waterway Analysis and Design, National Association of State Recd. Authorities, Adelaide.
Flavell, D.J. (1983). Regional flood frequency procedure for the south-west of Western Australia. In: Proceedings of Institute of Engineers Australia Hydrology and Water Resources Symposium, Hobart.
Flavell, D.J., Matin, D.K. and Belstead, B.S. (1987). Flood estimation procedures for Western Australia. Main Roads Department of Western Australia, Technical Report No. 50T.
Kratchler, R.S. (1980). Eastern Wheatbelt flood report, severe thunderstorms February 1978. Main Roads Department of Western Australia, Technical Report No. 13.
Quilty, J.A. (1986). Water spreading and water ponding in New South Wales and their relevance to Western Australia. Western Australian Department of Agriculture, Division of Resource Management Technical Report No. 51.
9: Water erosion
-181-
9. WATER EROSION
9.1 INTRODUCTION
9.1.1 What is water erosion? Water erosion is the detachment of soil particles and their transport by water. Water erosion is a natural process, but accelerated erosion due to human activities is considered a form of land degradation. When water erosion occurs, it is the finer soil particles (the most fertile component of our soils) that are removed first. These fine particles (generally less than 0.002 mm in diameter) are clay and organic matter. They are essential for retaining water and nutrients in soil and maintaining soil structure. During water erosion the fine particles become suspended in the flowing water and are carried away in streams. Heavier, less fertile particles are only detached by faster and deeper flows and are often deposited very close to their source (e.g. a metre down the slope, along fences or at the base of the slope). The heavier particles are sometimes deposited in local creeks and dams, but they can also be carried hundreds of kilometres to estuaries or the to the ocean by major rivers. A number of different forms of water erosion have been identified. Some of these forms occur independently but it is more common to find a few form occurring concurrently. With increased erosion, one form may develop into another. The most common forms of water erosion are: • Sheet erosion, sometimes referred to as inter-rill erosion, is the removal of a fairly uniform layer
of soil by raindrop splash and/or runoff. No perceptible channels are formed and soil particles are either transported to rills, gullies and streams or moved downslope to temporary stores. Soil stored on the slope is liable to be displaced by subsequent erosion. Sheet erosion is often found in combination with rill erosion. Sheet erosion tends to remove 1-10 mm per of soil decade. At this rate it is almost impossible to notice in normal farming operations.
• Rill erosion is the removal of soil by runoff from the land surface in numerous small channels
(rills), usually down to the base of the cultivation layer. The rills are commonly 5-10 cm deep, but can be up to 30 cm deep. Rills typically form on recently cultivated land, disturbed soils and on overgrazed paddocks during summer storms. Sandy soils are particularly prone to rilling. Rills can usually be crossed by machinery without significant damage to the machine or discomfort to the driver. Rill erosion can be seen easily because 10 to 100 mm of soil are removed per year.
• Gully erosion is the removal of soil in large channels (gullies). Gullies are defined as being
more than 30 cm deep and can incise several metres into the soil, so they cannot usually be crossed by farm machinery. They are typically steep sided and often have branches. Gully formation occurs as a result of either runoff or a combination of runoff and seepage. Gully erosion can take place after individual storms and removes 100 to 1,000s of mm of soil per day.
• Streambank erosion involves the removal of soil from streambanks by the direct action of the
water flowing in the stream. • Tunnel erosion (or tunnelling) is the removal of sub-surface soil by water while the top soil
remains intact (until the tunnel collapses and a gully is formed). • Mass movement (e.g. landslides) is a form of erosion which often involves water, but it is not
usually considered to be a form of water erosion because gravity is the primary agent of movement (see Section 10.1).
9.1.2 What causes water erosion? Water erosion is a process that occurs in natural ecosystems, but accelerated erosion rates are common as a result of land clearance, cultivation and overgrazing. The impact of raindrops striking bare earth can cause soil particles to be detached and thrown several centimetres away in a process known as splash erosion. Continual exposure of soil to intense rainstorms weakens the bonds between the soil particles allowing them to be removed easily by sheet, rill or gully erosion. Once the rate of rainfall exceeds the rate of infiltration into the soil, the

9: Water erosion
-182-
excess water becomes runoff, moving down the slope. This flowing water transports detached soil particles down the slope through the process of sheet erosion. Rills begin to form where the runoff becomes concentrated into small channels. The sediment laden waters can be abrasive, acting like “sandpaper” on the soils. Concentrated runoff is often the cause of gully formation, which is often initiated where there is a change in surface gradient increasing the velocity of the water. The runoff can gouge large channels into the soil’s surface or undermine the subsoil when it falls over a ledge. Gully elongation and expansion are often a result of this undermining, which is most common where subsoils are dispersive (e.g. sodic clays) or slake readily (e.g. sands). In the South-west Hydrological Region, seepage flow also makes a major contribution to undermining. Gullies increase in size by headward expansion up the main channel, or by lateral expansion (which makes them wider). Lateral expansion can result from the undermining of the gully side walls and erosion along tributaries to the gully. Tunnel erosion also occurs in soils where the subsoil is less stable than the topsoil. Water flowing through weaknesses, cracks and channels in the subsoil carries abrasive soil particles with it forming a tunnel. Dispersive subsoils are particularly prone to tunnel erosion. Stream erosion usually occurs during periods of high flow, with the sediment carried by high velocity streams acting like a “sandblaster” on the streambank. In meandering stream channels, the energy of the stream flow is directed to the outside bends, where the water velocity is highest. This results in the undercutting and collapse of the streambank while sediment builds up on the inside bend. There are a number of factors that influence the likelihood of water erosion: Rainfall and runoff The intensity of rainfall is an important factor. In intense rainfall events, such as summer thunderstorms, the heavy rain drops have greater impact on the soil and are more likely to generate runoff. Thin flows can be particularly damaging because the raindrops still impact the soil and the runoff carries away the detached particles. Although deep runoff waters may actually “protect” the soils from rain splash, they expose them to the greater abrasive power of the sediment laden water. The erosivity of runoff increases with its velocity, depth and turbulence. Preceding rainfall events are also important. If the soil is already wet, soil particles are more easily detached and any extra rain generates runoff almost immediately. Slope and slope length Long or steep slopes increase the risk of erosion because they increase the velocity and volume of surface runoff. Soil type and condition Soils vary in their erodibility. The particles of some soils are more prone to detachment and transport. Soil texture plays an important part in determining erodibility because the finer particles (clays and silts) are lighter and more easily transported than the coarser sands. As a general rule, infiltration is lower on clayey soils which are therefore more likely to produce runoff. Soil structure, the spatial arrangement of primary soil particles (sand, silt and clay) into aggregates such as peds or clods, is also an important factor. Well structured soils tend to have a lower erodibility because they are more stable and have better infiltration. There are two forms of structural instability. Slaking describes the process whereby a soil aggregate breaks down partially when wet. Water entering the aggregate breaks the weak bonds holding its constituent smaller aggregates together because it replaces air in the aggregates pores and causes the clays to swell. The second form of instability is called dispersion and describes the process whereby the smaller aggregates breakdown into individual soil particles (sand, silt and clay). Dispersive soils form cloudy suspensions when placed in water. Dispersion usually occurs in sodic soils that have a combination of high levels of exchangeable sodium on their clay surfaces and low levels of soluble salts. When this combination is present in a soil, it causes the clay particles to separate in water. Since clay is

9: Water erosion
-183-
one of the chief agents holding soil materials together, their separation leads to the collapse of the soil structure. The non-wetting sandy topsoils can also contribute to erosion by initiating runoff. Topsoil compaction, which is most common in loamy soils, also leads to increased runoff and erosion. Waterlogged soils are prone to erosion because saturation excess runoff is generated quickly and the structure of the saturated soil has often been weakened by slaking or dispersion. Vegetative cover The effectiveness of vegetation in reducing erosion depends on the density of above soil “cover” and the root density (Morgan, 1986). Plant leaves and stems can intercept raindrops so that their kinetic energy is dissipated before they reach the ground. This reduces the raindrop’s ability to detach soil particles. Plants also dissipate the energy of running water by creating “roughness” or turbulence to the flow, reducing its velocity. Because erosion increases exponentially as water velocity increases, slowing the flow of water can have a significant effect on restricting or preventing soil loss (Morgan, 1986). Below the surface, roots remove the water from the soil, reducing the soil's wetness and allowing more water to soak in. The binding effect of roots, locking small soils grains and clods in an organic web, is very important. Vegetation also provides organic matter to improve the soil structure and litter to protect the soil surface. Land management practices Land management has a major impact on the susceptibility of land to water erosion. Practices that decrease or remove the vegetative cover increase the risk of erosion. For example: burning natural vegetation leaves the land temporarily bare and prone to erosion; clearing natural vegetation and replacing it with annual pastures, grazing pressure; and the amount of ground cover maintained throughout the year are all very important factors. Disturbance of the soil increases its erodibility. One of the most widespread forms of disturbance is cultivation which breaks down soil structure and removes vegetation, leaving the soil exposed to raindrops and runoff. With conventional cropping systems, bare soil can be exposed between ripping up and crop tillering for as long as 12 weeks (Negus, 1984). The timing of cultivation is important, because soils are often left exposed when the most erosive rains fall. The gradient and length of furrows also contributes to the erosion risk. Other common forms of disturbance include trampling and scratching of the soil surface by livestock, which loosens soil particles. Soil compaction by livestock and machinery reduces infiltration and increases runoff. Farm tracks and stock pads are particularly prone to erosion. Waterlogging can also contribute to the risk of water erosion. When the soil is saturated, its erodibility increases and a larger volume of runoff is generated. In addition, poor ground cover due to reduced crop and pasture performance contributes to the erosion risk. Similar conditions are associated with salinity, which can remove all ground cover leaving the soil highly vulnerable.

9: Water erosion
-184-
9.2 WATER EROSION IN THE SOUTH-WEST HYDROLOGICAL REGION
9.2.1 What is the extent of water erosion? While water erosion is a natural process in the South-west Hydrological Region, accelerated water erosion probably began more than 30,000 years ago with the low intensity burning of forests and woodlands practiced by the Noongar people. Flannery (1994) provides evidence that altered fire regimes coincided with the arrival of the Aboriginal people in Australia and suggests that, as well as changing vegetation communities, the increased incidence of fires resulted in higher rates of soil loss in catchments and the sedimentation of river mouths. From the 19th century onwards, extensive clearing of vegetation and land use changes introduced by European settlers would have resulted in a dramatic rise in erosion rates. The current extent of water erosion in the South-west Hydrological Region is difficult to estimate. Not all erosion leaves highly visible, permanent scars. Gullies and large rills can be seen in paddocks for many years after they first form, but much of the other erosion is only evident until the next growing season. It is likely that the most extensive form of erosion is sheet erosion where relatively small amounts of soil are lost each year. This type of erosion is very difficult to see, but over many years it can be quite significant. Across the South-west Hydrological Region, soil loss rates in the range of 0.5-4.1 t/ha/y have been estimated from pasture land with no visible signs of erosion (van Moort et al., 1994). Even when a relatively large amount of soil is lost in one event, a couple of years of pasture growth or cultivation can cover over the visual evidence. More severe sheet and rill erosion can be found on steeper land that has been heavily grazed over the spring and summer, leaving soils bare and exposed to erosion if heavy rain falls in summer or autumn. This is evident in some areas of the Forested Hills and the Western Woolbelt, especially in the area between Darkan and Quindanning. In the Wheatbelt, erosion is most common below large rock outcrops or breakaways, especially on hardsetting loams or clays. Similar problems are experienced on land which has been cultivated for field crops or vegetables, especially if heavy rain falls soon after cultivation and before pastures and crops emerge. Soil loss rates of 2-19 t/ha/year have been estimated on cultivated land in the Manjimup, Donnybrook and Capercup districts (van Moort et al., 1994). These rates are long-term averages, and much of the soil could have been moved in one or two events. Erosion on vegetable plots is evident in the Pemberton/Manjimup district, where cultivation up and down relatively steep slopes is still common. Similar problems occur in the Donnybrook district, but over the past decade or so vegetable growers have moved away from the steeper slopes that have high erosion risks. Soil loss is also evident in the Western Woolbelt, from cultivated paddocks that have longer slopes but more moderate gradients. These long slopes allow greater volumes of runoff to build up. Waterlogging is often a contributing factor on the gentle slopes in the Western Woolbelt. Gullies are scattered throughout the South-west Hydrological Region, being most common in the steeply sloping country in the Forested Hills or in saline valley floors in the Western Woolbelt and Eastern Woolbelt. Tunnel erosion is rare in the South-west Hydrological Region and is usually associated with old rabbit infestations, active landslips or gully development. 9.2.2 What are the problems associated with water erosion? Water erosion reduces soil fertility and productivity. During erosion, the finer soil particles (clays, silts and organic matter) are lost first because they are light and readily transported. These fine particles are essential for soil structure and play a major role in retaining moisture and nutrients in soil. Most organic matter is found near the surface of the soil profile and is especially susceptible to erosion. This is why the loss of even a few millimetres of soil can be significant in terms of productivity. Gully erosion leads to a loss of productive land area and gullies cutting across paddocks reduce trafficability. Soil is a precious resource which should be viewed as virtually irreplaceable because it takes such a long time to form. The deeply weathered profile common in the south-west is 30 m deep on average and has taken about 30 million years to form. This converts to an average of 1 mm formed every 1,000 years (ranging from about 1 mm per 500 years in the south-west part of the Forested Hills to 1 mm per 5,000 years in the eastern part of the Eastern Woolbelt). Erosion rates of 1 mm per year may be considered acceptable in districts where more than 500 cm of fertile soil is present. Such situations are very rare in the South-west Hydrological Region, where

9: Water erosion
-185-
soils tend to be 100-300 cm thick and the depth of the fertile topsoils is usually only 2-50 cm. Implications of this are that if erosion continues at 1 mm/year (a conservative estimate) then during a hundred years of intensive agriculture the top 10 cm of topsoil will be lost. In some shallow duplex soils this can expose the clayey subsoil which is often a hostile environment for plant germination and growth. Even in cases where the layer of topsoil is thicker, most of the soil organic matter will have been lost. The organic matter is a major store of nutrients such as nitrogen, phosphorus, potassium and sulphur which are essential to plant growth. Most of the soil micro-organisms depend on this organic matter and the highest concentrations of soil animals and microbes are found in the topsoil. The loss of this topsoil and the associated soil fauna reduces the nutrient recycling capacity of the soil. Sedimentation is another problem connected to water erosion. Soil particles detached during erosion can fill dams and streams, dramatically altering aquatic ecosystems. Waterholes on streams and rivers can become silted up. Finally, soil erosion can contribute to eutrophication by carrying nutrients (especially phosphorus) to water bodies where it may feed algal blooms (see Section 11.1.2). 9.2.3 Which areas are susceptible to erosion? McFarlane et al. (1986) present maps of rainfall erosivity over the South-west Hydrological Region using an index. This erosivity index (EI30) is the product of the energy and the intensity of rainfall to cause erosion over a 30 minute period, with high values representing high erosivity. The maps show that, on average, winter rains are more erosive than summer rains. Over the years the erosivity of winter rains remains fairly constant, but erosivity in summer can vary greatly. During some summers there are only a few scattered showers while highly erosive storms occur in others. On average, the most erosive rains are experienced to the north of Bunbury on the Swan Coastal Plain and Forested Hills between May and October (EI30>200). In summer, the most erosive rainfalls (EI3080) fall on the Swan Coastal Plain and adjacent areas of the Forested Hills. The least erosive rains occur in the Wheatbelt during summer (EI30<50). The long steep slopes in the valleys of the Forested Hills have the highest inherent risk of water erosion, but because most of these slopes are either under forest or permanent pasture their susceptibility to erosion is lower than might be expected. The areas at greatest risk of erosion are cultivated paddocks on slopes with gradients of 10-15%. Slopes with gradients steeper than 15% should not be cultivated because it is not safe to operate machinery across the slope at this angle. On farms the following areas are particularly susceptible to erosion: • steep slopes, especially if they are long enough to generate significant runoff, • highly erodible soils such as pink clays below breakaways, sodic soils, loose fine-grained
sands, • areas receiving concentrated runon such as water diverted from roads or earthworks or areas
below rock outcrops, • waterlogged slopes, especially wet footslopes which receive runon when saturated, • drainage lines and streambanks, especially narrow and poorly vegetated waterways, • headlands in cropping areas (water collects in the headland and then runs down the furrows
where the soil particles are dislodged easily), • firebreaks where erosion occurs during summer thunderstorms and wet winters, • stock pads where soil is disturbed and acts as a pathway to concentrate runoff, and • gates and water sources in grazing paddocks where converging stock pads direct water to one
point.

9: Water erosion
-186-
9.2.4 Water erosion research in the South-west Hydrological Region Research into water erosion in the South-west Hydrological Region has been limited, and mostly concentrates on land used for vegetable cropping. McGhie (1980) demonstrated the role of runoff, generated on mallet hills in the Narrogin district, in initiating erosion. McFarlane (1984) investigated water erosion on potato land during the 1983 growing season at Donnybrook. McFarlane et al. (1989) then measured soil lost from vegetable land in the Donnybrook and Manjimup/Pemberton districts. They also investigated different solutions to the soil loss problem and the economics of soil loss on cropping land. McFarlane et al. (1992) studied water erosion rates using the Caesium-137 (137Cs) method on ten agricultural hillslopes as part of a national reconnaissance survey. Two of the sites were in the South-west Hydrological Region. Most of the soil was lost from cultivated sites, or where the sample sites were downslope of areas shedding significant amounts of runoff. At Darkan (sheep grazing) and Donnybrook (horticulture, potatoes) soil loss rates of 2-20 t/ha/year were reported. In more recent studies (van Moort et al., 1994; McFarlane et al., 2000), soil loss was estimated at twelve sites in the South-west Hydrological Region using the 137Cs technique (Table 9.1). Results indicated that slopes that were cropped or used for horticulture had lower 137Cs activity measurements and therefore higher rates of soil loss (mean of 6 sites = 5.6 t/ha/year). Grazed hillslopes had higher 137Cs activities and lower erosion rates (mean of 6 sites = 1.8 t/ha/year). Cultivation appeared to have a significant influence on soil loss. Along individual slopes, soil loss was most pronounced below the break of slope and at the top of the slope. Table 9.1: Summary of soil loss on twelve slopes sampled for 137Cs Location Date
cleared Land use Rain-
fall Slope Slope
length Net soil loss
range Mean net soil loss
(mm/yr) (%) (m) (t/ha/year) (t/ha/yr) (mm/ha/yr) Benger <1954 Pasture 1,100 25 204 +0.1-14.0 2.0 2.0 Bridgetown <1954 Pasture 800 24 600 0.1-17.0 2.9 2.5 Bridgetown <1954 Pasture 800 26 405 0.0-3.2 0.8 0.6 Ferguson <1954 Pasture 1,100 15 244 0.0-2.0 0.5 0.5 Kulikup 1950-
1980s Pasture 600 11 419 0.8-19.0 4.1 3.7
Manjimup <1959 Pasture 1,100 10 126 0.0-1.3 0.3 0.3 Capercup 1961-2 Cropping/
Pasture 550 8 464 6.3-23.0 15.0 11.8
Manjimup <1964 Vegetable cropping
1,100 12 295 +0.6-0.1 2.0 1.4
Winnejup <1954 Cropping/ Pasture
700 11 291 0.7-13.0 4.9 4.1
Reference value is 93.6 mBq/cm2. Note: Positive value (+) indicates soil deposition rather than soil loss. Source: van Moort et al. (1994).

9: Water erosion
-187-
9.3 MANAGING WATER EROSION
Modifying farm management to increase ground cover decreases the likelihood of water erosion. Altering cultivation practices can also reduce the erosion risk. Earthworks can be installed to manage the velocity and placement of water, with the excess water either being stored on-farm for later use or slowly discharged into natural watercourses. Developing and implementing a farm plan is an important step towards controlling erosion. Altering paddock layout, realigning fences and access ways, and designing systems for the safe disposal of surface water can all contribute to decreasing soil erosion. Earthworks on one part of the farm often affects where water runs to on other parts of the farm. 9.3.1 How can water erosion be identified? Observation is an effective technique for identifying where water erosion is taking place, except for identifying the gradual loss of topsoil through sheet erosion. The more severe forms of erosion are highly visible, for example gullies and severe rills are quite obvious. In eroded areas the fine soil particles are often removed, leaving a soil surface consisting mainly of coarse sand and gravels. Pedestals (small pillars of soil usually capped by a stone or a piece of gravel) and the exposure of plant roots are further evidence of erosion. Signs of soil deposition should be looked for. Sediment often builds up at the bottom of the slope, along fence lines, on roads or around the edge of dams. Cloudy water in drainage lines and creeks after rain is another indication that erosion has taken place. While gradual sheet erosion may be virtually imperceptible, the total amount of soil lost through this process may prove greater than that lost from all other forms of erosion on a property. Observations made during rain storm events are often the best means of finding out if soil movement is taking place. Comparisons can also be made of topsoil depth on adjoining cleared and uncleared paddocks. Signs of deposition at the bottom of the slope could also be observed. The Farm Monitoring Handbook (Hunt and Gilkes, 1992) provides a good summary of practical methods of assessing erosion rates. These include troughs to trap sediment, pins to measure soil loss, deposition plates and ways of estimating soil loss from rills and gullies. One technique for estimating gradual soil loss over the long-term (30 years or more) uses Caesium-137. In this technique, the amount of the radio-active isotope Caesium-137 attached to the topsoil is measured and compared with the amount that should be present following the fallout from atmospheric thermonuclear weapons testing conducted since the mid-1950s. The difference provides a guide to the amount of soil lost (Ritchie and McHenry, 1975). This technique can be expensive and, as with any method of measuring soil loss, there is some doubt about the accuracy of the results achieved. However, it is cheaper than establishing long-term plots to measure soil erosion and has the advantage of being able to assess the amount of soil lost over the past 50 years. 9.3.2 What changes can be made to agricultural practices? Farm layout Little consideration was given to the affect of farm layout on the risk of soil erosion when many properties were developed originally. Realigning fences to minimise soil and topographical variation within paddocks enables the landholder to isolate areas that require special management. For example, soils or slopes with a high erosion risk can be cultivated or grazed differently from other parts of the property. Farm infrastructure should be positioned to avoid the channelling of runoff which can initiate erosion. Fence lines should be sited along natural topographic features, such as creeks, rock outcrops, ridges or breakaways. They should be placed at least 10-20 m from the centre of drainage depressions (further if the depression is broad or flat and ill defined). On slopes, fences should runon a slight gradient just off the contour. If fences are to run downslope, they should be placed at right angles to the contour and be situated on spurs so that they do not collect runoff. Paddock corners in cropping areas should not point downslope, as this encourages the formation of headlands which funnel runoff and initiate erosion.
9: Water erosion
-188-
Gateways should be located on relatively high and dry ground away from where water is likely to flow. Laneways should follow ridge lines where possible, and straight downslope if not. Tracks, firebreaks and fences should never run downhill alongside waterways, but along ridges and spurs or on the lower side of grade banks. Firebreaks can be sprayed with herbicides rather than cultivated to reduce the erosion risk. So that stock pads do not develop, watering points should be located where access is not limited (e.g. in the centre of the paddock) or as far upslope in the paddock as possible. Vegetation cover As a general rule, the greater the vegetative cover maintained, the smaller the erosion risk. Vegetation suitable for erosion control may include annual and perennial pastures, crops, stubble, trees and shrubs. They are all necessary parts of the soil ground cover and can be used in appropriate areas. It is especially important to maintain cover in waterways and other areas where surface water flows congregate. Vegetation also has a role to play in controlling waterlogging, which is important because saturated soils are more prone to erosion (see Section 7.3.2). Attention should be paid to fertilising pastures and crops to ensure good growth. With annual pastures, grazing can be managed so that some dry matter remains as cover until the break of the season. Perennial pastures can be sown to maintain ground cover throughout the year, especially from late summer to the break of season when many erosion events occur. Species such as kikuyu (Pennisetum clandestinum), couch (Cynodon dactylon), chicory (Cichorium intybus), Rhodes grass (Chloris gayana), tall wheatgrass (Thinopyrum elongatum), kangaroo grass (Themeda spp.) and wallaby grass (Danthonia spp.) can be used to protect the soil surface and act as sediment traps. Grasses can also be used to stabilise waterways, gullies and landslips. Section 5.3.2 provides more information about suitable perennial pastures species. In broadacre cropping paddocks, ground cover can be maintained by retaining stubble during the summer-autumn thunderstorm period. In combination, trees, shrubs and grasses can be used to reduce soil erosion, the roots helping bind soil together and the foliage reducing the impacts of raindrops. Rows of three or more trees with understory planted on the contour form vegetative buffer strips to trap sediment. Shrubs and trees can be planted near drainage lines to stabilise the streambanks. Trees for planting near drainage lines should be selected carefully, as some species create more problems than they solve. Willows (Salix spp.), often used to bind streambanks with their hard dense roots, may contribute to erosion downstream because the stream velocity increases due to the smooth streambanks the roots create. Willows also drop all of their leaves at once and can de-oxygenate waters, killing native fish and crustaceans. Stock control Grazing management of pastures is as important as the pasture type when controlling erosion. Stocking rates should be managed to retain sufficient pasture cover throughout the year. Overgrazed perennial pastures can be just as susceptible to erosion as annual pastures. Reasonable protection from erosion will be provided even from a good cover of dead annual species if it is maintained until the break of season. Fencing should be used to exclude or limit stock access to areas of high erosion hazard, such as creeks and waterways. Erosion prone paddocks may require lower stocking rates. Access to tree plantings or remnant bush may need to be controlled by fencing as stock will often congregate under trees in paddocks where shelter is limited, removing ground cover and compacting the soil and reducing productivity. Grazing on loamy soils when they are waterlogged often leads to soil compaction, increasing runoff and erosion risk. Fencing is also a way of protecting erosion control structures from stock, ensuring that stock move around earthworks using routes that are least susceptible to erosion. As mentioned above, stock pads are particularly susceptible to erosion, so the layout of each paddock needs to be carefully thought out. Stock tracks cannot be prevented, but dams, troughs and gates can be sited so that the convergence of the pads is not near the base of a long slope or in soil that is particularly susceptible to erosion. Cultivation practices for cropping Only land with suitable characteristics should be cropped. Cultivating steep slopes, waterlogged land, erodible soils and drainage lines or waterways should be avoided.
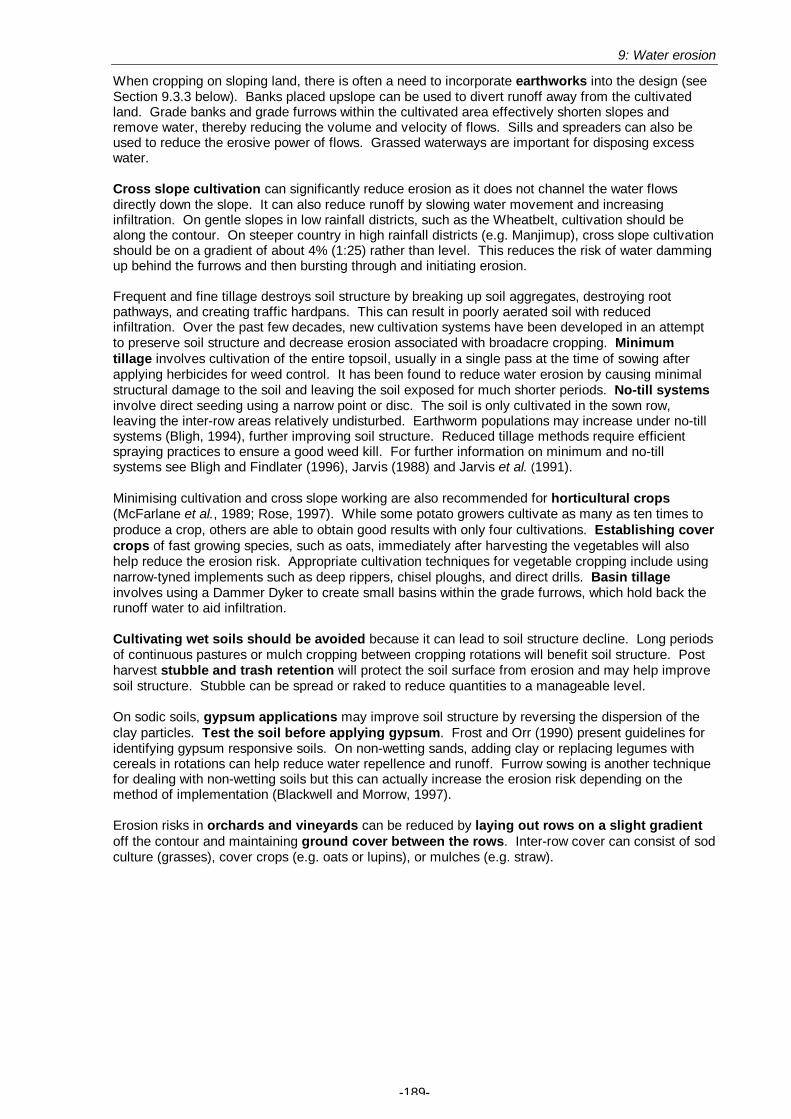
9: Water erosion
-189-
When cropping on sloping land, there is often a need to incorporate earthworks into the design (see Section 9.3.3 below). Banks placed upslope can be used to divert runoff away from the cultivated land. Grade banks and grade furrows within the cultivated area effectively shorten slopes and remove water, thereby reducing the volume and velocity of flows. Sills and spreaders can also be used to reduce the erosive power of flows. Grassed waterways are important for disposing excess water. Cross slope cultivation can significantly reduce erosion as it does not channel the water flows directly down the slope. It can also reduce runoff by slowing water movement and increasing infiltration. On gentle slopes in low rainfall districts, such as the Wheatbelt, cultivation should be along the contour. On steeper country in high rainfall districts (e.g. Manjimup), cross slope cultivation should be on a gradient of about 4% (1:25) rather than level. This reduces the risk of water damming up behind the furrows and then bursting through and initiating erosion. Frequent and fine tillage destroys soil structure by breaking up soil aggregates, destroying root pathways, and creating traffic hardpans. This can result in poorly aerated soil with reduced infiltration. Over the past few decades, new cultivation systems have been developed in an attempt to preserve soil structure and decrease erosion associated with broadacre cropping. Minimum tillage involves cultivation of the entire topsoil, usually in a single pass at the time of sowing after applying herbicides for weed control. It has been found to reduce water erosion by causing minimal structural damage to the soil and leaving the soil exposed for much shorter periods. No-till systems involve direct seeding using a narrow point or disc. The soil is only cultivated in the sown row, leaving the inter-row areas relatively undisturbed. Earthworm populations may increase under no-till systems (Bligh, 1994), further improving soil structure. Reduced tillage methods require efficient spraying practices to ensure a good weed kill. For further information on minimum and no-till systems see Bligh and Findlater (1996), Jarvis (1988) and Jarvis et al. (1991). Minimising cultivation and cross slope working are also recommended for horticultural crops (McFarlane et al., 1989; Rose, 1997). While some potato growers cultivate as many as ten times to produce a crop, others are able to obtain good results with only four cultivations. Establishing cover crops of fast growing species, such as oats, immediately after harvesting the vegetables will also help reduce the erosion risk. Appropriate cultivation techniques for vegetable cropping include using narrow-tyned implements such as deep rippers, chisel ploughs, and direct drills. Basin tillage involves using a Dammer Dyker to create small basins within the grade furrows, which hold back the runoff water to aid infiltration. Cultivating wet soils should be avoided because it can lead to soil structure decline. Long periods of continuous pastures or mulch cropping between cropping rotations will benefit soil structure. Post harvest stubble and trash retention will protect the soil surface from erosion and may help improve soil structure. Stubble can be spread or raked to reduce quantities to a manageable level. On sodic soils, gypsum applications may improve soil structure by reversing the dispersion of the clay particles. Test the soil before applying gypsum. Frost and Orr (1990) present guidelines for identifying gypsum responsive soils. On non-wetting sands, adding clay or replacing legumes with cereals in rotations can help reduce water repellence and runoff. Furrow sowing is another technique for dealing with non-wetting soils but this can actually increase the erosion risk depending on the method of implementation (Blackwell and Morrow, 1997). Erosion risks in orchards and vineyards can be reduced by laying out rows on a slight gradient off the contour and maintaining ground cover between the rows. Inter-row cover can consist of sod culture (grasses), cover crops (e.g. oats or lupins), or mulches (e.g. straw).

9: Water erosion
-190-
9.3.3 Engineering options Earthworks can be used to reduce the risk of water erosion. They are designed to intercept, divert or retain water before safely disposing of it in natural or “man-made” water bodies. Earthworks can be used to reduce: • the effective slope length, • the peak flows of runoff, and • the velocity of runoff. Grade and level earthworks placed at regular intervals can effectively reduce slope length and gradient by intercepting runoff flowing downslope, diverting it sideways across the slope. They also reduce the velocity and erosivity of the runoff by increasing the distance that it has to flow before reaching the drainage line or waterway. These works usually reduce the peak runoff rate and in some instances the flood peak. Earthworks are designed to work under specific conditions and contain specific volumes and velocities of water. They can lead to more severe erosion if incorrectly designed, built or maintained. Most agricultural structures are designed for an event that occurs once every 5-20 years. That means the structures could be expected to fail once in every 5-20 years on average, but it would also be possible for them to fail on several occasions in a single year if severe conditions are experienced. It is usually more efficient to construct many smaller structures than one large structure, and to design the structure for multiple uses. For example, grassed waterways can be used for flash grazing, contour banks can be planted with trees, and creek lines can be revegetated for use by native fauna. There are numerous different structures that can be built, depending on landscape position, catchment size and whether the water is to be directed or retained. Figure 9.1 provides a guide to selecting the appropriate structure for various situations. There are Farmnotes listed in Section 9.4.1 dealing with most of the structures mentioned below, and Bligh (1989) details some of the design criteria.
Is there a runoff/erosion problem?
Yes
No
Is there asafe waterway?
Yes No
Is there also awaterloggingproblem?
Yes
Seepage interceptor
Can an artificial waterway be constructed that will not erode?
YesNo
Grade banks
drains
Grade banksartificialwaterways
No
Level banksor absorptionbanks
Is recharge aproblem?
Yes No
Banks needpiped outletsto allow discharge.
Allow banks to filland overflow around their ends.
Figure 9.1: Flow chart to help select earthworks for controlling runoff and erosion.

9: Water erosion
-191-
Level banks Level banks (Figure 9.2) are built on upper slopes and are designed to control surface flows where there is no safe way to dispose of the water. Level banks are surveyed and constructed on the contour with a bulldozer. They consist of a bank (typically 100-120 cm high with a base width of up to 4 m) and an uphill channel (typically 30-50 cm deep and 3-6 m wide). Because one or both ends are left open to allow overflow during heavy runoff, these banks must be designed carefully. There is always a risk of erosion if runoff exceeds the bank’s capacity, and the banks can contribute to waterlogging and salinity problems by increasing recharge rates. They can be built in low rainfall districts in the Wheatbelt that have long, gentle slopes (gradients about 3%) and broad, undefined waterways. Here banks should be spaced about 200 m apart. The spacing needs to be reduced drastically on the steep erodible slopes in higher rainfall districts. Level banks can also be constructed right at the base of breakaways and around mallet hills. Regular maintenance is essential and channel blocks should be used where possible to prevent massive failures and excess recharge in highly permeable sections. Piped overflows can be used to move water to a safe disposal area.
Figure 9.2: Cross-sections of level and absorption banks (from Negus, 1991a).

9: Water erosion
-192-
Absorption banks Absorption banks are very similar to level banks, the main difference being that both ends of the bank are turned up to maximise water storage (Figure 9.2). This increases the risk of bank failure and potential recharge rates. Mallet hills (and other steep slopes) in both Woolbelts are the main locations for absorption banks. Like level banks, they must be designed carefully and maintained regularly. Channel blocks and piped overflows can be used to reduce risks the banks breaking. Contour sills Contour sills are shallow channels (Figure 9.3) built by a grader in paddocks used for regular broadacre cropping. They are designed to spread runoff from normal rainfall events and encourage contour cultivation. They reduce the velocity of water flowing down the slope, thus aiding infiltration and reducing the volume of runoff. Contour sills also re-spread channelised flow to prevent rills from forming. They are not designed to store or remove runoff from storm events. The channel is approximately 30 cm deep and 1 m wide and no bank is constructed because the spoil is spread evenly upslope. Though they are constructed mostly on the contour, where slight drainage depressions are present on the slope, contour sills are built on a gradient away from the depression to spread water evenly across the slope. The sills are usually placed about 150-200 m apart to help ensure that contour cropping is practised.
Figure 9.3: Constructing contour sills with a road grader (from Negus, 1985).

9: Water erosion
-193-
Grade banks Grade banks (often referred to as contour banks) are built in the upper to middle part of the landscape and are designed to control surface flows, limiting damage from peak-volume or high runoff events. Grade banks consist of a bank (typically 25-50 cm high with a base width of 2.5-3 m) and an uphill channel (typically 15-30 cm deep and 2.5-3.5 m wide). The bank should have a gradual fall with gradients of 0.2% (2:1,000) to 0.5% (5:1,000) and can be built with a grader, plough or bulldozer (Figure 9.4). They can be up to 1 km long and have a downslope spacing of 50-250 m. It is essential that they direct runoff into a stable waterway.
Figure 9.4: Construction of grade banks (from Negus, 1991b). Grade furrows Grade furrows are small, temporary drains constructed on slopes where vegetable cropping rows run up and down a slope. They are designed to shorten row lengths and quickly remove water from the plot. The furrows are typically 15-20 cm deep and 50 cm wide and should be constructed on gradients ranging from 1.0% (1:100) on sandy soils to 4.5% (9:200) on heavy-textured soils. Furrow length should not exceed 150 m and downslope spacing should be about 20-50 m. It is essential that they flow into grassed waterways to dispose of collected water. Machinery can work over grade furrows which are filled in during harvesting.
Grade furrows removing water from a potato crop in Manjimup after 60 mm rain.

9: Water erosion
-194-
Broad-based banks Broad-based banks are variations of grade or level banks that allow for machinery movement and tillage. They are built by a grader or bulldozer and have flat channels (typically 3-5 m wide), gentle batters with a gradient of around 17% (1:6) and low banks. While broad-based banks are ideal in flatter cropping country with gradients of approximately 3% (3:100), they can be used safely on slopes with gradients of up to 6%. They can be up to 1 km long and have a downslope spacing of 100-250 m. Interceptor drains Reverse seepage interceptor drains can be constructed to control erosion where waterlogging is also a problem. They are suited to duplex soils and can be built with a grader or a bulldozer. A channel is dug through the topsoil and 20-30 cm into the clayey subsoil. This channel collects water sub-surface flow through the highly permeable topsoil. The bank is constructed upslope from the channel, acting as a grade bank to intercept runoff. This reduces the risk of channel silting and decreases the volume and depth of channel flows. The channel is about 75 cm deep (depending on the depth to clay) and 2.5-4.0 m wide while the bank is typically 30-100 cm high with a base width of 2.5-4.0 m. These drains can be built safely on gradients of 0.5-0.8% (5:1,000-8:1,000). They can be up to 500 m long and should have a downslope spacing of 50-150 m. Seepage interceptor drains can be installed above hillside seeps subject to erosion, or upslope from waterlogged footslopes. It is important to have a safe outlet, such as a grassed waterway, for drain discharge. See Section 7.3.3 for a diagram of a reverse interceptor drain. Spreader banks These are designed to check erosive runoff by reducing its velocity and then spreading channelised flow as thin sheet flow across the slope, thereby maximising infiltration and reducing the formation of rills. They are constructed on the contour by a bulldozer or grader working upslope. A channel or sill (typically 2-3 m wide and 15-20 cm deep) is constructed below a bank (which should have a settled height of at least 40 cm and a base width of 2 m). Wide gaps (typically 3-5 m) are constructed in the bank at 100-150 m intervals so the water flows onto the sill at low velocity and spreads out before continuing to flow downslope. The use of spreader banks should be restricted to slopes with gradients of less than 3% on cultivated land, and slopes with gradients of less than 5% on pastured land. They should not be constructed on slopes that receive large volumes of runoff unless earthworks to reduce the runoff have been installed upslope. Diversion spreader banks Diversion spreader banks consist of grade banks running into spreader banks. They are designed to divert water out of a natural flow line and spread it out across the adjacent hill slope. They consist of a grade bank which diverts water away from the flow line and flows into a spreader bank which allows the water to be disposed of evenly across the slope. An alternative for small catchments where water flows are higher than drainage lines can handle, is for the diversion grade bank to shift the water into adjacent catchments where it will do less damage. These banks are usually bigger than normal grade banks and should be designed with care. Level sill outlets Level sill outlets can be used to reduce the velocity and erosive power of water discharging from drains to allow it to enter waterways without eroding. They are most needed where the waterway has steep sides or where erosion has commenced. The outflow from a bank or drain is dispersed by entering the sill. The sill is a level channel which is about 30-45 cm deep, at least 15 m long and the same width as the channel of the bank or drain. The water should overflow gently along the length of the sill. The sill and the area downslope must be protected from disturbance by livestock or traffic.

9: Water erosion
-195-
Waterways Waterways are an essential component of any earthworks system designed to divert runoff and sub-surface flows. They can either be natural drainage lines or artificially constructed waterways. Waterways should be protected by natural vegetation or permanent pastures. Where conditions are suitable, perennial species should be used to ensure protection all year round. Cultivation or over grazing of waterways must be avoided and care needs to be taken to avoid the formation of stock pads. Vehicular traffic across the waterways should be minimised and driving along the waterway avoided totally. Artificial waterways are installed to transport excess water safely from grade banks, grade furrows and interceptor drains. Waterways run up and down a slope (not on a surveyed gradient) and should be designed so that they can handle peaks flows. The channel should have a broad, flat or slightly dished floor, with the aim being to ensure that flow depths are about 15 cm. Leveed waterways can be constructed on slopes where there is no natural flow line for water. The levee banks should have a compacted freeboard of 20 cm above peak flow depth. Gully control Reducing the velocity of runoff by decreasing the gradients on which it flows is an essential step in gully control. Gully head sills can be constructed to prevent water flows from entering at the gully head where the most active erosion is occurring. They consist of a large level bank (check bank) which diverts water away from the gully head. A level sill outlet is constructed at either end of the bank so that the water is dispersed and flowing at low velocity as it enters the gully over the sidewalls. Other methods that can be used for gully control include: • flumes, consisting of an inlet, chute and outlet to carry water into the gully without causing further
erosion. These can be constructed of vegetated earth, rock or concrete, • hay bales anchored to the stream bed with star pickets which help to trap sediment, • drains to remove excess water and decrease soil erodibility by reducing waterlogging, and • gully filling, using a road grader. This reduces the velocity of water by returning the land surface
to a higher and widening the channel.
Deep rilling or minor gullying in a Manjimup potato crop. These rills have now been repaired and are no longer visible.

9: Water erosion
-196-
9.4 SOURCES OF FURTHER INFORMATION
9.4.1 Useful publications See Appendix 1 for contact details of the publishing organisations. Available from Agriculture Western Australia: Preventing erosion and soil structure decline: A soil management practices guide for horticultural farmers in the South West high rainfall hills (Rose, 1997) has chapters explaining management techniques that have been demonstrated to be effective in the south-west. These include farm planning, surface water control earthworks, seeding of waterways, irrigation, cover crops and cultivation practices. Also included is a chapter on techniques not yet proven in the local environment, including permanent beds, straw mulching and power harrows. Soilguide. A handbook for understanding and managing agricultural soils contains a chapter titled Runoff and Water Erosion (Coles and Moore, 1998) which provides a way to estimate potential soil loss and discusses management options (with a special emphasis on contour no-till cropping). The chapter titled Soil structure decline (Needham et al., 1998) summarises the principles of soil structure which affect soil erodibility and discusses management options to overcome these problems. Common conservation works used in Western Australia (Keen, 1998) provides notes on design, construction and variables leading to risk of degradation or failure for a variety of conservation works including banks, leveed waterways and gull control structures. Soil conservation earthworks design manual (Bligh, 1989) has sections covering rainfall intensity, runoff rates and volumes, waterways, grade banks, level and absorption banks and water spreading structures. NOTE: this Earthworks Design Manual is listed as being for use by staff of Agriculture Western Australia only. A revised version of this manual should be available in 2001. Managing for stubble retention (Leonard, 1993) provides a guide to selecting stubble levels for erosion control and the management and handling of stubble. Pasture management for small landholders (Angell and Parlevliet, 1997) provides guidelines for managing pastures to ensure good ground cover and minimise erosion risks. It is specifically aimed at small landholders with limited agricultural experience. Relevant Agriculture Western Australia Farmnotes include: Erosion prevention
59/82 Cereal rye – a crop for stabilising erosion-prone soils 13/86 General principles for control of erosion and sedimentation in Special Rural Zones 15/86 An introduction to conservation farm planning
102/88 Fitting trees into the farm plan 52/89 Preventing soil erosion and tree damage on small holdings 21/91 Landcare at low or no cost 31/91 Tree planting for erosion and salt control 97/91 Taxation and the control of land degradation 26/93 How to prevent farm track erosion 26/93 How to prevent firebreak erosion 28/93 How to prevent headland erosion 29/93 How to prevent stock pad erosion 25/95 Oversowing pasture to avoid autumn feed shortage in high rainfall areas 63/96 Farmer to farmer - Landcare case studies; Farming with environmental benefits
109/96 Managing water repellent soils 110/96 Assessing water repellence 111/96 Furrow sowing for improved crops and pastures on water repellent soils 14/97 Claying water repellent soils 4/99 Regulation 4, covering land clearing
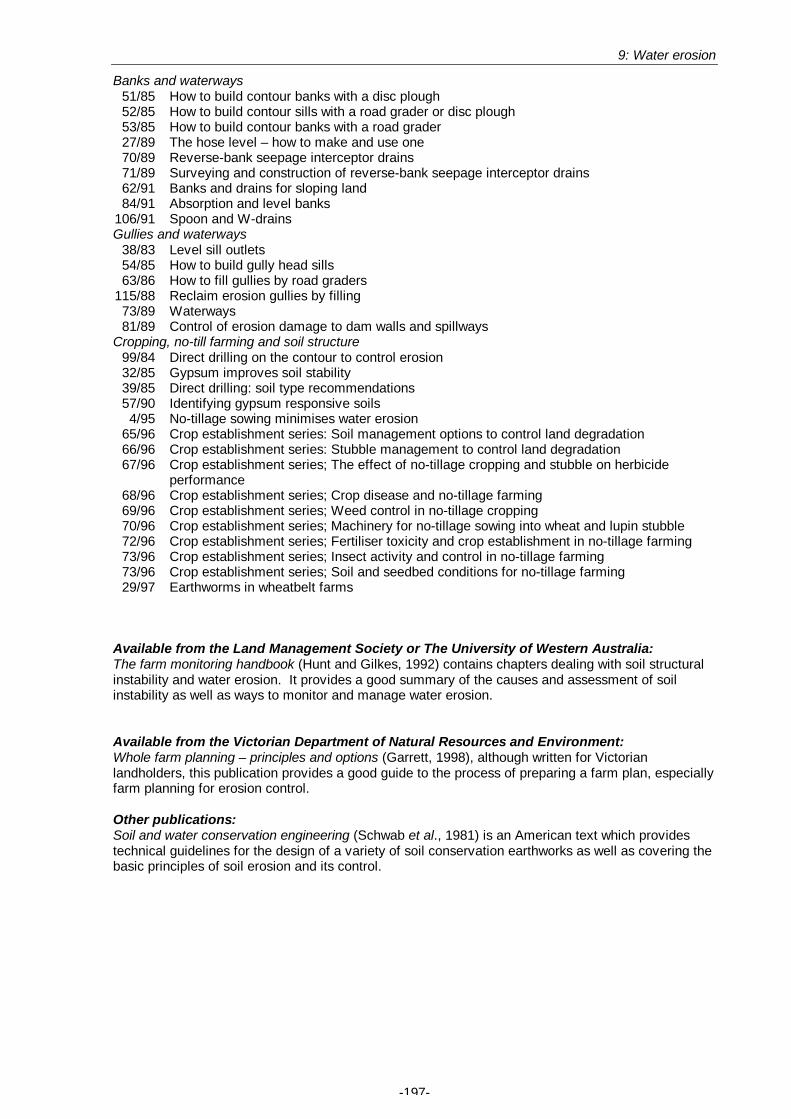
9: Water erosion
-197-
Banks and waterways 51/85 How to build contour banks with a disc plough 52/85 How to build contour sills with a road grader or disc plough 53/85 How to build contour banks with a road grader 27/89 The hose level – how to make and use one 70/89 Reverse-bank seepage interceptor drains 71/89 Surveying and construction of reverse-bank seepage interceptor drains 62/91 Banks and drains for sloping land 84/91 Absorption and level banks
106/91 Spoon and W-drains Gullies and waterways
38/83 Level sill outlets 54/85 How to build gully head sills 63/86 How to fill gullies by road graders
115/88 Reclaim erosion gullies by filling 73/89 Waterways 81/89 Control of erosion damage to dam walls and spillways
Cropping, no-till farming and soil structure 99/84 Direct drilling on the contour to control erosion 32/85 Gypsum improves soil stability 39/85 Direct drilling: soil type recommendations 57/90 Identifying gypsum responsive soils 4/95 No-tillage sowing minimises water erosion
65/96 Crop establishment series: Soil management options to control land degradation 66/96 Crop establishment series: Stubble management to control land degradation 67/96 Crop establishment series; The effect of no-tillage cropping and stubble on herbicide
performance 68/96 Crop establishment series; Crop disease and no-tillage farming 69/96 Crop establishment series; Weed control in no-tillage cropping 70/96 Crop establishment series; Machinery for no-tillage sowing into wheat and lupin stubble 72/96 Crop establishment series; Fertiliser toxicity and crop establishment in no-tillage farming 73/96 Crop establishment series; Insect activity and control in no-tillage farming 73/96 Crop establishment series; Soil and seedbed conditions for no-tillage farming 29/97 Earthworms in wheatbelt farms
Available from the Land Management Society or The University of Western Australia: The farm monitoring handbook (Hunt and Gilkes, 1992) contains chapters dealing with soil structural instability and water erosion. It provides a good summary of the causes and assessment of soil instability as well as ways to monitor and manage water erosion. Available from the Victorian Department of Natural Resources and Environment: Whole farm planning – principles and options (Garrett, 1998), although written for Victorian landholders, this publication provides a good guide to the process of preparing a farm plan, especially farm planning for erosion control. Other publications: Soil and water conservation engineering (Schwab et al., 1981) is an American text which provides technical guidelines for the design of a variety of soil conservation earthworks as well as covering the basic principles of soil erosion and its control.
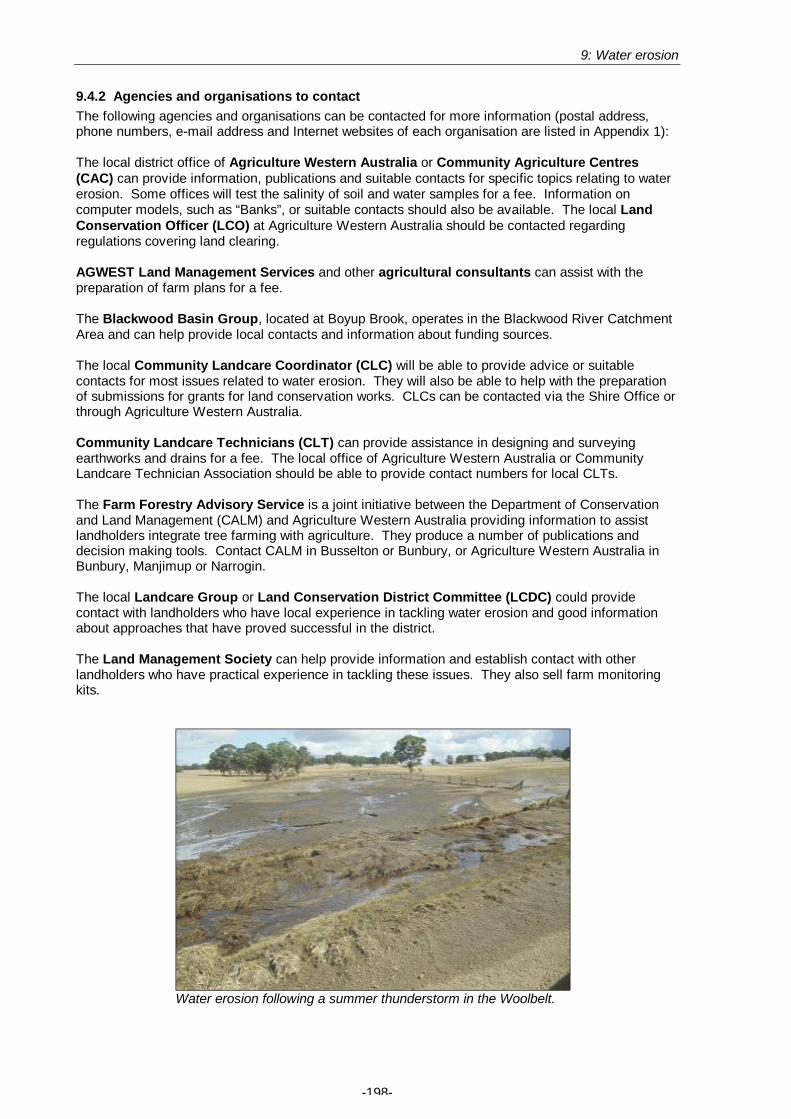
9: Water erosion
-198-
9.4.2 Agencies and organisations to contact The following agencies and organisations can be contacted for more information (postal address, phone numbers, e-mail address and Internet websites of each organisation are listed in Appendix 1): The local district office of Agriculture Western Australia or Community Agriculture Centres (CAC) can provide information, publications and suitable contacts for specific topics relating to water erosion. Some offices will test the salinity of soil and water samples for a fee. Information on computer models, such as “Banks”, or suitable contacts should also be available. The local Land Conservation Officer (LCO) at Agriculture Western Australia should be contacted regarding regulations covering land clearing. AGWEST Land Management Services and other agricultural consultants can assist with the preparation of farm plans for a fee. The Blackwood Basin Group, located at Boyup Brook, operates in the Blackwood River Catchment Area and can help provide local contacts and information about funding sources. The local Community Landcare Coordinator (CLC) will be able to provide advice or suitable contacts for most issues related to water erosion. They will also be able to help with the preparation of submissions for grants for land conservation works. CLCs can be contacted via the Shire Office or through Agriculture Western Australia. Community Landcare Technicians (CLT) can provide assistance in designing and surveying earthworks and drains for a fee. The local office of Agriculture Western Australia or Community Landcare Technician Association should be able to provide contact numbers for local CLTs. The Farm Forestry Advisory Service is a joint initiative between the Department of Conservation and Land Management (CALM) and Agriculture Western Australia providing information to assist landholders integrate tree farming with agriculture. They produce a number of publications and decision making tools. Contact CALM in Busselton or Bunbury, or Agriculture Western Australia in Bunbury, Manjimup or Narrogin. The local Landcare Group or Land Conservation District Committee (LCDC) could provide contact with landholders who have local experience in tackling water erosion and good information about approaches that have proved successful in the district. The Land Management Society can help provide information and establish contact with other landholders who have practical experience in tackling these issues. They also sell farm monitoring kits.
Water erosion following a summer thunderstorm in the Woolbelt.

9: Water erosion
-199-
9.5 REFERENCES
Angell, K. and Parlevliet, G. (1997). ‘Pasture management for small landholders’. Agriculture Western Australia.
Blackwell, P. and Morrow, G. (1997). Furrow sowing on water repellent soils. Agriculture Western Australia, Bulletin No. 4333.
Bligh, K.J. (1989). ‘Soil conservation earthworks design manual’. Department of Agriculture Western Australia (internal document).
Bligh, K.J. (1994). No-tillage sowing decreases water erosion on loamy soils and increases earthworm activity. Journal of Agriculture Western Australia 35: 47-50.
Bligh, K.J. and Findlater, P. (1996). No-tillage sowing helps keep cropland soils in place. Journal of Agriculture Western Australia 37: 50-55.
Coles, N. and Moore, G. (1998). Runoff and water erosion. In: ‘Soilguide - A handbook for understanding and managing agricultural soils’. (ed. G. Moore). Agriculture Western Australia, Bulletin No. 4343. pp. 223-242.
Flannery, T.F. (1994). The future eaters: an ecological history of the Australasian lands and people. Reed Books, Melbourne.
Frost, F. and Orr, G. Identifying gypsum responsive soils. Agriculture Western Australia Farmnote 57/90. Garrett, B.K. (1998). ‘Whole farm planning - principles and options’. Department of Conservation and
Environment, Melbourne. Hunt, N. and Gilkes, R. (1992). ‘Farm monitoring handbook - a practical down-to-earth manual for farmers and
other land users’. The University of Western Australia. Jarvis, R. (1988). Tillage systems and soil stability. Journal of Agriculture Western Australia 29: 54-57. Jarvis, R., Perry, M.W., Porritt, S. and White, P. (1991). Tillage. In: The wheat book. Western Australian
Department of Agriculture, Bulletin 4196. pp. 117-132. Keen, M.G. (1998). Common conservation works used in Western Australia. Agriculture Western Australia,
Resource Management Technical Report No. 185. Leonard, L. (1993). Managing for stubble retention. Department of Agriculture Western Australia, Bulletin No.
4271. McFarlane, D.J. (1984). Water erosion on potato land during the 1983 growing season, Donnybrook. Western
Australian Department of Agriculture, Division of Resource Management Technical Report No. 26. McFarlane, D.J., Davies, J.R. and Wescott, T. (1986). Rainfall erosivity in Western Australia. In: ‘Hydrology
and water resources symposium.’ Institution of Engineers, Australia, Brisbane, November 25-27. pp. 350-351.
McFarlane, D.J., Delroy, N., Gratte, H.V.B., Middlemas, J.P., van Vreeswyk, A.M.E. and McKissock, I. (1989). Water erosion on vegetable growing land in south Western Australia. Western Australian Department of Agriculture, Division of Resource Management Technical Report No. 107.
McFarlane, D.J., Loughran, R.J. and Campbell, B.L. (1992). Soil erosion of agricultural land in Western Australia estimated by caesium-137. Australian Journal of Soil Research 30: 533-546.
McFarlane, D.J., George, R.J., Loughran, R.J., Elliot, G.L., Ryder, A.T., Bennett, D.L. and Tille, P.J. (2000). A national reconnaissance survey of soil erosion in Australia: Western Australia – A report for the Australian National Landcare Program, Department of Primary Industry and Energy. The University of Newcastle, NSW.
McGhie, D.A. (1980). The contribution of mallet hill surface to runoff and erosion in the Narrogin region of Western Australia. Australian Journal of Soil Research 18: 299-307.
Morgan, R.P.C. (1986). ‘Soil erosion and conservation’. John Wiley & Sons, New York. Needham, P., Moore, G. and Scholz, G. (1998). Soil structure decline In: ‘Soilguide - A handbook for
understanding and managing agricultural soils’. (ed. G. Moore). Agriculture Western Australia, Bulletin No. 4343. pp. 64-79.
Negus, T.R. (1984). Direct drilling on the contour to control erosion. Western Australian Department of Agriculture, Farmnote No. 99/84.
Negus, T.R. (1985). How to build contour sills with a road grader or disc plough. Western Australian Department of Agriculture, Farmnote No. 52/85.
Negus, T.R. (1991a). Absorption and level banks. Western Australian Department of Agriculture, Farmnote No. 84/91.
Negus, T.R. (1991b). Banks and drains for sloping land. Western Australian Department of Agriculture, Farmnote No. 62/91.
Ritchie, J.C. and McHenry, J.R. (1975). Fallout Cs-137: a tool in conservation research. Journal Soil and Water Conservation 30: 283-286.
Rose, B. (1997). Preventing erosion and soil structure decline: a soil management practices guide for horticultural farmers in the south west high rainfall hills. Agriculture Western Australia, Miscellaneous Publication No. 23/97.
Schwab, G.O., Frevert, R.K., Edminster, T.W. and Barnes, K.K. (1981). ‘Soil and water conservation engineering’ (3rd edition). John Wiley and Sons, New York.
van Moort, J.C.P., George, R.J., Tille, P.J. and Elliot, G.L. (1994). Soil loss in the south-west of Western Australia as determined by caesium-137. In: ‘Soils '94’ - Proceedings of the Third Triennial Western Australian Soil Science Conference. pp. 199-205.

10: Mass movement
-200-
10. MASS MOVEMENT
10.1 INTRODUCTION
10.1.1 What is mass movement? Mass movement is a term applied to forms of erosion where gravity (rather than water or wind) is the primary agent of soil movement. Mass movement often involves the rapid displacement of large volumes of soil and surface material. Although gravity is the primary agent of mass movement, hydrological processes are usually a major contributing factor. It is for this reason that mass movement has been included in this manual. Saturation of sub-surface materials plays a major role in initiating mass movement. Mass movement may occur on natural slopes or areas of soil deposition (e.g. dam walls). Forms of mass movement include landslides, soil creep, earth flows, avalanches and subsidence (see Figure 10.1). Landslides occur where a mass of material moves downslope, sliding over the underlying material. Types of landslides include landslips and slumps. During a landslip, soil and the underlying weathered material slides downslope along a plane of weakness. Slumps differ from landslips in that the mass of material rotates against a horizontal axis. While landslides tend to occur fairly rapidly, soil creep involves the slow movement of surface soil downslope. Earthflows occur where saturated earth moves like a viscous fluid. Avalanches involve an extremely rapid downhill movement of surface materials, often including soil, weathered material and/or rock. These materials usually become rearranged in the process. Subsidence occurs where ground overlying a sub-surface cavity, such as a cave or mine, collapses. It may also be caused by the over pumping of an underlying aquifer. Some of these forms of mass movement move occur together, for example it is quite common for a small earthflow to be present at the foot of a slump. 10.1.2 What causes mass movement? Mass movement occurs when the gravitational stress acting on the land’s surface exceeds the resistance of the surface materials to dislodgement. The occurrence of mass movement depends upon the interaction of various factors including landform, soil type, the nature of the underlying rocks, rainfall intensity and duration, drainage characteristics, vegetation cover and human intervention (Houghton and Charman, 1986). Two common situations leading to mass movement are; (i) The increase in shearing stress of a slope without a change in the shearing resistance. A typical example is when development, such as road construction, increases the average slope by cutting into the side of a hill. The forces (stresses) applied through gravity on the materials comprising the cutting wall are greater because the slope is steeper. (ii) An unaltered shearing stress with a change in the shearing resistance of the slope. For example, a increase in the water content of the soil on the slope increases the pore water pressure which in turn decreases the bonding of the soil and its ability to resist the downslope pull of gravity. Mass movement is a natural process, but is greatly accelerated by land clearing. The two main reasons for the increased risk following the removal of native vegetation and its replacement by pastures are: • the death of tree and shrub roots which help bind the soil and hold it against shearing
stresses, and • reduced plant water use leading to increased soil saturation, waterlogging and rising water
tables (see Sections 5.1.2 and 7.1.2). Water is often the major factor initiating mass movement and so it is most likely to happen following periods of high rainfall. When soils and weathered material become saturated they become heavier because water replaces the air in the soil pores and cavities. The additional weight of the water increases the shearing stress on a slope, while the shearing resistance of the material decreases as it becomes wet. Mass movement typically occurs on steeper slopes where the force of gravity increases the shearing stress. Deep soils and deeply weathered profiles are also prone to mass movement because there is
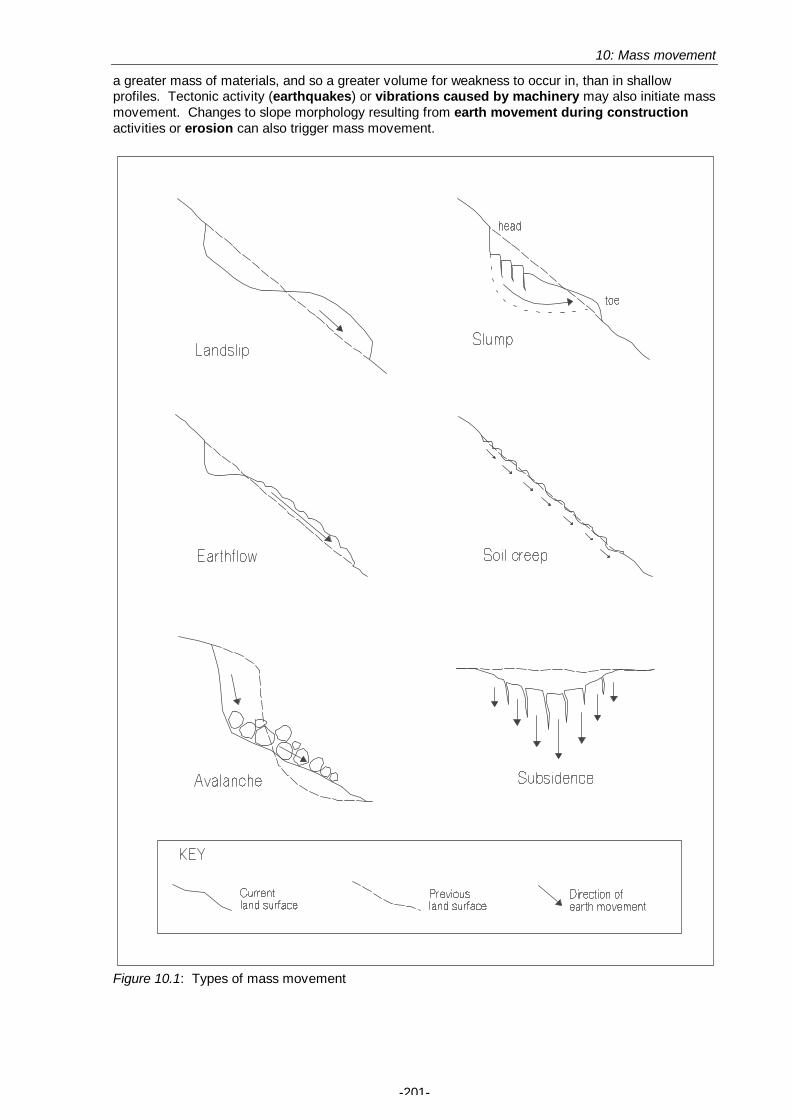
10: Mass movement
-201-
a greater mass of materials, and so a greater volume for weakness to occur in, than in shallow profiles. Tectonic activity (earthquakes) or vibrations caused by machinery may also initiate mass movement. Changes to slope morphology resulting from earth movement during construction activities or erosion can also trigger mass movement.
Figure 10.1: Types of mass movement
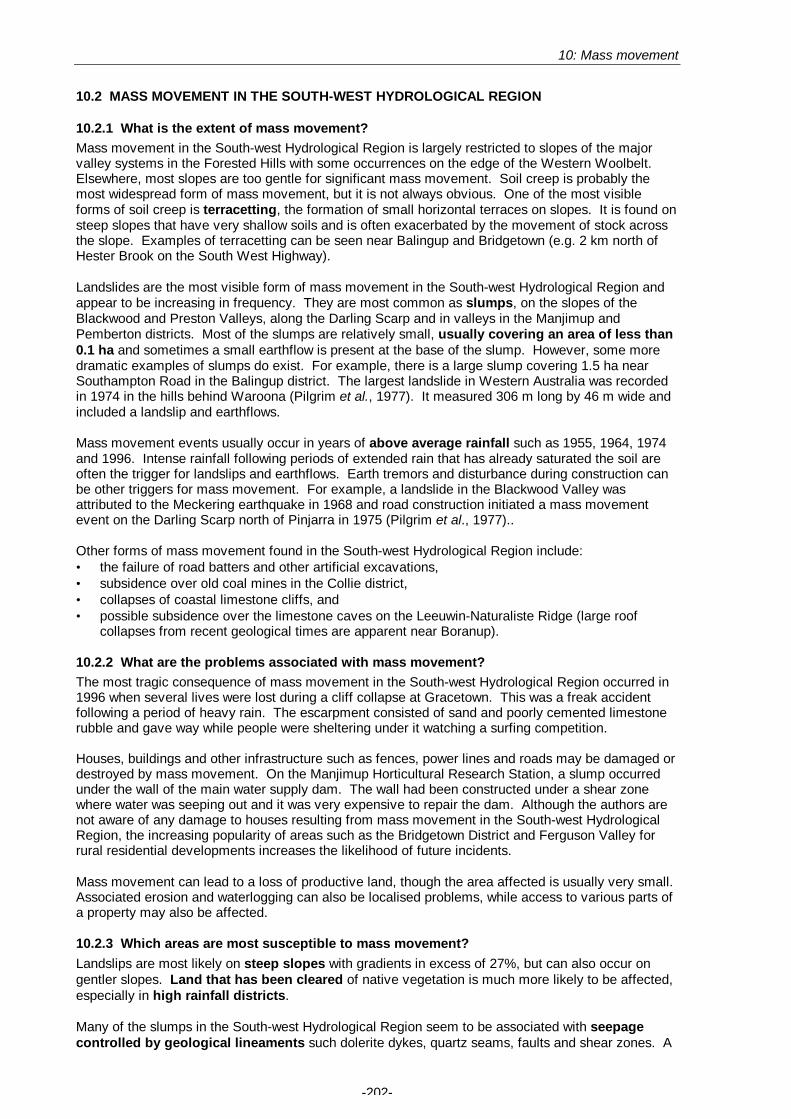
10: Mass movement
-202-
10.2 MASS MOVEMENT IN THE SOUTH-WEST HYDROLOGICAL REGION
10.2.1 What is the extent of mass movement? Mass movement in the South-west Hydrological Region is largely restricted to slopes of the major valley systems in the Forested Hills with some occurrences on the edge of the Western Woolbelt. Elsewhere, most slopes are too gentle for significant mass movement. Soil creep is probably the most widespread form of mass movement, but it is not always obvious. One of the most visible forms of soil creep is terracetting, the formation of small horizontal terraces on slopes. It is found on steep slopes that have very shallow soils and is often exacerbated by the movement of stock across the slope. Examples of terracetting can be seen near Balingup and Bridgetown (e.g. 2 km north of Hester Brook on the South West Highway). Landslides are the most visible form of mass movement in the South-west Hydrological Region and appear to be increasing in frequency. They are most common as slumps, on the slopes of the Blackwood and Preston Valleys, along the Darling Scarp and in valleys in the Manjimup and Pemberton districts. Most of the slumps are relatively small, usually covering an area of less than 0.1 ha and sometimes a small earthflow is present at the base of the slump. However, some more dramatic examples of slumps do exist. For example, there is a large slump covering 1.5 ha near Southampton Road in the Balingup district. The largest landslide in Western Australia was recorded in 1974 in the hills behind Waroona (Pilgrim et al., 1977). It measured 306 m long by 46 m wide and included a landslip and earthflows. Mass movement events usually occur in years of above average rainfall such as 1955, 1964, 1974 and 1996. Intense rainfall following periods of extended rain that has already saturated the soil are often the trigger for landslips and earthflows. Earth tremors and disturbance during construction can be other triggers for mass movement. For example, a landslide in the Blackwood Valley was attributed to the Meckering earthquake in 1968 and road construction initiated a mass movement event on the Darling Scarp north of Pinjarra in 1975 (Pilgrim et al., 1977).. Other forms of mass movement found in the South-west Hydrological Region include: • the failure of road batters and other artificial excavations, • subsidence over old coal mines in the Collie district, • collapses of coastal limestone cliffs, and • possible subsidence over the limestone caves on the Leeuwin-Naturaliste Ridge (large roof
collapses from recent geological times are apparent near Boranup). 10.2.2 What are the problems associated with mass movement? The most tragic consequence of mass movement in the South-west Hydrological Region occurred in 1996 when several lives were lost during a cliff collapse at Gracetown. This was a freak accident following a period of heavy rain. The escarpment consisted of sand and poorly cemented limestone rubble and gave way while people were sheltering under it watching a surfing competition. Houses, buildings and other infrastructure such as fences, power lines and roads may be damaged or destroyed by mass movement. On the Manjimup Horticultural Research Station, a slump occurred under the wall of the main water supply dam. The wall had been constructed under a shear zone where water was seeping out and it was very expensive to repair the dam. Although the authors are not aware of any damage to houses resulting from mass movement in the South-west Hydrological Region, the increasing popularity of areas such as the Bridgetown District and Ferguson Valley for rural residential developments increases the likelihood of future incidents. Mass movement can lead to a loss of productive land, though the area affected is usually very small. Associated erosion and waterlogging can also be localised problems, while access to various parts of a property may also be affected. 10.2.3 Which areas are most susceptible to mass movement? Landslips are most likely on steep slopes with gradients in excess of 27%, but can also occur on gentler slopes. Land that has been cleared of native vegetation is much more likely to be affected, especially in high rainfall districts. Many of the slumps in the South-west Hydrological Region seem to be associated with seepage controlled by geological lineaments such dolerite dykes, quartz seams, faults and shear zones. A

10: Mass movement
-203-
typical example is where there are two dykes running diagonally across a hillslope. Both capture throughflow running down the slope and channel it to the point where the dykes meet. Here the water is forced to the surface and the saturated soil can slump rapidly in response to small additions of water. Many of the landslides occur on slopes with a relatively shallow depth to bedrock (2-5 m) because these soils saturate quickly as throughflow (or groundwater flow) from upslope is forced towards the surface. Shallow soils around rock outcrops are often prone to mass movement as well. The subsoil is often an unstable clay or saprock with prominent biotite or types of mica. The top of valley slopes on the edge of plateau areas is another situation prone to mass movement. It is in these areas the water that has percolated into the deeply weathered profiles over a large area of the plateau surface often discharges. Added pressure such as that resulting from vehicular traffic, trampling by livestock, the weight of buildings or the weight of water stored in dams will increase the likelihood of mass movement in susceptible areas. Earthmoving or the removal of soil and other materials during construction work add to the risk. Mass movement is common on road cuttings and earth walls. 10.2.4 Mass movement research in the South-west Hydrological Region Very little, if any, research has been conducted into mass movement in the South-west Hydrological Region. Pilgrim et al. (1977) undertook the most detailed study which covered the Waroona earth flow. The Donnybrook-Balingup Land Conservation District and Agriculture Western Australia have initiated several minor investigations recently. Main Roads and Agriculture Western Australia have been investigating methods of stabilising and repairing areas affected by mass movement. 10.3 MANAGING MASS MOVEMENT
One of the most important tactics for preventing mass movement and stabilising affected areas, is ensuring that subsoils on susceptible slopes do not become saturated. If present, native vegetation should be retained on slopes where mass movement is likely. Revegetation upslope of susceptible areas is also advisable. Fencing susceptible areas to prevent stock access is important. There may also be a role for earthworks to divert water away from unstable slopes or for pumping of groundwater to dry out subsoils. Constructing roads, buildings or dams on susceptible areas should be avoided. Where soil is excavated, the angle of the side batters created should be small enough to prevent failure. 10.3.1 How can mass movement be identified? Recent landslips, slumps and earthflows are usually rather obvious. Areas previously affected by mass movement may become smoothed out and grassed over, but the land surface will still show signs of disturbance, often being very uneven and hummocky or lumpy. The presence of terracetts is a good indication of soil creep. Identifying areas in which mass movement is likely in the future may require a little more effort. Cracks and fissures may appear on the soil surface before landslips commence. Factors such as landscape position, slope gradients, geological structures, soil materials, land use and time since clearing are all important in determining the risk of mass movement. Pilgrim and Conacher (1974) identified a threshold slope of 27% as being essential for earthflows in the Chittering Valley, but mass movement can occur on gentler slopes (gradients above 10%) where the conditions discussed in Section 10.2.3 apply. Any steep slopes subject to waterlogging or seepage should be treated with suspicion. Identifying geological lineaments will also aid in determining where there is a risk of mass movement. This is especially important if some form of building or construction is planned on the slope. In such cases, expert advice should be considered. The cost involved in properly investigating a site prior to construction is minor in comparison to the losses if earth movement does occur. Damage to buildings, failure of farm dams or cutting of access roads can all have major consequences and be very expensive to repair. Geotechnical assessments carried out by engineering and hydrological consultants can involve drilling to determine water table depths, hydraulic pressure and the nature of the soils. Tests of soil strength and stability will also provide valuable information. The geology can be mapped to
10: Mass movement
-204-
identify fault lines, shear zones, dykes and other geological lineaments that influence slope stability. This could be done from aerial photographs or with the aid of tools such as a magnetometer. 10.3.2 What changes can be made to agricultural practices? Any activities that increase disturbance on or above areas of potential mass movement should be avoided. Poorly located roads, dams and buildings can contribute to mass movement. Vehicular movement and livestock trampling can also destabilise areas. In many cases, increasing water use on the slope will significantly reduce the risk of mass movement. This can be achieved by planting trees or shrubs upslope of susceptible areas. Larger trees should only be planted on stable areas because their weight will add to the shear stress on the slope. In addition, tall trees can exert considerable forces on the soil on windy days as they sway back and forth, further adding to soil instability. Major tree plantings on the lateritic plateau (upland gravelly flats) above the slope would often be preferable. These areas are stable, usually have soils suitable for growing commercial timber, and can be the source of a significant proportion of the recharge contributing to seepage downslope. Where geological lineaments are involved, trees can be planted upslope along these features to intercept sub-surface water flows. Where landslides have already occurred treatment should involve fencing and replanting. At least 1 ha upslope from the head of the slide should be fenced off. Current experience suggests that a diamond shaped fence around the affected area, with one corner upslope, one downslope and two on the same contour, is the most appropriate design (see Figure 10.2). This ensures the maximum distance between the landslide and both the top and bottom of the fenced area, reducing the chances of a disturbance upslope (such as stock trampling) triggering another slide and of any further movement damaging the fence downslope. This design will also help divert runoff away from the affected area because stock tracks that develop along the fence line will run diagonally across the slope. Revegetation within the fenced area needs to be planned carefully. To avoid adding extra stress, only low shrubs or perennial grasses should be planted on, and directly above, the head of the slip. Deep-rooted species should be selected to obtain the maximum benefit from root binding and water usage. These could include native shrubs and ground covers such as species of Grevillea, Melaleuca and Callistemon or grasses such as kikuyu, Phalaris or tall fescue. Downslope the height of the plants can increase progressively. As a rule of thumb, the aim should be to select species of trees or shrubs so that their tops grow to a height level with the head of the slip, regardless of where on the slope they are planted (see Figure 10.2). Below the toe of the slip, taller waterlogging tolerant trees can be planted to help prevent continued movement downslope. Suitable species include blackbutt (Eucalyptus patens), bangalay gum (E. botryoides), rose gum (E. grandis), swamp mahogany (E. robusta) and blackwood (Acacia melanoxylon). 10.3.3 Engineering options In some cases it may be appropriate to construct earthworks upslope to divert water away from susceptible areas. Options could include seepage interceptor drains and grade banks (see Sections 7.3.3 and 9.3.3 for more details and diagrams). Groundwater drainage and groundwater pumping to remove excess water are other possibilities that may merit consideration following hydrological investigations. The safe disposal of any drained water needs to be ensured. If the extracted water is fresh, it could be diverted to a storage for stock water or irrigation supplies. Geotechnical advice should be sought before commencing construction work on slopes susceptible to mass movement. This is especially important where excavation is involved, as batter gradients will need to be designed carefully. Roads and tracks should be constructed along ridgelines rather than across slopes in areas prone to mass movement.
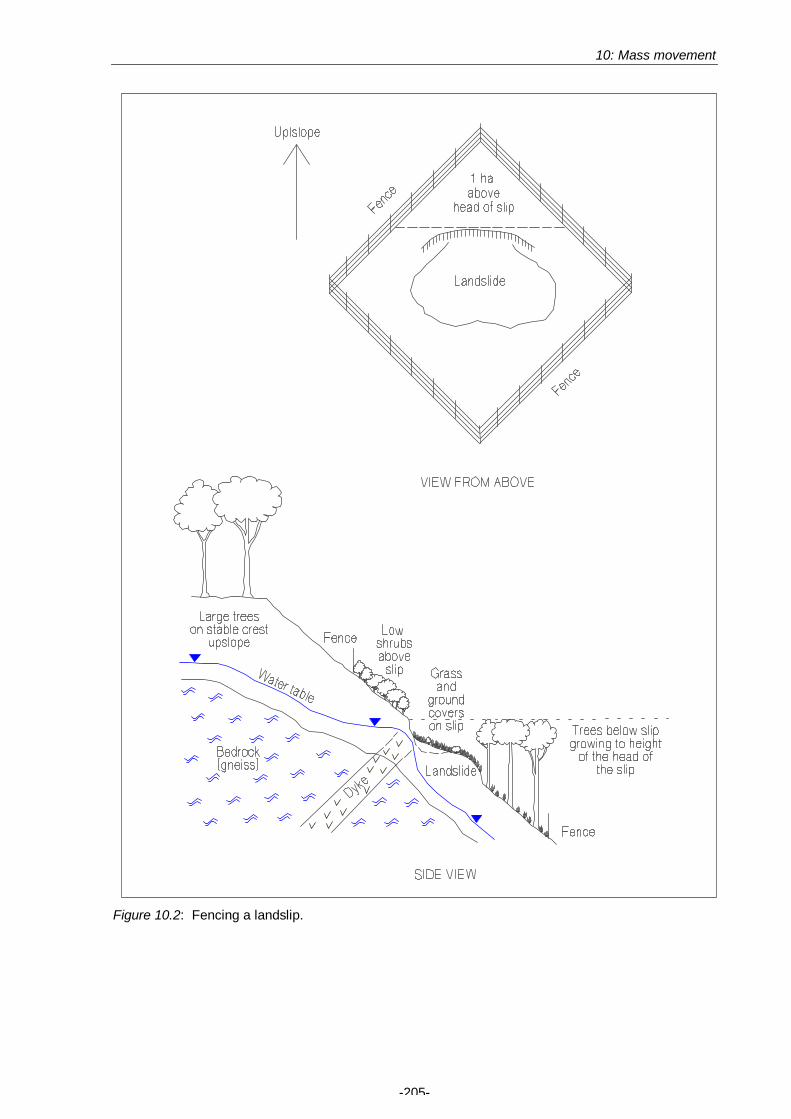
10: Mass movement
-205-
Figure 10.2: Fencing a landslip.

10: Mass movement
-206-
10.4 SOURCES OF FURTHER INFORMATION
10.4.1 Useful publications See Appendix 1 for contact details of the publishing organisations. Available from the Victorian Department of Natural Resources and Environment: Landslips in South Gippsland (Ziebell and Richards, 1993) is a four page pamphlet covering the management of landslips. Available from the New South Wales Department of Land and Water Conservation: How to recognise and treat landslips (Robins and Lines-Kelly, 1992a) is a short pamphlet describing the cause and treatment of landslips in Northern New South Wales. Spring tappers for landslip areas (Robins and Lines-Kelly, 1992b) is a short pamphlet describing the construction of a spring tapping unit for removing seepage from slopes prone to mass movement. Other publications: Introducing Victorian Geology (Cochrane et al., 1991) is a book aimed at high school and university students and contains a chapter titled “Engineering and environmental geology”. This chapter has a good summary of the types of landslides, their causes and prevention, as well as a couple of case studies from Victoria. Soil slope instability and stabilisation (Walker and Fell, 1987) contains a collection of technical papers concentrating on slope stabilisation. There are six papers covering general issues, followed by 17 papers dealing with case studies (mostly from the east coast of Australia). Landslides and their control (Zaruba and Mencl, 1982) is a comprehensive international text covering definitions of various forms of mass movement, the factors causing them and the processes involved, methods of investigating landslides and analysing slope stability, corrective and control measures that can be implemented, and special chapters on dam and road construction. 10.4.2 Agencies and organisations to contact The following agencies and organisations can be contacted for more information (postal address, phone numbers, e-mail address and Internet websites of each organisation are listed in Appendix 1): The local district office of Agriculture Western Australia or Community Agriculture Centres (CAC) can provide information, publications and suitable contacts for specific topics relating to mass movement. Some offices will test the salinity of soil and water samples for a fee. Information on computer models, such as “AgET”, “Pumps”, “Drains” and “Banks”, or suitable contacts should also be available. The local Land Conservation Officer (LCO) at Agriculture Western Australia should be contacted regarding regulations covering land clearing or drainage. The local Community Landcare Coordinator (CLC) will be able to provide advice or suitable contacts for most issues related to mass movement. They will also be able to help with the preparation of submissions for grants for land conservation works. CLCs can be contacted via the Shire Office or through Agriculture Western Australia. The Donnybrook-Balingup Land Conservation District Committee (LCDC) could provide contact with landholders who have local experience in mass movement. Geotechnical and engineering consultants can assess soil and slope stability and prepare development plans.

10: Mass movement
-207-
10.5 REFERENCES
Cochrane, G.W., Quick, G.W. and Spencer-Jones, D. (editors) (1991). ‘Introducing Victorian Geology’. Victorian Division of the Geological Society of Australia, Melbourne.
Houghton, P.D. and Charman, P.E.V. (1986). ‘Glossary of terms used in soil conservation’. Soil Conservation Service of New South Wales.
Pilgrim, A.T. and Conacher, A.J. (1974). Causes of earthflows in the Southern Chittering Valley, WA. Australian Geographical Studies 12: 38-56.
Pilgrim, A.T., Shields, D. and Tutt, K. (1977). A description of the morphology and causal factors of an earthflow near Waroona, Western Australia. Western Geographer 2: 42-53.
Robins, M. and Lines-Kelly, R. (1992a). How to recognise and treat landslips. Soil Sense Leaflet No. 12/92. Department of Conservation and Land Management, Casino, NSW.
Robins, M. and Lines-Kelly, R. (1992b). Spring tappers for landslip areas. Soil Sense Leaflet No. 13/92. Department of Conservation and Land Management, Casino, NSW.
Walker, B.F. and Fell, R. (editors) (1987). ‘Soil slope instability and stabilisation’. Balkema, Rotterdam, The Netherlands.
Zaruba, Q. and Mencl, V. (1982). ‘Landslides and their control. Developments in Engineering 31’. Elsevier Scientific Publishing, Amsterdam, The Netherlands.
Ziebell, D. and Richards, P. (1993). Landslips in South Gippsland. Landcare Notes Series No. SC0041. Natural Resources and Environment, Melbourne.
11: Eutrophication
-208-
11. NUTRIENT LOSS AND EUTROPHICATION
11.1 INTRODUCTION
11.1.1 What are nutrient loss and eutrophication? A nutrient is a mineral substance absorbed by the roots of a plant or ingested by an animal for nourishment. Plants and animals need macro-nutrients in large quantities and the micro-nutrients in very small quantities. Macro-nutrients include nitrogen (N), phosphorus (P), sulphur (S), potassium (K), calcium (Ca) and magnesium (Mg). Micro-nutrients (often referred to as trace elements) include iron (Fe), copper (Cu), zinc (Zn), manganese (Mn), boron (B) and molybdenum (Mo). Nutrient loss refers to the removal of nutrients from an ecological or farming system. In farming systems, a significant proportion of these nutrients are present as a result of the application of fertilisers. Nutrient loss from farming systems occurs via the hydrological cycle (transported by water) or by the removal of farm produce (e.g. sending milk, meat or grain to markets). Nutrients are present in ecosystems in a variety of forms. They are found in plant and animal tissues, in dead organic matter (e.g. bones and humus), in solution in the water and attached to soil particles. Nutrients are made available to plants through the breakdown of minerals and organic matter in the soil. The nutrient cycle is a term used to describe the movement of nutrients from the soil, to soil-water, into plants and eventually returning to the soil. The cycle typically involves nutrients changing from one form to another and back again. For example, nitrogen gas (N2), nitrate-nitrogen (NO3
-), ammonium-nitrogen (NH4
+) or organic nitrogen (e.g. part of a plant such as a protein or an amino acid) are some of the forms of nitrogen. Eutrophication is a consequence of nutrient loss and describes the enrichment of water bodies with nutrients. The word eutrophic is derived from the Greek word “eutrophos” which means "well fed", the food referred to is the nutrients such as nitrogen and phosphorus. Eutrophication can be defined as an addition of plant nutrients to a water body (Weaver, 1991) or as the enrichment of a water mass with organic and inorganic plant nutrients. When concentrated in dams, rivers, lakes and estuaries, these nutrients cause the water body to become highly biologically active with increased numbers of micro-algae (e.g. phytoplankton) and macro-algae (e.g. filamentous algae and sea weeds) flourishing in the nutrient rich water. This change in the ecology is viewed as a form of degradation, especially when it results in algal blooms killing other plants and animals present in the water. 11.1.2 What are the causes of nutrient loss and eutrophication? Nutrient loss and eutrophication are natural parts of the nutrient cycle. The movement of nutrients in an ecological system is a complex process, being affected by a number of interacting factors. Water is a major carrier of nutrients and a number of hydrological processes are involved in their transport. These processes include runoff, stream flow, percolation, throughflow and groundwater flow (see Section 3.1.2). Although drainage is usually the major determinant of nutrient export, nutrients may also be removed in wind-borne materials or through the movement of animals. Water soluble nutrients, such as orthophosphate (PO4
3-) or nitrate (NO3-), are transported in
solution (i.e. the nutrients are dissolved in the water). Leaching describes the process whereby water soluble nutrients are carried downwards through the soil profile by percolating water. Throughflow moving downslope can also leach nutrients, while runoff and stream flow carry dissolved nutrients on the surface. Nutrients in non-soluble form are transported in suspension, the nutrients occurring as particles (e.g. particulate phosphorus, bound to pieces of soil and organic matter larger than 0.45 µm) that are picked up and carried by runoff or stream flows. Natural eutrophication takes place over hundreds of thousands of years, with organic matter (such as plant debris) and silt being washed into water bodies and providing a source of food for a diverse biological community and playing an important role in the development of aquatic ecosystems. Minimal algal growth is associated with these natural processes because the supply of nutrients and the demand from the waterborne fauna are similar (Weaver, 1991).
11: Eutrophication
-209-
A range of human activities, especially agricultural development and urbanisation, have greatly accelerated the processes of nutrient loss. Sources of nutrient loss can be divided into two categories: diffuse sources and point sources. Nutrients lost from diffuse sources occur more or less evenly over a broad area. Pastures and broadacre cropping land are common diffuse sources. Nutrient loss from point sources occurs where nutrients are removed from confined areas or discharged from a particular point. Many of the extra nutrients lost due to human activities are eventually transported, directly or indirectly, into water bodies where they are responsible for the process of artificial eutrophication (Boney, 1989; Vollenweider, 1989). Nutrient loss from diffuse sources Changes to the nutrient cycles due to agricultural development have dramatically altered nutrient balances. Under native vegetation, a high proportion of the nutrients present in a system are usually found within living or dead plant tissues (humus and the leaves, stems and roots of trees, shrubs, herbs and grasses). Clearing of vegetation typically leads to greatly reduced biomass. As a result, a higher proportion of nutrients is in the soil and water. This is especially the case where annual crops and pastures are involved, because levels of plant biomass fluctuate dramatically on a seasonal basis. In many paddocks in the South-west Hydrological Region, hardly any plant biomass remains by the end of summer. Modern farming systems also rely heavily on importing nutrients from outside the system, typically in the form of fertilisers which are often added yearly. In some cases the amount of nutrient added can be very large and in excess of the plants’ abilities to assimilate them. The reduced biomass combined with the application of fertilisers decreases the proportion of organic nutrients and increases the proportion of water soluble inorganic nutrients as well as changing levels of individual nutrients. In the South-west Hydrological Region, fertilising has increased the levels of phosphorus, zinc and copper. Clearing native vegetation has probably led to a reduction in the level of other nutrients such as sulphur and potassium. Major hydrological changes have also resulted from clearing native vegetation and establishing farming systems. These include increases in recharge, runoff, waterlogging and erosion (see Section 3.3). Such changes, combined with the higher proportion of water soluble nutrients present, have resulted in a dramatic acceleration in the transport of nutrients from the land to the water. On agricultural land, fertilisers applied to pastures and broadacre crops provide a major contribution to nutrient loss from diffuse sources. These fertilisers are spread relatively evenly across the land surface and are readily dissolved by water. They are often applied in greater amounts than immediately required by the crops and pastures and can leach rapidly through soils. The nutrients do not have to move very far down the profile before they are beyond the reach of the shallow-rooted annual plants and they can then be transported by sub-surface flows. Soil type is an important factor in the process of nutrient loss. The rate of nitrogen leaching is primarily determined by soil permeability. Unless held in organic matter, most nitrogen in the soil is in the water soluble, nitrate form which is highly mobile and can therefore be removed rapidly as water percolates through sandy profiles. In heavier textured soils with lower percolation rates, more nitrate is held in the profile. Some nitrate may be absorbed onto soil particles, but the amount is usually insignificant. Ammonium nitrogen is absorbed onto soil particles temporarily, being oxidised to nitrite over a few days or weeks. Phosphorus from fertilisers typically enters the soil in a water soluble form, but can be quickly transformed into non-soluble forms by being adsorbed onto soil particles or by precipitating after reacting with other chemical elements. Clay, organic matter, iron, aluminium and calcium all influence the amount of phosphorus adsorbed by the soil. Phosphorus is initially adsorbed by the most reactive sites which bind it strongly. As additional fertiliser is added these sites become saturated and phosphorus begins to be adsorbed by less reactive sites in the soil, from where it is more available to plants (Bolland, 1998). The highest rates of leaching occur in highly permeable soils with a poor ability to adsorb phosphorus, because much of the phosphorus remains in a water soluble form. The phosphorus retention index (PRI) is a measure of the ability of a soil to adsorb and hold phosphorus (Allen and Jeffery, 1990). PRI values of: • >150 are considered to be very high,

11: Eutrophication
-210-
• 100-150 are considered to be high, • 50-100 are considered to be moderate, • 20-50 are considered to be low, • 2-20 are considered to be very low, • 0-2 are considered to be extremely low, • <0 (negative values) indicate that the soil has no retention ability and is actually losing
phosphorus. Increased rates of waterlogging and water erosion resulting from agriculture make major contributions to the process of nutrient loss. Nutrients attached to soil particles or bound up in organic matter are transported with the sediment moved by water erosion. Waterlogging often results in nutrients going into solution rather than being absorbed by soil or plants, bit it also decreases plant biomass and increases the risk of erosion. A significant proportion of the nutrients lost from the soil will eventually find their way into watercourses and water bodies. Even though the nutrient loss per hectare of land may have been relatively low, the fact that this loss often occurs over broad areas leads to high nutrient concentrations in the water body. Nutrient loss from point sources Nutrient loss from point sources usually occurs where, through human activity, nutrients are removed from diffuse sources, transported long distances and concentrated at a certain point. This can involve taking nutrients stored in grain, vegetables, fruit and meat from agricultural land to the cities for human consumption. It can involve harvesting fodder from a farm and feeding to animals confined in a feedlot on that property or exporting it to other properties. On dairy farms nutrients all over the property are grazed by the cattle, who then congregate twice a day in the dairy where they deposit many of the nutrients in faeces. Land where nutrients are concentrated in heavy applications of fertiliser over a small area can also act as point sources. Common point sources include: • rubbish tips and waste dumps, • sewage treatment plants, • septic tanks, • factories, such as tanneries, discharging organic waste, • fish farms, • piggeries, • dairies , • livestock yards and feedlots, • intensive horticulture plots, and • home gardens and sports fields. Nutrients from point sources are sometimes deposited directly in waterways. In other cases the nutrients may be washed over land, during heavy rainfall events, or slowly leached through the soil into groundwaters. Eutrophication Rising nutrient levels, resulting from export from diffuse and point sources, often triggers an increase in the growth and reproduction rates of aquatic plants. In many aquatic ecosystems, nutrient supply is the major factor limiting the growth of micro and macro-algae and as well as other aquatic plants such as pondweeds, bullrushes and seagrasses. Water soluble nutrients (present in solution) are readily available to micro and macro-algae. Non-soluble forms bound by sediments or contained in organic matter are less accessible to most aquatic plants. Phosphorus bound to sediments can be released into a soluble form by the activities of bacteria. This is most likely to happen under anaerobic conditions which can develop when the water body is calm and becomes stratified (oxygen at the bottom of the water column is used up and is not replaced from the surface due to a lack of water movement). Phosphorus and nitrogen have been identified as the most important nutrients contributing to eutrophication, with phosphorus usually being more significant in freshwater ecosystems and nitrogen more significant in marine ecosystems. Eutrophication is likely to occur in a water body when there are nutrient concentrations of more than 0.04-0.06 mg/L phosphorus and more than 0.4-

11: Eutrophication
-211-
0.6 mg/L nitrogen (AEC,1987). As levels increase, the expansion in biomass and numbers of some species can be quite dramatic, and both these have major impacts on the ecology of the water body. The nature of the water body plays an important role in determining the biological response to increased nutrient input. While nutrients allow a large biomass of algae to accumulate, the amount of available sunlight exerts an overriding control over the rate at which the biomass increases. Nutrient levels increase more rapidly when there is limited outflow from the water body. Lakes that are at the lowest point in the landscape often lose water mainly by evaporation so that nutrients are concentrated in the remaining water. Similar processes will happen in estuaries and inlets where water exchanges with the ocean are blocked for long periods (McComb and Davis, 1993). In broad, shallow water bodies, high evaporation rates contribute to nutrient concentration, while high temperature and light penetration encourage plant growth.
The Vasse-Wonerup Estuary near Busselton – a water body experiencing eutrophication problems.

11: Eutrophication
-212-
11.2 NUTRIENT LOSS AND EUTROPHICATION IN THE SOUTH-WEST HYDROLOGICAL REGION
11.2.1 What is the extent of nutrient loss and eutrophication? In the South-west Hydrological Region, phosphorus and nitrogen have been identified as the most important nutrients contributing to eutrophication. While algal growth in the Region’s rivers, lakes and estuaries is usually limited by the levels of phosphorus present, the levels of nitrogen and other nutrients are contributing factors. In coastal waters, such as Geographe Bay, nitrogen levels are often the factor limiting algal growth. Nitrogen pollution of groundwater resources is another area of concern, and nitrate levels that are high enough to cause health problems for humans have been identified under market gardens on the Swan Coastal Plain. Rates of nutrient loss and eutrophication vary markedly across the South-west Hydrological Region due to a variety of factors which include differences in climate, soil types, drainage, vegetative cover, land use, fertiliser applications and the nature of water bodies. Some of the highest rates of nutrient loss are experienced on the Coastal Plains where leaching from sandy surfaced soils and runoff from clayey surfaced soils have resulted in the eutrophication of waterways. High rainfall, extensive clearing of native vegetation, intensive land uses and widespread waterlogging contribute to nutrient loss on the Coastal Plains. Lower rates of nutrient loss are experienced over much of the Forested Hills where much of the land is still covered by native forests. Despite extensive clearing, nutrient loss over large areas of the Wheatbelt could be relatively low due to a combination of clayey subsoils and low rainfall. Fertiliser use Many of the soils of the South-west Hydrological Region have inherently low levels of nutrients. When first cleared for agriculture, they were often very deficient in phosphorus, nitrogen, copper and zinc, with phosphorus deficiencies in the sands and gravels being particularly acute. As a result, fertiliser applications tend to be relatively high. Table 11.1 summarises various fertilisers commonly used in the South-west Hydrological Region, typical application rates and the amount of nutrient made available by applying this amount of fertiliser. The amount of fertiliser supplied to vegetable crops can be 10-20 times greater than that supplied to broadacre pastures and crops. Table 11.1: Common fertilisers used in the South-west Hydrological Region. Zone Land use Commonly used
fertilisers Application
rates Nutrient availability
(kg/ha/year) (kg/ha/year) Phosphorus Nitrogen Sulphur Calcium Potassium Wheatbelt and Woolbelt
Cropping Agras No. 1 Superphosphate Urea
100-150 100-200 30-50
7-11 9-18
-
17-26 -
14-23
17-25 11-23
-
- 20-40
-
- - -
Sheep and cropping
Superphosphate Agras No.1
100-200 100-200
9-18 15-23
- 17-35
11-23 17-34
20-40 -
- -
Forested Hills
Pastures and hay
Superphosphate Urea
100-200 25-75
9-18 -
- 11-34
11-23 -
20-40 -
- -
Fruit orchard Super & Potash 5:1 Urea
1,000-1,500 300-500
75-110 -
- 138-230
90-135 -
- -
75-110 -
Vegetable crops*
Potato E Urea
2,000-3,000 200-500
140-210 -
80-120 96-230
260-390 -
300-450 -
140-210 -
Swan Coastal
Dryland dairying
Super & Potash 3:2 Ammonium Sulphate
2-400 100-150
11-22 -
- 21-32
14-28 24-36
24-48 -
40-80 -
Plain Irrigated dairying
Super & Potash 3:2 Ammonium Sulphate
400-600 200-300
22-33 -
- 42-63
28-42 48-72
48-72 -
80-120 -
Beef Super & Potash 3:1 Ammonium Sulphate
150-300 75-100
10-20 -
- 16-21
13-17 18-24
22-45 -
18.5-37 -
Fruit orchard Super & Potash 5:1 Urea
1,000-1,500 300-500
75-110 -
- 138-230
90-135 -
- -
75-110 -
Vegetable crops*
Double Phos Urea Muriate of Potash
100-1,200 500-1,500 500-1,000
17-210 - -
- 230-690
-
3-42 - -
16-190 - -
- -
245-490 *Values should be doubled where two crops are grown per year.
As a result of fertiliser applications, many agricultural soils in the South-west Hydrological Region now have a moderate or high phosphorus status with respect to plant growth requirements (Weaver et al., 1994). About 70% of the phosphorus used by agricultural plants in the Peel-Harvey catchment area is derived from soil stores that have built up from previous fertiliser applications, rather than from freshly applied fertiliser (Schofield et al., 1984).

11: Eutrophication
-213-
Levels of nitrogen have also increased in many soils, though nitrogen levels can fluctuate greatly from year to year. Increased nitrogen levels are partly due to fertiliser applications and partly a result of the widespread adoption of nitrogen fixing crops and pastures such as clovers and lupins. Nutrient loss It has been estimated between 1% and20% of the phosphorus applied as fertiliser is lost from farmland in the South-west Hydrological Region. Assuming an average annual average application of 20 kg/ha, this amounts to 0.2-4.0 kg/ha/year (Weaver, 1991). Although this figure may seem relatively small per for each hectare of land, the large areas of farmland involved mean that the total contribution is quite significant. In contrast, sheep holding yards can contribute up to 91 kg/ha of phosphorus per year (Weaver, 1991), but they only cover a fraction of the area. A major source of phosphorus loss is the pale deep sands, often referred to as banksia, gutless or Bassendean sands, which cover large areas of the Coastal Plains. Their permeability, very low clay content (<5%) and low levels of iron and aluminium oxides contribute to high rates of phosphorus loss through leaching. Further, farmers often use high rates of fertiliser on these sand in an attempt to maintain the supply of phosphorus to crops and pastures. Significant losses also occur from the topsoil of waterlogged grey sandy duplex profiles. In vegetable cropping areas, as much as 15-20 mg/L of phosphorus have been measured in sub-surface water under pale deep sands (McPharlin et al., 1990). Under a new turf farm on a pale deep sand, Lantzke (1997) found that the phosphorus level in the shallow groundwater (water table at 3 m) increased from close to 0 mg/L up to 16 mg/L within 13 months. The presence of coffee rock (iron-organic pans) below these sands often prevents phosphorus moving into the deep groundwater, either by restricting water flow or by adsorbing the nutrient from the water. In contrast to pale deep sands, water leached from vegetable crops on yellow deep sands (often referred to as tuart, limestone, Spearwood or Karrakatta sands) contained less than 0.15 mg of phosphorous per litre (McPharlin et al., 1990). Although the yellow deep sands do not have a significantly higher clay content, the sand grains are coated by iron and aluminium oxides which bind the phosphorus (PRI values are in the range of 7-20). Nitrogen leaches at high rates from pale deep sands and yellow deep sands because water percolates rapidly through both. The presence of iron oxides in the yellow deep sands make little difference because the oxides do not adsorb nitrates and ammonium. Lantzke (1997) found nitrate-nitrogen levels of 7-110 mg/L in the shallow groundwater below horticultural properties on the Swan Coastal Plain. Elsewhere, nitrogen is lost from soils through a combination of percolation and throughflow in duplex soils on hill slopes. In the Forested Hills with gravelly, loamy and duplex soils, Gerritse and Adeney (1992) estimated that 20-50% of the nitrogen added as fertiliser to orchards is lost as nitrate in the stream flows. The vast areas of clover based pastures on agricultural land throughout the Region also make a major contribution to nitrate levels in waterways. Phosphorus is usually lost from soils with high PRI values as a result of erosion, the phosphorus being bound to the eroded soil particles and transported with the sediment. Erosion makes a major contribution to soil loss from the Forested Hills and Western Woolbelt, where loams and gravels are the predominant soils. Gerritse and Adeney (1992) showed that although levels of soluble phosphate in streams draining the Darling Plateau are low and barely affected by land use, high levels of phosphorus are found attached to particulate matter carried in suspension. One of the soil groups with the rate of highest phosphorus retention is the friable red-brown loamy earths (e.g. karri loams), found in the valleys of the Forested Hills. These soils have high clay contents and very high levels of reactive iron and are favoured for horticulture. It is likely that erosion from vegetable plots on sloping land results in substantially localised phosphorus losses from these soils. Erosion can also remove significant amounts of organic nitrogen in forms such as dung or dead remnants of crops and pastures Table 11.2 presents examples of typical soil profiles from the agricultural land throughout the South-west Hydrological Region, showing levels of nitrogen and phosphorus present as well as the phosphorus retention index (PRI), and other factors affecting nutrient retention. It demonstrates that not only do these values vary between soil types, but that there can also be significant variation within profiles. In the pale deep sands, phosphorus may leach rapidly from the topsoil but be adsorbed and

11: Eutrophication
-214-
held by a coffee rock hardpan in the subsoil. It should be noted that the levels of phosphorus and nitrogen present are influenced by land use and fertiliser history as much as by soil factors. Table 11.2: Phosphorus and nitrogen content and factors affecting nutrient loss for typical profiles of
some common agricultural soils in the South-west Hydrological Region. Zone Soil group Soil Layer Permea- PRI* Total P Total N Depth
(cm) Description bility (ppm) (ppm)
0-10 dark grey sand Rapid 1.1 68 1,150
Pale deep sand 10-150+ light grey sand Rapid 0.2 23 60
0-20 dark grey sand Rapid -0.4 110 920 20-110 light grey sand Rapid 0.3 42 140 110-145 porous coffee
rock Moderate 630 360 450
Pale deep sand with coffee rock
145-150 mottled clayey sand
Rapid 92 57 260
Coastal 0-15 brown sand Rapid 0.4 54 Plains 15-40 yellow-brown
sand Rapid 1.5 26
Yellow deep sand
40-150 yellow sand Rapid 4.5 21 0-5 dark grey loamy
sand Rapid 3 140
5-35 grey loamy sand Rapid 2 85
Grey deep sandy duplex
35-150 yellow clay Slow >100 180 0-10 dark grey
gravelly sand Rapid 77 250 2,300
10-45 yellow sandy gravel
Rapid 15 55 200
Duplex sandy gravel
45-150+ yellow clay Slow >1,000 63 160 0-15 brown loam Moderate >1,000 820 2,960
15-50 red loam Moderate >1,000 170 750
Forested Hills
Friable red/brown loamy earth 50-150+ red clay Slow >1,000 95 210
0-10 dark brown loamy sand
Rapid 10.3 370 3,000
10-20 red-brown sandy loam
Rapid-moderate
18 71 510
20-55 red clay Moderate 881 68 470
Western Woolbelt
Red shallow loamy duplex
55-150 yellow-brown clay
Moderate-slow
760 25 115
0-20 dark grey coarse sand
Rapid 0.8 120 1,000
20-60 grey coarse clayey sand
Rapid 1.7 37 450
60-100 grey clay Slow 74 38 110
Eastern Woolbelt
Grey deep sandy duplex
100-150 red clay loam Slow 33 22 80 0-12 dark grey brown
sandy clay loam Moderate 5.4 270 1,400
12-55 brown clay Slow 30 46
Wheat- Belt
Alkaline grey shallow loamy duplex (sodic and hardsetting)
55-150 brown clay Slow 22 41
* - Phosphorus retention index (see Section 11.1.2) Phosphorus and nitrogen loss also occurs via runoff. In soils where saturation or infiltration excess runoff occurs (see Section 3.1.2), fertilisers may be dissolved and washed away before they have a chance to enter the soil. Examples include runoff generated from: clays and shallow loamy duplex soils in irrigation paddocks, waterlogged sands on footslopes or hardsetting loams on hill sides. Water soluble phosphate in the runoff may be adsorbed if it is flowing over soil with a high PRI on the surface, but the rate of adsorption will be slow. Relating nutrient loss to soil type is rarely straightforward. This can be demonstrated by three separate studies done in the Peel-Harvey Catchment Area. Birch (1982) concluded that phosphorus export increased with the proportion of clayey soils in an area while Kinhill (1989) concluded that 89% of the phosphorus draining into the estuary originated from sandy soils. Summers et al. (1999) found no significant relationship between the proportion of sandy and clayey soils occurring within sub-catchments and the total amount of phosphorus discharge.

11: Eutrophication
-215-
Sandy and clayey soils within the Peel-Harvey Catchment probably lose similar amounts of phosphorus, but through different mechanisms and at different rates. Leaching of dissolved phosphorus dominates on sandy soils where runoff is low due to high rates of infiltration, recharge and transpiration. There are often high concentrations of phosphorus in waterways draining sandy soils, however the volumes of water are relatively low with flow rates tending to be slow and steady. In contrast, runoff from clayey soils is typically high due to low infiltration. Phosphorus is largely exported while attached to soil or organic matter particles carried by runoff water. Considerable loads of phosphorus may be exported from clayey catchments due to high flow rates in the waterways, even if nutrient concentrations are low. Nutrient loads of waterways Nutrient concentrations in the waterways of the South-west Hydrological Region show significant variations, reflecting differences in the soils and land use of their catchment areas. Table 11.3 presents average nutrient loads and nutrient concentrations in some waterways based on data collected between 1985 and 1995, along with an estimation of the average rate of nutrient loss over their catchment area. Table 11.3: Phosphorus and nitrogen loads of some waterways in the South-west Hydrological
Region. Catchment and waterway
Area drained
Average load (t/year)
Average concentration (mg/L)
Average catchment export (kg/ha/year)
(,000 ha) Total phosphorus
Total nitrogen
Total phosphorus
Total nitrogen
Total phosphorus
Total nitrogen
Peel- Harvey Estuary
Meredith Drain 5 6 16 0.80 2.10 1.20 3.20 Nambeelup Brook 11 8 33 0.60 2.30 0.70 3.00 Harvey River 73 35 199 0.20 1.20 0.50 2.70 Serpentine River 113 23 197 0.10 1.10 0.20 1.80 Murray River 684 7 258 0.02 0.80 0.01 0.40 Leschenault Estuary
Ferguson River 17 2 37 0.05 1.00 0.10 2.20 Brunswick River 26 13 116 0.10 0.80 0.50 4.40 Preston River 83 3 86 0.03 0.80 0.05 1.00 Collie River 290 4 101 0.02 0.50 0.01 0.40 Walpole-Nornalup Inlet
Deep 47 0 29 0.01 0.80 0.01 0.60 Frankland 452 4 145 0.03 1.00 0.01 0.30 Hardy Inlet Blackwood River 2,114 5 557 0.01 1.10 0.00 0.30 Broke Inlet Shannon River 41 1 34 0.02 0.70 0.02 0.80 Wilson Inlet Denmark River 53 0 23 0.01 0.80 0.01 0.40 Adapted from: Deeley et al. (1999) using data collected between 1985-1995 Rivers and streams that drain forested catchments (e.g. the Shannon and Deep Rivers) contain very low concentrations of phosphorus and relatively low concentrations of nitrogen. The highest concentrations of phosphorus and nitrogen are found in rivers, streams and artificial drains located in the extensively cleared, poorly drained catchments on the Coastal Plains (e.g. Meredith Drain, Vasse Drain, Wellesley River and Scott River). Sandy soils are predominant in these catchments. There is a trend for the average export of nutrient from a catchment to decrease with catchment area (Table 11.3). This is probably because phosphate travelling in solution in waterways tends to become assimilated along the way. Some may be taken up by sediment and some is used by plants and animals. Deeley et al. (1999) suggested that in-stream assimilation in the south-west is relatively low in comparison with other parts of Australia due the significantly lower number of macro-invertebrate grazers (mainly insect larvae such as dragonflies). The slower the movement of water in a stream, river or drain, and the greater the distance to be travelled, the greater the assimilation. The

11: Eutrophication
-216-
fact that artificial drains provide a direct route to the estuary is probably one of the reasons that most of the nutrients in the Peel-Harvey originate on the Coastal Plain, which only comprises approximately one quarter of the total catchment area. Nutrient loads in streams and rivers fluctuate with time and are closely related to rainfall and flow rates. In any one year, a major proportion of the total nutrient loss from a catchment can occur during one or two events. Large amounts of nutrients carried by waterways for a short period are sometimes referred to as slugs, and these often happen around the break of the season, when nutrients accumulated over summer are flushed out by the first heavy rains. Phosphorus bound by organic matter in the soil is rapidly mineralised into a soluble form over the hot, dry summer months, making it available for transport by runoff during the first winter rains (Summers et al., 1999). Peak flows during winter and runoff generated by intense summer thunderstorms can also remove large amounts of nutrients. Eutrophication Eutrophication has occurred in a variety of surface water bodies in the South-west Hydrological Region. Problems are particularly prominent on the Swan Coastal Plain, due to a combination of factors including: • the presence of permanent waterways and large coastal wetlands and estuaries, • intensive agricultural and urban development, • large areas of sandy soil with poor nutrient retention ability, • widespread waterlogging, and • the construction of networks of artificial drains that transport nutrients rapidly. All the water bodies are potentially susceptible to eutrophication, but concern was initially centred on the Peel-Harvey Estuary. Between 1977 and 1986 it was calculated that an average of 143 t/year of phosphorus entered the estuary while an average of only 60 t/year (Kinhill, 1989) left the estuary. In 1960, red slimy algae (Monosporous australis) was first recorded causing problems. Widespread blooms of the blue-green alga, Nodularia, have occurred regularly during summer since 1973. The Nodularia grows mainly in response to increased levels of phosphorus. Nodularia growth increased dramatically following widespread clearing of the native vegetation, and subsequent fertiliser applications, on the pale deep sands during the 1960s and 70s. The blue-green alga, Oscillatoria, has also been common since 1982. Other species that indicate eutrophic conditions include the macro-algae: rope weed (Chaetomorpha), sea lettuce (Ulava rigida), goat weed Cladophera and Enteromorpha. Most of the coastal estuaries and inlets in the South-west Hydrological Region are susceptible to eutrophication. This is due to a combination of the high rates of nutrient export from the surrounding sandy countryside, the shallow nature of most estuaries and the Mediterranean climate. Winter rains and runoff mean that nutrient loads in water bodies are high by the beginning of spring when warm weather, increased hours of sunlight and clear skies encourage algal growth (Deeley et al., 1999). Low stream flows and low tidal ranges result in the partial or complete closure of river mouths in summer, limiting the flushing of estuaries. The estuaries tend to be fresher in winter and more saline in summer, and as a result, both phosphorus and nitrogen contribute to algal growth at various times of the year. It is possible that phosphorus attached to particulate matter (often from clayey soils) makes a greater contribution to eutrophication problems than the soluble phosphorus commonly exported from sandy soils. This is because particulate phosphorus tends to settle to the bottom in large water bodies, rather than being flushed out (as often occurs to dissolved phosphorus). Nutrients that accumulate in sediments over time play a very significant role in driving algal blooms. Phosphorus attached to clay particles stored on the floor of the water body can be released in November-December when flows from the catchment area have largely stopped, temperatures rise and oxygen levels drop. The phosphorous is then available to the algae. In contrast, water draining from sandy catchments is more likely to contain tannins which block out light and reduce algal blooms. Table 11.4 presents an assessment of the eutrophication status of the major estuaries and inlets in the South-west Hydrological Region. Indicators of high nutrient concentrations are measurements of phosphorous, the extent of algal growth and the loss of seagrasses. The table also shows the sources of nutrients flowing into the water bodies. Table 11.4: Eutrophication of estuaries and inlets of the South-west Hydrological Region.

11: Eutrophication
-217-
Peel-Harvey
Estuary2
Leschen- ault
Estuary
Vasse-Wonerup Estuary
Hardy Inlet
Broke Inlet
Walpole Inlet
Nornalup Inlet
Irwin Inlet
Wilson Inlet
Estuarine condition
POOR SATISF-ACTORY
POOR GOOD GOOD SATISF-ACTORY
GOOD GOOD GOOD
Mean total phosphorus concentration 1
0.12-0.16
0.03 <0.01 0.06
Macroalgal growth High High Low Low Nil Low Nil Low Low Microalgal growth High Nil High Low Nil Low Nil Low Nil Blue-green algal blooms
Medium Nil Medium Nil Nil Nil Nil Nil Nil
Epiphytic algal growth
High Nil Low Nil Nil Low Nil Nil Medium
Seagrass loss Medium Nil n.a. Low Nil Low Nil Nil Nil Nutrient sources Agricultural fertilisers
High High High Medium Nil Low Low Low Medium
Agricultural point sources
Medium Low Medium Low Nil Low Nil Nil Low
Industrial point sources
Nil Low Low Nil Nil Nil Nil Nil Low
Urban point sources
Low Nil Nil Low Nil Low Nil Nil Low
General urban Low Low Low Low Nil Low Nil Nil Low n.a. – not applicable because seagrass is not present. Adapted from: Briggs et al. (1992) except 1. Average concentration of total phosphorus in estuary (taken from McComb and Davis, 1993). 2. This assessment of the Peel-Harvey estuary was made before the construction of the Dawesville Channel. Conditions have
improved since the channel was opened.
The eutrophication status of an estuary depends on both the inflow and outflow of nutrients. For example the Vasse-Wonnerup Estuary is one of the most eutrophic water bodies, having artificial barriers preventing tidal interchange. Although the Leschenault Estuary receives large amounts of nutrient, many of these pass rapidly out to sea due to the construction many years ago of a cut opposite where the Collie and Preston Rivers enter the estuary. In the Harvey Estuary, the recently constructed Dawesville Channel allows flushing from the Indian Ocean and has reduced the severity of eutrophication. In freshwater bodies, phosphorus is the major nutrient contributing to eutrophication. The Blackwood River experienced toxic algal blooms during the summers of 1993-1994 and 1994-1995 as a result of low winter flows and erosive summer thunderstorms. Water in individual farm dams can become unsuitable for stock consumption from time to time, especially after summer storms when large volumes of animal manures, organic matter and phosphorus rich topsoil are deposited in the warm water. Eutrophication of lakes and wetlands has also been recorded. In the marine environment, Geographe Bay is the location most susceptible to eutrophication. The bay receives high levels of nitrate discharge from rivers and drains on the Swan Coastal Plain and in addition, it is relatively shallow and sheltered from the prevailing winds and swells (which cause water mixing). To date, increased nutrient and micro-algae levels have been identified in the bay close to (within 500 m) drain outlets but no problems have been identified offshore (Kinhill, 1998).

11: Eutrophication
-218-
11.2.2 What are the problems associated with nutrient loss and eutrophication? Off-site effects generally form the major area of concern. However, any decline in soil fertility on-site should be viewed as land degradation and thus is a problem in itself. The loss of nutrients is usually masked by the addition of fertilisers, but this represents a major economic cost affecting the profitability of farming enterprises. Adding nutrients to a crop or pasture involves the cost of purchasing the fertilisers as well as time, labour and fuel. If the nutrients are washed or leached away before being used by the plants, this is equivalent to flushing money down the drain. The eutrophication of waterways is the aspect of nutrient loss that causes the greatest concern to the general community. The consequences of the eutrophication of a water body and the resultant changes to the aquatic ecosystem can include: • algal blooms, • algal scum mats on the water surface, • oxygen depletion of the water, • the destruction of seagrass meadows, • widespread killing of fish and crustaceans, • the death of waterbirds, • increased populations of bacteria, • high concentrations of algal and bacterial toxins, • health risks to humans and livestock, • unpleasant odours, and • the loss of water supplies • the closure of recreation areas • the loss of income (for fishermen and tourist enterprises) Small increases in the amount of algae present are not necessarily detrimental to aquatic ecosystem because they increase the food supply, which can benefit all levels of the food chain, including crustaceans, fish and waterbirds. It is the larger increases in algal growth that have detrimental effects, particularly on aquatic flora and fauna, altering habitats and food webs and resulting in declining species diversity. Algal blooms are one of the most visible consequences of eutrophication and can eventually choke waterways. Nodularia grows as chains of microscopic cells that are usually distributed throughout a water body giving it a green appearance. High levels of such micro-algae limit light penetration, to the detriment of other aquatic life, especially submerged plants such as seagrasses. Seagrass meadows, such as those present in the Harvey Estuary, Geographe Bay and Hardy Inlet, are an essential part of the food chain and provide a number of other benefits such as oxygenation of the water and taking up nutrients in spring and summer months. Seagrasses are damaged when deprived of light by algal blooms clouding the water and algal epiphytes growing on their fronds. This ultimately decreases the depth at which the grasses can live. In shallow water where more light is available, increased wave action, erosion and grazing by water fowl puts further stress on the plants. In some cases the meadows die out completely. Of particular concern are the massive blooms of blue-green algae (Cyanobacteria) such as Nodularia, Microcystis, Oscillatoria, Aphenozymenon and Anabeana spumigena which can be highly toxic, even when they die. Their toxins have been responsible for the death of fish, water birds and livestock. In some cases they pollute water bodies to the extent that there is a health hazard to humans. In calm conditions, or when they die, the Nodularia float to the surface of the water where they can form a thick green mat of scum (Kinhill, 1989). Oscillatoria grows as a mat over the surface of the sediment, but it breaks off in lumps that float to the surface when growing rapidly. These dense surface mats of macro or micro-algae form an even more effective light barrier. The death of algae in a bloom results in large reductions of dissolved oxygen in the water, providing anaerobic conditions in which little else can survive. The situation is worsened because anaerobic conditions also assist in releasing nutrients from the sediments on the floor of the river or estuary. In 1995, micro-algae cell counts had reached 500,000 per millilitre in the lower Serpentine River compared to a "normal bloom count" of about 20,000 per millilitre. Fish, prawn and crab kills were reported as the animals attempted to move away from the oxygen depleted water (Mandurah Telegraph, 1995).

11: Eutrophication
-219-
The algal mats often accumulate on the shore where they smother rushes and other vegetation along the shore. The rotting of these mats produces noxious odours and encourages bacterial outbreaks. The odours (usually hydrogen sulphide gas) are unpleasant and may affect human health. Algal blooms in estuaries and rivers have economic consequences, affecting fisheries and tourism. Smells, toxins and bacteria reduce the recreational use of the waterways while ecological changes deplete recreational and commercial fisheries. Large amounts of money have been spent on tackling the problem in the Peel-Harvey estuary, including the harvesting of algal mats and the construction of the Dawesville Channel. Toxic algal blooms in rivers and dams have serious consequences for farmers who rely on these supplies for stock water, while algae in water drawn from eutrophic supplies can block irrigation systems. There are some other ramifications of nutrient loss that should not be overlooked: • Nitrogen leaching is a major contributor to the process of soil acidification. When ammonium
(NH4+) is converted to nitrate(NO3
-), hydrogen ions (H+) are the by-product. An excess of hydrogen ions can make a soil acidic so if the nitrate leaches below the root-zone, the remaining hydrogen ions can lower the pH.
• Nitrate contamination of groundwater often results from nutrient loss and presents a health risk. Concentrations of more than 10 mg/L have been found in a number of bores on the Swan Coastal Plain. This is above the World Health Organisation’s Guideline and drinking this water can lead to brain disorders, especially in infants.
• Irrigating with nutrient polluted groundwater (high concentrations of nitrate or phosphate) can lead to excessive crop growth or toxic effects. This is most common where water supplies are obtained from shallow groundwater that is extracted from below the crop.
• Communities of native vegetation growing in areas receiving runoff with high levels of nutrients or accessing nutrient enriched groundwater can be adversely affected. Many native species have a relatively low tolerance to phosphate and increased nutrient availability can encourage weed competition.
• Changes to the nutrient balance (Section 11.2) may have impacts on soil ecology and soil fauna.
11.2.3 Which areas are most susceptible to nutrient loss and eutrophication? Nutrient loss There are a variety of factors that determine the likelihood of nutrient loss from a piece of land. The following factors increase the risk of nutrient loss: • Heavy fertiliser use: The higher the rate of fertiliser application, the greater the amount of
nutrients available to be leached or washed away, especially if fertilisers are applied in excess of the requirements of crops or pastures.
• Leguminous crops or pastures: Plants such as clover, medics, peas and lupins fix atmospheric nitrogen leading to increased stores of nitrogen in the soil. The nitrogen is transferred from the plant to the soil as part of the organic matter. This organic nitrogen can then be washed away as particulate matter or broken down into water soluble forms and leached. While the process of nitrogen fixing generally improves soil fertility, it can contribute to nitrate pollution of groundwater or eutrophication in water bodies where nitrogen availability limits algal growth.
• Highly permeable soils: The risk of nutrient leaching is highest on sandy soils, through which water containing dissolved nutrients can percolate rapidly.
• Soils with poor infiltration: Some profiles have a good nutrient retention ability, but low infiltration rates increase the risk of fertilisers being washed away by runoff before they become incorporated into the soil. Clays and hardsetting loams with poor soil structure are examples of this.
• Soils with low PRI: Phosphorus leaches more rapidly from soil such as pale deep sands because they have a poor ability to adsorb this nutrient.
• Waterlogging: Areas that become waterlogged have a high potential for nutrient loss. Nutrients go into solution more readily in saturated conditions, especially if fertilisers are applied when the soils are wet.
• Erosion risk: Soils susceptible to erosion are also susceptible to nutrient loss, because the nutrients are lost with the eroded soil. The risk of erosion may be due to landscape position, land

11: Eutrophication
-220-
use or soil erodibility. Soils with high clay, iron or aluminium contents, which adsorb and store large amounts of phosphorus, are most likely to suffer significant nutrient losses if the clay particles are removed during major erosion events.
• Low productivity: The risk of nutrient loss is increased in areas with poor pasture or crop growth. When plants are growing slowly and not achieving their full potential, they use less nutrients, so any nutrients added in fertilisers build up in the soil.
• Shallow-rooted annual crops and pastures: If plants are only extracting nutrients from a relatively thin layer of soil for part of the year, there is a potential for nutrients to leach below the root zone and so be lost.
• Intensive drainage: The proximity of land to drainage lines has a large bearing on nutrient loss. Drainage networks that remove water rapidly from paddocks and catchments are also likely to export large amounts of dissolved nutrients before plants are able to take them up. Fast moving waters can then quickly transport these nutrients into eutrophic water bodies.
It must be remembered that the export of nutrients from a catchment is usually a complex process determined by a number of inter-related factors. When assessing potential nutrient loss from an area, the tendency to concentrate on a single factor is a mistake. It is important to understand the ways in which the hydrology, soils and land management practices combine to affect nutrient loss before drawing any conclusions. Current research suggests that sandy and clayey catchments on the Swan Coastal Plain both export phosphorus at similar rates (Summers et al., 1999). In assessing the risk of nutrient export a heavy reliance is often placed on soil PRI, with a single value being assigned to a soil type. However, this approach can ignore the importance of hydrological processes and the fact that PRI values can vary dramatically down a profile. In the second profile presented in Table 11.2 (a pale deep sand with coffee rock), the PRI values change from being very low in the top metre of sand to very high in the underlying coffee rock. In a similar profile located on a well drained sandy rise, phosphorus applied to pastures would leach rapidly from the sand, but much of this could be adsorbed as the water passed through the moderately permeable coffee rock. A similar profile located in a drainage depression with a water table present above the coffee rock could be losing significant amounts of phosphorus due to throughflow in the topsoil. Elsewhere in the catchment, a red loamy earth (with very high PRI) used for potato cropping may contribute significant nutrient loads to waterways due to a combination of high levels of fertiliser applications and extensive soil loss through erosion. Constructing an artificial drainage network in area of waterlogged pastures provides another example where interacting factors need to be considered. While the drains are likely to increase the rate at which dissolved nutrients are removed, improvements to profile drainage throughout the area may counterbalance the effect and may even lead to a reduction in total nutrient export. Fertilisers will have a greater chance of being adsorbed by the well drained soils, and increased pasture health and growth will result in higher rates of plant nutrient uptake.
11: Eutrophication
-221-
Eutrophication Just about all the water bodies within South-west Hydrological Region are susceptible to eutrophication to some degree. The susceptibility of a water body to eutrophication depends on a number of factors: • The amount of nutrient input, which is determined by how much nutrient loss is lost from the
catchment, and how efficiently the drainage system transports the nutrients to the water body. • The degree of flushing that occurs in the water body during late spring and summer. Water
bodies that have a continual inflow and outflow of water are less likely to go eutrophic because nutrients can be removed and the movement of water can improve oxygen supplies. Oxygenated water restricts the release of nutrients bound to sediments.
• The depth and width of the water body. Higher temperatures and greater light penetration occur in broad, shallow water bodies and these encourage algal growth. In addition, high levels of evaporation increase nutrient concentrations.
Water bodies that are particularly susceptible include: • those surrounded by sandy soils and intensive land uses (especially estuaries with restricted tidal
interchange in summer) • farm dams that have had a high input of nutrients from animal manure and fertilisers, and • rivers that have poor summer flows and flow in agricultural catchments that are extensively
cleared. 11.2.4 Nutrient loss and eutrophication research in the South-west Hydrological Region Research into the fields of nutrient loss and eutrophication in the South-west Hydrological Region was largely initiated by concerns about the state of the Peel-Harvey Estuary and has followed a number of paths. Cross (1974) associated excessive algal growth in the Peel Inlet with eutrophication of the waterway. In the mid 1970s, the Department of Conservation and Environment initiated a study of the ecology and management of the Estuary in response to the appearance of algal blooms (Hodgkin et al., 1980). Much research followed up this initial study, including investigations covering water quality (Lukatelich and McComb, 1983), water exchange between the estuary and ocean (Black et al., 1981), nutrient cycling and algal growth (Lukatelich and McComb, 1985) and the use of algal growth inhibitors (Bowmer, 1984). Hodgkin (1985) has compiled a summary of much of the research undertaken in the Estuary. The problems in the Peel-Harvey spurred on investigations about the nutrient input and health of other coastal water bodies including Hardy Inlet (Congdon and McComb, 1980), Wilson Inlet (Lukatelich et al., 1987), Vasse-Wonnerup Estuary (McAlpine et al., 1989), Leschenault Estuary (Donohue et al., 1994) and Geographe Bay (Lord, 1995). Significant work has also been undertaken in the Swan River Estuary to the north and the Albany Harbours to the east. A number of researchers have investigated the sources of nutrients found in the Peel-Harvey Estuary. Schofield et al. (1984) investigated phosphorus loss from fertiliser applications on various soil types in the catchment area while Summers et al. (1999) monitored drains to calculate nutrient losses. Sharma et al. (1991) and Lantzke (1997) studied nutrient leaching from horticultural properties on the sandy soils of the Swan Coastal Plain. On the south coast, Weaver et al. (1999) undertook a phosphorus inventory which included the catchments of Wilson and Parry Inlets. George et al. (1999) investigated shallow groundwater contamination caused by leakage from dairy effluent ponds on the Swan Coastal Plain. Considerable effort has been invested in identifying changes to management practices that will reduce nutrient export from the catchment area. Yeates et al. (1985) and Weaver et al. (1988) investigated the effects of modifying fertiliser applications to pastures. Amendments, such as red mud from bauxite residues, use to improve the nutrient retention of sandy soils have been extensively investigated by Barrow (1982), Vlahos et al. (1989) and Summers et al. (1993). One issue of the international journal “Fertilizer Research” (Hodgkin and Yates, 1993) is devoted entirely to fertilisers and eutrophication in south-western Australia and contains contributions from many of the researchers involved in investigating these issues over the previous decade and a half.

11: Eutrophication
-222-
11.3 MANAGING NUTRIENT LOSS AND EUTROPHICATION
To tackle the problem of eutrophication, it is essential to reduce the amount of nutrients lost across the South-west Hydrological Region. This requires us to adopt a variety of tactics in combination. These include: • modifying fertiliser applications, • improving irrigation management, • increasing nutrient uptake by plants, • controlling soil erosion, • using soil amendments to improve nutrient retention; • altering agricultural effluent and waste disposal systems; • using wetland filters and buffer strips to prevent nutrients from entering waterways, and; • reducing nutrient levels from urban and industrial sources. Nutrient pollution from agricultural areas should not be viewed in isolation from other land management issues. Using land and water resources productively and efficiently (including management practices designed to combat waterlogging, erosion and salinity) often helps to minimise the amount of nutrient export. The most effective way to reduce the eutrophication of a water body is to minimise nutrient loss in its catchment area, however this cannot be achieved overnight. The high levels of nutrients stored in the sediments of many of our estuaries mean that, even if all nutrient input ceased immediately, eutrophication problems would continue for many years. Strategies to deal with eutrophication in major water bodies include: • removing algal blooms by mechanical harvesting, • major engineering works (such as the Dawesville Channel) which alter the hydrology of estuaries,
and • applying algaecides. The remainder of this chapter will concentrate on management practices relevant to rural landholders. 11.3.1 How can nutrient loss and eutrophication be identified? The problems associated with eutrophication, such as discoloured water, the presence of algal mats, noxious odours and fish kills, tend to be very obvious. However, if indicators of future eutrophication can be identified well before the problems develop, then timely actions to prevent or minimise these problems can be initiated. When algal blooms appear in a water body or water supply, a sample can be taken to identify the species responsible and to determine if it is a blue-green algae (cyanobacteria) that may produce toxins. Samples should be taken while the bloom is still alive and sent to a laboratory within 24 hours or kept fresh at 4OC. Algal samples should not be frozen. Samples can be sent to Agriculture Western Australia, the Government Chemistry Centre, Curtin University or Murdoch University. The organisation should be contacted to arrange details before sampling. If there are more than 1,000 cyanobacteria cells per 100 ml, the water is likely to be unfit for drinking. Direct contact with the water should be avoided when the cell count exceeds 15,000/100 ml. Measuring the nutrient concentrations in water provides a guide to the health of estuaries, lakes, dams and other water bodies, with longer term monitoring being useful to detect trends (e.g. increases in phosphorus loads). Monitoring the water quality of streams, drains and rivers feeding into a water body will also provide valuable information and indicate likely sources of nutrients. However, nutrients usually originate from diffuse sources, so sampling may do little more than indicate that one sub-catchment makes a greater contribution than other catchments. In other cases, point sources of nutrient pollution requiring attention can be highlighted. Collecting water samples to assess water quality and nutrient concentrations is not always straightforward. Concentrations of nutrient can vary markedly with depth and time, and nutrients may be present in soluble and non-soluble forms. Changing volumes and flow rates in water courses can also add an extra complication. The method, location and timing of sampling will all affect the results, as will the nature of the analysis conducted. This is not to suggest that monitoring water quality is too difficult to contemplate, rather it needs to be planned carefully. The booklet “Environmental water quality - a guide to sampling and measurement” (George et al., 1996) provides a

11: Eutrophication
-223-
very good guide for conditions in the south-west. The Water and Rivers Commission is currently coordinating the monitoring of nutrient concentrations in the South-west Hydrological Region. Table 11.5 presents the concentrations of phosphorus and nitrogen at which water is considered to be polluted. The levels presented for running and still surface water indicate at which point excess algal growth is likely, and will vary according to other environmental conditions such as water salinity, temperature, light availability and water turbidity. The levels for human and livestock consumption indicate when health problems are likely if the water is consumed. Table 11.5: Guidelines for the maximum, safe levels of nutrient in water for various uses. Total
phosphorus mg/L
Total nitrogen
mg/L
Nitrates (NO3) mg/L
Nitrites (NO2) mg/L
Running waters (rivers and streams)
0.01-0.10 0.10-0.75 0.40
Static waters (lakes and dams)
0.005-0.050 0.10-0.50 0.25
Human consumption 0.20 10.0 1.0 Livestock consumption 30.0 10.0 Source: George et al. (1996) Assessing the degree of nutrient loss from a particular area of land is not necessarily straightforward because nutrients are lost from the surface as well as from depth. Nutrient concentrations in water leaving the land can be measured. This is easiest if all the water leaves the area as stream flow, because only one or a small number of sampling points will be required. Things become more complicated when nutrients are also removed by groundwater. Monitoring soil nutrient levels is another way of assessing potential nutrient loss. Soil nutrient monitoring has the added benefit of ensuring that fertiliser applications are matched to crop and pasture requirements. This not only allows the farmer to maximise productivity but can save money by avoiding unnecessary fertilising costs at the same time as reducing nutrient export. Collecting soil samples (to a depth of 10 cm for broadacre farming and to 15 cm for horticulture) with the aid of a sampling tool, such as a pogo stick, is the traditional method of sampling soil and is the simplest way of assessing nutrient levels. Multiple samples (20-30) are taken and bulked together because nutrients in the soil can vary significantly. Samples taken from different paddocks or different soil types should not be mixed together. Samples should be taken between growing seasons (e.g. January to March for annual pastures or winter crops) and at least three months after fertilisers are applied. They should also be taken at the same time each year. The samples then need to be sent to a commercial laboratory for analysis. Available phosphorus and nitrogen (water soluble or weakly bonded) are among the analyses carried out routinely. Programs such as NP-DECIDE or PHOSUL-K (see Section 11.2.3 below) can then be used to assess if the nutrients present are excess to requirements.

11: Eutrophication
-224-
Table 11.6 presents an indication of suitable phosphorus levels for the growth of crops and pastures. On soils with a low phosphorus status, a large growth response (>15%) would be expected if fertiliser was applied. On soils with a moderate status, only a small response (<15%) to fertiliser would be expected and only maintenance dressings are required. Little or no fertiliser response would be expected on soil with a high status. This table should be used as a general guideline only, as the requirements of individual plant species and sorption by soil can vary greatly. Table 11.6: Generalised interpretation guidelines of available phosphorus in soils.
Phosphorus status1 (ppm)2
Soil phosphorus adsorption ability
PRI Reactive iron
(ppm)2
Crop
Low Moderate High Dryland pasture <10 10-30 >30 Grain crops <15 15-45 >45
Low
<50
<500
Vegetable crops <20 20-60 >60 Dryland pasture <20 20-60 >60 Grain crops <30 30-90 >90
Moderate to high
>50
>500
Vegetable crops <50 50-150 >150 1. Colwell-extractable phosphorus for 0-10 cm. 2. ppm = mg/kg Adapted from: Moody and Bolland (1999) Table 11.6 was designed as a general guide to be used on an Australia wide basis. While the guidelines are appropriate for much of the South-west Hydrological Region, they are less applicable to the sandy soils of the Coastal Plains where leaching is the dominant process of nutrient loss. Table 11.7 presents phosphorus status guidelines developed for pastures on the sandy soils of the Swan Coastal Plain. Table 11.7: Interpretation guidelines for pastures on sandy soils.
Phosphorus status1 (ppm)2
Potassium status (ppm)2
PRI Reactive iron
(ppm)2 Low Moderate High Low Moderate High
Sulphur response3
(% growth increase)
<2 <100 <7 7-10 >10 <80 80-120 >120 >33% <2 100-200 <8 8-13 >13 <8 8-13 >13 >33% 2-7 200-400 <17 17-20 >20 <17 17-20 >20 >25-33%
8-15 400-800 <20 20-25 >25 <20 20-25 >25 12-33% 16-35 800-1,600 <25 25-35 >35 <25 25-35 >35 12-25%4 >35 >1,600 <30 30-45 >45 <30 30-45 >45 Nil5
1. Colwell-extractable phosphorus for 0-10 cm. 2. ppm = mg/kg. 3. Sulphur response refers to likely growth increase if sulphur fertiliser is applied. 4. Nil response when PRI is >30 and reactive iron is >1,400 ppm. 5. A sulphur deficiency can develop over time even on soils with >2,000 ppm reactive iron. Adapted from: Glencross (1995) If nutrient loss is of concern, sampling only the top 10 cm of the soil will not provide a complete picture. Samples taken from varying depths down the profile will help identify whether or not leaching is occurring. High levels of available nutrients in the subsoil would suggest movement down the profile, and would be especially of concern if found below the root zone. It would not be necessary to collect as many samples from the subsoil as from the surface, as there should be less disturbance and variability.

11: Eutrophication
-225-
11.3.2 Which farm management practices need to be changed? Farm management practices to control nutrient loss from diffuse sources mainly involve ensuring suitable rates of fertiliser application. Other tactics include growing plants that make use of as much of the nutrients and water in the soil as possible or implementing management to reduce erosion and waterlogging. Fertiliser applications on pastures The over-application of fertilisers is one of the major factors contributing to eutrophication. Sometimes, significantly more fertiliser is spread than is required by plants. In other cases, fertilisers are applied at an even rate across different soil types with the result that some soils are over-fertilised while others are under-fertilised. Another common problem is that fertilisers containing a variety of nutrients are used to improve growth when pastures are suffering from deficiencies in only one element. A typical example is the application of superphosphate to pastures growing on soils with sufficient stores of phosphorus but requiring sulphur. This can result in the unnecessary application of 10-18 kg/ha of phosphorus. The first step in reducing nutrient loss should to match fertiliser applications to pasture requirements, while taking into account existing nutrient levels in the soil. Regional surveys have shown that 50-70% of agricultural soils in the coastal districts of the South-west Hydrological Region contain high levels of bicarbonate extractable phosphorus (in excess of plant growth requirements) and so do not require the addition of phosphate fertilisers for at least one year (Yeates et al., 1985; Weaver et al., 1994). Trials have shown that when there is no further addition of phosphorus to these “high status” soils, pastures growing on clays and loams will not suffer phosphorus deficiencies for at least 4-6 years. In deep sands the soil will sometimes continue to provide sufficient phosphorus for up to 3 years. Soil sampling and analysis (see Section 11.3.1 above) are essential to ensure appropriate fertiliser applications. The PHOSUL-K computer model (Yeates et al., 1991) was developed to help advisers give fertiliser advice to farmers in the high rainfall (>700 mm) area of the south-west. It deals with the nutrients phosphorus, sulphur and potassium and uses information on soil analysis, soil type, fertiliser cost and enterprise profitability to work out four alternative fertiliser programs for each paddock. The model will often demonstrate how phosphorus applications can be reduced, which saves money, increases productivity and reduces nutrient loads in waterways. Apart from reductions in the amount of superphosphate spread, the model provides options for incorporating other fertilisers. Coastal super was developed for use pale sands in the high rainfall districts of the south-west. It is a slow release fertiliser containing 70% superphosphate and 30% elemental sulphur (rock phosphate is no longer included). The high sulphur content means that coastal super can be applied to many soils at lower rates than superphosphate. Applications of gypsum can be used if pastures require only sulphur, while a mix of gypsum and muriate of potash will supply potassium and sulphur. Coarse rock gypsum is suitable for use in high rainfall districts on pale deep sands prone to leaching. Soil sampling and the PHOSUL-K model have helped modify the fertiliser practices of landholders in the Peel-Harvey catchment. This contributed to a 33% decrease in phosphorus applications between 1982 and 1986 and a 30-40% reduction in phosphorus exported from the catchment. Recent investigations (Summers and Rivers, 1999) have shown the potential for coating superphosphate with bauxite residue to reduce phosphorus leaching, and a slow release sulphur fertiliser called “Ironman Gypsum” which is developed from the waste from mineral sands processing. Non-soluble rock phosphate is a fertiliser that reduces the risk of leaching because it releases the phosphorus slowly. On most soils, not enough phosphate is released from this fertiliser to satisfy pasture requirements (Bolland and Glencross, 1992). However, rock phosphate is good option on many of the acidic sands (with a dark coloured topsoil due to the presence of organic matter) found in poorly drained areas of the Coastal Plains. Pastures on these soils respond well to applications of rock phosphate and leaching is greatly reduced. Rock phosphate is unsuitable for soils with a PRI greater than 5. Animal manure used to provide nutrients for pastures should only be applied in volumes that add nutrients at the same rate as in fertiliser applications. Careful note needs to be taken of the nutrient balance of these manures, as most contain a high proportion of phosphorus in relation to nitrogen. This means that spreading manure often leads to a significant over-application of phosphorus in order to provide sufficient nitrogen.

11: Eutrophication
-226-
A buffer strip of at least 10 m of land on which no fertiliser is applied should be made around waterways including all drains, streams, swamps and wetlands. Buffer strips should be wider (20 m or more) on sandy soils, sloping land prone to erosion and in areas of poor vegetation cover. Broader buffer strips are also recommended around sensitive remnant vegetation (such as banksias) and a 50 m buffer strip should be left to protect conservation wetlands. Pastures growing in the buffer strip will receive sufficient nutrients as a result of fertiliser being washed or leached from the remainder of the paddock. By leaving a buffer strip the landholder saves on fertiliser costs as well as reducing the risk of eutrophication. Avoiding firebreaks when fertilising is another way of improving the efficiency of nutrient application. The timing of fertiliser applications is also important. Most "broadacre" farmers apply their fertilisers in late summer to early autumn because the paddocks are accessible and the break of season is near. Unfortunately this often corresponds to a period of high thunderstorm activity (with heavy rain) and little or nil plant growth. At this time of the year large volumes of runoff can transfer nutrients and topsoil directly into the water bodies, while in highly permeable soils nutrients can be leached before plant growth commences. If pastures are growing on sandy soils where leaching is likely to be a problem, phosphate fertilisers should applied after the break of season. This can be done in May-June on soils with low levels of available phosphorus. Where there are good stores of phosphorus in the soil, a maintenance dressing of phosphorus should be applied in August along with sulphur and potassium (if required). Phosphorus should be applied to irrigated pastures in early spring when the soil is moist, either three weeks before the first irrigation or just after irrigation commences. Irrigation should not be restarted for at least a couple of days after fertilising. This allows the phosphorus to move out of the granule and into the soil. In the first two or three irrigations following fertilising, it is important to ensure that there is no runoff at the end of the bay. If too much water is applied, phosphorus is likely to be washed away into the drains. A buffer strip of 20 m where no fertiliser is applied should be left at the bottom of the bay. Broadacre cropping Most of the points made above concerning pastures apply equally to fertilising broadacre crops. Matching fertiliser applications to crop requirements using soil testing is also important. The lime and nutrient calculator (TopCrop Australia, 1998) can be used to estimate amount of nutrient lost from a paddock following various cropping and pasture sequences. This information can then be used to determine likely fertiliser requirements. The emphasis on the sandy soils of the Coastal Plains is of less relevance here because most cropping occurs further inland. If nutrient loss from cropping areas is of concern, one option that could be considered to is sow crops that are better adapted at extracting phosphorus from the soil. Crops such as canola, chick peas and some varieties of lupins are able to take up considerably more of the phosphorus stored in the soil than crops such as wheat and they also require lower levels of fertilising. Many of these crops exude acids to release phosphorus bound by the soil, and can actually increase phosphorus availability for wheat planted the following season. Nutrient management in horticulture The principal of not over-fertilising applies to horticultural crops as much as it does to broadacre farming. Soil testing to determine the optimum rate of phosphorus application is important. Some vegetable growers are currently applying phosphorus at 2-10 times the required rate in yellow deep sands that already have good phosphorus stores. McPharlin and Hegney (1997) and Anon. (1996) provide guidelines for fertiliser requirements of various vegetable crops on yellow deep sands with varying amounts of available phosphorus. Tissue testing the crops is more applicable for assessing nitrogen requirements. Lantzke (1997) and Anon. (1996) presents recommendations for upper rates of nitrogen application for various vegetable and tree crops on the same soil. Guidelines for other soil types are currently being developed. Applications of poultry manure prior to sowing can contribute significantly to nitrogen leaching and these nitrogen applications before planting are unnecessary. Applying fertilisers in small, regular doses reduces the chances of leaching. This is especially the case when applying phosphorus to pale deep sands or nitrogen to any sands. Fertigation, applying dissolved fertilisers through the

11: Eutrophication
-227-
irrigation systems, is an effective way of achieving this because fertiliser can be applied daily at the required rate to meet immediate crop demands. Irrigation management is an important component of reducing nutrient loss from horticultural land, especially on sandy soils. Over-watering is not only costly, but can leach nutrients below the root zone. Automatic irrigation systems with controllers, injectors and soil moisture monitoring devices can be used to ensure that crops receive the water the require without leaching the nutrients. Low output drip and mini-sprinklers are more efficient at delivering the required amount of water than high output impact sprinklers. Anon. (1996) presents guidelines for irrigation management. Erosion control (see below) is another important consideration in reducing nutrient loss from horticultural properties. Soil amendment Considerable research has been conducted to investigate the suitability of soil amendments such as red mud to improve soil phosphorus retention. Red-mud (bauxite residue) is the by-product formed when alumina is extracted from crushed gravels and ironstone (bauxite) with hot caustic soda (sodium hydroxide). Red mud is now produced under the name Alkaloam-gypsum®, but it has not yet been released for commercial use. Current processing methods applied to the bauxite mined from the Darling Range removes about 35% of the original bauxite. The red mud is the fine fraction of the bauxite residue. Although 50% of the particles are less than 10 microns in size, they tend to agglomerate and behave like a silt. The residue remains highly alkaline (pH 10.8) even though it is washed to reclaim most of the caustic soda. Using bauxite residue to retain nutrients in Western Australia was first suggested by Barrow (1982) following laboratory studies. When sandy soils on the Coastal Plains are treated with red mud, they show: • improved phosphorus retention due to the high iron and aluminium oxides, • increased pH due to the high alkalinity of the mud, • improved water retention due to the inclusion of smaller particles, and • fewer non-wetting problems. Field trials have shown that when red mud was applied to these soils at 80 t/ha, phosphorus leaching was reduced by 70%, decreasing from over 14 kg/ha to 4 kg/ha (Summers et al., 1993). Applying red mud at a rate 20 t/ha over 1,600 ha of sandy soils resulted in a 50% reduction in phosphorus loads in the waterways draining a 4,300 ha property and a 25% improvement in pasture production was also noted (Summers and Rivers, 1999). If red mud is applied at rates in excess of 250 t/ha, gypsum may need to be added to reduce its pH. Up to 20 t/ha of red mud can be spread over the surface of grey sandy soils with only a light harrowing required. At the heavier application rates (60-240 t/ha) that are required on some pale deep sands for horticultural production, the bauxite residue needs to be mixed into the soil. Lantzke (1999) recorded lower yields for some horticultural crops in the first year after applying the red mud, but pre-application yields were achieved in subsequent years. When red mud becomes available, the Environmental Protection Authority will apply some controls for its use. Perennial vegetation Incorporating deep-rooted perennial pastures, shrubs and trees into a farming system can decrease nutrient losses. The principles of increasing nutrient uptake by plants are essentially the same as those applying to lower recharge farming systems for salinity or waterlogging control. Perennial species are able to extract nutrients from the soil almost all year round, and their deep root systems enable them to tap nutrients that have leached beyond the reach of many annual species. Because of their greater biomass, trees and shrubs will take up and hold more nutrients than pastures. The use of perennial species can range from strategically placed windbreaks and shelter belts to farm forestry or grazing systems based on perennial species. Streamlining and filter strips (see below) are another option. Section 5.3.2 has details on incorporating deep-rooted perennial species into a farming system. The pasture species lucerne (Medicago sativa), chicory (Cichorium intybus), consol lovegrass (Eragrostis curvula), Rhodes grass (Chloris gayana), veldt grass (Ehrharta calycina), couch (Cynodon dactylon) and sheep’s burnet (Sanguisorba minor), as well as the fodder shrub tagasaste (Chamaecytisus palmensis), could be planted on well drained sands that usually make a major contribution to nutrient export. A wide variety of tree species could be planted, though growth rates

11: Eutrophication
-228-
may be insufficient for timber production on the deeper sands. In these situations, rose gum (Eucalyptus grandis) may have the best potential. Section 7.3.2 deals specifically with pastures suited to waterlogged areas, on which improving productivity and nutrient uptake are especially important in order to combat nutrient loss. Suitable species include kikuyu (Pennisetum clandestinum), phalaris (Phalaris aquatica), tall fescue (Festuca arundinacea), Paspalum (Paspalum dilatatum), balansa clover (Trifolium michelianum) and strawberry clover (Trifolium fragiferum). Bangalay gum (Eucalyptus botryoides), swamp mallet (E. spathulata), wandoo (E. wandoo), river red gum (E. camaldulensis) and swamp mahogany (E. robusta) are some of the tree species that could be used for agroforestry in waterlogged areas. Streamlining and filter strips Many of waterways in the South-west Hydrological Region have been cleared of their natural fringing vegetation and have been used as watering points with uncontrolled stock access. This has significantly contributed to eutrophication problems. Revegetation and fencing to exclude stock is known as streamlining and has been demonstrated to be effective in rejuvenating rivers, streams and drains by improving water quality, preventing erosion and promoting a more diverse ecology. The vegetation can include trees, shrubs, herbs, grasses, reeds and rushes. Attempts can be made to recreate natural ecosystems, or just provide filter strips of perennial grasses. The vegetation acts in several ways. It: • stabilises the streambanks of the waterway and sediment in the channel, • slows stream flow velocity to allow for increased assimilation of nutrients, • filters runoff flowing into the waterway by trapping sediments and attached nutrients, • intercepts groundwater flows containing dissolved nutrients before they enter the waterway, • extracts nutrients from water flowing down the waterway, • improves shade, evaporation and temperature control of the waterway, and • provides a habitat for waterbirds, fish and other organisms that increase nutrient cycling. Fencing to exclude stock from waterways is important for a number of reasons. Livestock will damage fringing vegetation through a combination of grazing pressure and trampling. By disturbing the streambanks they also contribute to erosion. Finally, if stock have access to the waterway, they usually deposit nutrients directly into it in the form of manure or urine. If there is a filter strip of pasture present, periodic grazing, slashing or harvesting of hay can be used to control weeds and the fire risk while re-cycling nutrients back into paddock. The Pinjarra Community Catchment Centre have produced a booklet detailing the implementation and effects of stream lining (Heady and Guise, 1994). For livestock, fenced buffer strips of 10 m are usually adequate on relatively flat land. Fencing off waterways will often mean that alternative watering facilities for livestock (e.g. pumping into troughs) are needed. This can be beneficial as it usually results in cleaner water that increases stock appetite and reduces the risk of disease. Guidelines have been produced for the width of buffer strips needed on the Swan Coastal Plain between land used for vegetable production and drains, waterways and wetlands (Lantzke and Galati, 1997). These buffer strips range from 20 m on soil with good nutrient retention characteristics to 100 m on pale deep sands. Erosion control Implementing measures to control runoff and soil erosion will reduce the risk of nutrient export. Controlling erosion is especially important because phosphorus bound to soil particles plays a major role in the eutrophication of waterways (see the sub-heading “Eutrophication” in section 11.2.1 above). Such measures include: well designed farm layout, management of grazing pressure to maintain good ground cover, adoption of suitable cultivation practices and the use of earthworks to control runoff. See Section 9.3 for more details.

11: Eutrophication
-229-
11.3.3 Engineering options and other management techniques Drainage, developing wetland filters, and using nutrient rich waters on the farm are some of the options that can be considered for reducing nutrient export from diffuse sources. Intensive animal industries require the development of specialised systems to deal with the disposal of waste and effluent. The treatment of algal blooms in eutrophic water supplies is covered at the end of this section. Drainage Draining waterlogged soils can be a “double-edged sword” in relation to nutrient loss. By reducing waterlogging and promoting improved crop and pasture performance, drainage increases the amount of nutrients taken up by plants. On the other hand, drainage may increase nutrient export by providing a fast means of transporting nutrients into the natural waterways. This is not true of all drainage systems, of course. A system of collector and mole drains, for example, can decrease runoff rates by improving sub-surface drainage, and therefore reduce nutrient export. It is important to differentiate the impacts of each type of drainage system on nutrient flows before choosing which type of drain to install. Installing grade banks and seepage interceptor drains upslope can reduce waterlogging by diverting water away from waterlogged areas. Levee banks can be built to contain flood waters that spread across flats, contributing to waterlogging and washing nutrients away. Spoon or w-drains will improve surface drainage on waterlogged areas and promote better pasture growth. Deep open, mole or tube drainage can be used to lower water tables. Section 7.3.3 provides more details on controlling waterlogging with drains. Before installing artificial drainage on land that is likely to make a significant contribution to nutrient export, it is important to have an understanding of the soil properties and hydrological processes that are operating. On highly permeable soils with poor nutrient retention, drains may increase the speed of nutrient leaching and removal. However, if groundwater currently sits above a subsoil that has good nutrient retention and is highly permeable (e.g. a layer of coffee rock that is weakly cemented), lowering the water table may increase nutrient retention. If the subsoil layer that retains nutrient has a low permeability (e.g. a poorly structured heavy clay or strongly cemented hardpan), little benefit may be derived from drainage. Nutrient loss may also be reduced if waterlogged loamy soils are drained. Surface drainage of clays that have slow infiltration rates may result in more nutrients being removed by runoff before they can be incorporated into the soil. Groundwater drainage of the same soils is likely to result in improved infiltration and nutrient retention. Monitoring irrigated paddocks at Wokalup shows that nutrient levels in surface drains are several times higher than levels in the water flowing out of mole drains. The Commissioner of Soils and Land Conservation must be notified at least 90 days before a new drainage or pumping scheme is set up if the scheme will discharge saline water onto other land, or into water or into a water course. For further information is available at Agriculture Western Australia. Additional controls on drainage apply in the Peel-Harvey Catchment. In this area contact the Pinjarra Community Catchment Centre. Wetland filters Natural wetlands on the Swan Coastal Plain absorb nutrients from agricultural runoff, with dynamic processes ensuring that nutrients are trapped and recycled within the wetland (Chambers et al., 1993). The construction of artificial wetlands also has the potential to slow the water flows, allowing sediments to be trapped and dissolved nutrients assimilated. The aim is to design wetlands that duplicate physical, chemical and biological processes in natural wetlands. The water should flow through a lagoon, settling basin, or other type of solids trap to remove sediment before it enters the wetland. The discharge rate from the lagoon can be controlled to prevent excessive flooding of the wetland. The constructed wetland usually comprises one or more "cells" in series or parallel. Multiple cells improve the effectiveness of the system and provide flexibility for operating and maintenance. These cells contain wetland plants and microscopic organisms that use both aerobic and anaerobic processes to assimilate dissolved nutrients and nutrients bonded to sediment. It can be difficult to design and manage artificial wetlands in areas such as the South-west Hydrological Region that experience their dominant rainfall in winter. This is because large volumes of water pass through the wetland in short periods, and the cold weather reduces biological activity at

11: Eutrophication
-230-
the time when the highest nutrient loads are usually generated. There appears to be a greater potential for artificial wetlands to filter runoff from small agricultural catchments than from large areas or from concentrated point sources (Chambers et al., 1993). Diverting runoff into existing natural wetlands should be avoided. These often already contain high concentrations of nutrients and adding extra water or nutrients to the systems could cause problems. If this resulted in the collapse of the ecosystem and increased outflow, the wetland could be transformed from a nutrient assimilator to a major source of export. On-farm re-use systems The nutrients contained in water flowing off a property can be re-used to increase on-farm production. By trapping and storing waters rich in nutrients on their farm, landholders can develop supplies to irrigate crops and pastures in summer and reduce fertiliser costs. In the Forested Hills and Western Woolbelt, grade banks and dams can be used to harvest and store water and nutrients. Nutrient rich groundwater below horticultural crops can also be used to recycle nutrients. In the South-west Irrigation Areas, runoff from tail drains can be stored in sumps and returned to the pastures. If such systems are implemented, it is necessary to monitor the quality of the water used. There is a need to ensure that: • sufficient nutrients are supplied to the crops and pastures, • the water does not become too saline, and • nutrient concentrations are not so high that they become toxic. It is also important that the nutrient rich water is stored in such a way that it does not become eutrophic, because algal growth will cause blockages in irrigation systems. Effluent and waste management The disposal of effluent and waste water from dairies and intensive animal industries can be a major source of nutrients in south-west waterways. Discharging effluent directly into a nearby drain or waterway is no longer considered acceptable and the way that landholders dispose of effluent is currently changing. The focus of nutrient management on dairy properties has changed from treating the effluent to make it suitable for disposal to re-cycling the nutrients by applying effluent to paddocks. This involves the construction of sumps to collect effluent from the dairy, yards, laneways, feeding areas and other areas where the cattle congregate. In the past the dairy has often been viewed as the main area of concern, however 90% of effluent is usually deposited elsewhere. Laneways in particular can be a major source of nutrient export as they are designed to shed water. Strategies should be implemented to reduce the amount of time cows spend in laneways and to ensure that runoff is directed evenly over pastures or collected in a sump. Traps or trafficable sumps can be constructed to filter sand and gravel from the effluent before it is applied to the pasture or transferred to effluent ponds by gravity flow or pumping. Effluent ponds are used to store the liquid waste for later use. Most ponds will produce some breakdown of solids and reduce bacterial activity but will have little effect on phosphorus loads. Liquid from storage ponds should never be discharged into drains or groundwater. Two important considerations when designing ponds are ensuring that they have sufficient capacity to hold the maximum amount of liquid produced, and ensuring that the pond is properly sealed and will not leak into underlying groundwaters. Two pond systems are usually the most appropriate. Having two ponds reduces the risk of failure, allows for improved biological treatment and provides more flexibility when applying waste to pastures. Ponds should be emptied twice a year, usually in autumn and spring. George et al. (1999) provide more information on the effectiveness of dairy effluent ponds on the Swan Coastal Plain From the storage ponds, effluent should be applied to pastures or fodder crops to provide them with water and nutrients. Separated solids can also be dried and sold to other farmers. The most appropriate time to apply effluent is when the pastures or crops are actively growing as this will be the time of maximum nutrient uptake. Effluent should not be applied to waterlogged or excessively dry paddocks, because this increases the likelihood of runoff and nutrient loss. The effluent can be added to pasture through sprinkler systems or by mixing it with water used to flood irrigated paddocks. Slurry tankers can also be used to spread effluent on paddocks. Monitoring of

11: Eutrophication
-231-
nutrient and salinity levels in the soil and effluent helps to develop irrigation strategies that ensure maximum pasture productivity and reduce nutrient export. More details can be obtained from the management guidelines for dairy farm effluent prepared by the Dairy Industry Nutrient Strategy Working Group (1998). Controlling algal blooms in on-farm water supplies Filtering runoff water through silt and manure traps at the dam inlet will help to reduce the eutrophication of on-farm water supplies. These traps may be fenced off vegetation buffer strips or highly permeable filters of hay and sand. The management practices mentioned in Section 11.3.2 will also reduce nutrient input from surrounding land into dams. Covering the water to exclude the light necessary for algal growth is another method of preventing the blooms. Single or repeated treatments using block ferric alum at the rate of 50 mg/L will reduce algal blooms in farm dams. It removes phosphorus from the water by causing it to precipitate and sink to the bottom where it is unavailable to algae. Barley straw may also inhibit algal growth in dams. The straw must be placed in the water several weeks, if not months, before the expected algal bloom. Algae in water supplies can be killed with a number of chemicals, including Simazine and calcium hypochlorite. Simazine is most effective but should not be used where water is for household consumption, contains fish or crustaceans. Water containing Simazine can also kill plants if it is used for irrigation. Copper sulphate is no longer recommended for killing algae because of its toxic qualities. Calcium hypochlorite is less toxic if used properly, but fish and crustaceans may still be killed. For best results, chemical treatment should be done when algal development is first noticed and the algae should be the removed mechanically before the chemical is applied. Water consumption by humans or animals should be delayed for two weeks until all the toxins released when the algae died dissipates. For further details see Agriculture Western Australia Farmnote No. 43/94. An alternative to chemicals is to drag algae and scum off the water with a net or any type of scooping device. This reduces any problems with the algae dying and settling to form an ooze at the bottom of the water body or poisoning any life forms such as marron, gilgies or fish with chemicals. This is only practical at a small scale, e.g. a 20 m2 bloom in a dam.

11: Eutrophication
-232-
11.4 SOURCES OF FURTHER INFORMATION
11.4.1 Useful publications See Appendix 1 for contact details of the publishing organisations. Available from Agriculture Western Australia: Soilguide. A handbook for understanding and managing agricultural soils contains a chapter titled Soil factors influencing eutrophication (Weaver and Summers, 1998). The chapter discusses the factors affecting nutrient loss from soils and management options for reducing this loss. It also contains chapters about the use of nitrogen (Mason, 1998), phosphorus (Bolland, 1998) and other nutrients in agricultural soils. The Journal of Agriculture Western Australia (Ayling, 1984; 1989) has two separate issues devoted largely to topics associated with the management of nutrients on the Swan Coastal Plain. Articles in the 1984 edition include algal problems in the Peel-Harvey Estuary, the algal growth cycle, soil types and drainage, the soil phosphorus store, modifying fertiliser practices and alternative land uses. Articles in the 1989 edition cover topics such as irrigation and fertiliser management for horticulture, improving fertilising practices on grazing land, growing trees and intensive agricultural industries. Environment water quality - A guide to sampling and measurement (George et al., 1996) provides a good summary of water pollution in the South-west Hydrological Region as well as guidelines for collecting surface and groundwater samples and analysing results. Streamlining - An environmentally sustainable drainage network for the Swan Coastal Plain (Heady and Guise, 1994) provides information on physical drain modification, the exclusion of livestock and the vegetation of streambanks to reduce nutrient flows in drains in the Peel-Harvey catchment. Fertilisers for pastures on sandy soils of the Swan Coastal Plain (Angell, 1999) covers strategies for reducing nutrient loss from pastures on the sandy soils of the Swan Coastal Plain. It also includes tables showing soil nutrient test standards and recommended application rates for various fertilisers to supply certain levels of nutrients. Soil testing for vegetable production on the coastal plain (McPharlin and Hegney, 1997) describes the process for soil testing to ensure suitable rates of fertiliser are applied to vegetable crops. Fertiliser recommendations for the Swan Coastal Plain are also presented. Lime and nutrient calculator (TopCrop Australia, 1998) provides farmers and advisers with a means of estimating the amount of lime equivalents or nutrients (including phosphorus, potassium, sulphur, calcium, magnesium, copper, zinc, manganese, molybdenum and boron) lost from a paddock following various cropping and pasture sequences. The calculator consists of a number of cardboard dial for making the calculations and comes with explanatory notes. Codes of practice for vegetable production on the Swan Coastal Plain (Lantzke and Galati, 1997) provides guidelines for site selection, fertiliser management and the application of poultry manure on horticultural properties on the Swan Coastal Plain. Environmental guidelines for horticulturists in the Lower Great Southern (Prout and McFarlane, 1996) provides brief guidelines to avoid leaching of nutrients under horticultural crops. Environmental guidelines for horticulture within the Peel-Harvey Catchment (Anon., 1996) provides guidelines for nutrient management of a variety of horticultural crops (including upper limits of phosphorus and nitrogen application), irrigation management and soil amendments. Environmental management for animal based industries - dairy farm effluent (Dairy Industry Nutrient Strategy Working Group, 1998) provides guidelines for disposing of dairy effluent. Topic covered include the design of ponds, spreading waste on the land and regulations relating to waste management. Environmental guidelines for new and existing piggeries (Latto et al., 2000) provides guidelines for environmental management with an emphasis on waste disposal. Perennial grasses for animal production in the high rainfall areas of Western Australia (Greathead et al., 1998) provides assessments of the economics, establishment and management of

11: Eutrophication
-233-
perennial pastures using case examples from sites on the Swan Coastal Plain and the south of the Forested Hill and Western Woolbelt. Perennial grasses for areas receiving less than 800 mm annual rainfall (Sudmeyer et al., 1994) provides information on the general characteristics, site selection, establishment and management of a variety of perennial species suitable for specific niches in lower rainfall districts. A series of keys in the appendix assist in identifying potentially suitable species for a variety of situations. Although written specifically for low rainfall districts, much of the information in this publication is equally relevant to the Coastal Plains. Tagasaste and Acacia saligna establishment using bare rooted seedlings (Angell and Glencross, 1993) provides a guide for establishing and managing plantings of these two species on farmland on the Swan Coastal Plain. Tree planting on the high rainfall coastal plain (Bennett and George, 1993) was specifically prepared for the Swan Coastal Plain and provides a guide to species selection, planting design, site preparation, planting and weed and pest control. Field planting of trees and shrubs: A guide for landowners and developers in the Shires of Serpentine-Jarrahdale and Murray (Mortlock et al., 1993) is a short booklet specifically targeting landowners in the Peel-Harvey Catchment and provides a good guide for matching species to soil types. Relevant Agriculture Western Australia Farmnotes include: General information
15/86 An introduction to conservation farm planning 97/91 Taxation and the control of land degradation 21/98 Manure management on small properties 41/98 Trafficable sumps (dairy manure handling) 53/98 Disposing of milk
112/99 Farm laneways – design and construction Fertiliser management and irrigation
94/84 Soil testing – a guide to fertiliser use 54/90 Management of estuarine catchments: coastal superphosphates 30/92 Design guidelines for fixed sprinklers and micro-irrigation systems 16/93 Soil testing for phosphorus 79/94 Soil moisture sensors for sandy soils 99/94 Selection of fertigation equipment 2/95 Nitrates in the groundwater beneath horticultural properties
66/95 Irrigating vegetables on sandy soils 33/96 Effectiveness of rock phosphates 39/98 Managing nutrients on irrigated pastures
Drainage 45/86 Drainage of saline and waterlogged soils 79/86 Legal aspects of land drainage 70/89 Reverse-bank seepage interceptor drains 71/89 Surveying and construction of reverse-bank seepage interceptor drains 73/89 Waterways
9/91 Responsibilities of landholders under agricultural Acts: Water and drainage 62/91 Banks and drains for sloping land
106/91 Spoon and W-drains 47/93 Notification of draining or pumping saline land 26/94 Notification of intention to drain or pump water in the Peel-Harvey Catchment
Treating eutrophic water supplies 84/85 Emergency chlorination of farm dams 11/87 Skimming polluted dams - a successful two stage system
103/89 Grass filter strips to prevent dam pollution 43/94 Toxic algal blooms

11: Eutrophication
-234-
Pastures, trees and shrubs 102/88 Fitting trees into the farm plan 32/89 Simple electric fencing to protect bush areas on farms 61/90 Balansa clover 79/93 Managing waterlogging and inundation in pastures 11/95 Kikuyu – the forgotten pasture? 59/96 Green feed in summer 4/98 Dryland lucerne: establishment and management
20/99 Perennial grasses – their role in Ellen Brook Catchment 26/99 Establishing balansa and Persian clovers on waterlogged, mildly saline soils
Relevant TreeNotes (available form Agriculture Western Australia or the Department of Conservation and Land Management) include: No. 1 Growing eucalypts for high grade sawlogs No. 2 Preparing sites for tree planting in the greater than 600 mm rainfall zone No. 3 Thinning for sawlogs No. 10 Farm forestry definitions and designs No. 11 Benefits of farm forestry No. 12-16 Farmer experiences in farm forestry No. 17 Tree planting - in the medium to high rainfall zone of Western Australia No. 18 Growing pines for wood products No. 19 Harvesting farm grown trees: three growers’ experiences No. 20 Weed control in eucalypts and pines in the greater than 450 mm rainfall zone No. 21 Insect pests of eucalypts and pines in the greater than 450 mm rainfall zone No. 22 Windbreak design and management in the greater than 450 mm rainfall zone No. 23 Timber production from windbreaks in the greater than 450 mm rainfall zone No. 24-25 Farmer experiences in farm forestry No. 26 Parrot damage in agroforestry in the greater than 450 mm rainfall zone No. 27 Growing Tasmanian blue gum - overview in the greater than 600 mm rainfall zone No. 28 Growing Tasmanian blue gum for pulpwood – the profit potential in the greater than 600 mm
rainfall zone No. 29 Rectifying parrot damage in eucalypts in the greater than 450 mm rainfall zone Available from Water and Rivers Commission: Explanatory notes for the groundwater vulnerability to contamination maps of the Perth Basin (Appleyard, 1993) contains a 1:500,000 scale map showing the risk of groundwater contamination on the Swan Coastal Plain and Donnybrook Sunklands and explanatory text. Relevant Water facts (a series of pamphlets available from the Water and Rivers Commission) include: No. 2 Macroinvertebrates and water quality No. 3 River and estuary pollution No. 4 Living streams (streamlining and restoration) No. 6 Algal blooms No. 10 Groundwater pollution Available from Blackwood Basin Group: Repairing farm waterways – Blackwood stories (Karafilis, 2000) contains a collection of case studies of riverbank restoration from landholders in the Blackwood Catchment. Available from the Environmental Protection Agency: Environmental code of practice – Poultry industry (DEP, 1991) a small booklet containing environmental guidelines for locating and operating feedlots, including the disposal of solid and liquid waste. Environmental code of practice – Cattle feedlots (DEP, 1993) a small booklet containing environmental guidelines for locating and operating poultry sheds, including the management of poultry litter and manure.

11: Eutrophication
-235-
Other publications: Soil analysis - an interpretation manual (Peverill et al., 1999) provides a comprehensive guide for interpreting soil analysis results. The chapters on phosphorus and nitrogen provide a number of examples from Western Australia and cover a variety of pastures and crops. Fertiliser use guidelines for the Swan Coastal Plain of WA (Kingdon, 2000) details the fertilisers used on the Swan Coastal Plain, best management practices, calculating application rates and fertilisers in the environment. 11.4.2 Agencies and organisations to contact The following agencies and organisations can be contacted for more information (postal address, phone numbers, e-mail address and Internet websites of each organisation are listed in Appendix 1): The local district office of Agriculture Western Australia or Community Agriculture Centres (CAC) can provide information, publications and suitable contacts for specific topics relating to nutrient loss and eutrophication. Some offices will test the salinity of soil and water samples for a fee. Information on computer models, such as “Phosul-K” and “DECIDE” should also be available. The local Land Conservation Officer (LCO) at Agriculture Western Australia should be contacted regarding regulations covering land clearing or drainage. AGWEST Land Management Services and other agricultural consultants can assist with the preparation of farm plans and dam design for a fee. Consultants are listed on the Australian Association of Agricultural Consultants website. The Chemistry Centre (WA) and a number of commercial laboratories can analyse soil and water samples for a fee. The local Community Landcare Coordinator (CLC) will be able to provide advice or suitable contacts for most issues related to nutrient loss and eutrophication. They will also be able to help with the preparation of submissions for grants for land conservation works. CLCs can be contacted via the Shire Office or through Agriculture Western Australia. Community Landcare Technicians (CLT) can help design and survey earthworks and drains for a fee. The local office of Agriculture Western Australia or Community Landcare Technician Association should be able to provide contact numbers for local CLTs. Fertiliser companies and agricultural consultants can help interpret soil analyses and provide fertiliser recommendations. The Environmental Protection Authority is responsible for regulations concerning water quality and the preservation of wetlands. The Farm Forestry Advisory Service is a joint initiative between the Department of Conservation and Land Management (CALM) and Agriculture Western Australia providing information to help landholders integrate tree farming with agriculture. They produce a number of publications and decision making tools. Contact CALM in Busselton or Bunbury, or Agriculture Western Australia in Bunbury, Manjimup or Narrogin. Horticultural consultants can provide advice on crop water requirements and irrigation scheduling. Contact the Irrigation Association of Australia for a list of certified irrigation designers. Inlet management authorities and catchment committees are another potential source of assistance. Relevant inlet management authorities are the Peel Inlet Management Authority (PIMA), Leschenault Inlet Management Authority (LIMA) and Wilson Inlet Management Authority (WIMA). Geocatch Network Centre (operating in the Geographe Bay Catchment area) and the Blackwood Basin Group can help provide local contacts and information about funding sources. The local Landcare Group or Land Conservation District Committee (LCDC) can often provide contact with landholders who have local experience about successful approaches to tackling nutrient loss and eutrophication.

11: Eutrophication
-236-
The Land Management Society can help provide information and establish contact with other landholders who have practical experience in tackling these issues. They also sell farm monitoring kits. The Pinjarra Community Catchment Centre provides a service to landholders and other community members in the Peel-Harvey Catchment Area. It is a one-stop-shop offering advice about land management issues that are available from the various government agencies. The Water and Rivers Commission is responsible for coordinating the management of the State’s waterways. As the leading agency for the Waterways WA program, the Commission provides technical expertise to support on-ground action by Local Government, community groups and landholders who require assistance to protect, revegetate and enhance waterways and wetlands. The Commission is also responsible for the allocation and licensing of water resources.

11: Eutrophication
-237-
11.5 REFERENCES
AEC (1987). Nutrients in Australian waters. Australian Environment Council Report No. 19, Australian Government Public Service, Canberra.
Allen, D.G. and Jeffery, R.C. (1990). Methods for analysis of phosphorus in Western Australian soils. Report of Investigation No. 37, Chemistry Center, Perth.
Angell, K. (1999). Fertilisers for pastures on sandy soils of the Swan Coastal Plain. Agriculture Western Australia, Bulletin No. 4357.
Angell, K. and Glencross, R. (1993). Tagasaste and Acacia saligna establishment using bare rooted seedlings. Department of Agriculture Western Australia, Bulletin No. 4262.
Anon. (1996). ‘Environmental guidelines for horticulture within the Peel-Harvey Catchment’. Western Australian Department of Agriculture and the Peel Horticultural Landcare Group.
Appleyard, S.J. (1993). Explanatory notes for the groundwater vulnerability to contamination maps of the Perth Basin. Geological Survey of Western Australia, Record No. 1993/6.
Ayling, G.P. (editor) (1984). Journal of Agriculture Western Australia, Volume 25, No. 3, 4th Series. Ayling, G.P. (editor) (1989). Journal of Agriculture Western Australia, Volume 30, No. 3, 4th Series. Barrow, N.J. (1982). Possibility of using caustic residue from bauxite for improving the chemical and physical
properties of sandy soils. Australian Journal of Agricultural Research 33: 275-285. Bennett, D.L. and George, R.J. (1993). Tree planting on the high rainfall coastal plain. Western Australian
Department of Agriculture, Bulletin No. 4274. Birch, P.B. (1982). Phosphorus export from Coastal Plain drainage into the Peel-Harvey Estuarine System of
Western Australia. Australian Journal of Marine and Freshwater Research 33: 23-32. Black, R.E., Lukatelich, R.J., McComb, A.J. and Rosher, J.E. (1981). Exchange of water, salt, nutrients and
phytoplankton between Peel Inlet, Western Australia, and the Indian Ocean. Australian Journal of Marine and Freshwater Research 32: 709-720.
Bolland, M. (1998). Phosphorus. In: ‘Soilguide - A handbook for understanding and managing agricultural soils’. (ed. G. Moore). Agriculture Western Australia, Bulletin No. 4343. pp. 168-175.
Bolland, M. and Glencross, R. (1992). Rock phosphates for high rainfall pastures are unlikely to reduce eutrophication of waterways. Western Australian Department of Agriculture, Technote No. 14/92.
Boney, A.D. (1989). ‘Phytoplankton’. (2nd edition). Edward Arnold, London, UK. Bowmer, K.H. (1984). Potential use of algal growth inhibitors in the Peel-Harvey estuarine system, Western
Australia. CSIRO Centre for Irrigation Research, Technical Report No. 2, Griffith, New South Wales. Briggs, I., Corbett, G., Humphries, B., McKellar, R. and Mulholland, S. (1992). ‘State of the environment report
- December 1992’. Government of Western Australia. Chambers, J.M., Wrigley, T.J. and McComb, A.J. (1993). The potential use of wetlands to reduce phosphorus
export from agricultural catchments. Journal of Fertilizer Research 36: 157-164. Congdon, R.A. and McComb, A.J. (1980). Nutrient pools of an estuarine ecosystem - the Blackwood River
estuary, south-western Australia. Journal of Ecology 68: 287-313. Cross, W.J. (1974). A look at pollution problems of Peel Inlet. Australian Marine Science Association Bulletin
48: 7-9. Dairy Industry Nutrient Strategy Working Group. (1998). Environmental management for animal based
industries - dairy farm effluent. Agriculture Western Australia, Bulletin No. 4336. Deeley, D.M., Paling, E.I. and Humphries, R. (1999). Why south-western Australian estuaries are highly
susceptible to nutrient enrichment. In: Proceedings of the International Conference on Diffuse Pollution. International Association of Water Quality, Perth, Western Australia, 16-20 May, 1999.
DEP (1991). Environmental code of practice – Poultry industry. Department of Environmental Protection, Perth.
DEP (1993). Environmental code of practice – Cattle feedlots. Department of Environmental Protection, Perth. Donohue, R., Parsons, G. and Deeley, D. (1994). Estimated annual loads of nutrients to the Leschenault
Estuary, 1984-1992. Waterways Commission, Report No. 47. George, R.J., Weaver, D. and Terry, J. (1996). Environmental water quality - a guide to sampling and
measurement. Agriculture Western Australia, Miscellaneous Publication No. 16/96. George, R.J., Bennett, D.L., Bell, J.R.M and Wrigley, R.J. (1999). Observations of shallow groundwater
contamination due to leakage of dairy effluent ponds on the Swan Coastal Plain, W.A. Agriculture Western Australia, Resource Management Technical Report No. 192.
Gerritse, R.G. and Adeney, J.A. (1992). Nutrient export from various land uses on the Darling Plateau in Western Australia – effects on stream water quality. CSIRO Division of Water Resources, Report No. 92/41.
Glencross, R. (1995). Nutrient soil test standards. In: ‘Productive pastures pay – a manual on pasture establishment and management for the above 700 mm rainfall zone’. (ed. P. Arkell). Department of Agriculture Western Australia, Bulletin No. 4302.
Greathead, K., Sanford, P. and Cransberg, L. (1998). Perennial grasses for animal production in the high rainfall areas of Western Australia. Agriculture Western Australia, Miscellaneous Publication No. 2/98.
Heady, G. and Guise, N. (1994). Streamlining - an environmentally sustainable drainage network for the Swan Coastal Plain (Peel-Harvey Catchment). Western Australian Department of Agriculture, Bulletin No. 4279.
Hodgkin, E.P. (1985). Peel-Harvey estuarine system study – management of the estuary. Department of Conservation and Environment Bulletin No. 195.

11: Eutrophication
-238-
Hodgkin, E.P. and Yates, J.S. (editors) (1993). Fertilizers and eutrophication in south-western Australia. Special issue of Fertilizer Research, Volume 63, No. 2, Kluwer Academic Publishers, Dordrecht, The Netherlands.
Hodgkin, E.P., Birch, P.B., Black, R.E. and Humphries, R.B. (1980). Peel-Harvey estuarine system study (1976-1980). Department of Conservation and Environment Report No. 9, Perth.
Karafilis, A. (2000). ‘Repairing farm waterways – Blackwood stories’. Blackwood Basin Group, Boyup Brook. Kingdon, B. K. (2000). ‘Fertiliser use guidelines for the Swan Coastal Plain of WA’. Vasse-Wonerup Landcare
District Committee. Kinhill (1989). ‘Peel Inlet and Harvey Estuary Management Strategy – Environmental review and management
programme – Stage 2’. Kinhill Engineers Pty Ltd, Victoria Park, Western Australia. Kinhill (1998). ‘Water Corporation Busselton waste water treatment and disposal – Consultative environmental
review’. Kinhill Pty Ltd, Victoria Park, Western Australia. Lantzke, N.C. (1997). Phosphorus and nitrate loss from horticulture on the Swan Coastal Plain. Agriculture
Western Australia, Miscellaneous Publication No. 16/97. Lantzke, N.C. (1999). Phosphorus and nitrate loss from horticulture on the Swan Coastal Plain. In:
Proceedings of the International Conference on Diffuse Pollution. International Association of Water Quality, Perth, Western Australia, 16-20 May, 1999. pp. 157-166.
Lantzke, N.C. and Galati, A. (editors) (1997). ‘Codes of practice for vegetable production on the Swan Coastal Plain’. Vegetable Growers, Market Gardeners and Potato Growers Associations.
Latto, A., Noonan, J.D. and Taylor, R.J. (2000). Environmental guidelines for new and existing piggeries. Agriculture Western Australia, Bulletin No. 4416.
Lord, D.A. (1995). Geographe Bay study, 1993-1995 – Summary report. In: Wastewater 2040 strategy for the South-West Region. Water Authority of Western Australia.
Lukatelich, R.J., and McComb, A.J. (1983). Water quality of the Peel-Harvey estuarine system, March 1981-August 1982. Waterway Commission Report No. 2.
Lukatelich, R.J. and McComb, A.J. (1985). Nutrient recycling and the growth of phytoplankton and macro-algae in the Peel-Harvey estuarine system. The University of Western Australia, Report No. ED–185-118.
Lukatelich, R.J., Schofield, N.J. and McComb, A.J. (1987). Nutrient loading and macrophyte growth in Wilson Inlet, a bar-built southwestern Australian estuary.. Estuarine, Coastal and Shelf Science 24: 141-165.
McAlpine, K.W., Spice, J.F. and Humphries, R. (1989). The environmental condition of the Vasse Wonnerup wetland system and a discussion of management options. Environmental Protection Authority, Technical Series No. 13., Perth, Western Australia.
McComb, A.J. and Davis, J.A. (1993). Eutrophic waters of south-western Australia. Journal of Fertilizer Research 36: 105-114.
McPharlin, I. and Hegney, M. (1997). Soil testing for vegetable production on the coastal plain. Agriculture Western Australia, Bulletin No. 4328.
McPharlin, I., Delroy, N., Jeffery, B. Dellar, G. and Eales, M. (1990). Phosphorus retention of sandy horticultural soils on the Swan Coastal Plain. Journal of Agriculture Western Australia 31: 28-32.
Mandurah Telegraph (1995). Algal bloom choking life out of river. Written by Paul Whillier, Tuesday, March 14, 1995.
Mason, M. (1998). Nitrogen. In: ‘Soilguide - A handbook for understanding and managing agricultural soils’. (ed. G. Moore). Agriculture Western Australia, Bulletin No. 4343. pp. 164-167.
Moody, P.W. and Bolland, M. (1999). Phosphorus. In: ‘Soil analysis, an interpretation manual’. (eds K.I. Peverill, L.A. Sparrow and D.J. Reuter). CSIRO and the Australian Soil and Plant Analysis Council, Melbourne. pp. 187-220.
Mortlock, W., Grime, P. Bradbury, K. and Ovens, N. (1993). ‘Field planting of trees and shrubs: A guide for landowners and developers in the Shires of Serpentine-Jarrahdale and Murray’. Community Catchment Centre, Pinjarra.
Peverill, K.I., Sparrow, L.A. and Reuter, D.J. (editors) (1999). ‘Soil analysis, an interpretation manual’. CSIRO and the Australian Soil and Plant Analysis Council, Melbourne.
Prout, A. and McFarlane, J. (1996). Environmental guidelines for horticulturalists in the Lower Great Southern. Agriculture Western Australia, Miscellaneous Publication No. 11/96.
Schofield, N.J., Birch, P.B., Forbes, G.G., McAlpine, K.W. and Bott, G.M. (1984). Determining phosphorus losses from currently applied superphosphate and coastal superphosphate fertilisers and from soil storage from different soil types in the Peel-Harvey catchment. In: ‘Potential for management of the Peel-Harvey Estuary’. Department of Conservation and Environment, Bulletin No. 160.
Sharma, M.L., Byrne, J.D.M., Herne, D.E. and Kin, P.G. (1991). Impact of horticulture on water and nutrient fluxes to a sandy aquifer. CSIRO Division of Water Resources, Report No. 91/33.
Sudmeyer, R.A., Saunders, C., Maling, I. and Clark, T. (1994). Perennial grasses for areas receiving less than 800 mm annual rainfall. Agriculture Western Australia, Bulletin No. 4253.
Summers, R.N. and Rivers, M. (1999). Phosphorus in runoff from the coastal catchment of Peel Inlet and Harvey Estuary and innovative solutions for control. In: Proceedings of the International Conference on Diffuse Pollution. International Association of Water Quality, Perth, Western Australia, 16-20 May, 1999.
Summers, R.N., Guise, N.R. and Smirk, D.D. (1993). Bauxite residue (red mud) increases phosphorus retention in sandy soil catchments in Western Australia. Fertilizer Research 34: 85-94.
Summers, R.N., van Gool, D., Guise, N.R., Heady, G.J. and Allen, T. (1999). Phosphorus content in the runoff from the coastal catchment of Peel Inlet and Harvey Estuary and its associations with land characteristics. Agriculture, Ecosystems and Environment 73:271-279.
TopCrop Australia (1998). Lime and nutrient calculator: Western Australian Version. TopCrop Australia.

11: Eutrophication
-239-
Vlahos, S., Summers, K.J., Bell, D.T. and Gilkes, R.J. (1989). Reducing phosphorus leaching from sandy soils with red mud bauxite processing residues. Australian Journal of Soil Research 27: 651-652.
Vollenweider, R.A. (1989). Global problems of eutrophication and its control. In: ‘Conservation and management of lakes’. (eds J. Salanki and S. Herodek). Akademiai Kiado, Budapest, Hungary.
Weaver, D.M. (1991). Eutrophication - nutrients in estuaries, catchment management. Notes presented at the "Land Management Induction Course", July 10, 1991. York. Western Australia Department of Agriculture.
Weaver, D.M. and Summers, R. (1998). Soil factors influencing eutrophication. In: ‘Soilguide - A handbook for understanding and managing agricultural soils’. (ed. G. Moore). Agriculture Western Australia, Bulletin No. 4343. pp. 243-250.
Weaver, D.M., Ritchie, G.S.P., Anderson, G.C. and Deeley, D.M. (1988). Phosphorus leaching in sandy soils. I. Short-term effects of fertiliser applications and environmental conditions. Australian Journal of Soil Research 26: 177-190.
Weaver, D.M., Pen, L.J. and Reed, A.E.G. (1994). Modifying the phosphorus cycle to achieve management objectives in the Oyster Harbour Catchment. Water 21: 28-32.
Weaver, D.M., McCafferty, P.B. and Reed, A.E.G. (1999). A phosphorus inventory for the Albany Hinterland, south coast of Western Australia. In: Proceedings of the International Conference on Diffuse Pollution. International Association of Water Quality, Perth, Western Australia, 16-20 May, 1999.
Yeates, J.S., Arkell, P.T., Russell, W.K., Deeley, D.M. and Peek, C. (1985). Management of agricultural phosphorus losses from the soils of the Peel-Harvey catchment. In: Peel-Harvey Estuarine System Study: management of the estuary. Department of Conservation and Environment, Bulletin No. 195.
Yeates, J.S., Clarke, M.F., Mattinson, B. and Longbottom, K. (1991). Integrated phosphorus, sulphur and potassium fertiliser recommendations – the Phosul K model. Western Australian Department of Agriculture, Miscellaneous Publication No. 313/91.
12: Water shortages
-240-
12. ON-FARM WATER SUPPLIES AND WATER SHORTAGES
12.1 INTRODUCTION
12.1.1 What systems are used for on-farm water supplies? An on-farm water supply system is an integrated group of structures and reservoirs that access and harvest available water resources on a property and then store and distribute the water for beneficial use. Available water resources will vary from property to property. They can include rainfall, creeks, rivers, seeps from surficial aquifers and groundwater. Methods used to obtain and store these resources include rainwater tanks (collecting roof runoff), banks, dams, soaks, bores and pumps. Although water may also be accessed from off-farm sources such as irrigation schemes, reticulated supply systems and water carting, this chapter will concentrate on supplies obtained on-farm. Water resources The original source of all on-farm water supplies is rainfall. With the exception of deep aquifers, the amount of rain that falls in a particular year impacts on water availability the following season. Rainfall may be harvested directly from the roofs of buildings and stored in rainwater tanks (usually for domestic supplies and mixing crop sprays) or it can be harvested using improved catchments (roaded, gravel or bitumen) and stored in dams. However, most of the rain falling on a property reaches the ground surface where it evaporates, becomes runoff or infiltrates into the ground. Runoff is the main source of surface water supplies and it may be harvested directly using banks that capture runoff and then diverted to a storage, usually a farm dam. Runoff can also be collected directly off rock outcrops. Runoff that is not harvested directly usually concentrates in drainage lines where streams form after rainfall. Water in drainage lines may be captured by, and stored in, gully wall dams. On some properties water may be available from perennial streams or rivers. Even if they do not flow all year, pools of water may remain throughout the summer and autumn. In some cases livestock access this water directly, or it may be pumped out into dams for storage. Water that infiltrates into the ground often becomes part of a surficial aquifer. This is groundwater held at or near the surface without an overlying confining layer. The amount available in any year is often directly related to the amount of rainfall received the previous winter. Throughflow on a slope can be harvested using seepage interceptor drains and diverted to a dam. Soaks, shallow wells and pumps are other methods employed to access this water supply. Some rainfall percolates down into deeper, often partially or fully confined aquifers. This is deep groundwater that occurs below an layer of low permeability in the soil profile or geological strata. The nature of the bedrock is the largest influence on aquifer type. Major or regional aquifers usually take the form of a saturated sedimentary layer that covers an extensive area. Other aquifer types include fractured rock aquifers and weathered rock aquifers. Water is obtained from confined aquifers by means of wells or bores. Unless the aquifer is pressurised (i.e. contains artesian groundwater) it will need to be pumped to the surface using solar, wind or mechanical power. Rainfall is the source of recharge for these aquifers. However, the large size of the storage and the slow movement of water through the ground means that it may take many years for the amount of rain received in a particular season to have an impact on the volume of water stored in the aquifer. This also means that deep aquifers provide a reliable water source on a year by year basis, but it will take many years for them to replenish if they are over exploited. 12.1.2 What causes water shortages? Water supply shortages occur when the volume of water harvested and stored is less than the volume of water required, taking into account evaporation losses. The water may be required for domestic use, livestock consumption or for irrigating crops or pastures. In the South-west Hydrological Region water supply shortages are most likely in late summer and autumn before the break of season. These shortages may occur in years of lower than average rainfall, because insufficient supplies were harvested, because of water loss during storage or because of inefficient water use.
12: Water shortages
-241-
Water availability and quality Low rainfall is a major cause of water shortages. This is especially the case if there are several consecutive years of below average rainfall and there is little excess in storage from previous years. Areas with low rainfall often experience high rainfall variability, increasing the risk of consecutive years of below average rainfall. Water quality is another significant factor in limiting water supplies. The salinity levels of surface and groundwater supplies are high over significant areas of the South-west Hydrological Region. Although water may be available, it is often too salty to use for irrigation, mixing crop sprays or livestock consumption. Salinity tends to be higher in low lying areas where water is generally more abundant. On many properties, especially in the Wheatbelt and both Woolbelts, there are limited catchments and dam sites suitable for harvesting or storing water. Gully wall dams on drainage lines are especially susceptible to the rising saline water tables. The causes of these salinity hazards are discussed in Section 5.1.2. A lack of runoff is another factor that adversely affects the availability of surface water supplies. This can be due to: • small catchment areas, which are insufficient for generating reliable surface runoff, • the presence of highly permeable soils, which have high infiltration and low runoff rates
(surficial groundwater may be available from such soils), and • catchments with dense vegetation, which yield less runoff than those that have been cleared for
agriculture (water quality is usually higher in vegetated catchments). The scarcity of good quality groundwater is a widespread problem. Factors that contribute towards this problem are salinity (as discussed above) and unsuitable (non porous) geological formations. Insufficient harvesting and storage On most properties only a fraction of the rainfall and subsequent runoff is harvested. This is usually due to the cost and inconvenience of building structures capable of capturing runoff (e.g. roaded catchments or grade banks) over the whole property and is exacerbated by high evaporation rates from surface farm water storages. The occurrence of salinity in low lying areas often confines water harvesting to the higher parts of the landscape where there are fewer sites suitable for dams. Capturing 100% of the runoff generated may not be feasible or desirable, but increasing the proportion of runoff harvested would decrease the risk of water shortage and may help reduce the impact of other problems such as flooding, waterlogging, erosion, salinity and rising groundwater levels. The low storage capacity of dams and other facilities often causes water shortages on farms. This may be because not enough dams have been constructed, or because the dams are too small and inefficient. Where a high proportion of the rain falls as light showers, and long periods of seasonal drought, large volume dams with improved catchments (roaded or bitumen) are required to cater for demand during extended periods of limited runoff. Sedimentation, following erosion in the catchment, often reduces the storage capacity of dams. Sediment washed into dams due to over grazing and inappropriate cultivation practices upstream or on slopes directly above the dams is also a problem in some areas. In some cases, low storage capacity may be due to poor planning or lack of funds, but the scarcity of suitable dams sites is often a major factor. Soils unsuited to dam construction, a lack of soil depth, the presence of rock outcrop and site morphology can all contribute to the scarcity of sites. For the larger gully wall dams, which are constructed to meet irrigation requirements, valley shape is also important. If a valley is too wide and not very deep it will be very difficult and expensive to construct a wall that is high and wide enough to store the required volume of water. In such situations excessive evaporation from the shallow water bodies is often an added problem. Storage capacities can also be reduced in hilly country if the valley floor is steep.

12: Water shortages
-242-
Losses during storage A significant proportion of the water harvested during winter may be lost during summer. Evaporation is one of the major causes of water loss and up to 1.5 m of water can be lost from farm dams and other storage facilities each year. In most areas of the South-west Hydrological Region, evaporation exceeds rainfall, with dam evaporation rates ranging from 1,021 mm/year in Margaret River to 1,586 mm/year in Narrogin (see Figure 2.2). Leaky dams are another cause of water loss. Leaks are usually caused by moderately permeable soils used in construction or poor installation of wall cores. Soils that are unsuitable for building dams include granitic saprock (usually a gritty material), acid shallow duplexes (typically found on mallet hills), silty soils (found along major rivers), cracking clays, rocky soils and deep gravels. While highly dispersive soils prone to tunnelling lead to dam failure, some dispersion of the clay materials lining the dam is desirable to seal cracks and holes. Porous, sandy soils are only suitable for dam construction if they overlie a cemented hardpan that can be ripped and used to provide a seal over the dam batters. Poor construction, bad site selection and spillways that are not designed to handle peak flows can all lead to dam wall failures and the loss of storage capacity. Dams built on unstable sites prone to slumping or water seepage will not have a long life expectancy. Stored water can become unusable if it is affected by salinity or toxic algal blooms during summer. Inefficient use of water supplies Water shortages may be caused by inefficient use of water supplies. Overflowing livestock water troughs are one example, but inefficient use is a much more significant problem in horticultural industries. Over-irrigating crops not only wastes water, but can leach nutrients and contribute to rising groundwater levels, resulting in waterlogging, salinity and eutrophication problems.
Gully wall dam in the Blackwood Valley near Bridgetown.

12: Water shortages
-243-
12.2 WATER SUPPLIES IN THE SOUTH-WEST HYDROLOGICAL REGION
12.2.1 Water resources and shortages in the South-west Hydrological Region A guide to water requirements for farming enterprises is presented below, followed by a summary of the current availability of water supplies in each of the hydrological zones. Box 12.1 discusses the Water Law Reforms currently occurring in Western Australia and their implications for landholders. Water requirements Water requirements in the South-west Hydrological Region vary markedly. While the nature of the farming system is a major factor, local climate and property size also play an important role. The size of the water holding structure should reflect the requirements of livestock and irrigation as well as accounting for evaporation losses over the summer. Water balance calculations for estimating effective volumes of water stored in a dam are mostly dependent on rainfall-runoff relationships and water lost by evaporation and leakage. DAMCAT III (Coles et al., 2001) is a computer model that generates a design package for dams and roaded catchments of different size combinations. Table 12.1 gives an indication of water requirements of livestock. Figures may vary by up to 150% as factors such because water quality, climatic variation, the physiological state of the animal and the quality, quantity and salt content of feed will all affect consumption. For example, even in winter months, a minimum of about 2 litres/head/dry sheep equivalent (d.s.e.)/day is required by stock subsisting purely on dry feed such as grain. For more information on livestock water requirements see Luke (1987). Table 12.2 presents the tolerance of livestock to saline drinking water. Table 12.1: Typical water requirements of domestic animals in the South-west Hydrological Region. Location Livestock litres/head/
day (January)
litres/head/ day
(September)
m3/head/ year
Head/ ha m3/ ha/ year1
Katanning Merino sheep (dry) 2.9 0.1 0.5 5.0 2.4 Merino sheep
(lactating ewes) 5.8 0.1 1.0 2.5 2.4
Dairy cow 43.5 0.8 7.3 - - Beef cattle 29.0 0.5 4.9 0.5 2.4 Manjimup Merino sheep (dry) 2.3 0.0 0.4 10.0 3.6 Merino sheep
(lactating ewes) 4.6 0.1 0.7 5.0 3.6
Dairy cow 34.5 0.5 5.4 1.3 7.0 Beef cattle 23.0 0.3 3.6 1.0 3.6 1- Figures for m3/ha/year have not been corrected to account for evaporation losses from dams. Adapted from: Luke (1987) Table 12.2: Tolerance of livestock to saline drinking water. Livestock Upper salinity limit
(mg/L TSS) Adult sheep 9,000-12,000 Beef cattle 8,500 Lambs, weaners, breeder ewes 6,000 Horses 5,500 Pigs 3,900 Milk producing dairy cattle 3,000

12: Water shortages
-244-
BOX 12.1: WATER LAW REFORM IN WESTERN AUSTRALIA
The Water and Rivers Commission has embarked on a major law reform program to strengthen and improve Western Australia's system of allocating rights to use water from natural sources and establishing a licence trading system. The reforms are likely to lead to amendments to the Rights in Water and Irrigation Act 1914. The current multiple vesting for surface water and groundwater is intended to be replaced by a single, general vesting for both types of water in a way that does not introduce new controls over springs, soaks or wetlands contained wholly on one property. The major change is that, outside proclaimed areas where licensing already applies, surface waters will become vested in the Crown without the need to proclaim the area. This will allow local rules to be introduced, rather than introducing licensing, if management is necessary. As part of these changes it is proposed that local people will have a direct influence on how water is shared between the different uses and how it is managed into the future. The new system will give greater recognition and protection of the rights of individual users who in turn will have greater control and responsibility for their water supplies. Local water resource committees will be established to assist the Commission in developing local by-laws for managing water resources. They may also assist in settling disputes over water use. As local by-laws are developed across the state the current rigid management systems can be replaced. The Commission will supervise this process to ensure that the rules are fair to both users and the environment. It is proposed to establish general guidelines for the duties of water users. The guidelines will help people use water in a way that respects the rights of others. The guidelines should also help people who are unfairly affected to obtain redress in the courts. The new legislation should provide a means to clearly state, on a place by place basis, the specific duties that people who use or affect water resources owe to each other. Part of the reform framework requires that water must be provided to the environment to protect waterways, wetlands and aquifers. The Water and Rivers Commission has developed a set of guiding principles to ensure this provision of environmental water. The Commission is also developing processes to enable efficient and timely trading in water entitlements. Trading will allow water users to buy and sell water entitlements in areas where all available the resource has already been allocated. Under the reforms, people should still be able to take water from their own land or from public land for domestic and household use, watering stock and firefighting. Local rules should govern the way water is taken only if there is not enough water to go around or if other problems, such as preventing damage to the watercourse or aquifer, need to be addressed. In some instances it may be necessary to issue licences or to prohibit the taking of water altogether. Currently, people building gully wall dams on proclaimed watercourses require the approval of the Commission. As proclaimed areas are to be removed, local rules will be applied to dams on any watercourse. All dams on watercourses in proclaimed areas will continue to be controlled by the Commission until the area is de-proclaimed. Dams built outside watercourses are presently subject to control only if they affect the flow of a proclaimed watercourse. In the future, local rules controlling these dams may be made if the dam is likely to significantly reduce the flow of a watercourse and the local water management committee considers the rules necessary. Landholders need to be aware of how the changes resulting from water law reforms will affect them. It would be advisable to contact the Water and Rivers Commission before embarking on any substantial surface or groundwater supply schemes. Information about water law reforms can be obtained from the Water Reform Secretariat at the Head Office of the Water and Rivers Commission. The following Internet website provides more details: www.wrc.wa.gov.au/water_reform/Legislative_guide-summary/Summary.htm Bartlett et al. (1996) provide background reading on the topic of water resources law and management in Western Australia. Clement and Bennett (1998) provide information on the likely impacts on landholders. Table 12.3 presents typical water requirements of different crops and pastures at Wokalup on the Swan Coastal Plain. For more information see Paulin (1984) and Aylmore et al. (1994). Table 12.4

12: Water shortages
-245-
presents the tolerance of some local crops and pastures to saline water. The salinity values represent the levels at which yields begin to decline. These values are intended only as a general guide and it must be remembered that tolerances vary depending on climate, soil conditions and cultural practices. Table 12.3: Typical water requirements for irrigation at Wokalup.
Crops and pastures % of pan evaporation
m3/ha/year (Wokalup)
Vegetables 100-150 9,800-14,700 Melons 100-120 9,800-11,760 Stone Fruit 40-90 3,920-8,820 Peaches/nectarines 40-110 3,920-10,780 Citrus 55-65 5,390-6,370 Apples 40-90 3,920-8,820 Wine grapes 20-40 1,860-3,920 Table grapes 40-70 3,920-6,860 Perennial pasture 60-70 5,880-6,860 Lucerne 90-120 8,820-11,760 Average annual pan evaporation is 980 mm. Adapted from: Paulin (1984) and Aylmore et al. (1994) Table 12.4: Tolerance of crops and pastures to salts in irrigation water Sensitivity Water salinity
tolerance (mg/L) Crops
Highly sensitive
0-500 Pastures: Ladino clover, red clover, white clover Crops: Passionfruit, strawberries, avocado, stone fruit, citrus fruit, apples, pears, green beans, celery, radish, squash, peas, onion, carrot
Mildly sensitive
500-1,500 Pastures: Strawberry clover, maize, oats, lucerne Crops: Grapes, cucumbers, capsicum, lettuce, sweet corn, potato, melons, cauliflower, cabbage, broccoli, pumpkin, tomato
Slightly sensitive
1,500-3,500 Pastures: Paspalum, Phalaris, perennial ryegrass, kikuyu, couch grass, tall wheatgrass Crops: Barley, olives, fig, pomegranate, spinach, asparagus
Salt tolerant 3,500-13,000 Puccinellia, saltwater couch, salt river gum, saltbush Adapted from Agriculture Western Australia Farmnote No. 46/99 Water availability in the Wheatbelt There are no permanent streams in the Wheatbelt. Salinity is widespread in low lying areas, so most water harvesting and storage is now restricted to positions higher in the landscape. Many dams located in low lying positions are now too saline for use. The area north of Dumbleyung is serviced by reticulated waters piped from the Harris River Dam. The most common form of farm water storage is small earthen tanks (i.e. dams with a capacity of 1,000-5,000 m3). Good dam building materials are plentiful. In the sandy duplex soils common over much of the Wheatbelt, the topsoils have a high permeability. For runoff to be generated on these soils, the rainfall intensity must be greater than the rate of infiltration into the topsoil (infiltration excess) or the topsoil must be wet from previous events (saturation excess). As a consequence, duplex soils have a higher rainfall threshold than clays resulting in a longer wet-up period and therefore a longer time before runoff begins. Improved catchments (mostly roaded and some bitumen) and banks are often constructed to alleviate these problems. Where available, runoff from granite outcrops is often harvested. Fresh to brackish groundwater is usually found adjacent to large outcrops of granitic rock and on the margins of sandplains. Some dykes and structural features such as shear zones (fractured rock aquifers) contain groundwater of variable quality and quantity. These resources are scattered throughout the zone but tend to be isolated and small (10-100 m3/day).

12: Water shortages
-246-
Water availability in the Eastern Woolbelt There are no permanent streams in the Eastern Woolbelt. During winter, the salinity levels of major streams and rivers typically range from brackish to saline (1,500 mg/L to over 8,000 mg/L). To the north and east of Wagin, farms are serviced by reticulated waters piped from the Harris River Dam. The most common form of farm water storage is in small earthen tanks (i.e. dams with a capacity of 1,000-2,500 m3) which are located on hillsides or have been excavated across drainage depressions and small gullies. Good dam building materials are plentiful with large areas of suitable clayey subsoils. Soaks and groundwater supplies are less common, although in some cases they are relied on in dry seasons. Banks are heavily relied on to fill farm water storages in most cases. Both seepage (collected by interceptor and grade banks) and runoff (from waterways and grade banks) are harvested in winter. Seepage flows are highest in wet seasons. Surface runoff is often more pronounced in summer, owing to the intensity of summer thunderstorms relative to the amount of rainfall. Catchments usually rely on direct inflow from surface streams and runoff from paddocks. Few improved catchments are present. These are mostly roaded catchments, with occasional bitumen catchments for rural town supplies. Dams do not usually have silt or manure traps and are therefore subject to contamination and sedimentation after summer thunderstorms. Many dams in the Eastern Woolbelt have become too saline for sheep and cattle. Many more dams will be affected by rising water tables and salinity. Poor water supplies typically occur in drainage lines, especially in the lower parts of the landscape. Fresh to brackish groundwater is usually found adjacent to large outcrops of granitic rocks and on the margins of the sandplains that are scattered throughout the Eastern Woolbelt. Dykes and structural features often contain small, isolated amounts (yielding 10-100 m3/day) of variable quality groundwater. Some larger groundwater stores (yielding 100-1,000 m3/day) of varying quality exist in the buried remnants of old river and lake systems (palaeochannels) close to the Arthur and Beaufort Rivers. While some of better quality (<1,000 mg/L) supplies are currently being developed around Beaufort River, there is no guarantee that the supplies may not remain fresh in the future unless carefully managed. Water availability in the Western Woolbelt. Streams that flow with brackish to saline water (1,500-6,000 mg/L) throughout the year are becoming common in the Western Woolbelt. Small earthen tanks (holding 500-3,000 m3) that have been excavated across drainage depressions and small gullies are the most common form of farm water storage. Soaks and groundwater supplies are more common than in the Eastern Woolbelt. Good dam building materials are common. However, some problems have been encountered when dams have been constructed from materials derived from weathering faults, dolerite dykes and quartz veins. Leaky clays are commonly found on sites just below gravel hilltops. While most hillslopes have suitable gradients for dam construction, careful design is required on some of the steeper slopes in the west. Both seepage (collected by interceptor and grade banks) and runoff (from waterways and grade banks) are harvested during winter. Seepage flows are most significant in the deep lateritic profiles. Surface runoff is often more pronounced in summer, especially in the area around Darkan where summer thunderstorms are frequent and may cause significant damage. Catchments are rarely improved (roaded, bitumen etc) and rely on direct inflow from streams and runoff from paddocks. Some dams have silt or manure traps to protect them from contamination after rain storms. Many dams in the Western Woolbelt have become too saline for sheep and cattle. The number of dams in the West Arthur and Boyup Brook Shires affected by rising water tables and salinity is increasing. Unreliable, low quality water supplies typically occur in major drainage lines. Saline hillside seeps are common and threaten many traditional sites selected for water supplies. Turkey nest dams on hillsides will become more common as water tables and salinity reduce the areas suitable for conventional dams. Groundwater supplies are limited, but there are some small fractured rock aquifers and weathered rock aquifers scattered throughout the zone. These small resources are exploited for stock water

12: Water shortages
-247-
when surface supplies are inadequate. Some aquifers in the sedimentary remnants of old (Eocene) river and lake systems have a large capacity and contain groundwater of varying quality. Fresh water from the Hillman and Towerrinning palaeochannels has been exploited at Darkan for a tannery and around Duranillin for horticultural crops. Water availability in the Forested Hills Water quality of most waterways ranges from fresh to marginal (usually less than 1,000 mg/L and often below 500 mg/L). The Collie, Blackwood and Frankland Rivers, which have their headwaters in the Woolbelts or Wheatbelt, are often brackish (up to 3,000 mg/L). Some waterways are permanent and flow throughout the year, especially in the south. On some properties, water from these streams and permanent pools is used for irrigation or livestock. Farm water storages comprise mainly of gully wall dams (holding 2,000-360,000 m3) that have been excavated across drainage depressions and gullies. The smaller dams (holding less than 5,000 m3) are designed for stock supplies while the larger dams (holding 100,000-360,000 m3) have been built to irrigate horticultural crops. Dam building materials are variable and shallow rocky soils are a problem in some valleys. Seepage and collapse problems have been encountered when dams have been constructed from materials derived from weathering faults, dolerite dykes and quartz veins. Steep gradients in some valleys limit the storage capacity of dams. Catchments usually rely on direct inflow from surface streams and runoff from paddocks, and the construction of improved catchments is usually not required. In some areas, surficial aquifers are significant sources of water. Soaks are common on upland flats and many dams are replenished by seepage. Many seeps in the Donnybrook-Ferguson area have been dug out, had well liners installed and water is pumped into 20,000-40,000 litre earthen tanks for livestock. There are some saline seeps present, mostly in the east. Deep groundwater supplies are variable in both quantity and quality. Large amounts of good quality water are found in the Perth Basin sediments below the Donnybrook Sunklands. There are also three sedimentary basins east of the Darling Scarp. The Collie Basin is the largest of these and contains good water supplies, though much of this is allocated to industry. Smaller supplies are contained in the Wilga and Boyup Basins which are mostly situated underneath Sate Forest. Tertiary sedimentary deposits on the plateau surfaces may also contain some supplies. In the crystalline rocks that dominate the Yilgarn Craton, Albany-Fraser Orogen and Leeuwin Complex, groundwater supplies are limited to fractured rock aquifers and weathered rock aquifers. Supplies are generally small and difficult to find and water quality is variable. Extensive systems of shear zones are present south east of Manjimup and groundwater may be transmitted along these structures. Many of the lakes within the area are spatially associated with these structures. The water within them is saline in most cases, although fresh groundwater has been found on individual properties. There has been some recent drilling within the Preston River valley area, where supplies of varying quality (typically <1,000 mg/L) have been located in deep river sediments. Water availability in the Coastal Plains Water is supplied from large reservoirs in the Darling Range via a network of channels to farms in the South-western Irrigation Area (which occupies a portion of the eastern Swan Coastal between Dardanup and Waroona). Farm water storage structures are small because supply from the irrigation scheme is reliable. Elsewhere on the coastal plains, aquifers are extensively used for water supplies. Water tables are usually close to the surface so that soaks and shallow wells are able to supply most of the water requirements of livestock. Shallow groundwater is extracted by windmills or pressure pumps, stored in large tanks and reticulated to troughs. Other sources of livestock water are soaks in seepage areas (usually about 1,000 m3 capacity) and local swamps. Salinity problems are encountered in some of these surficial aquifers on the Swan Coastal Plain but have not been recorded on the Scott River Plain. The presence of these saline water tables necessitate the use of bores to access deeper aquifers for stock water on some properties. Bores are also used to supply livestock water where there is shallow ironstone in the Busselton district and on the extensive areas of deep sands on the coastal portion of the plain. Water tables are often too
12: Water shortages
-248-
deep for soaks and there is little potential for harvesting runoff from the sandy soils. Water supplies for irrigation on these sandy soils are also obtained from wells and bores. On the Swan Coastal Plain there are three commonly used aquifers: • The closest to the surface are the surficial aquifers that extend to depths of 20-50 m. These
include unconfined aquifers in the Bassendean sands, Tamala limestone, Guildford formation and sandy Yoganup formation deposits along the Scarps. While the water quality is fresh, there are some brackish and saline waters in the Guildford Formation, especially under the irrigation area. Saline waters are also found along the coast and south of Busselton.
• The Leederville formation is a confined aquifer comprised of sandstone, shales, siltstones and conglomerates. It has a maximum thickness of 550 m and contains substantial water resources. Water quality is variable but large quantities of fresh water are used for town water and industry to the south of Bunbury.
• The Yarragadee formation lies beneath the Leederville formation. It is comprised of sandstones and thin shale beds and is about 3,000 m thick. It contains large reserves of good quality water and is used by urban centres such as Bunbury for domestic water.
On the Scott River Plain most water is extracted from surficial aquifers. Recently, supplies have been tapped from the Yarragadee formation to irrigate horticultural crops. 12.2.2 What are the problems associated with water shortages? The problems associated with water shortages are obvious. Insufficient or poor quality water result in the poor condition or death of livestock. To avoid this the landholder is forced to sell or agist stock, or go to the expense of carting water. In areas with salinity problems, stock often have to graze on pastures with a high salt content and so they have higher water requirements than stock grazed on non-saline pastures. In such situations, widespread salinity limits landholders’ options when it comes to supplying water. Inadequate water supplies are also likely to result in poor growth and major yield declines in horticultural crops. Irrigation in orchards and vineyards is most needed late in the season when the fruit is developing and ripening. Unfortunately this is the time of year when water supplies are likely to be at their lowest. 12.2.3 Which areas are most susceptible to water shortages? Areas most susceptible to water supply shortages in the South-west Hydrological Region include districts where: • rainfall is lowest and most variable, • salinity is a widespread problem, • few sites suitable for building dams are available, • groundwater resources are scarce, and where • water demand is high. See Section 12.2.1 for more details on specific areas 12.2.4 Water supply research in the South-west Hydrological Region Considerable research has been conducted into harvesting available surface water to provide reliable supplies for domestic and livestock use in the Wheatbelt and Eastern Woolbelt (e.g. Pepper, 1984; Laing et al., 1988; Pepper and Burke, 1990). Staff from Agriculture Western Australia in Katanning are currently investigating the reclamation of saline dams in the Woolbelt by using pumps and relief wells to lower water tables. Research into water supplies on the Coastal Plains and Forested Hills has mainly centred around groundwater availability and was undertaken by the Geological Survey of Western Australia (e.g. Deeney, 1988; Prangley, 1994; Thorpe and Baddock, 1994; Waterhouse et al., 1994), its successor the Water and Rivers Commission and private companies (Rockwater, 1990). Groundwater drilling and airborne geophysical investigations undertaken to study groundwater hydrology in relation to dryland salinity have identified fresh water aquifers in the Woolbelt (George et al., 1994; George, 1998).
12: Water shortages
-249-
12.3 MANAGING WATER SHORTAGES
The most common solutions to farm water shortages centre around constructing and maintaining suitable systems to harvest and store surface water, or to obtain groundwater supplies. Changes to farm management that improve supplies include adopting farming systems designed to tackle salinity problems and efficiently use the available supplies. 12.3.1 How can water shortages be identified and predicted? Water shortages are easily identified once they are actually occurring, because the demand for water requirements exceeds the available supply. However, it is very important to be able to predict such shortages in advance and to match the supply and demand throughout the year. To encourage good design for water conservation on a property it is important to have a good understanding of water requirements and to be able to assess the capacity for on-farm water harvesting and storage. This information can then be used to predict the likelihood of future water shortages. Section 12.2.1 provides general information about water supplies and requirements in the South-west Hydrological Region. Tables 12.1 and 12.3 summarise the amount of water required by livestock and irrigated crops and Tables 12.2 and 12.4 summarise salinity tolerances. McFarlane et al. (1995) provide an easy-to-follow guide for assessing the water requirements of horticultural crops and for estimating the amount of water that can be harvested from a catchment. There are a number of computer programs that can help identify water requirements. DAMCAT III (Coles et al., 2001) can be used to estimate the domestic and livestock water requirements of a property and to determine whether current water supplies are sufficient. For horticultural enterprises, the Crop Irrigation Requirement Program (Aylmore et al., 1994) can be used in combination with DAMCAT III. 12.3.2 What changes can be made to agricultural practices? Rising saline water tables are a major cause of water shortages on many properties. Any effective steps that can be taken to tackle the causes of salinity may also help to improve water supplies. These steps can include the adoption of lower recharge farming systems as well as revegetation and engineering options (Section 5.3). The problems of sedimentation of dams and poor water quality due to turbidity and high nutrient levels are best tackled by controlling erosion and nutrient loss from paddocks in the catchment area. Techniques include maintaining good ground cover, avoiding inappropriate cultivation practices and careful management of fertiliser applications and stocking rates (see Sections 9.3.2 and 11.3.2 for more details). Filtering runoff water through silt and manure traps at the dam inlet will help to maintain water quality. These traps may be fenced off vegetation buffer strips or highly permeable filters of hay and sand. The careful use of existing water supplies will reduce the risk of water shortages and minimise contributions to other forms of degradation such as waterlogging, salinity and eutrophication. The greatest scope for increased efficiencies in water use is in irrigation. Adopting micro-irrigation systems and irrigation scheduling to match crop requirements, soil types and climatic conditions is likely to reduce water use markedly. Designing irrigation systems to cope with topographic variations and monitoring soil moisture levels, providing windbreaks and avoiding the use of sprinklers in windy conditions will also save water.

12: Water shortages
-250-
12.3.3 Engineering options Improved water harvesting Improved harvesting of runoff and sub-surface flows can be achieved by installing grade banks and seepage interceptor drains (see Section 7.3.3 for more details) leading into farm water storages. These banks and drains are especially useful where dams or earthen tanks are located on hillslopes rather than in natural drainage lines, because they enable the natural catchment to be enlarged. Reverse seepage interceptor drains will capture both runoff and sub-surface flows on duplex soils while reducing the risk of erosion (which can silt up dams). Figure 12.1 demonstrates the effect of installing seepage interceptor drains on the amount of water that can be harvested. The data is from on several monitored sites in the South-west Hydrological Region and annual rainfall represent the rainfall received in any given year, rather than the annual average.
Figure 12.1: Comparison of runoff as a function of rainfall for cleared (>60%) catchments with defined
watercourses, small catchments with seepage interceptor drains and catchments without a defined watercourses (from McFarlane et al. 1995)
0
50
100
150
200
250
300
400 500 600 700 800 900
Annual rainfall (mm)
Ann
ual r
unof
f (m
m)
Catchment with a watercourse
Small catchment (<10ha) with interceptordrains
Catchment without a watercourse orinterceptor drains (estimated)

12: Water shortages
-251-
There are a variety of techniques for maximising runoff in areas where rainfall is low or soil infiltration rates are high. Roaded catchments (Figure 12.2) are commonly used in areas receiving less than 420 mm rainfall. They are constructed by compacting the soil in a similar manner to that used to form the surface of an earth road and consist of many parallel ridges with a smooth and impervious surface to minimise infiltration and maximise runoff. The roads are usually constructed within 500 m of a dam or earthen tank and can run straight up and down the slope on gradients ranging from 0.3% to 2.5% (1:300-1:40). Scraped catchments operate on a similar principal by removing the topsoil from a portion of the dam’s catchment to expose the clayey subsoil.
Figure 12.2: Roaded catchment layout (from Farmnote 109/84)

12: Water shortages
-252-
The computer model DAMCAT III (Coles et al., 2001) will generate reliability ratings for dams and roaded catchments of different size combinations using 25 year rainfall records. For a similar demand level, smaller dams need a relatively larger area of roaded catchment than do larger dams. This is because small dams have a lower storage and lose a higher proportion of water through evaporation than larger dams. Rock catchments can be constructed on large granitic rock outcrops. Low concrete walls constructed on the rock channel runoff into a storage. Such systems usually have a delivery efficiency of about 40% (of rainfall). Treated catchments use concrete, bitumen, corrugated iron, plastic or butyl rubber sheeting to increase runoff generation. Although more efficient than roaded catchments, they are more expensive to construct. Diversion banks can be used to capture runoff from tracks and roads. Flat batter dams are an option where the site is nearly level (Laing et al., 1980). Salinity problems Where salinity problems due to rising groundwater are encountered, the only solution may be to relocate the dam higher in the landscape. However, in some cases there is potential to divert the low flow that are saline away from water storages while still allowing the high volume flows that are fresh to enter the dam and improve the water quality. Another method of improving water quality in marginal dams is the use of siphons and piped outlets to remove water from the bottom of the dam where salinity concentrates during summer. Both option could be tried before abandoning a dam. Minimising water loss from storages Dam design can play an important role in reducing water lost by evaporation. The surface area from which water evaporates can be reduced by building circular dams rather than square dams and by deep excavation when the dam is constructed. Steep high batters surrounding the water on all sides (with a piped inlet) can also reduce evaporation. Windbreaks situated around the dam can reduce evaporation but care needs to be taken to avoid planting trees too close to the dam because roots and leaves may reduce its efficiency. Suspended covers such as corrugated iron or butyl sheeting can significantly reduce evaporation, but can be expensive to erect and difficult to maintain. Floating barriers such as old plastic bottles or beer cans strung together have limited potential. Problems with leaky dams have a variety of solutions. Compacting of the bottom and walls of the dam can be done when the dam is dry but the soil is still moist. Livestock trampling, compactors or rollers can be used to achieve this. In some cases it may be necessary to add a clay lining, approximately 30-80 cm thick, to the inside of a leaky dam. Pepper and Burke (1990) discuss techniques of clay lining applicable to Western Australian conditions. Plastic lining can also be used but care needs to be taken to ensure the durability of the lining. Bitumen and concrete linings are likely to prove expensive and may be prone to failure. Where clays are not dispersive enough to seal leaks in the dam, the chemical sodium tripolyphosphate (STPP) can be added to the water (Pepper, 1984). It is first necessary to conduct tests to ensure that the soils are suitable and to calculate the amount of STPP needed. Bentonite is a swelling clay that can be added to dams to seal the leaks. Sometimes the only solutions to water losses from dams and earthen tanks may be to build another storage elsewhere or to compensate for water losses through a combination of increased storage capacity, increased catchment size and improved harvesting. The groundwater option Accessing groundwater supplies is one potential solution to water shortages. Over large areas of the South-west Hydrological Region, groundwater is either unavailable or of an unsuitable quality, but there are some reasonable, scattered supplies. As the cost of exploratory drilling is high and there are often limited chances of success, professional advice should be sought by those considering prospecting for groundwater on their properties. A brief summary of groundwater availability for each of the hydrological zones is provided in Section 12.2.1 above. More detailed information is available from the Hydrogeological Mapping Series being produced by the Data Products and Marketing Branch at the Water and Rivers Commission and from regional hydrologists at local offices of Agriculture Western Australia.

12: Water shortages
-253-
Groundwater is a limited resource and it can take many years to replenish supplies if extraction rates are too high or if the supply becomes contaminated by surrounding saline waters. Any bores extracting water from aquifers have to be licensed by the Water and Rivers Commission.

12: Water shortages
-254-
12.4 SOURCES OF FURTHER INFORMATION
12.4.1 Useful publications See Appendix 1 for contact details of the publishing organisations. Available from Agriculture Western Australia: A farm water supply design manual is currently being prepared by Agriculture Western Australia and should be available in 2001. The Journal of Agriculture Western Australia (Ayling, 1985) devoted an entire issue to water supply topics. These included water supply schemes, roaded catchment designs, groundwater supplies and the chemical sealing of earth dams. This information is most relevant to the Wheatbelt and both Woolbelts. Water Harvesting - Improving the reliability of farm dams in the Western Australian wheatbelt (Hillman, 1992) provides a good overview of harvesting and storing surface water supplies in the Wheatbelt. Much of the information would also be appropriate to both Woolbelts. DAMCAT III (Coles et al., 2001) is a computer model that generates designs for dams and roaded catchments of different size combinations. Soilguide. A handbook for understanding and managing agricultural soils contains a chapter titled Runoff and Water Erosion (Coles and Moore, 1998) which provides methods for estimating runoff and water yields. It also provides tables of estimated runoff from the different landform types and rainfall zones in the agricultural districts of Western Australia. Dam design for pastoral stock supplies (Addison et al., 1994) was written for the rangelands, but provides a lot of information relevant to water harvesting and storage in agricultural areas. It is very comprehensive and contains practical information about dam construction. Chemical sealing of small earth dams using sodium tripolyphosphate (Pepper, 1984) details the results of research on using chemicals to seal leaky dams. A review of four on-farm water supply demonstration farms (Casey and Laing, 1993) presents four examples of successful whole-farm water supply improvements undertaken on properties in the north-eastern Wheatbelt. Common conservation works used in Western Australia (Keen, 1998) provides notes on design, construction of a variety of conservation works, including banks and dams. It also discusses the risk of failure or degradation associated with these works. Soil conservation earthworks design manual (Bligh, 1989) has sections covering rainfall intensity, runoff rates and volumes and the construction of earthworks which can be used for water harvesting. NOTE: this Earthworks Design Manual is listed as being for use by staff of Agriculture Western Australia only. A revised version of this manual should be available in 2001. Water supplies for horticulture in the Lower Great Southern (McFarlane et al., 1995) contains a variety of information including the water requirements of different crops in the Manjimup, Mt Barker and Albany districts, estimating water yield and dams sizes, the availability of groundwater and the ownership of water rights. Crop Irrigation Requirement Program (Aylmore et al., 1994) describes a program that estimates seasonal irrigation requirements for annual and perennial horticultural crops. Relevant data for specific crops are supplied for Albany, Armadale, Manjimup, Margaret River, Medina, Mt Barker and Wokalup. Consumption of water by livestock (Luke, 1987) provides information and ways to calculate the water requirements of livestock in the South-west Hydrological Region and other parts of Western Australia. Selecting and developing reliable bore sites in the eastern wheatbelt (George, 1991) is a good guide about locating groundwater supplies for livestock water in the Wheatbelt, and constructing and developing a bore.

12: Water shortages
-255-
Relevant Agriculture Western Australia Farmnotes include: General information
17/84 Pumping water on the farm 24/84 Building a synthetic windbreak 65/87 Selecting pipes for the farm 84/90 Rainwater tanks 21/91 Landcare at low or no cost 73/94 Water supplies for irrigation on the small farm 5/95 Farm Water Grants Scheme 1995
Dams and roaded catchments 31/81 Sites for new dams
109/84 Roaded catchment design and reconstruction 56/85 How to build roaded catchments with a road grader 41/86 Dimensions and volumes of farm dams 58/86 Roaded catchments – maintenance and construction 49/87 Irrigation dams 27/89 The hose level – how to make and use one 81/89 Control of erosion damage to dam walls and spillways 82/89 Roaded interceptor catchments 83/89 Selecting dam sites in the Upper Great Southern 88/90 Using explosives in dam construction
Water harvesting 51/85 How to build contour banks with a disc plough 53/85 How to build contour banks with a road grader 70/89 Reverse-bank seepage interceptor drains 71/89 Surveying and construction of reverse-bank interceptor drains 73/89 Waterways 62/91 Banks and drains for sloping land
Water requirements and quality 84/85 Emergency chlorination of farm dams 11/86 Clearing coloured or cloudy water 42/86 Low cost filter for trickle irrigation 11/87 Skimming polluted dams - a successful two stage system 59/88 Livestock and water salinity
103/89 Grass filter strips to prevent dam pollution 43/90 Salt accumulation and leaching under trickle irrigation 43/92 Iron in water for micro-irrigation 43/94 Toxic algal blooms 41/99 Water quality for dairying 46/99 Water salinity and crop irrigation 71/99 Tolerance of plants to salty water 72/99 Water quality for farm domestic use 73/99 Water quality for farm, garden and household use
Efficient water use 102/85 Watering requirements of vegetables grown on sandy soils 53/86 Sprinkler and micro-irrigation systems for small farms 52/88 Irrigation guide for maize, sorghum and sweet corn 22/90 Scheduling for trickle, sprinkler and flood irrigation 23/90 Irrigation scheduling - how and why 24/90 Interpreting tensiometer readings 25/90 Tensiometers – preparation and installation 26/90 Soil moisture monitoring equipment 35/90 Evaluating sprinkler and trickle irrigation systems 99/90 Irrigating table grapes
107/91 Using tensiometers for potato irrigation scheduling 30/92 Design guidelines for fixed sprinklers and micro-irrigation systems 48/92 Efficiency of irrigation systems 88/93 Tensiometers: a practical guide to problem solving 79/94 Soil moisture sensors for sandy soils 99/94 Selection of fertigation equipment 66/95 Irrigating vegetables on sandy soils 3/98 Using gypsum blocks to measure soil moisture in vineyards
43/99 Windbreaks for horticulture on the Swan Coastal Plain

12: Water shortages
-256-
66/99 Irrigation techniques for wine grapes 131/99 Irrigation of summer fruit in Western Australia 107/00 Scheduling irrigation of potatoes using tensiometers on light/medium to heavy soils Available from Water and Rivers Commission: Guidelines for the design and construction of small farm dams in the Warren area (Water Authority of Western Australia, 1993) is a manual designed to provide technical requirements for small dams (i.e. those with walls less than 10 m high) in the Warren and Donnelly River Catchments. Issues dealt with include soil investigations, design (including specifications for bank slopes and outlet pipes), construction, inspections and maintenance. The technical information is equally applicable over much of the Forested Hills and Woolbelt. The Hydrogeological Mapping Series currently being produced by the Data Products and Marketing Branch at the Water and Rivers Commission provides a regional overview of groundwater resources at a scale of 1:250,000. Currently published maps and accompanying explanatory notes cover the following areas: Harvey-Collie-Darkan-Boyupbrook-Bridgetown-Donnybrook-Capel-Bunbury (McCombe, 1999), Arthur River-Dumbleyung-Katanning-Kojonup (McCombe and Ye, 1999), Denmark-Frankland-Tambellup (Smith, 1997), Manjimup-Pemberton-Northcliffe-Walpole-Tonebridge (De Silva, 2000), the Dumbleyung Land Conservation District (Cody, 1994) and the Blackwood Catchment (De Silva et al., in press). Relevant Water facts (a series of pamphlets available from the Water and Rivers Commission) include: No. 5 Taking water from streams and lakes No. 8 What is groundwater No. 9 Western Australia’s groundwater resources No. 10 Groundwater pollution Available from the Environmental Defender’s Office: The law of Landcare in Western Australia (Clement and Bennett, 1998) is written to help landholders understand how they are affected by various laws relating to land and water resources and environmental issues. It answers question regarding the ownership of water resources, controls on the taking and use of surface and groundwater, obtaining licences, the relevant authorities and riparian rights under common law. Other publications: Soil and water conservation engineering (Schwab et al., 1981) is an American text which provides technical guidelines for the design of farm water storages and irrigation systems. It also includes chapters on water supplies and quality and the principles of irrigation. Design and construction of small earth dams (Nelson, 1985) outlines techniques for designing and constructing a variety of small earth dams in Australia.

12: Water shortages
-257-
12.4.2 Agencies and organisations to contact The following agencies and organisations can be contacted for more information (postal address, phone numbers, e-mail address and Internet websites of each organisation are listed in Appendix 1): The local district office of Agriculture Western Australia or Community Agriculture Centres (CAC) can provide information, publications and suitable contacts for specific topics relating to water supplies. Some offices will test the salinity of soil and water samples for a fee. Information on computer models, such as “AgET”, “Pumps”, “Drains” and “Banks” , or suitable contacts should also be available. The local Land Conservation Officer (LCO) at Agriculture Western Australia should be contacted regarding regulations covering land clearing or drainage. AGWEST Land Management Services and other agricultural consultants can assist with the preparation of farm plans and dam design for a fee. Consultants are listed on the Australian Association of Agricultural Consultants website. The Chemistry Centre (WA) and a number of commercial laboratories can analyse soil and water samples for a fee. Community Landcare Technicians (CLT) can help design and survey earthworks and drains for a fee. The local office of Agriculture Western Australia or Community Landcare Technician Association should be able to provide contact numbers for local CLTs. Groundwater hydrology consultants can help locate and develop groundwater supplies. Horticultural consultants can provide advice on crop water requirements and irrigation scheduling. Contact the Irrigation Association of Australia for a list of certified irrigation designers. The local Landcare Group or Land Conservation District Committee (LCDC) can often provide contact with landholders who have local experience about successful approaches to tackling water supply problems in the district. The Land Management Society can help provide information and establish contact with other landholders who have practical experience in tackling these issues. They also sell farm monitoring kits. The Water and Rivers Commission manages Western Australia’s water resources to enable sustainable development and maintain environmental and social values. They are responsible for allocating and licensing surface and groundwater supplies. The Data Products and Marketing Branch at the Water and Rivers Commission has comprehensive records of privately drilled bores, Government surveys, mining company bores etc. They can provide details of any groundwater information that has been recorded from, or is relevant to, any particular property. 12.5 REFERENCES
Addison, J.S., Law, R.J. and Eliot, G.B. (1994). Dam design for pastoral stock supplies. Western Australian Department of Agriculture, Bulletin No. 4207.
Ayling, G. (editor) (1985). Journal of Agriculture Western Australia. Volume 26(3). Aylmore, P.M., Luke, G.J. and Hauck, E.J. (1994). Crop irrigation requirement program. Western Australian
Department of Agriculture, Resource Management Technical Report No. 125. Bartlett, R.H., Gardner, A. and Humphries, B. (1996). ‘Water resource law and management in Western
Australia’. Centre for Commercial and Resources Law, The University of Western Australia. Bligh, K.J. (1989). ‘Soil conservation earthworks design manual’. Department of Agriculture Western Australia
(internal document). Casey, M.H.M. and Laing, I.A.F. (1993). A review of four on-farm water supply demonstration farms. Western
Australian Department of Agriculture, Resource Management Technical Report No. 120. Clement, J.P. and Bennett, M. (1998). ‘The law of Landcare in Western Australia’. Environmental Defender’s
Office W.A., Perth. Cody, S.J. (1994). Explanatory notes for the hydrogeological map and groundwater database of the
Dumbleyung Land Conservation District, Western Australia. Geological Survey of Western Australia Record 1994/7.
Coles, N. and Moore, G. (1998). Runoff and water erosion. In: ‘Soilguide - A handbook for understanding and managing agricultural soils’. (ed. G. Moore). Agriculture Western Australia, Bulletin No. 4343. pp. 223-242.

12: Water shortages
-258-
Coles, N, Denby, C. and Hauck, E. (2001). ‘DAMCAT III: Water supply design package’. Water Resource Unit, Agriculture Western Australian.
Deeney, A.C. (1988). Geology and groundwater resources of the surficial formations of the coastal plain between Pinjarra and Bunbury. Geological Survey of Western Australia, Hydrogeology Report No. 1988/5, Perth. (unpub).
De Silva, J. (2000). Pemberton-Irwin Inlet, W.A. Sheet S1 50-14. Water and Rivers Commission 1:250,000 Hydrogeological Series.
De Silva, J., Smith, R.A. and Ye, L. (in press). Hydrogeology of the Blackwood River Catchment. Water and Rivers Commission Hydrogeology Report HR 146.
George, R.J. (1991). Selecting and developing reliable bore sites in the eastern wheatbelt. Western Australian Department of Agriculture, Bulletin No. 4207.
George, R.J. (1998). Toolibin, Western Australia – Evaluation of airborne geophysics for catchment management. The National Airborne Geophysics Project produced for Agriculture, Fisheries and Forestry Australia and the National Dryland Salinity Program.
George, R.J., Cochrane, D.L. and Bennett, D.L. (1994). Groundwater systems responsible for dryland salinity in the Lake Towerrinning catchment, Western Australia. In: ‘Water Down Under ’94 - Volume 2: Groundwater Papers’. Institution of Engineers Australia, Canberra.
Hillman, B. (editor) (1992). ‘Water harvesting - Improving the reliability of farm dams in the Western Australian wheatbelt’. Western Australian Department of Agriculture.
Keen, M.G. (1998). Common conservation works used in Western Australia. Agriculture Western Australia, Resource Management Technical Report No. 185.
Laing, I.A.F., Pepper, R.G. and Prout, A.L. (1980). Flat batter dams suit difficult sites. Journal of Agriculture Western Australia 24: 110-112
Laing, I.A.F., Pepper, R.G. and McRea, A.F. (1988). Problem districts for on-farm water supply in South Western Australia. Western Australian Department of Agriculture, Division of Resource Management Technical Report No. 84.
Luke, G.J. (1987). Consumption of water by livestock. Western Australian Department of Agriculture, Division of Resource Management Technical Report No. 60.
Luke, G.J. and Denby, C. (1987). Storage life of farm dams. Western Australian Department of Agriculture, Division of Resource Management Technical Report No. 64.
McCombe, C.J. (1999). Collie, W.A. Sheet S1 50-7. Water and Rivers Commission 1:250,000 Hydrogeological Series.
McCombe, C.J. and Ye, L. (1999). Dumbleyung, W.A. Sheet S1 50-6. Water and Rivers Commission 1:250,000 Hydrogeological Series.
McFarlane, D.J., Ferdowsian, R. and Ryder, A. (1995). Water supplies for horticulture in the Lower Great Southern. Western Australian Department of Agriculture, Miscellaneous Publication No. 17/95.
Nelson, K.D. (1985). ‘Design and construction of small earth dams’. Inkata Press, Melbourne. Paulin, R. (1984). Fruit tree and vine crop irrigation. Western Australian Department of Agriculture, Bulletin No.
26. Pepper, R.G. (1984). Chemical sealing of small earth dams using sodium tripolyphosphate. Western
Australian Department of Agriculture, Technical Bulletin No. 67. Pepper, R.G. and Burke, K.L. (1990). Clay lining of leaking earth dams. Agricultural Water Management 17:
379-390. Prangley, C.J. (1994). Boscabel palaeochannel bore completion report. Western Australian Geological Survey
Hydrology Report 1994/1 (unpublished). Rockwater Pty Ltd (1990). ‘Proposed tannery site at Daradine – Results of groundwater investigations’.
Unpublished report to Kinhill Engineers Pty Ltd. Schwab, G.O., Frevert, R.K., Edminster, T.W. and Barnes, K.K. (1981). ‘Soil and water conservation
engineering’ (3rd edition). John Wiley and Sons, New York. Smith, R.A. (1997). Hydrogeology of the Mount-Barker-Albany 1: 250,000 Sheet. Western Australian Water
and Rivers Commission, Hydrological Map Explanatory Notes Series No. HM 1. Thorpe, P.M. and Baddock, L.J. (1994). Groundwater resources of the Busselton-Walpole region. Western
Australian Geological Survey Hydrology Report 1994/29 (unpublished). Water Authority of Western Australia (1993). Guidelines for the design and construction of small farm dams in
the Warren area. Water Authority of Western Australia, Report No. WP 159. Waterhouse, J.D., Commander, D.P., Prangley, C. and Backhouse, J. (1994). Newly recognized Eocene
sediments in the Beaufort River Palaeochannel. Western Australian Geological Survey Annual Review, 1993-94.

Appendix 1: Contact details
-259-
APPENDIX 1: CONTACT DETAILS FOR ORGANISATIONS AND AGENCIES
Agriculture Western Australia Agriculture Western Australia Postal address: 3 Baron-Hay Court Locked Bag 4 SOUTH PERTH WA 6151 Bentley Delivery Centre WA 6983 Phone: 08 9368 3333 Internet: www.agric.wa.gov.au Regional Offices Bunbury Regional Office Albany Regional Office North Boyanup Road 444 Albany Highway (PO Box 1231 ) ALBANY WA 6330 BUNBURY WA 6230 Phone: 08 9892 8444 Phone: 08 9780 6100 District Offices Busselton District Office Katanning District Office Narrogin District Office 1 Queen Street Clive Street 10 Doney Street BUSSELTON WA 6280 (PO Box 757) NARROGIN WA 6312 Phone: 08 9752 1688 KATANNING WA 6317 Phone: 08 9881 0222 Phone: 08 9821 3333 Harvey District Office Manjimup District Office Pinjarra Office 6 Becher Street Rose Street 6 George Street HARVEY WA 6220 MANJIMUP WA 6258 (PO Box 376) Phone: 08 9729 1507 Phone: 08 9771 1299 PINJARRA WA 6208 Phone: 08 9531 1788 Community Agriculture Centres (CAC) Blackwood CAC Kojonup CAC Wickepin CAC Railway Parade 97 Albany Highway 40 Wogalin Road BOYUP BROOK WA 6244 KOJONUP WA 6395 WICKEPIN WA 6370 Phone: 08 9765 1478 Phone: 08 9831 1999 Phone: 08 9888 1223 Gillamii CAC Pingelly CAC Blackwood CAC Cnr Gordon & Gathorne Sts 21 Park Street St John’s Ambulance Centre CRANBROOK WA 6321 PINGELLY WA 6308 Cnr Scadden and Rifle Streets Phone: 08 9826 1285 Phone: 08 9887 0092 (PO Box 311) WAGIN WA 6315 West Arthur CAC Plantagenet CAC Phone: 08 9861 2022 1-3 Hillman Street Railway Station DARKAN WA 6392 PO Box 118 Phone: 08 9736 1379 MT BARKER WA 6324 Phone: 08 9851 2706

Appendix 1: Contact details
-260-
AGRICULTURE WESTERN AUSTRALIA PUBLICATIONS ARE AVAILABLE FROM: Publications Officer Agriculture Western Australia Locked Bag 4 BENTLEY DELIVERY CENTRE WA 6983 Phone: 08 9368 3729 e-mail: [email protected] Internet: www.agric.wa.gov.au/agency/Pubns/ Farmnotes dating back to 1988 are available in the dial-up AgFax system. Dial 1902 990 506 from a fax machine with a handset, with the machine set to tone and voice (not poll) and follow the prompts to receive documents immediately, 24 hours per day. The charge is 50 cents per minute. If your exchange is non-digital (this is now the exception), you should dial 0055 10700; the charge is then 60 c/minute. Charges from mobile and payphones are higher. Farmnotes are also available over the Internet at: www.agric.wa.gov.au/agency/Pubns/farmnote/ AGWEST Land Management Services AGWEST Land Management Services Agriculture Western Australia Locked Bag 4 Bentley Delivery Centre WA 6983 Phone: 08 9368 3440 e-mail: [email protected] Australian Association of Agricultural Consultants WA (Inc.) Australian Association of Agricultural Consultants Phone: 1800 644 855 Internet: www.aaacwa.com.au Blackwood Basin Group Blackwood Basin Group Railway Parade (PO Box 231) BOYUP BROOK WA 6244 Phone: 08 9765 1555 Chemistry Centre WA Chemistry Centre WA 125 Hay Street EAST PERTH WA 6004 Phone: 08 9325 5554 Community Landcare Coordinator (CLC) Community Landcare Coordinators can be contacted through the local office of Agriculture Western Australia (see above) or the relevant Local Shire or Local Council office (see your local telephone directory or contact: WA Municipal Association on 08 9321 5055).

Appendix 1: Contact details
-261-
Community Landcare Technicians (CLT) Community Landcare Technicians can be contacted through the:
local office of Agriculture Western Australia (see above),
relevant Local Shire Local Council office (see local telephone directory or contact: WA Municipal Association on 08 9321 5055),
Community Landcare Technician’s Association Phone: (08) 9961 9015 e-mail: [email protected] Internet: a website is currently being prepared. CSIRO Division of Forestry CSIRO Division of Forestry PO Box 4008 CANBERRA, ACT, 2600 Phone: (02) 6281 8211 e-mail: [email protected] Internet: www.cbr.for.csiro.au/publicat Data Products and Marketing Data Products and Marketing Water and Rivers Commission 3 Plains Street EAST PERTH WA 6004 Phone: 08 9278 0580 Environmental Defender’s Office Environmental Defender’s Office WA (Inc) Level 1, Law Society House 33 Barrack Street PERTH WA 6000 Phone: 08 9221 3070 e-mail: [email protected] Internet: www.environ.wa.gov.au Environmental Protection Authority Environmental Protection Authority Westralia Square 141 St Georges Terrace PERTH WA 6000 Phone: 08 9222 7000 Internet: www.edo.org.au/edowa

Appendix 1: Contact details
-262-
Farm Forestry Advisory Service Internet: www.agric.wa.gov.au/programs/srd/farmforestry/index.htm Contact the Department of Conservation and Land Management (CALM) or Agriculture Western Australia at the following addresses: Conservation and Land Management Agriculture Western Australia 14 Queen Street North Boyanup Road BUSSELTON WA 6280 BUNBURY WA 6230 Phone: 08 9752 1677 Phone: 08 9780 6100 Conservation and Land Management Agriculture Western Australia North Boyanup Road 10 Doney Street BUNBURY WA 6230 NARROGIN WA 6312 Phone: 08 9725 4300 Phone: 08 9881 0222 Agriculture Western Australia Rose Street MANJIMUP WA 6258 Phone: 08 9771 1299 Fisheries Western Australia Fisheries Western Australia 3rd Floor, SGIO Atrium 168-170 St Georges Terrace PERTH WA 6000 Phone: 08 9482 7333 e-mail: [email protected] Internet: www.wa.gov.au/westfish/aqua/ index.html#AQWA Geocatch Network Centre Geocatch Network Centre Unit 2, Palm Court Arcade 62 Kent Street BUSSELTON WA 6280 Phone: 08 9754 4331 Irrigation Association of Australia Irrigation Association of Australia 12 Vincents Ave WEMBELY WA 6014 Phone: 08 9388 0088 Landcare Group or Land Conservation District Committee (LCDC) Landcare Groups or Land Conservation District Committees can be contacted through the local office of Agriculture Western Australia (see above), the relevant Local Shire or Local Council office (see your local telephone directory or contact: WA Municipal Association on 08 9321 5055) or the Soil and Land Conservation Council (Phone: 08 9368 3282). Land Management Society Land Management Society PO Box 242 COMO WA 6152 Phone: 08 9450 6862 e-mail: [email protected] Internet: www.lmsinfo.com

Appendix 1: Contact details
-263-
Land and Water Resources Research and Development Corporation Land and Water Resources Research and Development Corporation GPO Box 2182 CANBERRA ACT 2601 e-mail: [email protected] Internet: www.lwrrdc.gov.au/publicat/publicat.htm New South Wales Department of Land and Water Conservation Information Centre Department of Land and Water Conservation GPO Box 39 SYDNEY NSW 2001 Phone: 02 9228 6415 e-mail: [email protected] Internet: www.dlwc.nsw.gov.au Pinjarra Community Catchment Centre 6 George Street (PO Box 376) PINJARRA WA 6208 Phone: 08 9531 1788 Queensland Department of Natural Resources Department of Natural Resource Locked Bag 40 COOPAROO DC QLD 4151 Phone: 07 3227 6626 Internet: www.dnr.qld.gov.au Rural Industries Research and Development Corporation (RIRDC) Rural Industries Research and Development Corporation PO Box 4776 KINGSTON, ACT, 2604 Phone: 08 9771 1878 e-mail: [email protected] Internet: www.dpie.gov.au/rirdc South-west Irrigation South-west Irrigation James Stirling Place HARVEY WA 6220 Phone: 08 9729 0100 The University of Western Australia The University of Western Australia NEDLANDS WA 6907 Phone: 08 9380 3838 e-mail: [email protected]

Appendix 1: Contact details
-264-
Victorian Department of Natural Resources and Environment Natural Resources and Environment Information Centre 8 Nicholson Street EAST MELBOURNE VIC 3002 Phone: 03 9637 8080 e-mail: [email protected] Internet: www.dce.vic.gov.au/index.htm Water and Rivers Commission Head Office Data Products and Marketing Level 2, Hyatt Centre Hyatt Centre 3 Plain Street 3 Plain Street EAST PERTH WA 6004 EAST PERTH WA 6004 Phone: 08 9278 0300 Phone: 08 9278 0580 Internet: www.wrc.wa.gov.au South West Regional Office South Coast Regional Office Unit 2, Leschenault Quays 5 Bevan Street Austral Parade (PO Box 525) (PO Box 261) ALBANY WA 6330 BUNBURY WA 6231 Phone: 08 9842 5760 Phone: 08 9721 0666 Denmark Office Mandurah Office Suite 1 “Sholl House” 55 Strickland Street 21 Sholl Street (PO Box 303) (PO Box 332) DENMARK WA 6333 MANDURAH WA 6201 Phone: 08 9848 1866 Phone: 08 9535 3411 Manjimup Office 52 Bath Street MANJIMUP WA 6258 Phone: 08 9771 1878 The following Waterways Management Authorities and Catchment Councils can also be contacted: Leschenault Inlet Management Authority Blackwood Basin Group C/- Water and Rivers Commission Railway Parade PO Box 261 (PO Box 231) BUNBURY WA 6231 BOYUP BROOK WA 6244 Phone: 08 9721 0666 Phone: 08 9765 1555 Peel Inlet Management Authority Geographe Catchment Group C/- Water and Rivers Commission Geocatch Network Centre PO Box 332 Unit 2, Palm Court Arcade MANDURAH WA 6201 62 Kent Street Phone: 08 9535 3411 BUSSELTON WA 6280 Phone: 08 9754 4331 Wilson Inlet Management Authority C/- Water and Rivers Commission PO Box 303 DENMARK WA 6333 Phone: 08 9848 1866
Appendix 2: Glossary
-265-
APPENDIX 2: GLOSSARY OF TERMS
Absorption banks: Embankments built on upper slopes and designed to control surface flows where there is no safe way of disposing the water. Absorption banks are surveyed and constructed on the contour with a bulldozer. Both ends of the absorption bank are turned up to maximise water storage and this differentiates them from level banks. See Section 9.3.3 for further details.
Accelerated erosion: An increased rate of soil erosion resulting from human activities.
Acidic (soil): Describes the condition of a soil with a high concentration of hydrogen ions. Soil acidity is measured using the pH scale. A soil with a pH of less than 6.5 is considered to be acidic. Where soil pH measured in calcium chloride (pHCa) is below 4.5, acidity is likely to restrict plant growth and problems such as aluminium toxicity may develop.
Acidification: A form of land degradation where soils become increasingly acidic due to human activities such applying fertilisers or introducing leguminous pastures.
Active discharge: Groundwater that returns to the ground surface as a saturated flow driven by the hydraulic gradient. Examples of active discharge include springs, soaks or saline flats where aquifers intersect the ground surface.
Adsorb: To bond a gas, liquid or dissolved substance onto a surface in a condensed layer, e.g. dissolved phosphorus molecules adsorb onto the surfaces of soil constituents (clay particles, organic matter or iron oxyhydroxides).
Adsorption: The binding of a gas, liquid or dissolved substance onto a surface.
Agroforestry: The integration of tree crops with the traditional agricultural practices of grazing livestock and cropping.
Algal bloom: The rapid and excessive growth of algae in a water body caused by favourable growing conditions and high nutrient levels.
Alkaline (soil): Describes the properties of a soil with a high level of carbonates of calcium and/or sodium. Soil alkalinity is measured using the pH scale. A soil with a pH of greater than 7.5 is considered to be alkaline.
Alluvial plain: A broad plain formed of alluvium.
Alluvium: Unconsolidated material deposited by running water such as a river. Includes gravel, sand, silt, clay and various mixtures of these.
Amendment (soil): A material (such as gypsum) that is added to a soil to improve its chemical or physical characteristics.
Amphibolite: A metamorphic rock comprised mainly of the mineral amphibole.
Anaerobic: Describes conditions that are free of molecular oxygen. In soils, anaerobic conditions are usually caused by excess water filling most of the coarse pores in the soil.
Annual pan evaporation: An estimate of the average total evaporation occurring at a particular site over the period of a year based on measurements of how much water is lost from a Class A pan fitted with bird guards. The bird guard reduces the evaporation by about 7%.
Annual pasture: A pasture composed primarily of annual plants.
Annual plant: A plant that completes its life cycle within 12 months. In the South-west Hydrological Region, annual pastures usually begin growing in late autumn or early winter and complete their life cycles in late spring or early summer.
Aquifer: A geological formation comprising layers of rock, unconsolidated deposits or regolith, that are capable of receiving, storing and transmitting significant quantities of water. Aquifers may be permeable or fractured bedrock, unconsolidated sediments or highly weathered rock. The term is usually applied to saturated materials that currently contain water.
Aquitard: A geological formation of low permeability that can only transmit water at much lower rates than adjacent aquifers. Aquitards occur above confined aquifers or below perched aquifers.
Artesian aquifer: A confined aquifer in which the piezometric head sits above the ground surface so that the pressure causes water to flow freely from bores drilled into the aquifer.

Appendix 2: Glossary
-266-
Available nutrients: The elements and minerals in the soil solution that can readily be taken up by plant roots.
Bank: An artificial embankment constructed by piling earth into a long, linear mound. Banks are constructed to intercept and control surface water flows.
Basalt: A dark coloured, fine grained, basic igneous rock formed in association with volcanic activity.
Basin (geology): A low area in which sediments have accumulated. Also used to refer to geological strata formed from sediments deposited in a basin.
Batter: The excavated or constructed face of a dam wall, bank or cutting, produced as a result of earth moving operations involving cutting or filling.
Beach ridge: A very long, nearly straight low ridge, built up by waves and usually modified by wind.
Bedrock: A general term for the solid rock that lies underneath the soil and other unconsolidated material. When exposed at the surface it is referred to as rock outcrop.
Bedrock high: An area in which the bedrock is closer to the ground surface than in the surrounding areas. On slopes with patches of shallow bedrock, groundwater discharge is often initiated as lateral flows are forced to the surface.
Biomass: The amount of living material present in a given area at a given time.
Biotite: A geological mineral of the mica group containing both iron and aluminium.
Bore: A hole drilled through soil, regolith or rock, typically for the purpose of observing or extracting groundwater.
Brackish (water): A term used to describe water that has moderate salinity levels (1,070-5,000 mg/L) these levels limit its suitability for many uses.
Break of slope seep: Seepage occurring where groundwater is discharged near the foot of a slope after being forced to the surface by a decrease in the slope of the water table.
Breakaway: A landform found on the edge of a plateau or plateau remnant where a relatively flat upland ends abruptly in a low scarp that sits above a debris slope. Breakaways are common in lateritic landscapes in the Wheatbelt and Woolbelts.
Broadacre: A term used to describe farming or cropping enterprises that cover large areas of land, as are typical of farms in the Wheatbelt. The term “broadacre cropping” is used to differentiate the growing of crops such as wheat, lupins and canola from the intensive cropping practiced in horticulture.
Broad-based banks: Variations of grade or level banks that allow for machinery movement and tillage. They are built by a grader or bulldozer and have flat channels, gentle batters and low bank. See Section 9.3.3 for further details.
Buffer strip: A strip of land protecting the land it surrounds from management practices or processes occurring on adjoining areas. In this report buffers strips are generally narrow areas of vegetated land used to filter sediment or nutrients from water entering a drainage line or waterway.
Calcareous (soil): A soil with a high content of calcium carbonate (commonly referred to as lime). Calcareous sands that are found in coastal areas typically contain numerous sea shell fragments.
Capillary fringe: The zone immediately above a water table in which most pores and voids are filled with water, but the water is at less than atmospheric pressure (i.e. the soil or regolith is almost saturated) and will not flow into a hole or macropore.
Capillary rise: The unsaturated flow of water upwards from the water table. Capillary rise is driven by matric suction maintained by evapotranspiration from the soil surface. The water moves upwards through fine pore spaces and as films around the soil particles.
Catchment: The total area of land potentially contributing to water flowing through a particular point.
Catchment divide: The boundary between two catchments that divides the surface waters that flow naturally in one direction from those that flow in the opposite direction.
Cemented: Soil and rock particles bound together by another material such as calcium carbonate or iron. The degree of cementation can range from weakly cemented to indurated.

Appendix 2: Glossary
-267-
Clay: (a) Fine soil particles <0.002 mm in diameter; (b) Soil texture class with more than 30% clay-sized particles and less than 25% silt sized particles; (c) Soil profiles with a clayey texture in the top 3 cm.
Coastal plain: A low, generally broad plain that has as its margin an oceanic shore. Its strata are horizontal or slope gently towards the ocean.
Coastal Plains: The hydrological zone which includes the Swan Coastal Plain (on the West Coast from Kwinana to Dunsborough) and the Scott Coastal Plain (on the South Coast stretching east from Augusta). The Coastal Plains are characterised by high rainfall, flat topography, extensive areas of poor drainage and an underlying sedimentary geology.
Coffee rock: A colloquial term typically used to describe the organic pan found in deep sands. Coffee rock can be weakly to strongly cemented by iron and aluminium and is especially common on the Coastal Plains. The name comes from the resemblance that these pans bear to instant coffee powder that has been exposed to moisture and then allowed to dry.
Colluvium: Unconsolidated, unsorted earth materials deposited on sideslopes and/or at the base of slopes by local runoff (unconcentrated) or mass movement (e.g. direct gravitational action).
Complex (geology): A geological term referring to an area comprised of mixed group of rocks of varying origin or nature.
Confined aquifer: An aquifer (geological formation containing water) overlain by an aquitard (layer of low permeability) that restricts the upward movement of water. In a confined aquifer there is no water table because the aquitard prevents the water from rising (i.e. the piezometric head is above the aquifer).
Conglomerate: A group of sedimentary rocks consisting of rounded and sub-rounded particles, many greater than 2 mm in diameter.
Contour: An imaginary line on the surface of the earth connecting points of the same elevation (i.e. the same height above sea level).
Contour cropping: The practice of sowing crops along the contour rather than cultivating up and down the slope.
Contour sills: Shallow channels built by a grader in paddocks used for regular broadacre cropping. They are designed to spread runoff from normal rainfall events and encourage contour cultivation. Contour sills reduce the velocity of water flowing down the slope, thus aiding infiltration and reducing runoff volume. See Section 9.3.3 for further details.
Cracking clay: A soil profile with a clay texture throughout, which swells and forms a solid mass when wet, but which cracks (at least 5 mm wide and 10 cm deep) when drying.
Craton: A major structural unit of the Earth's crust, consisting of a large stable mass of rock that has not been altered significantly for a long period. The Yilgarn Craton, consisting of crystalline rocks such as granite, is a dominant feature of the geology of Western Australia.
Crest: The commonly linear, narrow summit of a ridge, hill or mountain.
Crust (soil): A thin surface layer of a soil profile that is harder than the underlying horizons. The crust can often retard infiltration. Usually referred to as surface crust.
Crystalline rock: An igneous or metamorphic rock comprised of interlocking crystals. Examples include granite or gneiss.
Dam: A barrier, embankment or excavated earth structure constructed primarily to impound water for storage. Dams are generally built in or near drainage lines. Dam walls can range from large concrete structures such as Wellington Dam to the small earthen walls typical of many farm dams.
Deep drainage: The removal of groundwater using deep open drains or sub-surface drains.
Deep open drains: Drains designed to intercept and remove groundwater (typically from surficial aquifers). Deep open drains are constructed with a bulldozer or excavator and are left uncovered. They are more than 60 cm deep and typically 1.2-2.5 m deep or more.
Deeply weathered profile: A deep (up to 50 m deep) section of soil and regolith formed by the weathering (physical disintegration, chemical decomposition or biologically-induced changes) of rock on the Earth’s surface over a long period of time of geological stability. In the South-west Hydrological Region, deep weathering usually resulted in the formation of laterite and the deeply weathered profile is usually a lateritic profile.

Appendix 2: Glossary
-268-
Degradation: The decline in the quality of natural resources such as soils, water and plants.
Deposit: Earth material of any type, either consolidated or unconsolidated, that has transported and subsequently accumulated by natural processes.
Deposition: The laying down of any material by any agent such as wind, water, ice or by other natural processes.
Depression: Any relatively sunken part of the Earth's surface; especially a low-lying area surrounded by higher ground.
Depression storage: Water accumulated in pools or puddles formed in depressions on the ground surface.
Diffuse source: Describes a broad area from which nutrients that contribute to eutrophication are discharged. Pastures and broadacre cropping land are common examples of diffuse sources.
Discharge: The water which moves from a groundwater body to the ground surface (or into a surface water body such as a lake or the ocean). Discharge typically leaves aquifers directly through seepage (active discharge) or indirectly through capillary rise (passive discharge). The term discharge is also used to describe the process of water movement from a body of groundwater.
Discharge area: An area where significant amounts of groundwater come to the surface, either directly or indirectly.
Dispersion (soil): The process whereby the soil aggregates break down in water into their constituent particles (sand, silt and clay) due to deflocculation. The clay particles go into suspension. Dispersion affects the structure and coherence of a soil and its pores get clogged by the loose clay particles, reducing its permeability and often resulting in waterlogging.
Dispersive: Describes a soil prone to dispersion.
Dissected: Describes a land surface that has been cut by valleys formed by eroding rivers and streams.
Dissection: The process by which valleys are cut into a land surface by eroding rivers and streams.
Dissolved (salts or nutrients): Describes the situation when salts or nutrients go into solution, becoming bonded to water molecules.
Dolerite: A medium grained, basic, igneous rock that has crystallised near the surface, typically occurring as a dyke, sill or plug.
Drain: A channel or tunnel constructed to intercept and remove water.
Drainage: The removal of water from a site or soil profile. Site drainage relates to the rate at which water is removed from a particular site. Soil or profile drainage relates to the rate at which water is removed from a particular soil profile. The term drainage is also used to describe systems that are artificially constructed to improve site or soil drainage (e.g. deep drains, seepage interceptors or pumping systems).
Drainage depression: A level to gently inclined shallow, open depression with smoothly concave cross-section that conveys runoff only during or immediately after periods of heavy rainfall.
Drainage line: A channel down which surface water naturally concentrates and flows regularly, either permanently or for short periods. Examples include streams and the floors of drainage depressions.
Drainage system: A network of drainage lines and waterways (either natural or artificial) through which water occurring over an area is transported to and end point. Natural drainage systems typically consist of all the rivers and streams in a catchment. Artificial drainage systems usually comprise a series of connected drains and waterways designed and constructed to remove excess surface or groundwater from an area.
Drawdown: The lowering of a water table resulting from the removal of water from an aquifer or reduction in hydraulic pressure.
Dryland salinity: The salinisation of land which is not irrigated. The term dryland salinity does not imply that the land is dry, as areas affected by dryland salinity are typically also waterlogged.
Dune: A ridge, bank, hill or low mound of loose, wind-blown, granular material (generally sand), either bare or covered with vegetation; capable of movement from place to place but always retaining its characteristic shape.

Appendix 2: Glossary
-269-
Duplex (soil): A soil with a sudden increase in texture between the topsoil and subsoil, e.g. a sand over a clay.
Duricrust: A hard layer which looks like rock and is formed at, or near, the ground surface by the concentration of materials. In the South-west Hydrological Region, duricrust usually occurs as a layer of cemented ironstone gravels that are rich in iron-oxide. Duricrust is sometimes referred to as sheet laterite, ferricrete, ironstone or caprock.
Dyke: A sheet-like body of igneous rock cutting across the bedding or structural planes of the host rock. Dykes typically appear on the surface as relatively narrow, linear features.
Dyke swarm: Describes the situation where numerous dykes, usually of similar age, are found in the same area.
Earth (soil): A soil profile with a gradual increase in texture between the topsoil and subsoil, e.g. a sand grading into a loam with depth or a loam grading to clay with depth. Soils with a loam texture throughout the profile are also referred to as earths.
Earthen tank: A water supply structure, similar to a dam but usually constructed on a hill slope away from drainage lines. Earthen tanks consist of an excavated hole, usually with three walls constructed using the spoil. Water is directed into these structures via banks or drains. Earthen tanks are common in the Woolbelt and Wheatbelt and typically have a capacity of 500-5,000 m3.
Earthflow: A form of mass movement where saturated earth moves like a viscous fluid. Differs from other forms of mass movement (landslide, landslip and slumps) where the earth remains a solid mass.
Earthwork: A structure made out of earth (soil and regolith) and designed or constructed to intercept, divert, retain, detain or dispose of runoff or throughflow.
Eastern Woolbelt: The hydrological zone which lies predominantly between the Great Southern Highway and the Albany Highway. This zone stretches from Pingelly in the north, through Narrogin, Wagin and Kojonup to Tambellup and Cranbrook. The Eastern Woolbelt is characterised by a moderately low rainfall, undulating landscape and a relatively shallow weathering profile.
EC: An abbreviation of electrical conductivity, a measure of the ability of a medium to conduct electricity. EC is used often as a surrogate measure of salinity levels in water or soil as the conductivity of a solution generally increases in proportion with its salt content. There are three types of electrical conductivity measurements made on soils; • ECe measurements are made on saturation extract paste from soil samples. • EC1:5 measurements are made on a solution obtained by mixing one part soil with five parts
distilled water. • ECa measurements are taken in the field using an electromagnetic induction meter.
Eocene sediments: Sediments deposited during the Eocene Epoch (38-65 million years before the present). In the South-west Hydrological Region they consist mostly of cemented and unconsolidated layers of sand and clay.
Ephemeral stream: A stream, or part of a stream, that flows only in direct response to precipitation. Its channel is always above the water table.
Equilibrium: Describes the state of a flow system in which recharge equals discharge and the water table level therefore remains constant or rises and falls around a long-term average level.
Erodibility (soil). The susceptibility of a soil to erosion.
Erosion: The wearing away of the land surface by running water, waves, wind or by other processes like mass wasting and corrosion (solution and other chemical processes). The term “geological erosion” refers to natural erosion processes occurring over long (geological) time spans. “Accelerated erosion” generically refers to erosion in excess of what is presumed or estimated to be naturally occurring levels, and which is a direct result of human activities such as cultivation.
Eutrophication: The enrichment of a water body with organic and inorganic plant nutrients. Eutrophication can cause the water body to become highly active biologically, with increased growth of algae.
Evaporation: The conversion of a liquid into vapour. In the hydrological cycle, evaporation involves heat from the sun transforming water (held in surface storages in soil) from a liquid state into a gaseous state. This allows the water to move from water bodies or the soil and enter the atmosphere as water vapour.
Appendix 2: Glossary
-270-
Evapotranspiration: The transfer of soil water to the atmosphere from vegetated land through the combined processes of evaporation from soils and transpiration from plants.
Farm water storage: Any structure or natural feature which is used to hold water for later use on an agricultural property. Examples include gully wall dams, soaks, and concrete tanks.
Farming system: A combination of the crops, pastures, livestock and agricultural practices (e.g. cultivation technique and fertiliser regime) that are used on a farm.
Fault: A fracture or fracture zone of the Earth’s crust with displacement along one side in respect to the other.
Fertigation: The practice of dissolving nutrients and supplying them to crops through the irrigation system. Fertiliser can be applied daily at the required rate to meet immediate crop demands.
Fertiliser: A material that is added to the soil to supply one or more plant nutrients.
Fertiliser application: The process of adding fertilisers to a crop or pasture.
Fertility (soil): The capacity of a soil to produce abundant plant growth. Usually implies a good supply of nutrients and water.
Flood plain: A plain built up by periodic flooding and alluvial deposition.
Flooding: The situation where large volumes of water flow across the ground surface. It usually occurs along drainage lines and on valley floors. Differs from inundation where water on surface is stationary.
Flow rate: The amount of surface water or groundwater flowing past a given point or line over a defined time period. Measured as volume, depth or area of water per minute, hour, day or year.
Flow systems: The portions of the hydrological cycle which involve the movement of water across the land surface or through the ground. Includes surface flows (runoff and stream flow), temporary sub-surface flows and permanent groundwater flows.
Flow velocity: The speed at which surface water or groundwater flows. Measured as a distance per time period (e.g. mm/hr or m/day).
Fodder shrub: A medium sized woody plant with leaves that are a good source of food for livestock .
Footslope: The lower part of a hillslope, commonly concave in profile.
Forested Hills: The hydrological zone which extends from Jarrahdale, through Dwellingup, Collie, Donnybrook, Bridgetown, Nannup, Margaret River, Manjimup, Pemberton, Northcliffe and Walpole to Denmark. The Forested Hills are characterised by high rainfall, undulating to rolling topography and extensive areas of uncleared land.
Formation (geology): A geological term for a distinct layer of sedimentary deposits.
Fracture (geology): Cracks, joints, faults and other breaks in a rock as a result of that rock being subjected to pressures or movement.
Fractured rock aquifers: Rocks that capable of receiving, storing and transmitting significant quantities of water due to the presence of numerous cracks, fissures or fractures in what would otherwise be an impermeable material.
Fresh (rock): A colloquial term for bedrock that has been exposed on or near the surface relatively recently (in geological terms). The term can be misleading as the rocks involved are usually more than a billion years old. The term “fresh” refers to the fact that the rock has been stored underground in an undisturbed state in contrast to deeply weathered profiles in which the rock has been subjected to extensive alteration. Soils formed from fresh rock are typically fertile and often have a rich red or brown colour.
Fresh (water): A term used to describe water that has very low levels of salinity (less than 500 mg/L) - these present no limitation to its suitability for most uses.
Geological structure: A feature produced by the displacement or deformation of rocks. Examples include faults, folds, shear zones and dykes.
Geology: The study of the Earth and the rocks of which it is composed.
Gneiss: Banded metamorphic rocks which are generally coarse-grained.

Appendix 2: Glossary
-271-
Grade bank: A bank built across a slope (on a slight gradient off the contour) to collect and direct runoff water. Grade banks can be built with a grader, plough or bulldozer. Grade banks are sometimes incorrectly referred to as contour banks. See Section 9.3.3 for further details.
Grade furrows: Small temporary drains constructed on slopes where vegetable cropping rows run up and down a slope. They are designed to shorten row lengths and quickly remove water from the plot. See Section 9.3.3 for further details.
Gradient: The degree of inclination of a slope, usually expressed as a ratio of the change in height over a particular distance. For example, a gradient of 1:500 means the slope drops by a metre over every 500 m. Gradients of steeper slopes are expressed as a percentage, with a 100% slope being the equivalent of 1:1 gradient, a 25% slope being the equivalent of 1:4 gradient and a 10% slope being the equivalent of 1:10 gradient. Gradients can be measured on hillslopes, valley floors, water tables and earthworks.
Granite: A light-coloured, coarse grained igneous rock formed by the slow cooling of a large intrusion of magma. Granite consists essentially of quartz (20-40%), feldspar and very commonly a mica as well.
Gravel: In the South-west Hydrological Region, the term gravel is most commonly used to describe the rounded ironstone gravel associated with laterite and commonly used as a road base. The correct technical definition relates to coarse mineral particles (rock fragments) in the size range of 2-75 mm in diameter.
Gravels (soil): The term applied to soil with a significant ironstone gravel content (>20%) in the top 15 cm of the profile. Includes shallow gravels, duplex sandy gravels, deep sandy gravels and loamy gravels.
Ground cover: Any matter that protects the soil surface from erosion. Ground cover is usually the same as vegetative cover (i.e. living plants) but can include dead plant matter, stones or gravel.
Groundwater drainage: Artificial drains (deep open and/or sub-surface drains) that are designed to intercept and remove excess groundwater and thereby lower water tables.
Groundwater management: A management system designed to lower water tables, usually with the aim of preventing the additional accumulation of salts while allowing rainfall to leach salt from the upper soil profile. Groundwater management systems can involve drains, bores with pumps or relief wells to extract the water.
Groundwater pumping: The extraction of water from aquifers with the aid of electric, wind powered or compressed air pumps. Groundwater pumping involves drilling bores down into aquifers. Usually a number of bores and pumps are required to have any effect on water tables in a particular area.
Groundwater: Water that is held below the ground surface that is a pressure greater than atmospheric pressure and will therefore flow freely into a bore or a well. This term is most commonly applied to permanent bodies of water found under the ground.
Groundwater flow: The movement of groundwater in soil, regolith and rocks that are fully saturated.
Growing season: The length of the period each year when plants are growing actively. In the South-west Hydrological Region the term usually refers to the growing season of annual plants, which extends from late autumn into spring. There is little growth over the summer when evaporation exceeds rainfall.
Gully: A small channel with steep sides cut by running water and through which water ordinarily runs only after rain. Gullies are more than 30 cm deep and can incise several metres into the soil. They often have branches and usually cannot be crossed by farm machinery.
Gully erosion: The removal of soil by large channels (gullies).
Gully wall dam: An on-farm water storage created by constructing an earthen wall across a natural drainage line in a small valley or drainage depression. Gully wall dams are not usually associated with erosion gullies.
Hardpan: A hard soil layer cemented with organic matter, silica, sesquioxides, gypsum or calcium carbonate or formed by physical compaction of the soil.
Hardsetting: Describes a soil which is compact, hard and apparently without structure when dry, but softens on wetting.
Headwaters: The upper part of a catchment, areas in which streams and rivers begin.
Appendix 2: Glossary
-272-
Heavy clay: A heavy clay has a higher proportion of the fine particles (>50% clay) than a light or medium clay. Heavy clays typically have low permeability, can be difficult to cultivate and set very hard when dry.
Heavy-textured soil: A soil profile with a high clay content (>30% clay) throughout or a clay horizon close to the surface. Examples include cracking clays, non-cracking clays, shallow loamy duplexes and shallow sandy duplexes.
High rainfall district: A loose term used to describe areas close to the coast that receive more rainfall than inland areas. Typically applied to the districts receiving more than 600 or 800 mm per year on average.
Hillside seep: The discharge of groundwater on a hill slope. This discharge is usually associated with local flow systems and often occurs where the groundwater flow is forced to the surface by a barrier.
Horizon: A term used to describe individual layers in a soil profile. Each horizon has morphological properties different from those above and below it.
Hydraulic conductivity: A measure of the potential rate of flow of a fluid through soil or rock. As such it takes into account the nature of the fluid, the degree of saturation and the permeability of the material the fluid passes through. The hydraulic conductivity of a material can be measured in either the saturated or unsaturated states. The unsaturated hydraulic conductivity will change as a material becomes wetter, but the saturated hydraulic conductivity of a material remains constant. Hydraulic conductivity is expressed in units of length per unit of time, typically millimetres per hour (mm/hour) or metres per day (m/day).
Hydraulic gradient: The slope of a water table or piezometric head. The hydraulic gradient provides a measure of the force of gravity driving the movement of water within aquifers and can be measured by comparing the water level in two or more piezometers that have been drilled into a groundwater system.
Hydraulic pressure: The pressure exerted on water in an aquifer due to the weight of water present in it or in a connected aquifer upslope. Hydraulic pressure determines the hydraulic gradient and drives groundwater flow systems. Hydraulic pressure is also referred to as “piezometric pressure”.
Hydrological cycle: The continuous circulation of water between the land, sea (or other water surface) and the atmosphere.
Hydrological zone: An area of land where the geology, landform, soil, climate and land use combine to form a unique set of hydrological characteristics.
Hydrology: The study of water and water movement in relation to the land. Deals with the properties, laws, geographical distribution and movement of water on the land or under the Earth’s surface.
Igneous rock: Rock formed as magma from the core of the Earth cools and becomes solid on or near the surface. Igneous rocks include volcanic rocks (e.g. basalt) which form when magma erupts on the surface, and plutonic rocks (e.g. dolerite and granite) which form under the ground.
Impermeable: Describes the nature of a solid material that will not allow fluids to pass freely. A material described as being impermeable will have a saturated hydraulic conductivity of less than 0.02 m/day.
Infiltration: The process whereby water enters the soil through its surface. The downward movement of water into the soil profile.
Infiltration capacity: The maximum rate at which water can soak into, or be absorbed by, a soil. It assumes that the rate of water application is not limiting infiltration, and it varies with the degree of saturation of the soil.
Infiltration excess runoff: Runoff (overland water flow) which occurs because the amount of water falling on (or being applied to) the ground surface exceeds the soil’s infiltration capacity.
Infiltration rate: The speed at which water soaks into, or is absorbed by, a soil. Expressed in units of depth and time (e.g. mm/hour).
In situ: In its original place or in the same place.
Interception: The process whereby rain adheres to the surfaces of leaves or branches of plants as water droplets or as a thin film and evaporates before it reaches the soil.

Appendix 2: Glossary
-273-
Interception loss: The amount of water intercepted by plants and returned to the atmosphere by evaporation during a particular rainfall event.
Interceptor drains: See seepage interceptor drains.
Intermediate discharge: Discharge emanating from an intermediate flow system.
Intermediate flow system: A flow system transporting groundwater for distances of 5-10 km. Intermediate flow systems are typically found in areas of low relief with long slopes and broad valley floors, and may cross surface catchment boundaries.
Inundation: Describes the situation where water lies stationary above the soil surface. Sometimes referred to as surface ponding. Inundation is commonly confused with waterlogging because both processes often occur at the same time. In certain situations, soils can become inundated without being waterlogged, with the soil surface sealing and water lying on the ground but not infiltrating.
Ironstone: A material indurated with iron-oxides so that it appears like a rock. It can occur as sheets of duricrust or ferruginous nodules or concretions (ironstone gravel). Ironstone typically has a reddish or orange colour and is typically associated with the lateritic profile.
Irrigation: The process of supplying land with water by artificial means in order to promote plant growth.
Irrigation salinity: The salinisation of land that is irrigated.
Landform: Any physical, recognisable form or feature on the Earth's surface, having a characteristic shape and range in composition, and produced by natural causes. Landforms provide an empirical description of similar portions of the Earth's surface and can range in size from several metres across up to 100 km long.
Landscape: A collection of related, natural landforms; usually the land surface which the eye can comprehend in a single view.
Landslide: A form of mass movement in which regolith moves downslope, sliding over the underlying material. Types of landslides include landslips and slumps.
Landslip: A form of landslide in which the soil and underlying weathered material slides downslope along a plane of weakness.
Lateral groundwater flow: Movement of groundwater in a non-vertical direction (i.e. sideways instead of straight up or down). Lateral groundwater flows are usually more or less parallel to the ground surface, though this is not always the case.
Laterite: Deeply weathered material, thought to be formed in past tropical environments under climatic extremes of wet and dry seasons throughout the year. Leaching of the profile removes sodium, potassium, calcium and magnesium ions. Iron oxides remain to form a hardened and cemented layer.
Lateritic plateau: A relatively flat upland landscape formed on the lateritic profile.
Lateritic profile: A deeply weathered profile of soil and regolith that typically consists of sand or gravel on top of a ferruginous duricrust where the iron oxides have accumulated. This overlies the mottled zone (pale clay with mottles) and then a pallid zone (white clay) from which the leaching has occurred.
Leach: To wash material from the soil, both in solution and suspension. The process by which nutrients, chemicals or contaminants are dissolved and carried away by water, or are moved into a lower layer of soil.
Levee bank: An embankment (a long, narrow mound of earth) constructed by a grader or bulldozer along a waterway to contain or exclude flood waters.
Leveed waterways: A narrow sloping area with levee banks installed on either side. Leveed waterways are designed to confine and dispose of water flows.
Level banks: Embankments built on upper slopes and designed to control surface flows where there is no safe way of disposing the water. Level banks are surveyed and constructed on the contour with a bulldozer. They consist of a bank and an uphill channel. One or both ends of level banks are left open to allow overflow during heavy runoff and this differentiates them from absorption banks. See Section 9.3.3 for further details.

Appendix 2: Glossary
-274-
Limestone: A chemical sedimentary rock consisting chiefly (more than 50%) of calcium carbonate, primarily in the form of calcite. Limestone is usually formed by a combination of organic and inorganic processes and includes chemical precipitates as well as shell and rock fragment.
Lineament (geology): A geological term for a linear feature, such as a fault or fold, which expresses itself on the Earth’s surface. For example, the Darling Scarp is a topographical expression of the Darling Fault, which is a very large lineament.
Loam: A medium textured soil material containing a mix of clay, silt and sand particles (approximately 10-25% clay, 25-50% silt and <50% sand).
Local flow system: A flow system transporting groundwater in which discharge and recharge occur within a couple of kilometres of each other. Flows may be permanent or temporary and the water is typically transported down a hill slope through unconfined aquifers that are relatively thin (<20 m) and close to the surface.
Low rainfall district: A loose term used to describe inland areas that receive less rainfall than areas closer to the coast. Typically applied to districts receiving less than 400-500 mm/year on average.
Lower recharge farming system: A farming system which minimises groundwater recharge, typically through a combination of strategies. These can include incorporating trees, fodder shrubs, perennial grasses and higher water use crops into the farming system as well as effective management of surface drainage. Lower recharge farming systems need to replace current agronomic practices with an alternative, economically viable system that reduces deep percolation of water beyond the root zone.
Macropore: A large pore (such as an old root channel or animal burrow) which provides a pathway for water movement through a soil profile or regolith.
Marginal (water): A term used to describe water that has low salinity levels (500-1,070 mg/L) – these levels may limit its suitability for some uses.
Mass movement: A form of erosion where gravity rather than water or wind is the primary agent of soil movement. Includes landslips, landslides and avalanches.
Matric suction: A pressure that can move water upwards, downwards or sideways through the soil and is independent of gravity. Matric suction moves water from areas of high potential energy to areas of low potential and is driven by capillary forces (surface tension between water and air in the soil) and adsorption forces (which hold a thin film of water onto soil particles).
Measure (geology): A sequence of sedimentary rocks occurring together.
Metagranite: Granite that has been partly metamorphosed by heat and pressure but in which the original texture is still recognisable.
Metamorphic rock: Rock of any origin altered in mineralogical composition, chemical composition or structure by heat, pressure, or movement at depth in the Earth's crust. Examples of metamorphic rocks include schist, gneiss, quartzite, slate and marble. Most have parallel bands of minerals evident.
Mica: A group of layered minerals composed mainly of silica but also including aluminium. The individual flakes are flexible, elastic and often have a shiny, plate like appearance. A common constituent of weathered igneous rocks.
Mineralisation: The change of an element from an organic form to an inorganic form by micro-organisms.
Miocene: The epoch of the Tertiary Period of geological time occurring approximately 5-23 million years ago.
Mole drain: A tubular hole (50-100 mm diameter) created by pulling a metal foot and trailing expander through the soil. The foot and expander create a cavity that may conduct water rapidly to a nearby drain.
Mottle (soil): Patches or spots of different colours in a soil material. Mottles develop due to oxidation-reduction reactions associated with waterlogging.
Mottled zone: A horizon of the lateritic profile consisting of a pale coloured clay with prominent red and orange mottles.
Mounding: The construction of a low pile of earthy material that is raised above a waterlogged area, usually to provide a growing medium for plants.

Appendix 2: Glossary
-275-
Neutral (soil): Describes the situation where a soil is neither acidic nor alkaline (pH value 6.5-7.5).
Nitrate: A form of nitrogen (NO3-) capable of being dissolved and held in solution. Because it is
soluble, nitrate is highly mobile and available for uptake by plants. Its mobility also means that it can be leached down the profile easily.
Nitrogen: A nutrient essential for plant growth. It can also play a major role in eutrophication.
Nitrogen level: See nutrient level.
Nitrogen load: See nutrient load.
Non-wetting (soil): Describes a soil material that is water repellent. Non-wetting soils typically have a sandy topsoil with organic compounds that form a wax like coating on the sand grains. Early in the season, infiltration into non-wetting soils will be very patchy, with many areas of topsoil remaining dry. As the season progresses the non-wetting character of the topsoil is usually overcome slowly.
No-till system: A system of sowing crops that involves direct seeding using a narrow point or disc. The soil is only cultivated in the sown row, leaving the inter-row areas relatively undisturbed.
Nutrient: A mineral substance absorbed by the roots of a plant to provide that plant with nourishment.
Nutrient cycle: The movement of nutrients from the air or soil, to soil-water, into plants and eventually returning to the soil. The cycle typically involves nutrients transforming from one form to another and back again.
Nutrient deficiencies: The lack of an adequate amount of a plant nutrient. This may result in a number of symptoms, including poor plant growth, yellowing or death.
Nutrient input: Describes the process whereby nutrients are added to a soil, water body or ecosystem.
Nutrient level: A measure of the total amount of nutrients present in soils, plants or water at any given time. Typically expressed in terms of mass of nutrients present per given volume such as parts per million (ppm) or milligrams per litre (mg/L).
Nutrient load: A measure of the amount of nutrient transported by a river or stream. Typically expressed in terms of mass of nutrients over a given time period (e.g. tonnes per year).
Nutrient loss: The removal of nutrients (e.g. from applied fertilisers) from an ecological or agricultural system. Nutrient loss from agricultural systems occurs via the hydrological cycle (transported by water in solution or attached to sediments) or the by removal of farm produce (e.g. sending milk, meat or grain to markets).
Nutrient retention ability: The ability of the soil to adsorb and retain added nutrients. The nutrients may be held in a form that is inaccessible to plants.
Organic matter: Material that includes the residual products of living organisms (remnants of plant and animal tissue, often decomposed). Organic matter can be an important component of topsoil, improving fertility, soil structure and water retention.
Orogen: A zone of weakness in the Earth's crust along which movement and deformation has taken place during a period of tectonic plate movement. The rocks of an orogen may include deformed and reworked parts of older cratons as well as new volcanic and sedimentary rocks.
Outcrop (geology): Part of a geological formation or structure that appears as rocks on the ground surface.
Palaeochannel: The floor of an ancient drainage system containing old sedimentary deposits. Palaeochannels are often partly obscured or eroded by contemporary drainage systems and may cross existing drainage divides.
Pallid zone: Pale coloured white to pink kaolinitic clay (a stable with aluminosilicate minerals) clayforming a lower horizon of the lateritic profile. The horizon is pale in colour because the iron has been removed.
Passive discharge: Describes the situation where groundwater rises to the surface indirectly through capillary rise. Passive discharge is due to matric suction, which is maintained by evapotranspiration from the soil surface.
Peak flow: Describes the greatest volume of water that flows past a given point at any time. Can apply to flows in a river, stream or drain as well as to flood events and runoff.

Appendix 2: Glossary
-276-
Peds: Natural soil aggregates consisting of soil particles held together by cohesive forces or secondary materials such as iron oxides, silica or organic matter.
Perched aquifer: A sub-surface material containing perched groundwater.
Perched groundwater: Groundwater in an unconfined aquifer (in a saturated condition) near the land surface and separated from deeper groundwater by unsaturated materials. Perched groundwater is typically shallow, thin and ephemeral (i.e. temporary or seasonal) and sits on top of materials of low permeability, such as clay and hardpans, which restrict the downwards flow of water.
Perched water table: The upper surface of perched groundwater.
Percolation: The downward movement of water through soil and regolith.
Perennial (plant): A plant whose life cycle continues for more than one season. Includes trees and shrubs and many species of grasses.
Perennial pasture: A pasture composed primarily of perennial plants.
Perennial stream. A stream or part of a stream that flows continuously throughout the year, the surface of which is generally lower than the adjacent water table.
Permeability: The capacity of a material to transmit a fluid such as water. Permeability is a characteristic of the soil or rock only, and is not a measure of the rate at which water passes through the material (i.e. it is different from hydraulic conductivity). A material that is highly permeable will have few restrictions to the passage of water. A material with low permeability will provide major restrictions to the movement of water.
Permeable: The degree to which a solid material will allow fluids to pass. • A highly permeable material has a saturated hydraulic conductivity in excess of 2.5 m/day. • A moderately permeable material has a saturated hydraulic conductivity of about 0.5-2.5 m/day. • A material of low permeability has a saturated hydraulic conductivity of less than 0.02 m/day.
pH: A measure of how acidic or alkaline a solution or soil is. The pH scale, ranges from 0 to 14, with 0-6 being acidic, 7 neutral and 8-14 alkaline. In technical terms pH is the negative logarithm of the hydrogen ion concentration of a solution.
Phosphate: A form of phosphorus (PO4-3) capable of being dissolved and held in solution. Because
it is soluble, phosphate is highly mobile and available for uptake by plants. Its mobility also means that it can be leached down the profile easily.
Phosphorus: A nutrient essential for plant growth. It can also play a major role in eutrophication.
Phosphorus load: See nutrient load.
Phosphorus retention index: A measure of the ability of a soil to adsorb and hold phosphorus, commonly abbreviated to PRI.
Phosphorus status: Refers to the amount of phosphorus present in a soil at any given time. See nutrient level.
Piezometer: Tubing (typically a PVC pipe) sunk into the ground to pass into a confined aquifer, usually to depths of 2-10 m. The lower 1-2 m of the pipe is slotted to allow water to enter the pipe. The level of this water reflects the piezometric head of the aquifer at that depth. Piezometers are installed to monitor the level of water tables as well as salinity levels.
Piezometric head: The level to which the water rises in bores drilled into an aquifer. If recharge occurs high in the landscape, the piezometric head low in the landscape is likely to be above the top of the aquifer. It will also often be above the water table of overlying aquifers, or even the ground surface.
Plain: A general term referring to any flat area of land.
Plateau: A comparatively flat, upland area bounded by slopes to lower ground. The plural form of plateau is plateaux.
Plateau remnants: Relatively small areas of upland flats surrounded by valleys. Plateau remnants were once part of a broad plateau that has since been dissected extensively by water erosion.
Pliocene: The last epoch of the Tertiary Period of geological time occurring approximately 2-5 million years ago.
Appendix 2: Glossary
-277-
Point source: Describes the discrete area or particular point from which nutrients that contribute to eutrophication are discharged. Examples of point sources include effluent disposal sites, dairies, piggeries and factories.
Ponding: A form of inundation whereby water collects on the soil surface in puddles.
Pore: A space in a soil material not filled by solid particles. Pores are holes filled with air or water.
Precipitation: Water falling to earth due to the force of gravity. Includes rain, hail, sleet or snow.
Preferred pathway: A channel or pore in a soil layer, which otherwise has low permeability, through which water flows preferentially. Old tree root channels are preferred pathways in many clayey subsoils in the South-west Hydrological Region.
PRI: See phosphorus retention index.
Primary salinity: Describes the situation where soils are inherently saline as a result of natural processes. As a general rule, areas affected by primary salinity do not get developed for agriculture.
Profile: See soil profile.
Quartz: Mineral composed of silicon dioxide (SiO2).
Quartz vein: A tabular or sheet-like body of quartz that has been intruded into a joint or fissure in the surrounding rocks. On the surface, quartz veins appear as discontinuous lines of white rock (quartz) outcrops.
Quartzite: A metamorphic rock consisting of interlocking quartz crystals.
Quaternary: The period of geological time extending from the end of the Tertiary Period (about 2 million years ago) to the present.
Rainfall intensity: The amount of rain falling in a given time interval. Rainfall intensity is usually expressed in millimetres per hour (mm/hour).
Recharge: The water that moves into a groundwater body and therefore replenishes or increases sub-surface storage. Recharge typically enters aquifers by rainfall infiltrating the soil surface and then percolating through the zone of aeration (unsaturated soil). Recharge can also come via irrigation, the leakage of surface water storage or leakage from other aquifers. The term recharge is also used to describe the process of water entering a groundwater body.
Recharge area: An area of land from which a significant amount of recharge occurs.
Recharge rate: The speed at which water moves into a groundwater body. Expressed in units of depth per time (e.g. mm/year).
Regional aquifer: A material containing groundwater that is part of a regional flow system.
Regional discharge: Discharge emanating from a regional flow system.
Regional flooding: A form of flooding that affects large areas rather than just a small localised area. Usually initiated when major rivers break their streambanks.
Regional flow system: Groundwater flows that transport permanent groundwater long distances, up to 50 km or more, typically through confined or semi-confined aquifers in sedimentary deposits that can be several hundred metres thick.
Regional water table: The upper surface of groundwater in a regional aquifer.
Regolith: All the unconsolidated earth materials occurring above solid bedrock. Regolith includes soil, unconsolidated sediments and weathered bedrock. Soil scientists regard as “soil” as being only that part of the regolith that is modified by organisms and soil-forming processes. Most engineers describe the whole regolith, even to a great depth, as “soil.”
Relief well: An artesian well used to remove excess groundwater from a lower (often semi-confined) aquifer. A bore hole is drilled, through which groundwater is discharged under hydraulic pressure. A pipe is connected to the bore to discharge the water into a waterway.
Retention basin: A basin (either natural or constructed) used to hold runoff or stream flow and thus reduce peak flows and the risk of flooding. Some of the water may be stored permanently in the basin, while the remainder is released at a controlled rate.
Revegetation: The process of returning perennial plants to land that was cleared. Land can be revegetated with native or introduced species.

Appendix 2: Glossary
-278-
Reverse seepage interceptor drains: An type interceptor drain in which the spoil is placed upslope and acts as a grade bank intercepting runoff, while seepage enters the channel. This reduces the risk of channel silting and decreases the volume and depth of channel flows. See Section 7.3.3 for further details.
Rill erosion: The removal of soil by runoff from the land surface in numerous small channels (rills), usually down to the base of the cultivation layer. The rills are commonly 5-10 cm deep, but can be up to 30 cm deep. Rills typically form on recently cultivated land, disturbed soils and on overgrazed paddocks during summer storms.
Roaded catchment: An artificial catchment area for a dam or earthen tank constructed by compacting the soil in a similar manner to that used to form the surface of an earth road. Roaded catchment consist of many parallel ridges with smooth and impervious surfaces that minimise infiltration and maximise runoff. Roaded catchments are commonly used in areas receiving less than 420 mm rainfall.
Rolling (landscape): Describes landscapes with slope gradients of about 10-30%.
Root zone: The portion of the soil profile where the majority of plant roots are found, typically within the top 30-50 cm.
Rooting depth: The depth to which plant roots can penetrate the soil without being restricted by a physical or chemical barrier.
Runoff: Water flowing downslope over the ground surface, also known as overland flow. Precipitation that does not infiltrate into the soil and is not stored in depressions becomes runoff.
Saline (soil): A soil containing sufficient soluble salts to reduce productivity.
Saline (water): A term used to describe that has high salinity levels (in excess of 5,000 mg/L) - these levels limit its suitability for many uses.
Saline seep: An area where saline groundwater is discharged.
Salinisation: The process of accumulation of soluble salts in soil.
Salinity: An accumulation of soluble salts in the soil root zone, at levels where plant growth or land use is affected adversely. Also used to indicate the amounts of various types of salt present in soil or water.
Salinity level: The measured amount of salt contained in soil or water.
Salt store: Refers to the total amount of salt present within the regolith (both saturated and unsaturated) under a certain area of land. Usually expressed in terms of tonnes per hectare.
Salt tolerant: A term used to describe plants and animals that are capable of living in saline soil or water.
Sand: (a) Coarse soil particles that range in diameter from 0.05-2.0 mm; (b) Soil texture class dominated by sand sized particles (>75%) and containing few clay sized particles (<15%); (c) Soil profile with a sandy texture in the top 3 cm.
Sandplain: Extensive level to gently undulating landform with sandy soils, little topographic relief and few stream channels.
Sandplain seep: Seepage that occurs where groundwater is discharged from the base of sandy or gravelly deposits that are upslope.
Sandstone: Sedimentary rock containing predominantly sand-sized grains cemented together.
Saprock: Partially weathered bedrock that remains in situ and typically consists of a gritty material retaining the fabric (structure and orientation) of the underlying rock. Saprock is often called saprolite, which literally means “rotten rock”.
Saturated: The condition whereby effectively all of the pores and voids in a soil or aquifer are filled with water which has a pressure equal to, or greater than, atmospheric pressure.
Saturated hydraulic conductivity: see hydraulic conductivity.
Saturation excess runoff: Occurs when water that falls on (or is being applied to) the ground surface becomes runoff (overland water flow) because the soil is already saturated and cannot accept any more water.
Appendix 2: Glossary
-279-
Scarp: An escarpment, cliff or steep slope falling away from the margin of a plateau or other raised landform.
Schist: A metamorphic rock characterised by a parallel arrangement of the constituent minerals. Schist often appears shiny and flaky.
Secondary salinity: Describes the situation where salinity levels have increased as a result of human activities changing the water balance. Secondary salinity often occurs as a result of agricultural development and can be responsible for preventing large areas of agricultural land from being productive.
Sediment: An accumulation of soil and rock particles, chemical precipitates, and organic remains deposited by water or wind.
Sedimentary deposits: Materials that have been moved from their site of origin by the action of wind, water, gravity or ice and then deposited. When these materials become consolidated and hard they are known as sedimentary rocks.
Sedimentary rock: A rock consisting of consolidated sediments, including sandstone, siltstone, shale, conglomerate, limestone, dolomite and evaporites.
Sedimentation: The deposition of sediment, usually by water. Sedimentation is the result of water erosion and involves soil particles being washed downslope or downstream before being deposited.
Seep: See seepage.
Seepage: Occurs where the water table intersects the ground surface and water flows out. This is active discharge and is driven by the hydraulic gradient.
Seepage interceptor drains: Sub-surface drains constructed in duplex soils on hillslopes to drain waterlogged areas as well as to intercept water moving towards waterlogged areas. A channel is dug through the topsoil into the clayey subsoil and collects water seeping through the highly permeable topsoil. In conventional seepage interceptor drains the spoil (earth removed from the channel) is mounded on the downslope side of the channel where both runoff and seepage are collected. In reverse seepage interceptor drains the spoil is placed upslope and acts as a grade bank intercepting runoff, while seepage enters the channel.
Semi-confined aquifer: An aquifer (geological formation containing water) overlain by a layer that partly restricts the upward movement of water.
Shear zone: A tabular geological zone (i.e. zone having two dimensions much greater than the third like a upturned table top) where rocks have been deformed due to shear stress (i.e. stress causing fracturing and compression along parallel planes).
Sheet erosion: The removal of a fairly uniform layer of soil by raindrop splash and/or runoff. No perceptible channels are formed and soil particles are either transported to rills, gullies and streams or moved downslope to temporary stores. Soil stored on the slope is liable to be displaced by subsequent erosion. Sheet erosion is often found in combination with rill erosion.
Shield: Rigid mass of ancient rocks usually forming the core of a continental land mass (see craton).
Silt: Medium sized soil particles that range in diameter from 0.002-0.05 mm.
Siltstone: A sedimentary rock composed of mostly silt sized particles.
Sluggish (drainage): A term used to describe the drainage on flat landscapes where low gradients and poorly defined drainage lines result in very slow rates of surface water flow, typically resulting in extensive waterlogging and inundation.
Slump: A form of landslide in which the soil and underlying weathered material rotate against a horizontal axis.
Soak: A water supply structure constructed by excavation in an area receiving seepage or where the water table is close to the surface. Soaks are most common on the Coastal Plains and on poorly drained flats and valley floors in the Forested Hills. In some soaks the spoil is used to construct a dam wall to capture runoff in addition to the seepage.
Sodic (soil): A soil in which the subsoil has a high exchangeable sodium percentage (ESP >6 in sodic soils, >15 in highly sodic soils). Sodic soils can be structurally unstable and plant growth may be adversely affected. Clays in sodic soils disperse when exposed to water and are highly erodible. Low permeability is often a feature of sodic soils.

Appendix 2: Glossary
-280-
Soil: A natural medium for the growth of land plants. Soil consists of a mixture of unconsolidated mineral and organic material developed by physical, chemical and biological processes.
Soil amendment: See amendment.
Soil compaction: The process of increasing soil density caused by the soil particles becoming more closely packed resulting in air being removed. Soil compaction is often caused by the pressure exerted by the weight of machinery or livestock trampling. Topsoil compaction leads to reduced infiltration while subsoil compaction slows water percolation through the profile.
Soil creep: A form of mass movement which involves the slow movement of surface soil down a slope.
Soil profile: A vertical cross-section of soil, and/or regolith, extending downwards from the Earth’s surface. The profile consists of all the soil horizons and regolith layers sitting on top of each other.
Soil structure: The size, shape, type and degree of development of natural aggregates (called peds or clods) found in soil. Well structured soils peds are well developed and this provides good soil/water/air relationships for the growth of plants. In well structured soils, there are few physical barriers to the movement of water or the growth of roots. Well structured soils are usually more stable and less prone to erosion than poorly structured soils.
Soil structure decline: The process whereby a soil becomes less well structured, usually by human activities such as cultivation. As the natural aggregates found in soil break down, soil drainage and plant root growth can be retarded.
Soil water: Commonly applied to sub-surface water occurring in the soil and regolith in an unsaturated condition (i.e. above the water table). This water is also sometimes referred to as soil water storage, soil moisture or sub-surface water.
Spinner drain: Shallow drains constructed to efficiently move surface water from paddocks into spoon or W-drains. Spinner drains consist of small rills that are 5-10 cm deep and 2-3 m apart and are constructed with rotating steel blades.
Spoon drain: A form of surface drain that is 3-4 metres wide, approximately 30 cm deep and can be constructed with a grader. The spoil is spread on either side of the channel. Spoon drains are suitable for removing excess water from land that is cropped.
Spoil:. Soil, sediment, rock or other waste material produced as a result of excavation.

Appendix 2: Glossary
-281-
Spreader banks: Banks designed to check erosive runoff by reducing its velocity and spreading channelised flow into a thin sheet flow across the slope, thereby maximising infiltration and reducing the formation of rills. They are constructed on the contour by a bulldozer or grader working upslope. See Section 9.3.3 for further details.
Storage capacity: The total amount of water that a soil, aquifer, dam or other form of water storage can hold.
Stream flow: The transportation of water across the ground surface concentrated into streams, creeks, rivers and drains.
Stream salinity: Refers to the situation where there is a concentration of dissolved salts in a watercourse (e.g. stream or river). Although most current examples of stream salinity are directly associated with secondary salinity in the catchment area, there were streams that were saline before clearing began.
Streambank erosion: The removal of soil from streambanks by the direct action of stream flow.
Stripped: Refers to the state of a soil profile or landscape when a significant amount of surface material has been removed by erosion. With landscapes, the stripping has often taken place over millions of years.
Structure (soil): See soil structure.
Subsidence: A form of mass movement that occurs where ground overlying a sub-surface cavity, such as a cave or mine, collapses. It may also occur if an underlying aquifer is over-pumped.
Subsoil: The lower part of the soil profile. The lower layer/s are usually higher in clay and lower in organic matter than the upper layers (or topsoil). The subsoil is usually referred to as the B horizon/s and most typically begins at depths of 30-60 cm.
Sub-surface drainage: Systems that are designed to intercept and remove water from the subsoil (e.g. mole or tile drains).
Sub-surface flow: The movement of water in saturated conditions below the ground surface. This term is typically used to describe temporary, lateral groundwater flows in the topsoil or subsoil and often involves perched groundwater.
Sub-surface storage: Water stored below the ground surface, either as groundwater in aquifers, in the capillary fringe or as unsaturated soil water.
Sub-surface water: All water occurring below the ground surface.
Sub-surface waterlogging: A term used to describe the condition whereby the topsoil of a profile is drained freely but the subsoil is saturated.
Surface crust: A thin surface layer of a soil profile that is harder than the underlying horizons. Surface crusts often retard infiltration.
Surface drainage: Systems that are designed to intercept and remove excess surface water. Surface drainage works include spoon drains and W-drains.
Surface flow: A term used to describe the movement of water across the ground surface as runoff or stream flow.
Surface sealing: Describes the situation where a crust or seal forms on the soil surface, preventing the infiltration of water.
Surface storage: A term used to describe the water that remains on the ground surface either as surface moisture or accumulated in depressions such as puddles, swamps or lakes.
Surficial: On or near the surface.
Surficial aquifer: An unconfined aquifer in a surface deposit. Water in a surficial aquifer is referred to as surficial groundwater and the water table is situated close to (or is sometimes on or above) the ground surface. Surficial aquifers typically contain perched groundwater.
Surficial deposit: Materials lying more or less loosely on the land surface, formed independently of the soil or rocks below and usually transported and deposited there by natural agencies such as wind or water. Often the exposed, upper layer of an unburied sedimentary deposit.

Appendix 2: Glossary
-282-
Suspension: Describes the situation where soil (or other solid) particles are held in water without being dissolved. Soil held in suspension can be transported long distances by water. Muddy water typically contains a large amount of soil in suspension.
Temporary perched groundwater: Perched groundwater that is seasonal or ephemeral. A typical example is the perched groundwater found during winter in the sandy topsoil of many duplex soils. Perched groundwater may only be present for a few hours or days following rain.
Terrane: A geological term referring to an area comprised of a group of rocks of similar origin or nature.
Tertiary: The period of geological time approximately 2-66 million years ago.
Texture (soil): A description of soil material based on field assessment that describes the relative abundance of sand, silt and clay particles. Soils with a light texture have a high proportion of coarse (sand) particles. Soils with a heavy texture have a high proportion of fine (clay) particles.
Throughflow: The lateral movement of sub-surface water in the soil. Throughflow usually involves the downslope movement of perched groundwater; the water flows through a moderately to highly permeable soil material above an impeding layer and usually follows the slope of the ground surface. Throughflow can also occur in unsaturated conditions.
Topography: The relative positions and elevations of the natural or man-made features of an area that describe the shape of its surface.
Topsoil: The upper part of the soil profile. These surface layer/s are usually higher in organic matter (at least at the surface) and lower in clay than the lower layers (or subsoil). The topsoil is usually referred to as the A horizon/s and is most typically 15-60 cm deep.
Transmissivity: The rate at which water is transmitted through a one metre wide slice across the entire depth of an aquifer. Transmissivity is recorded in units of square metres per day (m2/day). It provides a better comparison of the possible yield of an aquifers than saturated hydraulic conductivity because it takes into account the thickness of the aquifer.
Transpiration: The process by which water is absorbed from the soil by plant roots, is transported through the plant and is removed from the leaf surfaces by evaporation.
Tributary: A stream or river that flows into a larger stream or river.
Truncated (laterite): A lateritic profile from which the upper layers have been removed by erosion. Soils found on truncated lateritic profiles have often formed from mottled or pallid zone materials.
Tube drain: A form of sub-surface drainage, consisting of a permeable or perforated pipe installed in the subsoil. Tube drains are also referred to as “tile drains” or “slotted pipe drains”. See Section 6.3.3 for further details.
Tunnel erosion: The sub-surface removal of soil by water while the topsoil remains intact (until the tunnel collapses and a gully is formed).
Unconfined aquifer: An aquifer (geological formation containing water) over which there is no aquitard (layer that restricts the upward movement of water). This means there is no barrier to movement of water between the ground surface and the aquifer. The water table may rise or fall freely as water enters and leaves the aquifer.
Unconsolidated: Describes sediments and deposits that are loose and not hardened.
Undulating (landscape): Describes landscapes with slopes of about 3-10%.
Unsaturated: The condition whereby the pores and voids of a soil or aquifer are filled with a mixture of water and air. The pressure of the water is less than atmospheric pressure.
Unsaturated flow: The movement of water in the soil at water contents less than saturation.
Upland: A general term for the higher part of the landscape.
Valley: An elongated, relatively large, externally drained depression of the Earth's surface that is primarily developed by stream erosion.
Valley floor: A general term for the nearly level, lower part of a valley.
Vapour pressure deficit: The evaporative demand of the atmosphere. Water vapour will move from areas of high concentration (or low deficit), such as inside the leaves of plants, to those of low concentration (or high deficit), such as air of low humidity.

Appendix 2: Glossary
-283-
Vegetative cover: Plants that cover the ground surface. Includes grasses, herbs, trees, shrubs and crops. Vegetative cover usually protects the soil from erosion and increases evapotranspiration rates.
Velocity: The speed of movement of water flowing past a point in a specific direction. A high velocity flow involves fast moving water.
Water balance: The relationship between input, storage and output within a hydrological system. If the amount of water entering the system is the same as the amount leaving, then storage remains constant and the system can be considered to be in equilibrium. Where input exceeds output, the water balance becomes altered and the amount of water stored in the system increases. Conversely, the balance can be altered as storage decreases in response to output exceeding input.
Water erosion: The detachment and transport of soil particles by water leading to the wearing away of the land surface.
Water harvesting: The capture, diversion and storage of fresh water from surface or sub-surface flows. Water harvesting often involves the construction of dams, banks, drains and/or roaded catchments.
Water storage: A broad term referring to any situation where water is temporarily or permanently held, including in aquifers, soil water, lakes, farm dams and reservoirs.
Water supply shortages: The situation where there is an insufficient volume of water held in storage to meet the requirements of domestic use, livestock consumption or the irrigation of crops or pastures.
Water table: The upper surface of a body of groundwater occurring in an unconfined aquifer. At the water table, pore water pressure equals the atmospheric pressure.
Water use (plant): Describes the uptake of water from the soil by a plant. Most of this water is then transpired into the atmosphere.
Waterlogging: The condition whereby soil becomes saturated with excess water to the extent that most or all of the soil air is replaced.
Waterway: Usually describes a natural or constructed drainage line used for water disposal. Waterways run up and down a slope (not on a surveyed gradient). Artificial waterways are installed to safely transport excess water from grade banks, grade furrows and interceptor drains. They should be designed so that they can handle peaks flows, the channel should have a broad, flat or slightly dished floor. The term waterway is also applied broadly to all the surface water bodies (including creeks, rivers, lakes and estuaries) that are connected by stream flow.
W-drain: A form of surface drain in which the spoil is mounded in between two channels so that there is nothing impeding water flow from the surrounding flats. W-drains are approximately 3 m wide and 30 cm deep and can be built with a grader or bulldozer. See Section 7.3.3 for further details.
Weathered: Describes the state of a material (e.g. rock, bedrock, sediment or colluvium) once it has been subjected to physical disintegration, chemical decomposition or biologically induced changes at or near the Earth's surface. The process of weathering involves essentially no transport of the altered material.
Weathered profile: See deeply weathered profile.
Weathering: The process leading to the formation of a weathered material.
Weathering in situ: Describing the genesis of regolith that has formed directly as a result of weathering of the underlying bedrock without any major movement of the materials.
Western Woolbelt: The hydrological zone that lies inland from the main areas of State Forest and stretches from Bannister through Boddington, Darkan and Boyup Brook to Frankland and Rocky Gully. The Western Woolbelt is characterised by moderate rainfall, undulating to rolling topography and variable geology.
Wheatbelt: The hydrological zone that encompasses the upper Blackwood Catchment east of Katanning and Wagin. Towns include Harrismith, Kukerin, Dumbleyung and Nyabing. The Wheatbelt is characterised by low rainfall, subdued landscape and a relatively deep weathering profile.
Wind erosion. A process in which the soil is detached and transported from the land surface by the action of the wind.

Appendix 2: Glossary
-284-
WISALTS bank: An interceptor bank constructed on the contour (or on a very low gradient) with an upslope channel dug deep into the clayey subsoil. The spoil is formed into a high bank downslope and lined with clay on the channel side. Both runoff and sub-surface flow into the channel where they are stored.
Woolbelts: A combination of the Eastern Woolbelt and Western Woolbelt hydrological zones.
Zone of aeration: An area below the ground surface which is above the zone of saturation. This zone is characterised by unsaturated conditions, but saturation may occur temporarily in some areas (e.g. saturation following heavy rainfall as water moves down towards the water table). The zone of aeration is also known as the vadose zone or the unsaturated zone.
Zone of saturation: An area below the ground surface which is permanently saturated. This zone is usually relatively deep below the surface and is thick, containing large volumes of water. The zone of saturation lies below the water table in unconfined aquifers, and below the aquitard in confined aquifers.

Appendix 3: Abbreviations and symbols
-285-
APPENDIX 3: COMMONLY USED ABBREVIATIONS AND SYMBOLS
cm: Centimetres - a measure of distance or depth (10 mm).
cm/year: Centimetres per year - – used here as a measure of the rate of water table falls or rises.
EC1:5: 1:5 suspension electrical conductivity - a surrogate measure of salinity in soil.
ECa: Apparent soil electrical conductivity (measured with an electromagnetic induction meter) - a surrogate measure of salinity in soil.
ECe: Saturation extract electrical conductivity - a surrogate measure of salinity in soil.
EM38: A portable instrument designed to take field measurements of soil salinity in situ. It has the ability to sample and resample soils non-destructively.
ha: Hectares - a measure of area (10,000 m2)
kg/ha: Kilograms per hectare – used here as a measure of crop or pasture productivity, or the amount of fertiliser applied to a crop or pasture.
kg/ha/year: Kilograms per hectare per year – used here as a measure of the rate of slat deposition (by rainfall), fertiliser application or nutrient export.
km: Kilometres - a measure of distance (1000 m).
km2: Square kilometres - a measure of area (10 ha).
m: Metres - a measure of distance or depth (100 cm).
m/year: Metres per year – used here as a measure of the rate of water table falls or rises.
m2/day: Square metres per day – used here as a measure of the rate at which water is transmitted through aquifer(transmissivity).
m3/ha/year: Cubic metres per hectare per year – used here as a measure of the volume of water used or consumed.
m3/year: Cubic metres per year – used here as a measure of the volume of water flowing past a given point.
mg/L: Milligrams per litre – used here as a measure of the amount of salt in water.
mg/L/year: Milligrams per litre per year – used here as a measure of the rate of increase in water salinity levels.
ml: Millilitres - a measure of volume.
mm: Millimetres - a measure of distance or depth.
mm/hour: Millimetres per hour– used here as a measure of the rate of movement of water.
mm/year: Millimetres per year – used here as a measure of the amount (equivalent depth) of water accumulated (e.g. rainfall or recharge ) or lost (e.g evaporation or runoff).
mS/m: MilliSiemens per metre - a measure of the ability of a medium to conduct electricity, often as a surrogate measure of salinity levels in water or soil. OC: Degrees Celsius - a measure of temperature.
PRI: The phosphorus retention index - a measure of the ability of a soil to adsorb and hold phosphorus.
t/ha: Tonnes per hectare – used here as a measure of the amount of salt stored in the soil.
t/ha/year: Tonnes per hectare – used here as a measure of the amount of soil lost.
t/year: Tonnes per year – used here as a measure of the amount of salt or nutrient carried in a waterway .
WISALTS: Whittington Salt Affected Land Treatment Society