south plainfield board of education comprehensive …
TRANSCRIPT
SOUTH PLAINFIELD BOARD OF EDUCATION
COMPREHENSIVE ANNUAL FINANCIAL REPORT
FOR THE FISCAL YEAR ENDED JUNE 30, 2015
South Plainfield, New Jersey

COMPREHENSIVE ANNUAL
FINANCIAL REPORT
ofthe
South Plainfield Board of Education
South Plainfield, New Jersey
For The Fiscal Year Ended June 30,2015
Prepared by
Finance Department

SOUTH PLAINFIELD BOARD OF EDUCATION TABLE OF CONTENTS
INTRODUCTORY SECTION
Letter of Transmittal Organizational Chart Roster of Officials Consultants and Advisors
·Independent Auditor's Report
FINANCIAL SECTION
REQUIRED SUPPLEMENTARY INFORMATION- PART I
Management's Discussion and Analysis
Basic Financial Statements
A. District-wide Financial Statements
A-1 Statement of Net Position A-2 Statement of Activities
B. Fund Financial Statements
Governmental Funds B-1 Balance Sheet B-2 Statement of Revenues, Expenditures, and Changes in Fund Balances B-3 Reconciliation of the Statement of Revenues, Expenditures, and Changes in
Fund Balances of Governmental Funds to the Statement of Activities
Proprietary Funds B-4 Statement of Net Positon B-5 Combining Statement of Revenues, Expenses and Changes in Net Position B-6 Statement of Cash Flows
Fiduciary Funds B-7 Statement of Fiduciary Net Position B-8 Statement of Changes in Fiduciary Net Position
Notes to the Basic Financial Statements
1-V
vi vii
viii
1-3
4-14
15 16-17
18 19
20
21 22 23
24 25
26-62

SOUTH PLAINFIELD BOARD OF EDUCATION TABLE OF CONTENTS
REQUIRED SUPPLEMENTARY INFORMATION- PART II
C. Budgetary Comparison Schedules
C-1 Budgetary Comparison Schedule- General Fund C-2 Budgetary Comparison Schedule- Special Revenue Fund
NOTES TO THE REQUIRED SUPPLEMENTARY INFORMATION- PART II
63-69 70
C-3 Budgetary Comparison Schedule- Note to Required Supplementary Information 71
REQUIRED SUPPLEMENTARY INFORMATION - PART III
L. Schedules Related to Accounting and Reporting for Pensions (GASB 68)
L-1 Required Supplementary Information - Schedule of the District's Proportionate Share of the Net Pension Liability- Public Employees Retirement System 72
L-2 Required Supplementary Information- Schedule of District Contributions-Public Employees Retirement System 73
L-3 Required Supplementary Information- Schedule of the District's Proportionate Share of the Net Pension Liability- Teachers Pension and Annuity Fund 74
Notes to Required Supplementary Information
OTHER SUPPLEMENTARY INFORMATION
D. School Level Schedules- Not Applicable
E. Special Revenue Fund
E-1 Combining Schedule of Revenues and Expenditures Special Revenue Fund - Budgetary Basis
E-2 Schedule of Preschool Education Aid-Budgetary Basis
F. Capital Projects Fund
F-1 F-2
F-2a
Summary Schedule of Project Expenditures Summary Schedule of Revenues, Expenditures and Changes in Fund Balance -Budgetary Basis
F-2m Schedule of Project Revenues, Expenditures, Project Balance and Project Status-
74a
75-76
77
78
79
Budgetary Basis 80-92
SOUTH PLAINFIELD BOARD OF EDUCATION TABLE OF CONTENTS
G. Proprietary Funds
G-1 Statement of Net Position- Not Applicable G-2 Statements of Revenues, Expenses and Changes in
Net Position- Not Applicable G-3 Statements of Cash Flows- Not Applicable
H. Fiduciary Fnnds
H-1 Combining Statement of Agency Fund Net Position H-2 Nonexpendable Trust Fund- Combining Statement of Changes in
Fiduciary Net Position -Not Applicable H-3 Student Activity Agency Fund- Schedule of Receipts and Disbursements H-4 Payroll Agency Fund- Schedule of Receipts and Disbursements
I. Long-Term Debt
I-1 Schedule of Serial Bonds Payable I-2 Schedule of Obligations Under Capital Leases- Not Applicable I-3 Debt Service Fund Budgetary Comparison Schedule
J. STATISTICAL SECTION (Unaudited)
J-1 Net Position by Component J-2 Changes in Net Position J-3 Fund Balances- Governmental Funds J-4 Changes in Fund Balances - Governmental Funds J-5 General Fund Other Local Revenue by Source J-6 Assessed Value and Actual Value of Taxable Property J-7 Direct and Overlapping Property Tax Rates J-8 Principal Property Taxpayers J-9 Property Tax Levies and Collections J-1 0 Ratios of Outstanding Debt by Type J-11 Ratios of Net General Bonded Debt Outstanding J-12 Direct and Overlapping Governmental Activities Debt J-13 Legal Debt Margin Information J-14 Demographic and Economic Statistics J-15 Principal Employers J-16 Full-Time Equivalent District Employees by Function/Program J-17 Operating Statistics J-18 School Building Information J-19 Schedule of Required Maintenance for School Facilities J-20 Schedule oflnsurance
93
93 93
94
95 95 96
97 98 99
100 101-102
103 104 105 106 107 108 109 110 Ill 112 113 114 115 116 117 118 119 120
SOUTH PLAINFIELD BOARD OF EDUCATION TABLE OF CONTENTS
SINGLE AUDIT SECTION
K-1 Report on Internal Control Over Financial Reporting and on Compliance and Other Matters Based on an Audit of Financial Statements Performed in Accordance With Government Auditing Standards 121-122
K-2 Report on Compliance with Requirements that could have a Direct and Material Effect on Each Major Program and on Internal Control Over Compliance in Accordance With OMB Circular A-133 and New Jersey OMB Circular 15-08-Independent Auditor's Report 123-125
K-3 Schedule of Expenditures ofF ederal A wards 126
K-4 Schedule of Expenditures of State Financial Assistance 127-128
K-5 Notes to the Schedules of Expenditures of Federal Awards and State Financial Assistance 129-130
K-6 Schedule of Findings and Questioned Costs 131-138
K-7 Summary Schedule of Prior Year Audit Findings and Questioned Costs 139-141

INTRODUCTORY SECTION
South Plainfield Public Schools
Dr. Johanna Rubetio Interim Superintendent of Schools
Fax: 908-822-2453 [email protected]
November 24, 2015
Honorable President and
125 Jackson Avenue South Plainfield, New Jersey 07080
908-754-4620 spboe.org
Dr. LeRoy Seitz Interim Assistant Superintendent
Fax: 908-822-2848 [email protected]
Members of the Board of Education South Plainfield School District County of Middlesex, New Jersey
Dear Board Members:
Mr. Alexandre Ferreira Board Secretmy/Rusiness Admin.
Fax: 908-822-2516 [email protected]
The comprehensive annual financial report (CAFR) of the South Plainfield School District (District) for the fiscal year ended June 30,2015, is hereby submitted. Responsibility for both the accuracy of the data and completeness and fairness of the presentation, including all disclosures, rests with the management ofthe Board of Education (Board). To the best of our knowledge and belief, the data presented in this report is accurate in all material respects and is reported in a manner designed to present fairly the financial position and results of operations of the various funds of the District. All disclosures necessary to enable the reader to gain an understanding of the District's financial activities have been included.
The District has implemented Statement No. 34 of the Governmental Accounting Standards Board (GASB) entitled Basic Financial Statements- and Management's Discussion and Analysis- for State and Local Governments. This standard, issued in June 1999, creates a new reporiing model of financial information and disclosure, which represents a significant departure from the previously used reporting model. The reader will notice that the t\vo main basic fmancial statements created by this standard, the Statement ofNet Position and the Statement of Activities, do not contain numerous columns for various funds that have been seen in past governmental financial statements. These two financial statements consolidate much of the detailed information contained in fund based financial statements of the South Plainfield School District.
Also required as pmi of "Required Supplementary Information" by GASB Statement No. 34 is a "Management's Discussion and Analysis" (MD&A) which allows the District to explain in layman's tetms its fi11ancial position and results of operations of the past fiscal year.
i
In addition, please note that the GASB standards on pensions substantially change the accounting and financial reporting of public employee pension plans and the state and local govemments that participate in such plans. The district is following GASB Statement No. 67, Financial Reporting for Pension Plans, and GASB Statement No. 68, Accounting and Financial Reporting for Pensions, which revises and establishes new financial reporting requirements for most govemments that provide their employees with pension benefits.
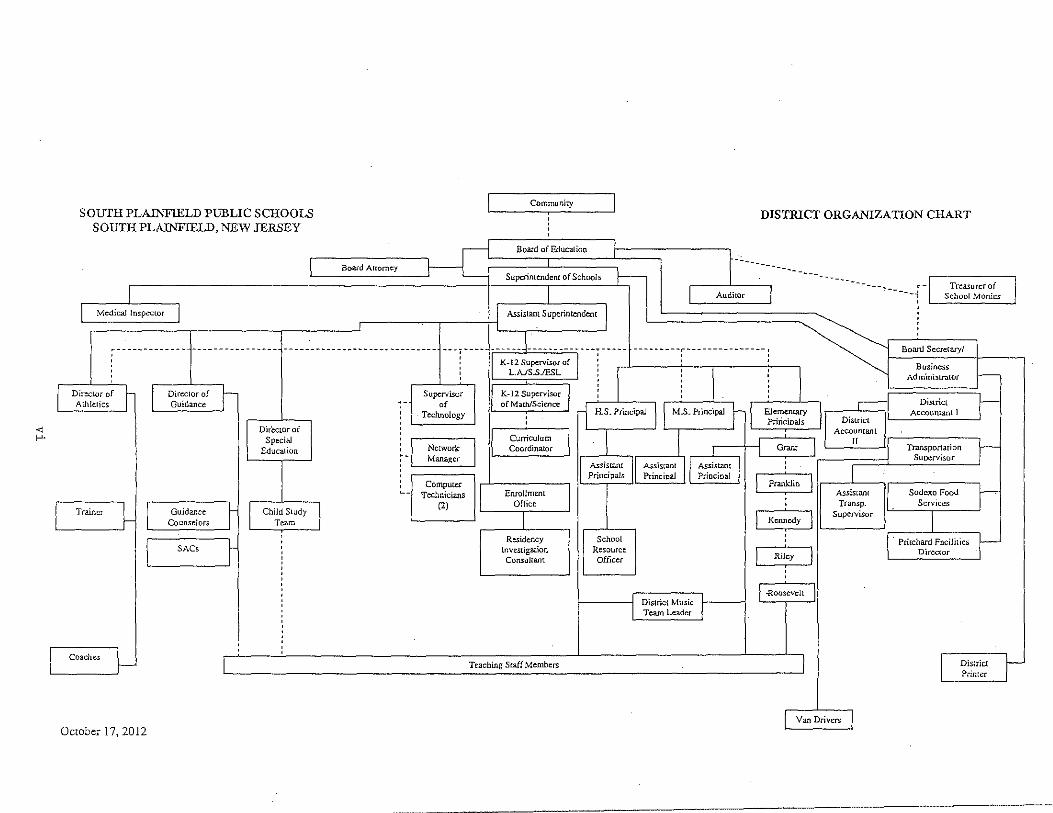
The comprehensive annual financial report is presented in four sections: ihtroductqry, fmancial, statistical and single audit. The introductory section includes this transmittal letter, the District's organizational chart and a list of principal officials. The financial section includes the basic financial statements and schedules, Management's Discussion and Analysis (MD&A), supplemental information, the combining of individual schedules as well as the auditor's report thereon. The statistical section includes selected financial and demographic information, generally presented on a multi -year basis. The District is required to undergo an armual single audit in confmmity with the provisions of the Single Audit Act, as amended, and the U.S. Office of Management and Budget Circular A-133, Audits of States, Local Govemments and Non-Profit Organizations, and New Jersey OMB Circular 15-08, Single Audit Policy for Recipients of Federal Grants, State Grants and State Aid. Information related to this single audit, including the auditor's report on the internal control stn1cture and compliance with applicable laws and regulations and findings and recommendations, are included in the single audit section of this report.
Generally Accepted Accounting Principles (GAAP) requires that management provide a narrative introduction, overview, and analysis to accompany the basic financial statements in the form of Management's Discussion and Analysis (MD&A). This letter of transmittal is designed to complement the MD&A and should be read in conjunction with it. The :tviD&A of South Plainfield School District can be found immediately following the report of the independent auditors.
1. Reporting Entity and its Services: South Plainfield School District is an independent reporting entity within the criteria adopted by the GASB as established by GASB Statement No. 14. All funds of the District are included in this report. The South Plainfield Board of Education and all its schools constitute the District's reporting entity. The District provides a full range of educational services appropriate to grade levels K tlnough 12. These include regular, vocational, limited English-proficient, as well as special education for educationally handicapped youngsters.
ii

The District operated the 2014/15 fiscal year with an emollment of 3,576 students, which represents an increase of 3.32% more students than the previous year's emollment. This change is primarily due to different recording procedures on the district's ASSA submission relating to students in Pre-K. The following details the changes in the student enrollment of the district over the last ten years.
Fiscal Year
2014-2015 2013-2014 2012-2013 2011~2012
2010-2011 2009-2010 2008-2009 2007-2008 2006-2007 2005-2006
Average Daily Emollment
Student Enrollment
3,576 3,461 3,558 3,630 3,714 3,739 3,705 3,721 3,797 3,791
Percent Change
3.32% -2.73% -1.96% -2.26% -0.70% 0.91% -0.43% -2.00% 0.02% -1.36%
2. Economic Condition and Outlook: South Plainfield's economy benefits from its location as a convenient commutation point to major employment centers, including New York City. The economy mirrors the national economy that is reportedly ending a recession but has not yet fully recovered.
3. Internal Accounting Controls: Management of the District is responsible for establishing and maintaining an internal control structure designed to ensure that the assets of the District are protected fi'Om loss, theft or misuse and to ensure that adequate accounting data are compiled to allow for the preparation of financial statements in conformity with Generally Accepted Accounting Principles (GAAP). The· internal control structure is designed to provide reasonable, but not absolute, assurance that recognizes: (1) the cost of a control should not exceed the benefits likely to be derived; and (2) the valuation of costs and benefits requires estimates and judgments by management.
As recipient of federal and state financial assistance, the District also is responsible for ensuring that an adequate internal control structure is in place to ensure compliance with applicable laws and regulations related to those programs. This intemal control structure is also subject to periodic evaluation by the District management.
As part of the District's single audit described earlier, tests are made to detetmine the adequacy of the internal control structure, including that p01tion related to federal and state financial assistance programs, as well as to detetmine that the District has complied with applicable laws and regulations.
iii
4. Budgetary Controls: In addition to internal accounting controls, the District maintains budgetary controls. The objective of these budgetary controls is to ensure compliance with legal provisions embodied in the annual appropriated budget approved by the voters of the municipality. Annual appropriated budgets are adopted for the general fund, the special revenue fund and the debt service fund. Project-length budgets are approved for the capital improvements accounted for in the capital projects fund. The final budget amount as amended for the fiscal year is reflected in the financial section.
An encumbrance accounting system is used to record outstanding purchase commitments on a line item basis. Open encumbrances at year-end are either canceled or are included as reappropriations of fund balance in the subsequent year. Those amounts to be reappropriated are repmied as reservations of fund balance at June 30, 2015.
5. Accounting System and Repm1s: The District's accounting records reflect generally accepted accounting principles, as promulgated by the Govemmental Accounting Standards Board (GASB). The District had implemented GASB No. 34 for the fiscal year ended June 30, 2006 as explained in the Notes to the Basic Financial Statements.
6. Debt Administration: The Board of Education issued bonds to pay for the school district's capital projects. The proposal was approved by the voters at the April 17, 2001 school election for a total of$19,283,380.00 The State's share of the project was $6,647,000, and the local share of the project was $12,636,380.00. The project included the building of a new elementary school; expansion of Grant School to include grades 5 and 6; and two (2) contracts for electrical and technology upgrades. On August 14, 2009, the Board of Education sold and issued $9,765,000 Refunding School Bonds resulting in a savings of $341,112. As of June 30, 2015, the outstanding principal was $7,325,000- bonds.
7. Cash Management: The investment policy of the District is guided in large pali by state statute as detailed in the "Notes to Basic Financial Statements", Note 2. The District has adopted a cash management plan which requires it to deposit its funds in public depositories protected from loss under the provisions of the Goverl111lental Unit Deposit Protection Act ("GUDPA"). GUDPA was enacted in 1970 to protect Govemmental Units from a loss of funds on deposit with a failed. banking institution in New Jersey. The law requires goverl111lental units to deposit public funds only in public depositories located in New Jersey, where the funds are secured in accordance with the Act.
8. Risk Management: The Board carries various forms of insurance, including but not limited to general liability, automobile liability and comprehensive/collision, hazard and theft insurance on prope11y and contents, and fidelity bonds.
iv
9. Other Information:
Independent Audit: State statutes require an annual audit by independent certified public accountants or registered municipal accountants. The accounting fum of Lerch, Vinci and Higgins, LLP, was selected by the Board. In addition to meeting the requirements set forth in state statutes, the audit also was designed to meet the requirements of the Single Audit Act, as amended, and the related OMB Cin:ular A-133 and New Jersey OMB Circular 15-08. The auditor's report of the CAFR is included in the financial section of this report. The auditor's reports related specifically to the single audit are included in the single audit section of this report.
10. Acknowledgments:
We would like to express our appreciation to the members of the South Plainfield School Board of Education for their concern in providing fiscal accountability to the citizens and taxpayel's of the school district and thereby contributing their fhll support to the development and maintenance of our financial operation. The preparation of this report could not have been accomplished without the efficient and dedicated services of our administrative office staff.
Respectfully submitted,
v
cf\ Alex Feneira, School Business Administrator I Board Secretary
< f-'·
I
I
SOUTH PLAINFIELD PUBLIC SCHOOLS SOUTH PLAINFIELD, NEW JERSEY
J 1 Medical Inspector 1
T~cr •-w Guidance Counselors
SACs
Coaches ~
October 17, 2012
r
Oir'ecwr of Special
Education
~Study earn
' ' ' ' ' '
:
'
I Board Attorney
'
~-1 u
----"j---:----' ' ~
Supervisor of
Technology
Network Mana,!!;er
Computer Technicians
[2)
\ Communicy --]
DISTRICT ORGANIZATION CHART
Board of Education
--- -- ___ ~- Treasurerof
--: School Monies
...... ---- .......... ----- f ------- ··r--------- ------, Boru-d Swo<oryl ' ' '
K-12 Supervisor of : ' ' Business
L.AJS.S.IESL ~ I ; I ~ I Adm"misLrator
K- 12 Supervisor I of Math/Science District , Accountant I
' Curriculum Coordinator Transportation
Enrollment Office
I Residency
Investigation Consllltam
J : Suoervisor
I r--f-,;mld-':-io--,] Sod~o Food
School Resource Officer
District Music j Team Leader
I Konnody -~
~'~~
j -Roosevelt
I
Transp. Supervisor
Pritchard Facilities Director
Teaching Scaff Members I [ District Printer
Van Drivers J
BOROUGH OF SOUTH PLAINFIELD BOARD OF EDUCATION MIDDLESEX COUNTY, NEW JERSEY
ROSTER OF OFFICIALS JUNE 30,2015
Members of the Board of Education
Mrs. Deborah Boyle, President
Mrs. Kimberly "Anesh" DeAngelis, Vice-President
Mr. Steven Bohn
Mrs. Carol Byrne
Mr. John Farinella, Jr., Vice-President
Mr. Ernie "Jim" Giannakis
Mrs. Chere Glover
Mrs. Sharon Miller, President
Mr. William Seesselberg
Other Officials
Mr. Thomas Gialanella, Interim Superintendent
Mrs. Nicole Pormilli, Assistant Superintendent
Mr. Alex Ferreira, School Business Administrator I Board Secretary
Mr. Glenn Cullen, Treasurer of School Monies
Term Expiration
January 2017
January 2016
January 2017
January 2017
January 2018
January 2016
January 2018
January 2018
January 2016
Marc H. Zitomer, Esq., Schenck, Price, Smith & King, LLP, School Board Attorney
vii
BOROUGH OF SOUTH PLAINFIELD BOARD OF EDUCATION
CONSULTANTS AND ADVISORS
AUDIT FIRM
Lerch, Vinci & Higgins, LLP 17-17 Route 208 N
Fair Lawn, New Jersey 07410
ATTORNEY
Schenck, Price, Smith & King, LLP 220 Park Avenue
P.O. Box 991 Florham Park, New Jersey 07932
OFFICIAL DEPOSITORY
Investors Bank 101 Wood Avenue South
Iselin, NJ 08830
viii

FINANCIAL SECTION
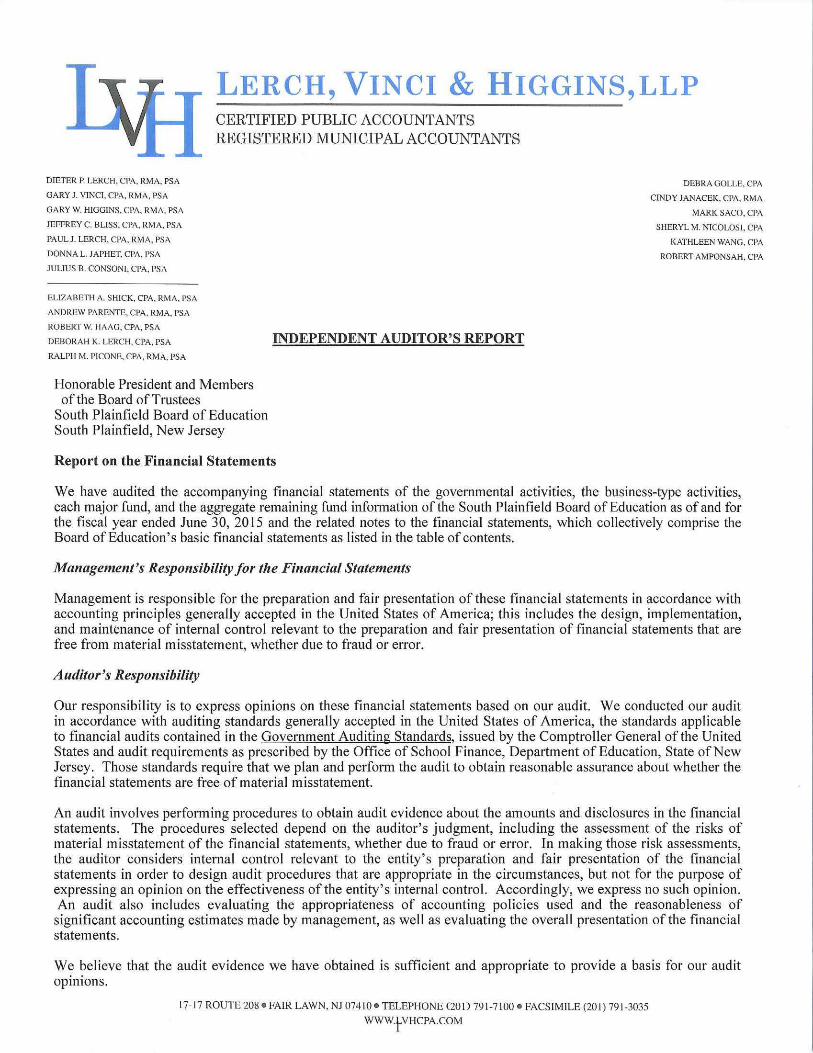
LERCH, VINCI & HIGGINS,LLP CERTIFIED PUBLIC ACCOUNTANTS REGISTERED MUNICIPAL ACCOUNTANTS
DIETER P. LERCH. CPA, RMA. PSA
GARY J. VINCI. CPA. RMA, PSA
GARY W. HJGGINS, CPA, RMA, PSA
JEFFREY C. BLISS. CPA, RMA, PSA
PAULJ. LERCH. CPA, RMA, PSA
DONNA L. JAPHET. CPA. !'SA
JULIUS B. CONSONI. CPA. PSA
ELIZABETH A. SHICK, CPA, RMA. PSA
ANDREW PARENTE, CPA, RMA, PSI\
ROBERT W. HAAG, CPA. PSI\
DEBORAH K. LERCH. CPA. PSA
RALPH M. PICONE, CPA. RMA. !'SA
Honorable President and Members of the Board ofTrustees
South Plainfield Board of Education South Plainfield, New Jersey
INDEPENDENT AUDITOR'S REPORT
Repot·t on the Financial Statements
DEBRA GOLLE, CPA
CINDY JANACEK. CPA. RMA
MARK SACO, CPA
SHERYL M. NICOLOSI. CPA
KATHLEEN WANG. CPA
ROBERT AMPONSAH. CPA
We have audited the accompanying financial statements of the governmental activities, the business-type activities, each major fund, and the aggregate remaining fund infonnation of the South Plainfield Board of Education as of and for the fiscal year ended June 30, 2015 and the related notes to the financial statements, which collectively comprise the Board of Education's basic financial statements as listed in the table of contents.
Management's Responsibility for the Financial Statements
Management is responsible for the preparation and fair presentation of these financial statements in accordance with accounting principles generally accepted in the United States of America; this includes the design, implementation, and maintenance of internal control relevant to the preparation and fair presentation of financial statements that are free from material misstatement, whether due to fraud or error.
Auditor's Responsibility
Our responsibility is to express opinions on these financial statements based on our audit. We conducted our audit in accordance with auditing standards generally accepted in the United States of America, the standards applicable to financial audits contained in the Government Auditing Standards, issued by the Comptroller General of the United States and audit requirements as prescribed by the Office of School Finance, Department of Education, State of New Jersey. Those standards require that we plan and perf01m the audit to obtain reasonable assurance about whether the financial statements are free of material misstatement.
An audit involves performing procedures to obtain audit evidence about the amounts and disclosures in the financial statements. The procedures selected depend on the auditor's judgment, including the assessment of the risks of material misstatement of the financial statements, whether due to fraud or eiTor. In making those risk assessments, the auditor considers internal control relevant to the entity's preparation and fair presentation of the financial statements in order to design audit procedures that are appropriate in the circumstances, but not for the purpose of expressing an opinion on the effectiveness of the entity's internal control. Accordingly, we express no such opinion. An audit also includes evaluating the appropriateness of accounting policies used and the reasonableness of
significant accounting estimates made by management, as well as evaluating the overall presentation of the financial statements.
We believe that the audit evidence we have obtained is sufficient and appropriate to provide a basis for our aud it opinions.
17-17 ROUTE 208 • FAIR LAWN, NJ 07410• TELEPHONE (201) 79 1-7100 • FACSIMILE (20 1) 791-3035
WWW.tVI-ICPA.COM
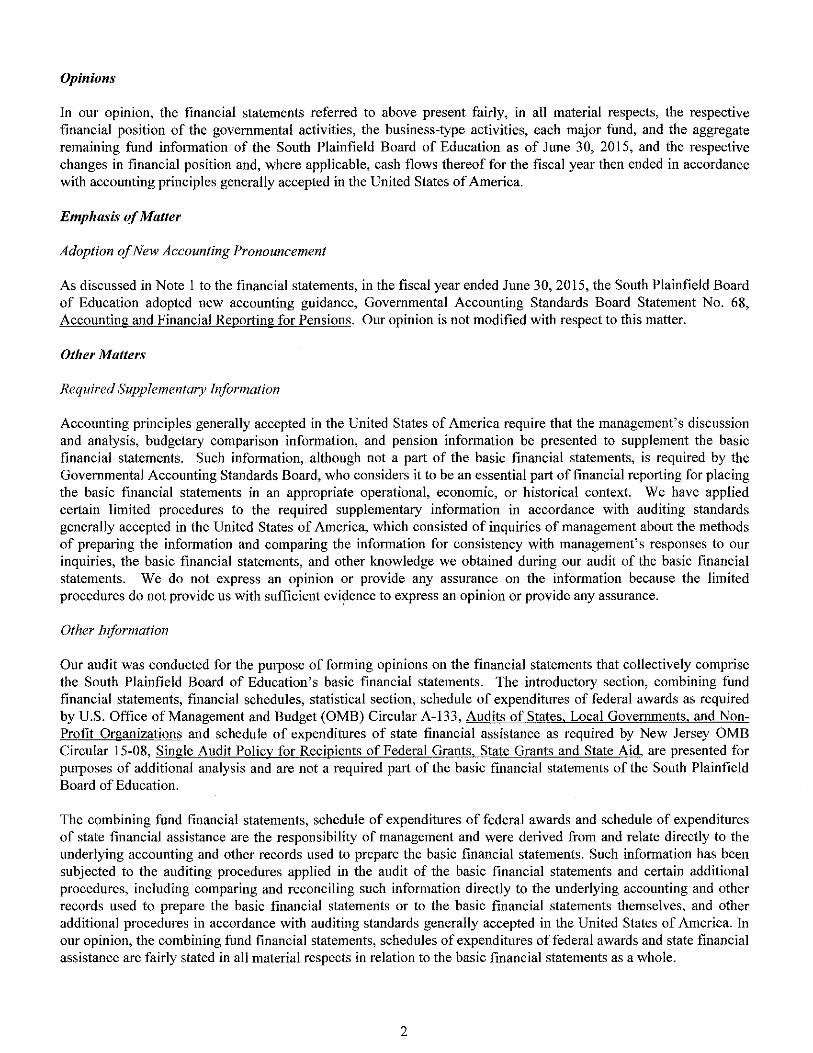
Opinions
In our opinion, the financial statements referred to above present fairly, in all material respects, the respective financial position of the governmental activities, the business-type activities, each major fund, and the aggregate remaining fund information of the South Plainfield Board of Education as of June 30, 2015, and the respective changes in financial position and, where applicable, cash flows thereof for the fiscal year then ended in accordance with accounting principles generally accepted in the United States of America.
Emphasis of Matter
Adoption of New Accounting Pronouncement
As discussed in Note I to the financial statements, in the fiscal year ended June 30, 2015, the South Plainfield Board of Education adopted new accounting guidance, Governmental Accounting Standards Board Statement No. 68, Accounting and Financial Reporting for Pensions. Our opinion is not modified with respect to this matter.
Other Matters
Required Supplementary Information
Accounting principles generally accepted in the United States of America require that the management's discussion and analysis, budgetary comparison information, and pension information be presented to supplement the basic financial statements. Such information, although not a part of the basic financial statements, is required by the Governmental Accounting Standards Board, who considers it to be an essential part of financial reporting for placing the basic financial statements in an appropriate operational, economic, or historical context. We have applied certain limited procedures to the required supplementary information in accordance with auditing standards generally accepted in the United States of America, which consisted of inquiries of management about the methods of preparing the information and comparing the information for consistency with management's responses to our inquiries, the basic financial statements, and other knowledge we obtained during our audit of the basic financial statements. We do not express an opinion or provide any assurance on the information because the limited procedures do not provide us with sufficient evidence to express an opinion or provide any assurance.
Other Information
Our audit was conducted for the purpose of forming opinions on the financial statements that collectively comprise the South Plainfield Board of Education's basic financial statements. The introductory section, combining fund financial statements, financial schedules, statistical section, schedule of expenditures of federal awards as required by U.S. Office of Management and Budget (OMB) Circular A-133, Audits of States, Local Governments, and NonProfit Organizations and schedule of expenditures of state financial assistance as required by New Jersey OMB Circular 15-08, Single Audit Policy for Recipients of Federal Grants, State Grants and State Aid, are presented for purposes of additional analysis and are not a required part of the basic financial statements of the South Plainfield Board of Education.
The combining fund financial statements, schedule of expenditures of federal awards and schedule of expenditures of state financial assistance are the responsibility of management and were derived from and relate directly to the underlying accounting and other records used to prepare the basic financial statements. Such information has been subjected to the auditing procedures applied in the audit of the basic financial statements and certain additional procedures, including comparing and reconciling such information directly to the underlying accounting and other records used to prepare the basic financial statements or to the basic financial statements themselves, and other additional procedures in accordance with auditing standards generally accepted in the United States of America. In our opinion, the combining fund financial statements, schedules of expenditures of federal awards and state financial assistance are fairly stated in all material respects in relation to the basic financial statements as a whole.
2

The introductory section, financial schedules and statistical section have not been subjected to the auditing procedures applied in the audit of the basic financial statements and, accordingly, we do not express an opinion or provide any assurance on them.
Other Reporting Requit·ed by Government Auditing Standards
In accordance with Government Auditing Standards, we have also issued our report dated November 24, 2015 on our consideration of the South Plainfield Board of Education's internal control over financial reporting and on our tests of its compliance with certain provisions of laws, regulations, contracts, and grant agreements and other matters. The purpose of that report is to describe the scope of our testing of internal control over financial reporting and compliance and the results of that testing, and not to provide an opinion on internal control over financial reporting or on compliance. That report is an integral patt of an audit performed in accordance with Government Auditing Standards in considering the South Plainfield Board of Education 's internal control over financial repotting and compliance.
Fair Lawn, New Jersey November 24, 2015
3
L~:rzc L. O,,o< ~ ~ f..II£.S!.-o>. LL.P
LERCH, VINCI & HIGGINS, LLP Certified Public Accountants Public School Accountants
Jeffrey C. Bliss Public School Accountant PSA Number CS00932
REQUIRED SUPPLEMENTARY INFORMATION-PART I

MANAGEMENT'S DISCUSSION AND ANALYSIS

SOUTH PLAINFIELD BOARD OF EDUCATION
INTRODUCTION
Management Discussion and Analysis Year Ended June 30,2015
This section of South Plainfield Board of Education's annual financial report presents our discussion and analysis of the School District's financial performance during the fiscal year that ended on June 30, 2015. Please read it in conjunction with the transmittal letter at the front of this report and the School District's financial statements, which immediately follows this section.
The Management's Discussion and Analysis (MD&A) is an element of Required Supplementary Information specified in the Governmental Accounting Standard Board's (GASB) Statement No. 34 -Basic Financial Statements -and Management's Discussion and Analysis- for State and Local Governments. Certain comparative information between the current year (2014-2015) and the prior year (2013-2014) is required to be presented in the MD&A.
The discussion and analysis of the School District's financial performance provides an overall review of the School District's financial activities for the fiscal year ended June 30, 2015. The intent of this discussion and analysis is to look at the School District's financial performance as a whole; readers should also review the notes to the financial statements and financial statements to enhance their understanding of the School District's financial performance.
USING THIS COMPREHENSIVE ANNUAL FINANCIAL REPORT (CAFR)
This annual report consists of a series of financial statements as well as notes to those statements. These statements are organized so that the reader can understand the South Plainfield Board of Education as a financial whole, an entire operating entity. The statements then proceed to provide an increasingly detailed look at specific financial activities.
The Statement of Net Position and Statement of Activities provide information about the activities of the whole School District, presenting both an aggregate view of the School District's finances and a longer-term view of those finances. Fund financial statements provide the next level of detail. For governmental funds, these statements tell how services were financed in the short-term as well as what remains for future spending. In the case of the South Plainfield Board of Education, the General Fund is by far the most significant fund.
REPORTING THE SCHOOL DISTRICT AS A WHOLE
Statement of Net Position and the Statement of Activities
While this document contains the large number of funds used by the School District to provide programs and activities, the view of the School District as a whole looks at all financial transactions and asks the question, "How did we do financially during 20 15?" The Statement of Net Position and Statement of Activities help answer this question. These Statements include all assets, deferred outflows of resources, liabilities and deferred inflow of resources using the accrual basis of accounting similar to the accounting used by most private-sector companies. This basis of accounting takes into account all of the current year's revenues and expenses regardless of when cash is received or paid.
4
SOUTH PLAINFIELD BOARD OF EDUCATION
Management's Discussion and Analysis Year Ended June 30,2015
REPORTING THE SCHOOL DISTRICT AS A WHOLE (Continued)
Statement of Net Position and the Statement of Activities (Continued)
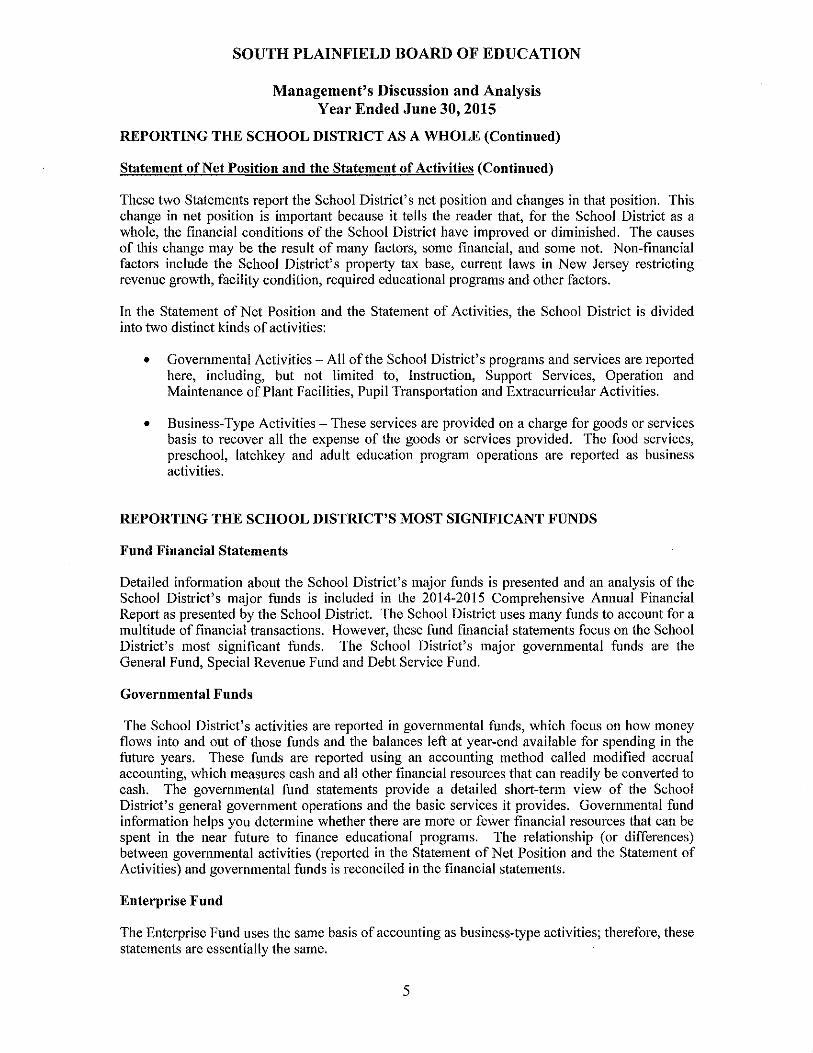
These two Statements report the School District's net position and changes in that position. This change in net position is important because it tells the reader that, for the School District as a whole, the financial conditions of the School District have improved or diminished. The causes of this change may be the result of many factors, some financial, and some not. Non-financial factors include the School District's property tax base, current laws in New Jersey restricting revenue growth, facility condition, required educational programs and other factors.
In the Statement of Net Position and the Statement of Activities, the School District is divided into two distinct kinds of activities:
• Governmental Activities - All of the School District's programs and services are repmted here, including, but not limited to, Instruction, Support Services, Operation and Maintenance of Plant Facilities, Pupil Transportation and Extracurricular Activities.
• Business-Type Activities- These services are provided on a charge for goods or services basis to recover all the expense of the goods or services provided. The food services, preschool, latchkey and adult education program operations are reported as business activities.
REPORTING THE SCHOOL DISTRICT'S MOST SIGNIFICANT FUNDS
Fund Financial Statements
Detailed information about the School District's major funds is presented and an analysis of the School District's major funds is included in the 2014-2015 Comprehensive Annual Financial Report as presented by the School District. The School District uses many funds to account for a multitude of financial transactions. However, these fund financial statements focus on the School District's most significant funds. The School District's major governmental funds are the General Fund, Special Revenue Fund and Debt Service Fund.
Governmental Funds
The School District's activities are reported in governmental funds, which focus on how money flows into and out of those funds and the balances left at year-end available for spending in the future years. These funds are reported using an accounting method called modified accrual accounting, which measures cash and all other financial resources that can readily be converted to cash. The governmental fund statements provide a detailed short-term view of the School District's general government operations and the basic services it provides. Governmental fund information helps you determine whether there are more or fewer financial resources that can be spent in the near future to finance educational programs. The relationship (or differences) between governmental activities (reported in the Statement of Net Position and the Statement of Activities) and governmental funds is reconciled in the financial statements.
Enterprise Fund
The Enterprise Fund uses the same basis of accounting as business-type activities; therefore, these statements are essentially the same.
5

SOUTH PLAINFIELD BOARD OF EDUCATION
Management's Discussion and Analysis Year Ended June 30, 2015
REPORTING THE SCHOOL DISTRICT'S MOST SIGNIFICANT FUNDS (Continued)
Fiduciary Funds
The School District is the trustee, or fiduciary, for assets that belong to others. The School District is responsible for ensuring that the assets reported in these funds are used only for their intended purposes and by those to whom the assets belong. All of the School District's fiduciary activities are reported in a separate statement of fiduciary net position and a statement of changes in fiduciary net position. We exclude these activities from the district-wide financial statements because the School District cannot use these assets to finance its operations.
Notes to the Financial Statements
The notes provide additional information that is essential to a full understanding of the data provided in the government-wide and fund financial statements. The notes to the financial statements can be found following the financial statements.
Other Information
In addition to the financial statements and accompanying notes, this report also presents certain required supplementary information concerning the School District's budget process. The School District adopts an annual expenditure budget for the general, special revenue and debt service funds. A budgetary comparison statement has been provided for the general and special revenue funds as required supplementary information. Information regarding the School District's employee retirement systems and pension plans has also been provided as required supplemental information. The required supplementary information can be found following the notes to the financial statements.
Combining statements and schedules are presented immediately following the major budgetary comparisons.
FINANCIAL HIGHLIGHTS
Key financial highlights for the fiscal year 2015 are as follows:
• The assets and deferred outflows of the South Plainfield Board of Education exceeded its liabilities and deferred inflows at the close of the fiscal year by $8,778,613 (net position). The amount available to meet the District's ongoing obligations (unrestricted net position) was in a deficit position of$8,712,977.
• The School District's total net position increased $1,037,692.
• General revenues accounted for $51,725,976 or 74 percent of all revenues. Program specific revenues in the form of charges for services, operating grants and contributions, and capital grants accounted for $18,452,511 or 26 percent of total revenues of $70,178,487.
• The School District had $66,770,706 in expenses for governmental activities; only $16,122,053 of these expenses were offset by program specific charges for services, grants or contributions. General revenues (primarily property taxes) of $51,720,312 were adequate to provide for these programs.
6

SOUTH PLAINFIELD BOARD OF EDUCATION
Management's Discussion and Analysis Year Ended June 30,2015
FINANCIAL HIGHLIGHTS (Continued)
• The General Fund had $58,848,422 in revenues and $58,586,272 in expenditures. The General Fund's balance decreased $819,450 over the previous year to $4,674,697. Of this amount, only $87,890 is available for spending at the District's discretion (unassigned fund balance).
• The General Fund unassigned budgetary fund balance at the close of the current fiscal year was $1,214,336 which represented an increase of$111,042 over the previous year.
THE SCHOOL DISTRICT AS A WHOLE
Recall that the Statement of Net Position provides the perspective of the School District as a whole.
The following provides a summary of the School District's Net Position as of2015 and 2014:
Net Position As of June 30, 2015 and 2014
Governmental Activities
Business-Type Activities Total
2015 2014 2015 2014 2015 2014
Current Assets Capital Assets
Total Assets
Deferred Outflows of Resources
Total Assets and Deferred Outflows of Resources
Long-Term Liabilities Other Liabilities
Total Liabilities
Deferred Inflows of Resources
Total Liabilities and Deferred
Inflows of Resources
Net Postion Net Investment in Capital Assets Restricted Unrestricted
Total Net Position
$ 5,748,027 $ 5,909,186 $ 1,205,932 $ 1,475,310 $ 6,953,959 $ 7,384,496 22,849,405 21,708,588 194,393 219,324 23,043,798 21,927,912
28,597,432
728,495
29,325,927
20,073,688 926,859
21,000,547
685,928
21,686,475
15,516,546 1,780,651
(9,657,745)
27,617,774
360,403
27,978,177
21,229,071 581,313
21,810,384
21,810,384
13,503,788 2,548,548
(9,884,543)
1,400,325
1,400,325
255,075
255,075
6,089
261,164
194,393
944,768
1,694,634
1,694,634
]]7,663
117,663
3,843
121,506
219,324
1,353,804
29,997,757
728,495
30,726,252
20,073,688 1,181,934
21,255,622
692,017
21,947,639
15,710,939 1,780,651
(8,712,977)
29,312,408
360,403
29,672,811
2!,229,071 698,976
21,928,047
3,843
21,931,890
13,723,112 2,548,548
(8,530,739)
$ 7,639,452 $ 6,167,793 $ 1,139,161 $ 1,573,128 $ 8,778,613 $ 7,740,921
7

SOUTH PLAINFIELD BOARD OF EDUCATION
Management's Discussion and Analysis Year Ended June 30,2015
THE SCHOOL DISTRICT AS A WHOLE (Continued)
By far the largest portion of the School District's net position reflects its investment in capital assets (e.g., land and improvements, buildings and improvements, vehicles, furniture and equipment); less any related debt used to acquire those assets that is still outstanding. The School District uses these capital assets to provide services to its students; consequently, these assets are not available for future spending. Although the School District's investment in its capital assets is reported net of related debt, it should be noted that the resources needed to repay this debt must be provided from other sources, since the capital assets themselves cannot be used to liquidate these liabilities.
The following shows the changes in Net Position for fiscal years 2015 and 2014:
Revenues
Changes in Net Position
For the Fiscal Years Ended ,June 30,2015 and 2014
Governmental
Activities
Business~ Type
Activities
Program Revenues
Charges for Services $ 198,711 $ 15,229,636
693,706
218,941 $ 1,789,145 $ 1,729,745 $ 1,987,856 $ 1,948,686
Operating Grants and Contributions
Capital Grants and Contributions
General Revenues Property Taxes
Federal and State Aid- Unrestricted Other
Total Revenues
Expenses Instruction
Regular
Special Education
Other Instruction School Sponsored Activities and Athletics
Support Services
Student and Instruction Related Services
General Administrative Services
School Administrative Services
Central and Other Support Services
Plant Operations and Maintenance
Pupil Transportation
Interest on Long~ Term Debt
Food Services
Preschool Program
Latchkey Program Adult Education Program
Total Expenses
Increase (Decrease) in Net Position Before Transfers
Transfers
lnerease/(Deerease) in Net Position
Net Position, Beginning of Year
Prior Year Adjustment
Net Position, End of Year
44,869,564
6,714,045 136 703
67,842,365
29,815,485
10,104,837
1,496,543
1,248,712
8,991,136
1,278,897
4,310,696
1,793,830
4,899,308
2,503,270
327,992
66,770,706
1,071,659
400,000
1,471,659
6,167,793
8,870,576
2,030
43,716,718
6,655,971 399,997
59,864,233
26,744,764
9,076,153
971,985
1,461,816
7,957,459
1,158,319
2,858,028
1,907,567
5,124,060
2,365,993
361,722
59,987,866
(123,633)
(123,633)
17,591,245
(11,299,819)
541,313
5,664
2,336,122
1,375,120
316,139
533,733 145,097
2,370,089
(33,967)
520,893
206
1,311,366
299,362
506,713 143,464
2,260,905
(10,061)
(400,000) ----'----
(433,967) (10,061)
1,573,128 1,583,189
15,770,949
693,706
44,869,564
6,714,045 142,367
70,178,487
29,815,485
10,104,837
1,496,543
1,248,712
8,991,136
1,278,897
4,310,696
1,793,830
4,899,308
2,503,270
327,992
1,375,120
316,139
533,733 145,097
69,140,795
1,037,692
1,037,692
7,740,921
9,391,469
2,030
43,716,718
6,655,971 400,203
62,115,077
26,744,764
9,076,153
971,985
1,461,816
7,957,459
1,158,319
2,858,028
1,907,567
5,124,060
2,365,993
361,722
1,311,366
299,362
506,713 143,464
62,248,771
(133,694)
(133,694)
19,174,434
(11,299,819)
$ 7,639,452 $ 6,167,793 $ 1,139,161 $ 1,573,128 $ 8,778,613 $ 7,740,921
8

SOUTH PLAINFIELD BOARD OF EDUCATION
Management's Discussion and Analysis Year Ended June 30,2015
Governmental Activities. The District's total revenues for governmental activities were $67,842,365 and $59,864,233 for the fiscal years ended June 30, 2015 and 2014. Property taxes of $44,869,564 and $43,716,718 made up 66% and 73% of the revenues for governmental activities for the South Plainfield Board of Education for fiscal years ended June 30, 2015 and 2014, respectively. Federal, state and local grants and aid accounted for another $22,637,387 and $15,528,577 representing 33% and 26% of total revenues for the fiscal years ended June 30, 2015 and 2014, respectively. In addition, transportation fees and other miscellaneous income is earned. Miscellaneous income includes items such as interest, prior year refunds and other miscellaneous revenue items.
The total cost of all governmental activities programs and services were $66,770,706 and $59,987,866 for the fiscal years ended June 30, 2015 and 2014, respectively. Instruction comprised $42,665,577 (64%) and $38,254,718 (64%) of District expenses for the fiscal years ended June 30, 2015 and 2014, respectively. Support services totaled $23,777,137 (35%) and $21,371,426 (35%) of District expense and interest on debt totaled $327,992 (1%) and $361,722 (1%) of District expenses for fiscal year ended June 30, 2015 and 2014, respectively.
Total governmental activities revenues and transfers were more than expenses, increasing net position $1,471,659 for the fiscal year ended June 30, 2015 and for the fiscal year ended June 30, 2014 expenses exceeded revenues decreasing net position $123,633.
The Statement of Activities shows the cost of program services and the charges for services and grants offsetting those services. The following table shows the total cost of services and the net cost of services. The net cost shows the financial burden that was placed on the District's taxpayers by each of these functions.
Total and Net Cost of Governmental Activities
Total Cost of Net Cost Services of Services
2015 2014 2015 2014
Instruction
Regular $ 29,815,485 $ 26,744,764 $ 22,247,458 $ 21,068,897
Special Education 10,104,837 9,076,153 5,371,050 7,444,682
Other Instruction 1,496,543 971,985 929,884 510,905
School Sponsored Activities and Athletics 1,248,712 1,461,816 1,248,712 1,461,816
Support Services
Student and Instruction Related Services 8,991,136 7,957,459 7,748,890 7,338,249
General Administrative Services 1,278,897 1,158,319 1,278,897 1,158,319
School Administrative Services 4,310,696 2,858,028 3,415,614 2,594,853
Central and Other Support Services 1,793,830 1,907,567 1,793,830 I ,907,567
Plant Operations and Maintenance 4,899,308 5,124,060 4,108,590 5,027,337
Pupil Transportation 2,503,270 2,365,993 2,177,736 2,021,972
Interest on Long-Term Debt 327,992 361,722 327,992 361,722
Total $ 66,770,706 $ 59,987,866 $ 50,648,653 $ 50,896,319
9
SOUTH PLAINFIELD BOARD OF EDUCATION
Management's Discussion and Analysis Year Ended June 30,2015
Governmental Activities (Continued)
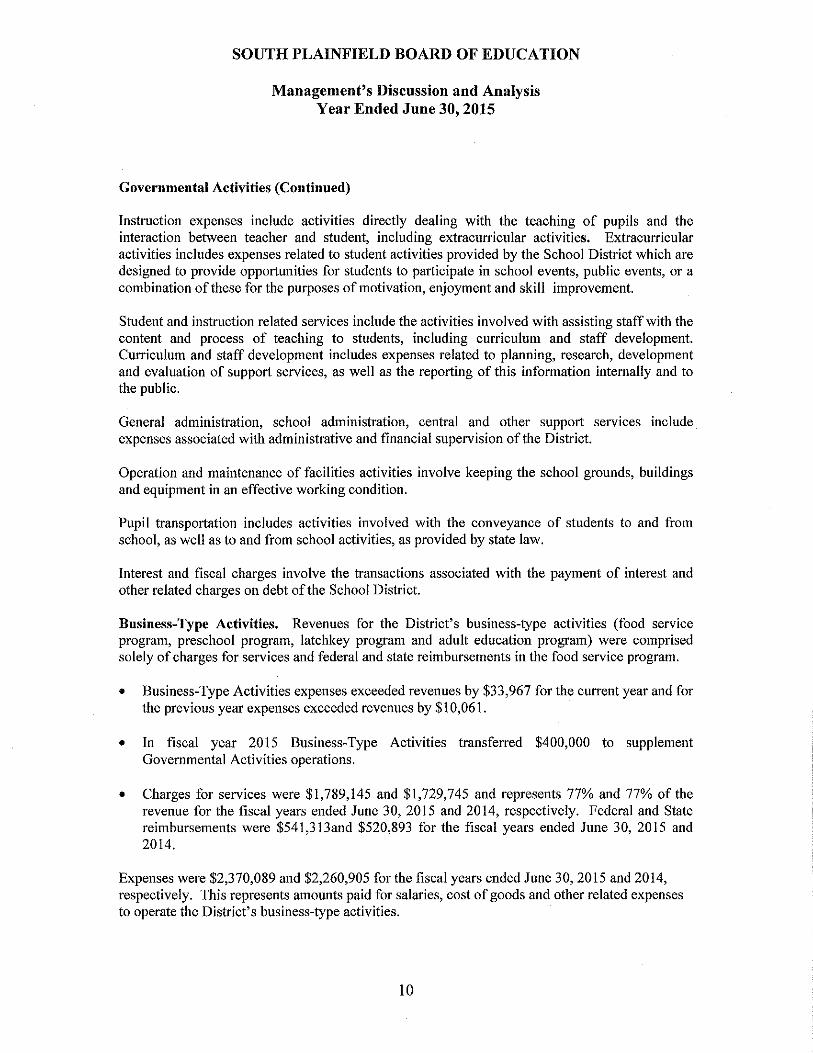
Instruction expenses include activities directly dealing with the teaching of pupils and the interaction between teacher and student, including extracurricular activities. Extracurricular activities includes expenses related to student activities provided by the School District which are designed to provide opportunities for students to participate in school events, public events, or a combination of these for the purposes of motivation, enjoyment and skill improvement.
Student and instruction related services include the activities involved with assisting staff with the content and process of teaching to students, including curriculum and staff development. Curriculum and staff development includes expenses related to planning, research, development and evaluation of support services, as well as the reporting of this information internally and to the public.
General administration, school administration, central and other support services include expenses associated with administrative and financial supervision of the District.
Operation and maintenance of facilities activities involve keeping the school grounds, buildings and equipment in an effective working condition.
Pupil transportation includes activities involved with the conveyance of students to and from school, as well as to and from school activities, as provided by state law.
Interest and fiscal charges involve the transactions associated with the payment of interest and other related charges on debt of the School District.
Business-Type Activities. Revenues for the District's business-type activities (food service program, preschool program, latchkey program and adult education program) were comprised solely of charges for services and federal and state reimbursements in the food service program.
• Business-Type Activities expenses exceeded revenues by $33,967 for the current year and for the previous year expenses exceeded revenues by $10,061.
• In fiscal year 2015 Business-Type Activities transferred $400,000 to supplement Governmental Activities operations.
• Charges for services were $1,789,145 and $1,729,745 and represents 77% and 77% of the revenue for the fiscal years ended June 30, 2015 and 2014, respectively. Federal and State reimbursements were $541,313and $520,893 for the fiscal years ended June 30, 2015 and 2014.
Expenses were $2,370,089 and $2,260,905 for the fiscal years ended June 30, 2015 and 2014, respectively. This represents amounts paid for salaries, cost of goods and other related expenses to operate the District's business-type activities.
10

SOUTH PLAINFIELD BOARD OF EDUCATION
Management's Discussion and Analysis Year Ended June 30,2015
THE SCHOOL DISTRICT'S FUNDS
Information about the School District's major funds is included in the June 30, 2015 Comprehensive Annual Financial Report as presented by the School District. These funds are accounted for using the modified accrual basis of accounting. All governmental funds (i.e., General Fund, Special Revenue Fund, Capital Project Fund and Debt Service Fund) presented in the fund-based statements had total revenues of $61,957,061 and $59,864,233 and expenditures of $62,879,808 and $60,884,107 for the fiscal years ended June 30, 2015 and 2014, respectively.
As demonstrated by the various statements and schedules included in the financial section of this report, the District continues to meet its responsibility for sound financial management. The following schedules present a summary of the revenues of the General Fund for the fiscal years ended June 30,2015 and 2014, and the amount and percentage of change in relation to prior-year revenues.
Amount of Year Ended Year Ended Increase Percent
June 30, 2015 June 30, 2014 (Decrease) Change
Local Sources:
Property Tax Levy $ 43,653,001 $ 42,499,893 $ 1,153,108 3%
Transportation Fees 198,711 218,941 (20,230) -9%
Miscellaneous 136,703 399,997 (263,294) -66%
State Sources 14,791,238 14,008,948 782,290 6% Federal Sources 68,769 18,824 49,945 265%
Total General Fund Revenues $ 58,848,422 $ 57,146,603 $ 1,701,819 3.0%
Overall General Fund revenues increased by 3% from the previous year. The change in Local Sources is attributable to a tax increase of 3% to finance the District's operating costs. Local miscellaneous revenues decreased 66% in the current year because of a one time revenues earned in the prior year from various sources. State sources increased 6% mainly due to the result of an increase in on-behalf contributions made by the State for the District's share of teachers' pension and post retirement medical benefit contributions. The increase in Federal sources was due to an increase in Medicaid reimbursements under SEMI funding for special education services.
The following schedule presents a summary of General Fund expenditures for the fiscal years ended June 30,2015 and 2014:
Amount of Year Ended Year Ended Increase Percent
June 30, 2015 June 30, 2014 (Decrease) Change
Instruction $ 36,069,903 $ 36,184,794 $ (114,891) 0%
Support Services 22,146,311 20,902,528 1,243,783 6%
Capital Outlay 370,058 1,079,155 (709,097) -66%
Total Expenditures $ 58,586,272 $ 58,166,477 $ 419,795 1%
11

SOUTH PLAINFIELD BOARD OF EDUCATION
Management's Discussion and Analysis Year Ended June 30,2015
THE SCHOOL DISTRICT'S FUNDS (Continued)
Overall General Fund expenditures increased 1% from the previous year. Regular education instructional costs was the main reason for the decrease in instruction expenditures. Increases in support service expenditures were mainly attributable to increases in student and instructional related costs as well as costs associated with school administrative services. These increases were offset by decreases in expenditures for capital outlay projects related to school facility improvements.
In addition to the capital outlay expenditure during fiscal year 2015 the District transferred $1,481,600 from the General Fund to the Capital Project Fund for its local share of the school facilities projects funded in part by state grants.
For the 2015 school year, General Fund expenditures and transfers out exceeded revenues and transfers in by $819,450. As a result total fund balance decreased to $4,674,697 at June 30, 2015. However, after deducting fund balances restricted, committed and assigned, the unassigned fund balance increased from $80,240 at June 30, 2014 to $87,890 at June 30, 2015. In addition restricted fund balance for capital reserve decreased $1,064,600 at June 30, 2015 to $1,033,879.
GENERAL FUND BUDGETING HIGHLIGHTS
The School District's budget is prepared according to New Jersey law, and is based on accounting for certain transactions on the budgetary basis of revenue, expenditures and encumbrance accounting. The most significant budgeted fund is the General Fund.
During the course of the 2015 school year, the School District amended its General Fund budget as needed. The School District uses program-based budgeting and the budgeting systems are designed to tightly control total program budgets but provide flexibility for program management. Transfers from one program to another must be approved by the School Business Administrator, Superintendent and Board of Education. Transfers were necessitated by:
• Staffing changes based on student needs. • Need for additional instructional supplies and equipment. • Changes in appropriations to prevent budget overruns.
For the fiscal year ended June 30, 2015, General Fund budgetary revenues were less than expenditures decreasing budgetary fund balance by $716,058 from the previous year. However, after deducting fund balances restricted, committed and assigned, the unassigned budgetary fund balance increased $111,042 from $1,103,294 atJune 30, 2014 to $1,214,336 at June 30, 2015 the maximum allowed under state regulations.
12
SOUTH PLAINFIELD BOARD OF EDUCATION
CAPITAL ASSETS
Management's Discussion and Analysis Year Ended June 30,2015
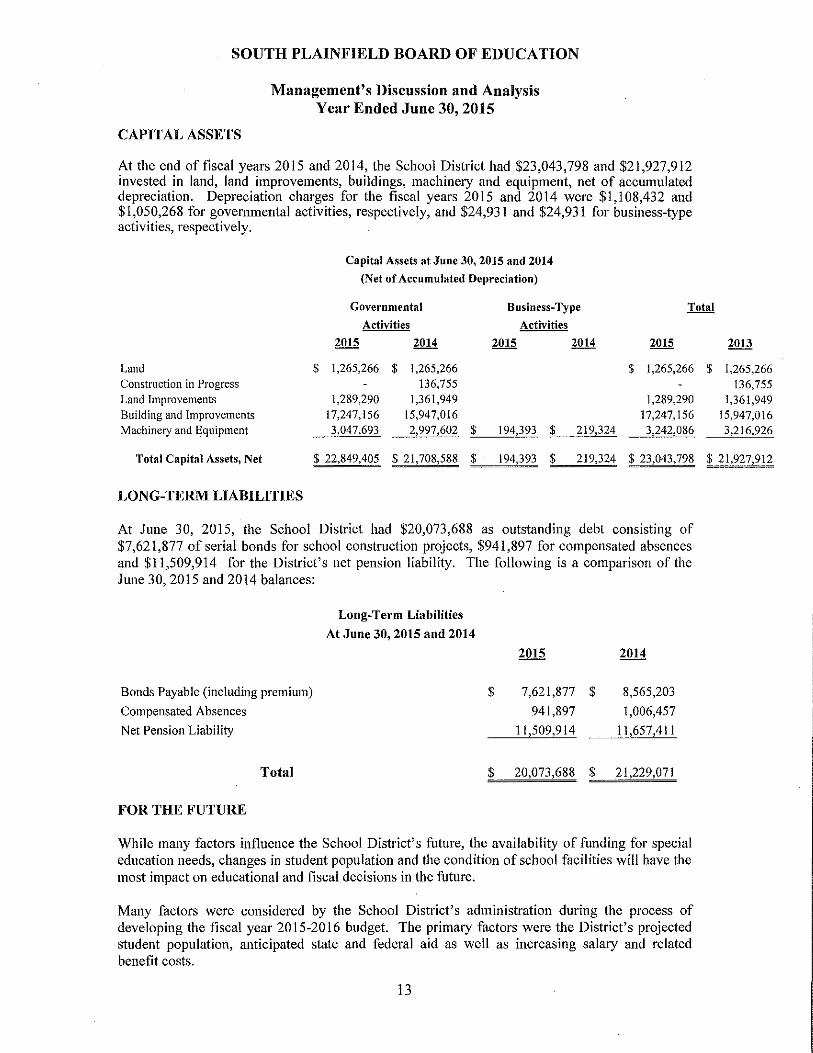
At the end of fiscal years 2015 and 2014, the School District had $23,043,798 and $21,927,912 invested in land, land improvements, buildings, machinery and equipment, net of accumulated depreciation. Depreciation charges for the fiscal years 2015 and 2014 were $1,108,432 and $1,050,268 for governmental activities, respectively, and $24,931 and $24,931 for business-type activities, respectively.
Capital Assets at June 30,2015 and 2014
(Net of Accumulated Depreciation)
Governmental Business-Type Total
Land Construction in Progress Land Improvements Building and Improvements Machinery and Equipment
Total Capital Assets, Net
LONG-TERM LIABILITIES
Activities
2015 2014
$ 1,265,266 $ 1,265,266 136,755
1,289,290 1,361,949 17,247,156 15,947,016 3,047,693 2,997,602
$ 22,849,405 $ 21,708,588
Activities
2015 2014 2015
$ 1,265,266
1,289,290 17,247,156
$ 194,393 $ 219,324 3,242,086
$ 194,393 $ 219,324 $ 23,043,798
At June 30, 2015, the School District had $20,073,688 as outstanding debt consisting of $7,621,877 of serial bonds for school construction projects, $941,897 for compensated absences and $11,509,914 for the District's net pension liability. The following is a comparison of the June 30,2015 and 2014 balances:
Bonds Payable (including premium) Compensated Absences Net Pension Liability
Total
FOR THE FUTURE
Long-Term Liabilities
At June 30, 2015 and 2014
$
$
2015 2014
7,621,877 $ 8,565,203
941,897 1,006,457
11,509,914 11,657,411
20,073,688 $ 21,229,071
While many factors influence the School District's future, the availability of funding for special education needs, changes in student population and the condition of school facilities will have the most impact on educational and fiscal decisions in the future.
Many factors were considered by the School District's administration during the process of developing the fiscal year 2015-2016 budget. The primary factors were the District's projected student population, anticipated state and federal aid as well as increasing salary and related benefit costs.
13
2013
$ 1,265,266 136,755
1,361,949 15,947,016 3,216,926
$ 21,927,912

SOUTH PLAINFIELD BOARD OF EDUCATION
Management's Discussion and Analysis Year Ended June 30,2015
FOR THE FUTURE (Continued)
These indicators were considered when adopting the budget for fiscal year 2015-2016. Budgeted expenditures in the General Fund decreased approximately 3 percent to $55,718,746 for fiscal year 2015-2016.
CONTACTING THE SCHOOL DISTRICT'S FINANCIAL MANAGEMENT
This financial report is designed to provide our citizens, taxpayers, investors and creditors with a general overview of the School District's finances and to show the School District's accountability for the funds it receives. If you have questions on this report or need additional financial information, please contact the School Business Administrator/Board Secretary at South Plainfield Board of Education, 125 Jackson Avenue, South Plainfield, New Jersey 07080.
14

FINANCIAL STATEMENTS
DISTRICT-WIDE FINANCIAL STATEMENTS

SOUTH PLAINFIELD BOARD OF EDUCATION STATEMENT OF NET POSITION
AS OF JUNE 30,2015
Governmental Business-Type Activities Activities
ASSETS
Cash and Cash Equivalents $ 3,986,089 $ 1,471,449 Receivables, Net 1,361,938 106,580 Internal Balances 400,000 (400,000) Inventory 27,903 Capital Assets, Not Being Depreciated 1,265,266 Capital Assets, Being Depreciated, Net 21,584,139 194,393
Total Assets 28,597,432 1,400,325
DEFERRED OUTFLOWS OF RESOURCES
Deferred Amounts on Net Pension Liability 439,477 Deferred Amounts on Refunding of Debt 289,018
Total Deferred Outflows of Resources 728,495
Total Assets and Deferred Outflows of Resources 29,325,927 1,400,325
LIABILITIES
Accounts Payable and Other Current Liabilities 334,877 244,558 Payable to Other Governments 46,248 Unearned Revenue 394,914 10,517 Accrued Interest Payable 150,820 Noncurrent Liabilities
Due Within One Year 1,444,686 Due Beyond One Year 18,629,002
Total Liabilities 21,000,547 255,075
DEFERRED INFLOWS OF RESOURCES
Deferred Amounts on Net Pension Liability 685,928
Deferred Commodities Revenue 6,089
Total Deferred Inflows of Resources 685,928 6,089
Total Liabilities and Defctred Inflows of Resources 21,686,475 261,164
NET POSITION
Net Investment in Capital Assets 15,516,546 194,393 Restricted for:
Capital Projects 1,329,994 Plant Maintenance 449,481 Debt Service 1,176
Unrestricted (9,657,745) 944,768
Total Net Position $ 7,639,452 $ 1,139,161
The accompanying Notes to Financial Statements are an integral part of this statement. 15
EXHIBIT A-1
Total
$ 5,457,538 1,468,518
27,903 1,265,266
21,778,532
29,997,757
439,477 289,018
728,495
30,726,252
579,435 46,248
405,431 150,820
1,444,686 18,629,002
21,255,622
685,928
6,089
692,017
21,947,639
15,710,939
1,329,994 449,481
1,176 (8,712,977)
$ 8,778,613
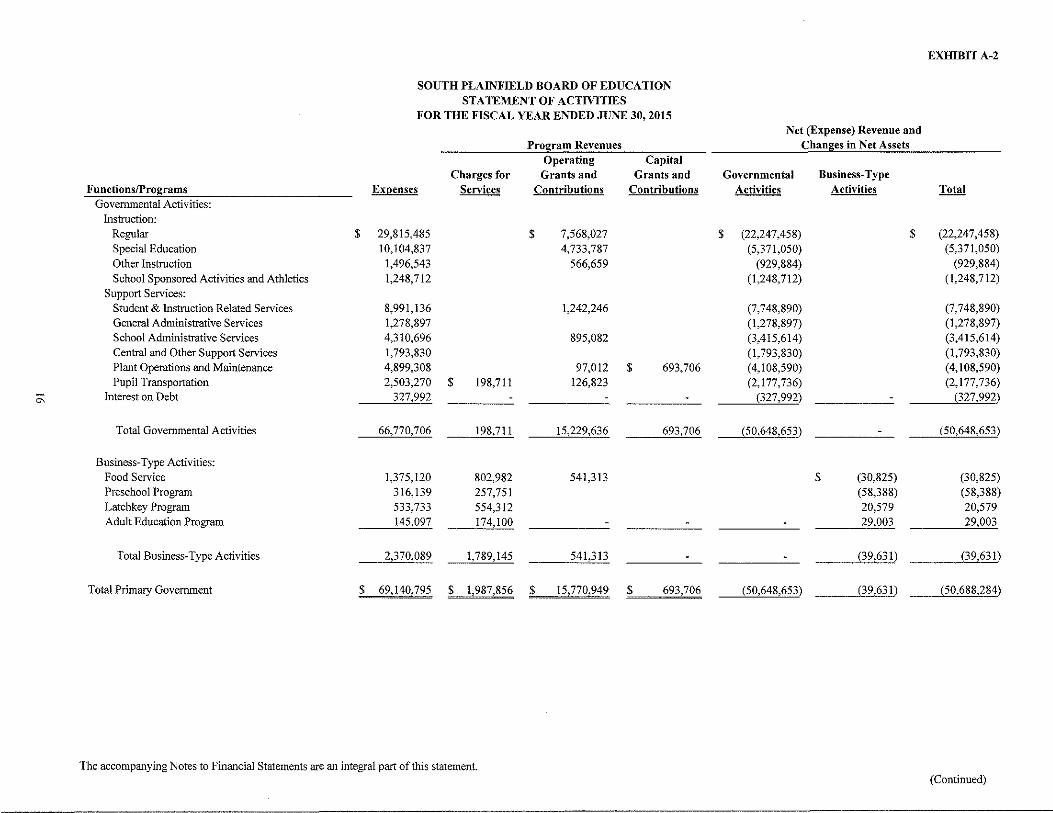
EXHIBIT A-2
SOUTH PLAINFIELD BOARD OF EDUCATION STATEMENT OF ACTIVITIES
FOR THE FISCAL YEAR ENDED JUNE 30, 2015 Net (Expense) Revenue and
Program Revenues Changes in Net Assets Operating Capital
Charges for Grants and Grants and Governmental Business-Type Functions/Programs ExQenses Services (Qntributions Contributions Activities Activities Total
Governmental Activities: Instruction:
Regular $ 29,815,485 $ 7,568,027 $ (22,247,458) $ (22,247,458) Special Education 10,104,837 4,733,787 (5,371,050) (5,371,050)
Other Instruction !,496,543 566,659 (929,884) (929,884) School Sponsored Activities and Athletics !,248,7!2 (1,248,712) (1,248,712)
Support Services: Student & Instruction Related Services 8,99!,!36 !,242,246 (7,748,890) (7,748,890) General Administrative Services !,278,897 (1,278,897) (1,278,897) School Administrative Services 4,3!0,696 895,082 (3,415,614) (3,415,614) Central and Other Support Services 1,793,830 (!, 793,830) (I, 793,830) Plant Operations and Maintenance 4,899,308 97,0!2 $ 693,706 (4,108,590) ( 4, I 08,590) Pupil Transportation 2,503,270 $ !98,711 !26,823 (2,!77,736) (2,!77,736)
o; Interest on Debt 327,992 (327,992) (327,992)
Total Governmental Activities 66,770,706 198,7!1 !5,229,636 693,706 (50,648,653) - (50,648,653)
Business-Type Activities: Food Service !,375,!20 802,982 54!,3!3 $ (30,825) (30,825) Preschool Program 3!6,!39 257,751 (58,388) (58,388) Latchkey Program 533,733 554,3!2 20,579 20,579 Adult Education Program !45,097 174,100 29,003 29,003
Total Business-Type Activities 2,370,089 !,789, !45 541,3!3 (39,631) (39,63!)
Total Primary Government !___£~!40,795 $ 1,987,856 L_ !5,770,949 $ 693,706 (50,648,653) (39"631) ----- (50,688,2~4)
The accompanying Notes to Financial Statements are an integral part of this statement. (Continued)
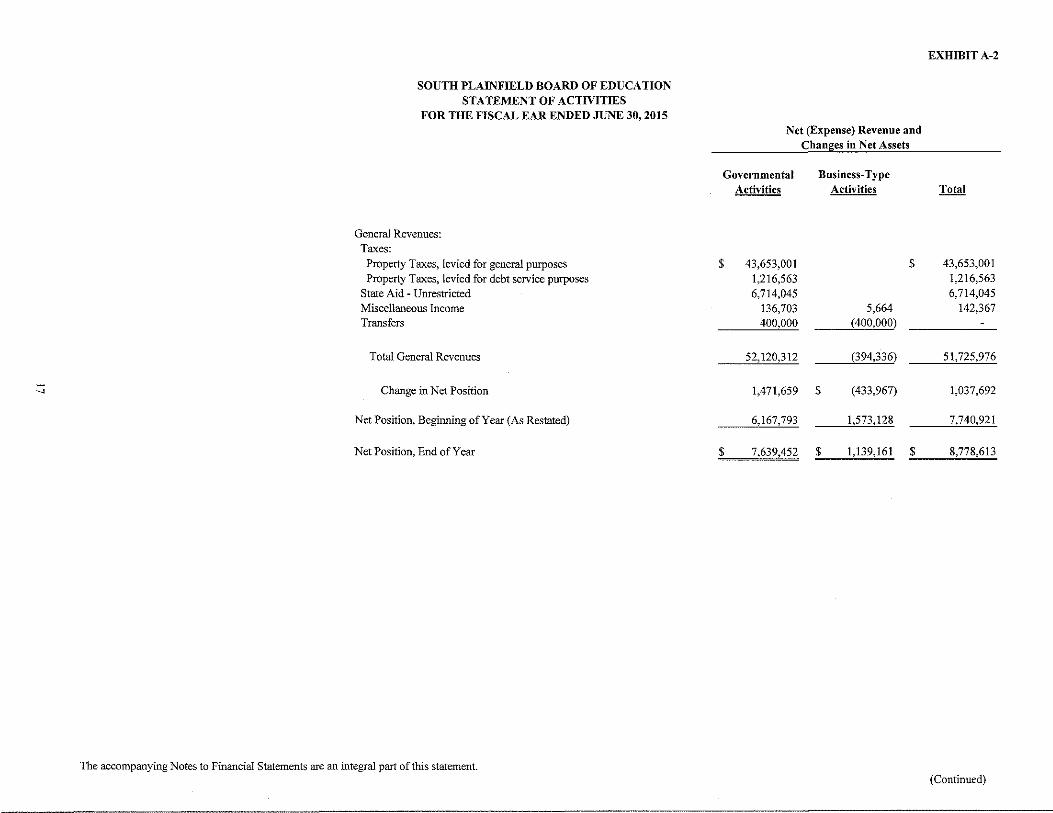
EXHIBIT A-2
SOUTH PLAINFIELD BOARD OF EDUCATION STATEMENT OF ACTIVITIES
FOR THE FISCAL EAR ENDED JUNE 30,2015 Net (Expense) Revenue and
Changes in Net Assets
Governmental Business-Type Activities Activities Total
General Revenues: Taxes:
Property Taxes, levied for general purposes $ 43,653,001 $ 43,653,001
Property Taxes, levied for debt service purposes 1,216,563 1,216,563 State Aid- Unrestricted 6,714,045 6,714,045 Miscellaneous Income 136,703 5,664 142,367 Transfers 400,000 (400,000)
Total General Revenues 52,120,312 (394,336) 51,725,976
_, Change in Net Position 1,471,659 $ (433,967) 1,037,692
Net Position, Beginning of Year (As Restated) 6,167,793 1,573,128 7,740,921
Net Position, End of Year $ 7,639,452 $ 1,139,161 $ 8,778,613
The accompanying Notes to Financial Statements are an integral part of this statement. (Continued)
FUND FINANCIAL STATEMENTS
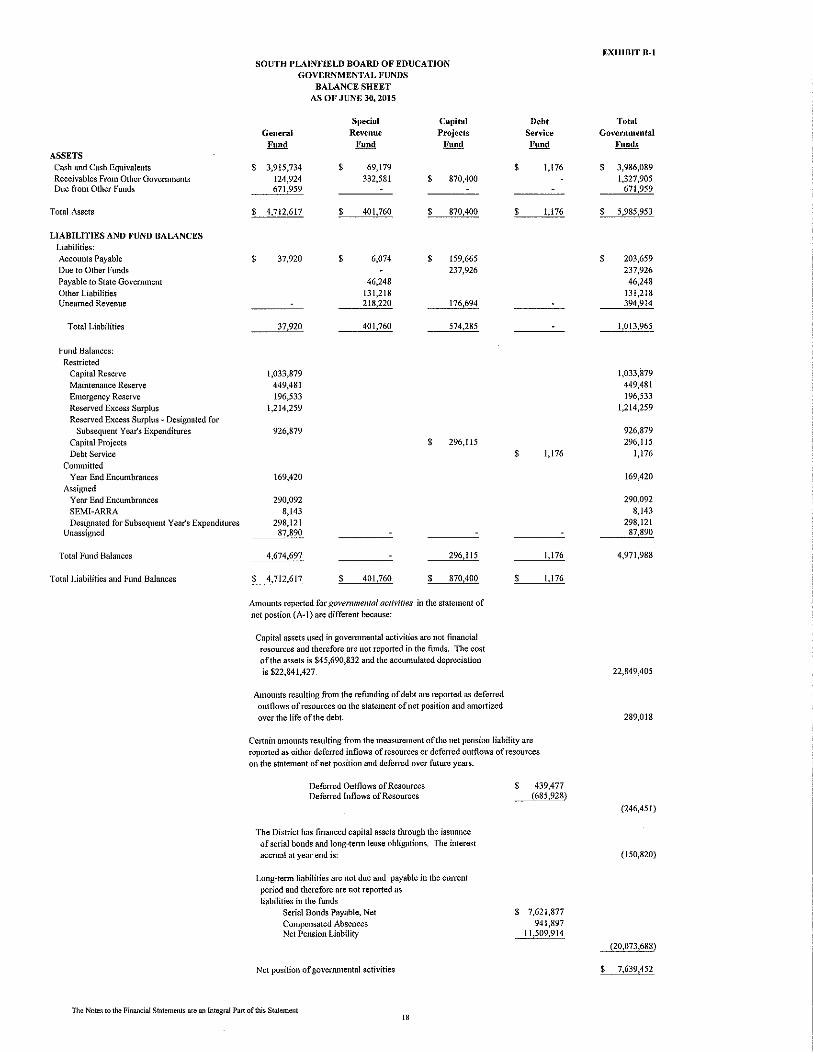
EXHIBIT 8-1 SOUTH PLAINI<'IELD BOARD OF EDUCATION
GOVERNMENTAL FUNDS BALANCE SHEET
AS OF JUNE 30, 2015
S)Jecial Capital Debt Total
General Revenue Projects Service Governmental
Fund Fund Fund Fund Funds ASSETS
Cash and Cash Equivalents $ 3,915,734 $ 69,179 $ 1,176 $ 3,986,089 Receivables From Other Govemments 124,924 332,581 $ 870,400 1,327,905 Due from Other Funds 671,959 671,959
Total Assets $ 4,712,617 $ 401,760 $ 870,400 $ 1,176 $ 5,985,953
LIABILITIES AND FUND BALANCES Liabilities: Accounts Payable $ 37,920 $ 6,074 $ 159,665 $ 203,659 Due to Other Funds 237,926 237,926 Payable to State Government 46,248 46,248 Other Liabilities 131,218 131,218 Unearned Revenue 218,220 176,694 394,914
Total Liabilities 37,920 401,760 574,285 1,013,965
Fund Balances: Restricted
Capital Reserve 1,033,879 1,033,879
Maintenance Reserve 449,481 449,481
Emergency Reserve 196,533 196,533
Reserved Excess Surplus 1,214,259 1,214,259
Reserved Excess Surplus • Designated for Subsequent Year's Expenditures 926,879 926,879
Capital Projects $ 296,l15 296,115
Debt Service $ 1,176 1,176
Committed Year End Encumbrances 169,420 169,420
Assigned Year End Encumbrances 290,092 290,092 SEMI-ARRA 8,143 8,143
Designated for Subsequent Year's Expenditures 298,121 298,121 Unassigned 87,890 87,890
Total Fund Balances 4,674,697 296,115 1,176 4,971,988
Total Liabilities and Fund Balances $ 4,712,617 $ 401,760 $ 870,400 $ 1,176
Amounts reported for governmental aclil>ilies in the statement of net post ion (A-1) are different because:
Capital assets used in governmental activities are not financial resources and therefore are not reported in the funds. The cost ofthe assets is $45,690,832 and the accumulated depreciation
is $22,841,427. 22,849,405
Amounts resulting from the refunding of debt are reported as deferred outflows of resources on the statement of net position and ammti?.cd over the life of the debt. 289,018
Ce1tain amounts resulting from the measurement oftl1e net pension liability are reported as either deferred inflows of resources or deferred outflows of resources on the statement of net position and deferred over future years.
Deferred Outflows of Resources $ 439,477 Deferred Inflows of Resources {685,928)
(246,451)
The District has financed capital assets through the issuance of serial bonds and long-tenn lease obligations. The interest
accrual at year end is: (150,820)
Long-tenn liabilities are not due and payable in the current
period and therefore are not reported as liabilities in the funds
Serial Bonds Payable, Net $ 7,621,877
Compensated Absences 941,897 Net Pension Liability 11,509,914
{20,073,688)
Net position of governmental activities $ 7,639,452
The Notes to the Financial Statements are an Integral Part of this Statement 18
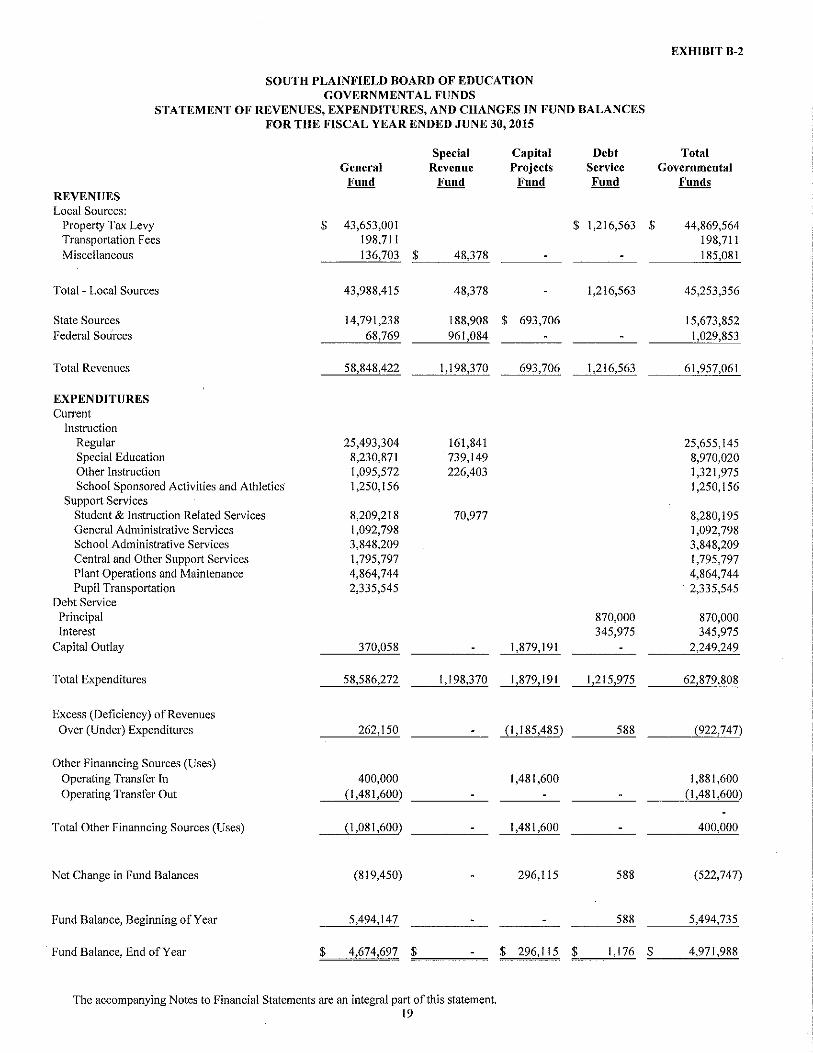
EXHIBIT B-2
SOUTH PLAINFIELD BOARD OF EDUCATION GOVERNMENTAL FUNDS
STATEMENT OF REVENUES, EXPENDITURES, AND CHANGES IN FUND BALANCES FOR THE FISCAL YEAR ENDED JUNE 30, 20I5
Special Capital Debt Total General Revenue Projects Service Governmental
Fund Fund Fund Fund Funds REVENUES Local Sources:
Property Tax Levy $ 43,653,001 $ 1,216,563 $ 44,869,564 Transportation Fees 198,711 198,711 Miscellaneous I 36,703 $ 48,378 I 85,081
Total - Local Sources 43,988,415 48,378 1,216,563 45,253,356
State Sources 14,791,238 188,908 $ 693,706 15,673,852 Federal Sources 68,769 961,084 1,029,853
Total Revenues 58,848,422 1,198,370 693,706 1,216,563 61,957,061
EXPENDITURES Current
Instruction Regular 25,493,304 161,841 25,655,145 Special Education 8,230,871 739,149 8,970,020 Other Instruction 1,095,572 226,403 1,321,975 School Sponsored Activities and Athletics 1,250,156 I ,250,156
Support Services Student & Instruction Related Services 8,209,218 70,977 8,280,195 General Administrative Services 1,092,798 1,092,798 School Administrative Services 3,848,209 3,848,209 Central and Other Support Services 1,795,797 1,795,797 Plant Operations and Maintenance 4,864,744 4,864,744 Pupil Transportation 2,335,545 2,335,545
Debt Service Principal 870,000 870,000 Interest 345,975 345,975
Capital Outlay 370,058 1,879,191 2,249,249
Total Expenditures 58,586,272 1,198,370 1,879,191 1,215,975 62,879,808
Excess (Deficiency) of Revenues Over (Under) Expenditures 262,150 (1,185,485) 588 (922,747)
Other Finanncing Sources (Uses) Operating Transfer In 400,000 1,481,600 I ,881,600 Operating Transfer Out (I ,481 ,600) (1,481,600)
Total Other Finanncing Sources (Uses) (I ,081 ,600) 1,481,600 400,000
Net Change in fund Balances (819,450) 296,115 588 (522,747)
Fund Balance, Beginning of Year 5,494,147 588 5,494,735
Fund Balance, End of Year $ 4,674,697 $ $ 296,115 $ 1,176 $ 4,971,988
The accompanying Notes to Financial Statements are an integral part of this statement. 19

SOUTH l'LAINFIELD BOARD OF EDUCATION RECONCILIATION OF THE STATEMENT OF REVENUES, EXPENDITURES,
AND CHANGES IN FUND BALANCES OF GOVERNMENTAL FUNDS TO THE STATEMENT OF ACTIVITIES
FOR THE FISCAL YEAR ENDED .JliNE 30, 2015
Total net change in fund balances - governmental funds (Exhibit B-2)
Amounts reported for governmental activities in the statement of activities (A-2) are different because:
Capital outlays are reported in governmental funds as expenditures. However, in the statement of activities, the cost of those assets is allocated over their estimated useful lives as depreciation expense. This is the amount by which capital outlays exceeded depreciation in the period.
Capital Outlays Depreciation Expense
Repayment of debt is an expenditure in the governmental funds, but the repayment reduces long-term liabilities in the statement of net position and is not reported in the statement of activities.
Repayment Serial Bond Principal
Govenunental funds report the effect of premiums and other such items related to the refunding bonds when they are issued, whereas these amounts are deferred and amortized in the statement of activities.
Amm1ization of Deferred Amounts on Refunding Amortization of Bond Premiuim
In the statement of activities, interest on long~term debt in the statement of activities is accrued, regardless of when due. In the governmental funds, interest is reported when due. The accrued interest is an addition to the reconciliation.
Decrease in Accrued Interest
In the statement of activities, certain operating expenses, e.g., compensated absences, net pension liabilities are measured by the amounts earned on incurred during the year. In the governmental funds, however, expenditures for these items are reported in the amount of financial resources used (paid). When the earned amount exceeds the paid amount, the difference is a reduction in the reconciliation(~); when the paid amount exceeds the earned amount the difference is an addition to the reconciliation(+).
Decrease in Compensated Absences Increase in Net Pension Liability
Change in net position of governmental activities (Exhibit A-2)
The accompanying Notes to Financial Statements are an integral part of this statement. 20
$ 2,249,249 (1,108,432)
(71,385) 73,326
64,560 (98,954)
EXHIBITB-3
$ (522,747)
1,140,817
870,000
1,941
16,042
(34,394)
$ 1,471,659
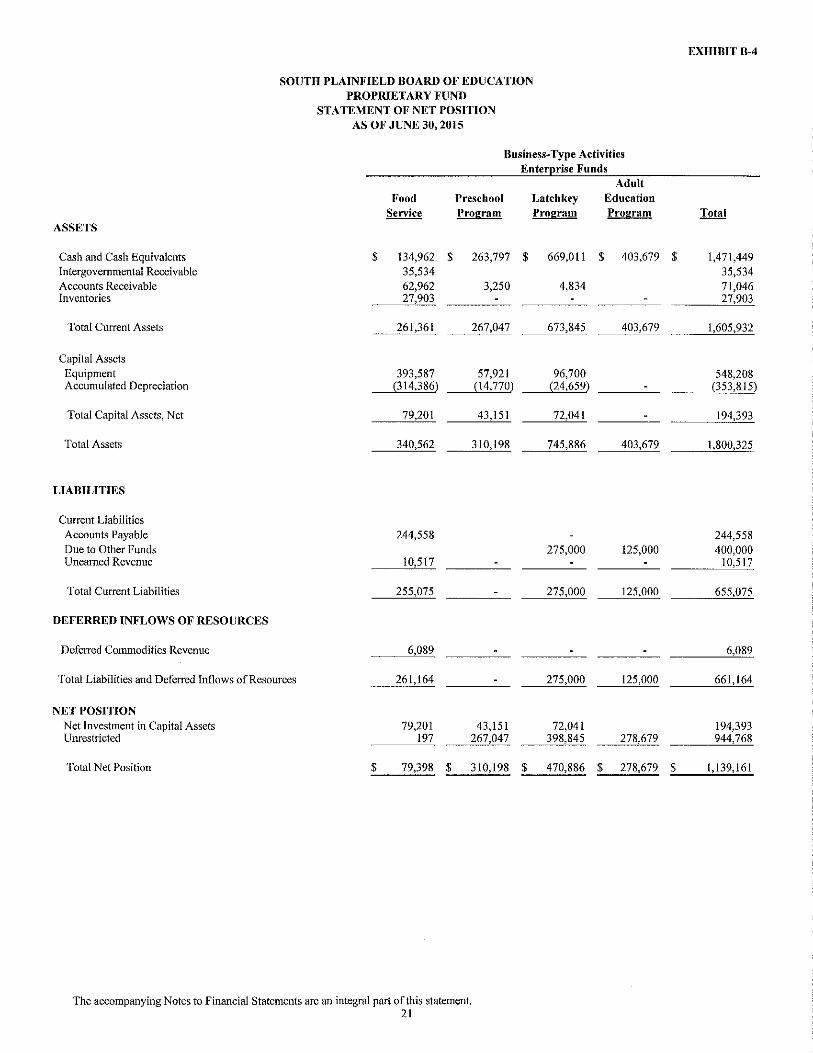
SOUTH PLAIN~'IELD BOARD OF EDUCATION PROPRIETARY FUND
STATEMENT OF NET POSITION AS OF JUNE 30, 2015
Business-Type Activities
Food Preschool Service Program
ASSETS
Cash and Cash Equivalents $ 134,962 $ 263,797 Intergovernmental Receivable 35,534 Accounts Receivable 62,962 3,250 Inventories 27,903
Total Current Assets 261,361 267,047
Capital Assets Equipment 393,587 57,921 Accumulated Depreciation (314,386) (14,770)
Total Capital Assets, Net 79,201 43,151
Total Assets 340,562 310,198
LIABILITIES
Current Liabilities Accounts Payable 244,558 Due to Other Funds Unearned Revenue 10,517
Total Current Liabilities 255,075
DEFERRED INFLOWS OF RESOURCES
Deferred Commodities Revenue 6,089
Total Liabilities and Deferred Inflows of Resources 261,164
NET POSITION Net Investment in Capital Assets 79,201 43,151 Unrestricted 197 267,047
Total Net Position $ 79,398 $ 310,198
The accompanying Notes to Financial Statements arc an integral part of this statement. 21
Enter(!rise Funds Adult
J_,atchl{ey Education Program Program
$ 669,011 $ 403,679
4,834
673,845 403,679
96,700 (24,659)
72,041
745,886 403,679
275,000 125,000
275,000 125,000
275,000 125,000
72,041 398,845 278,679
$ 470,886 $ 278,679
EXHIBIT B-4
Total
$ 1,471,449 35,534 71,046 27,903
1,605,932
548,208 (353,815)
194,393
1,800,325
244,558 400,000
10,517
655,075
6,089
661,164
194,393 944,768
$ 1,139,161

SOUTH PLAINFIELD BOARD OF EDUCATION
PROPRIETARY FUND
COMBINING STATEMENT OF REVENUES, EXPENSES AND
CHANGES IN NET POSITION
FOR THE FISCAL YEAR ENDED JUNE 30, 2015
Business-Type Activities
Food I,reschool
Service Program
OPERATING REVENUES
Local Sources
Daily Sales-Reimbursable Programs
School Lunch Program $ 475,658
School Breakfast Program 19,355
Daily Sales Non-Reimbursable Programs 307,969 Program Fees $ 257,751
Total Operating Revenues 802,982 257,751
OPERATING EXPENSES
Salaries and Benefits 630,328 291,706
Cost of Sales 529,281
Supplies and Materials 95,825 6,236
Management and Administration Fees 107,898
Other Purchased Services 13,274 Depreciation 11,788 4,923
Total Operating Expenses 1,375,120 316 139
Operating Income (Loss) (572,138) (58,388)
Nonoperating Revenues
State Sources
State School Lunch Program 13,728
Federal Sources
School Breakfast Program 36,981
National School Lunch Program 490,604 Interest on Investments 641 1,123
Total Nonoperating Revenues 541,954 I 123
Net Income (Loss) Before Transfers (30,184) (57,265)
Operating Transfers Out
Changes in Net Position (30,184) (57,265)
Total Net Position, Begilllling of Year 109,582 367,463
Total Net Position, End of Year $ 79,398 $ 310,198
The accompanying Notes to Financial Statements are an integral part ofthis statement. 22
Enter~ rise Funds Adult
Latchkey Education
Program Program
$ 554,312 $ 174,100
554,312 174,100
483,903 10,357
11,157 984
30,453 133,756 8,220
533,733 145,097
20,579 29,003
2,462 1,438
2,462 1,438
23,041 30,441
(275,000) (125,000)
(251,959) (94,559)
722,845 373,238
$ 470,886 $ 278,679
EXIllBIT B-5
Total
$ 475,658
19,355
307,969 986 163
1,789,145
1,416,294
529,281
114,202
107,898
177,483 24,931
2,370 089
(580,944)
13,728
36,981
490,604 5,664
546,977
(33,967)
(400,000)
(433,967)
1,573,128
$ 1,139,161
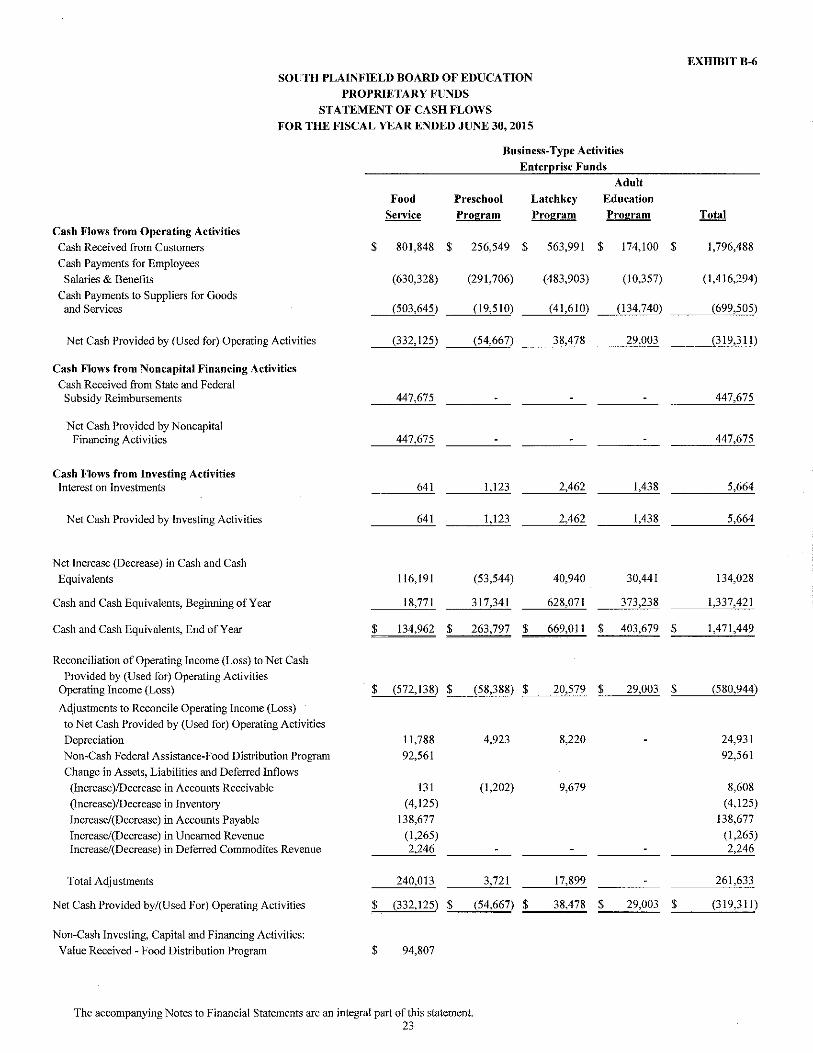
SOUTH PLAINFIELD BOARD OF EDUCATION
PROPRIETARY FUNDS
STATEMENT OF CASH FLOWS
FOR THE FISCAL YEAR ENDED JUNE 30,2015
Business-Type Activities
Enter~ rise Funds Adult
Food Preschool Latchkey Education Service Program Program Program
Cash Flows from Operating Activities Cash Received from Customers $ 801,848 $ 256,549 $ 563,991 $ 174,100
Cash Payments for Employees
Salaries & Benefits (630,328) (291,706) (483,903) (10,357)
Ca'>h Payments to Suppliers for Goods and Services (503,645) (19,51 0) (41,610) (134,740)
Net Cash Provided by (Used for) Operating Activities (332, 125) (54,667) 38,478 29,003
Cash Flows from Noncapital Financing Activities
Cash Received from State and Federal Subsidy Reimbursements 447,675
Net Cash Provided by Noncapital Financing Activities 447,675
Cash Flows from Investing Activities Interest on Investments 641 1,123 2,462 1,438
Net Cash Provided by Investing Activities 641 1,123 2,462 1,438
Net Increase (Decrease) in Cash and Cash
Equivalents 116,191 (53,544) 40,940 30,441
Cash and Cash Equivalents, Beginning of Year 18,771 317,341 628,071 373,238
Cash and Cash Equivalents, End of Year $ 134,962 $ 263,797 $ 669,011 $ 403,679
Reconciliation of Operating Income (Loss) to Net Cash
Provided by (Used for) Operating Activities Operating Income (Loss) $ (572,138) $ (58,388) $ 20,579 $ 29,003
Adjustments to Reconcile Operating Income (Loss)
to Net Cash Provided by (Used for) Operating Activities
Depreciation 11,788
Non-Cash Federal Assistance-Food Distribution Program 92,561
Change in Assets, Liabilities and Deferred Inf1ows
(Increase)/Decrea<>e in Accounts Receivable 131
(lncrea<;e )/Decrease in Inventory (4,125)
Jncrcase/(Decrease) in Accounts Payable 138,677
Increase/(Decrease) in Unearned Revenue (1,265) lncrease/(Decrease) in Deferred Commodites Revenue 2,246
Total Adjustments 240,013
Net Cash Provided by/(Used For) Operating Activities $ (332,125) $
Non-Cash Investing, Capital and Financing Activities:
Value Received - Food Distribution Program $ 94,807
The accompanying Notes to Financial Statements are an integral part of this statement. 23
4,923 8,220
(1,202) 9,679
3,721 17,899
(54,667) $ 38,478 $ 29,003
EXHIBITB-6
Total
$ 1,796,488
(1,416,294)
(699,505)
(319,311)
447,675
447,675
5,664
5,664
134,028
1,337,421
$ 1,471,449
$ (580,944)
24,931
92,561
8,608
(4,125)
138,677
(1 ,265) 2,246
261,633
$ (319,311)

SOUTH PLAINFIELD BOARD OF EDUCATION FIDUCIARY FUNDS
STATEMENT OF FIDUCIARY NET POSITION AS OF JUNE 30, 2015
Unemployment Compensation
Trust Fond
ASSETS Cash and Cash Equivalents $ 641,313
Total Assets $ 641,313
LIABILITIES Intergovenunental Accounts Payable 143 Due to Student Groups Payroll Deductions and Withholdings Accrued Salaries and Wages Due to Other Funds
Total Liabilities 143
NET POSITION Held in Trust for Unemployment Claims $ 641,170
The accompanying Notes to Financial Statements are an integral part of this statement. 24
EXHIBIT B-7
Agency Fond
$ 515,386
$ 515,386
128,915 349,126
3,312 34,033
$ 515,386

SOUTH PLAINFIELD BOARD OF EDUCATION FIDUCIARY FUNDS
STATEMENT OF CHANGES IN FIDUCIARY NET POSITION FOR THE FISCAL YEAR ENDED JUNE 30, 2015
EXHIBITB-8
Unemployment Compensation
Trust Fund ADDITIONS
Contributions District Employee
Total Contributions
Investment Earnings
Total Additions
DEDUCTIONS Unemployment Claims
Total Deductions
Change in Net Position
Net Position, Beginning of Year
Net Position, End of Year
$
$
The accompanying Notes to Financial Statements are an integral part of this statement. 25
1,084 50,210
51,294
2,434
53,728
25,436
25,436
28,292
612 878
641,170
NOTES TO THE FINANCIAL STATEMENTS
SOUTH PLAINFIELD BOARD OF EDUCATION NOTES TO THE FINANCIAL STATEMENTS FOR THE FISCAL YEAR ENDED JUNE 30, 2015
NOTE 1 SUMMARY OF SIGNIFICANT ACCOUNTING POLICIES
A. Reporting Entity
The South Plainfield Board of Education (the "Board" or the "District") is an instrumentality of the State of New Jersey, established to function as an education institution. The Board consists of nine elected officials and is responsible for the fiscal control of the District. A superintendent is appointed by the Board and is responsible for the administrative control of the District. Under existing statutes, the Board's duties and powers include, but are not limited to, the development and adoption of a school program; the establishment, organization and operation of schools; and the acquisition, maintenance and disposition of school property.
The Board also has broad financial responsibilities, including the approval of the annual budget and the establishment of a system of accounting and budgetary controls.
The reporting entity is composed ofthe primary government, component units, and other organizations that are included to ensure that the financial statements of the District are not misleading. The primary government consists of all funds, departments, boards and agencies that are not legally separate from the District. For the South Plainfield Board of Education this includes general operations, food service, preschool, childcare, adult education and student related activities of the District.
Component units are legally separate organizations for which the District is financially accountable. The District is financially accountable for an organization if the District appoints a voting majority of the organization's governing board and (I) the District is able to significantly influence the programs or services performed or provided by the organization; or (2) the District is legally entitled to or can otherwise access the organization's resources; the District is legally obligated or has otherwise assumed the responsibility to finance the deficits of, or provide financial support to, the organization; or the District is obligated for the debt of the organization. Component units may also include organizations that are fiscally dependent on the District in that the District approves the budget, the issuance of debt or the levying of taxes. Based on the foregoing criteria, the District has no component units. Furthermore, the District is not includable in any other reporting entity as a component unit.
B. New Accounting Standards
During fiscal year 2015, the District adopted the following GASB statements:
•
•
GASB 68, Accounting and Financial Reporting for Pensions. The objective of this Statement is to improve accounting and fmancial reporting by state and local governments for pensions. It also improves information provided by state and local governmental employers about financial support for pensions that is provided by other entities. This Statement replaces the requirements of Statement No. 27, Accounting for Pensions by State and Local Governmental Employers, as well as the requirements of Statement No. 50, Pension Disclosures, as they relate to pensions that are provided through pension plans administered as trusts or equivalent arrangements that meet certain criteria.
GASB 71, Pension Transition for Contributions Made Subsequent to the Measurement Date- an amendment of GASB Statement No. 68, should be applied simultaneously with the provisions of Statement No. 68. The objective of this Statement is to address an issue regarding application of the transition provisions of Statement No. 68, Accounting and Financial Reporting for Pensions. The issue relates to amounts associated with contributions, if any, made by a state or local government employer or nonemployer contributing entity to a defined benefit pension plan after the measurement date of the government's beginning net pension liability.
26

SOUTH PLAINFIELD BOARD OF EDUCATION NOTES TO THE FINANCIAL STATEMENTS FOR THE FISCAL YEAR ENDED JUNE 30, 2015
NOTE 1 SUMMARY OF SIGNIFICANT ACCOUNTING POLICIES (Continued)
B. New Accounting Standards (Continued)
Other accounting standards that the District is currently reviewing for applicability and potential impact on the financial statements include:
• GASB 72, Fair Value Measurement and Application, will be effective beginning with the fiscal year ending June 30, 2016. This Statement addresses accounting and financial reporting issues related to fair value measurements. This Statement provides guidance for determining a fair value measurement for financial reporting purposes. This Statement also provides guidance for applying fair value to certain investments and disclosures related to all fair value measurements.
• GASB 73, Accounting and Financial Reporting for Pensions and Related Assets that Are Not Within the Scope of GASB Statement 68, and Amendments to Certain Provisions of GASB Statements 67 and 68, will be effective beginning with the fiscal year ending June 30, 2017. The objective of this Statement is to improve the usefulness of information about pensions included in the general purpose external financial reports of state and local governments for making decisions and assessing accountability.
• GASB 74, Financial Reporting for Postemployment Benefit Plans Other than Pension Plans, will be effective beginning with the fiscal year ending June 30, 2017. The objective of this Statement is to improve the usefulness of information about postemployment benefits other than pensions (other postemployment benefits or OPEB) included in the general purpose external financial reports of state and local governmental OPEB plans for making decisions and assessing accountability.
• GASB 75, Accounting and Financial Reporting for Postemployment Benefits Other Than Pensions, will be effective beginning with the fiscal year ending June 30, 2018. The primary objective of this Statement is to improve accounting and financial reporting by state and local governments for postemployment benefits other than pensions (other postemp1oyment benefits or OPEB). It also improves information provided by state and local governmental employers about financial support for OPEB that is provided by other entities.
• GASB 76, The Hierarchy of Generally Accepted Accounting Principles for State and Local Governments, will be effective beginning with the fiscal year ending June 30, 2016. The objective of this Statement is to identifY- in the context of the current governmental financial reporting environment - the hierarchy of generally accepted accounting principles (GAAP). The "GAAP hierarchy" consists of the sources of accounting principles used to prepare financial statements of state and local governmental entities in conformity with GAAP and the framework for selecting those principles. This Statement reduces the GAAP hierarchy to two categories of authoritative GAAP and addresses the use of authoritative and nonauthoritative literature in the event that the accounting treatment for a transaction or other event is not specified within a source of authoritative GAAP.
C. Basis of Presentation - Financial Statements
The financial statements include both district-wide financial statements (based on the District as a whole) and fund financial statements (based on specific District activities or objectives). Both the district-wide and fund financial statements categorize activities as either governmental activities or business-type activities. While separate district-wide and fund financial statements are presented, they are interrelated. In the district-wide financial statements, the governmental activities column incorporates data from governmental funds, while business-type activities incorporate data from the District's enterprise funds. Fiduciary funds are excluded from the district-wide financial statements.
27

SOUTH PLAINFIELD BOARD OF EDUCATION NOTES TO THE FINANCIAL STATEMENTS FOR THE FISCAL YEAR ENDED JUNE 30, 2015
NOTE 1 SUMMARY OF SIGNIFICANT ACCOUNTING POLICIES (Continued)
C. Basis of Presentation- Financial Statements (Continued)
District-Wide Financial Statements
The district-wide financial statements (i.e., the statement of net position and the statement of activities) report information on all of the nonfiduciary activities of the Board of Education. All fiduciary activities are reported only in the fund financial statements. For the most part, the effect of interfund activity has been removed from these statements. Governmental activities, which normally are supported by property taxes and intergovernmental revenues, are reported separately from business-type activities, which rely to a significant extent on fees and charges for support. In the statement of net position, both the governmental and business-type activities columns (a) are presented on a consolidated basis by column, and (b) reflect on a full accrual economic resource basis, which incorporates long-term assets and receivables as well as long-term debt and obligations.
The statement of activities demonstrates the degree to which the direct expenses of a given function or segment are offset by program revenues. Direct expenses are those that are clearly identifiable with a specific function or segment. Program revenues include 1) charges to customers or other governmental entities, including other school districts, who purchase, use, or directly benefit from goods or services provided by a given function or segment and 2) grants and contributions that are restricted to meeting the operational or capital requirements of a particular function or segment. Property taxes, unrestricted state aid, and other items not properly included among program revenues are reported instead as general revenues.
As a general rule the effect of interfund activity has been eliminated from the district-wide financial statements. Exceptions to this general rule are charges between the Board's proprietary and fiduciary funds since elimination of these charges would distort the direct costs and program revenues reported for the various functions concerned.
Fund Financial Statements
Separate fund financial statements are provided for governmental, proprietary, and fiduciary activities, even though the latter are excluded from tl1e district-wide financial statements. The emphasis of fund financial statements is on major individual governmental and enterprise funds, each reported as separate columns in the fund financial statements. All remaining governmental and enterprise funds are aggregated and reported as nonmajor funds. The District considers all of its governmental and enterprise funds to be major funds.
The District reports the following major governmental funds:
The general fund is the School District's primary operating fund. It accounts for all financial resources of the District, except those to be accounted for in another fund.
The special revenue fund accounts for the proceeds of specific revenue sources legally restricted to expenditures for specified purposes. This fund accounts for federal, state and local financial programs, with the exception of grants for major capital projects and the child nutrition programs.
The capital projects fond accounts for tl1e proceeds from the sale of bonds, lease purchases and other revenues used for the acquisition or construction of capital facilities and other capital assets, other than those financed by the proprietary funds.
The debt service fund accounts for the accumulation of resources that are restricted, committed or assigned for the payment of principal and interest on long-term general obligation debt of governmental funds.
28

SOUTH PLAINFIELD BOARD OF EDUCATION NOTES TO THE FINANCIAL STATEMENTS FOR THE FISCAL YEAR ENDED JUNE 30, 2015
NOTE 1 SUMMARY OF SIGNIFICANT ACCOUNTING POLICIES (Continued)
C. Basis of Presentation- Financial Statements (Continued)
Fund Financial Statements (Continued)
The District reports the following major proprietary funds which are organized to be self-supporting through user charges:
The food service fund accounts for the activities of the school cafeteria, which provides food service to students as well as a Ia carte and catering services for teachers and special events.
The preschool program fund accounts for the activities of the District's preschool program, which provides preschool aged children ("Future Stars Children") living within the District instructional programs during the ten month regular school year.
The latchkey program fund accounts for the activities of the District's latchkey program, which provides before and after school child care for students within the District.
The adult education fund accounts for the activities of the Districts adult education program, which offers adult continuing education and recreational programs throughout the year.
Additionally, the government reports the following fund type:
The fiduciary trust fund is used to account for resources legally held in trust for the state unemployment insurance claims, payroll related activities and student related activities which are supported and controlled by student organizations and clubs. All resources of the fund, including any earnings on invested resources, may be used to support the intended purpose. There is no requirement that any portion of these resources be preserved as capital.
Activity between funds that are representative of lending/borrowing arrangements outstanding at the end of the fiscal year are referred to as either "due to/from other funds" (i.e., the current portion of interfund loans) or "advances to/from other funds" (i.e., the non-current portion of interfund loans). All other outstanding balances between funds are reported as "due to/from other funds". Any residual balances outstanding between the governmental activities and business-type activities are reported in the district-wide financial statements as "internal balances".
Reclassifications
Certain amounts presented in the prior year data may have been reclassified in order to be consistent with the current year's presentation.
29

SOUTH PLAINFIELD BOARD OF EDUCATION NOTES TO THE FINANCIAL STATEMENTS FOR THE FISCAL YEAR ENDED JUNE 30,2015
NOTE 1 SUMMARY OF SIGNIFICANT ACCOUNTING POLICIES (Continued)
D. Measurement Focus and Basis of Accounting
The accounting and financial reporting treatment is determined by the applicable measurement focus and basis of accounting. Measurement focus indicates the type of resources being measured such as current financial resources or economic resources. The basis of accounting indicates the timing of transactions or events for recognition in the financial statements.
The district-wide financial statements are reported using the economic resources measurement focus and the accrual basis of accounting, as are the proprietary fund and fiduciary fund financial statements with the exception of the agency fund which does not have a measurement focus. All assets, all liabilities and all deferred outflows/inflows of resources associated with these operations (with the exception of the fiduciary funds) are included on the Statement of Net Position. Revenues are recorded when earned and expenses are recorded at the time liabilities are incurred, regardless of the timing of related cash flows. Property taxes are recognized as revenues in the year for which they are levied. Grants and similar items are recognized as revenue as soon as all eligibility requirements imposed by the provider have been met.
Governmental fund financial statements are reported using the current financial resources measurement focus and the modified accrual basis of accounting. Revenues are recognized when susceptible to accrual (i.e. when they are both measurable and available). Revenues are considered to be available when they are collectible within the current period or soon enough thereafter to pay liabilities of the current period. For this purpose, the Board considers revenues to be available if they are collected within 60 days after year-end. Expenditures are recorded when a liability is incurred, as under accrual basis of accounting, with the exception of debt service expenditures as well as expenditures related to compensated absences and claims and judgments which are recorded only when payment is due. General capital asset acquisitions are reported as expenditures in govenunental funds. Issuance of long-term debt and acquisitions under capital leases are reported as other financing sources.
Property taxes, transportation fees, unrestricted state aid, and interest associated with the current fiscal period are all considered to be susceptible to accrual and so have been recognized as revenues of the current fiscal period. Entitlements (formula-type grants and aid) are recorded as revenues when all eligibility requirements are met, including any time requirements, and the amount is received during the period or within the availability period for this revenue source. Expenditure-driven grants and similar awards (reimbursement-type grants and awards) are recognized as revenue when the qualifying expenditures have been incurred and all other eligibility requirements imposed by the grantor or provider have been met, and the amount is received during the period or within the availability period for this revenue source. All other revenue items are considered to be measurable and available only when cash is received by the District.
When both restricted and unrestricted resources are available for use, it is the government's policy to use restricted resources first, then unrestricted resources as they are needed.
E. Assets, Liabilities, Deferred Outflows/Inflows of Resources, and Net Position/Fund Balance
1. Cash, Cash Equivalents and Investments
Cash and cash equivalents are considered to be cash on hand, demand deposits, and short-term investments with original maturities of three months or less from the date of acquisition.
Investments are reported at fair value and are limited by N.J.S.A. 18A:20-37.
30

SOUTH PLAINFIELD BOARD OF EDUCATION NOTES TO THE FINANCIAL STATEMENTS FOR THE FISCAL YEAR ENDED JUNE 30, 2015
NOTE 1 SUMMARY OF SIGNIFICANT ACCOUNTING POLICIES (Continued)
E. Assets, Liabilities, Deferred Outflows/Inflows of Resources, and Net Position/Fund Balance (Continued)
2. Receivables
All receivables are reported at their gross value, and where appropriate, are reduced by the estimated portion that is expected to be uncollectible.
3. Inventories
The cost of inventories of the governmental fund types are recorded as expenditures at the time individual inventory items are purchased.
Food Service Fund inventories, exclusive of the federal commodities, are valued at cost, using the first-in first-out (FIFO) method and consist of food and expendable supplies. The cost of such inventories is recorded as expenses when consumed rather than when purchased. The United States Department of Agriculture (USDA) commodity portion of the Food Service Fund inventory consists of food donated by the USDA. It is valued at estimated market prices by the USDA. The amount of unused commodities at year-end is reported as deferred inflows of resources.
4. Capital Assets
Capital assets, which include property, plant and equipment, are reported in the applicable governmental or business-type activities columns in the district-wide financial statements. Capital assets are defined by the Board as assets with an initial, individual cost of $2,000 and an estimated useful life in excess of two years. The District was able to estimate the historical cost for the initial reporting of these capital assets through back trending. As the District constructs or acquires additional capital assets each period, they are capitalized and reported at historical cost. Donated capital assets are recorded at estimated fair market value at the date of donation. The costs of normal maintenance and repairs that do not add to the value of the asset or materially extend its useful life are not capitalized.
Major outlays for capital assets and improvements are capitalized as projects are constructed. Interest incurred during the construction phase of capital assets of business-type activities is included as part of the capitalized value of the assets constructed.
Land and construction in progress are not depreciated. The other property, plant, and equipment of the District is depreciated using the straight line method over the following estimated useful lives:
Land hnprovements Buildings and Building Improvements Machinery and Equipment
31
10-20 20-50 5-10

SOUTH PLAINFIELD BOARD OF EDUCATION NOTES TO THE FINANCIAL STATEMENTS FOR THE FISCAL YEAR ENDED JUNE 30, 2015
NOTE 1 SUMMARY OF SIGNIFICANT ACCOUNTING POLICIES (Continued)
E. Assets, Liabilities, Deferred Outflows/Inflows of Resources, and Net Position/Fund Balance (Continued)
5. Deferred Outjlowsllnjlows of Resources
In addition to assets, the statement of fmancial position will sometimes report a separate section for deferred outflows of resources. This separate financial statement element, deferred outflows of resources, represents a consumption of net position that applies to a future period(s) and so will not be recognized as an outflow of resources (expense/expenditure) until then. The government has two items which arise only under the accrual basis of accounting that qualifY for reporting in this category. One item is the deferred amounts on refunding of debt which results from the loss on a debt refunding reported in the district-wide statement of net position. Deferred amounts on debt refunding result from the loss on the transaction when the debt's reacquisition price is greater than the carrying value of the refunded debt. These amounts are deferred and amortized over the shorter of the life of the refunded or refunding debt. The other item that qualifies for reporting in this category is the deferred amounts on net pension liability. Deferred amounts on net pension liability are reported in the district-wide statement of net position and result from: (1) differences between expected and actual experience; (2) changes in assumptions; (3) net difference between projected and actual investment earnings on pension plan investments; ( 4) changes in proportion and differences between employer contributions and proportionate share of contributions; and (5) contributions made subsequent to the measurement date. These amounts are deferred and amortized over future years.
In addition to liabilities, the statement of financial position will sometimes report a separate section for deferred inflows of resources. This separate financial statement element, deferred inflows of resources, represents an acquisition of net position that applies to a future period(s) and so will not be recognized as an inflow of resources (revenue) until that time. The government has two types of items, which arise only under the accrual basis of accounting that qualifY for reporting in this category. One item that qualifies for reporting in this category are the deferred amounts on net pension liability. Deferred amounts on net pension liability are reported in the district-wide statement of net position and result from: (1) differences between expected and actual experience; (2) changes in assumptions; (3) net difference between projected and actual investment earnings on pension plan investments; and (4) changes in proportion and differences between employer contributions and proportionate share of contributions. These amounts are deferred and amortized over future years. The other item that qualifies for reporting in this category is the deferred commodities revenue, reported in both the district-wide and the proprietary funds statements of net position. The deferred commodities revenue represents the estimated market value of the donated and unused Federal commodities at year end. This amount is deferred and recognized as an inflow of resources in the period the commodities are consumed.
6. Compensated Absences
It is the District's policy to permit employees to accumulate (with certain restrictions) earned but unused vacation and sick leave benefits. A long-term liability of accumulated vacation and sick leave and salary related payments has been recorded in the governmental activities in the district-wide financial statements, representing the Board's commitment to fund such costs from future operations. Proprietary Funds accrue accumulated vacation and sick leave and salary related payments in the period that they are earned. A liability is reported in the governmental funds only to the amount actually due at year end as a result of employee resignations and retirements.
32
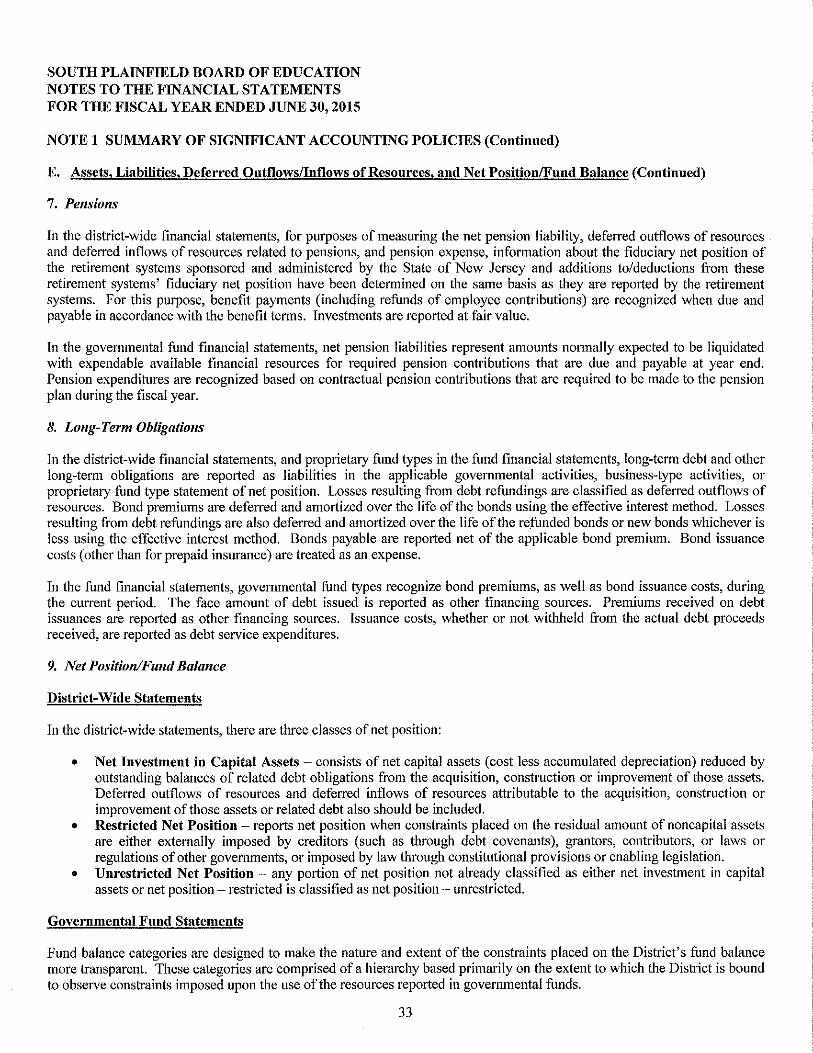
SOUTH PLAINFIELD BOARD OF EDUCATION NOTES TO THE FINANCIAL STATEMENTS FOR THE FISCAL YEAR ENDED JUNE 30, 2015
NOTE 1 SUMMARY OF SIGNIFICANT ACCOUNTING POLICIES (Continued)
E. Assets, Liabilities, Deferred Outflows/Inflows of Resources, and Net Position/Fund Balance (Continued)
7. Pensions
In the district-wide financial statements, for purposes of measuring the net pension liability, deferred outflows of resources and deferred inflows of resources related to pensions, and pension expense, information about the fiduciary net position of the retirement systems sponsored and administered by the State of New Jersey and additions to/deductions from these retirement systems' fiduciary net position have been determined on the same basis as they are reported by the retirement systems. For this purpose, benefit payments (including refunds of employee contributions) are recognized when due and payable in accordance with the benefit terms. Investments are reported at fair value.
In the governmental fund financial statements, net pension liabilities represent amounts normally expected to be liquidated with expendable available financial resources for required pension contributions that are due and payable at year end. Pension expenditures are recognized based on contractual pension contributions that are required to be made to the pension plan during the fiscal year.
8. Long-Term Obligations
In the district-wide financial statements, and proprietary fund types in the fund financial statements, long-term debt and other long-term obligations are reported as liabilities in the applicable governmental activities, business-type activities, or proprietary fund type statement of net position. Losses resulting from debt refundings are classified as deferred outflows of resources. Bond premiums are deferred and amortized over the life of the bonds using the effective interest method. Losses resulting from debt refundings are also deferred and amortized over the life of the refunded bonds or new bonds whichever is Jess using the effective interest method. Bonds payable are reported net of the applicable bond premium. Bond issuance costs (other than for prepaid insurance) are treated as an expense.
In the fund financial statements, governmental fund types recognize bond premiums, as well as bond issuance costs, during the current period. The face amount of debt issued is reported as other financing sources. Premiums received on debt issuances are reported as other financing sources. Issuance costs, whether or not withheld from the actual debt proceeds received, are reported as debt service expenditures.
9. Net Position/Fund Balance
District-Wide Statements
In the district-wide statements, there are three classes of net position:
• Net Investment in Capital Assets- consists of net capital assets (cost Jess accumulated depreciation) reduced by outstanding balances of related debt obligations from the acquisition, construction or improvement of those assets. Deferred outflows of resources and deferred inflows of resources attributable to the acquisition, construction or improvement of those assets or related debt also should be included.
• Restricted Net Position - reports net position when constraints placed on the residual amount of non capital assets are either externally imposed by creditors (such as through debt covenants), grantors, contributors, or laws or regulations of other governments, or imposed by law through constitutional provisions or enabling legislation.
• Unrestricted Net Position - any portion of net position not already classified as either net investment in capital assets or net position- restricted is classified as net position- unrestricted.
Governmental Fund Statements
Fund balance categories are designed to make the nature and extent of the constraints placed on the District's fund balance more transparent. These categories are comprised of a hierarchy based primarily on the extent to which the District is bound to observe constraints imposed upon the use of the resources reported in governmental funds.
33

SOUTH PLAINFIELD BOARD OF EDUCATION NOTES TO THE FINANCIAL STATEMENTS FOR THE FISCAL YEAR ENDED JUNE 30, 2015
NOTE 1 SUMMARY OF SIGNIFICANT ACCOUNTING POLICIES (Continued)
E. Assets, Liabilities, Deferred Outflows/Inflows of Resources, and Net Position/Fund Balance (Continued)
9. Net Position/Fund Balance (Continued)
Governmental Fund Statements (Continued)
Restricted Fund Balance- Amounts constrained to specific purposes by their providers (such as grantors, bondholders, and higher levels of government), through constitutional provisions, or by enabling legislation.
Capital Reserve- This restriction was created by the District in accordance with NJAC 6A:23A-14.1 to fund future capital expenditures (See Note 2.)
Maintenance Reserve - This restriction was created by the Board in accordance with NJAC 6A:23A-14.2 to accumulate funds for the required maintenance of school facilities in accordance with the EFCA (NJSA 18A:7G-9) for a thorough and efficient education. (See Note 2.)
Emergency Reserve- This restriction was created in accordance with NJAC 6A:23A-14.4(A)1 to accumulate funds in accordance with State statute to finance unanticipated general fund expenditures required for a thorough and efficient education. (See Note 2.)
Reserved Excess Surplus- This restriction was created in accordance with NJSA 18A:7F-7 to represent the June 30, 2015 audited excess surplus that is required to be appropriated in the 2016/2017 original budget certified for taxes.
Reserved Excess Surplus - Designated for Subsequent Year's Expenditures - This restriction was created in accordance with NJSA 18A:7F-7 to represent the June 30, 2014 audited excess surplus that was appropriated in the 2015/20 16 original budget certified for taxes.
Capital Projects - Represents fund balance restricted specifically for capital acquisitions and improvements in the Capital Projects Fund.
Debt Service - Represents fund balance restricted specifically for the repayment of long-term debt principal and interest in the Debt Service Fund.
Committed Fund Balance - Amounts constrained to specific purposes by a government itself, using its highest level of decision-making authority; to be reported as committed, amounts cannot be used for any other purpose unless the government takes the same highest level action to remove or change the constraint.
Year-End Encumbrances- Represents outstanding purchase orders at year end for contracts awarded by formal action of the Board of Trustee's for specific purposes from available resources of the current year for which the goods and materials have not yet been received or the services have not yet been rendered at June 30.
34

SOUTH PLAINFIELD BOARD OF EDUCATION NOTES TO THE FINANCIAL STATEMENTS FOR THE FISCAL YEAR ENDED JUNE 30, 2015
NOTE 1 SUMMARY OF SIGNIFICANT ACCOUNTING POLICIES (Continued)
E. Assets, Liabilities, Deferred Outflows/Inflows of Resources, and Net Position/Fund Balance (Continued)
9. Net Position/Fund Balance (Continued)
Governmental Fund Statements (Continued)
Assigned Fund Balance - Amounts a government intends to use for a specific purpose; intent can be expressed by the governing body or by an official or body to which the governing body delegates the authority.
Year-End Encumbrances - Represent outstanding purchase orders for goods or services approved by management for specific purposes from available resources of the current year for which the goods and materials have not yet been received or the services have not yet been rendered at June 30.
ARRA/SEMI- This designation was created to dedicate the portion of the ARRA/SEMI revenue that is unexpended at June 30, 2015 that will be appropriated either by Board resolution iuto the 2015/2016 budget or in the adopted 2016/2017 budget certified for taxes.
Designated for Subsequent Year's Expenditures - This designation was created to dedicate the portion of fund balance appropriated in the adopted 2015/2016 District budget certified for taxes.
Unassigned Fund Balance - Represents fund balance that has not been restricted, committed or assigned to specific purposes within the governmental funds.
F. Revenues and Expenditures/Expenses
1. Program Revenues
Amounts reported as program revenues in the district-wide statement of activities include I) charges to customers or applicants for goods or services, provided, 2) operating grants and contributions, and 3) capital grants and contributions. Internally dedicated resources are reported as general revenues rather than as program revenues. Likewise, general revenues include all property taxes, unrestricted state aid, investment earnings and miscellaneous revenues.
2. Property Taxes
Property taxes are levied pursuant to law and are collected by the municipality and are transferred to the District as requested. Property tax revenues are recognized in the year they are levied and become available. Property taxes collected in advance of the year-end for which they are levied and transferred to the District are reported as deferred inflows of resources. The tax bills are mailed rumually in June by the municipal tax collector and are levied and due in four quarterly installments on August I, November 1, February 1 and May 1 of the fiscal year. When unpaid, taxes or any other municipal lien, or part thereof, on real property, remains in arrears on April 1 '' in the year following the calendar year levy when the same became iu arrears, the tax collector of the municipality shall, subject to the provisions of New Jersey Statute, enforce the lien by placing the property on a tax sale. The municipality may institute annual "in rem" tax foreclosure proceedings to enforce the tax collection or acquisition of title to the property.
35

SOUTH PLAINFIELD BOARD OF EDUCATION NOTES TO THE FINANCIAL STATEMENTS FOR THE FISCAL YEAR ENDED JUNE 30, 2015
NOTE 1 SUMMARY OF SIGNIFICANT ACCOUNTING POLICIES (Continued)
F. Revenues and Expenditures/Expenses (Continued)
3. Tuition Revenues and Expenditures
Tuition Revenues - Tuition charges were established by the Board of Education based on estimated costs. The charges are subject to adjustment when the final costs are determined and certified by the State Department of Education.
Tuition Expenditures- Tuition charges for the fiscal years 2013-2014 and 2014-2015 were based on rates established by the receiving district. These rates are subject to change when the actual costs have been certified by the State Department of Education.
4. Proprietary Funds, Operating and Non-Operating Revenues and Expenses
Proprietary funds distinguish operating revenues and expenses from nonoperating items. Operating revenues and expenses generally result from providing services and producing and delivering goods in connection with a proprietary fund's principal ongoing operations. The principal operating revenues of the food service, preschool, latchkey and adult education enterprise funds are charges to customers for sales and services. Operating expenses for enterprise funds include the cost of sales and services, administrative expenses, and depreciation on capital assets. All revenues and expenses not meeting this definition are reported as nonoperating revenues and expenses. Federal and State subsidies for the food service operation are considered nonoperating revenues.
NOTE 2 STEWARDSHIP, COMPLIANCE AND ACCOUNTABILITY
A. Budgetary Information
In accordance with the requirements of the New Jersey Department of Education ("the Department"), the District annually prepares its operating budget for the forthcoming year. The budget, except for the general fund and special revenue fund, which is more fully explained below and in the notes to the required supplementary information, is prepared in accordance with accounting principles generally accepted in the United States of America and serves as a formal plan for expenditures and the proposed means for financing them.
The annual budget is adopted in the spring of the preceding year for the general, special revenue and debt service funds. The District is not required to adopt an annual budget for the capital projects fund. The budget is submitted to the county superintendent for review and approval prior to adoption. Prior to the 2012/2013 budget year, the annual budget was required to be voted upon at the annual school election held on the third Tuesday in April. On January 17, 2012, Chapter 202 of the Laws ofP.L. 2011 was approved which established procedures for moving the date of a school district's annual school election from April to the general election in November. Under the new law, districts that have their school board members elected in November no longer have to submit their budgets that meet levy cap requirements for voter approval beginning with the 2012/2013 budget year. Only a school board decision to exceed the tax levy cap would require voter approval for the additional amount on the November ballot. On January 18,2012, the Board adopted a resolution to move its annual election to the date of the general elections in accordance with the law; therefore voter approval of the annual budget is not required.
36
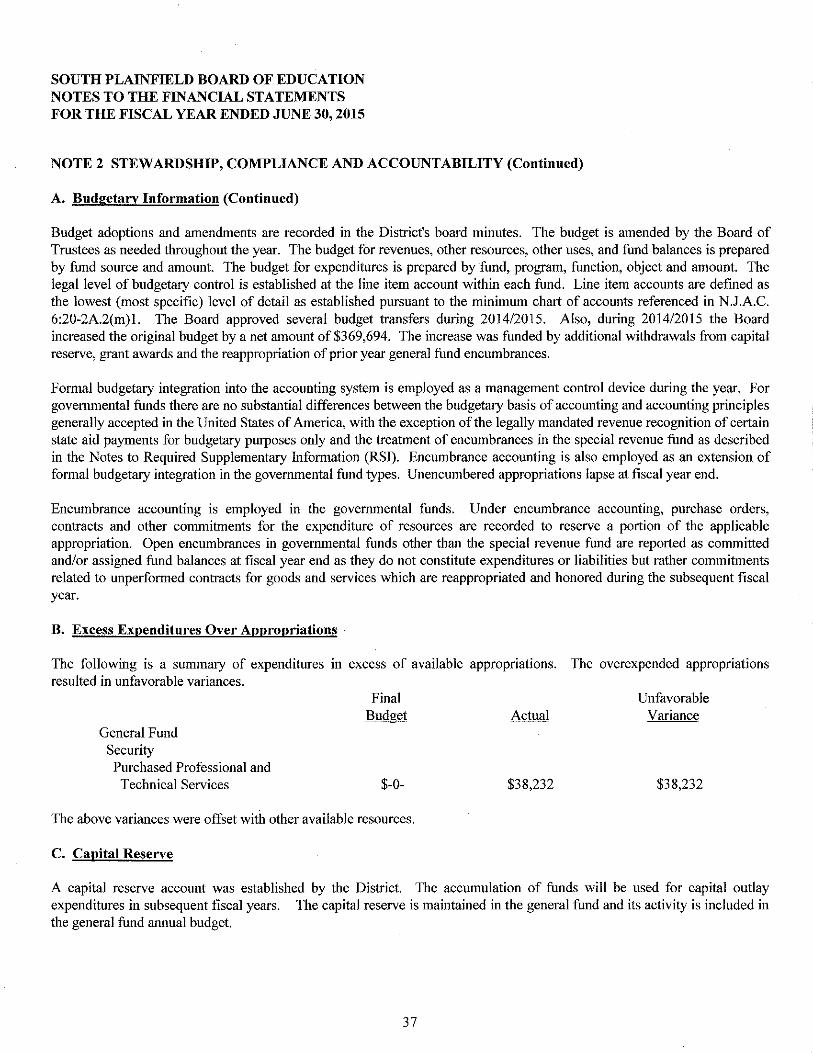
SOUTH PLAINFIELD BOARD OF EDUCATION NOTES TO THE FINANCIAL STATEMENTS FOR THE FISCAL YEAR ENDED JUNE 30, 2015
NOTE 2 STEWARDSHIP, COMPLIANCE AND ACCOUNTABILITY (Continued)
A. Budgetary Information (Continued)
Budget adoptions and amendments are recorded in the District's board minutes. The budget is amended by the Board of Trustees as needed throughout the year. The budget for revenues, other resources, other uses, and fund balances is prepared by fund source and amount. The budget for expenditures is prepared by fund, program, function, object and amount. The legal level of budgetary control is established at the line item account within each fund. Line item accounts are defined as the lowest (most specific) level of detail as established pursuant to the minimum chart of accounts referenced in N.J.A.C. 6:20-2A.2(m)l. The Board approved several budget transfers during 2014/2015. Also, during 2014/2015 the Board increased the original budget by a net amount of $369,694. The increase was funded by additional withdrawals from capital reserve, grant awards and the reappropriation of prior year general fund encumbrances.
Formal budgetary integration into the accounting system is employed as a management control device during the year. For governmental funds there are no substantial differences between the budgetary basis of accounting and accounting principles generally accepted in the United States of America, with the exception of the legally mandated revenue recognition of certain state aid payments for budgetary purposes only and the treatment of encumbrances in the special revenue fund as described in the Notes to Required Supplementary Information (RSJ). Encumbrance accounting is also employed as an extension of formal budgetary integration in the governmental fund types. Unencumbered appropriations lapse at fiscal year end.
Encumbrance accounting is employed in the governmental funds. Under encumbrance accounting, purchase orders, contracts and other commitments for the expenditure of resources are recorded to reserve a portion of the applicable appropriation. Open encumbrances in governmental funds other than the special revenue fund are reported as committed and/or assigned fund balances at fiscal year end as they do not constitute expenditures or liabilities but rather commitments related to unperformed contracts for goods and services which are reappropriated and honored during the subsequent fiscal year.
B. Excess Expenditures Over Appropriations ·
The following is a summary of expenditures in excess of available appropriations. The overexpended appropriations resulted in unfavorable variances.
General Fund Security Purchased Professional and
Technical Services
Final Budget
$-0-
The above variances were offset with other available resources.
C. Capital Reserve
$38,232
Unfavorable Variance
$38,232
A capital reserve account was established by the District. The accumulation of funds will be used for capital outlay expenditures in subsequent fiscal years. The capital reserve is maintained in the general fund and its activity is included in the general fund annual budget.
37

SOUTH PLAINFIELD BOARD OF EDUCATION NOTES TO THE FINANCIAL STATEMENTS FOR THE FISCAL YEAR ENDED JUNE 30, 2015
NOTE 2 STEWARDSHIP, COMPLIANCE AND ACCOUNTABILITY (Continued)
C. Capital Reserve (Continued)
Funds placed in the capital reserve are restricted to capital projects in the district's approved Long Range Facilities Plan (LRFP). Upon submission of the LRFP to the Department, a district may increase the balance in the capital reserve by appropriating funds in the annual general fund budget certified for taxes or by transfer by board resolution at year end of any unanticipated revenue or unexpended line-item appropriation amounts or both. A district may also appropriate additional amounts when the express approval of the voters has been obtained either by a separate proposal at budget time or by a special question at one of the four special elections authorized pursuant to N.J.S.A. 19:60-2. Pursuant to N.J.A.C. 6:23A-14.l(g), the balance in the reserve carmot at any time exceed the local support costs of uncompleted capital projects in its approved LRFP.
The activity of the capital reserve for the fiscal year ended June 30, 2015 is as follows:
Balance, July I, 2014
Increased by: Deposit Approved by Board Resolution
Withdrawals Approved by Board Resolution
Approved in District Budget
Balance, June 30, 2015
$ 2,098,479
500,000
2,598,479
$ 259,000 1,305,600
1,564,600
$ 1,033,879
The withdrawals from the capital reserve were for use in department approved facilities projects consistent with the District's Long Range Facilities Plan.
D. Maintenance Reserve
A maintenance reserve account was established by the District. The accumulation of funds will be used for required maintenance of school facilities expenditures in subsequent fiscal years. The maintenance reserve is maintained in the General Fund and its activity is included in the General Fund armual budget.
Funds placed in the maintenance reserve are restricted to required maintenance activities for a school facility as reported in the comprehensive maintenance plan. A District may appropriate funds into the maintenance reserve in the annual General Fund budget certified for taxes or by transfer by board resolution at year end of any unanticipated revenue or unexpended line item appropriation amounts or both. Pursuant to N.J.A.C. 6A:23A-14.2(g), the balance in the reserve cannot at any time exceed four percent of the replacement cost of the school district's school facilities for the current year.
38

SOUTH PLAINFIELD BOARD OF EDUCATION NOTES TO THE FINANCIAL STATEMENTS FOR THE FISCAL YEAR ENDED JUNE 30, 2015
NOTE 2 STEWARDSHIP, COMPLIANCE AND ACCOUNTABILITY (Continued)
D. Maintenance Reserve
The activity of the maintenance reserve for the fiscal year ended June 30, 2015 is as follows:
Balance, July 1, 2014 $ 449,481
Balance, June 30,2015 $ 449,481
E. Emergency Reserve
An emergency reserve account was established by the District. The accumulation of funds will be used to finance unanticipated General Fund current expenditures required for a thorough and efficient education in subsequent fiscal years.
Funds placed in the emergency reserve are restricted to finance reasonably unforeseeable costs and shall not include additional costs due to poor planning. A District may appropriate funds into the emergency reserve in the annual General Fund budget certified for taxes or by transfer by board resolution at year end of any unanticipated revenue or unexpended line item appropriation amounts or both. Withdrawals from the reserve require the approval of the Commissioner unless the withdrawal is necessary to meet an increase in total health care costs in excess of four percent. Pursuant to NJAC 6A:23A-14.4(A), the balance in the reserve cannot at any time exceed the greater of $250,000 or one percent of the school district's General Fund budget as certified for taxes up to a maximum of $1,000,000.
The activity of the emergency reserve for the fiscal year ended June 30,2015 is as follows:
Balance, July I, 2014 $ 196,533
Balance, June 30,2015 $ 196,533
F. Calculation of Excess Surplus
In accordance with N.J.S.A. 18A:7F-7, as amended, the restricted fund balance for Reserved Excess Surplus is a required calculation pursuant to the New Jersey Comprehensive Educational Improvement and Financing Act of 1996 (CEIFA). New Jersey school districts are required to reserve General Fund fund balance in excess of 2% of budget expenditures at the fiscal year end of June 30 if they did not appropriate a required minimum amount as budgeted fund balance in their subsequent year's budget. The excess fund balance at June 30, 2015 is $2,141,138. Of this amount, $926,879 was designated and appropriated in the 2015/2016 original budget certified for taxes and the remaining amount of $1,214,259 will be appropriated in the 2016/2017 original budget certified for taxes.
39
SOUTH PLAINFIELD BOARD OF EDUCATION NOTES TO THE FINANCIAL STATEMENTS FOR THE FISCAL YEAR ENDED JUNE 30, 2015
NOTE 3 DETAILED NOTES ON ALL FUNDS
A. Cash Deposits and Investments
Cash Deposits
The Board's deposits are insured through either the Federal Deposit Insurance Corporation (FDIC), Securities Investor Protection Corporation (SlPC) or New Jersey's Governmental Unit Deposit Protection Act (GUDPA). The Board is required to deposit their funds in a depository which is protecting such funds pursuant to GUDPA. The New Jersey Governmental Unit Deposit Protection Act requires all banks doing business in the State of New Jersey to pledge collateral equal to at least 5% of the average amount of its public deposits and 100% of the average amount of its public funds in excess of the lesser of 75% of its capital funds or $200 million for all deposits not covered by the FDIC.
Bank balances are insured up to $250,000 in the aggregate by the FDIC for each bank. SIPC replaces cash claims up to a maximum of $250,000 for each failed brokerage firm. At June 30, 2015, the book value of the Board's deposits were $6,614,237 and bank and brokerage firm balances of the Board's deposits amounted to $9,805,406. The Board's deposits which are displayed on the various fund balance sheets as "cash and cash equivalents" are categorized as:
Insured $
Fair Value
9,805,406
Custodial Credit Risk - Deposits - Custodial credit risk is the risk that in the event of a bank failure, the government's deposits may not be returned to it. The Board does not have a policy for custodial credit risk. As of June 30,2015 none of the Board's bank balances were exposed to custodial credit risk.
Investments
The Board is permitted to invest public funds in accordance with the types of securities authorized by N.J.S.A. 18A:20-37. Examples of the allowable investments are bonds or other obligations of the United States or obligations guaranteed by the United States of America, Government Money Market Mutual Funds, bonds or other obligations of the school district or bonds or other obligations of the local unit or units within which the school district is located, Local Government investment pools, and agreements or the repurchase of fully collateralized securities, if transacted in accordance with the above statute.
As of June 30, 2015, the Board had no outstanding investments.
Interest Rate Risk- The Board does not have a formal investment policy that limits investment maturities as a means of managing its exposure to fair value losses arising from increasing interest rates.
Credit Risk - State law limits investments as noted above (N.J.S.A. 18A:20-37). The District does not have an investment policy that would further limit its investment choices.
Concentration of Credit Risk- The Board places no limit in the amount the District may invest in any one issuer.
40

SOUTH PLAINFIELD BOARD OF EDUCATION NOTES TO THE FINANCIAL STATEMENTS FOR THE FISCAL YEAR ENDED JUNE 30, 2015
NOTE 3 DETAILED NOTES ON ALL FUNDS (Continued)
B. Receivables
Receivables as of June 30, 2015 for the district's individual major funds, in the aggregate, including the applicable allowances for uncollectible accounts, are as follows:
Special Capital Food Preschool Latchkey
General Revenue Projects Service Program Program Total
Receivables:
Intergovernmental:
Local $ 10 $ 5,330 $ 5,340
State 124,914 $ 870,400 $ 1,085 996,399
Federal 327,251 34,449 361,700
Accounts 62,962 $ 3,250 $ 4,834 71,046
Gross Receivables 124,924 332,581 870,400 98,496 3,250 4,834 1,434,485
Less: Allowance for
Uncollectibles
Net Total Receivables $ 124,924 $ 332,581 $ 870,400 $ 98,496 $ 3,250 $ 4,834 $ 1,434,485
c. Unearned Revenue
Govermnental funds report unearned revenue in connection with resources that have been received, but not yet earned. At the end of the current fiscal year, the various components of unearned revenue reported in the governmental funds were as follows:
Special Revenue Fund Unencumbered Grant Draw Downs Grant Draw Downs Reserved for Encumbrances
Capital Projects Fund Unrealized School Facilities Grant
41
$ 200,825 17,395
176,694
$ 394,914
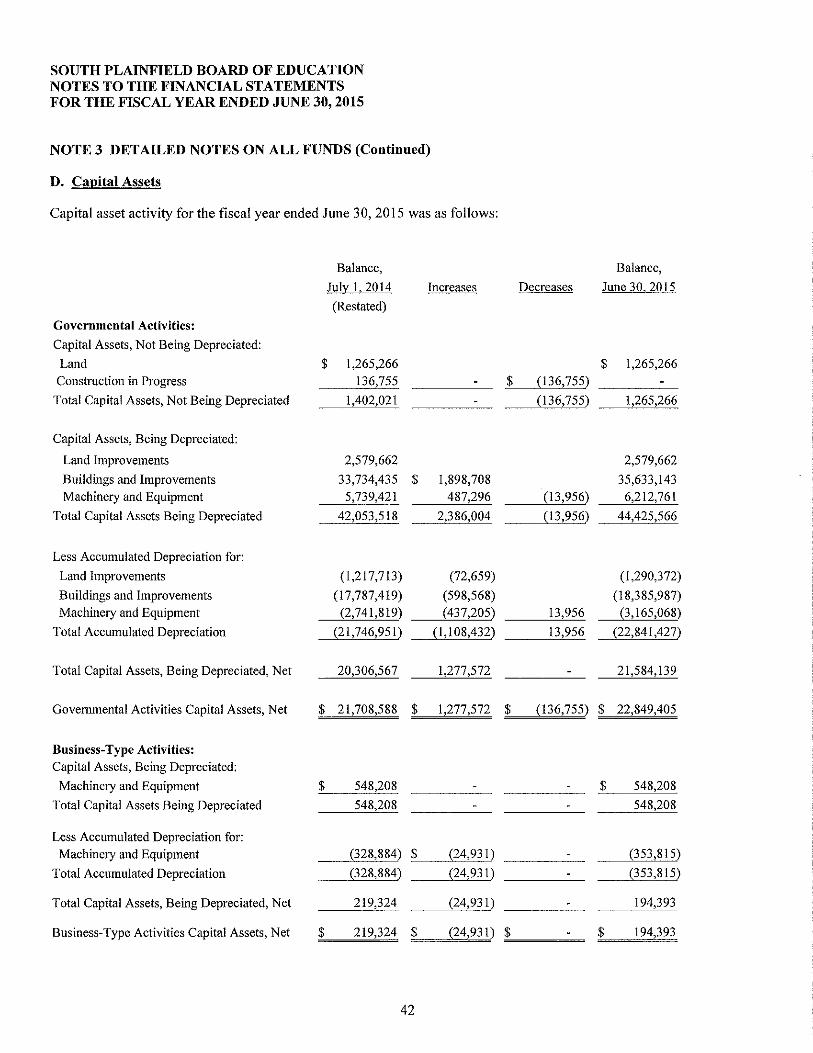
SOUTH PLAINFIELD BOARD OF EDUCATION NOTES TO THE FINANCIAL STATEMENTS FOR THE FISCAL YEAR ENDED JUNE 30, 2015
NOTE 3 DETAILED NOTES ON ALL FUNDS (Continued)
D. Capital Assets
Capital asset activity for the fiscal year ended June 30,2015 was as follows:
Balance,
July I, 2014 Increases (Restated)
Governmental Activities:
Capital Assets, Not Being Depreciated:
Land $ 1,265,266 Construction in Progress 136,755
Total Capital Assets, Not Being Depreciated 1,402,021
Capital Assets, Being Depreciated:
Land Improvements 2,579,662
Buildings and Improvements 33,734,435 $ 1,898,708 Machinery and Equipment 5,739,421 487,296
Total Capital Assets Being Depreciated 42,053,518 2,386,004
Less Accumulated Depreciation for:
Land Improvements (1,217,713) (72,659)
Buildings and Improvements (17,787,419) (598,568) Machinery and Equipment (2,741,819) (437,205)
Total Accumulated Depreciation (21,746,951) (I, I 08,432)
Total Capital Assets, Being Depreciated, Net 20,306,567 1,277,572
Govermnental Activities Capital Assets, Net $ 21,708,588 $ 1,277,572
Business-Type Activities: Capital Assets, Being Depreciated:
Machinery and Equipment $ 548,208
Total Capital Assets Being Depreciated 548,208
Less Accumulated Depreciation for: Machinery and Equipment (328,884) $ (24,931)
Total Accumulated Depreciation (328,884) (24,931)
Total Capital Assets, Being Depreciated, Net 219,324 (24,931)
Business-Type Activities Capital Assets, Net $ 219,324 $ (24,931)
42
Balance, Decreases June 30, 2015
$ 1,265,266 $ (136,755)
(136,755) 1,265,266
2,579,662
35,633,143 (13,956) 6,212,761
(13,956) 44,425,566
(1,290,372)
(18,385,987) 13,956 (3, 165,068)
13,956 (22,841 ,427)
21,584,139
$ (136,755) $ 22,849,405
$ 548,208
548,208
(353,815)
(353,815)
194,393
$ $ 194,393

SOUTH PLAINFIELD BOARD OF EDUCATION NOTES TO THE FINANCIAL STATEMENTS FOR THE FISCAL YEAR ENDED JUNE 30, 2015
NOTE 3 DETAILED NOTES ON ALL FUNDS (Continued)
D. Capital Assets (Continued)
Depreciation expense was charged to functions/programs of the District as follows:
Governmental Activities:
Instruction Regular Special
Total Instruction
Support Services Student and Instruction Related
General Administration School Administration
Operations and Maintenance of Plant Student Transportation
Total Support Services
Total Depreciation Expense- Governmental Activities
Business-Type Activities:
Food Service Fund Preschool Fund Latchkey Fund
Food Service Fund
Construction and Other Significant Commitments
The District has the following active construction projects as of June 30,2015:
Purposes
Roosevelt Building Gym Floor Replacement
43
$ 360,667 335,568 696,235
114,700 87,863 4,553
35,168 169,913 412,197
$ 1,108,432
$ 11,788 4,923 8,220
$ 24,931
Remaining Commitment
$ 169,420
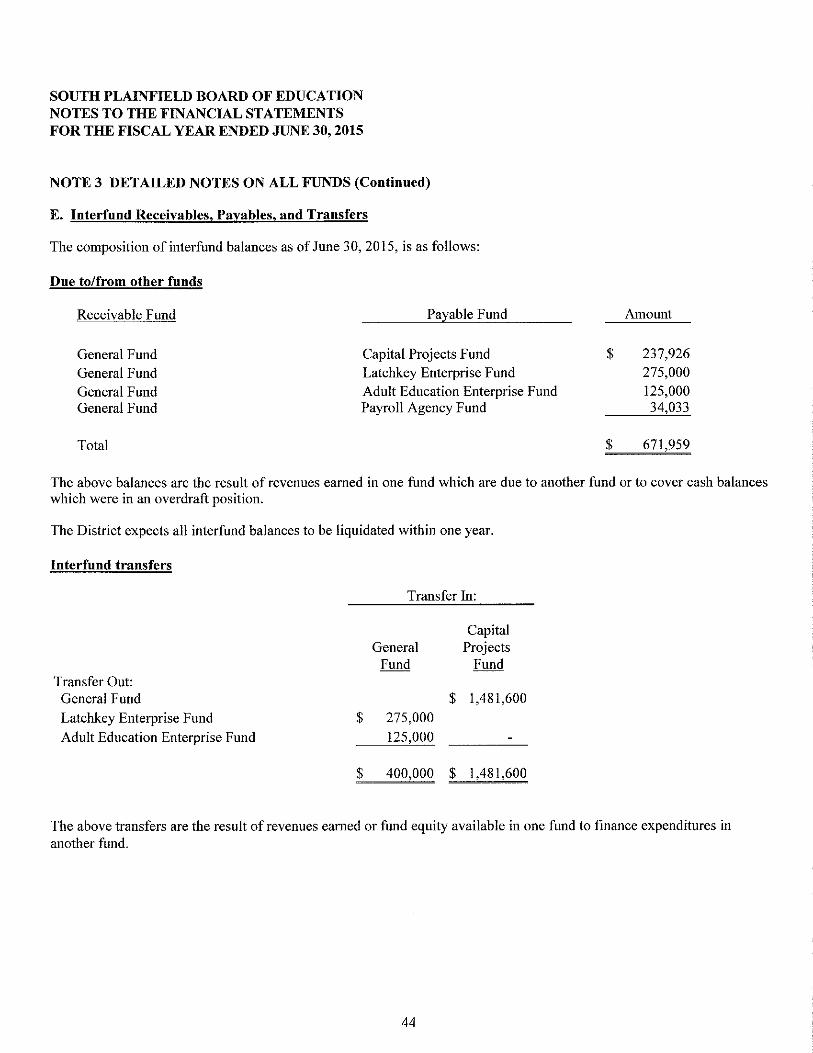
SOUTH PLAINFIELD BOARD OF EDUCATION NOTES TO THE FINANCIAL STATEMENTS FOR THE FISCAL YEAR ENDED JUNE 30, 2015
NOTE 3 DETAILED NOTES ON ALL FUNDS (Continued)
E. Interfund Receivables, Payables, and Transfers
The composition ofinterfund balances as of June 30,2015, is as follows:
Due to/from other funds
Receivable Fund
General Fund General Fund General Fund General Fund
Total
Payable Fund
Capital Projects Fund Latchkey Enterprise Fund Adult Education Enterprise Fund Payroll Agency Fund
$
$
Amount
237,926 275,000 125,000 34,033
671,959
The above balances are the result of revenues earned in one fund which are due to another fund or to cover cash balances which were in an overdraft position.
The District expects all interfund balances to be liquidated within one year.
Interfund transfers
Transfer In:
Capital General Projects
Fund Fund Transfer Out:
General Fund $ 1,481,600
Latchkey Enterprise Fund $ 275,000 Adult Education Enterprise Fund 125,000
$ 400,000 $ 1,481,600
The above transfers are the result of revenues earned or fund equity available in one fund to finance expenditures in another fund.
44

SOUTH PLAINFIELD BOARD OF EDUCATION NOTES TO THE FINANCIAL STATEMENTS FOR THE FISCAL YEAR ENDED JUNE 30, 2015
NOTE 3 DETAILED NOTES ON ALL FUNDS (Continued)
F. Leases
Operating Leases
The District leases copiers under noncancelable operating leases. Lease payments for the fiscal year ended June 30, 2015 were $126,272. The future minimum lease payments for these operating leases are as follows:
Fiscal Year Ending June 30
G. Long-Term Debt
2016 2017 2018 2019
Total
General Obligation Bonds
Amount
$ 126,212 121,632 114,946
19,158
$ 381,948
The Board issued general obligation bonds to provide funds for the acquisition and construction of major capital facilities and other capital assets. The full faith and credit of the Board are irrevocably pledged for the payment of the principal of the bonds and the interest thereon.
Bonds payable at June 30, 2015 are comprised of the following issues:
$9,765,000, 2009 Refunding Bonds, due in annual installments of$910,000 to $1,195,000 through July 15, 2021, interest at 3.00% to 5.00% $7.325.000
The Board's schedule of principal and interest for long-term debt issued and outstanding is as follows:
Governmental Activities:
Year Ended Serial Bonds June 30. Principal Interest Total
2016 $ 910,000 $ 308,588 $ 1,218,588 2017 960,000 264,238 1,224,238 2018 995,000 225,287 1,220,287 2019 1,040,000 188,006 1,228,006 2020 1,085,000 141,275 1,226,275
2021-2023 2,335,000 118,125 2,453,125
$ 7,325,000 $ I ,245,519 $ 8,570,519
45

SOUTH PLAINFIELD BOARD OF EDUCATION NOTES TO THE FINANCIAL STATEMENTS FOR THE FISCAL YEAR ENDED JUNE 30,2015
NOTE 3 DETAILED NOTES ON ALL FUNDS (Continued)
G. Long-Term Debt (Continued)
Statutory Borrowing Power
The Board's remaining borrowing power under N.J.S. 18A:24-19, as amended, at June 30, 2015 was as follows:
4% of Equalized Valuation Basis (Municipal) Less: Net Debt
Remaining Borrowing Power
H. Other Long-Term Liabilities
Changes in Long-Term Liabilities
Long-term liability activity for the fiscal year ended June 30, 2015, was as follows:
Balance,
July I, 2014 Additions Reductions
(Restated)
Governmental Activities:
Serial Bonds Payable $ 8,195,000 $ 870,000
Add: Premium 370,203 73,326
Total Bonds Payable 8,565,203 943,326
Compensated Absences 1,006,457 64,560
Net Pension Liability 11,657,411 98,954 246,451
Governmental Activity
Long-Term Liabilities $ 21,229,071 $ 98,954 $ 1,254,337
$ 148,991,335 7,325,000
$ 141,666,335
Balance, Within
June 30, 2015 One Year
$ 7,325,000 $ 910,000 296,877
7,621,877 910,000
941,897
II ,509,914 534,686
$ 20,073,688 $ 1,444,686
For the governmental activities, the liabilities for compensated absences and net pension liability are generally liquidated by the general fund.
46

SOUTH PLAINFIELD BOARD OF EDUCATION NOTES TO THE FINANCIAL STATEMENTS FOR THE FISCAL YEAR ENDED JUNE 30, 2015
NOTE 4 OTHER INFORMATION
A. Risk Management
The District is exposed to various risks of loss related to property, general liability, automobile coverage, theft of, damage to and destruction of assets; errors and omissions; injuries to employees; student accident; termination of employees and natural disasters. The Board has obtained commercial insurance coverage to guard against these events to minimize the exposure to the District should they occur. A complete schedule of insurance coverage can be found in the statistical section of this Comprehensive Annual Financial Report.
The District is a member of the New Jersey Schools Insurance Group (NJSIG or Group). The Group is a risk sharing public entity pool, established for the purpose of insuring against worker's compensation claims.
The relationship between the Board and the Group is governed by a contract and by-laws that have been adopted by resolution of each unit's governing body. The Board is contractually obligated to make all annual and supplementary contributions to the Group, to report claims on a timely basis, cooperate with the management of the Group, its claims administrator and attorneys in claims investigation and settlement, and to follow risk management procedures as outlined by the Group. Members have a contractual obligation to fund any deficit of the Group attributable to a membership year during which they were a member.
NJSIG provides its members with risk management services, including the defense of and settlement of claims and to establish reasonable and necessary loss reduction and prevention procedures to be followed by the members. Complete financial statements of the Group are on file with the School's Business Administrator.
There has been no significant reduction in insurance coverage from the previous year nor have there been any settlements in excess of insurance coverage's in any of the prior three years.
The District has elected to fund its New Jersey Unemployment Compensation Insurance under the "Benefit Reimbursement Method". Under this plan the District is required to reimburse the New Jersey Unemployment Trust Fund for benefits paid to its former employees and charged to its account with the State. The District is billed quarterly for amounts due to the State. The following is a summary of District contributions, employee contributions, reimbursements to the State for benefits paid and the ending balance of the District's fiduciary trust tund for the current and previous two years:
Year Ended District Employee Amount Ending June 30, Contributions Contributions Reimbursed Balance
2015 $ 1,084 $ 50,210 $ 25,436 $ 641,170 2014 6,427 34,296 4,824 612,878 2013 61,368 48,765 47,668 576,832
47

SOUTH PLAINFIELD BOARD OF EDUCATION NOTES TO THE FINANCIAL STATEMENTS FOR THE FISCAL YEAR ENDED JUNE 30, 2015
NOTE 4 OTHER INFORMATION (Continued)
B. Contingent Liabilities
The District is a party defendant in some lawsuits, none of a kind unusual for a school district of its size and scope of operation. In the opinion of the Board's Attorney the potential claims against the District not covered by insurance policies would not materially affect the financial condition of the District.
Federal and State Awards - The Board participates in a number of federal and state programs that are fully or partially funded by grants received from other governmental units. Expenditures financed by grants are subject to audit by the appropriate grantor government. If expenditures are disallowed due to noncompliance with grant program regulations, the Board may be required to reimburse the grantor government. As of June 30, 2015, significant amounts of grant expenditures have not been audited by the various grantor agencies but the Board believes that disallowed expenditures, if any, based on subsequent audits will not have a material effect on any of the individual governmental funds or the overall financial position of the District.
C. Federal Arbitrage Regulations
The District is subject to Section 148 of the Internal Revenue Code as it pertains to the arbitrage rebate on all tax-exempt obligations, both long and short-tenn debt. Under the 1986 Tax Reform Act, the h1ternal Revenue Service (IRS) required that all excess earnings from investulent proceeds be rebated to the IRS. Arbitrage, for purposes of these regulations, is defined as the difference between the yield on the investulent and the yield on the obligations issued. If there are excess earnings, this amount may be required to be rebated to the IRS. At June 30, 2015, the District has not estimated its arbitrage earnings due to the IRS, if any.
D. Employee Retirement Systems and Pension Plans
The State of New Jersey sponsors and administers the following contributory defined benefit public employee retirement systems (retirement systems) covering substantially all eligible Board employees:
Public Employees' Retirement System (PERS)- Established in January 1955, under the provisions ofN.J.S.A. 43: !SA to provide coverage, including post-retirement health care, to substantially all full time employees of the State or any county, municipality, school district, or public agency provided the employee is not a member of another State-administered retirement system. Membership is mandatory for such employees and vesting occurs after I 0 years of service for pension benefits and 25 years for post-retirement health care coverage. PERS is a cost sharing multi-employer defined benefit pension plan.
Teachers' Pension and Annuity Fund (TPAF)- Established in January 1955, under the provisions ofN.J.S.A. 18A:66 to provide coverage including post-retirement health care to substantially all full tinle certified teachers or professional staff of the public school systems in the State. Membership is mandatory for such employees and vesting occurs after I 0 years of service for pension benefits and 25 years for post-retirement health care coverage. TP AF is a cost sharing plan with special funding situations.
The State of New Jersey sponsors and administers the following defined contribution public employee retirement program covering certain state and local government employees which include those Board employees who are eligible for pension coverage.
48

SOUTH PLAINFIELD BOARD OF EDUCATION NOTES TO THE FINANCIAL STATEMENTS FOR THE FISCAL YEAR ENDED JUNE 30, 2015
NOTE 4 OTHER INFORMATION (Continued)
D. Employee Retirement Systems aud Pension Plans (Continued)
Defined Contribution Retirement Program (DCRP) - established under the provisions of Chapter 92, P.L. 2007 and Chapter 103, P.L. 2008 to provide coverage to elected, certain appointed officials, and certain Board employees not eligible for enrollment in PERS or TPAF. Effective July 1, 2007 membership is mandatory for such individuals with vesting occurring after one ( 1) year of membership. DCRP is a defined contribution pension plan.
Other Pension Funds
The State established and administers a Supplemental Ammity Collective Trust Fund (SACT) which is available to active members of the State-administered retirement systems to purchase annuities to supplement the guaranteed benefits provided by their retirement system. The state or local government employers do not appropriate funds to SACT.
The cost of living increase for PERS and TPAF, are funded directly by each of the respective systems but are currently suspended as a result of reform legislation.
According to state law, all obligations of each retirement system will be assumed by the State of New Jersey should any retirement system be tenninated.
The State of New Jersey, Department of the Treasury, Division of Pensions and Benefits, issues publicly available financial reports that include the financial statements and required supplementary information of each of the above systems. The financial reports may be accessed via the New Jersey, Division of Pensions and Benefits, website at www .state.n j. us/treasury/pensions.
Basis of Accounting
The financial statements of the retirement systems are prepared on the accrual basis of accounting. Employer contributions are recognized when payable to the retirement systems. Benefits or refunds are recognized when due and payable in accordance with the terms of the retirement systems.
Investment Valuation
Investments are reported at fair value. Securities traded on a national or international exchange are valued at the last reported sales price at current exchange rates. Mortgages are valued on the basis of future principal and interest payments, and are discounted at prevailing interest rates for similar instruments. The fair value of real estate investments is based on independent appraisals. Investments that do not have an established market are reported at estimated fair values.
The State of New Jersey, Department of the Treasury, Division of Investment, issues publicly available financial reports that include the financial statements of the State of New Jersey Cash Management Fund. The financial reports may be obtained in writing to the State of New Jersey, Department of the Treasury, Division of Investment, P.O. Box 290, Trenton, New Jersey 08625-0290 or at www.state.nj/treasury/doinvest.
49
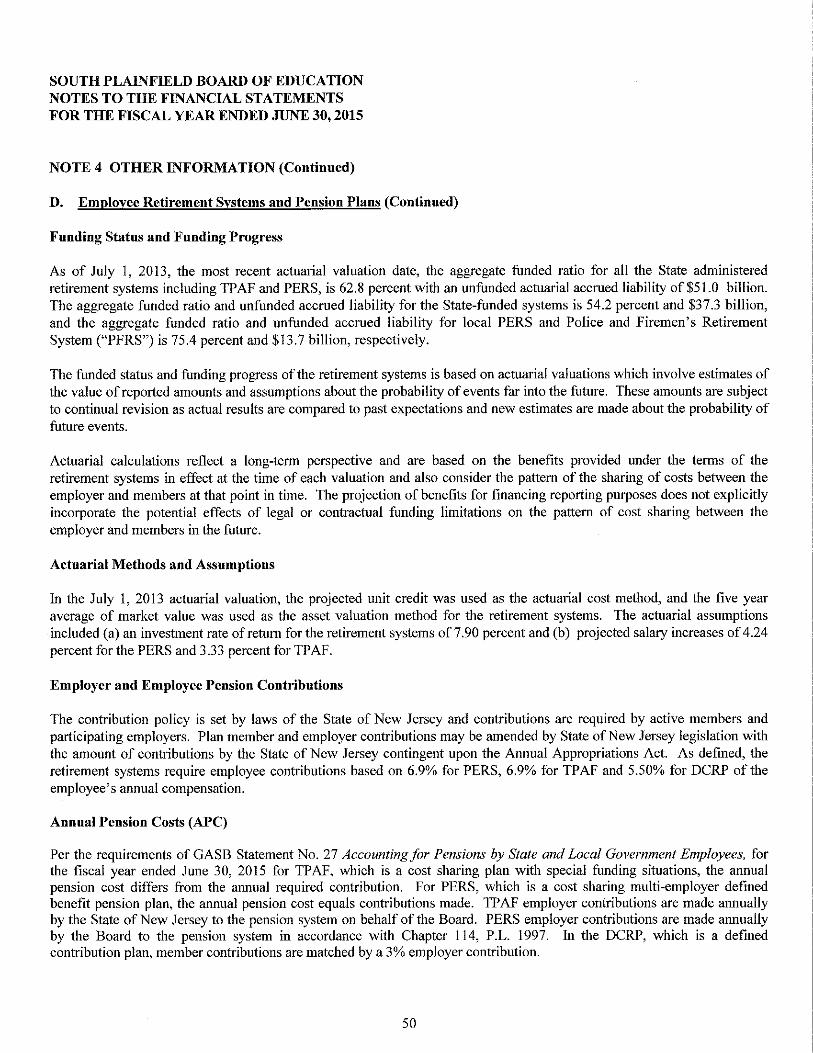
SOUTH PLAINFIELD BOARD OF EDUCATION NOTES TO THE FINANCIAL STATEMENTS FOR THE FISCAL YEAR ENDED JUNE 30,2015
NOTE 4 OTHER INFORMATION (Continued)
D. Employee Retirement Systems and Pension Plans (Continued)
Funding Status and Funding Progress
As of July I, 2013, the most recent actuarial valuation date, the aggregate funded ratio for all the State administered retirement systems including TPAF and PERS, is 62.8 percent with an unfunded actuarial accrued liability of $51.0 billion. The aggregate funded ratio and unfunded accrued liability for the State-funded systems is 54.2 percent and $37.3 billion, and the aggregate funded ratio and unfunded accrued liability for local PERS and Police and Firemen's Retirement System ("PFRS") is 75.4 percent and $13.7 billion, respectively.
The funded status and funding progress of the retirement systems is based on actuarial valuations which involve estimates of the value of reported amounts and assumptions about the probability of events far into the future. These amounts are subject to continual revision as actual results are compared to past expectations and new estimates are made about the probability of future events.
Actuarial calculations reflect a long-term perspective and are based on the benefits provided under the terms of the retirement systems in effect at the time of each valuation and also consider the pattern of the sharing of costs between the employer and members at that point in time. The projection of benefits for financing reporting purposes does not explicitly incorporate the potential effects of legal or contractual funding limitations on the pattern of cost sharing between the employer and members in the future.
Actuarial Methods and Assumptions
In the July 1, 2013 actuarial valuation, the projected unit credit was used as the actuarial cost method, and the five year average of market value was used as the asset valuation method for the retirement systems. The actuarial assumptions included (a) an investment rate of return for the retirement systems of 7.90 percent and (b) projected salary increases of 4.24 percent for the PERS and 3.33 percent for TPAF.
Employer and Employee Pension Contributions
The contribution policy is set by laws of the State of New Jersey and contributions are required by active members and participating employers. Plan member and employer contributions may be amended by State of New Jersey legislation with the amount of contributions by the State of New Jersey contingent upon the Annual Appropriations Act. As defined, the retirement systems require employee contributions based on 6.9% for PERS, 6.9% for TPAF and 5.50% for DCRP of the employee's annual compensation.
Annual Pension Costs (APC)
Per the requirements of GASB Statement No. 27 Accounting for Pensions by State and Local Government Employees, for the fiscal year ended June 30, 2015 for TPAF, which is a cost sharing plan with special funding situations, the annual pension cost differs from the annual required contribution. For PERS, which is a cost sharing multi-employer defined benefit pension plan, the annual pension cost equals contributions made. TP AF employer contributions are made annually by the State of New Jersey to the pension system on behalf of the Board. PERS employer contributions are made annually by the Board to the pension system in accordance with Chapter 114, P.L. 1997. In the DCRP, which is a defined contribution plan, member contributions are matched by a 3% employer contribution.
50
SOUTH PLAINFIELD BOARD OF EDUCATION NOTES TO THE FINANCIAL STATEMENTS FOR THE FISCAL YEAR ENDED JUNE 30, 2015
NOTE 4 OTHER INFORMATION (Continued)
D. Employee Retirement Systems and Pension Plans (Continued)
During the fiscal years ended June 30, 2015, 2014 and 2013 the Boru·d was required to contribute for PERS and DCRP and the State of New Jersey was required to contribute for TPAF for normal cost pension and accrued liability contributions (including non-contributory group life insurance (NCGI)) the following amounts:
Year Ended On-behalf June 30. PERS TPAF DCRP
2015 $ 506,796 $ 1,347,938 None 2014 459,587 1,063,986 None 2013 497,901 1,680,144 None
For fiscal years 2014/2015 and 2012/2013, the state contributed $1,347,938 and $1,680,144, respectively for normal cost pension, accrued liability and the NCGI premium. For fiscal year 2013/2014 the State did not contribute to the TPAF for accrued liability but did contribute $1,063,986 for normal cost pension and NCGI premium.
The PERS contributions ru·e recognized in the govermnental fund financial statements (modified accrual basis) as an expenditure. The on-behalf TPAF contributions are recognized in the governmental fund financial statements (modified accrual basis) as both a revenue and expenditure in accordance with GASB No. 24. The DCRP contributions are recognized in the governmental fund financial statements (modified accrual basis) as an expenditure, as well as, the district-wide financial statements (accrual basis) as an expense.
Also, in accordance with N.J.S.A. 18A:66-66 the State of New Jersey reimbursed the Board $2,001,968 during the fiscal year ended June 30, 2015 for the employer's share of social security contributions for TPAF members as calculated on their base salaries. This amount has been recognized in the district-wide financial statements (accrual basis) and the governmental fund financial statements (modified accrual basis) as a revenue and expense/expenditure in accordance with GASB No. 24.
Pension Liabilities, Pension Expense, and Deferred Outflows of Resources and Deferred Inflows of Resources Related to Pensions
Public Employees Retirement System (PERS)
At June 30, 2015, the District reported in the statement of net position (accrual basis) a liability of $11,509,914 for its proportionate share of the PERS net pension liability. The net pension liability was measured as of June 30,2014 and the total pension liability used to calculate the net pension liability was determined by an actuarial valuation as of that date. The District's proportionate share of the net pension liability was based on a projection of the District's long-term share of contributions to the pension plan relative to the projected contributions of all participating governmental entities, actuarially determined. At June 30, 2014, the District's proportionate share was .06148 percent, which was an increase of .00048 percent from its proportionate share measured as of June 30, 2013.
51

SOUTH PLAINFIELD BOARD OF EDUCATION NOTES TO THE FINANCIAL STATEMENTS FOR THE FISCAL YEAR ENDED JUNE 30, 2015
NOTE 4 OTHER INFORMATION (Continued)
D. Employee Retirement Systems and Pension Plans (Continued)
Pension Liabilities, Pension Expense, and Deferred Outflows of Resources and Deferred Inflows of Resources Related to Pensions (Continued)
Public Employees Retirement System (PERS) (Continued)
For the fiscal year ended June 30, 2015, the District recognized in the district-wide statement of activities (accrual basis) pension expense of $605,750 for PERS. At June 30, 2015, the District reported deferred outflows of resources and deferred inflows of resources related to PERS pension from the following sources:
Deferred Outflows Deferred Inflows of Resources of Resources
Changes of Assumptions $ 361,933 Net Difference Between Projected and Actual
Earnings on Pension Plan Investments $ 685,928 Changes in Proportion and Differences Between
District Contributions and Proportionate Share of Contributions 77,544
Total $ 439,477 $ 685,928
Amounts reported as deferred outflows of resources and deferred inflows of resources related to PERS pension will be recognized in pension expense as follows:
Fiscal Year Ending
June 30,
2016 $ (90,696) 2017 (90,696)
2018 (90,696) 2019 (90,696) 2020 80,786
Thereafter 35,547
$ (246,451)
52
SOUTH PLAINFIELD BOARD OF EDUCATION NOTES TO THE FINANCIAL STATEMENTS FOR THE FISCAL YEAR ENDED JUNE 30, 2015
NOTE 4 OTHER INFORMATION (Continued)
D. Employee Retirement Systems and Pension Plans (Continued)
Pension Liabilities, Pension Expense, and Deferred Outflows of Resources and Deferred Inflows of Resources Related to Pensions (Continued)
Public Employees Retirement System (PERS) (Continued)
Actuarial Assumptions
The total pension liability for the June 30, 2014 measurement date was determined by an actuarial valuation as of July I, 2013, which was rolled forward to June 30, 2014. The total pension liability for the June 30, 2013 measurement date was determined by an actuarial valuation as of July I, 2013. This actuarial valuation used the following actuarial assumptions, applied to all periods in the measurement:
Inflation Rate Salary Increases: 2012-2021
Thereafter
Investment Rate of Return Mortality Rate Table Period of Actuarial Experience
Study Upon Which Actuarial Assumptions were Based
3.01%
2.15-4.40% Based on Age
3.15-5.40% Based on Age
7.90% RP-2000
July I, 2008-June 30, 2011
Assumptions for mortality improvements are based on Society of Actuaries Scale AA.
53
SOUTH PLAINFIELD BOARD OF EDUCATION NOTES TO THE FINANCIAL STATEMENTS FOR THE FISCAL YEAR ENDED JUNE 30, 2015
NOTE 4 OTHER INFORMATION (Continued)
D. Employee Retirement Systems and Pension Plans (Continued)
Pension Liabilities, Pension Expense, and Deferred Outflows of Resources and Deferred Inflows of Resources Related to Pensions (Continued)
Public Employees Retirement System (PERS) (Continued)
Long-Term Expected Rate of Return
The long-tenn expected rate of return on pension plan investments was detennined using a building-block method in which best-estimate ranges of expected future real rate of return (expected returns, net of pension plans investment expense and inflation) are developed for each major asset class. These ranges are combined to produce the long-tenn expected rate of return by weighting the expected future real rates of return by the target asset allocation percentage and by adding expected inflation. Best estimates of arithmetic real rates of return for each major asset class included in the pension plans' target asset allocation as of June 30, 2014 are summarized in the following table:
Asset Class
Cash Core Bonds Intermediate-Term Bonds Mortgages High Yield Bonds Inflation-Indexed Bonds Broad US Equities Developed Foreign Equities Emerging Market Equities Private Equity Hedge Funds/ Absolute Return
Real Estate (Property) Commodities
Discount Rate
Target Allocation
6.00% 1.00%
11.20% 2.50% 5.50% 2.50%
25.90% 12.70% 6.50% 8.25% 12.25%
3.20% 2.50%
Long-Term Expected Real Rate of Return
0.80% 2.49% 2.26% 2.17% 4.82% 3.51% 8.22% 8.12% 9.91% 13.02% 4.92%
5.80% 5.35%
The discount rate used to measure the total pension liabilities of the PERS plan was as follows:
Discount Rate
PERS 5.39%
54
SOUTH PLAINFIELD BOARD OF EDUCATION NOTES TO THE FINANCIAL STATEMENTS FOR THE FISCAL YEAR ENDED JUNE 30, 2015
NOTE 4 OTHER INFORMATION (Continued)
D. Employee Retirement Systems and Pension Plans (Continued)
Pension Liabilities, Pension Expense, and Deferred Outflows of Resources and Deferred Inflows of Resources Related to Pensions (Continued)
Public Employees Retirement System (PERS) (Continued)
Discount Rate (Continued)
The following table represents the crossover period, if applicable, for the PERS defined benefit plan:
Period of Projected Benefit Payments for which the Following Rates were Applied:
Long-Term Expected Rate of Return
Municipal Bond Rate *
Through June 30, 2033
From July I, 2033 and Thereafter
* The municipal bond return rate used is 4.29%. The source is the Bond Buyer Go 20-Bond Municipal Bond Index, which includes tax-exempt general obligation municipal bonds with an average rating of AA/Aa or higher.
Sensitivity of Net Pension Liability
The following presents the District's proportionate share of the PERS net pension liability calculated using the discount rate of 5.39%, as well as what the District's proportionate share of the PERS net pension liability would be if it were calculated using a discount rate that is ]-percentage-point lower (4.39 percent) or !-percentage-point higher (6.39 percent) than the current rate:
1% Current 1% Decrease Discount Rate Increase (4.39%) (5.39%) (6.39%)
District's Proportionate Share of the PERS Net Pension Liability $ 14,479,817 $ 11,509,914 $ 9,015,946
The sensitivity analysis was based on the proportionate share of the District's net pension liability at June 30, 2014. A sensitivity analysis specific to the District's net pension liability was not provided by the pension system.
Pension Plan Fiduciary Net Position
Detailed information about the PERS pension plan's fiduciary net position is available in the separately issued financial report from the State of New Jersey, Department of the Treasury, Division of Pension and Benefits. The financial reports may be accessed via the New Jersey, Division of Pensions and Benefits, website at www.state.nLus/trasurvlpensions.
55
SOUTH PLAINFIELD BOARD OF EDUCATION NOTES TO THE FINANCIAL STATEMENTS FOR THE FISCAL YEAR ENDED JUNE 30, 2015
NOTE 4 OTHER INFORMATION (Continued)
D. Employee Retirement Systems and Pension Plans (Continued)
Pension Liabilities, Pension Expense, and Deferred Outflows of Resources and Deferred Inflows of Resources Related to Pensions (Continued)
Teachers Pension and Annuity Fund (TP AF)
In accordance with GASB Statement No. 68, Accounting and Financial Reporting for Pensions, the District is not required to recognize a net pension liability for TPAF. The State of New Jersey is the only entity that has a legal obligation to make employer contributions to TP AF on behalf of the District. Accordingly, the District's proportionate share percentage determined under Statement No. 68 is zero percent and the State's proportionate share is 100% for TPAF. Therefore, in addition, the District does not recognize any portion of the TP AF collective deferred outflows of resources and deferred inflows of resources.
For the fiscal year ended June 30, 2015, the District recognized in the district-wide statement of activities (accrual basis) pension expense of$7,233,242 for TPAF. This amount has been included in the district-wide statement of activities (accrual basis) as a revenue and expense in accordance with GASB No. 24.
At June 30,2015 the State's proportionate share of the net pension liability attributable to the District is $134,423,412. The nonemployer allocation percentages are based on the ratio of the State's contributions made as an employer and nonemployer towards the actuarially determined contribution amount adjusted by locations who participated in the State early retirement incentives to total contributions to TP AF during the year ended June 30, 2014.
Actuarial Assumptions
The total pension liability for the June 30, 2014 measurement date was determined by an actuarial valuation as of July I, 2013, which was rolled forward to June 30,2014. The total pension liability for the June 30, 2013 measurement date was determined by an actuarial valuation as of July I, 2013. This actuarial valuation used the following actuarial assumptions, applied to all periods in the measurement.
Inflation Rate Salary Increases: 2012-2021
Thereafter
Investment Rate of Return Mortality Rate Table Period of Actuarial Experience
Study Upon Which Actuarial
2.50%
Varies based on experience Varies based on experience
7.90% RP-2000
July I, 2009 -June 30,2012
Assumptions for mortality improvements are based on Society of Actuaries Scale AA.
56

SOUTH PLAINFIELD BOARD OF EDUCATION NOTES TO THE FINANCIAL STATEMENTS FOR THE FISCAL YEAR ENDED JUNE 30, 2015
NOTE 4 OTHER INFORMATION (Continued)
D. Employee Retirement Systems and Pension Plans (Continued)
Pension Liabilities, Pension Expense, and Deferred Outflows of Resources and Deferred Inflows of Resources Related to Pensions (Continued)
Teachers Pension and Annuity Fund (TPAF) (Continued)
Long-Term Expected Rate ofRetnrn
The long-term expected rate of return on pension plan investments was determined using a building-block method in which best-estimate ranges of expected future real rate of return (expected returns, net of pension plans investment expense and inflation) are developed for each mf\ior asset class. These ranges are combined to produce the long-term expected rate of return by weighting the expected future real rates of return by the target asset allocation percentage and by adding expected inflation. Best estimates of arithmetic real rates of return for each major asset class included in the pension plans' target asset allocation as of June 30, 2014 are summarized in the following table:
Long-Term
Target Expected Real Asset Class Allocation Rate of Return
Cash 6.00% 0.50% Core Fixed Income 0.00% 2.19%
Core Bonds 1.00% 1.38% Short-Term Bonds 0.00% 1.00% Intermediate-Term Bonds 11.20% 2.60% Long-Term Bonds 0.00% 3.23% Mortgages 2.50% 2.84% High Yield Bonds 5.50% 4.15% Non-US Fixed Income 0.00% 1.41% Inflation-Indexed Bonds 2.50% 1.30%
Broad US Equities 25.90% 5.88%
Large Cap US Equities 0.00% 5.62% Mid Cap US Equities 0.00% 6.39%
Small Cap US Equities 0.00% 7.39% Developed Foreign Equities 12.70% 6.05%
Emerging Market Equities 6.50% 8.90%
Private Equity 8.25% 9.15% Hedge Funds/Absolute Return 12.25% 3.85%
Real Estate (Property) 3.20% 4.43%
Real Estate (REITS) 0.00% 5.58% Commodities 2.50% 3.60%
Long Credit Bonds 0.00% 3.74%
57
SOUTH PLAINFIELD BOARD OF EDUCATION NOTES TO THE FINANCIAL STATEMENTS FOR THE FISCAL YEAR ENDED JUNE 30, 2015
NOTE 4 OTHER INFORMATION (Continued)
D. Employee Retirement Systems and Pension Plans (Continued)
Pension Liabilities, Pension Expense, and Deferred Outflows of Resources and Deferred Inflows of Resources Related to Pensions (Continued)
Teachers Pension and Annuity Fund (TPAF) (Continued)
Discount Rate
The discount rate used to measure the total pension liabilities of the TP AF plan was as follows:
Discount Rate
TPAF 4.68%
The following table represents the crossover period, if applicable, for the TPAF defined benefit plan:
Period of Projected Benefit Payments for which the Following Rates were Applied:
Long-Term Expected Rate of Return
Municipal Bond Rate *
Through June 30, 2027
From July 1, 2027 and Thereafter
* The municipal bond return rate used is 4.29%. The source is the Bond Buyer Go 20-Bond Municipal Bond Index, which includes tax-exempt general obligation municipal bonds with an average rating of AA/ Aa or higher.
Sensitivity of Net Pension Liability
The following presents the State's proportionate share of the TPAF net pension liability attributable to the District calculated using the discount rate of 4.68%, as well as what the State's proportionate share of the TPAF net pension liability attributable to the District that would be if it were calculated using a discount rate that is ]-percentage-point lower (3.68 percent) or !-percentage-point higher (5.68 percent) than the current rate:
1% Current 1% Decrease Discount Rate Increase (3.68%) (4.68%} (5.68%}
State's Proportionate Share of the TPAF Net Pension Liability Attributable to the District $161,676,054 $ 134,423,412 $ 111,756,343
The sensitivity analysis was based on the State's proportionate share of the net pension liability attributable to the District at June 30,2014. A sensitivity analysis specific to the State's proportionate share of the net pension liability attributable to the
58

SOUTH PLAINFIELD BOARD OF EDUCATION NOTES TO THE FINANCIAL STATEMENTS FOR THE FISCAL YEAR ENDED JUNE 30, 2015
NOTE 4 OTHER INFORMATION (Continued)
D. Employee Retirement Systems and Pension Plans (Continued)
Pension Liabilities, Pension Expense, and Deferred Outflows of Resources and Deferred Inflows of Resources Related to Pensions (Continued)
Teachers Pension and Annuity Fund (TPAF) (Continued)
Pension Plan Fiduciary Net Position
Detailed information about the TPAF pension plan's fiduciary net position is available in the separately issued financial report from the State of New Jersey, Department of the Treasury, Division of Pension and Benefits. The financial reports may be accessed via the New Jersey, Division of Pensions and Benefits, website at www.state.nj.us/treasury/pensions.
E. Post-Retirement Medical Benefits
The State of New Jersey sponsors and administers the post-retirement health benefit program plans for school districts. The Plans are classified as either single employer plans or cost sharing multiple employer defined benefit plans depending on the plan the eligible employee is covered under.
As a result of implementing Governmental Accounting Standards Board (GASB) Statement No. 43, Financial Reporting for Post-employment Benefit Plans Other than Pension Plans (OPEB), effective for Fiscal Year 2007, the State Health Benefits Program (SHBP), and the Prescription Dmg Program (PDP), and Post-Retirement Medical (PRM) of the PERS and TPAF are combined and reported as Pension and Other employee Benefit Tmst Funds in the State's Comprehensive Annual Financial Report (CAFR). Specifically, SHBP-State, and the PRM of the PERS are combined and reported as a Health Benefits Program Fund - State classified as a single employer plan. The SHBP-Local, PDP-Local, and the PRM of the TPAF-Local are combined and reported as Health Benefits Program Fund -Local Government classified as a cost-sharing multiple-employer plan in the State's CAFR. The post-retirement benefit programs had a total of 590 state and local participating employers and contributing entities for Fiscal Year 2014.
The State of New Jersey sponsors and administers the following health benefit programs covering certain state and local government employees, including those Board employees and retirees eligible for coverage.
Health Benefits Program Fund (HBPF) - Local Education (including Prescription Drug Program Fund) - The State of New Jersey provides paid coverage to members of the Teachers' Pension and Annuity Fund who retire from a board of education or county college with 25 years of service or on a disability retirement. Under the provisions of P.L. 1992, c.l26, the State also provides paid coverage to members of the Public Employees' Retirement System and Alternate Benefits Program who retire from a board of education or county college with 25 years of service or on a disability retirement if the member's employer does not provide this coverage. Certain local participating employers also provide post-retirement medical coverage to their employees. Retirees who are not eligible for state paid health coverage at retirement can continue in the program if their employer participates in this program or if they are participating in the health benefits plan of their former employer and are enrolled in Medicare parts A and B by paying the cost of the insurance for themselves and their covered dependents. Also, education employees are eligible for the PDP coverage after 60 days of employment.
The State of New Jersey, Department of the Treasury, Division of Pensions and Benefits, issues publicly available financial reports that include the financial statements and required supplementary information of the above Fund. The financial reports may be accessed via the State ofNew Jersey, Department of the Treasury, Division of Pensions and Benefits, website at www.state.nj.us/treasury/pensions.
59
SOUTH PLAINFIELD BOARD OF EDUCATION NOTES TO THE FINANCIAL STATEMENTS FOR THE FISCAL YEAR ENDED JUNE 30, 2015
NOTE 4 OTHER INFORMATION (Continued)
E. Post-Retirement Medical Benefits (Continued)
Basis of Accounting
The financial statements of the health benefit programs are prepared on the accrual basis of accounting. Employer contributions are recognized when payable to the health benefit programs. Benefits or refunds are recognized when due and payable in accordance with the terms of the health benefit programs.
Significant Legislation
P.L. 2011, c.78, effective October 2011, sets new employee contribution requirements towards the cost of employerprovided health benefit coverage. Employees are required to contribute a certain percentage of the cost of coverage. The rate of contribution is determined based on the employee's annual salary and the selected level of coverage. The increased employee contributions will be phased in over a 4-year period for those employed prior to this new legislation's effective date with a minimum contribution required to be at least 1.5% of salary.
Investment Valuation
Investments are reported at fair value. Investments that do not have an established market are reported at estimated fair values.
Funded Status and Funding Progress
As of July I, 2013, the most recent actuarial valuation date, the State had a $53.0 billion unfunded actuarial accrued liability for other post-employment benefits (OPEB) which is made up to $19.7 billion for state active and retired members and $33.3 billion for education employees and retirees that become the obligation of the State ofNew Jersey upon retirement.
The funded status and funding progress of the OPEB includes actuarial valuations which involve estimates of the value of reported amounts and assumptions about the probability of events far into the future. These amounts are subject to continual revision as actual results are compared to past expectations and new estimates are made about the probability of future events.
Actuarial calculations reflect a long-tenn perspective and are based on the benefits provided under the terms of the OPEB in effect at the time of each valuation and also consider the pattern of the sharing of costs between the employer and members at the point in time. The projection of benefits for financial reporting purposes does not explicitly incorporate the potential effects of legal or contractual funding limitations on the pattern of cost sharing between the employer and members in the future.
Actuarial Methods and Assumptions
In the July I, 2013, OPEB actuarial valuation, the projected unit credit was used as the actuarial cost method. The actuarial assumptions included an assumed investment rate of return of 4.50 percent.
60
SOUTH PLAINFIELD BOARD OF EDUCATION NOTES TO THE FINANCIAL STATEMENTS FOR THE FISCAL YEAR ENDED JUNE 30,2015
NOTE 4 OTHER INFORMATION (Continued)
E. Post-Retirement Medical Benefits (Continued)
Post-Retirement Medical Benefits Contributions
P.L. 1987, c. 384 and P.L. 1990, c.6 required the Teachers' Pension and Annuity Fund (TPAF) and Public Employees' Retirement System (PERS), respectively to fund post-retirement medical benefits for those State employees and education employees who retire after accumulating 25 years of credited service or on a disability retirement. As of June 30, 2014, there were 103,432, retirees receiving post-retirement medical benefits and the State contributed $1.04 billion on their behalf. The cost of these benefits is funded through contributions by the State and in accordance with P.L. 1994, c.62. Funding of post-retirement medical benefits changed from a pre-funding basis to a pay-as-you-go basis beginning in Fiscal Year 1994.
The State is also responsible for the cost attributable to P .L. 1992, c.l26, which provides employer paid health benefits to members of PERS and the Alternate Benefit Program who retired from a board of education or county college with 25 years of service. The State paid $165.8 million toward Chapter 126 benefits for 18,122 eligible retired members in Fiscal Year 2014.
The State sets the contribution rate based on a pay as you go basis and not on the annual required contribution of the employers (ARC), an amount actuarially determined in accordance with the parameters of GASB Statement 45. The ARC represents a level of funding that, if paid on an ongoing basis, is projected to cover normal cost each year and amortize any unfunded actuarial liabilities (or funding excess) of the plan over a period not to exceed thirty years. The State's contributions to the State Health Benefits Program Fund for TPAF retirees' post-retirement benefits on behalf of the School District for the fiscal years ended June 30,2015,2014 and 2013 were $2,139,852, $1,744,538 and $1,899,818, respectively, which equaled the required contributions for each year. The State's contributions to the State Health Benefits Program Fund for PERS retirees' post-retirement benefits on behalf of the School District was not determined or made available by the State ofNew Jersey.
NOTE 5 RESTATEMENT
On July I, 2014, the South Plainfield Board of Education implemented GASB Statement No. 68, "Accounting and Financial Reporting for Pensions. The South Plainfield Board of Education has determined that the effect of implementing this accounting change on the financial statements previously reported as of and for the fiscal year ended June 30, 2014 was to recognize the District's proportionate share of the Public Employees' Retirement System's (PERS) net pension liability, deferred outflows of resources and deferred inflows of resources with a corresponding reduction in the unrestricted component of net position in the amount of $11,657,411. \
The financial statements for June 30, 2014 have also been restated to reflect an updated inventory of the District's capital assets as provided by an independent consultant. The effect of this restatement results in a net increase of $357,592 in governmental activities capital assets with a corresponding increase in the net investment in capital assets component of net position at June 30, 2014 from the amounts as originally reported for the effects of the adjustments to capital assets.
61

SOUTH PLAINFIELD BOARD OF EDUCATION NOTES TO THE FINANCIAL STATEMENTS FOR THE FISCAL YEAR ENDED JUNE 30, 2015
NOTE 5 RESTATEMENT (Continued)
The results of these restatements is to reduce total net position of Governmental Activities as of June 30, 2014 from $17,467,612, as originally reported to $6,167,793. The effects of these restatements are as follows:
Governmental Activities:
ASSETS
Capital Assets Being Depreciated, Net
Total Capital Assets, Net
Total Assets
Total Assets and Deferred Outflows of Resources
LIABILITIES
Noncurrent Liabilities
Total Liabilities
Total Liabilities and Deferred Inflows of Resources
NET POSITION
Net Investment in Capital Assets
Unrestricted
Total Net Position
62
Beginning Balance Prior
to Restatement
$ 19,948,975 $
21,350,996
27,260,182
27,620,585
9,571,660
10,152,973
10,152,973
13,146,196
1,772,868
Restatement
357,592 $
357,592
357,592
357,592
11,657,411
11,657,411
11,657,411
357,592
(11,657,411)
$ 17,467,612 $ (11,299,819) $
Beginning Balance Restated
20,306,567
21,708,588
27,617,774
27,978,177
21,229,071
2\,810,384
21,810,384
13,503,788
(9,884,543)
6,167,793
REQUIRED SUPPLEMENTARY INFORMATION- PART II
BUDGETARY COMPARISON SCHEDULES

EXHIBIT C~I
SOUTH PLAINFIELD BOARD OF EDUCATION GENERAL FUND
BUDGETARY COMPARISON SCHEDULE FOR THE FISCAL YEAR ENDED JUNE 30, 2015
Variance Original Final Final To Budget Adjustments Budget Actual Actual
REVENUES Local Sources Local Property Tax Levy $ 43,653,001 $ 43,653,001 $ 43,653,001
Transportation Fees \50,000 150,000 198,711 $ 48,711
Miscellaneous ISO 000 150,000 136,703 {13,297)
Total Local Revenues 43,953,001 43,953 001 43,988,415 35,414
State Sources Equalization Aid 6,660,858 6,660,858 6,660,858 Special Education Aid 2,204,418 2,204,418 2,204,418 Security Aid 97,143 97,143 97,143 Transportation Aid 100,859 100,859 100,859 Extraordinary Aid 150,000 l 50,000 246,674 96,674 Parcc Readiness Aid 34,410 34,410 34,410 Per Pupil Growth Aid 34,410 34,410 34,410 Non-Public Transportation Aid 26,100 26,100 On BehalfTPAF Contributions
(Non Budgeted) Pension Contribution - NCGI Premium 90,469 90,469 Pension Benefit Contribution 1,257,469 1,257,469 Post Retirement Medical Benefit Contribution 2,139,852 2,139,852
Reimbursed TPAF Social Security Contribution (Non Budgeted) 2,001,968 2,001,968
Total State Revenues 9,282,098 9,282,098 14,894,630 5,612,532
Federal Sources
Medicaid Reimbursement 25,790 25,790 68,769 42,979
Total Federal Revenues 25,790 25,790 68,769 42,979
Total Revenues 53,260,889 53,260,889 58,951,814 5,690,925
CURRENT EXPENDITURES Regular Programs - Instruction
Salaries of Teachers Preschool 136,753 $ (2,551) 134,202 134,202 Kindergarten l,lll,\60 (226,737) 884,423 884,423 Grades 1-5 6,121,943 (375,533) 5,746,410 5,746,410 Grades 6-8 3,839,563 79,618 3,919,181 3,919,181 Grades 9-12 5,410,399 (197,784) 5,212,615 5,212,615
Regular Programs - Home Instruction Salaries of Teachers 30,000 (3,285) 26,715 26,144 571 Purchased Professional/Educational Services 24,993 24,993 22,560 2,433
Regular Programs - Undistributed Instruction Other Salaries for Instruction 82,206 (56,497) 25,709 25,709 Purchased Professional/Educational Services 14,000 563,077 577,077 567,883 9,194 Purchased Technical Services 118,171 (4,900) 113,271 113,257 14 Other Purchased Services 133,650 46,889 180,539 158,742 21,797 General Supplies 661,592 33,875 695,467 660,714 34,753 Textbooks 29,796 (10,578) 19,218 17,915 1,303 Other Objects 9,955 9,955 5,379 4,576
Total Regular Programs 17,699,188 {129,413) 17,569 775 17,495,134 74,641
Special Education Learning I Language Disabilities
Salaries of Teachers 255,888 (6,055) 249,833 244,252 5,581 Other Salaries for Instruction 87,036 (3,465) 83,571 82,156 1,415
Total Learning I Language Disabilities 342,924 (9,520) 333,404 326,408 6,996
63

EXIIIDIT C-1
SOUTH PLAINFIELD BOARD OF EDUCATION GENERAL FUND
BUDGETARY COMPARISON SCHEDULE FOR THE FISCAL YEAR ENDED .JUNE 30,2015
Variance Original Final Final To Budget Adjustments Budget Actual Actual
CURRENT EXPENDITURES (Continued)
Visually Impaired
Other Salaries for Instruction $ 11,224 $ 11,224 $ 11,224
Total Visually Impaired 11,224 11,224 11,224
Multiple Disabilities Salaries of Teachers $ 275,468 116,318 391,786 388,498 $ 3,288 Other Salaries for Instruction 89,376 (3,846) 85,530 82,516 3,014 Purchased Professional/Educational Services 2,460 2,460 588 1,872 General Supplies 8,600 8,600 4,142 4,458
Total Multiple Disabilities 373,444 114,932 488,376 475,744 12,632
Resource Room I Resource Center Salaries of Teachers 2,776,383 (184,779) 2,591,604 2,591,604 Other Salaries for Instruction 760,542 (10,000) 750,542 743,573 6,969 Purchased Professional/Educational Services 92,813 92,813 71,681 21,132 General Supplies 18,663 (7,212) 11,451 IO,Il7 1,334 Textbooks 3,712 3,712 1,673 2,039
Total Resource Room I Resource Center 3,555,588 (105,466) 3,450,122 3,418,648 31,474
Preschool Disabilities - Full - Time Salaries of Teachers 124,553 840 125,393 125,352 41 Other Salaries for Instruction 213,925 (840) 213,085 204,758 8,327 General Supplies 2,500 2,500 2,169 331
Total Preschool Disabilities- Full- Time 340,978 340,978 332,279 8,699
Home Instruction Salaries of Teachers 30,000 (15,000) 15,000 9,106 5,894 Purchased Professional/Educational Services 20,000 (16,960) 3,040 1,726 1,314
Total Home Instruction 50,000 (31,960) 18,040 10,832 7,208
Total Special Education 4,662 934 (20,790) 4,642,144 4,575,135 67,009
Basic Skills/Remedial Salaries of Teachers 507,175 {24,504) 482,671 481,966 705
Total Basic Skills/Remedial 507,175 (24,504) 482,671 481,966 705
Bilingual Education Salaries of Teachers 288,620 (35,170) 253,450 249,569 3,881
Total Bilingual Education 288,620 (35,170) 253,450 249,569 3,88 I
School Sponsored Co-Curricular Activities Salaries 134,686 1,500 136,186 130,179 6,007 Purchased Services 1,500 1,500 1,500
Supplies and Materials 22,750 5,000 27,750 14,687 13,063 Other Objects 9,380 6,000 15,380 5,285 10,095
Total School Sponsored Co-Curricular Activities 166,816 14,000 180,816 151,651 29,165
School Sponsored Athletics " Instruction Salaries 654,391 (60,464) 593,927 585,374 8,553
Purchased Services 150,205 (9,735) 140,470 117,538 22,932
Supplies and Materials 53,851 13,613 67,464 66,732 732
Other Objects 41,286 41,2&6 35,560 5,726
Total School Sponsored Athletics- Instruction 899,733 {56,586) &43,147 &05,204 37,943
Total- Instruction 24,224,466 (252,463) 23,972,003 23,75& 659 213,344
64

EXHIBIT CMI SOUTH PLAINFIELD BOARD OF EDUCATION
GENERAL FUND BUDGETARY COMPARISON SCHEDllLE
FOR THE FISCAL YEAR ENDED JUNE 30, 2015 Variance
Original Final Final To Budget Adjustments Budget Actual Actual
CURRENT EXPENDITURES (Continued) Undistributed Expenditures
Instruction Tuition- Other LEA's Within State - Regular $ 6,000 $ 1,790 $ 7,790 $ 6,000 $ 1,790 Tuition - Other LEA's Within State - Special 216,874 (107,145) 109,729 106,205 3,524 Tuition to County Special Services- School
Districts & Regional Day Schools 820,750 98,626 919,376 813,006 106,370 Tuition to Private Schools- Disabled Within
State 316,333 207,361 523,694 494,736 28,958 Tuition - State Facilities 17,699 (14,808) 2,891 2,890 I Tuition -Other 106,626 106,626 106,626
Total Undistributed Expenditures- Instruction 1,377,656 292,450 1,670,106 1,529,463 140,643
Attendance and Social Work Services Salaries 90,184 12,540 102,724 102,723
Total Attendance and Social Work Services 90,184 12,540 102,724 102,723
Health Services Salaries 679,859 679,859 672,002 7,857 Purchased Professional and Technical Services 12,060 12,060 7,110 4,950 Other Purchased Services 2,000 (383) 1,617 145 1,472 Supplies and Materials 17,900 178 18,078 15,803 2,275 Other Objects 805 205 1,010 902 108
Total Health Services 712,624 712,624 695,962 16,662
Speech, OT, PT and Related Services Salaries 461,769 (20,924) 440,845 435,526 5,319 Purchased Professional-Educational Services 569,405 126,503 695,908 641,780 54,128 Supplies and Materials 8,700 {2,200) 6,500 6,403 97
Total Speech, OT, PT and Related Services 1,039,874 103,379 1,143,253 1,083,709 59,544
Other Support Services-Students-Extra Services Salaries 155,462 47,253 202,715 202,384 331 Purchased Professional-Educational Services 161,000 7,977 168,977 141,128 27,849 Supplies and Materials 5,800 4,500 10,300 9,434 866
Total Other Support Services-Extra 322,262 59,730 381,992 352,946 29,046
Guidance Salaries of Other Protessional Staff 1,100,439 (126,403) 974,036 966,515 7,521 Salaries of Secretarial and Clerical Assistants 145,876 300 146,176 146,176 Purchased Professional and Technical Services 2,500 2,500 2,500 Other Purchased Services 14,219 (428) 13,791 11,413 2,378 Supplies and Materials 43,615 (5,404) 38,211 36,139 2,072 Other Objects 2,850 5 2,855 2,855
Total Guidance 1,309,499 (131,930) 1,177,569 1,163,098 14,471
Child Study Team Salaries of Other Professional Staff 709,682 2,900 712,582 711,523 1,059 Salaries of Secretarial and Clerical Assistants 139,776 (2,900) 136,876 134,324 2,552 Other Salaries 101,439 (101 ,439) Purchased Professional-Educational Services 25,000 10,010 35,010 33,683 1,327 Other Purchased Professionalffechnical Services 7,500 9,885 17,385 17,295 90 Other Purchased Services 8,7!0 8,710 5,423 3,287 Miscellaneous Purchased Services 13,500 (2,728) 10,772 9,650 1,122 Supplies and Materials 15,000 1,540 16,540 16,088 452 Other Objects 500 {282) 218 218
Total Child Study Team 1,012,397 {74,304) 938,093 928,204 9,889
65
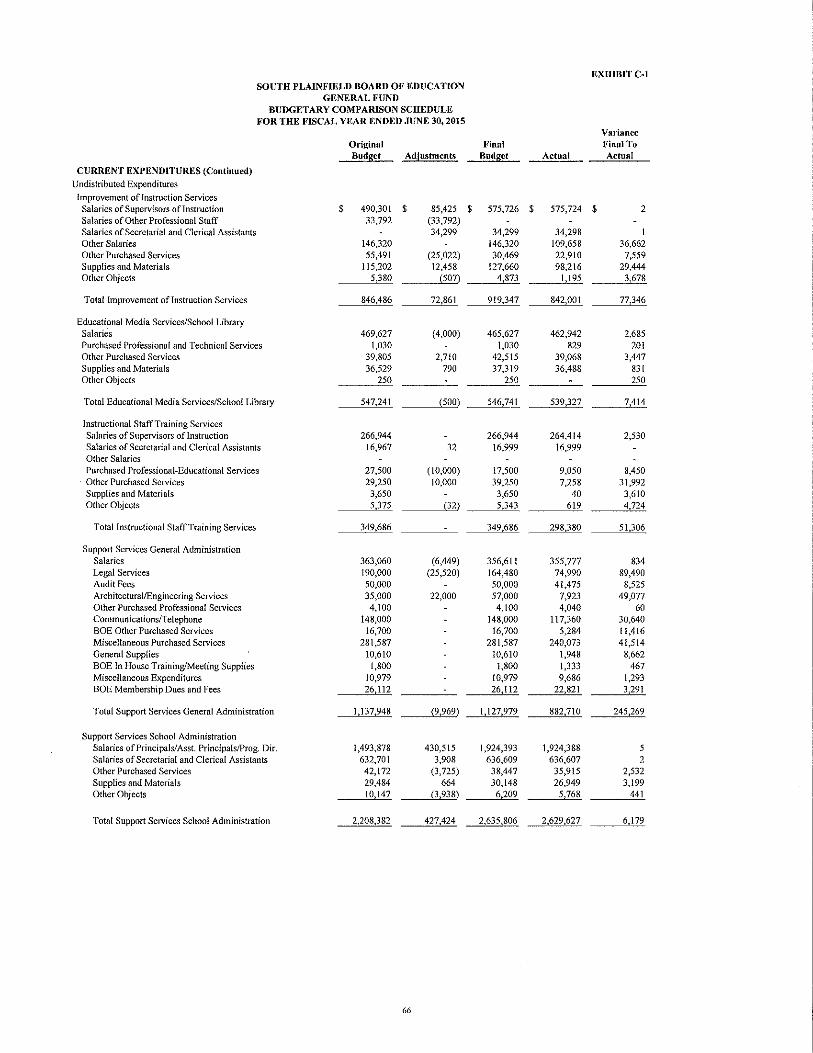
EXHIBITC~t
SOUTH PLAINFIELD BOARD OF EDUCATION GENERAL FUND
BUDGETARY COMPARISON SCHEDULE FOR THE FISCAL YEAR ENDED .JUNE 30, 2015
Variance Original Final Final To Budget Adjustments Budget Actual Actual
CURRENT EXPENDITURES (Continued)
Undistributed Expenditures
Improvement of Instruction Services Salaries of Supervisors of Instruction $ 490,301 $ 85,425 $ 575,726 $ 575,724 $ 2 Salaries of Other Professional Staff 33,792 (33,792) Salaries of Secretarial and Clerical Assistants 34,299 34,299 34,298 I Other Salaries 146,320 146,320 109,658 36,662 Other Purchased Services 55,491 (25,022) 30,469 22,910 7,559 Supplies and Materials 115,202 12,458 127,660 98,216 29,444 Other Objects 5,380 {507) 4,873 1,195 3,678
Total !mprovement of Instruction Services 846,486 72,861 919,347 842,001 77,346
Educational Media Services/School Library Salaries 469,627 (4,000) 465,627 462,942 2,685 Purchased Professional and Technical Services 1,030 1,030 829 201 Other Purchased Services 39,805 2,7l0 42,515 39,068 3,447 Supplies and Materials 36,529 790 37,319 36,488 831 Other Objects 250 250 250
Total Educational Media Services/School Library 547,241 {500) 546,741 539,327 7,414
Instructional Staff Training Services Salaries of Supervisors of Instruction 266,944 266,944 264,414 2,530 Salaries of Secretarial and Clerical Assistants 16,967 32 16,999 16,999 Other Salaries Purchased Professional-Educational Services 27,500 (10,000) 17,500 9,050 8,450 Other Purchased Services 29,250 10,000 39,250 7,258 31,992 Supplies and Materials 3,650 3,650 40 3,610 Other Objects 5,375 (32) 5,343 619 4,724
Total Instructional Staff Training Services 349,686 349,686 298,380 51,306
Support Services General Administration Salaries 363,060 (6,449) 356,611 355,777 834 Legal Services 190,000 (25,520) 164,480 74,990 89,490 Audit Fees 50,000 50,000 41,475 8,525 Architectural/Engineering Services 35,000 22,000 57,000 7,923 49,077 Other Purchased Professional Services 4,100 4,100 4,040 60 Communications/Telephone 148,000 148,000 117,360 30,640 BOE Other Purchased Services 16,700 16,700 5,284 11,416 Miscellaneous Purchased Services 281,587 281,587 240,073 41,514 General Supplies 10,610 10,610 1,948 8,662 BOE In House Training/Meeting Supplies 1,800 1,800 1,333 467 Misce!laneous Expenditures 10,979 10,979 9,686 1,293 BOE Membership Dues and Fees 26,112 26,112 22,821 3,291
Total Support Services General Administration 1,137,948 (9,969) 1,127,979 882,710 245,269
Support Services School Administration Salaries of Principals/Asst. Principals/Prog. Dir. 1,493,878 430,515 1,924,393 1,924,388 5 Salaries of Secretarial and Clerical Assistants 632,701 3,908 636,609 636,607 2 Other Purchased Services 42,172 (3,725) 38,447 35,915 2,532 Supplies and Materials 29,484 664 30,148 26,949 3,199 Other Objects 10,147 {3,938) 6,209 5,768 441
Total Support Services School Administration 2,208,382 427,424 2,635,806 2,629,627 6,179
66
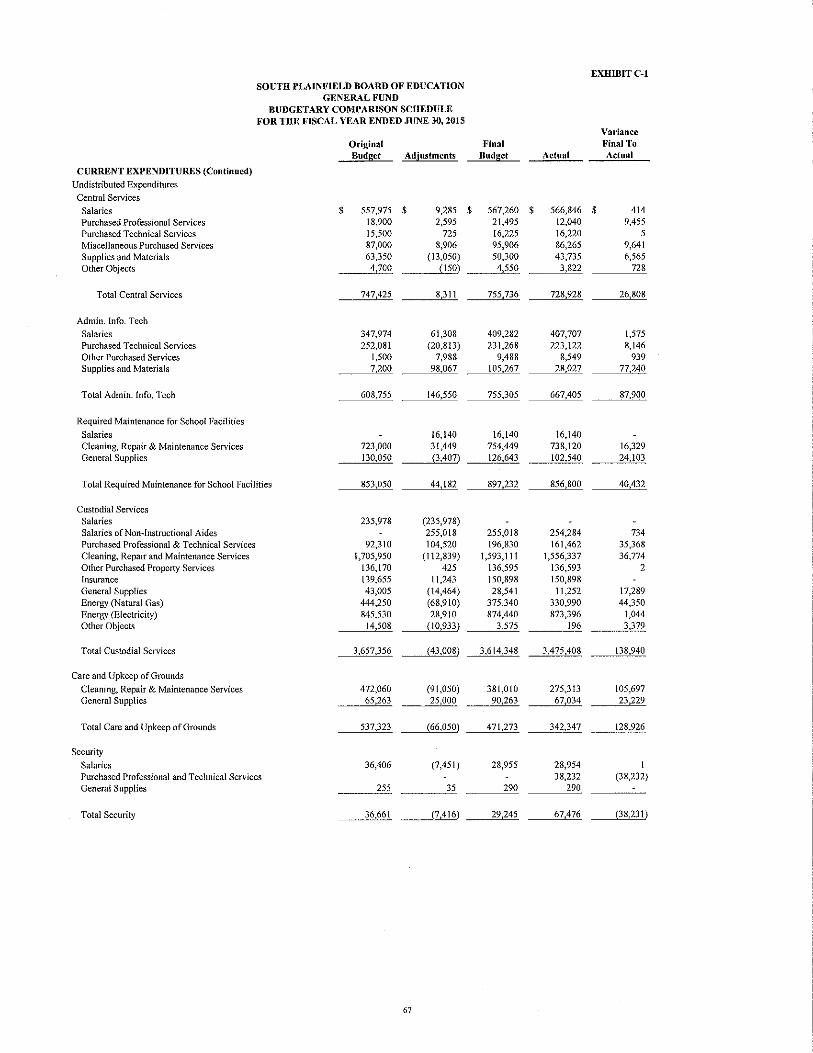
EXHIDITC-1 SOUTH PLAINFIELD BOARD OF EDUCATION
GENERAL FUND BUDGETARY COMPARISON SCHEDULE
FOR THE FISCAL YEAR ENDED JUNE 30, 2015 Variance
Original Final Final To Budget Adjustments Budget Actual Actual
CURRENT EXPENDITURES (Continued) Undistributed Expenditures
Central Services
Salaries $ 557,975 $ 9,285 $ 567,260 $ 566,846 $ 414 Purchased Professional Services 18,900 2,595 21,495 12,040 9,455 Purchased Technical Services 15,500 725 16,225 16,220 5 Miscellaneous Purchased Services 87,000 8,906 95,906 86,265 9,641 Supplies and Materials 63,350 (13,050) 50,300 43,735 6,565 Other Objects 4,700 (!50) 4,550 3,822 728
Total Central Services 747,425 8,311 755,736 728,928 26,808
Admin. Info. Tech
Salaries 347,974 61,308 409,282 407,707 1,575 Purchased Technical Services 252,081 (20,813) 231,268 223,122 8,146 Other Purchased Services 1,500 7,988 9,488 8,549 939 Supplies and Materials 7,200 98,067 105,267 28,027 77,240
Total Admin. Info. Tech 608,755 146,550 755,305 667,405 87,900
Required Maintenance for School Facilities
Salaries 16,140 16,140 16,140 Cleaning, Repair & Maintenance Services 723,000 31,449 754,449 738,120 16,329 General Supplies 130,050 (3,407) 126,643 102,540 24,103
Total Required Maintenance for School Facilities 853,050 44,182 897,232 856,800 40,432
Custodial Services Salaries 235,978 (235,978) Salaries of Non-Instructional Aides 255,018 255,018 254,284 734 Purchased Professional & Technical Services 92,310 104,520 196,830 161,462 35,368 Cleaning, Repair and Maintenance Services 1,705,950 (112,839) 1,593,111 1,556,337 36,774 Other Purchased Property Services 136,170 425 136,595 136,593 2 Insurance 139,655 11,243 150,898 150,898 General Supplies 43,005 (14,464) 28,541 11,252 17,289 Enerb'Y (Natural Gas) 444,250 (68,910) 375,340 330,990 44,350 Energy (Electricity) 845,530 28,910 874,440 873,396 1,044 Other Objects 14,508 (10,933) 3,575 196 3,379
Total Custodial Services 3,657,356 {43,008) 3,614,348 3,475,408 138,940
Care and Upkeep of Grounds
Cleaning, Repair & Maintenance Services 472,060 (91,050) 381,010 275,313 105,697 General Supplies 65,263 25,000 90,263 67,034 23,229
Total Care and Upkeep of Grounds 537,323 {66,050) 471,273 342,347 128,926
Security
Salaries 36,406 (7,451) 28,955 28,954 I Purchased Professional and Technical Services 38,232 (38,232) General Supplies 255 35 290 290
Total Security 36,661 (7,416) 29,245 67,476 (38,231)
67

EXHffiiTC-1 SOUTH PLAINFIELD BOARD OF EDUCATION
GENERAL FUND BUDGETARY COMPARISON SCHEDULE
FOR THE FISCAL YEAR ENDED JUNE 30, 2015 Variance
Original Final Final To Budget Adjustments Budget Actual Actual
Student Transportation Services Salaries ofNon-Instructional Aides $ 141,830 $ 8,090 $ 149,920 $ 149,350 $ 570 Salaries for Pupil Transportation
(Between Home and School) - Regular 536,704 16,450 553,154 548,564 4,590 Salaries for Pupil Transportation
(Between Home and School) - Special 339,770 (43,850) 295,920 286,895 9,025 Salaries for Pupil Transportation
(Other Than Between Home & School) 100,000 4,000 104,000 99,158 4,842 Cleaning, Repair and Maintenance Services 144,800 (4,444) 140,356 132,788 7,568 Aid in Lieu Payments- NonPublic Schools 119,340 (20,696) 98,644 98,644 Aid in Lieu Payments - Charter Schools 3,536 (1,768) 1,768 1,768 Contracted Services (Other Than Between Home
and School)- Vendors 20,000 20,000 20,000 Contracted Services (Special Education
Students)- Joint Agreements 140,000 28,395 168,395 80,761 87,634 Contracted Services (Spec Ed)- ESC's & CTSA's 205,000 170,995 375,995 335,338 40,657 Miscellaneous Purchased Services - Transportation 81,000 (4,000) 77,000 73,641 3,359 General Supplies 15,000 15,000 13,861 1,139 Transportation Supplies 154,200 (75,000) 79,200 66,074 13,126 Other Objects 7,171 (412) 6,759 4,391 2,368
Total Student Transportation Services 2,008,351 77,760 2,086,111 1,891,233 194,878
Unallocated Benefits Social Security Contributions 710,000 710,000 522,960 187,040 Other Retirement Contributions - PERS 565,000 (58,204) 506,796 506,796 Unemployment Compensation 85,000 (1) 84,999 1,084 83,915 Miscellaneous Purchased Services Workmen's Compensation 174,948 401 I 75,349 175,348 1 Health Benefits 9,500,000 (525,125) 8,974,875 8,561,538 413,337 Tuition Reimbursement 10,000 28,365 38,365 38,365 Other Employee Benefits 59,923 ~28,765) 31,158 250 30,908
Total Una!located Benefits 11,104,871 (583,329) 10,521,542 9,806,34 [ 715,201
On BehalfTPAF Contributions (Non Budgeted) Pension Contribution- NCGI Premium 90,469 (90,469) Pension Benefit Contribution 1,257,469 (1,257,469) Post Retirement Medical Benefit Contribution 2,139,852 (2,139,852)
Reimbursed TPAF Social Security Contribution (Non Budgeted) 2,001,968 (2,001,968)
Total On-Behalf Contributions 5,489,758 {5,489,758)
Total Undistributed Expenditures 30,508,031 328,681 30,836,712 34,373,846 {3,537,134)
Total Expenditures- Current Expenditures 54,732,497 76,218 54,808,715 '58,132,505 (3,323,790)
68

EXHIBITC~l
SOUTH PLAINFIELD BOARD OF EDUCATION GENERAL lc'UNO
BUDGETARY COMPARISON SCHEDULE FOR THE FISCAL YEAR ENDED JUNE 30, 2015
Variance Original Final Final To Budget Adjustments Budget Actual Actual
CAPITAL OUTLAY Equipment Grades 9~12 $ 268,397 $ 268,397 $ 268,397 School Sponsored Athletics 15,559 15,559 5,094 $ 10,465 Support Services
Health 3,855 3,855 3,855 Required Maintenance 5,999 5,999 5,999 Non-Instructional- Food Service 6,746 6,746 6,746
School Buses - Special $ 65,000 (190) 64 810 64,527 283
Total Equipment 65 000 300,366 365,366 354,618 10,748
Facilities Acquisition and Construction Services Architectural/Engineer Services 444,000 (434,042) 9,958 7,785 2,173 Construction Services 426,400 (249,325) 177,075 7,655 169,420 Other Objects 64,257 64,257 64,257
Total Facilities Acquis. and Const. Services 934,657 {683,367) 251,290 79,697 171,593
Total Capital Outlay 999,657 {383,001) 616,656 434,315 182,341
Charter Schools
Transfer To Charter Schools 55,480 (11,063) 44,417 19,452 24,965
Total Transfer to Charter Schools 55,480 (11,063) 44,417 19,452 24,965
Total Expenditures 55 787,634 (317,846) 55,469,788 58,586,272 (3,116,484)
Excess (Deficiency) of Revenues Over (Under) Expenditures {2,526,745) 317,846 {2,208,899) 365,542 2,574,441
Other Financing Sources (Uses) ROD Grants " State Share 870,000 (870,000) Transfers Out- Capital Projects Fund (1,305,600) (176,000) (1,481,600) (1,481,600) Transfers In" Enterprise Funds 400,000 400,000 400,000
Total Other Financing Sources (Uses) (35,600) {1,046,000) (I ,081 ,600) {1,081,600)
Net Change in Fund Balances (2,562,345) (728,154) (3,290,499) (716,058) 2,574,441
Fund Balances, Beginning of Year 6,517,201 6,517,201 6,517,201
Fund Balances, End of Year $ 3,954,856 $ (728,154) $ 3,226,702 $ 5,801,143 $ 2,574,441
Recapitulation Restricted
Capital Reserve $ 1,033,879 Maintenance Reserve 449,481 Emergency Reserve 196,533 Reserved Excess Surplus 1,214,259 Reserved Excess Surplus- Designated for Subsequent Year's Expenditures 926,879
Committed Year End Encumbrances 169,420
Assigned Year End Encumbrances 290,092 SEMI-ARRA 8,143 Designated for Subsequent Year's Expenditures 298,121
Unassigned 1,214,336
5,801,143
Reconciliation to Governmental Funds Statements (GAAP) Less State Aid Revenue Not Recognized on GAAP Basis (1,126,446)
Fund Balance Per Governmental Funds (GAAP) $ 4,674,697
69
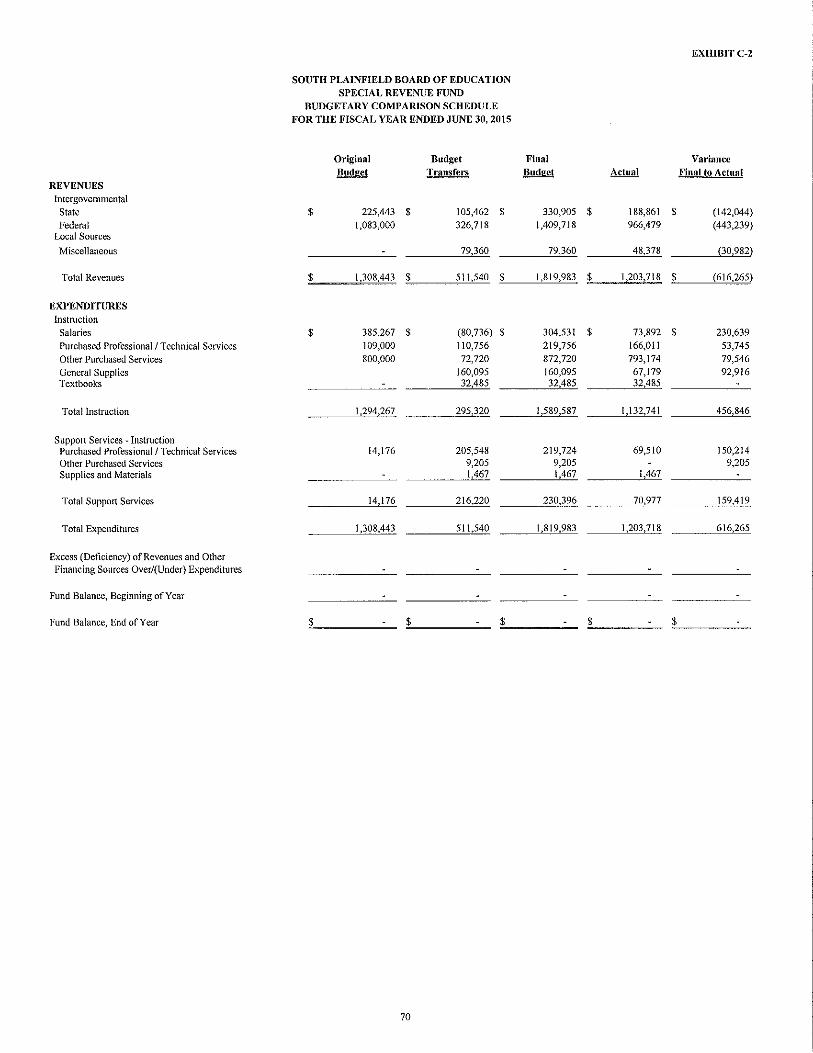
EXHIBITC~2
SOUTH PLAINFIELD BOARD OF EDUCATION SPECIAL REVENUE FUND
BUDGETARY COMPARISON SCHEDULE FOR THE FISCAL YEAR ENDED JUNE 30,2015
Original Budget Final Variance Budget Transfers Budget Actual Final to Actual
REVENUES Intergovernmental
State $ 225,443 $ 105,462 $ 330,905 $ 188,861 $ (142,044) Federal 1,083,000 326,718 1,409,718 966,479 (443,239)
Local Sources
Miscellaneous 79,360 79,360 48,378 (30,982)
Total Revenues $ 1,308,443 $ 511,540 $ 1,819,983 $ 1,203,718 $ (616,265)
EXPENDITURES Instruction Salaries $ 385,267 $ (80,736) $ 304,531 $ 73,892 $ 230,639 Purchased Professional I Technical Services 109,000 110,756 219,756 166,011 53,745
Other Purchased Services 800,000 72,720 872,720 793,174 79,546
General Supplies 160,095 160,095 67,179 92,916 Textbooks 32,485 32,485 32,485
Total Instruction 1,294,267 295,320 1,589,587 1,132,741 456,846
Support Services- Instruction Purchased Professional I Technical Services 14,176 205,548 219,724 69,510 150,214 Other Purchased Services 9,205 9,205 9,205 Supplies and Materials 1,467 1,467 1,467
Total Support Services 14,176 216,220 230,396 70,977 159,419
Total Expenditures 1,308,443 511,540 1,819,983 1,203,718 616,265
Excess (Deficiency) of Revenues and Other Financing Sources Over/(Under) Expenditures
Fund Balance, Beginning of Year
Fund Balance, End of Year $ $ $ $ $
70
NOTES TO THE REQUIRED SUPPLEMENTARY INFORMATION- PART II

SOUTH PLAINFIELD BOARD OF EDUCATION REQUIRED SUPPLEMENTARY INFORMATION
BUDGETARY COMPARISON SCHEDULES NOTES TO THE REQUIRED SUPPLEMENTARY INFORMATION
FOR THE FISCAL YEAR ENDED JUNE 30, 2015
EXHIBIT C-3
Formal budgetary integration into the accounting system is employed as a management control device during the year. For governmental funds there are no substantial differences between the budgetary basis of accounting i:tnd accounting principles generally accepted in the United States of America, with the exception of the legally mandated revenue recognition of certain state aid payments for budgetary purposes only and the treatment of encumbrances in the special revenue fund as described below. Encumbrance accounting is also employed as an extension of formal budgetary integration of the governmental fund types. Unencumbered appropriations lapse at fiscal year end.
The accounting records of the Special Revenue Funds are maintained on the grant accounting budgetary basis. The grant accounting budgetary basis differs from GAAP in that the grant accounting budgetary basis recognizes encumbrances as expenditures and also recognizes the related revenues, whereas the GAAP basis does not. Sufficient supplemental records are maintained to allow for the presentation of GAAP basis financial reports.
The following presents a reconciliation of the General and Special Revenue Funds from the budgetary basis of accounting as presented in the Budgetary Comparison Schedule - General Fund and Special Revenue Fund to the GAAP basis of accounting as presented in the Statement of Revenues, Expenditures and Changes in Fund Balance - Governmental Funds.
Sources/inflows of resources Actual amounts (budgetary basis) 11 revenue11
from the budgetary comparison schedule Difference- Budget to GAAP:
State Aid payments recognized for budgetary purposes, not
recognized for GAAP statements.(2014-2015) State Aid payments recognized for GAAP statements, not
recognized for budgetary purposes (2013-2014) Grant accounting budgetary basis differs from GAAP in that
encumbrances are recognized as expenditures, and the related revenue is recognized.
Encumbrances, June 30, 2015 Encumbrances, June 30, 2014
Total revenues as reported on the Statement of Revenues, Expenditures
and Changes in Fund Balances - Governmental Funds.
Uses/outflows of resources Actual amounts (budgetary basis) "total expenditures" from the
budgetary comparison schedule
Differences - Budget to GAAP Encumbrances for supplies and equipment ordered but
not received are reported in the year the order is placed for budgetary purposes, but in the year the supplies are received for financial reporting purposes.
Encumbrances, June 30, 2015
Encumbrances, June 30, 2014
Total expenditures as reported on the Statement of Revenues, Expenditures, and Changes in Fund Balances - Governmental Funds
71
General Fund
$ 58,951,814 $
(1,126,446)
1,023,054
$ 58,848,422 $
$ 58,586,272 $
$ 58,586,272 $
Special Revenue
Fund
1,203,718
(5,280)
5,280
(17,395) 12,047
1,198,370
1,203,718
(17,395)
12,047
1,198,370

REQUIRED SUPPLEMENTARY INFORMATION- PART III
PENSION INFORMATION
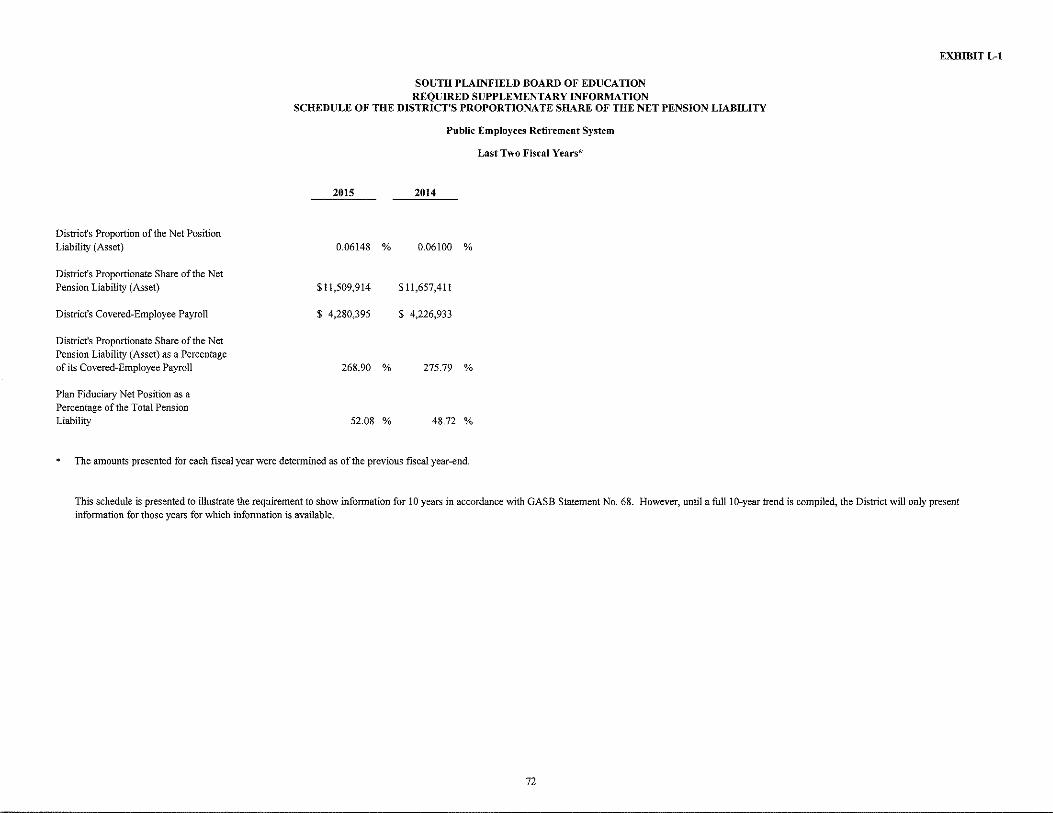
District's Proportion of the Net Position Liability (Asset}
District's Proportionate Share of the Net Pension Liability (Asset)
District's Covered~Employee Payroll
District's Proportionate Share of the Net Pension Liability (Asset) as a Percentage of its Covered-Employee Payroll
Plan Fiduciary Net Position as a Percentage of the Total Pension Liability
SOUTH PLAINFIELD BOARD OF EDUCATION REQUIRED SUPPLEMENTARY INFORMATION
SCHEDULE OF THE DISTRICT'S PROPORTIONATE SHARE OF THE NET PENSION LIABILITY
Public Employees Retirement System
Last Two Fiscal Years*
2015 2014
0.06148 % 0.06100 %
$11,509,914 $11,657,411
$ 4,280,395 $ 4,226,933
268.90 % 275.79 %
52.08 % 48.72 %
The amounts presented for each fiscal year were determined as of the previous fiscal year-end.
EXHIBIT L-1
This schedule is presented to illustrate the requirement to show information for 10 years in accordance with GASB Statement No. 68. However, until a fulllO-year trend is compiled, the District will only present information for those years for which information is available.
72
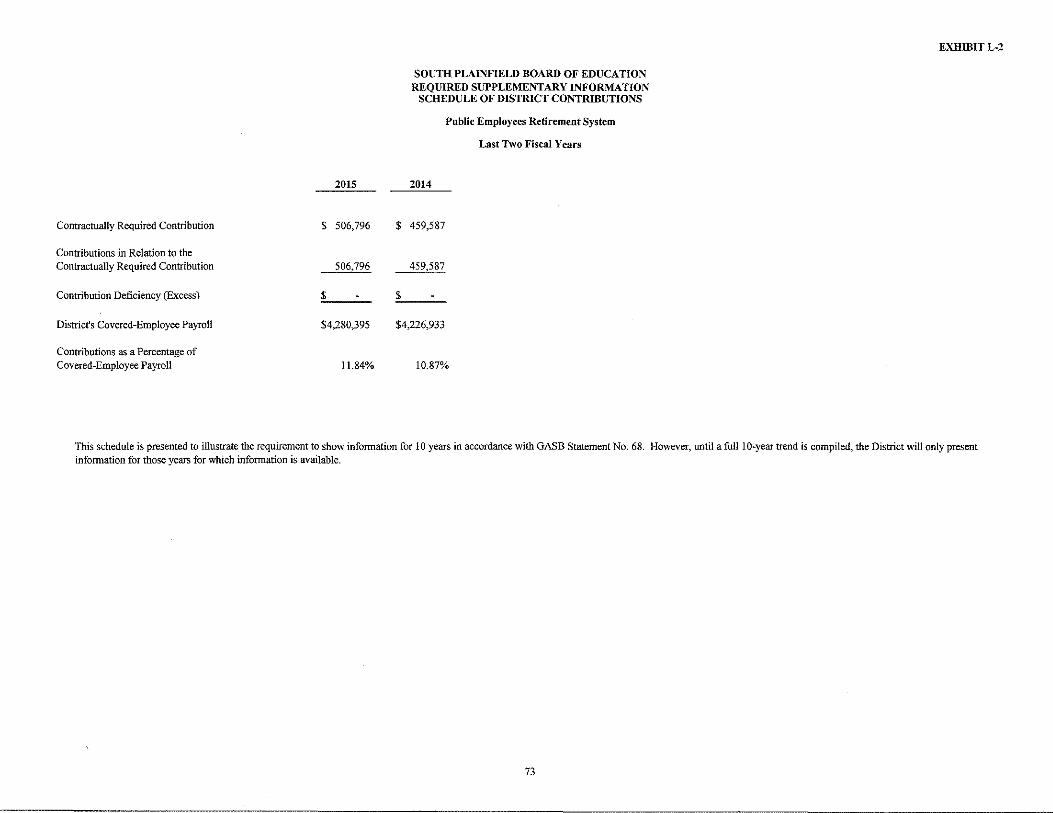
Contractually Required Contribution
Contributions in Relation to the Contractually Required Contribution
Contribution Deficiency (Excess)
District's Covered-Employee Payroll
Contributions as a Percentage of Covered-Employee Payroll
2015
$ 506,796
506,796
$
$4,280,395
11.84%
SOUTH PLAINFIELD BOARD OF EDUCATION REQUIRED SUPPLEMENTARY INFORMATION
SCHEDULE OF DISTRICT CONTRIBUTIONS
Public Employees Retirement System
Last Two Fiscal Years
2014
$ 459,587
459,587
$
$4,226,933
10.87%
EXHIBITL-2
This schedule is presented to illustrate the requirement to show information for I 0 years in accordance with GASB Statement No. 68. However, until a full! 0-year trend is compiled, the District will only present information for those years for which information is available.
73
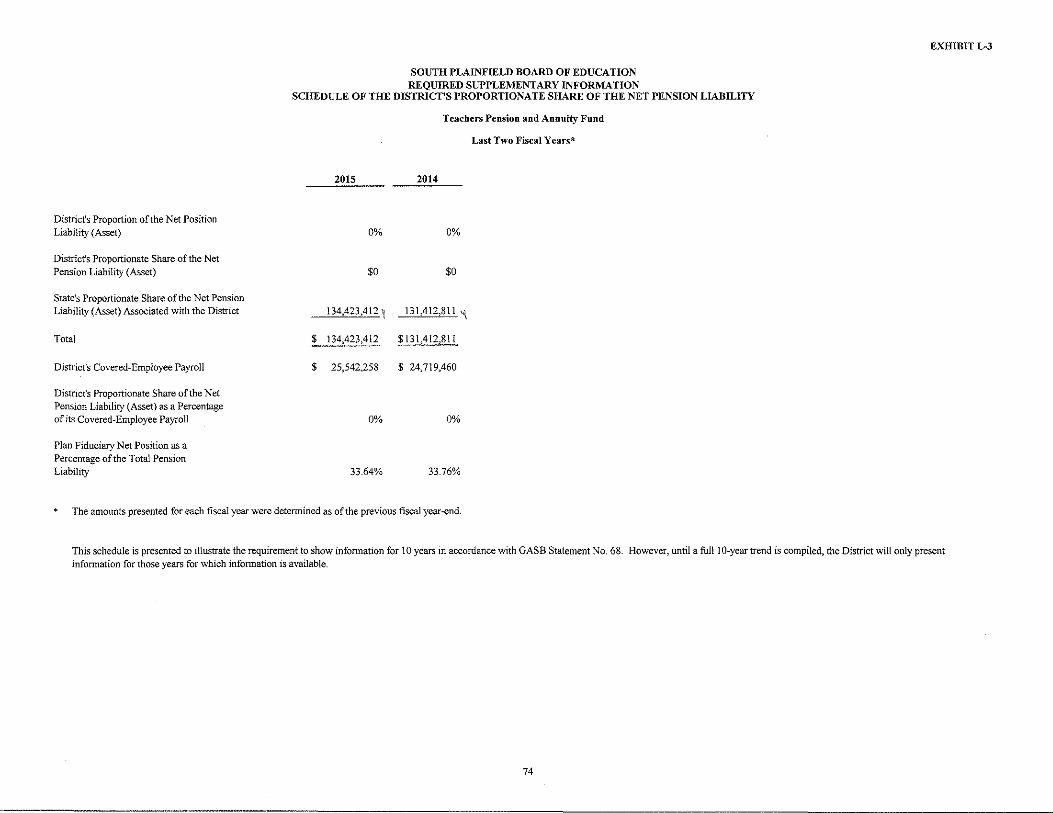
District's Proportion of the Net Position Liability (Asset)
District's Proportionate Share of the Net Pension Liability (Asset)
State's Proportionate Share of the Net Pension Liability (Asset) Associated with the District
Total
District's Covered-Employee Payroll
District's Proportionate Share of the Net Pension Liability (Asset) as a Percentage of its Covered-Employee Payroll
Plan Fiduciary Net Position as a Percentage of the Total Pension Liability
SOUTH PLAINFIELD BOARD OF EDUCATION REQUIRED SUPPLEMENTARY INFORMATION
SCHEDULE OF THE DISTRICT'S PROPORTIONATE SHARE OF THE NET PENSION LIABILITY
Teachers Pension and Annuity Fund
Last Two Fiscal Years*
2015 2014
0% 0%
$0 $0
134,423,412 i 131,412,811 "\
$ 134,423,412 $131,412,811
$ 25,542,258 $ 24,719,460
0% 0%
33.64% 33.76%
The amounts presented for each fiscal year were determined as of the previous fiscal year-end.
EXHIBIT L-3
This schedule is presented to illustrate the requirement to show information for 10 years in accordance with GASB Statement No. 68. However, until a full 1 0-year trend is compiled, the District will only present information for those years for which information is available.
74
SOUTH PLAINFIELD BOARD OF EDUCATION REQUIRED SUPPLEMENTARY INFORMATION
SCHEDULE OF DISTRICT'S PROPORTIONATE SHARE OF NET PENSION LIABILITY AND SCHEDULE OF DISTRICT CONTRIBUTIONS
NOTES TO REQUIRED SUPPLEMENTARY INFORMATION
Change of Benefit Terms:
Change of Assumptions:
FOR THE FISCAL YEAR ENDED JUNE 30, 2015
None.
The disconnt rate changed from the District's rate as of June 30, 2014 to the District's rate as of June 30, 2015, in accordance with GASB Statement No. 67.
74a
SCHOOL LEVELS SCHEDULES
GENERAL FUND
NOT APPLICABLE

SPECIAL REVENUE FUND
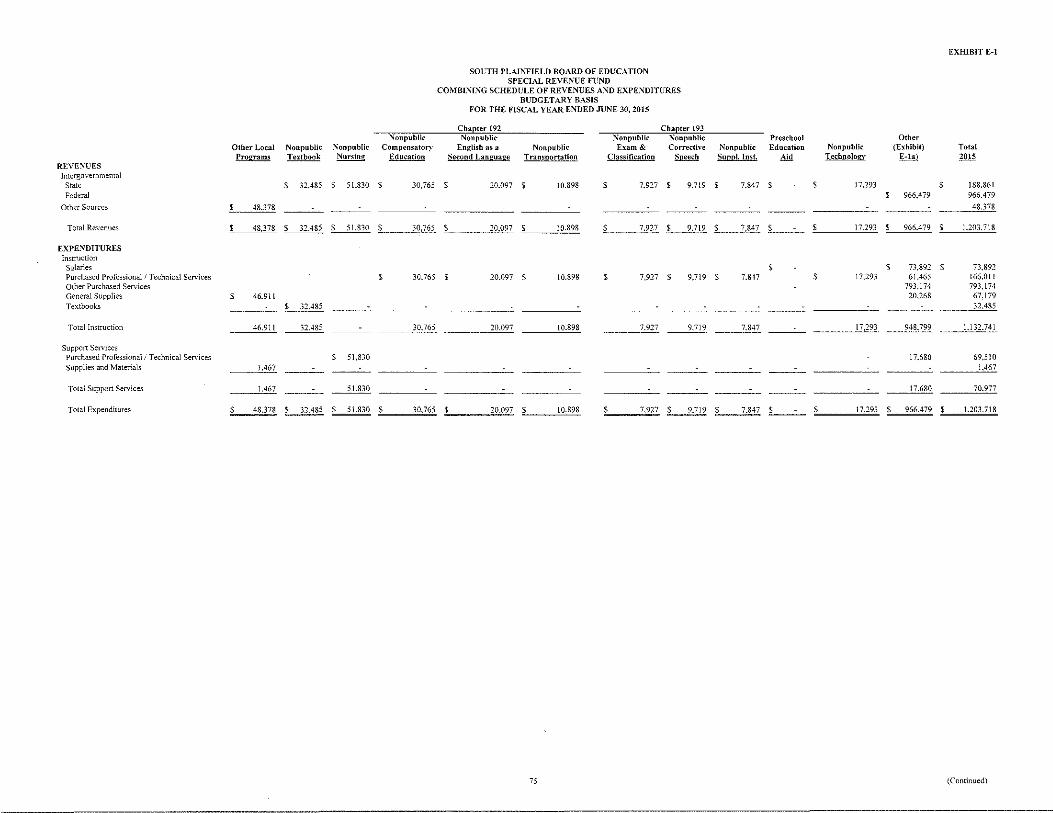
EXHIBIT E-l
SOt:TH PLAINFIELD BOARD OF EDUCATION SPECIAL REVEXUE FUND
COMBI:"'T\G SCHEDVLE OF REVENT.JES AND EXPE:'\DITURES BUDGETARY BASIS
FOR THE FISCAL YEAR ENDED JUNE 30,2015
Cba ter 192 Cba ter 193 NOilj)ublic Nonpublic Nonpublic Xonpublic Preschool Other
Other Local Nonpublic :"'"onpublic Compensatory English as a Nonpub!ic Exam& Corrective Nonpublic Education Nonpublic (E:~o:hibit) Total Pro<>rams Textbook Nursino Education Second Language Transnortation Classification Speech Snppl. Inst. Aid Technology &!.!1 2015
REVE:"''LIES Intergovemmemal
State $ 32.485 s 51.830 $ 30.765 s 20.097 $ 10.898 s 7.927 $ 9.719 s 7.847 $ s 17.293 $ 188,861 Federal $ 966.479 966.479
Other Sources $ 48.378 48.378 -------- ---- ----Total Revenues $ 48,378 $ 32.485 s 51,830 $ 30.765 s 20.097 s 10.898 $ 7.927 ~ s 7.847 _s ___ s 17.293 s 966.479 $ 1.203.718
EXPEXDITURES Instruction Salaries s s 73.892 $ 73.892 Purchased Professional/ Technical Services $ 30.765 s 20.097 $ 10.898 s 7.927 $ 9.719 s 7.847 s 17.293 61.465 166,011 Other Purchased Services 793.174 793,174 General Supplies $ 46.911 20.268 67.179 Textbooks $ 32.485 32.485
Total Instruction 46.911 32.485 ---- 30.765 20.097 10.898 7.927 ~ ___ 7.847 17.293 948.799 1.132.741
Support Services Purchased Protessional i Technical Services s 51.830 17.680 69.510 Supplies and Materials 1.467 -------- ---- ---- 1.467
Total Support Services 1.467 ----~ 17.680 70.977
Total Expenditures 5 ___ 48.378 L.1lill ~ s 30.765 $ 20.097 $ \0.898 s 7.927 L...21.!2. $ 7.847 _, ___ s 17.293 $ 966.479 $ 1.203.718
75 (Continued)

EXHIBIT E-1a
SOUTH PLAINFIELD BOARD OF EDUCATION SPECIAL REVENUE FUND
COMBINING SCHEDULE OF REVENUES AND EXPENDITURES BUDGETARY BASIS
FOR THE FISCAL YEAR ENDED JUNE 30,2015
Title III Total IDEA- Basic NCLB Title I IDEA NCLB Title IIA Emergency Immigrant N CLB Title III Exhibit
2014/2015 2013/2014 2014/2015 Preschool 2014/2015 2014/2015 2014/2015 E-la REVENUES
Intergovernmental Federal $ 717,601 $ 14,228 $ 123,962 $ 25,000 $ 60,969 $ 9,090 $ 15,629 $ 966,479
Total Revenues $ 717,601 $ 14,228 $ 123,962 $ 25,000 $ 60,969 $ 9,090 $ 15,629 $ 966,479
EXPENDITURES Instruction
Salaries $ 67,415 $ 3,178 $ 3,299 s 73,892 Purchased Professional/ Technical Services $ 14,228 $ 47,237 61,465 Other Purchased Services $ 699,921 47,006 s 25,000 11,495 3,548 6,204 793,174 General Supplies 9,541 2,237 2,364 6,126 20,268
Total Instruction 699,921 14,228 123,962 25,000 60,969 9,090 15,629 948,799
Support Services Purchased Professional I Technical Services 17,680 17,680
Total Support Services 17,680 17,680
Total Expenditures $ 717,601 $ 14,228 $ 123,962 $ 25,000 $ 60,969 $ 9,090 $ 15,629 $ 966,479
76
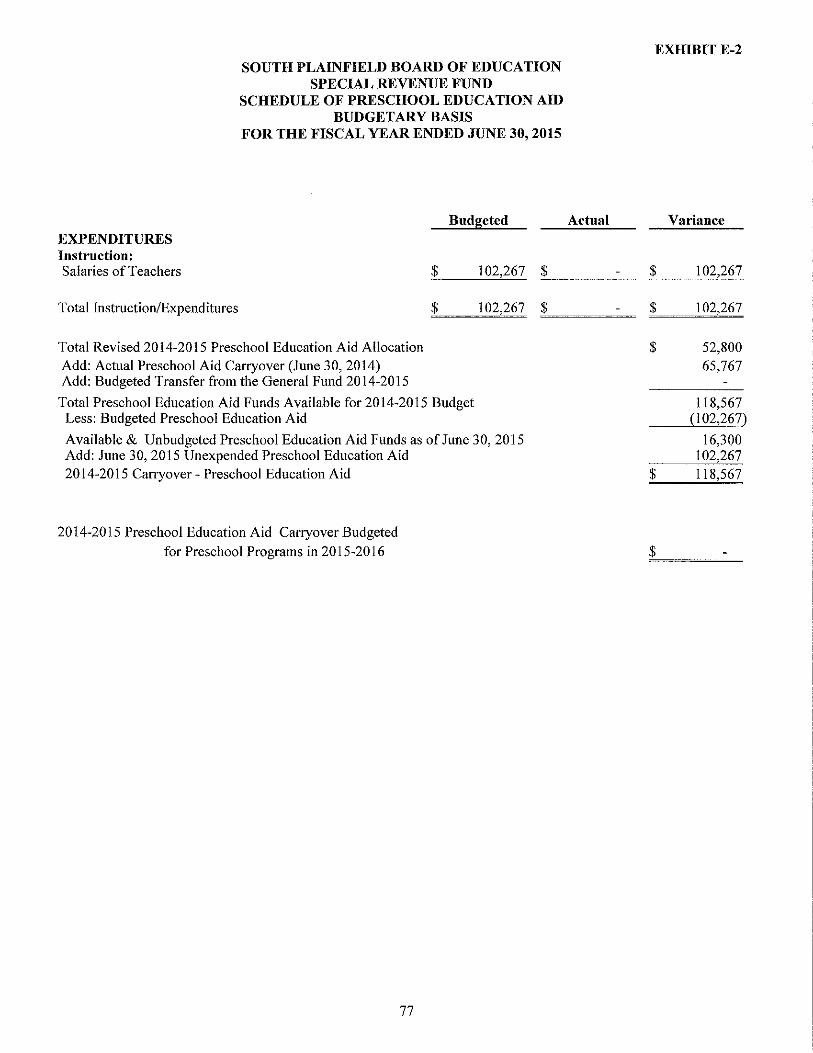
EXPENDITURES Instruction:
SOUTH PLAINFIELD BOARD OF EDUCATION SPECIAL REVENUE FUND
SCHEDULE OF PRESCHOOL EDUCATION AID BUDGETARY BASIS
FOR THE FISCAL YEAR ENDED JUNE 30, 2015
Budgeted Actual
Salaries of Teachers $ 102,267 "'-$ ----
Total Instruction/Expenditures
Total Revised 2014-2015 Preschool Education Aid Allocation Add: Actual Preschool Aid Carryover (June 30, 2014) Add: Budgeted Transfer from the General Fund 2014-2015
$
Total Preschool Education Aid Funds Available for 2014-2015 Budget Less: Budgeted Preschool Education Aid
102,267 ~$~~~~
Available & Unbudgeted Preschool Education Aid Funds as of June 30, 2015 Add: June 30, 2015 Unexpended Preschool Education Aid 2014-2015 Carryover- Preschool Education Aid
2014-2015 Preschool Education Aid Carryover Budgeted for Preschool Programs in 2015-2016
77
EXHIBITE-2
$
$
$
$
$
Variance
102,267
102,267
52,800 65,767
118,567 (1 02,267)
16,300 102,267 118,567
CAPITAL PROJECTS FUND
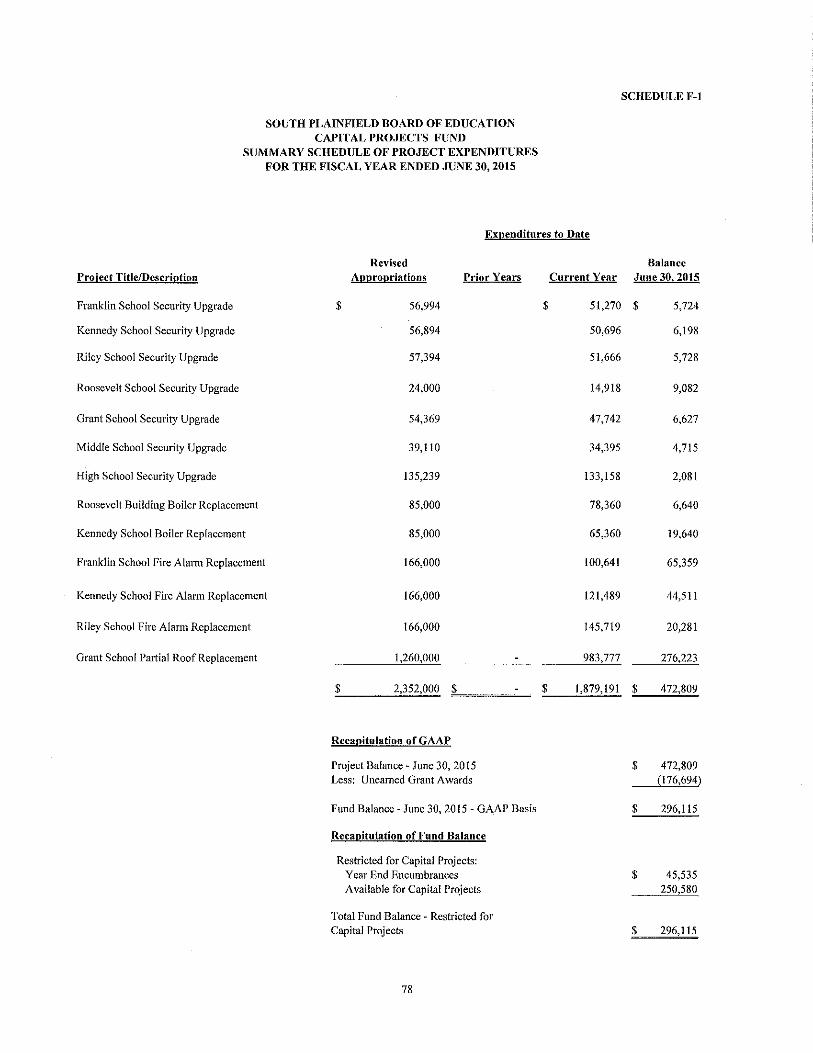
SOUTH PLAINFIELD BOARD OF EDUCATION CAPITAL PRO,JECTS FUND
SUMMARY SCHEDULE OF PROlliCT EXPENDITURES FOR THE FISCAL YEAR ENDED ,JUNE 30,2015
Ex(!enditures to Date
Revised Project Title/Descri(!tion Ap(!ropriations P1·ior Years Current Year
Franklin School Security Upgrade $ 56,994 $ 51,270
Kennedy School Security Upgrade 56,894 50,696
Riley School Security Upgrade 57,394 51,666
Roosevelt School Security Upgrade 24,000 14,918
Grant School Security Upgrade 54,369 47,742
Middle School Security Upgrade 39,110 34,395
High School Security Upgrade 135,239 133,158
Roosevelt Building Boiler Replacement 85,000 78,360
Kennedy School Boiler Replacement 85,000 65,360
Franklin School Fire Alarm Replacement 166,000 100,641
Kennedy School Fire Alarm Replacement 166,000 121,489
Riley School Fire Alarm Replacement 166,000 145,719
Grant School Partial Roof Replacement 1,260,000 983,777
$ 2,352,000 $ $ 1,879,191
Recapitulation of GAAP
Project Balance- June 30,2015 Less: Unearned Grant Awards
Fund Balance- June 30,2015- GAAP Basis
Reca(!itulation of Fund Balance
Restricted for Capital Projects: Year End Encumbrances Available tOr Capital PrQjects
Total Fund Balance- Restricted for Capital Projects
78
SCHEDULE F-1
Balance June 30, 2015
$ 5,724
6,198
5,728
9,082
6,627
4,715
2,081
6,640
19,640
65,359
44,511
20,281
276,223
$ 472,809
$ 472,809 (176,694)
$ 296,115
$ 45,535 250,580
$ 296,115
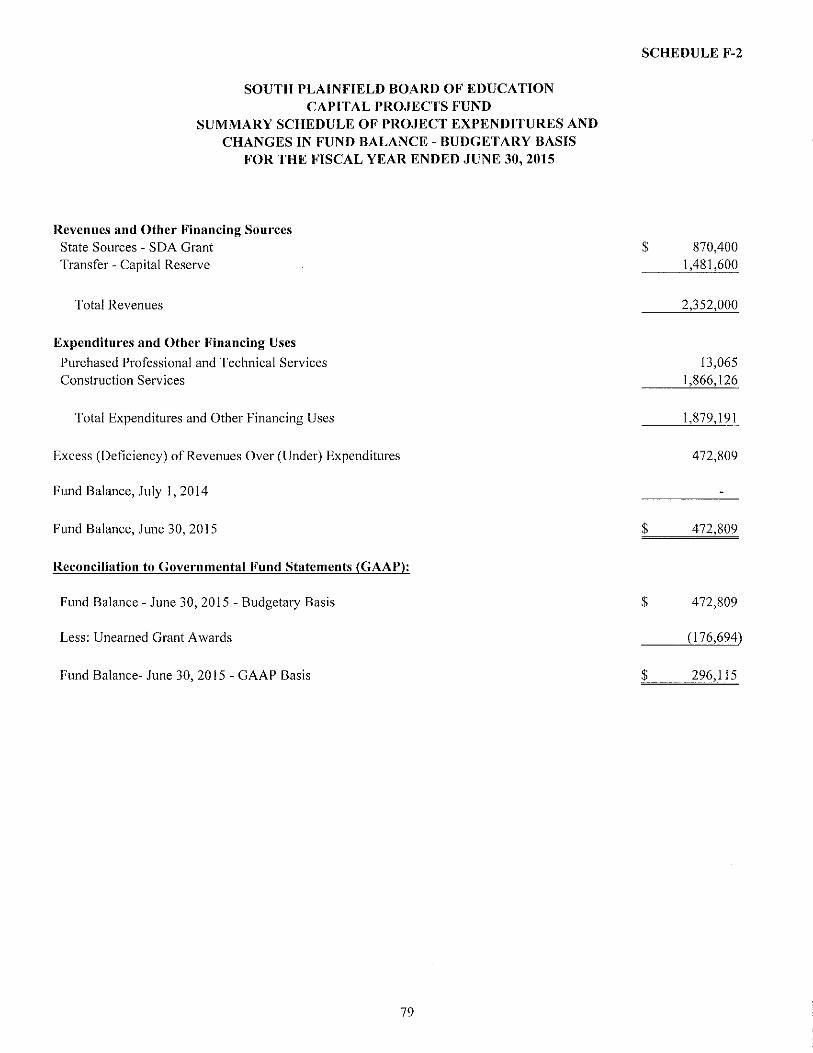
SOUTH PLAINFIELD BOARD OF EDUCATION CAPITAL PROJECTS FUND
SUMMARY SCHEDULE OF PROJECT EXPENDITURES AND CHANGES IN FUND BALANCE- BUDGETARY BASIS
FOR THE FISCAL YEAR ENDED JUNE 30,2015
Revenues and Other Financing Sources State Sources- SDA Grant Transfer - Capital Reserve
Total Revenues
Expenditures and Other Financing Uses
Purchased Professional and Technical Services Construction Services
Total Expenditures and Other Financing Uses
Excess (Deficiency) of Revenues Over (Under) Expenditures
Fund Balance, July 1, 2014
Fund Balance, June 30, 2015
Reconciliation to Governmental Fund Statements (GAAP):
Fund Balance- June 30, 2015 - Budgetary Basis
Less: Unearned Grant Awards
Fund Balance- June 30, 2015 - GAAP Basis
79
SCHEDULE F-2
$ 870,400 1,481,600
2,352,000
13,065 1 ,866,126
I ,879,191
472,809
$ 472,809
$ 472,809
(176,694)
$ 296,115

SOUTH PLAINFIELD BOARD OF EDUCATION CAPITAL PROJECTS FUND
SCHEDULE OF PROJECT REVENUES, EXPENDITURES, PROJECT BALANCE AND PROJECT STATUS- BUDGETARY BASIS
FRANKLIN SCHOOL SECURITY UPGRADE FROM INCEPTION AND FOR THE FISCAL YEAR ENDED JUNE 30, 20I5
Revenues and Other Financing Sources State Sources- SDA Grant Transfer from Capital Reserve
Total Revenues
Expenditures and Other Financing Uses
Purchased Professional and Technical Services
Construction Services
'fotal Expenditures
Excess of Revenues Over Expenditures
Additional Project Information: Project Number Grant Date Bond Authorization Date Bonds Authorized Bonds Issued Original Authorized Cost Additional Authorized Cost Revised Authorized Cost
Percentage Increase Over Original Authorized Cost
Percentage Completion Original Target Completion Date Revised Target Completion Date
Prior Periods
$
$
4910-060-14-G IXQ 8/22/2014
N/A N/A N/A
$ 44,000 $ 12,994 $ 56,994
29.53% 90%
6/30/15 6/30/15
80
$
$
Current Year Totals
17,600 $ 17,600 39,394 39,394
56,994 56,994
51,270 51,270
51,270 51,270
5,724 $ 5,724
SCHEDULE F-2a
Revised Authorized
Cost
$ 17,600 39,394
56,994
9,000
47,994
56,994
$
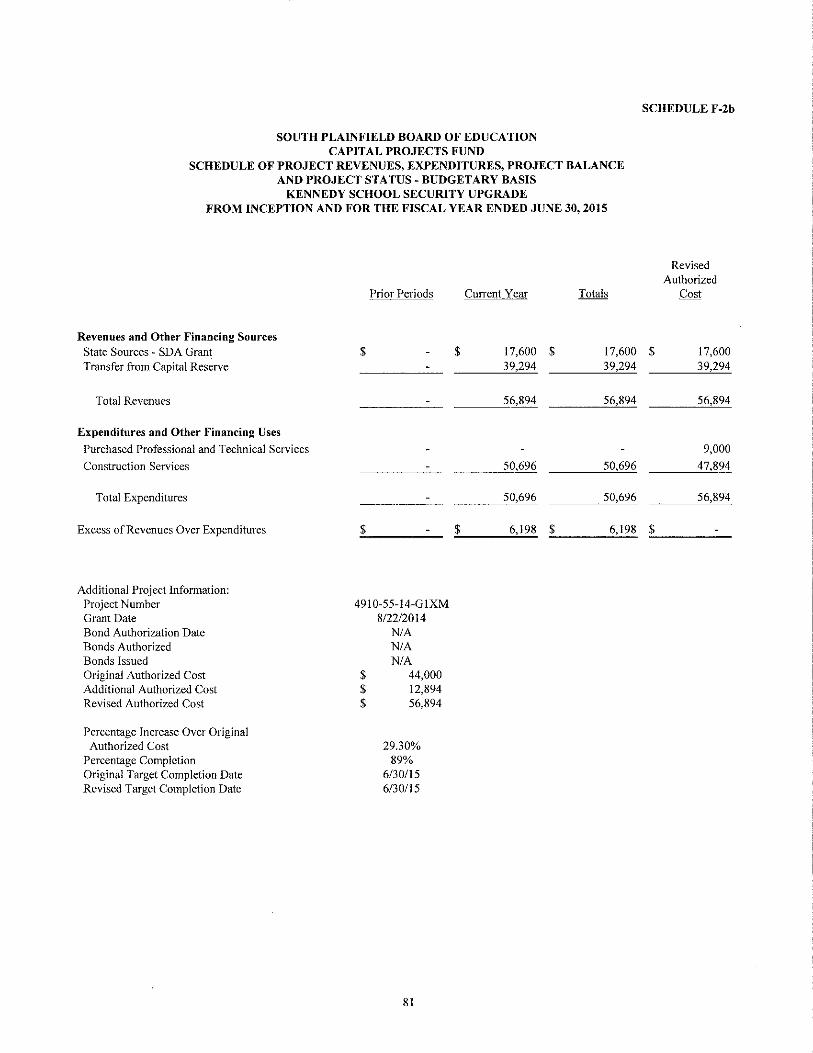
SOUTH PLAINFIELD BOARD OF EDUCATION CAPITAL PROJECTS FUND
SCHEDULE OF PROJECT REVENUES, EXPENDITURES, PROJECT BALANCE AND PROJECT STATUS- BUDGETARY BASIS
KENNEDY SCHOOL SECURITY UPGRADE FROM INCEPTION AND FOR THE FISCAL YEAR ENDED JUNE 30,2015
Revenues and Other Financing Sources State Sources- SDA Grant Transfer from Capital Reserve
Total Revenues
Expenditures and Other Financing Uses
Purchased Professional and Technical Services
Construction Services
Total Expenditures
Excess of Revenues Over Expenditures
Additional Project Information: Project Number Grant Date Bond Authorization Date Bonds Authorized Bonds Issued Original Authorized Cost Additional Authorized Cost Revised Authorized Cost
Percentage Increase Over Original Authorized Cost
Percentage Completion Original Target Completion Date Revised Target Completion Date
Prior Periods
$
$
4910-55-14-GIXM
$ $ $
8/22/2014 N/A N/A N/A
44,000 12,894 56,894
29.30% 89%
6/30/15 6/30115
81
$
$
Current Year Totals
17,600 $ 17,600 39,294 39,294
56,894 56,894
50,696 50,696
50,696 50,696
6,198 $ 6,198
SCHEDULE F-2b
Revised Authorized
Cost
$ 17,600 39,294
56,894
9,000
47,894
56,894
$

SOUTH PLAINFIELD BOARD OF EDUCATION CAPITAL PROJECTS FUND
SCHEDULE OF PROJECT REVENUES, EXPENDITURES, PROJECT BALANCE AND PROJECT STATUS- BUDGETARY BASIS
RILEY SCHOOL SECURITY UPGRADE FROM INCEPTION AND FOR THE FISCAL YEAR ENDED JUNE 30, 2015
Revenues and Other Financing Sources State Sources - SDA Grant Transfer from Capital Reserve
Total Revenues
Expenditures and Other Financing Uses
Purchased Professional and Technical Services
Construction Services
Total Expenditures
Excess of Revenues Over Expenditures
Additional Project Information: Project Number Grant Date Bond Authorization Date Bonds Authorized Bonds Issued Original Authorized Cost Additional Authorized Cost Revised Authorized Cost
Percentage Increase Over Original Authorized Cost
Percentage Completion Original Target Completion Date Revised Target Completion Date
Prior Periods
$
$
4910-058-14-GIXO
$ $ $
8/22/2014 N/A N/A N/A
44,000 13,394 57,394
30.44% 90%
6/30/15 6/30/15
82
$
$
Current Year Totals
17,600 $ 17,600 39,794 39,794
57,394 57,394
51,666 51,666
51,666 51,666
5,728 $ 5,728
SCHEDULE F-2c
Revised Authorized
Cost
$ 17,600 39,794
57,394
9,000
48,394
57,394
$
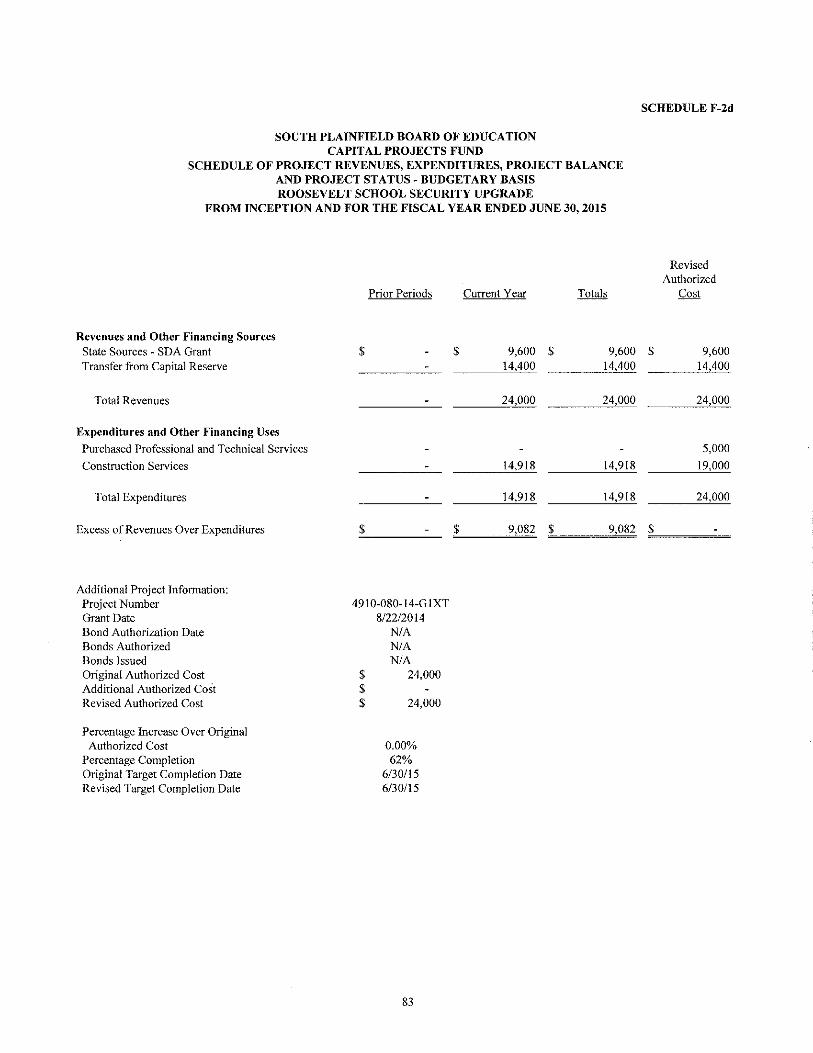
SOUTH PLAINFIELD BOARD OF EDUCATION CAPITAL PROJECTS FUND
SCHEDULE OF PROJECT REVENUES, EXPENDITURES, PROJECT BALANCE AND PROJECT STATUS -BUDGETARY BASIS ROOSEVELT SCHOOL SECURITY UPGRADE
FROM INCEPTION AND FOR THE FISCAL YEAR ENDED JUNE 30,2015
Revenues and Other Financing Sources State Sources R SDA Grant Transfer from Capital Reserve
Total Revenues
Expenditures and Other Financing Uses
Purchased Professional and Technical Services
Construction Services
Total Expenditures
Excess of Revenues Over Expenditures
Additional Project Information: Project Number Grant Date Bond Authorization Date Bonds Authorized Bonds Issued Original Authorized Cost Additional Authorized CoSt Revised Authorized Cost
Percentage Increase Over Original Authorized Cost
Percentage Completion Original Target Completion Date Revised Target Completion Date
Prior Periods
$
$
4910-080-14-G 1XT 8/22/2014
N/A N/A N/A
$ 24,000 $ $ 24,000
0.00% 62%
6/30115 6/30/15
83
$
$
Current Year Totals
9,600 $ 9,600 14,400 14,400
24,000 24,000
14,918 14,918
14,918 14,918
9,082 $ 9,082
SCHEDULE F-2d
Revised Authorized
Cost
$ 9,600 14,400
24,000
5,000
19,000
24,000
$

SOUTH PLAINFIELD BOARD OF EDUCATION CAPITAL PROJECTS FUND
SCHEDULE OF PROJECT REVENUES, EXPENDITURES, PROJECT BALANCE AND PROJECT STATUS- BUDGETARY BASIS
GRANT SCHOOL SECURITY UPGRADE FROM INCEPTION AND FOR THE FISCAL YEAR ENDED JUNE 30,2015
Revenues and Other Financing Sources State Sources- SDA Grant Transfer from Capital Reserve
Total Revenues
Expenditures and Other Financing Uses
Purchased Professional and Technical Services
Construction Services
Total Expenditures
Excess of Revenues Over Expenditures
Additional Project Information: Project Number Grant Date Bond Authorization Date Bonds Authorized Bonds Issued Original Authorized Cost Additional Authorized Cost Revised Authorized Cost
Percentage Increase Over Original Authorized Cost
Percentage Completion Original Target Completion Date Revised Target Completion Date
Prior Periods
$
$
4910-070-14-GJXS
$ $ $
8/22/2014 N/A N/A N/A
41,000 13,369 54,369
32.61% 88%
6/30/15 6/30/15
84
Current Year Totals
$ 16,400 $ 16,400 37,969 37,969
54,369 54,369
47,742 47,742
47,742 47,742
$ 6,627 $ 6,627
SCHEDULE F-2e
Revised Authorized
Cost
$ 16,400 37,969
54,369
9,000
45,369
54,369
$

SOUTH PLAINFIELD BOARD OF EDUCATION CAPITAL PROJECTS FUND
SCHEDULE OF PROJECT REVENUES, EXPENDITURES, PROJECT BALANCE AND PROJECT STATUS- BUDGETARY BASIS
MIDDLE SCHOOL SECURITY UPGRADE FROM INCEPTION AND FOR THE FISCAL YEAR ENDED JUNE 30, 2015
Revenues and Other Financing Sources State Sources - SDA Grant Transfer from Capital Reserve
Total Revenues
Expenditures and Other Financing Uses
Purchased Professional and Technical Services
Construction Services
Total Expenditures
Excess of Revenues Over Expenditures
Additional Project Information: Project Number Grant Date Bond Authorization Date Bonds Authorized Bonds Issued Original Authorized Cost Additional Authorized Cost Revised Authorized Cost
Percentage Increase Over Original Authorized Cost
Percentage Completion Original Target Completion Date Revised Target Completion Date
Prior Periods
$
$
4910-053-14-G1XJ 8/22/2014
N/A N/A N/A
$ 13,000 $ 26,110 $ 39,110
200.85% 88%
6/30/15 6/30/15
85
$
$
Current Year Totals
5,200 $ 5,200 33,910 33,910
39,110 39,110
34,395 34,395
34,395 34,395
4,715 $ 4,715
SCHEDULE F-2f
Revised Authorized
Cost
$ 5,200 33,910
39,110
3,000
36,110
39,110
$

SOUTH PLAINFIELD BOARD OF EDUCATION CAPITAL PROJECTS FUND
SCHEDULE OF PROJECT REVENUES, EXPENDITURES, PROJECT BALANCE AND PROJECT STATUS- BUDGETARY BASIS
HIGH SCHOOL SECURITY UPGRADE FROM INCEPTION AND FOR THE FISCAL YEAR ENDED JUNE 30, 2015
Revenues and Other Financing Sources State Sources- SDA Grant Transfer from Capital Reserve
Total Revenues
Expenditures and Other Financing Uses
Purchased Professional and Technical Services
Construction Services
Total Expenditures
Excess of Revenues Over Expenditures
Additional Project Information: Project Number Grant Date Bond Authorization Date Bonds Authorized Bonds Issued Original Authorized Cost Additional Authorized Cost Revised Authorized Cost
Percentage Increase Over Original Authorized Cost
Percentage Completion Original Target Completion Date Revised Target Completion Date
Prior Periods
$
$
4910-050-14-G lXI
$ $ $
8/22/2014 N/A N/A N/A
38,000 97,239
135,239
255.89% 98%
6/30/15 6/30/15
86
Current Year Totals
$ 15,200 $ 15,200 120,039 120,039
135,239 135,239
133,158 133,158
133,158 133,158
$ 2,081 $ 2,081
SCHEDULE F-2g
Revised Authorized
Cost
$ 15,200 120,039
135,239
8,000
127,239
135,239
$

SOUTH PLAINFIELD BOARD OF EDUCATION CAPITAL PROJECTS FUND
SCHEDULE OF PROJECT REVENUES, EXPENDITURES, PROJECT BALANCE AND PROJECT STATUS- BUDGETARY BASIS
ROOSEVELT PRE K/ADMINJSTRATION BUILDING BOILER REPLACEMENT FROM INCEPTION AND FOR THE FISCAL YEAR ENDED JUNE 30, 2015
Revenues and Other Financing Sources State Sources- SDA Grant Transfer from Capital Reserve
Total Revenues
Expenditures and Other Financing Uses
Purchased Professional and Technical Services
Construction Services
Total Expenditures
Excess of Revenues Over Expenditures
Additional Project Information: Project Number Grant Date Bond Authorization Date Bonds Authorized Bonds Issued Original Authorized Cost Additional Authorized Cost Revised Authorized Cost
Percentage Increase Over Original Authorized Cost
Percentage Completion Original Target Completion Date Revised Target Completion Date
Prior Periods
$
$
4910-085-14-G1XU
$ $ $
8/22/2014 N/A N/A N/A
85,000
85,000
0.00% 92%
6/30/15 6/30/15
87
$
$
Current Year Totals
34,000 $ 34,000 51,000 51,000
85,000 85,000
360 360
78,000 78,000
78,360 78,360
6,640 $ 6,640
SCHEDULE F-2h
Revised Authorized
Cost
$ 34,000 51,000
85,000
19,000
66,000
85,000
$
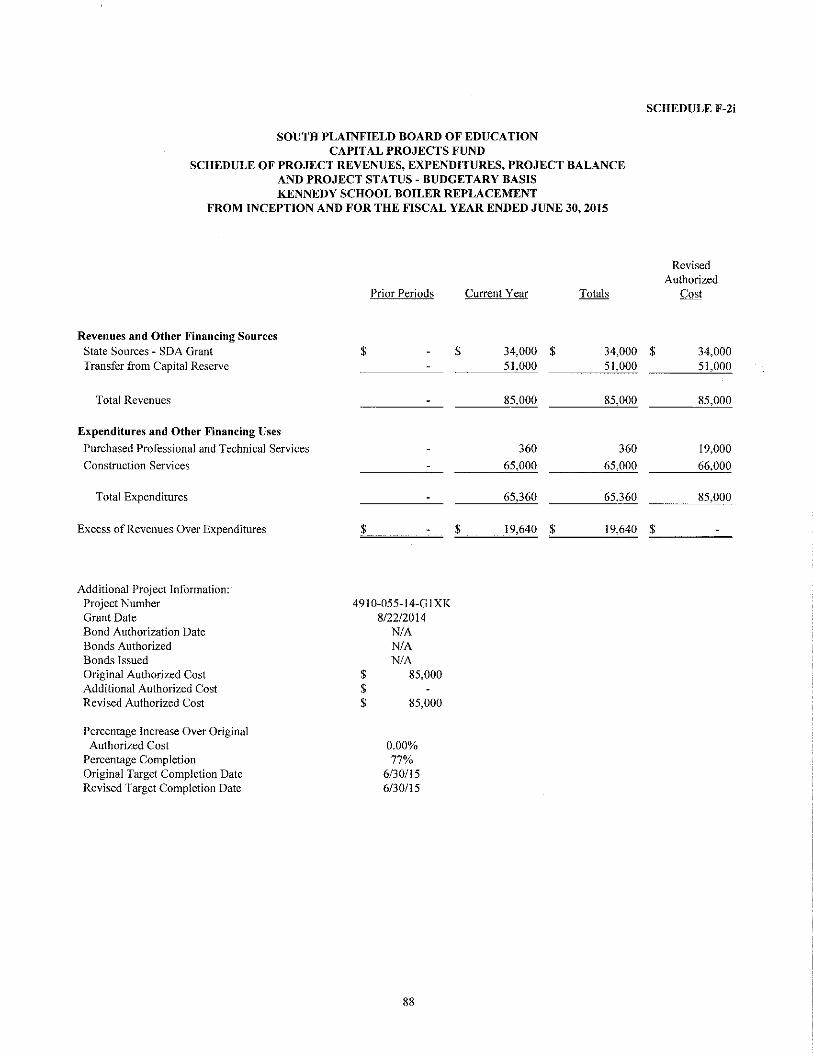
SOUTH PLAINFIELD BOARD OF EDUCATION CAPITAL PROJECTS FUND
SCHEDULE OF PROJECT REVENUES, EXPENDITURES, PROJECT BALANCE AND PROJECT STATUS - BUDGETARY BASIS KENNEDY SCHOOL BOILER REPLACEMENT
FROM INCEPTION AND FOR THE FISCAL YEAR ENDED JUNE 30,2015
Revenues and Other Financing Sources State Sources - SDA Grant Transfer from Capital Reserve
Total Revenues
Expenditures and Other Financing Uses
Purchased Professional and Technical Services
Construction Services
Total Expenditures
Excess of Revenues Over Expenditures
Additional Project Information: Project Number Grant Date Bond Authorization Date Bonds Authorized Bonds Issued Original Authorized Cost Additional Authorized Cost Revised Authorized Cost
Percentage Increase Over Original Authorized Cost
Percentage Completion Original Target Completion Date Revised 'farget Completion Date
Prior Periods
$
$
4910-055-14-G 1XK
$ $ $
8/22/2014 N/A N/A N/A
85,000
85,000
0.00% 77%
6/30/15 6/30/15
88
$
$
Current Year Totals
34,000 $ 34,000 51,000 51,000
85,000 85,000
360 360
65,000 65,000
65,360 65,360
19,640 $ 19,640
SCHEDULE F-2i
Revised Authorized
Cost
$ 34,000 51,000
85,000
19,000
66,000
85,000
$

SOUTH PLAINFIELD BOARD OF EDUCATION CAPITAL PROJECTS FUND
SCHEDULE OF PROJECT REVENUES, EXPENDITURES, PROJECT BALANCE AND PROJECT STATUS -BUDGETARY BASIS
FRANKLIN SCHOOL FIRE ALARM REPLACEMENT FROM INCEPTION AND FOR THE FISCAL YEAR ENDED JUNE 30, 2015
Revenues and Other Financing Sources State Sources - SDA Grant Transfer from Capital Reserve
Total Revenues
Expenditures and Other Financing Uses
Purchased Professional and Technical Services
Construction Services
Total Expenditures
Excess of Revenues Over Expenditures
Additional Project Information: Project Number Grant Date Bond Authorization Date Bonds Authorized Bonds Issued Original Authorized Cost Additional Authorized Cost Revised Authorized Cost
Percentage Increase Over Original Authorized Cost
Percentage Completion Original Target Completion Date Revised Target Completion Date
Prior Periods
$
$
4910-055-14-GIXP
$ $ $
8122/2014 N/A N/A N/A
166,000
166,000
0.00% 61%
6/30/15 6/30/15
89
Current Year Totals
$ 66,400 $ 66,400 99,600 99,600
166,000 166,000
750 750
99,891 99,891
100,641 100,641
$ 65,359 $ 65,359
SCHEDULE F-2j
Revised Authorized
Cost
$ 66,400 99,600
166,000
34,000
132,000
166,000
$

SOUTH PLAINFIELD BOARD OF EDUCATION CAPITAL PROJECTS FUND
SCHEDULE OF PROJECT REVENUES, EXPENDITURES, PROJECT BALANCE AND PROJECT STATUS- BUDGETARY BASIS
KENNEDY SCHOOL FIRE ALARM REPLACEMENT FROM INCEPTION AND FOR THE FISCAL YEAR ENDED JUNE 30,2015
Revenues and Other Financing Sources State Sources- SDA Grant Transfer from Capital Reserve
Total Revenues
Expenditures and Other Financing Uses
Purchased Professional and Technical Services
Construction Services
Total Expenditures
Excess of Revenues Over Expenditures
Additional Project Information: Project Number Grant Date Bond Authorization Date Bonds Authorized Bonds Issued Original Authorized Cost Additional Authorized Cost Revised Authorized Cost
Percentage Increase Over Original Authorized Cost
Percentage Completion Original Target Completion Date Revised Target Completion Date
Prior Periods
$
$
4910-058-14-G1XL
$ $ $
8/22/2014 N/A N/A N/A
166,000
166,000
0.00% 73%
6/30/15 6/30/15
90
$
$
Current Year Totals
66,400 $ 66,400 99,600 99,600
166,000 166,000
750 750
120,739 120,739
121,489 121,489
44,511 $ 44,511
SCHEDULE F-2k
Revised Authorized
Cost
$ 66,400 99,600
166,000
34,000
132,000
166,000
$

SOUTH PLAINFIELD BOARD OF EDUCATION CAPITAL PROJECTS FUND
SCHEDULE OF PROJECT REVENUES, EXPENDITURES, PROJECT BALANCE AND PROJECT STATUS - BUDGETARY BASIS
RILEY SCHOOL FIRE ALARM REPLACEMENT FROM INCEPTION AND FOR THE FISCAL YEAR ENDED JUNE 30,2015
Revenues and Other Financing Sources State Sources ~ SDA Grant Transfer from Capital Reserve
Total Revenues
Expenditures and Other Financing Uses
Purchased Professional and Technical Services
Construction Services
Total Expenditures
Excess of Revenues Over Expenditures
Additional Project Information: Project Number Grant Date Bond Authorization Date Bonds Authorized Bonds Issued Original Authorized Cost Additional Authorized Cost Revised Authorized Cost
Percentage Increase Over Original Authorized Cost
Percentage Completion Original Target Completion Date Revised Target Completion Date
Prior Periods
$
$
4910-058-14-GIXN
$ $ $
8/22/2014 N/A N/A N/A
166,000
166,000
0.00% 88%
6130115 6/30/15
91
$
$
Current Year Totals
66,400 $ 66,400 99,600 99,600
166,000 166,000
750 750
144,969 144,969
145,719 145,719
20,281 $ 20,281
SCHEDULE F-21
Revised Authorized
Cost
$ 66,400 99,600
166,000
34,000
132,000
166,000
$

SOUTH PLAINFIELD BOARD OF EDUCATION CAPITAL PROJECTS FUND
SCHEDULE OF PROJECT REVENUES, EXPENDITURES, PROJECT BALANCE AND PROJECT STATUS- BUDGETARY BASIS
GRANT SCHOOL PARTIAL ROOF REPLACEMENT FROM INCEPTION AND FOR THE FISCAL YEAR ENDED JUNE 30, 2015
Revenues and Other Financing Sources State Sources ~ SDA Grant Transfer from Capital Reserve
Total Revenues
Expenditures and Other Financing Uses
Purchased Professional and Technical Services
Construction Services
Total Expenditures
Excess of Revenues Over Expenditures
Additional Project Information: Project Number Grant Date Bond Authorization Date Bonds Authorized Bonds Issued Original Authorized Cost Additional Authorized Cost Revised Authorized Cost
Percentage Increase Over Original Authorized Cost
Percentage Completion Original Target Completion Date Revised Target Completion Date
Prior Periods
$
$
4910-070-14-GIXR
$ $ $
8/22/2014 N/A N/A N/A 1,260,000
1,260,000
0.00% 78%
6/30/15 6/30/15
92
$
$
Current Year Totals
504,000 $ 504,000 756,000 756,000
1.260,000 1,260.000
10,095 10,095
973,682 973,682
983,777 983,777
276,223 $ 276,223
SCHEDULE F-2m
Revised Authorized
Cost
$ 504,000 756,000
1,260,000
39,487
1,220,513
1,260,000
$

PROPRIETARY FUNDS
SOUTH PLAINFIELD BOARD OF EDUCATION
PROPRIETARY FUND STATEMENT OF NET POSITION
AS OF JUNE 30, 2015
THIS STATEMENT IS NOT APPLICABLE
FINANCIAL STATEMENTS ARE PRESENTED ON EXHIBIT B-4
COMBINING STATEMENT OF REVENUES, EXPENSES AND CHANGES IN NET POSITION
FOR THE FISCAL YEAR ENDED JUNE 30, 2015
THIS STATEMENT IS NOT APPLICABLE
FINANCIAL STATEMENTS ARE PRESENTED ON EXHIBIT B-5
STATEMENT OF CASH FLOWS FOR THE FISCAL YEAR ENDED JUNE 30, 2015
THIS STATEMENT IS NOT APPLICABLE FINANCIAL STATEMENTS ARE PRESENTED ON EXHIBIT B-6
93
EXHIBITG-1
EXHIBITG-2
EXHIBJTG-3

FIDUCIARY FUNDS AGENCY FUNDS

ASSETS
SOUTH PLAINFIELD BOARD OF EDUCATION AGENCY FUNDS
COMBINING STATEMENT OF AGENCY ASSETS AND LIABILITIES AS OF JUNE 30, 2015
Student Activity Payroll
EXHIBITH-1
Total Agency Funds
Cash $ 128,915 $ 386,471 :o:_$ _ ___::5_:_15"-''"-'38=6
Total Assets $ 128,915 $ 386,471 ;:;,$ _ ___::5_,_15"''"-'38=6
LIABILITIES
Due to Student Groups $ 128,915 $ 128,915 Payroll Deductions and Withholdings $ 349,126 349,126 Accrued Salaries and Wages 3,312 3,312
Interfund Accounts Payable 34,033 34,033
Total Liabilities $ 128,915 $ 386,471 $ 515,386
94

SOUTH PLAINFIELD BOARD OF EDUCATION
FIDUCIARY FUNDS
NONEXPENDABLE TRUST FUND
COMBINING STATEMENT OF CHANGES IN
FIDUCIARY NET POSITION
FOR THE FISCAL YEAR ENDED JUNE 30, 2014
NOT APPLICABLE
STUDENT ACTIVITY AGENCY FUND
SCHEDULE OF RECEIPTS AND DISBURSEMENTS
FOR THE FISCAL YEAR ENDED JUNE 30, 2015
Balance,
July 1, Cash Cash
2014 Receipts Disbursements
GRANT SCHOOL STUDENT COUNCIL $ 6,070 $ I, 128 $ 827
MIDDLE SCHOOL STUDENT ACTIVITY 31,654 177,067 159,403
HIGH SCHOOL STUDENT ACTIVITY 68,753 148,449 143,976
$ 106,477 $ 326,644 $ 304,206
95
EXHIBIT H-2
EXHIBIT H-3
Balance, June 30,
2015
$ 6,371
49,318
73,226
$ 128,915
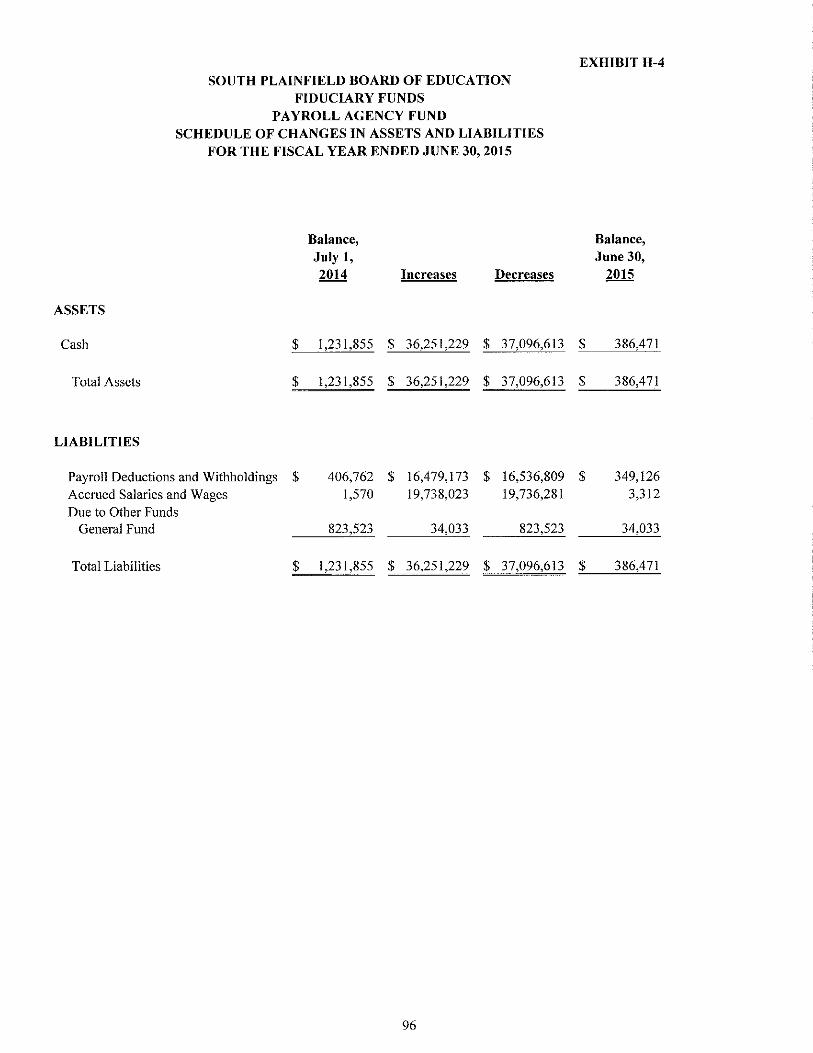
ASSETS
Cash
Total Assets
LIABILITIES
SOUTH PLAINFIELD BOARD OF EDUCATION FIDUCIARY FUNDS
PAYROLL AGENCY FUND SCHEDULE OF CHANGES IN ASSETS AND LIABILITIES
FOR THE FISCAL YEAR ENDED JUNE 30, 2015
Balance, July I, 2014 Increases Decreases
$ 1,231,855 $ 36,251,229 $ 37,096,613
$ 1,231,855 $ 36,251,229 $ 37,096,613
Payroll Deductions and Withholdings $ 406,762 $ 16,479,173 $ 16,536,809 Accrued Salaries and Wages 1,570 19,738,023 19,736,281 Due to Other Funds
General Fund 823,523 34,033 823,523
Total Liabilities $ I ,23 I ,855 $ 36,251,229 $ 37,096,613
96
EXHIBITH-4
Balance, Juue 30,
2015
$ 386,471
$ 386,471
$ 349,126 3,312
34,033
$ 386,471

LONG-TERM DEBT

"' .__,
Issue
Refunding Bonds
Date of Issue
7/15/2009 $
SOUTH PLAINFIELD BOARD OF EDUCATION SCHEDULE OF SERIAL BONDS PAYABLE
FOR THE FISCAL YEAR ENDED JUNE 30, 2015
Amount of Issue
9,765,000
Annual Maturities Date Amount
7/15/2015 $ 910,000
7/15/2016 960,000
7/15/2017 995,000
7115/2018 1,040,000
7115/2019 1,085,000
7/15/2020 1,140,000 7/15/2021 1,195,000
Interest Rate
4.50%
5.00%
3.00%
4.25%
4.50%
5.00% 5.00%
Balance, July I, 2014
$ 8,195,000
$ 8,195,000
Paid by Budget Appropriation
Decreased
$ 870,000
$ 870,000
$ 870,000
EXHIBIT I-I
Balance, June 30, 2015
$ 7,325,000
$ 7,325,000

EXHIBIT I-2
SOUTH PLAINFIELD BOARD OF EDUCATION SCHEDULE OF OBLIGATIONS UNDER CAPITAL LEASES
FOR THE FISCAL YEAR ENDED JUNE 30, 2015
NOT APPLICABLE
98
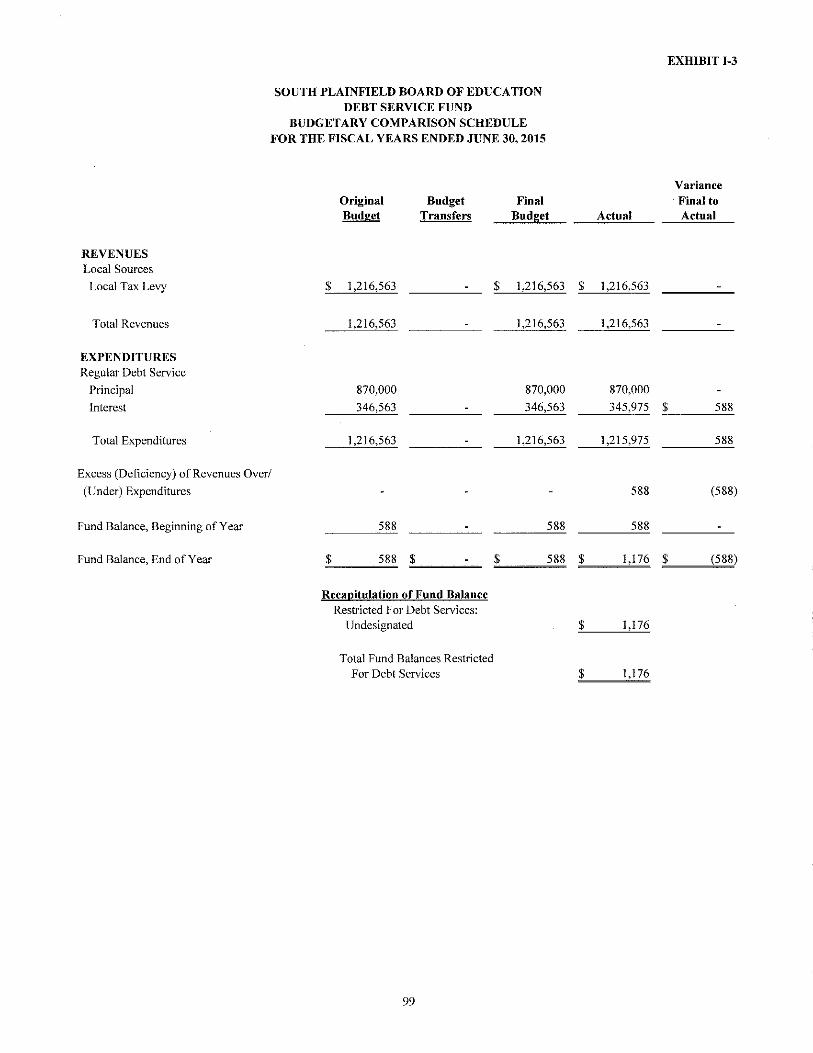
EXHIBIT I-3
SOUTH PLAINFIELD BOARD OF EDUCATION DEBT SERVICE FUND
BUDGETARY COMPARISON SCHEDULE FOR THE FISCAL YEARS ENDED JUNE 30, 20I5
Variance Original Budget Final Final to Budget Transfers Budget Actual Actual
REVENUES Local Sources
Local Tax Levy $ 1,216,563 $ 1,216,563 $ 1,216,563
Total Revenues 1,216,563 1,216,563 1,216,563
EXPENDITURES Regular Debt Service
Principal 870,000 870,000 870,000
Interest 346,563 346,563 345,975 $ 588
Total Expenditures 1,216,563 1,216,563 1,215,975 588
Excess (Deficiency) of Revenues Over/
(Under) Expenditures 588 (588)
Fund Balance, Beginning of Year 588 588 588
Fund Balance, End of Year $ 588 $ $ 588 $ 1,176 $ (588)
Recauitulation of Fund Balance Restricted For Debt Services:
Undesignated $ 1,176
Total Fund Balances Restricted For Debt Services $ 1,176
99
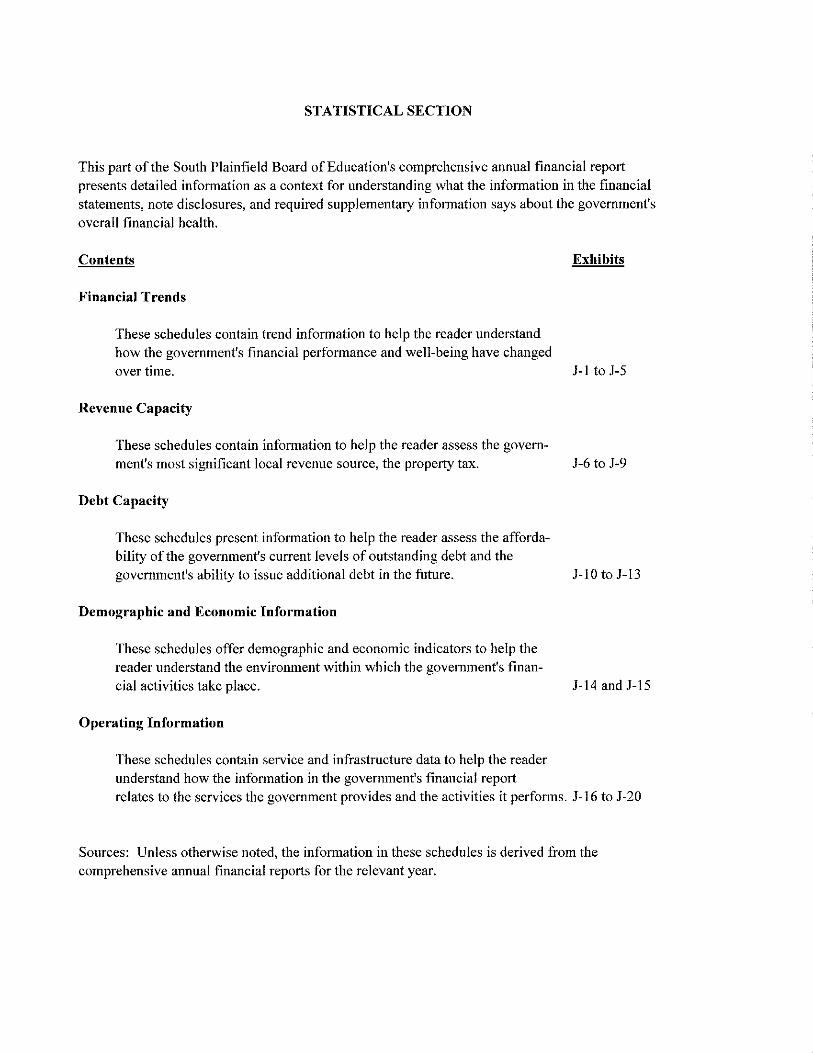
STATISTICAL SECTION
This part of the South Plainfield Board of Education's comprehensive annual financial report presents detailed information as a context for understanding what the information in the financial statements, note disclosures, and required supplementary information says about the government's overall financial health.
Contents
Financial Trends
These schedules contain trend information to help the reader understand how the government's financial performance and well-being have changed over time.
Revenue Capacity
These schedules contain information to help the reader assess the government's most significant local revenue source, the property tax.
Debt Capacity
These schedules present information to help the reader assess the affordability of the government's current levels of outstanding debt and the government's ability to issue additional debt in the future.
Demographic and Economic Information
These schedules offer demographic and economic indicators to help the reader understand the environment within which the government's financial activities take place.
Operating Information
These schedules contain service and infrastructure data to help the reader understand how the information in the government's financial report
Exhibits
J-1 to J-5
J-6 to J-9
J-10 to J-13
J-14 and J-15
relates to the services the government provides and the activities it perfonns. J-16 to J-20
Sources: Unless otherwise noted, the information in these schedules is derived from the comprehensive annual financial reports for the relevant year.

0 0
SOUTH PLAINF1ELD BOARD OF EDUCATION NETPOSniTONBYCOMPONENT
LAST TEN FISCAL YEARS (Unaudited)
{accrual basis of accounting)
Fiscal Year Ending June 30, 2006 __ 2007 2008 2009 2010 2011 2012 2013 2014
Governmental activities Invested in capital assets, net of related debt $ 2,760,586 $ 4,393,358 $ 4,687,615 $ 5,943,343 $ 7,499,986 $ 6,784,851 $ 7,082,547 $ 12.268,014 $ 13,503,788 Restricted 5,917,921 6,950,391 5,861,710 5,156,707 3,386,689 3,489,765 2,548,548
Unrestricted 696,887 1,689,210 {195,897) (825,142) (349,647) {708,454) 2,386,482 1,833,466 (9,884,543) Total governmental activities net position $ 3,457,473 $ 6,082,568 $ 10,409,639 $ 12.068,592 $ 13,012,049 $ ll,233,104 $ 12,855,718 $ 17,591,245 $ 6,167,793
Business-type activities Invested in capital assets, net of related debt $ 95,208 $ 97,677 $ 90,356 $ 83,035 $ 90,092 $ 77,411 $ 219,204 $ 244,255 $ 219,324 Restricted Unrestricted 348,620 430,615 654,732 873,446 1,057,047 1,148,665 1,253,294 1,338,934 1,353,804
Total business-type activities net position $ 443,828 $ 528,292 $ 745,088 $ 956,481 $ 1,147,139 $ 1,226,076 $ 1_,47_~,12_~--- $ _1,5_8~,_1_§.~ $ __ 12_7:3_,_1_:2?
District-wide Invested in capital assets, net of related debt $ 2,855,794 $ 4,491,035 $ 4,777,971 $ 6,026,378 $ 7,590,078 $ 6,862,262 $ 7,301,751 $ 12,512,269 $ 13,723,112 Restricted 5,917,921 6,950,391 5,861,710 5,156,707 3,386,689 3,489,765 2.548,548
Unrestricted 1,045,507 2,119,825 458,835 48,304 707,400 440,211 3,639,776 3.172,400 f8,530,739) Total district net position $ 3,901,301 $ 6,610,860 $ 11,154,727 $ 13,025,073 s \4,159,!88 $ 12,459,180 $ 14,328,216 $ 19,174,434 $ 7,740,921
Note I -Net Position at June 30, 2012 is restated to reflect the implementation ofGASB Statement No. 63, "Financial Reporting of Deferred Outflows of Resources, Deferred Inflows of Resources and Net Position" and GASB Statement No. 65, "Items Previously Reported in Assets and Liabilities" and recording of amounts related to the District's 2009 refunding bonds and governmental activities capital assets.
Note 2- Net Position at June 30, 2014 is restated to reflect the implementation of GASB Statement No. 68, "Accounting and Financial Reporting for Pensions"
EXHIBIT J-1
2015
$ 15,516,546 1,780,651
{9,657,745) $ 7,639,452
$ 194,393
944,768 $ 1,139,161
$ 15,710,939 1,780,651
f8,712,977) $ 8,778,613

EXHIBIT J-2
SOUTH PLAINFIELD BOARD OF EDUCATION CHANGES IN NET POSITION
LAST TEN FISCAL YEARS (Unaudited)
(accmal basis of accounting)
Fiscal Year Ending June 30, 2006 2007 2008 2009 2010 20ll 2012 2013 2014 ~
E.:penses Governmental activities
Instruction Regular $ 17,814,248 $ 24,943,639 $ 23,899,746 $ 23,907,312 $ 24,613,371 ' 24,293,199 s 24,701,312 $ 25,895,594 ' 26,744,764 ' 29.815,485
Special Education 3,996,562 7,128,497 6,090,215 5,990,400 7,502,098 7,674,924 8,395,082 8,361,993 9,076,153 10,104,&37
Other Instruction 937,506 1,134,712 1,954,057 1,763,815 1,920,632 1,815,960 1,079,829 1,122,688 971.985 1,496,543
School Sponsored Activities and Athletics 1,180,725 1,312,462 1,461,816 1.248,712
Snpport &rviccs: Tnition \,251,452 1,195,973 1,\89,630 1,252,047 1,134,463
Student and Instruction Related Seniccs 4,968,106 7,20&,508 6,195,047 6,149,740 6,341,027 5,901,185 6,613,391 7,591,031 7,957,459 &,991,136
School Administrative Services 1,539,825 2,222,792 2,53&,731 2,871,127 3,013,615 3,022,552 3,380,066 1,906,861 1,158,319 1,278,897
General Administrative Services 1,880,559 2,155,173 2,596,816 2,088,527 2,143,004 2,414,733 !,238,685 2,937,397 2,858,028 4.310.696
Central and Support Services 573,256 381,523 361,669 1,453,217 1,570,824 1,907,567 1,793,830 Plant Operations and Maintenance 4,706,569 5,192,664 5,416,830 5,700,095 5,562,928 4,8ll,259 4,504,179 4,775,302 5,124,060 4,899,308 Pupil Transportation 1,388,192 1,821,280 1,976,627 1,943,771 2,048,352 1,896,037 2,316,150 2,377,641 2,365,993 2,503,270
Special Schools 302,977 527,197 496,766 605,641 42,468
§ Charter Schools 4,478 28,669 32,262 8,044
Other Unallocated Expenses 10,902,530
Debt Service Assessment 68,734
Interest on long-te:rm debt 703.000 697.772 603)00 567,011 416,2:05 428.703 393.844 378.663 361.722 327,992
Total governmental activities expenses 50.391.526 5L)05.037 52.998.817 53,270.119 55,832.705 __21.873,930 55,256,480 58.230.456 59,987.866 66.770.706
Business-type activities: Food service 1,035,844 1,121,588 1,140,614 1,186,806 1,163,548 1,209,946 1,302,832 1,237,900 1,311,366 1,375,120 Preschool Program 207,069 203,323 219,024 240,804 222,473 267,259 299,362 316,139 Latchkey Program 114,868 240,540 377,681 373,795 333,947 391,479 341,000 390,769 506,713 533,733 Adult Education Program 489,180 57l.671 222.133 262.138 269.589 272.749 193 861 176.723 143.464 145.097
Total business-type activities expense 1,639.892 1,933.799 1.947.497 2.026,062 1.986.108 2.114.978 2,060.166 2.072.651 2.260.905 2.370,089 Total district expenses $ 52.031.418 $ 54.438.&36 $ 54.946.314 ' 55,296,181 $ 57,818,813 $ 55,988,908 $ 57,316,646 $ 60,303,107 $ 62.248.771 $ 69)40.795
Program Revenues Governmental activities:
Charges for services: Tuition $ 535,779 $ 53,092 Trnnsportation 208,468 209,680 202,237 218,941 198,711
Operating grants and contnbutions 10,052,012 10,759,447 8,505,200 8,354,394 &,369,423 8,503,754 9,491,962 8,870,576 15,229,636 Capital grants and contributions 58,154 21,856 2,030 693,706 Interest on 1ong·tenn debt Unallocated Benefits 3,760,692
Total governmental activities program revenues 3.760.692 10.052,012 10.759.447 8.505.200 8,354.394 9.113.670 8,824.680 9,716,055 9.091.547 ___ 16_,122.053
Business·type activities: Charges for services
Food service ' 823,703 $ 804,496 $ 795,171 $ 846,811 ' 751,141 $ 770,978 $ 764,153 $ 704,980 $ 758,727 $ 802,982
Preschool Program 239,418 263,628 304,575 288,641 356,161 274,011 289,016 257,751
Latchkey Program 148,629 296,227 473,314 515,361 394,804 383,424 454,134 421,823 528,822 554,312
Adult Education Program 643,156 654,852 262,396 283,090 271,505 303,827 226,534 224,107 153,180 174,100
Operating grants and contributions 242,663 288,812 297,316 328,564 422.602 442.431 505,606 491.431 520,893 541,313 Total business type activities program revenues 1.858.151 2.044.387 2.067,615 2.237.454 2.144.627 2.189.301 2.306.588 2.116,352 2.250.638 2.330,458 Total district program revenues ' 5.618.843 $ 12.096399 $ 12.827.062 $ 10.742.654 ' 10,4'.<9.021 $ 11302.971 $ 11)31.268 $ 11.832.407 $ 11342.185 ' 18.452.511
Net (E>:pense)/Revenue Governmental activities ' (46,630,834) $ (42,453,025) $ (42,239,370) $ (44,764,919) ' (47,478,311) $ (44,760,260) $ (46,43\,800) $ (48,514,401} $ (50,896,319) s (50,648,653) Business-type acti,ities 218.259 110.588 120.118 211.392 158.519 74.323 246.422 43 701 (10.267) (39,631) Total district·,.~de net expense s. (4§_,412,575) $ (42,342,437) $ (42,119,252) $ (44,553,527) ' (':17,31?.792) $ {44,685,937) $ {4(;,1~~.37~) $ (48,470,790) $ {50,906,586) $ (50,688,284)
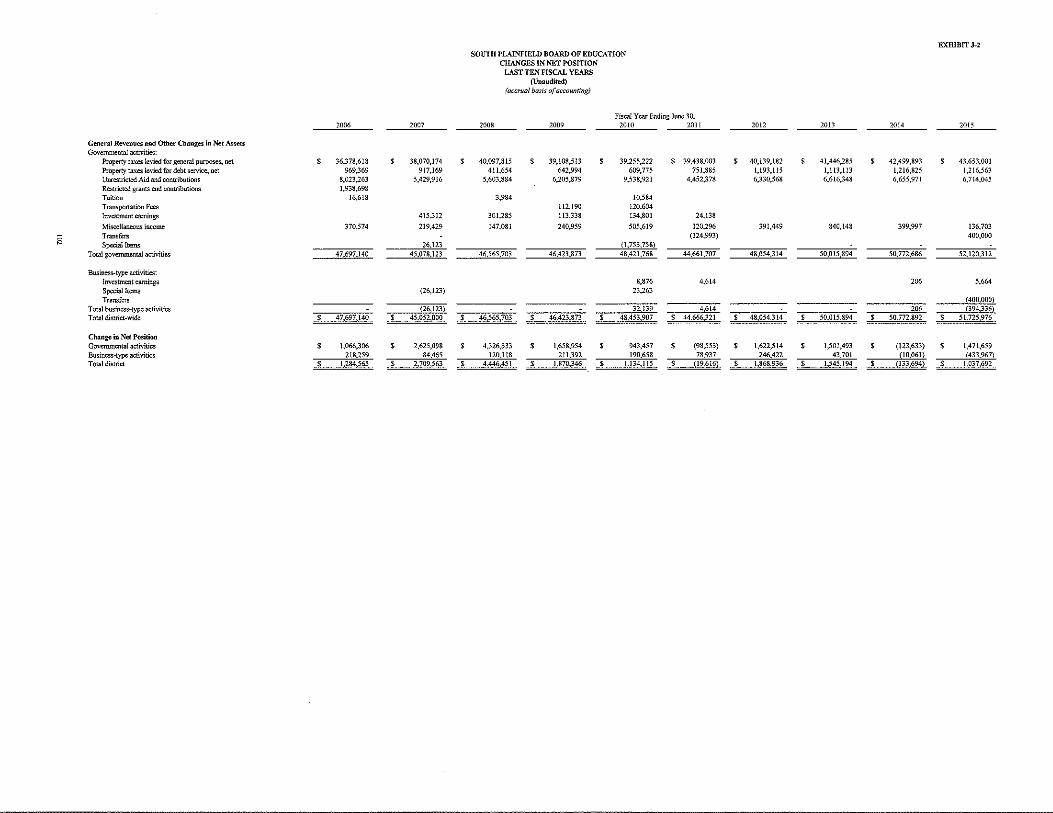
EXHIBIT J-l SOUTH PLAINFIELD BOARD OF EDUCATION
CHANGES IN NET POSITION LAST TEN FISCAL YEARS
(Unaudited) (accrual basis of accounting)
Fiscal Y car Ending June 30, 20M 2007 2008 2009 2010 2011 2012 2013 20!4 ~
General Revenues and Other Changes in Net k;sets Governmental acti>ities:
Property taxes lc,ied for gencrnl pUipO:ses, net s 36,378,618 $ 38,070,174 $ 40,097,815 $ 39,108,5!3 s 39,255,222 $ 39,438,003 $ 40,139,182 $ 41,446,285 $ 42,499,893 s 43,653,001 Property taxes levied for debt sen ice, net 969,369 917,169 411,654 642,994 609,775 751,885 1,193,115 1,113,1!3 1,216,825 1,216,563 Unrestricted Aid and contributions 8,023,263 5,429,916 5,603,884 6,205,879 9,538,921 4,452,378 6,330,568 6,616,348 6,655,971 6,714,045 Restricted grants and contributions 1,938,698 Tuition 16,618 3,984 10.584 Trnusportation Fees 112,190 120.604 Investment earnings 4153!2 301.285 113,338 134,801 24,138
Miscellaneous income 370,574 219,429 147.081 240,959 505,619 120,296 391,449 840,148 399,997 136,703
s Transfers (124,993) 400.000 Special Items 26.123 (1,753.758)
Total govenunental acti,ities 47 697.140 45.078.123 46.565,703 46,413.873 48,421,768 44.661,707 48.054,314 50,015.894 50,772,686 52.120.312
Business-type activities: Investment earnings 8,876 4,614 2M 5,664 Special Items (26,123) 23,263 Transfers {400.000)
Total business-type activities (26.123) 32,139 4.614 206 [394,336) Total district-wide $ 47.697.140 $ 45.052,000 $ 46.565,703 $ 46.423.873 $ 48.453,907 $ 44.666,321 $ 48,054314 $ 50.015,894 $ 50.772.892 $ 51.725,976
Change in Net Position Governmental activities $ 1,066,306 s 2,625,098 $ 4326333 $ 1,658,954 $ 943,457 $ (98,553) $ 1,622,514 $ 1,501,493 $ {123,633) s 1,471,659 Business-lype acti\ities 218.259 84,465 120.ll8 211,392 190.658 78.937 246.422 43,701 [10.061) (433,967) Total district $ 1_,2,84,5(;5 $ 2,71)9,56) s 4.446.451 $ 1.870,346 $ l_.J34,1l~-- s _(19.6!6) s l.~(i~_.936 s 1.545.194 $ (i:33_.(i\14} s 1.037.692

§
SOUTH PLAINFIELD BOARD OF EDUCATION FUND BALANCES- GOVERNMENTAL FUNDS
LAST TEN FISCAL YEARS (Unaudited)
(modified accruaf basis of accounting)
Fiscal Year Endin June 30. 2006 2007 2008 2009 2010 2011
General Fund Reserved $ 877,182 $ 1,785.276 $ 6,210.036 $ 7,064,506 $ 2.590,394 Unreserved 521,874 597.639 587,805 164.847 748,915 Restricted $ 2,541,016 Committed Assigned 986.078 t.:nassigned 348,942
Total general fund $ 1,399,056 $ 2,382,915 s 6,797,841 $ 7,229,353 $ 3,339,309 $ 3,876,036
All Other Governmental Funds Reserved $ 132.988 Unreserved $ (973) $ (12,613) $ (19,782) (5,279) $ 3,308,168 Restricted $ 1.685,608 Unassigned (55,995}
Total all other governmental funds s t__3]:,Q_!L --~ ______ (l_2_kl)J_ __L _____ (_12_,2_81)_ _J _____ (5~2J)_ -~-__ _)2_0_~,_1~_ _L_!j_~~,§}_~--
Beginning with Fiscal Year 2012, the District implemented GASB Statement No. 54, "Fund Balance Reporting and Governmental Type Definitions." The Statement provides more clearly defined fund balance categories to make the nature and extent of the constraints placed on a government's fund balance more transparent. This Statement established fund balance classifications that comprise a heirarchy based primarily on the extent to which a governemt is bound to observe constraints imposed upon the use of resources reported in governmental funds. Reclassification of prior year fund balance amounts to comply with Statement No. 54 is not required
EXHIBIT J-3
2012 2013 2014 2015
$ 4,016,409 $ 5,367,848 $ 4,578,117 $ 3,821.031 228,600 292,322 169.420
1.104,018 865,067 543.468 596,356 69,032 52.506 80,240 87,890
$ 5,189,459 $ 6,514,021 $ 5,494,147 s 4,674,697
$ 1,685.608 $ 588 $ 588 s 297,291
--~_1_,_§_~_,60~-- -~-- __ 5?_~-- -~-- - ~~~- - ~---- 297,291
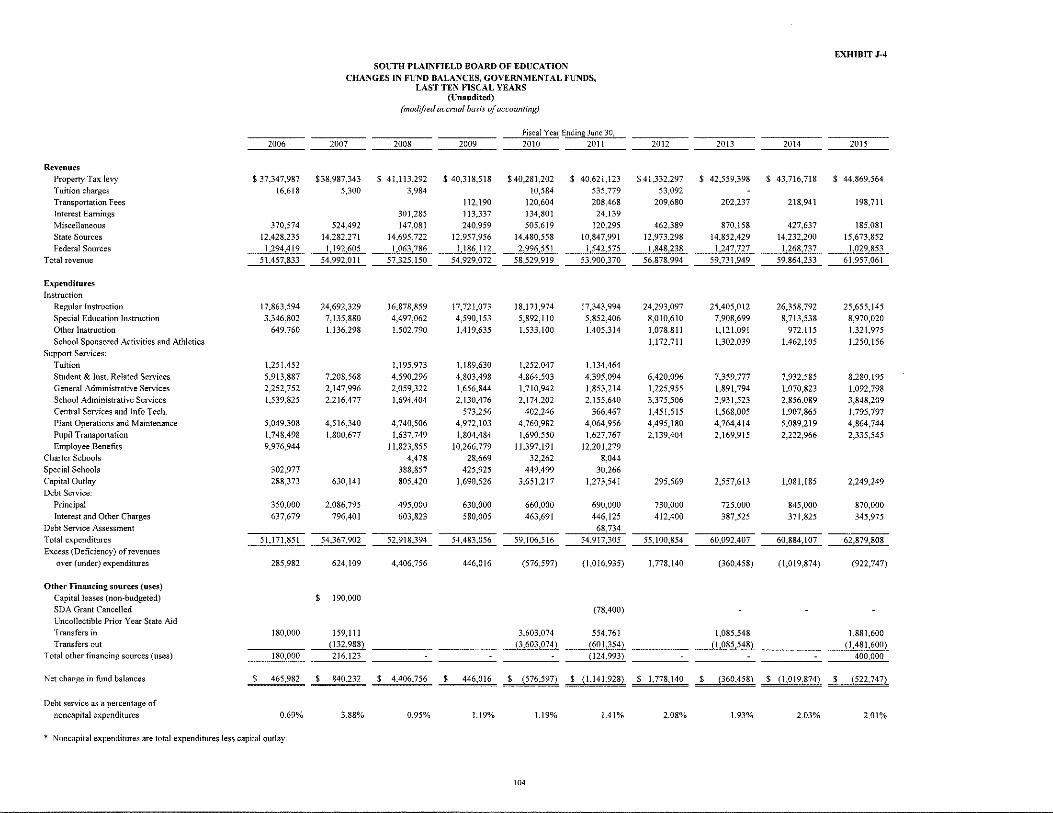
Re,·enues Property Tax lery Tuition charges Transportation Fees Interest Earnings Miscellaneous State Sources Federal Sources
Total revenue
Expenditures Instruction
Regular Instruction Special Education Instruction Other Instruction School Sponsored Activities and Athletics
Support Services: Tuition Student & Inst. Related Services General Administrative Services School Administrative Services Central Services and Info Tech. Plant Operations and Maintenance Pupil Transportation Employee Benefits
Charter Schools Special Schools Capital Outlay Debt Service:
Principal Interest and Other Charges
Debt Service Assessment Total expenditures Excess (Deficiency) of revenues
over (under) expenditures
Other Financing sources (uses) Capital leases (non-budgeted) SDA Grant Cancelled Uncollectible Prior Year State Aid Transfers in Transfers out
Total other financing sources (uses)
SOUTH PLAINFIELD BOARD OF EDUCATION CHANGES IN FUND BALANCES, GOVERNMENTAL FUNDS,
LAST TEN FISCAL YEARS
2006 2007
$37.347,987 $38,987,343 16,618 5,300
370,574 524,492 12.428,235 14,282.271 1,294,419 1,192.605
51,457,833 54,992,011
17.863,594 3,346.802
649.760
1,251.452 5,913,887 2,252,752 1,539,825
5,049,308 1,748.498 9,976.944
302,977 288.373
350.000 637,679
51,171,851
285.982
180,000
180,000
24,692,329 7,135,880 1,136,298
7,208,568 2,147,996 2.216,477
4,516,340 1,800,677
630,141
2.086,795 796,401
54,367,902
624,109
$ 190,000
159,111 (132,988) 216,123
(Unaudited) (mod[fied accrual hasis of accounting)
2008
s 41.113,292 3,984
301,285 147,081
14.695,722 1,063,786
57,325,150
16,878,859 4.497.062 1,502,790
1,195.973 4,590,296 2,059.322 1,694,404
4.740.506 1,637.749
11,823,855 4,478
388,857 805.420
495.000 603,823
52,918,394
4,406,756
2009
$ 40,318.518
112.190 113.337 240.959
12.957,956 1,186,112
54,929,072
17,721,073 4,590,153 1,419,635
1,189,630 4,803,498 1,656,844 2,130,476
573.256 4,972,103 1,804,484
10,266,779 28,669
425,925 1,690,526
630,000 580.005
54,483.056
446,016
Fiscal Year Ending June 30, 2010 2011 --------
$40.281,202 10,584
120,604 134,801 505,619
14,480,558 2,996,551
58,529,919
18.171,974 5.892,110 1,533,100
1,252,047 4.864,503 1,710,942 2,174.202
402.246 4,760.982 1,690.550
11,397,191 32,262
449.499 3,651,217
660,000 463,691
59,106,516
(576,597)
3.603,074 (3,603,074)
$ 40,621,123 535.779 208.468
24.139 120.295
10,847,991 1,542,575
53,900,370
17,343,994 5,852,406 1,405,314
1,134,464 4,395,094 1,853,214 2,155,640
366,467 4,064,956 1,627,767
12,201,279 8,044
30,266 1,273,541
690,000 446,125
68,734 54,917,305
(1,016,935)
(78,400)
554,761 {601,354) (124,993)
2012
$41.332,297 53,092
209,680
462,389 12,973.298 1,848,238
56.878,994
24,293,097 8.010.610 1,078.811 1,172,711
6,420,096 1,225.955 3,375,506 1,451.515 4,495,180 2,139,404
295,569
730,000 412.400
55,100,854
1,778,140
2013
$ 42,559,398
202,237
870.158 14,852,429 1,247,727
59,731,949
25,405,012 7,908,699 1,121,091 1,302,039
7,359,777 1,891,794 2,931,523 1,568,005 4,764,414 2,169,915
2,557,613
725.000 387,525
60,092,407
(360,458)
1,085,548 (1,085,548)
2014
$ 43,716,718
218,941
427,637 14,232,200
1,268,737 59,864,233
26.358,792 8,713,538
972.115 1.462,105
7,932,585 1,070,823 2,856,089 1,907,865 5,089.219 2,222,966
1,081,185
845,000 371.825
60,884,107
(1,019,874)
EXHIBIT J-4
2015
$ 44,869.564
198,711
185.081 15,673,852 1,029,853
61,957,061
25,655,145 8,970,020 1,321,975 1.250,156
8.280.195 1,092,798 3,848.209 1.795,797 4,864,744 2,335,545
2,249,249
870,000 345,975
62,879,808
(922,747)
1,881,600 (1,481,600)
400,000
Net change in fund balances s 465,982 $ 840.232 $ 4.406,756 $ 446,016 $ (576,597) $ (1,141,928) $ 1,778,140 $ (360,458) s (1,019,874) $ (522,747)
Debt service as a percentage of noncapital expenditures 0.69%
* Noncapital expenditures are total expenditures less capital outlay.
3.88% 0.95% l.l9%
104
1.19% 1.41% 2.08% 1.93% 2.03% 2.01%
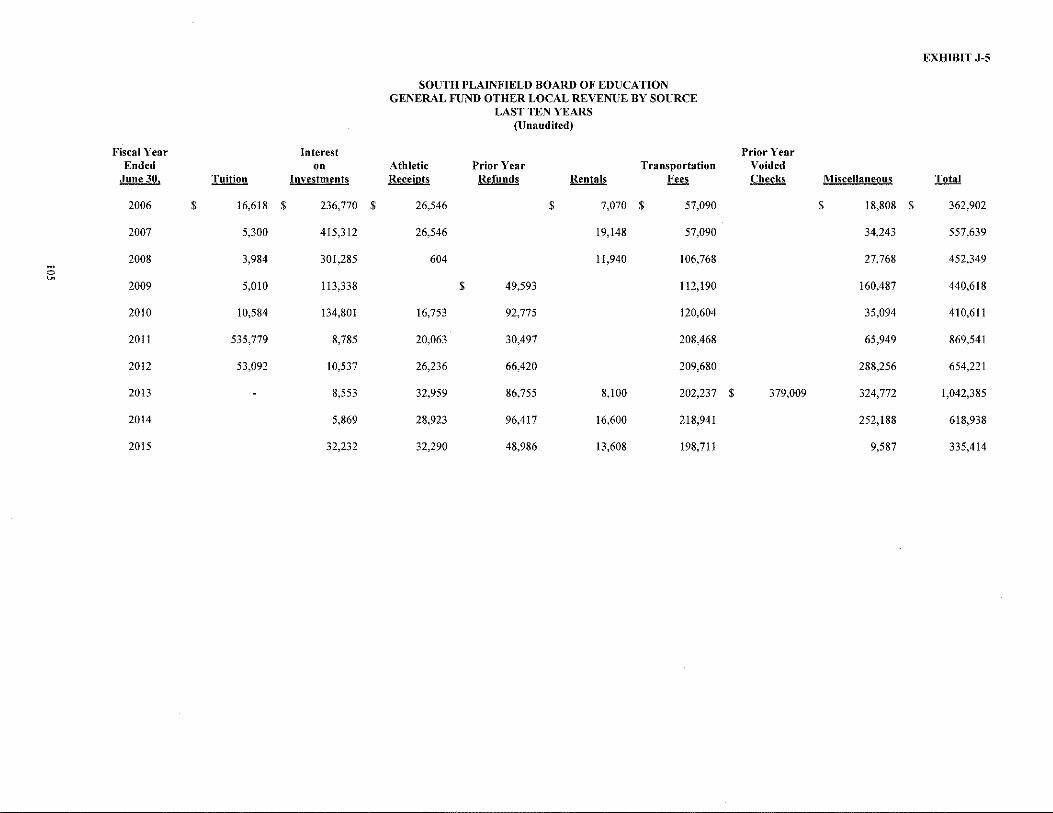
EXHIBIT J-5
SOUTH PLAINFIELD BOARD OF EDUCATION GENERAL FUND OTHER LOCAL REVENUE BY SOURCE
LAST TEN YEARS (Unaudited)
Fiscal Year Interest Prior Year Ended on Athletic Prior Year Transportation Voided
June 30. Tuition Investments Receints Refunds Rentals Fees Checks Miscellaneous Total
2006 $ 16,618 $ 236,770 $ 26,546 $ 7,070 $ 57,090 $ 18,808 $ 362,902
2007 5,300 415,312 26,546 19,148 57,090 34,243 557,639
2008 3,984 301,285 604 11,940 106,768 27,768 452,349 0 "' 2009 5,010 113,338 $ 49,593 112,190 160,487 440,618
2010 10,584 134,801 16,753 92,775 120,604 35,094 410,611
2011 535,779 8,785 20,063 30,497 208,468 65,949 869,541
2012 53,092 I 0,537 26,236 66,420 209,680 288,256 654,221
2013 8,553 32,959 86,755 8,100 202,237 $ 379,009 324,772 1,042,385
2014 5,869 28,923 96,417 16,600 218,941 252,188 618,938
2015 32,232 32,290 48,986 13,608 198,711 9,587 335,414
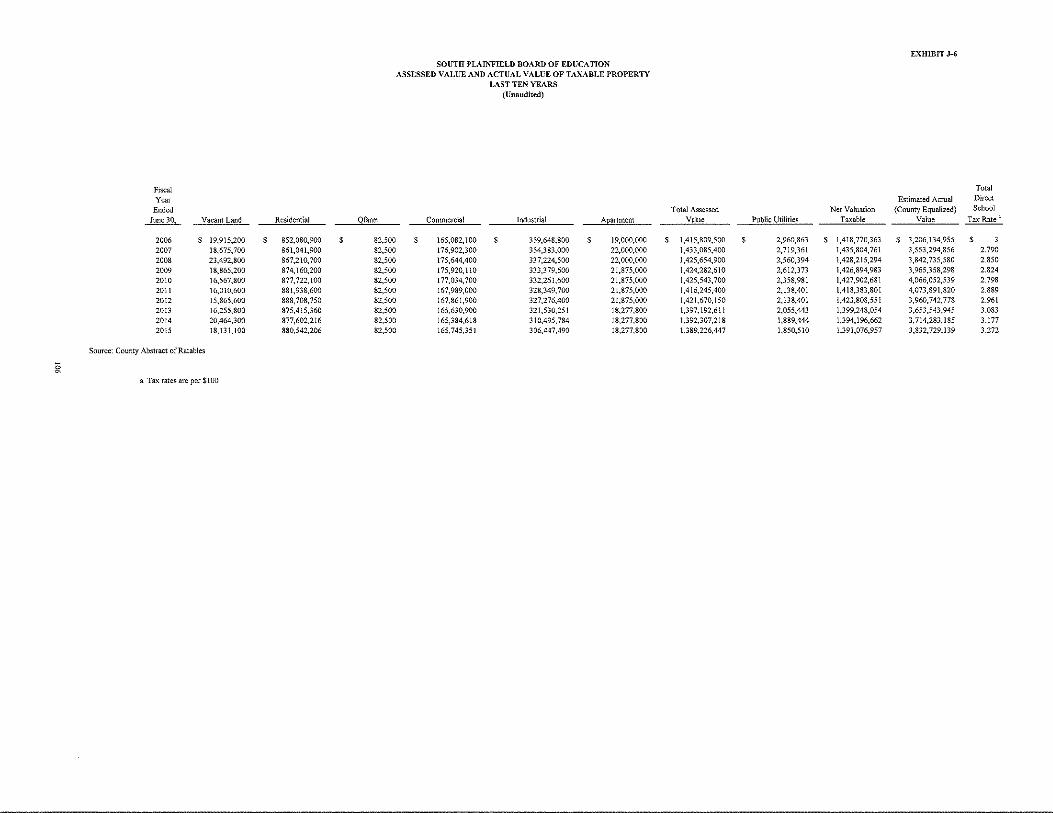
Fiscal Ym
Ended June 30, Vacant Land Residential
2006 s 19,915,200 s 852,080,900 s 2007 18,675,700 861,041,900 2008 23,492,800 867,210,700 2009 18,865,200 874,160,200 2010 16,567,800 877,722,100 2011 16,010,600 881,938,600 2012 15,865,600 888,708,750 2013 16,255,800 875,415,360 2014 20,464,300 877,602,216 2015 18,131,100 880,542,206
Source: County Abstract ofRatables
iii a Tax rates are per $100
Qf=
82,500 82,500 82,500 82,500 82,500 82,500 82,500 82,500 82,500 82,500
SOUTH PLAINFIELD BOARD OF EDlJCATION ASSESSED VALUE AND ACTUAL VALUE OF TAXABLE PROPERTY
LAST TEN YEARS (Unaudited)
Commercial Industrial A2artment
s 165,082,100 $ 359,648,800 s 19,000,000 176,902,300 354,383,000 22,000,000 175,644,400 337,224,500 22,000,000 175,920, l!O 333,379,600 21,875,000 177,034,700 332,261,600 21,875,000 167,989,000 328,349,700 21,875,000 167,861,900 327,276,400 21,875,000 165,630,900 321,530,251 18,277,800 165,384,618 310,495,784 18,277,800 165,745,351 306,447,490 18,277,800
EXHffiiT J-6
Total
Estimated Actual Direct
Total Assessed Net Valuation (County Equalized) School
Value Public Utilities Taxable Value Tax Rate'
s 1,415,809,500 $ 2,960,863 s 1,418,770,363 s 3,206,134,955 s 1,433,085,400 2,719,361 1,435,804,761 3,553,294,856 2.790 1,425,654,900 2,560,394 1,428,215,294 3,842, 735,580 2.850 1,424,282,610 2,612,373 1,426,894,983 3,965,358,298 2.824 1,425,543,700 2,358,981 1,427,902,681 4,066,052,539 2.798 1,416,245,400 2,138,401 1,418,383,801 4,073,891,820 2.889 1,421,670,150 2,138,401 1,423,808,551 3,960,742,778 2.961 1,397,192,611 2,055,443 1,399,248,054 3,653,543,945 3.083 1,392,307,218 1,889,444 1,394,196,662 3,714,283,185 3.177 1,389,226,447 1,850,510 1,391,076,957 3,832,729,139 3.272
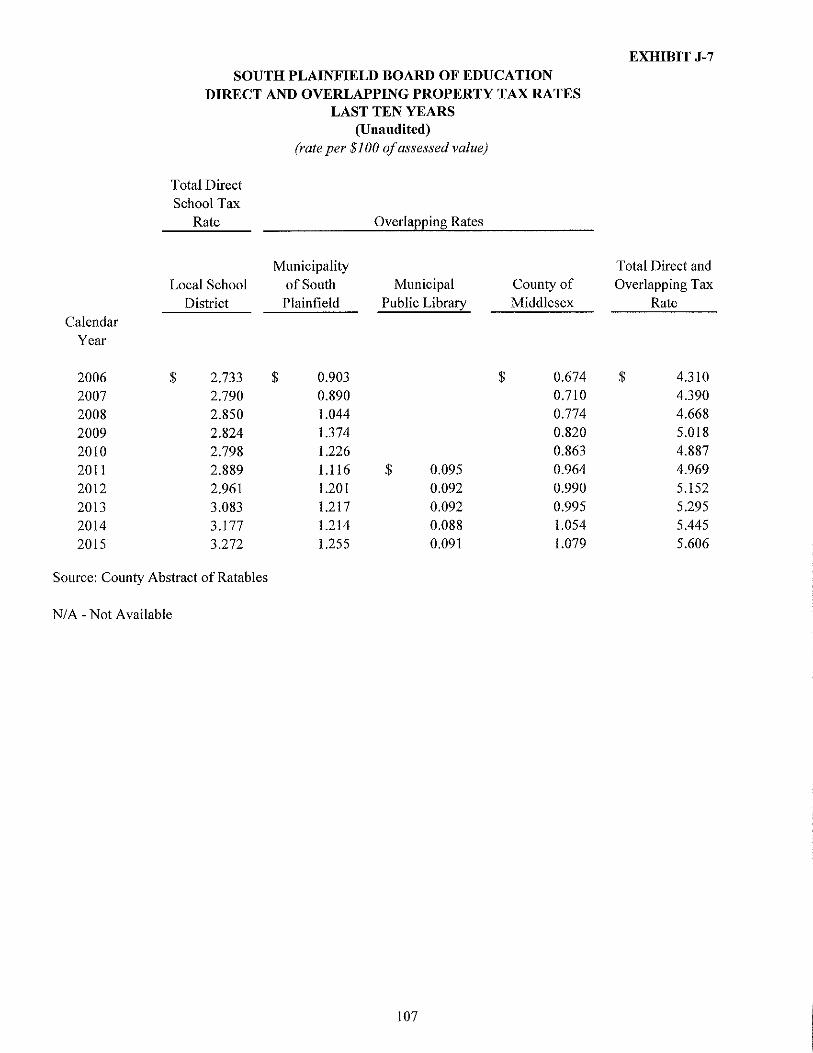
Calendar Year
2006 2007 2008 2009 2010 2011 2012 2013 2014 2015
SOUTH PLAINFIELD BOARD OF EDUCATION DIRECT AND OVERLAPPING PROPERTY TAX RATES
LAST TEN YEARS
Total Direct School Tax
Rate
Local School District
$ 2.733 2.790 2.850 2.824 2.798 2.889 2.961 3.083 3.177 3.272
(Unaudited) (rate per $100 of assessed value)
Overlapping Rates
Municipality of South Municipal
Plainfield Public Library
$ 0.903 0.890 1.044 1.374 1.226 1.116 $ 0.095 1.201 0.092 1.217 0.092 1.214 0.088 1.255 0.091
County of Middlesex
$ 0.674 0.710 0.774 0.820 0.863 0.964 0.990 0.995 1.054 1.079
Source: County Abstract of Ratables
N/A- Not Available
107
EXHIBIT J-7
Total Direct and Overlapping Tax
Rate
$ 4.310 4.390 4.668 5.018 4.887 4.969 5.152 5.295 5.445 5.606

Taxpayer
Jayne Enterprises Office Two Limited/o Ntl Tit Devl Nakash 200 Helen EQR- South Plainfield LLP Harris Realty LLC AG-WP Oak Park Owner, LLC GBR Middlesex LLC Plainfield Associates LLC
SOUTH PLAINFIELD BOARD OF EDUCATION PRINCIPAL PROPERTY TAXPAYERS, LAST YEAR AND EIGHT YEARS AGO
(Unaudited)
2015 Taxable %of Total Assessed District Net
Value Assessed Value
$ 18,268,400 1.31% 13,772,700 0.99% 12,500,000 0.90% 12,000,000 0.86% 11,124,200 0.80% 11,052,800 0.79% 10,238,100 0.74% 8,618,000 0.62%
Oak Tree Associates c/Odenholtz Association Favorite Realty North, LTD
6,970,000 6,913,300
0.50% 0.50%
$ Ill ,457,500 8.01%
Note:
Note:
EXHIBIT J-8
2008 Taxable %of Total Assessed District Net
Value Assessed Value
$ 18,454,800 1.29% 13,528,800 0.95% N/A 16,000,000 1.12% 11,001,100 0.77% NIA 10,000,000 0.70% 11,144,000 0.78% NIA NIA
GASB requires that the principal property taxpayers from last year and nine years ago data be presented. The principal property taxpayers from nine years ago was not available only from eight years ago.
Source: Municipal Tax Assessor
108
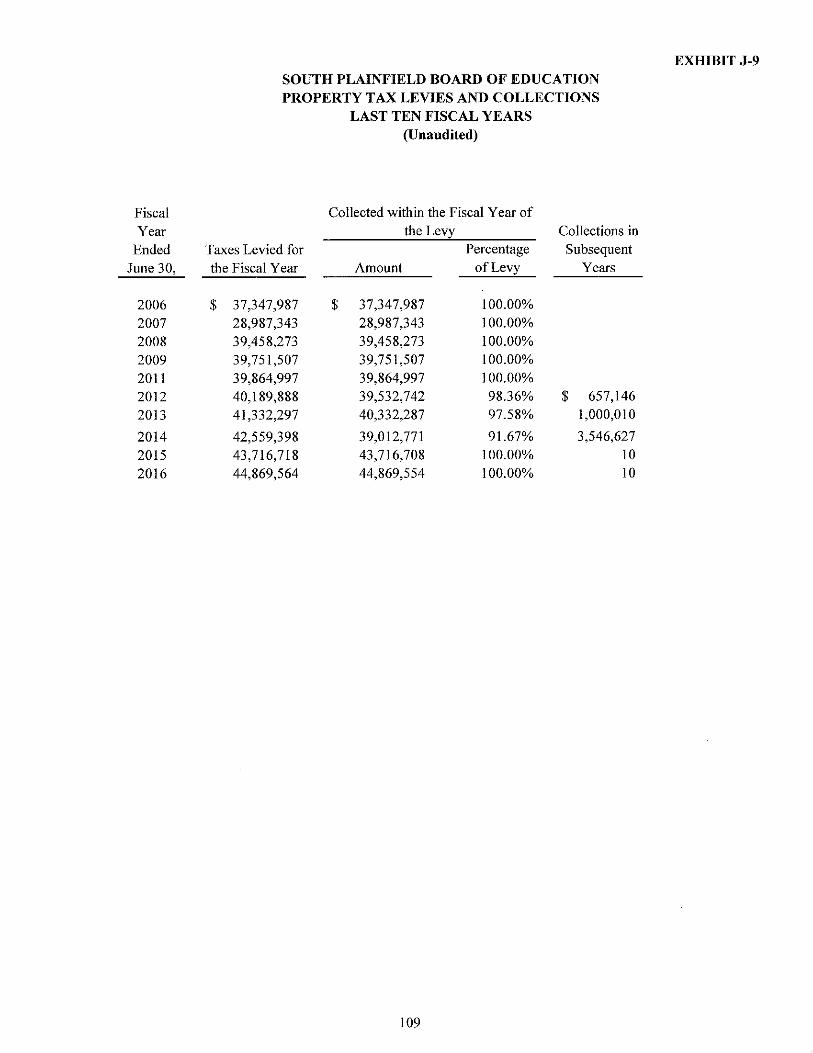
Fiscal Year
Ended June 30,
2006 2007 2008 2009 2011 2012 2013
2014 2015 2016
SOUTH PLAINFIELD BOARD OF EDUCATION PROPERTY TAX LEVIES AND COLLECTIONS
LAST TEN FISCAL YEARS (Unaudited)
Collected within the Fiscal Year of the Levy Collections in
Taxes Levied for Percentage Subsequent the Fiscal Year Amount of Levy Years
$ 37,347,987 $ 37,347,987 100.00% 28,987,343 28,987,343 100.00% 39,458,273 39,458,273 100.00% 39,751,507 39,751,507 100.00% 39,864,997 39,864,997 100.00% 40,189,888 39,532,742 98.36% $ 657,146
41,332,297 40,332,287 97.58% 1,000,010
42,559,398 39,012,771 91.67% 3,546,627
43,716,718 43,716,708 100.00% 10 44,869,564 44,869,554 100.00% 10
109
EXHIBIT J-9
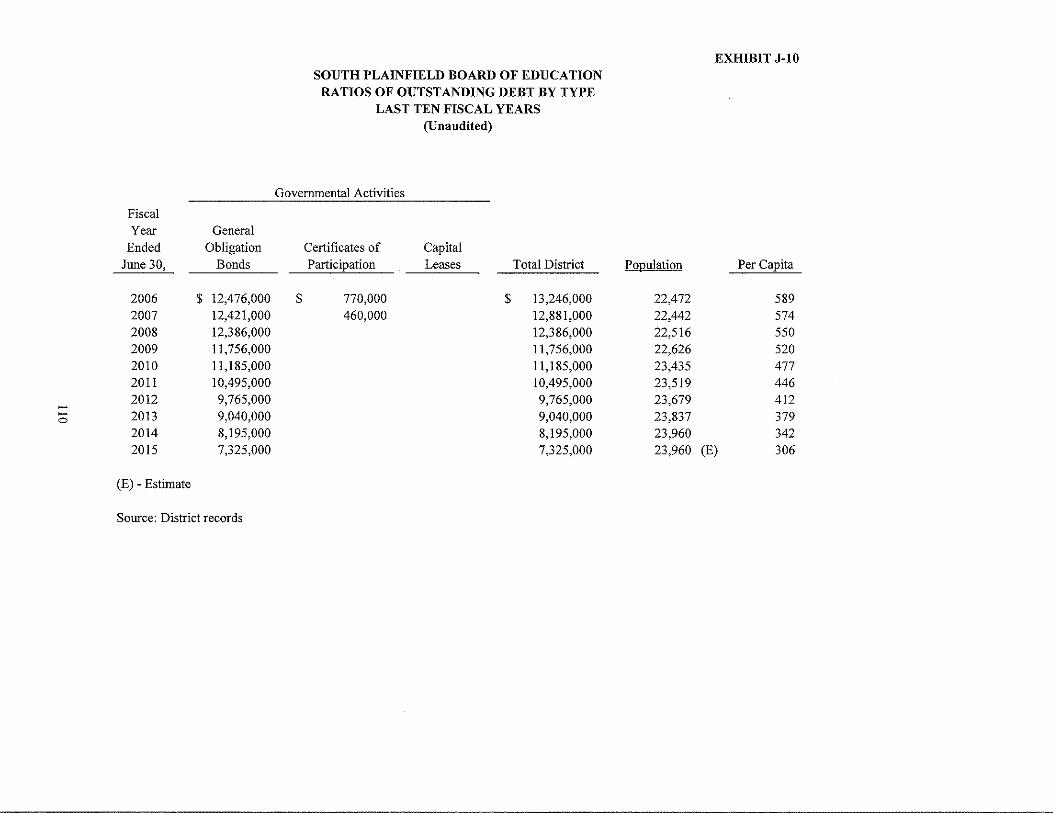
Fiscal Year General
Ended Obligation June 30, Bonds
2006 $ 12,476,000 2007 12,421,000 2008 12,386,000 2009 11,756,000 2010 11,185,000 2011 10,495,000 2012 9,765,000 - 2013 9,040,000 0
2014 8,195,000 2015 7,325,000
(E) - Estimate
Source: District records
SOUTH PLAINFIELD BOARD OF EDUCATION RATIOS OF OUTSTANDING DEBT BY TYPE
LAST TEN FISCAL YEARS (Unaudited)
Governmental Activities
Certificates of Capital Participation Leases Total District
$ 770,000 $ 13,246,000 460,000 12,881,000
12,386,000 11,756,000 11,185,000 10,495,000 9,765,000 9,040,000 8,195,000 7,325,000
EXHIBIT J-1 0
Population Per Capita
22,472 589 22,442 574 22,516 550 22,626 520 23,435 477 23,519 446 23,679 412 23,837 379 23,960 342 23,960 (E) 306

EXHIBIT J-11 SOUTH PLAINFIELD BOARD OF EDUCATION
RATIOS OF NET GENERAL BONDED DEBT OUTSTANDING LAST TEN FISCAL YEARS
(Unaudited)
General Bonded Debt Outstanding Percentage of
Fiscal Year General Net General Actual Taxable
Ended June Obligation Bonded Debt Value • of 30, Bonds Deductions Outstanding Property Per Capita
2006 $ 13,246,000 $ $ 13,246,000 0.93% $589 2007 12,881,000 12,881,000 0.90% $574 2008 12,386,000 12,386,000 0.87% $550 2009 11,756,000 11,756,000 0.82% $520 2010 11,185,000 11,185,000 0.78% $477 2011 10,495,000 10,495,000 0.74% $446 2012 9,765,000 9,765,000 0.69% $412 2013 9,040,000 9,040,000 0.65% $379 2014 8,195,000 8,195,000 0.59% $342 2015 7,325,000 7,325,000 0.53% $306
Source: District records
Ill
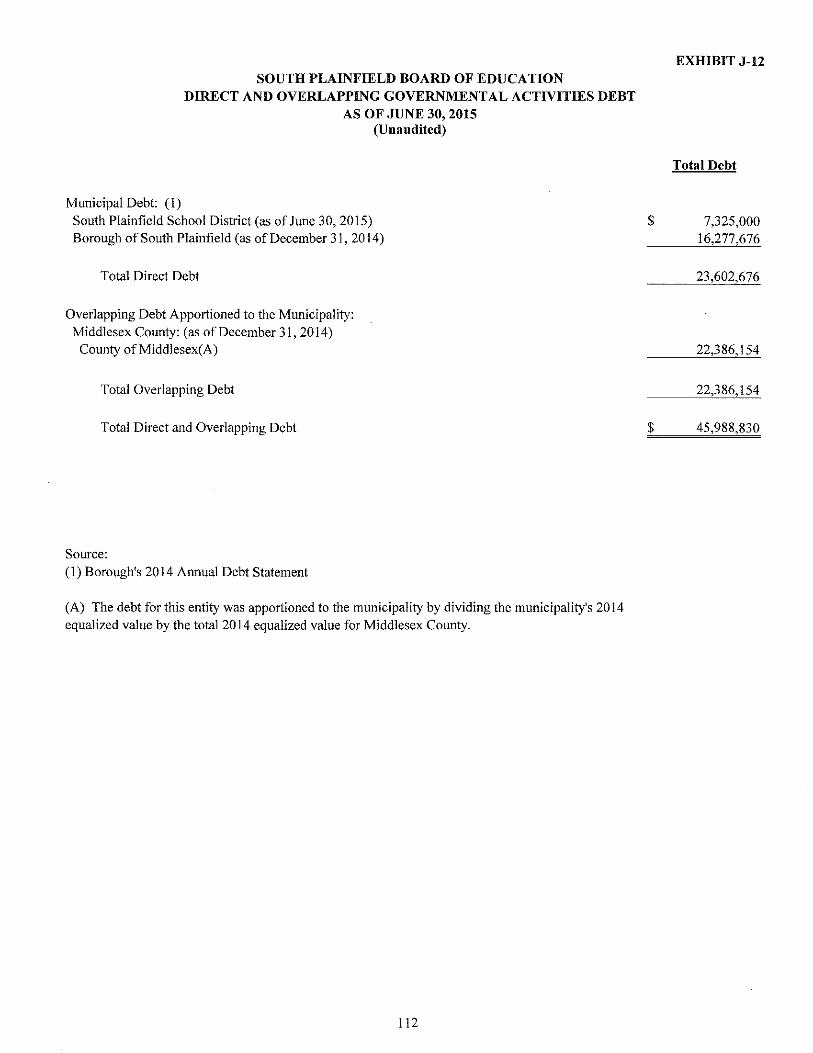
SOUTH PLAINFIELD BOARD OF EDUCATION DIRECT AND OVERLAPPING GOVERNMENTAL ACTIVITIES DEBT
AS OF JUNE 30, 2015 (Unaudited)
Municipal Debt: (1) South Plainfield School District (as of June 30, 2015) Borough of South Plainfield (as of December 31, 2014)
Total Direct Debt
Overlapping Debt Apportioned to the Municipality: Middlesex County: (as of December 31, 2014)
County ofMiddlesex(A)
Total Overlapping Debt
Total Direct and Overlapping Debt
Source: (I) Borough's 2014 Annual Debt Statement
(A) The debt for this entity was apportioned to the municipality by dividing the municipality's 2014 equalized value by the total2014 equalized value for Middlesex County.
112
$
$
EXHIBIT J-12
Total Debt
7,325,000 16,277,676
23,602,676
22,386,154
22,386,154
45,988,830
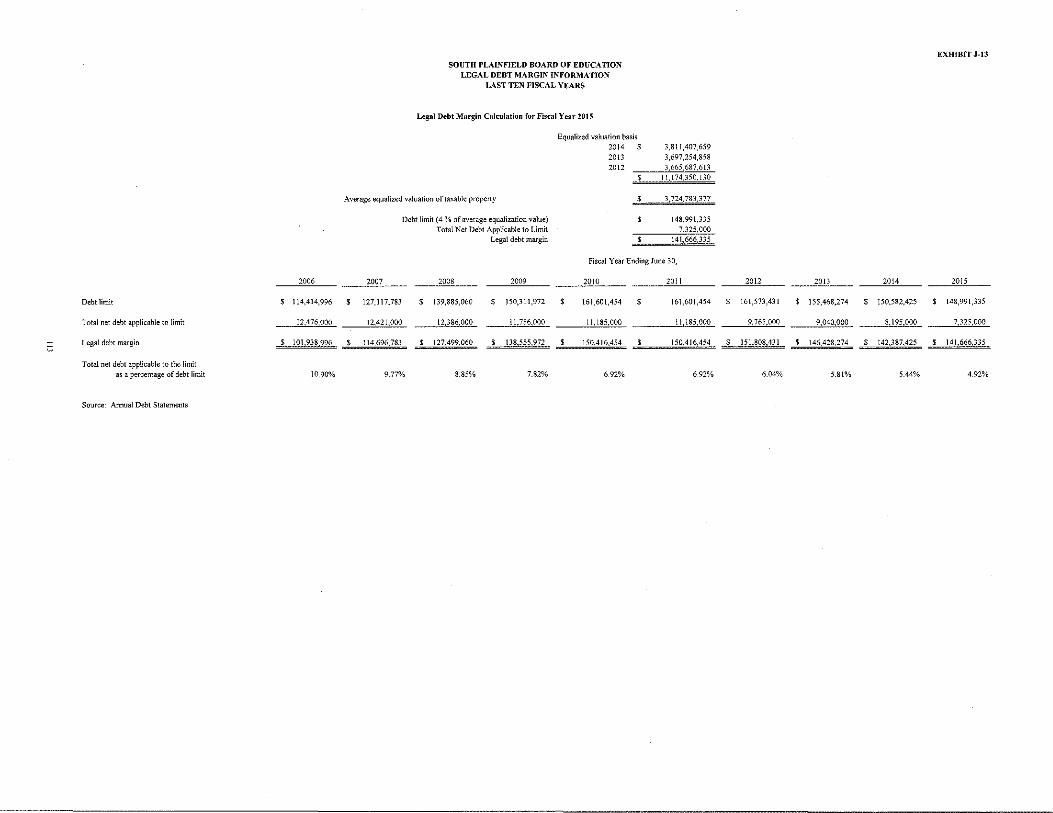
2006
Debt limit 114,414,996
Total net debt applicable to limit 12,476.000
Legal debt margin 101,938,996
Total net debt applicable to the limit as a percentage of debt limit 10.90%
Source: Annual Debt Statements
SOUTH PLAL~FIELD BOARD OF EDUCATION LEGAL DEBT MARGIN INFORMATION
LAST TEN FISCAL YEARS
Legal Debt Margin Calculation for Fiscal Year 2015
Equalized valuation basis
Average equalized valuation of taxable property
Debt limit (4% of average equalization value) Total Net Debt Applicable to Limit
Legal debt margin
2014 s 2013 2012
$
3,811,407,659 3,697,254,858 3,665,687,613
11,174,350,130
3,724,783,377
148,991,335 7,325,000
141,666,335
Fiscal Year Ending June 30,
2007 2008 2009 2010 2011
127,117,783 139,885,060 150,311,972 161,601,454 $ 161,601,454
12,421,000 12,}~_§,000 11,756,000 11,185,000 11185000
114,696,783 $ 127,499,060 $ \38 555 972 150,416,454 $ 150,416 454
9.77% 8_85% 7.82% 6.92% 6.92%
EXHIBIT J-13
2012 2013 2014 __12l1
$ 161,573.431 $ 155,468,274 $ 150,582,425 $ 148,991,335
9,765,000 9,040,000 8 195,000 7,325,000
$ 151,808,431 $ 146,428,274 $ 142,387,425 $ 141,666.335
6.04% 5.81% 5.44% 4.92%
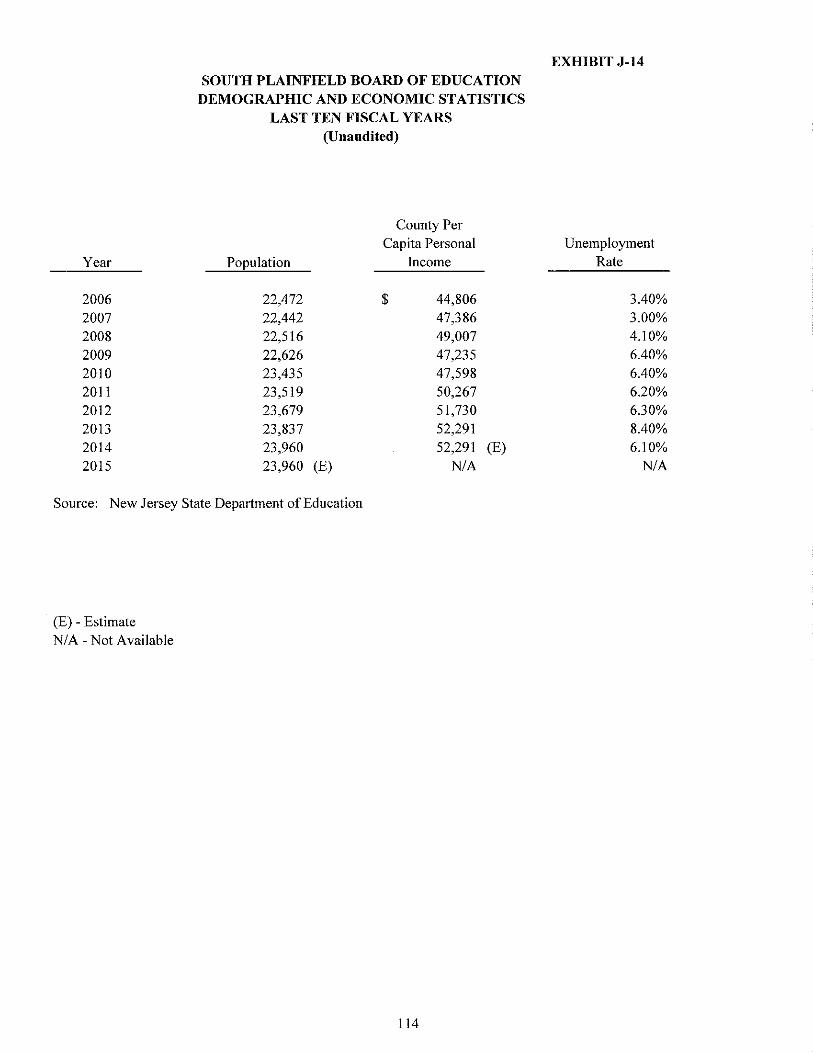
Year
2006 2007 2008 2009 2010 20I I 20I2 20I3 2014 20I5
SOUTH PLAINFIELD BOARD OF EDUCATION DEMOGRAPHIC AND ECONOMIC STATISTICS
LAST TEN FISCAL YEARS (Unaudited)
County Per Capita Personal
Population Income
22,472 $ 44,806 22,442 47,386 22,516 49,007 22,626 47,235 23,435 47,598 23,519 50,267 23,679 5 I,730 23,837 52,291 23,960 52,291 (E) 23,960 (E) N/A
Source: New Jersey State Department of Education
(E) - Estimate N/A- Not Available
I I 4
EXHIBIT J-14
Unemployment Rate
3.40% 3.00% 4.IO% 6.40% 6.40% 6.20% 6.30% 8.40% 6.IO%
N/A
Employer
SOUTH PLAINFIELD BOARD OF EDUCATION PRINCIPAL EMPLOYERS,
CURRENT YEAR AND NINE YEARS AGO (Unaudited)
2015
Employees
Percentage of Total
Municipal Employment
INFORMATION IS NOT AVAILABLE
115
2006
Employees
EXHIBIT J-15
Percentage of Total
Municipal Employment
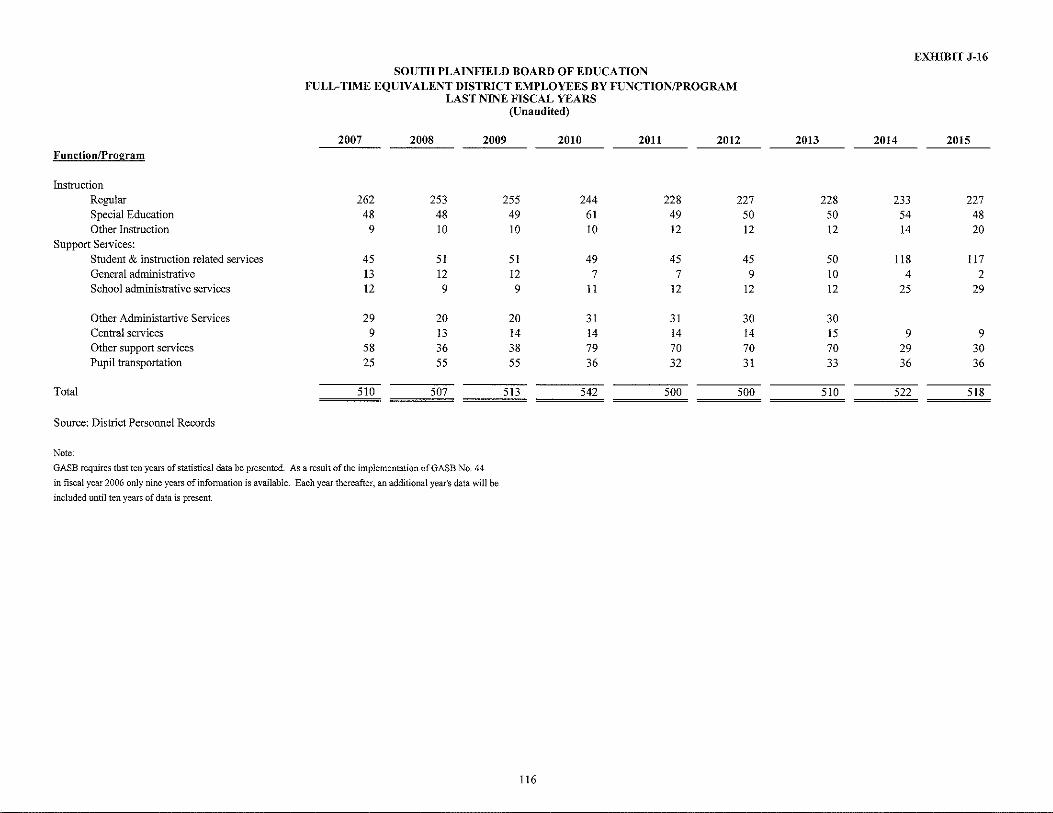
SOUTH PLAINFIELD BOARD OF EDUCATION FULL-TIME EQUIVALENT DISTRICT EMPLOYEES BY FUNCTION/PROGRAM
LAST NINE FISCAL YEARS (Unaudited)
2007 2008 2009 2010 2011 2012 Function/Program
Instruction Regular 262 253 255 244 228 227 Special Education 48 48 49 61 49 50 Other Instruction 9 10 10 10 12 12
Support Services: Student & instruction related services 45 51 51 49 45 45 General administrative 13 12 12 7 7 9 School administrative services 12 9 9 11 12 12
Other Administartive Services 29 20 20 31 31 30 Central services 9 13 14 14 14 14 Other support services 58 36 38 79 70 70 Pupil transportation 25 55 55 36 32 31
Total 510 507 513 542 500 500
Source: District Personnel Records
Note:
GASB requires that ten years of statistical data be presented. As a result of the implementation of GASB No. 44
in fiscal year 2006 only nine years of infonnation is available. Each year thereafter, an additional year's data will be
included until ten years of data is present.
116
EXHIBIT J-16
2013 2014 2015
228 233 227 50 54 48 12 14 20
50 118 117 10 4 2 12 25 29
30 15 9 9 70 29 30 33 36 36
510 522 518

Operating Cost Per Percentage Fiscal Year Enrollment • Expenditures h Pupil~ Change
2006 3,783 $ 49,895,799 $ 13,189 5.77% 2007 3,889 51,807,265 13,321 1.00% 2008 3,710 52,395,717 14,123 6.02% 2009 3,708 52,703,108 14,213 0.64% 2010 3,764 54,331,608 14,435 1.56% 2011 3,753 52,438,805 13,973 -3.20% 2012 3,641 53,662,885 14,739 5.48% 2013 3,564 56,422,269 15,831 7.41% 2014 3,468 58,586,097 16,893 14.62% 2015 3,530 59,414,584 16,831 6.32%
Sources: District records
Note: a Enrolhnent based on annual October district count. b Operating expenditures equal total expenditures less debt service and capital outlay.
Cost per pupil represents operating expenditures divided by enrolhnent.
~
SOUTH PLAI:'IIFIELD BOARD OF EDUCATION OPERATING STATISTICS LAST TEN FISCAL YEARS
(Unaudited)
Teacher/Pupil Ratio
Teaching Senior High Staff Elementary Middle School School
294.2 16.70 14 15 307.0 9.40 14 12
NIA N/A NIA NIA
NIA N!A NIA NIA
NIA NIA NIA NIA
NIA NIA N/A NIA NIA NIA NIA N/A
291.0 NIA NIA NIA 293.0 12.6 \0.7 12.6 343.0 11.0 8.2 10.4
EXHIBIT J-17
Average Daily %Change in Average Daily Attendance Average Daily Student Attendance
Enrollment (ADE) (ADA} Enrollment Percentage
3,791 3,619 34.00% 95.46% 3,797 3,623 0.16% 95.42% 3,721 3.557 -2.00% 95.59% 3,705 3,536 -0.43% 95.44% 3,739 3,585 0.92% 95.88% 3,714 3,551 -0.67% 95.61% 3,630 3,490 -2.26% 96.14% 3,558 3,408 -1.99% 95.79% 3,461 3,322 -2.72% 95.98% 3,576 3,416 3.32% 95.53%
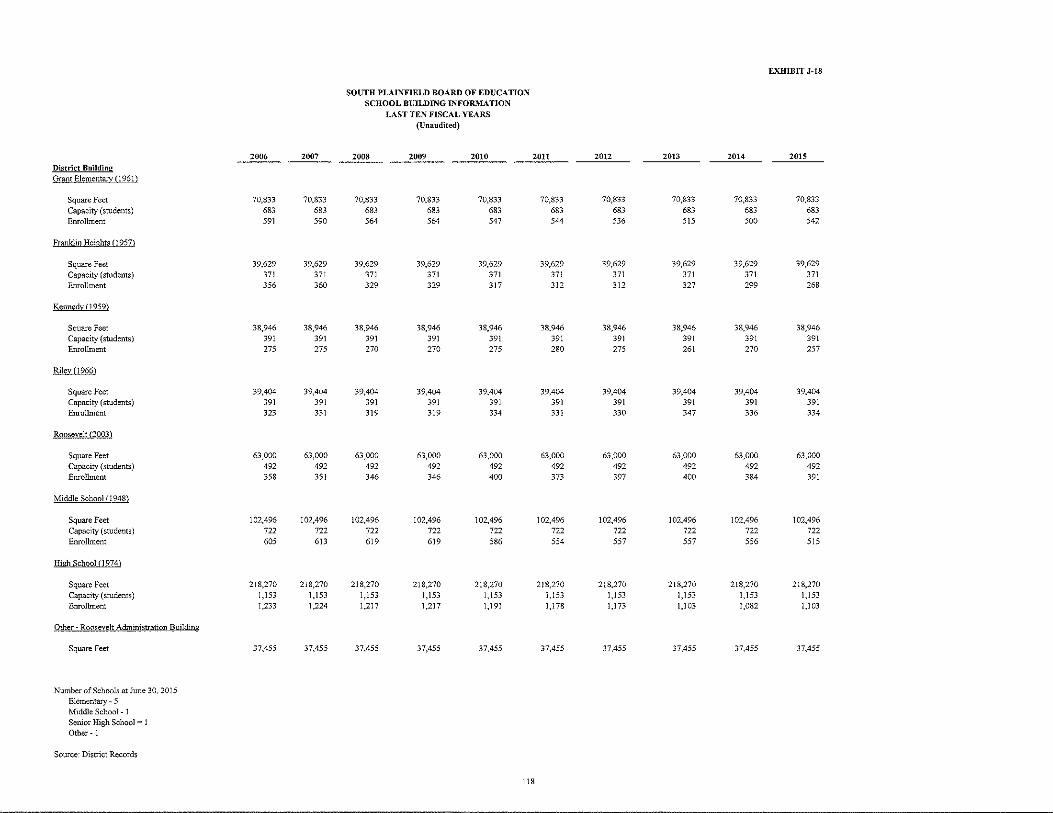
EXHIBIT J-18
SOUTH PLAINFIELD BOARD OF EDUCATION SCHOOL BUILDING INFOR..\1ATION
LAST TEN FISCAL YEARS (L"naudited)
2006 2007 2008 2009 2010 2011 2012 2013 2014 2015
District Building Grant Elementary(] 961 l
Square Feet 70,833 70,833 70,833 70,833 70,833 70,833 70,833 70,833 70,833 70,833
Capacity (students) 683 683 683 683 683 683 683 683 683 683 Enrolhnent 591 590 564 564 547 544 536 515 500 542
Franklin Heights IJ957l
Square Feet 39,629 39,629 39,629 39,629 39,629 39,629 39,629 39,629 39,629 39,629
Capacity (students) 371 371 371 371 371 371 371 371 371 371 Enrollment 356 360 329 329 317 312 312 327 299 268
Kennedv (1959)
Square Feet 38,946 38,946 38,946 38,946 38,946 38,946 38,946 38,946 38,946 38,946 Capacity (students) 391 391 391 391 391 391 391 391 391 391 Enrolhnent 275 275 270 270 275 280 275 261 270 257
Riley 11966)
Square Feet 39,404 39,404 39,404 39,404 39,404 39,404 39,404 39,404 39,404 39,404 Capacity (students) 391 391 391 391 391 391 391 391 391 391 Enrolhnent 323 331 319 319 334 331 330 347 336 334
Roosevelt 12003)
Square Feet 63,000 63,000 63,000 63,000 63,000 63,000 63,000 63,000 63,000 63,000 Capacity (students) 492 492 492 492 492 492 492 492 492 492 Enrollment 358 351 346 346 400 373 397 400 384 391
Middle School 11948)
Square Feet 102,496 102,496 102,496 102,496 102,496 102,496 102,496 102,496 102,496 102,496 Capacity (students) 722 722 722 722 722 722 722 722 722 722 Enrolhnent 605 613 619 619 586 554 557 557 556 515
Hi!!:h School 0974l
Square Feet 218,270 218,270 218,270 218,270 218,270 218,270 218,270 218,270 218,270 218,270 Capacity (students) 1,153 1.153 1,153 1,153 1,153 1,153 1,153 1,153 1,153 1,153 Enro1hnent 1,233 1,224 1,217 1,217 1,191 1,178 1,173 1,103 1,082 1,103
Other- Roosevelt Administration Building
Square Feet 37,455 37,455 37,455 37,455 37,455 37,455 37,455 37,455 37,455 37,455
Number of Schools at June 30, 2015 Elementary- 5 Middle School- 1 Senior High School= I Other- 1
Source: District Records
118
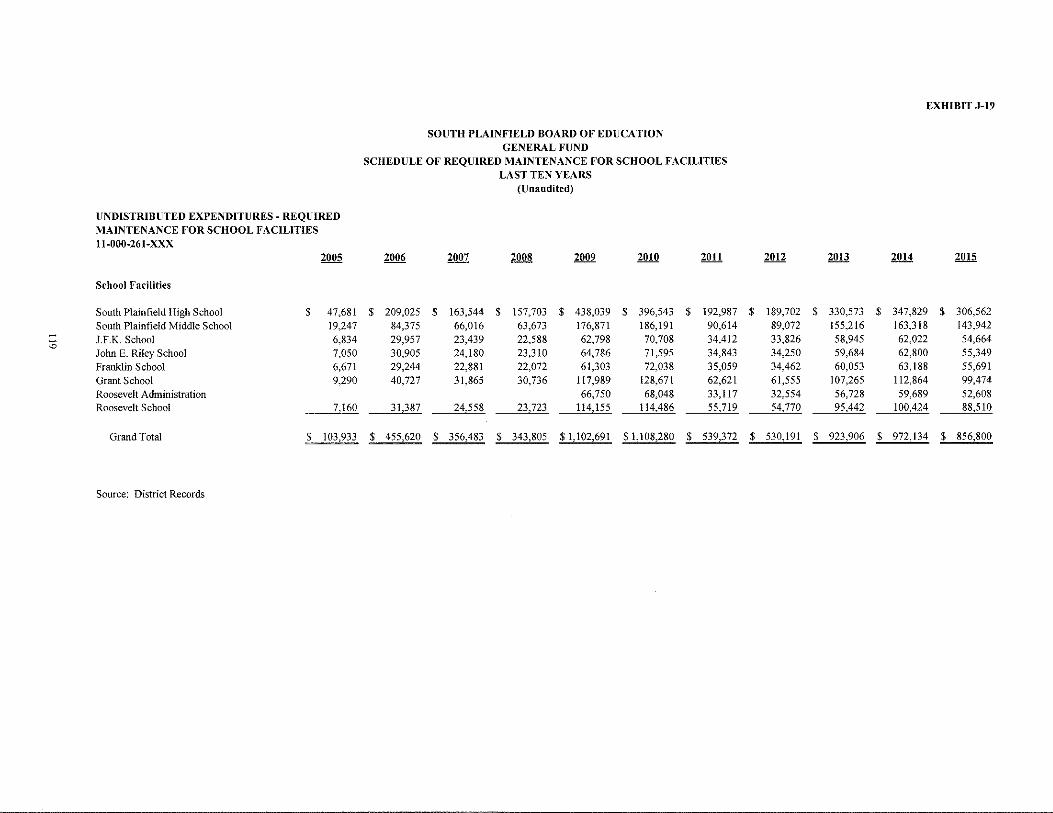
EXHIBIT J-I9
SOUTH PLAINFIELD BOARD OF EDUCATION GENERAL FUND
SCHEDULE OF REQUIRED MAINTENANCE FOR SCHOOL FACILITIES LAST TEN YEARS
(Unaudited)
UNDISTRIBUTED EXPENDITURES- REQUIRED MAINTENANCE FOR SCHOOL FACILITIES 11-000-261-XXX
2005 2006 2007 2008 2009 20IO 2011 2012 2013 2014 2015
School Facilities
South Plainfield High School $ 47,681 $ 209,025 $ 163,544 $ 157,703 $ 438,039 $ 396,543 $ 192,987 $ 189,702 $ 330,573 $ 347,829 $ 306,562
South Plainfield Middle School 19,247 84,375 66,016 63,673 176,871 186,191 90,614 89,072 155,216 163,318 143,942
:;; J.F.K. School 6,834 29,957 23,439 22,588 62,798 70,708 34,412 33,826 58,945 62,022 54,664
John E. Riley School 7,050 30,905 24,180 23,310 64,786 71,595 34,843 34,250 59,684 62,800 55,349
Franklin School 6,671 29,244 22,881 22,072 61,303 72,038 35,059 34,462 60,053 63,188 55,691
Grant School 9,290 40,727 31,865 30,736 117,989 128,671 62,621 61,555 107,265 112,864 99,474
Roosevelt Administration 66,750 68,048 33,117 32,554 56,728 59,689 52,608 Roosevelt School 7 J,§,Q, 31,387 24,558 23,723 114,155 114,486 55,719 54,770 95,442 100,424 ~510
Grand Total $ 103,933 $ 455,620 $ 356,483 $ 343,805 $ 1,102,691 $1,108,280 $ 539,372 $ 530,191 $ 923,906 $ 972,134 $ 856,800
Source: District Records

SOUTH PLAINFIELD BOARD OF EDUCATION INSURANCE SCHEDULE
JUNE 30, 2015 (Unaudited)
Coverage
School Package Policy- New Jersey School Boards Association Insurance Group (NJSIG)
Real and Personal Property- Building and Contents (NJSIG Limit)
Electronic Data Processing
Environmental Package
Comprehensive General Liability
School Leaders Errors and Omissions Liability
Automobile Liability
Faithful Performance Crime Coverage
Workers Compensation and Employees Liabilitiy
Surety Bond - Treasurer of School Monies
Surety Bond- Business Administrator/Board Secretary-
Source: School District's records
120
$ 350,000,000
1,500,000
1,000,000
16,000,000
16,000,000
16,000,000
500,000
2,000,000
350,000
350,000
EXHIBIT J-20
Deductible
$ 5,000
1,000
10,000
5,000
1,000
1,000

SINGLE AUDIT
LERCH, VINCI & HIGGINS,LLP CERTIFIED PUBLIC ACCOUNTANTS REGISTERED MUNICIPAL ACCOUNTANTS
DIETER P. LERCH, CPA, RMA, I'SA
GARY J. VTNCI, CPA, RMA, PSA
GARY W. HIGGINS, CPA, RMA. PSA
ffirl'R EY C. BLISS, CPA, RMA. I'SA
PAUL J. LERC H. CPA, RMA, PSA
DONNA L. JAPHET. CPA, PSA
JULIUS B. CONSONI, CPA, PSA
ELIZABETH A. SHICK, CPA. RMA, PSA
ANDREW PARENTE, CPA. RMA. PSA
ROBERT W. HAAG. CPA, PSA
DEBORAH K. LERCH. CI'A. PSA REPORT ON INTERNAL CONTROL OVER FINANCIAL RALPH M. PICONE, CPA, RMA. PSA REPORTING AND ON COMPLIANCE AND OTHER MATTERS
BASED ON AN AUDIT OF FINANCIAL STATEMENTS PERFORMED IN ACCORDANCE WITH GOVERNMENT AUDITING STANDARDS
Honorable President and Members of the Board of Trustees
South Plainfield Board ofEducation South Plainfield, New Jersey
INDEPENDENT AUDITOR'S REPORT
EXHIBITK-1
DEBRA GOLLE. CI'A
CINDY JANACEK. CPA, RMA
MARK SACO. CPA
SHERYL M. NICOLOSI, CPA
KATHLEEN WANG, CPA
ROBERT AMPONSAH, CPA
We have audited, in accordance with the auditing standards generally accepted in the United States of America; the standards applicable to financial audits contained in Government Auditing Standards issued by the Comptroller General of the United States and audit requirements prescribed by the Office of School Finance, Department of Education, State of New Jersey, the financial statements of the governmental activities, the business-type activities, each major fund, and the aggregate remaining fund infonnation of the South Plainfield Board of Education as of and for the fiscal year ended June 30, 20 I 5 and the related notes to the financial statements, which collectively comprise the South Plainfield Board of Education's basic financial statements and have issued our report thereon dated November 24, 2015.
Internal Control Over Financial Reporting
In planning and performing our audit of the financial statements, we considered the South Plainfield of Education's internal control over financial reporting (internal control) to determine the audit procedures that are appropriate in the circumstances for the purpose of expressing our opinions on the financial statements but not for the purpose of expressing an opinion on the effectiveness of the South Plainfield Board of Education 's internal control. Accordingly, we do not express an opinion on the effectiveness of the South Plainfield Board of Education's internal control.
A deficiency in internal control exists when the design or operation of a control does not allow management or employees, in the normal course of performing their assigned functions, to prevent, or detect and correct, misstatements on a timely basis. A material weakness is a deficiency, or a combination of deficiencies, in internal control, such that there is a reasonable possibility that a material misstatement of the entity' s financial statements will not be prevented, or detected and corrected on a timely basis. A significant deficiency is a defi ciency, or a combination of deficiencies, in internal control that is less severe than a material weakness, yet important enough to merit attention by those charged with governance.
17- 17 ROUTE 208 • FAIR LAWN, NJ 074 10 • TELEPHONE (201) 791-7100 • FACSTMILE (201 ) 791-3035
WWW+ 2 ¥ CPA.COM

EXHIBITK-1
Our consideration of intemal control was for the limited purpose described in the first paragraph of this section and was not designed to identify all deficiencies in intemal control that might be material weaknesses or significant deficiencies and therefore, material weaknesses or significant deficiencies may exist that were not identified. Given these limitations, during our audit we did not identify any deficiencies in internal control that we consider to be material weaknesses. We did identify a certain deficiency in internal control, described in the accompanying schedule of schedule of findings and questioned costs as item 2015-001 that we consider to be a significant deficiency in internal control over financial repm1ing.
Compliance and Other Matters
As part of obtaining reasonable assurance about whether the South Plainfield Board of Education's financial statements are free from material misstatement, we performed tests of its compliance with certain provisions of laws, regulations, contracts, and grant agreements, noncompliance with which could have a direct and material effect on the determination of financial statement amounts. However, providing an opinion on compliance with those provisions was not an objective of our audit, and accordingly, we do not express such an opinion. The results of our tests disclosed instances of noncompliance or other matters that are required to be reported under Government Auditing Standards and audit requirements as prescribed by the Office of School Finance, Department of Education, State of New Jersey and which are described in the accompanying schedule of findings and questioned costs as items 2015-001 and 2015-002.
We also noted certain matters that are not required to be reported under Government Auditing Standards that we reported to management of the South Plainfield Board of Education in a separate report entitled, "Auditor's Management Report on Administrative Findings- Financial, Compliance and Performance" dated November 24,2015.
South Plainfield Board of Education's Response to Finding
The South Plainfield Board of Education's response to the finding identified in our audit is described in the accompanying schedule of findings and questioned costs The South Plainfield Board of Education' s response was not subjected to the auditing procedures applied in the audit of the financial statements and, accordingly, we express no opinion on the response.
Purpose of this Report
The purpose of this report is solely to describe the scope of our testing of internal control and compliance and the results of that testing, and not to provide an opinion on the effectiveness of the South Plainfield Board of Education's internal control or on compliance. This report is an integral part of an audit performed in accordance with Government Auditing Standards in considering the South Plainfield Board of Education's internal control and compliance. Accordingly, this communication is not suitable for any other purpose.
Fair Lawn, New Jersey November 24, 2015
122
l~tz.<~. v,~~, ~ +J,~,~s.. Ll-P LERCH, VJNCI & HIGGINS, LLP Certified Public Accountants Pu~· <.:P'o~'
ffrey C. Bliss Public School Accountant PSA Number CS00932
LERCH, VINCI & HIGGINS,LLP
DIETER P. LEKCH. CPA. RMA, PSA
GARY J. VINC I, CPA, RMA. PSA
GARY W. HIGGINS. CPA, RMA, PSA
JEFfREY C. BLISS, CPA, RMA, PSA
PAULl. LERCH, CPA, RMA, PSA
DONNA L. JAPHET, CPA, PSA
JULIUS B. CONSONI, CPA, PSA
ELIZABETH A. SHICK. CPA, RMA, PSA
ANDREW PARENTE, CPA, RMA, PSA
RO!JERT W. HAAG. CPA, PSA
DEBORAH K. LERCH. CPA. PSA
RALPH M. PICONE. CPA, RMA, PSA
CERTIFIED PUBLIC ACCOUNTANTS REGISTERED MUNICIPAL ACCOUNTANTS
EXHIBITK-2
DEBRA GOLLE, CPA
CINDY JANACEK. CPA. RMA
MARK SACO, CPA
SHERYL M. NICOLOSI. CPA
KATHLEEN WANG. CPA
ROBERT AMPONSAH, CPA
REPORT ON COMPLIANCE FOR EACH MAJOR FEDERAL AND STATE PROGRAM; REPORT ON INTERNAL CONTROL OVER COMPLIANCE; AND REPORT ON SCHEDULE
OF EXPENDITURES OF FEDERAL AWARDS REQUIRED BY U.S. OMB CIRCULAR A-133 AND SCHEDULE OF EXPENDITURES OF STATE FINANCIAL ASSISTANCE REQUIRED BY NEW JERSEY
OMB CIRCULAR 15-08
Honorable President and Members ofthe Board ofTrustees
South Plainfield Board of Education South Plainfield, New Jersey
INDEPENDENT AUDITOR'S REPORT
Report on Compliance for Each Major Federal and State Program
We have audited the South Plainfield Board of Education's compliance with the types of compliance requirements described in the U.S. Office of Management and Budget (OMB) Circular A-133 Compliance Supplement and the New Jersey OMB Circular 15-08 State Aid/ Grant Compliance Supplement that could have a direct and material effect on each of South Plainfield Board ofEducation's major federal and state programs for the fiscal year ended June 30, 2015. The South Plainfield Board of Education's major federal and state programs are identified in the summary of auditor's results section of the accompanying schedule of findings and questioned costs.
Management's Responsibility
Management is responsible for compliance with the requirements of laws, regulations, contracts, and grants applicable to its federal and state programs.
Auditor's Responsibility
Our responsibility is to express an opinion on compliance for each of the South Plainfield Board of Education 's major federal and state programs based on our audit of the types of compliance requirements referred to above. We conducted our audit of compliance in accordance with auditing standards generally accepted in the United States of America; the standards applicable to financial audits contained in Government Auditing Standards, issued by the Comptroller General of the United States; audit requirements as prescribed by the Office of School Finance, Department of Education, State of New Jersey; U.S. OMB Circular A-133, Audits of States, Local Governments, and Non-Profit Organizations and New Jersey OMB Circular 15-08, Single Audit Policy for Recipients of Federal Grants, State Grants and State Aid. Those standards and Circulars require that we plan and perform the audit to obtain reasonable assurance about whether
17-17 ROUTE 208• FAIR LAWN, NJ 074 10• TELEPHONE (201 ) 79 1-7 100 • FACSIMILE (20 1) 791-3035
WWW.LVHCPA.COM 123

EXHIBITK-2
noncompliance with the types of compliance requirements referred to above that could have a direct and material effect on a major federal or state program occurred. An audit includes examining, on a test basis, evidence about the South Plainfield Board of Education's compliance with those requirements and performing such other procedures as we considered necessary in the circumstances.
We believe that our audit provides a reasonable basis for our opinion on compliance for each major federal and state program. However, our audit does not provide a legal determination of the South Plainfield Board of Education's compliance.
Opinion on Each Major Federal and State Program
In our opinion, the South Plainfield Board of Education complied, in all material respects, with the types of compliance requirements referred to above that could have a direct and material effect on each of its major federal and state programs for the fiscal year ended June 30,2015.
Other Matters
The results of our auditing procedures disclosed instances of noncompliance, which are required to be reported in accordance with U.S. OMB Circular A-133 and New Jersey OMB Circular 15-08 and which are described in the accompanying schedule of findings and questioned costs as items, 2015-003 and 2015-004. Our opinion on each major federal and state program is not modified with respect to these matters.
The South Plainfield Board of Education's responses to the noncompliance findings identified in our audit are described in the accompanying schedule of findings and questioned costs. The South Plainfield Board of Education's responses were not subjected to the auditing procedures applied in the audit of compliance and, accordingly, we express no opinion on the responses.
Report on Internal Control Over Compliance
Management of the South Plainfield Board of Education is responsible for establishing and maintaining effective internal control over compliance with the types of compliance requirements referred to above. In planning and performing our audit of compliance, we considered the South Plainfield Board of Education's internal control over compliance with the types of requirements that could have a direct and material effect on each major federal and state program to determine the auditing procedures that are appropriate in the circumstances for the purpose of expressing an opinion on compliance for each major federal and state program and to test and report on internal control over compliance in accordance with U.S. OMB Circular A-133 and New Jersey OMB Circular 15-08, but not for the purpose of expressing an opinion on the effectiveness of internal control over compliance. Accordingly, we do not express an opinion on the effectiveness of the South Plainfield Board of Education's internal control over compliance.
A deficiency in internal control over compliance exists when the design or operation of a control over compliance does not allow management or employees, in the normal course of performing their assigned functions, to prevent, or detect and correct, noncompliance with a type of compliance requirement of a federal or state program on a timely basis. A material weakness in internal control over compliance is a deficiency, or combination of deficiencies, in internal control over compliance, such that there is a reasonable possibility that material noncompliance with a type of compliance requirement of a federal or state program will not be prevented, or detected and corrected, on a timely basis. A significant deficiency in internal control over compliance is a deficiency, or a combination of deficiencies, in internal control over compliance with a type of compliance requirement of a federal or state program that is less severe than a material weakness in internal control over compliance, yet important enough to merit attention by those charged with governance.
124
EXHIBITK-2
Our consideration of internal control over compliance was for the limited purpose described in the first paragraph of this section and was not designed to identity all deficiencies in internal control over compliance that might be material weaknesses or significant deficiencies and, therefore, material weaknesses or significant deficiencies may exist that were not identified. We did not identify any deficiencies in internal control over compliance that we consider to be material weaknesses. However, we identified a cet1ain deficiency in internal control over compliance, as described in the accompanying schedule of findings and questioned costs as item 20 15-003 that we consider to be a significant deficiency.
The South Plainfield Board of Education's response to the internal control over compliance finding identified in our audit is described in the accompanying schedule of findings and questioned costs. The South Plainfield Board of Education's response was not subjected to the auditing procedures applied in the audit of compliance and, accordingly, we express no opinion on the response.
The purpose of this repmt on internal control over compliance is solely to describe the scope of our testing of internal control over compliance and the results of that testing based on the requirements of U.S. OMB Circular A-133 and New Jersey OMB Circular 15-08. Accordingly, this report is not suitable for any other purpose.
Report on Schedules of Expenditures of Federal Awards Required by U.S. OMB Circular A-133 and Schedule of Expenditures of State Financial Assistance Required by New Jersey OMB Circular 15-08
We have audited the fmancial statements of the govemmental activities, the business-type activities, each major fund, and the aggregate remaining fund information of the South Plainfield Board of Education as of and for the fiscal year ended June 30, 2015 and the related notes to the financial statements, which collectively comprise the Board of Education's basic financial statements. We issued our repor1 thereon dated November 24, 2015, which contained unmodified opinions on those financial statements. Our audit was conducted for the purpose of forming opinions on the financial statements that collectively comprise the basic financial statements. The accompanying schedule of expenditures of federal awards as required by U.S. OMB Circular A-133 and schedu le of expenditures of state financial assistance as required by New Jersey OMB Circular 15-08 are presented for purposes of additional analysis and are not a required pat1 of the basic financial statements. Such information is the responsibility of management and was derived from and relates directly to the underlying accounting and other records used to prepare the basic financial statements. The information has been subjected to the auditing procedures applied in the audit of the financial statements and certain additional procedures, including comparing and reconciling such information directly to the underlying accounting and other records used to prepare the basic financial statements or to the basic financial statements themselves, and other additional procedures in accordance with auditing standards generally accepted in the United States of America. In our opinion, the schedule of expenditures of federal awards and schedule of expenditures of state financial assistance are fairly stated in all material respects in relation to the basic financial statements as a whole.
Fair Lawn, New Jersey November 24,2015
125
L~(2c l . V ·~c.~ q' p~,l\:1~. LL:-P LERCH, VINCI & HIGGINS, LLP Certified Public Accountants Public School Accountants
Jeffrey C. Bliss Public School Accountant PSA Number CS00932
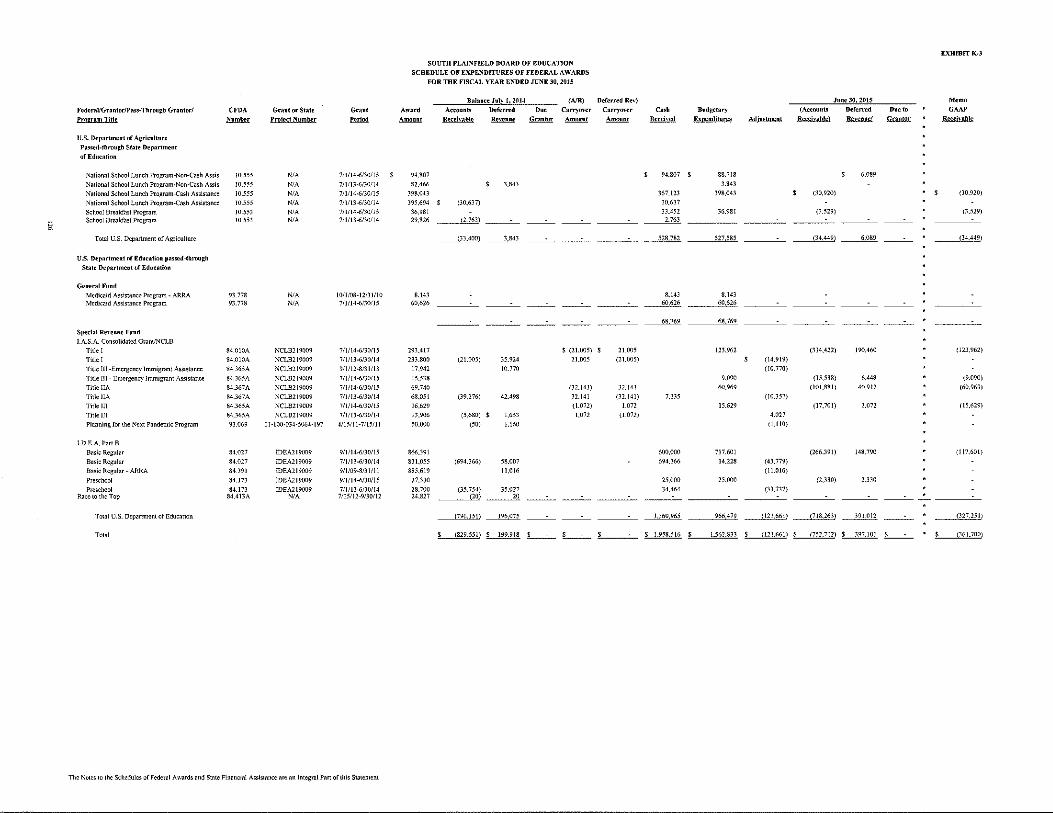
EXHIBIT K-3
SOUTH PLAI!<IFIELD BOARD OF EDUCATION
SCHEDULE OF EXPENDITURES OF FEDERAL AWARDS
FOR THE FISCAL YEAR ENDED JUNE 30,2015
Balance Juli l, 20U (MR) Deferred Re-·) June 30, 2015 Memo
Federnl/Grantor!Pas. ... Throu~b Grantor/ CFDA Grnnt or State Grnnt Award Account• Deferred D"' Cari')'<Wer Carry<wer Ca•h Budgetary (Account• Deferred Doc to GAAP
Program Title Number Project Number """' """"" ~ Rc>enoe Grantor Amount Amount Received E~ncnditures ~ ~ ~ ~ Reccimhlc
U.S. Department of A~:ricnlltlrc
PM!iell-througb State Department
of Education
National School Lunoh Prowam-Non-Cash Assis 10.555 NIA 711114-<l/30/15 $ 94.807 $ 94.807 $ 88.718 $ 6.089
National School Lunch Pml(rom-Non-Cash Assis 10.55~ WA 711113-<l/30/14 82.466 $ 3.843 3.843
National School Lunch Pmgrom..Cash Assistance W.555 NIA 711114-<l/30115 398.0~3 367.123 398.043 $ (30.920) $ (30.920)
National School Lunch Prol(rom..Cash Assist:mcc 10.555 NIA 711113-<l/30114 395.694 ' (30.637) 30.637
School Breakfast Pmgrom 10.553 WA 711114-<l/30/15 36.981 33.4n 36.981 (3.529) (3.529)
" School Breakfast Progrom 10,553 NIA 711113-<l/30/14 29.826 (2.763) --- _______b2g ----
Total U.S. D<:partmem of Agricul!urc (33.400) ~ __ -_ --- ---- 528.782 527.585 (34.449) ~---- (34A49l
U.S. Department of Eduution passcd-throu~:h
State Department of Education
(rloneral Fund
Mcdic:.id Assistance Progrom- ARRA 93.778 N" 10/l/08-12/31/10 8.143 8.143 8.143 Medicaid Assistance Progrom 93.778 N/A 711114-<l/30/15 60.626 --- ----- ---- ~.626 60.626
~ 68.769 ------ ----S1>eda1 Re,·cnoc Fund
I.A.S.A. Consolidated OrontiNCLB
Ti1le I 84.010A NCLB219009 7/1/14-6130115 293At7 $ (21.005) $ 21.005 123.962 (314.422) ]90.460 (123.962)
Ti!le I 84.010A NCLB219009 711113-6130/14 233.800 (21.005) 35.924 21.005 (21.005) ' (14.919)
Ti!le 111 -Emergency Immigrant Assistance 84.365A NCLB219009 9/l/12·8131113 l7.9H 10.770 (10.770)
Title 111- Emergency Immigrant Assistance 84.36~A NCLB219009 711/14-6130115 15.538 9.090 (15.538) 6.448 (9.090)
Titlei!A 84.367A NCLB219009 7/1114..(;/30/l~ 69,740 (32.141) 32.141 60.969 (101.881) 40.912 (60.969)
Titlc!IA 84.367A NCLB219009 7/1/13-6130/14 6l!.051 (39.276) 42_498 32.141 (32.141) 7.B5 (!0.357)
Titlclll 84.365A NCLB219009 7/1/14-6/30/15 16.629 (1.072) 1.072 15.629 (17.701) 2.072 (15.629)
Title III 84.365A NCLB219009 7/1/13-6130/14 !3.906 (5.680) $ 1.653 1.072 (1.072) 4.027
Planning for the NeNt Pandemic Progrom 93.069 I l-100-{)34-5064-197 4/l5/ll-71151JJ 50.000 (50) 1.160 (1.110}
I.D E.A. PanB
Basic Regular 84.027 IDEA219\J09 9/1114-<l/30/15 866.391 600.000 717.601 (266.391) 148.790 (!!7.601)
Basic Regular 84.027 lDEA219009 7/1/B-6130114 S31.055 (694.366) 58.007 694.366 14.228 (43.779)
Bask Regular ARRA 8~.391 IDEA219009 911109~/31111 885.619 11.016 (11.016)
Preschool 84.173 lDEA21901l9 9/l/14-6/30/IS 27.330 25.000 25.000 (2.330) 2.330
Preschool 84.173 IDEA219009 711113-<l/30114 28.700 (35.754) 35.027 34.464 (33,737) Race to the Top 84.413A WA 7/15/12-9130112 2U27 '" ---'-" --- --- ---- ---- ----
Total U.S. Deporl.rncnt of Education (796.151) 196.075 U60.96S 966.479 ___JI21.661) !718.263) ~--- _ ___Q12.11!.J
Tot"! $ (829.551) ~ $ ___ '---- _, ___ ~ $ 1.562.833 $ (121.661) $ (752.712) $ 397.101 $ ___ ' (361.700)
The Notes to the Schedules offcdcnJI Awards and State Financial Assistance are an Integral Par! of this Statement

Stafe Grnntor[pmpram Tille
State Department of Education
General fond
Equnlizatian Aid
Eq11olizati~n Aid Special Educatiou Aid
Special Educmion Aid Transporta!i~n Aid
Transpo!1ationAid Security Aid
Socuriii'Aid
Pnrcc Readtncss Aid
Per Pupil G,..-cm1h Aid htrootdinory Spedol Education Coot< Aid
E'<tmordtnory Spccwl Education Coots Aid Non Public Tronsportntion Rcirnb
Non Public Tmnspm1ntion Reimb On-Bchalfl1'AF Pension Svstem-NCG! Prom
On-&halfTPAF Pen1>lon &"t1efil Contributions Normal Co.<L<
On-BcholfTPAF Post Ret1rement·Me<hcal T P.A F • Social Secunty
T.P.A.F .• Sociol Security
Total General fund
Special Revenue Fond
Preschool F-<iucotion Aid
Pre.chool Education Aid New JcrscyNonpublic Aid
Textbook Aid T c'tbook Aid
Nnrsmg Services Nursing Services
Nursing Sc"ices Technology
Technology
Au~iliorySc"'ices
Cornpcn,;tory Education
Compcnsotm')' Education
English as o Second Language Tran,portotir>n
Horne1>1.<ttuction Hondicopped Se"•ices
Examination ond Classtficatwn
Examination and Clossificoticm CMrcctive Sp<>..'<h
Correcth·e Speeoh Supplemental Instruction
Suppkmcntol 1nstruct1on
Total Sredal Ro,·onue Fund
Stato Department of A~rioulture
Grantor Slate PmjeytNumbtr
15-495-034-5120-078
14-495-034-5120-078
15-495-034-5120-089 14-495-034-5120-089
15-495-034-5120-0 14 14-495-034-S 120-0 14
1 S-495-034-5120-084 14-495-034-S 120-084
I S-495-034·5120-098
l S-495-034-S 120-097 1 5-!00-034-5120-473
14· 100-034-5120-473
WA
WA 15-495-034-5094-007 15-495-034-5094-006
15·495-034-5094-00 I 15-100-034-5094-003
14-l 00-034-5095-002
15-495-034-5120-086
14-495-034-5120-086
15-100-034-5120-0(>4
14-1 00-034-5120-064 15-100-034-5120-070
13-100-034-5120-070
14-1 00-034-5120-070
15-1 00-034-5120-373 14-1 00-034-5120-373
15-1 00-034-5120-067 14-1 00-034-S 120-067
15-1 00-034-5120-067
14-1 00-034-5120-068 14-!00-034-5120-067
15-1 00-034-5120-066
14-100-034-5120-066
14-1 00-034-5120-066 15-100-034-5120-066
14-1 00-034-5120-066 15-1 00-034-5120-066
Grant
"""
711114-6130115
711113-6/30114
711114-6130115 711/13-6130114
711!14-6/30!15 711!13-6130114
711!14-6130/15 711113-6130114
711!14-6130115
711114-6/30115 711114-6/30115
7/]/D-6130114 7/1114-6/30115
7/1111-6/30112
711114-6/30/15
711114-6130115 711114-6130115 711114-6130/15
711113-6130114
7/1114-61301!5 7!1/13-6130/14
711/14-6130/15
711113-6/30/14 711114-6130/15
711112-6130113
711113-6130114
711114-6/30115 711113-6130114
711114-6/30115
711113-6130114
7/J/14-6130115
71!114-6/30/15 711113-6130!14
711114-6130115
711113-6/30!14 711113-6/30114
711!14-6130115
711113-6/30!14 711!12-6130!13
SOUTH PLAINFIELD SOARD Of EDI.ICA TION
SCHEOULE OF STAT£ FINANCIAL ASSISTANCE
FOR THE FISCAL YEAR ENDED JUNE 30, 2Ul5
Award
""""
6,660.858 6,660,858
2.204.418 2,204.418
100.859 100.859
97.143
97.143 34.410
34.410 246.674
162.139 26,100
23.495 9(),469
1.257,469
2.139,852 2.001,968
1.974.944
52.800
52.800
32.709 27.809 53,021
43.417
39.989
17.568
10.140
51.956 72,758
27.405 IO.M8
1.912
17.107
14.176
17.%8
11.486 14.571
11.771
Balanoe,
~
(632,642)
(209.460)
(9.583)
(9,230)
(162,139)
(23.495)
Cari')'OVer
{Walkover)
"""""'
----~~~·'~J'"45) ______ c_
~-.±2.±) ______ c_
60.487
;o
U88
w
" 35.952
(1.912)
2.235 7,812
6.245
65.767 (65,767)
----~'~"~-'~"~ --------
The Notes to the Schedules ofFederal Awards and State Financial Assistance are an Integral Part of the Statement
"'
Ca•b
~
6.019.215 632,642
1.992.001 209,460
91.140 9,583
87,782
9.230
31.094
31.094
162.t39
23.495
90.469 1.257.469
2.139,852 1.903.154
97.945
14,787,764
47.520 5,280
32.709
53.021
17.568
51.956
27.405 10,898
1.912
17.107
11.486
11.771
288,633
Budgetary
Exnendilore•
6,660.858
2,204.418
100.859
97,143
34.410 34,410
246.674
26,100
90.469 1.257,469
2.139.852 2,001.968
14,894,630
32.485
51.830
17.293
30.765
20.09/ 10,898
7,927
9,719
7,847
188,861
Repa)·ment of
Prf<:>rYea .. •
Balanoe•
;o
817
" 35.952
2.235 7,812
6.245
53,185
(A<TI>unt.
Re«"ivabl~l
(641.643)
(212.417)
(9,719)
(9.361)
(3.316)
(3,316)
(246.674)
(26.100)
(98.814)
(1.251.360)
June30,2U15
Deferred
Re>·enue
(5,280) $ 118.567
(5.280) 118.567
Daeto -
"' U91
U88
275
21.191
7.308
9.180
1.767
3.924
46.248
EXHIBITK-4
Memo0n1y
Cumulntln
G~' -
(26.tOO)
(98,814)
024.914)
Total
~
6.66(}.858
2.204.'118
1U{l,859
97.143
34,410
34.410
246.674
26.100
90.469
1.257.469
2,139.852 2.001.968
14.894.630
32.485
51.830
17.293
30,765
20,097
10.898
7,927
9,719
7.847
188,861
(Continued)
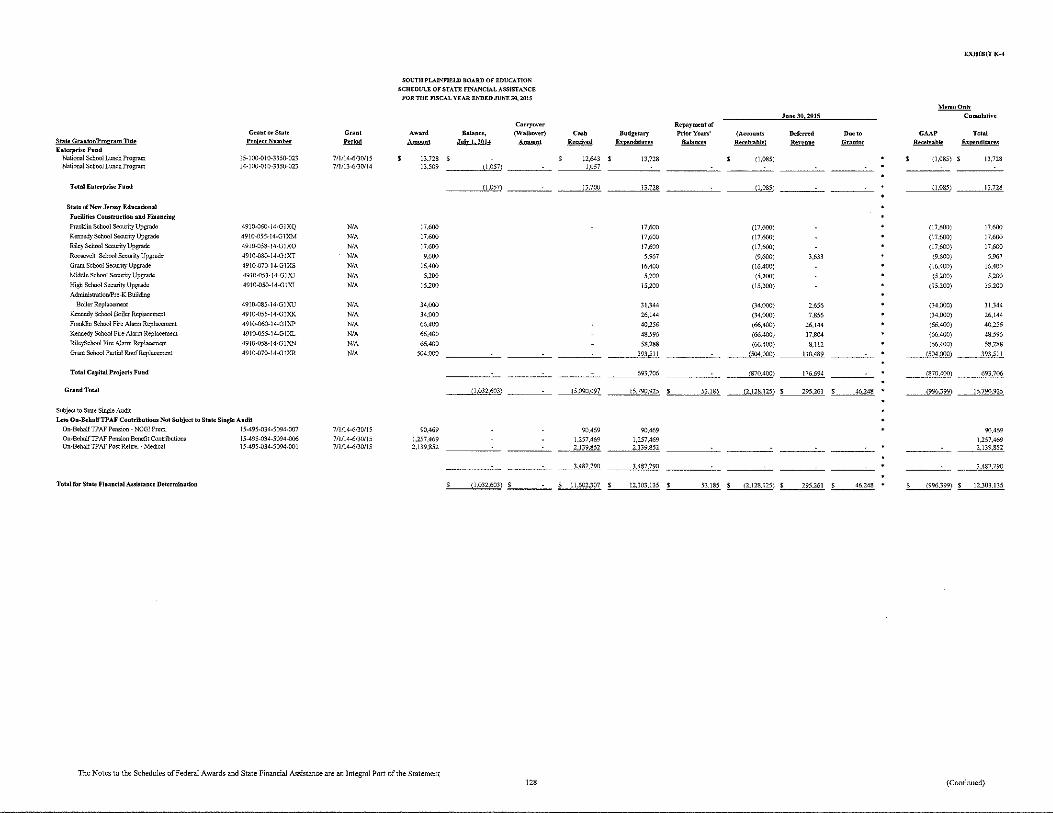
EXHffil'fl(-4
SOUTH PLAINFIELD BOARD OF EDUCATION SOUWULE OF STATE FINANCIAL ASSISTANCE
FQR THE FISCAL YEAR ENDEDJUNE30,201S
MemoOnl\' Jnne30,201S Cnmnlalive
Canyo.-er Repayment of Grant or Stale Grant Award llaiance, (Walkover) Cash Budgetary PrlorYears' (Acrounto Deferred Due to G~' Total
Stale GnontoriP!:!!l:rKin Title Project Number Period A moon! ~ ""'- Rccci\·ed Exl!"odirure• Bal""""" Recoi\·ablel Revenue Grantor Rf'CeiVable En..,ndilu..,. Enterprise Fond
National School Lunch Program 15-1 00..() 10-3350-023 711114-6/30/JS ' 13.728 ' $ 12,643 ' 13,728 ' (1,085) . ' (L085) $ 13,728 National Scbool Lunch Program 14-1 00..0 I 0-3350-023 711!13-6130114 13,509 1.057 ___ 1,057
Total Enterpri!iC Fund 1.057 __ 13,700 13,728 __________(_1_085) (1.085) 13,728
State ofNe.o· Jersey Educational
Fad6ties Construttk>n and Financing
Fnmklin Scbool Security Upgrade 4910-060-14·GIXQ WA 17,600 17.600 (17,600) (17,600) 17.600
Kennedy School Security Upgrade 4910-055-14-G!XM WA 17,600 17,600 (17.600) (17.600) 17,600
Rile}' School Security Upgrade 4910-058-14-GlXO WA 17,600 17,600 (17.600) (17.600) 17,600
Roo..,vdt School Security Upgrade 4910..0S0·14·GlXT WA '·"" 5.967 (9,600) 3,633 (9.600) 5.%7 Gram School Secunty Upgrade 491G-070-l4-G1XS WA 16,400 16.400 (16.400) (16.400) !MOO Middle Sch<>D] Socurity Upgrade 4910-053-14-GJXJ WA 5,200 5,200 (5,200) (5.200) 5,200
High Sch<>Dl Security Upgrade 4910..050-14-GIXI WA 15.200 15,200 (15,200) (15.200) 15.200 Administratio!liPre-K Building
Boiler Replacement 491G-085-14-GIXU WA 34,000 31,344 (34Jl00) 2,656 (34.000) 31.344 Kennedy School Boiler Repla=l!Oill 4910..055-14-GIXK WA 34,000 26,144 (34,000) 7,856 (34,000) 26,144
Franklin School Fire Alarm Replo.cement 4910-D60-14-GlXP N'A 66.400 40,256 (66,400) 26,\44 (66.400) 40,256
Kennedy School Fire Alarm Replocernent 49!0-055-14-G1XL WA 66,400 48,596 (66.400) 17,804 (66,400) 48.5% ruie)'School Fire Alarm bplocemcnt 4910..058-14-GJXN WA 66,400 58,288 (66.400) 8,112 (66,400) 58,288
Gnmt Scbool Partial Roof Replacement 4910..070·14-G!XR WA 504,000 393,51 I (504J)Q0) 110.489 (504,000) 393,511
Total Capital Projctts Fund ---- 693,706 (870.400) 176,694 (870.400) 693,706 . Grand Total 0.032,603) ]5,090,097 15,790,925 ' 53,185 (2.128.125) $ 295,261 $ 46.248 . (9%,399) __ ,_5,790.925
Subject to State Sin.Ue Audit
Leos On-BchalfTPAF Coulrib11tions Not Subject to Stale Siugle Audit
On-Behalf TP AF Pemion - NCGI Prem_ 15-495-034-5094-007 7/1!14-6130115 90,#9 90.469 90,469 . 90.469 On-BeholfTPAF P=ion Benefit Contributions 15-495-034-5094..006 7111!4-6130115 1,257,469 1.257,469 1,257,469 1.257.469 On-BehalfTP AF Post Retire. -Medical 15-495-034-5094-00 I 7!lfl4-6/301!5 2,139,852 2.139,852 2.139.852 2,139,852 -----
3.487,790 3,487,790 . - 3,487,790 . TolRl for Stale Financial Assistance Determination ' (1,032.603) s ' 11,602,307 ' 12.303.135 ' 53,185 s (2,12S.l25) $ 295.261 ' 46.248 ' (996.399) $ 12.303.135
The Notes to the Schedules of Federal Awards and State Financial Assistance are an Integral Part of the Statement 128 {Continued)

SOUTH PLAINFIELD BOARD OF EDUCATION NOTES TO THE SCHEDULES OF EXPENDITURES OF FEDERAL AWARDS AND STATE FINANCIAL ASSISTANCE FOR THE FISCAL YEAR ENDED JUNE 30, 2015
NOTE 1 GENERAL
The accompanying schedules present the activity of all federal and state financial assistance programs of the South Plainfield Board of Education. The Board of Education is defined in Note l(A) to the Board's financial statements. All federal financial assistance received directly from federal agencies, as well as federal awards and state financial assistance passed through other government agencies is included on the schedule of expenditures of federal awards and state financial assistance.
NOTE 2 BASIS OF ACCOUNTING
The accompanying schedules are prepared and presented using the budgetary basis of accounting with the exception of programs recorded in the food service fund, which are presented using the accrual basis of accounting. These basis of accounting are described in Notes l(C) to the Board's financial statements. The information in these schedules is presented in accordance with requirements of U.S. OMB Circular A-133, "Audits of States, Local Governments and Non-Profit Organizations" and New Jersey OMB Circular 15-08, "Single Audit Policy for Recipients of Federal Grants, State Grants, and State Aid". Therefore, some amounts presented in these schedules may differ from the amounts presented in, or used in the preparation of, the financial statements.
NOTE 3 RELATIONSHIP TO FINANCIAL STATEMENTS
The financial statements present the general fund and special revenue fund on a GAAP basis. Budgetary comparison statements or schedules (RSI) are presented for the general fund and special revenue fund to demonstrate finance-related legal compliance in which certain revenue is permitted by Jaw or grant agreement to be recognized in the audit year, whereas for GAAP reporting, revenue is not recognized until the subsequent year or when expenditures have been made.
The general fund is presented in the accompanying schedules on a modified accrual basis with the exception of the revenue recognition of the delayed state aid payments in the current budget year, which is mandated pursuant to N .J .S.A. 18A:22-44.2.. For GAAP purposes, those payments are not recognized until the subsequent year due to the state deferral and recording of certain state aid payments in the subsequent year. The special revenue fund is presented in the accompanying schedules on the grant accounting budgetary basis which recognizes encumbrances as expenditures and also recognizes the related revenues, which may include the delayed state aid payments, whereas the GAAP basis does not. The special revenue fund also recognizes the delayed state aid payments in the current budget year, consistent with N .J .S.A. 18A:22-44.2.
The net adjustment to reconcile from the budgetary basis to the GAAP basis is a decrease of $103,392 for the general fund and a decrease of $5,348 for the special revenue fund. See the Notes to Required Supplementary Infonnation for a reconciliation of the budgetary basis to the modified accrual basis of accounting for the general and special revenue funds. Awards and financial assistance revenues are reported in the Board's financial statements on a GAAP basis as presented as follows:
Federal State Total
General Fund $ 68,769 $ 14,791,238 $ 14,860,007 Special Revenue Fund 961,084 188,908 1,149,992 Capital Projects Fund 693,706 693,706 Food Service Fund 527,585 13,728 541,313
Total Financial Assistance $ 1,557,438 $ 15,687,580 $ 17,245,018
129

SOUTH PLAINFIELD BOARD OF EDUCATION NOTESTOTHESCHEDULESOFEXPENDITURESOF FEDERAL AWARDS AND STATE FINANCIAL ASSISTANCE FOR THE FISCAL YEAR ENDED JUNE 30, 2015
NOTE 4 RELATIONSHIP TO FEDERAL AND STATE FINANCIAL REPORTS
EXHIBITK-5
Amounts reported in the accompanying schedules may not necessarily agree with the amounts reported in the related federal and state financial reports due to timing differences between the District's fiscal year and grant program years.
NOTE 5 OTHER INFORMATION
Revenues and expenditures reported under the National School Lunch Program as non-cash assistance represent current year value received and current year distributions, respectively of the Federal Food Distribution Program. TPAF Social Security contributions in the amount of $2,001,968 represents the amount reimbursed by the State for the employer's share of social security contributions for TPAF members for the fiscal year ended June 30,2015. The amount reported as TPAF Pension System Contributions in the amount of$1,347,938 and TPAF Post-Retirement Medical Benefits Contributions in the amount of $2,139,852 represents the amount paid by the State on behalf of the District for the fiscal year ended June 30, 2015.
NOTE 6 ON-BEHALF PROGRAMS NOT SUBJECT TO STATE SINGLE AUDIT
On-behalf State Programs for TP AF Pension and Post-Retirement Medical Benefits Contributions are not subject to a State single audit and, therefore, are excluded from major program detennination. The Schedule of State Financial Assistance provides a reconciliation of State fmancial assistance reported in the District's financial statements and the amount subject to State single audit and major program determination.
130
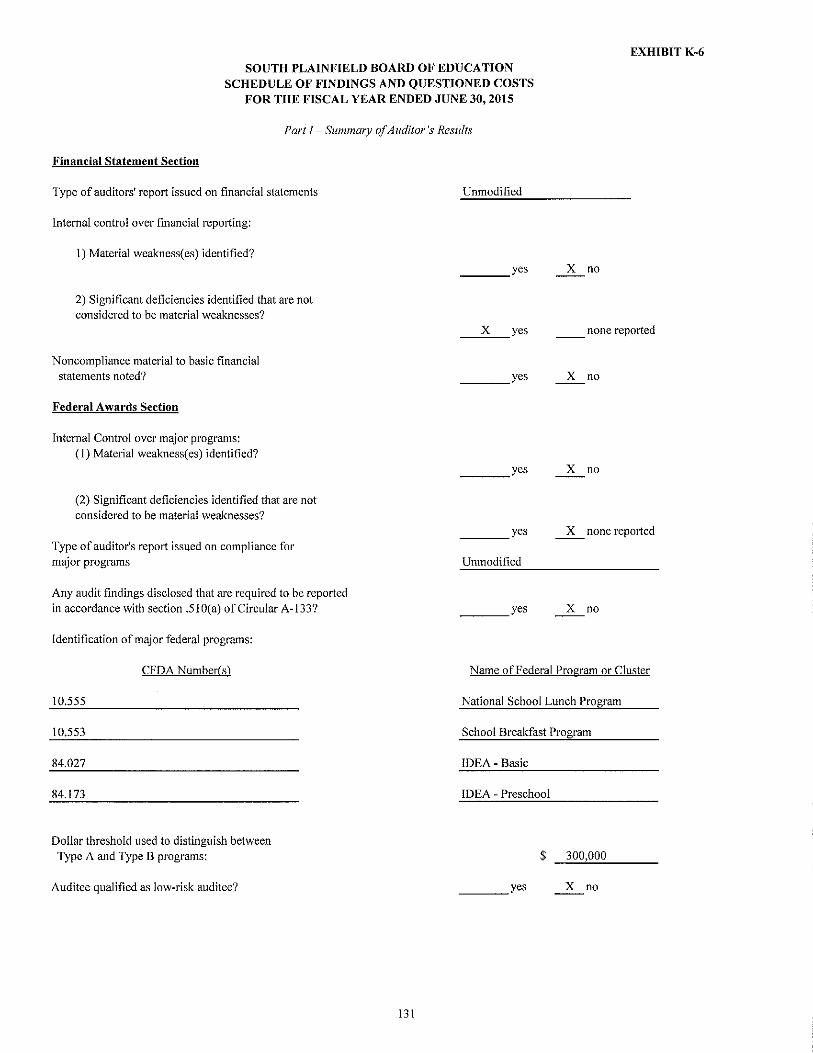
SOUTH PLAINFIELD BOARD OF EDUCATION SCHEDULE OF FINDINGS AND QUESTIONED COSTS
FOR THE FISCAL YEAR ENDED JUNE 30,2015
Part 1- Summary of Auditor's Results
Financial Statement Section
Type of auditors' report issued on financial statements
Internal control over financial reporting:
1) Material weakness( es) identified?
2) Significant deficiencies identified that are not considered to be material weaknesses?
Unmodified
yes X no ---
EXHIBIT K-6
_.c:_X;:__yes none reported
Noncompliance material to basic financial statements noted?
Federal Awards Section
Internal Control over major programs: (I) Material weakness( es) identified?
(2) Significant deficiencies identified that are not considered to be material weaknesses?
Type of auditor's report issued on compliance for major programs
Any audit findings disclosed that are required to be reported in accordance with section .510(a) of Circular A-133?
Identification of major federal programs:
CFDA Number(s)
10.555
10.553
84.027
84.173
Dollar threshold used to distinguish between Type A and Type B programs:
Auditee qualified as low-risk auditee?
131
___ yes X no
___ yes X no
____ yes ~none reported
Unmodified
___ yes X no
Name of Federal Program or Cluster
National School Lunch Program
School Breakfast Program
IDEA- Basic
IDEA - Preschool
$ 300,000
____ yes X no
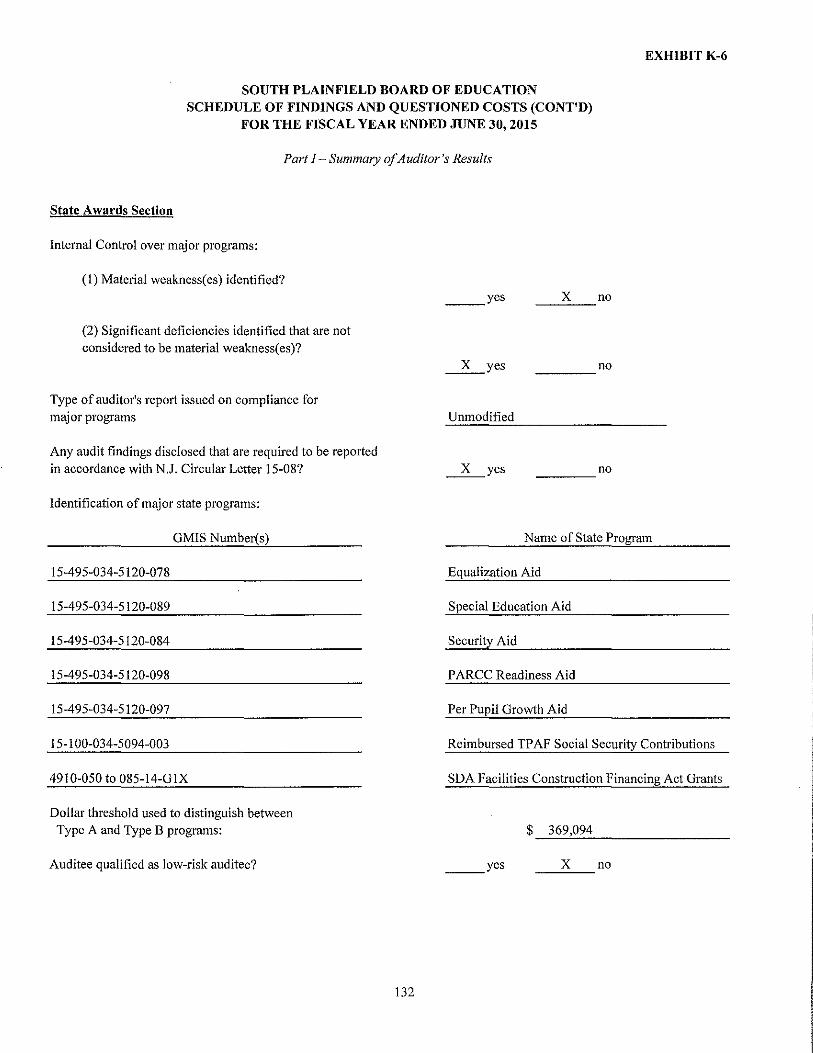
SOUTH PLAINFIELD BOARD OF EDUCATION SCHEDULE OF FINDINGS AND QUESTIONED COSTS (CONT'D)
FOR THE FISCAL YEAR ENDED JUNE 30, 2015
Part I- Summary of Auditor's Results
State Awards Section
Internal Control over major programs:
(1) Material weakness(es) identified?
(2) Significant deficiencies identified that are not considered to be material weakness(es)?
Type of auditor's report issued on compliance for major programs
Any audit findings disclosed that are required to be reported in accordance with N.J. Circular Letter 15-08?
Identification of major state programs:
yes
X yes
Unmodified
X yes
X no ---
____ no
____ no
EXHIBITK-6
GMIS Number(s) Name of State Program
15-495-034-5120-078
15-495-034-5120-089
15-495-034-5120-084
15-495-034-5120-098
15-495-034-5120-097
15-100-034-5094-003
4910-050 to 085-14-GIX
Dollar threshold used to distinguish between Type A and Type B programs:
Auditee qualified as low-risk auditee?
132
Equalization Aid
Special Education Aid
Security Aid
PARCC Readiness Aid
Per Pupil Growth Aid
Reimbursed TPAF Social Security Contributions
SDA Facilities Construction Financing Act Grants
$ 369,094
yes _ _:X.:...__ no
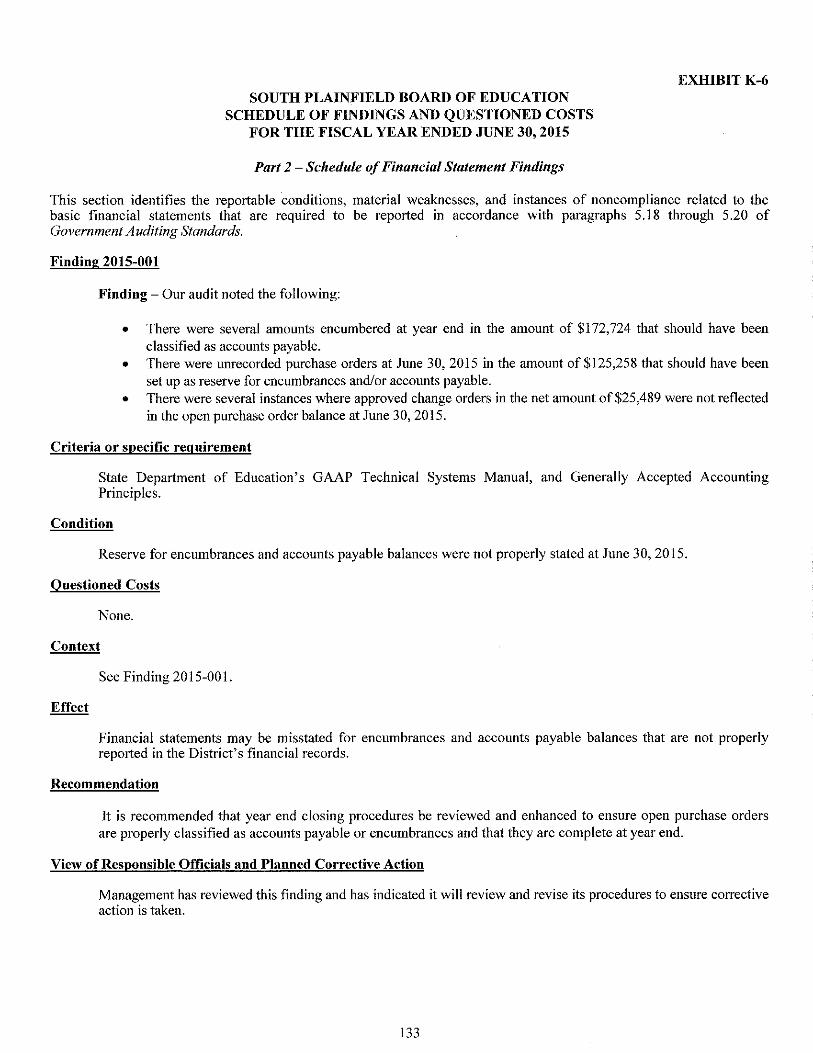
SOUTH PLAINFIELD BOARD OF EDUCATION SCHEDULE OF FINDINGS AND QUESTIONED COSTS
FOR THE FISCAL YEAR ENDED JUNE 30, 2015
Part 2 -Schedule of Financial Statement Findings
EXHIBITK-6
This section identifies the reportable conditions, material weaknesses, and instances of noncompliance related to the basic financial statements that are required to be reported in accordance with paragraphs 5.18 through 5.20 of Government Auditing Standards.
Finding 2015-001
Finding- Our audit noted the following:
• There were several amounts encumbered at year end in the amount of $172,724 that should have been classified as accounts payable.
• There were unrecorded purchase orders at June 30,2015 in the amount of$125,258 that should have been set up as reserve for encumbrances and/or accounts payable.
• There were several instances where approved change orders in the net amount of$25,489 were not reflected in the open purchase order balance at June 30, 2015.
Criteria or specific requirement
State Department of Education's GAAP Technical Systems Manual, and Generally Accepted Accounting Principles.
Condition
Reserve for encumbrances and accounts payable balances were not properly stated at June 30,2015.
Questioned Costs
None.
Context
See Finding 2015-00 I.
Financial statements may be misstated for encumbrances and accounts payable balances that are not properly reported in the District's financial records.
Recommendation
It is recommended that year end closing procedures be reviewed and enhanced to ensure open purchase orders are properly classified as accounts payable or encumbrances and that they are complete at year end.
View of Responsible Officials and Planned Corrective Action
Management has reviewed this finding and has indicated it will review and revise its procedures to ensure corrective action is taken.
133
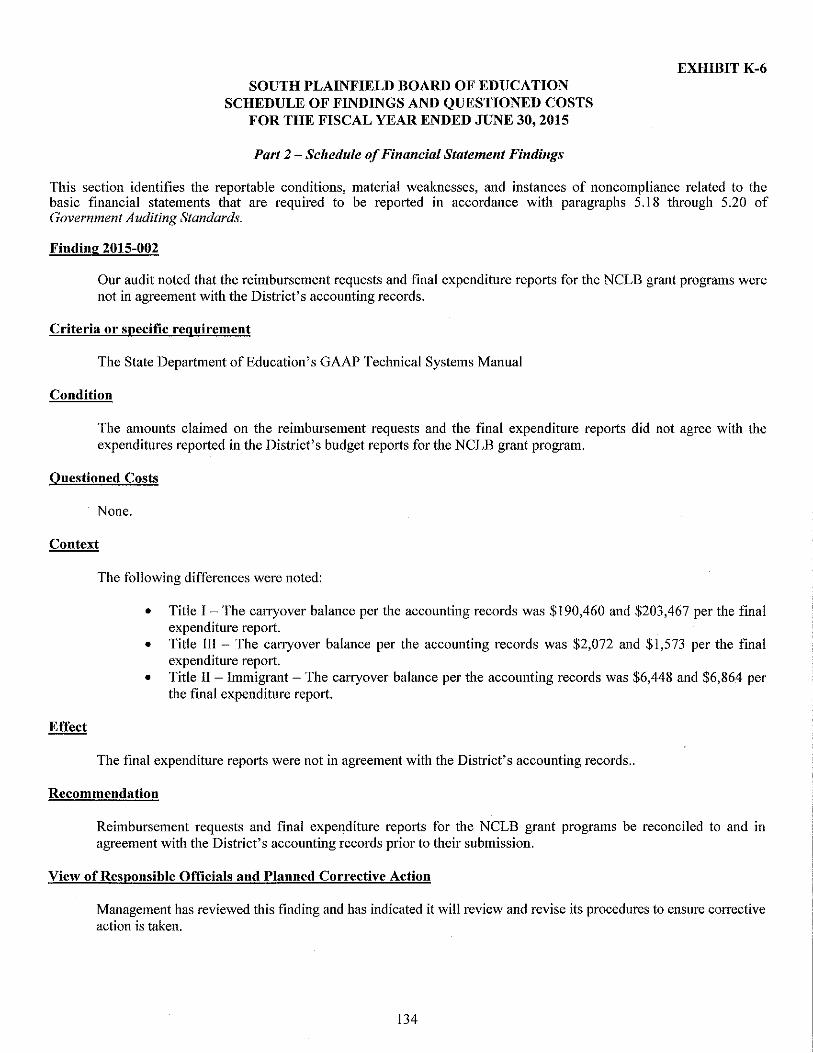
SOUTH PLAINFIELD BOARD OF EDUCATION SCHEDULE OF FINDINGS AND QUESTIONED COSTS
FOR THE FISCAL YEAR ENDED JUNE 30, 2015
Part 2 -Schedule of Financial Statement Findings
EXHIBITK-6
This section identifies the reportable conditions, material weaknesses, and instances of noncompliance related to the basic financial statements that are required to be reported in accordance with paragraphs 5.18 through 5.20 of Government Auditing Standards.
Finding 2015-002
Our audit noted that the reimbursement requests and final expenditure reports for the NCLB grant programs were not in agreement with the District's accounting records.
Criteria or specific requirement
The State Department of Education's GAAP Technical Systems Manual
Condition
The amounts claimed on the reimbursement requests and the final expenditure reports did not agree with the expenditures reported in the District's budget reports for the NCLB grant program.
Onestioned Costs
None.
Context
The following differences were noted:
• Title I- The carryover balance per the accounting records was $190,460 and $203,467 per the final expenditure report.
• Title III- The carryover balance per the accounting records was $2,072 and $1,573 per the final expenditure report.
• Title II- Immigrant- The carryover balance per the accounting records was $6,448 and $6,864 per the final expenditure report.
The final expenditure reports were not in agreement with the District's accounting records ..
Recommendation
Reimbursement requests and final expenditure reports for the NCLB grant programs be reconciled to and in agreement with the District's accounting records prior to their submission.
View of Responsible Officials and Planned Corrective Action
Management has reviewed this finding and has indicated it will review and revise its procedures to ensure corrective action is taken.
134
SOUTH PLAINFIELD BOARD OF EDUCATION SCHEDULE OF FINDINGS AND QUESTIONED COSTS
FOR THE FISCAL YEAR ENDED JUNE 30, 2015
Part 3- Schedule of Federal and State Award Findings and Questioned Costs
EXIllBIT K-6
This section identifies the significant deficiencies, material weaknesses, and instances of noncompliance, including questioned costs, related to the audit of major federal and state programs, as required by OMB Circular A-133 and New Jersey OMB's Circular 15-08.
CURRENT YEAR FEDERAL A WARDS
There are none.
135

SOUTH PLAINFIELD BOARD OF EDUCATION SCHEDULE OF FINDINGS AND QUESTIONED COSTS
FOR THE FISCAL YEAR ENDED JUNE 30, 2015
Part 3- Schedule of Federal and State Award Findings and Questioned Costs
EXHIBITK-6
This section identifies the significant deficiencies, material weaknesses, and instances of noncompliance, including questioned costs, related to the audit of major federal and state programs, as required by OMB Circular A-133 and New Jersey OMB's Circular 15-08.
CURRENT YEAR STATE AWARDS
Finding 2015-003
Our audit revealed the following:
• There were two instances where transportation expenses for trips in the Adult School exceeded the quote threshold where quotes were not obtained. In addition, the vendor was paid $64,660 in the aggregate for the school year.
• Our review of invoices for bus repairs revealed certain per unit labor costs and the markup in parts were not in accordance with the bid award terms.
• There was insufficient documentation to support the District's assertion that the alarm system was purchased through the use of a State contract.
State Program Information
Equalization Aid Special Education Aid Security Aid P ARCC Readiness Aid Per Pupil Growth Aid
Criteria or Specific Requirement
State Grant Compliance Supplements
495-034-5120-078 495-034-5120-089 495-034-5120-084 495-034-5120-098 495-034-1520-097
N.J.S.A. 18:18A-4 Contracts and Agreements Requiring Advertising N.J.S.A. 52:15C-10
Condition
See Finding 2015-003.
Questioned Cost
Undeterminable.
Context
See Finding 2015-003.
136
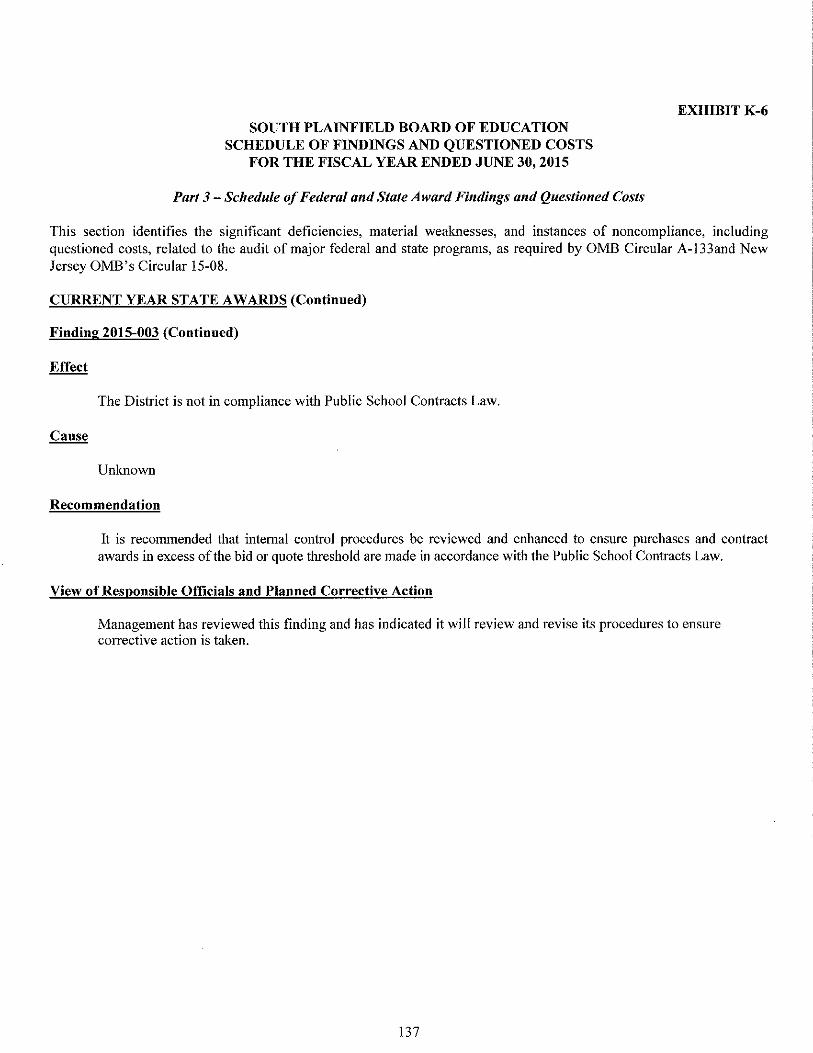
SOUTH PLAINFIELD BOARD OF EDUCATION SCHEDULE OF FINDINGS AND QUESTIONED COSTS
FOR THE FISCAL YEAR ENDED JUNE 30, 2015
Part 3- Schedule of Federal and State Award Findings and Questioned Costs
EXHIBITK-6
This section identifies the significant deficiencies, material weaknesses, and instances of noncompliance, including questioned costs, related to the audit of major federal and state programs, as required by OMB Circular A-133and New Jersey OMB's Circular 15-08.
CURRENT YEAR STATE AWARDS (Continued)
Finding 2015-003 (Continued)
The District is not in compliance with Public School Contracts Law.
Unknown
Recommendation
It is recommended that internal control procedures be reviewed and enhanced to ensure purchases and contract awards in excess of the bid or quote threshold are made in accordance with the Public School Contracts Law.
View of Responsible Officials and Planned Corrective Action
Management has reviewed this finding and has indicated it will review and revise its procedures to ensure corrective action is taken.
137

SOUTH PLAINFIELD BOARD OF EDUCATION SCHEDULE OF FINDINGS AND QUESTIONED COSTS
FOR THE FISCAL YEAR ENDED JUNE 30, 2015
Part 3- Schedule of Federal and State Award Findings and Questioned Costs
EXHIBITK-6
This section identifies the significant deficiencies, material weaknesses, and instances of noncompliance, including questioned costs, related to the audit of major federal and state programs, as required by OMB Circular A-133and New Jersey OMB's Circular 15-08.
CURRENT YEAR STATE AWARDS
Finding 2015-004:
Our audit noted that expenditures for security projects were charged to the Capital Projects Fund that were not allowable project expenditures. An audit adjustment was subsequently made to reclassifY those expenditures to the General Fund.
State program Information:
SDA Facilities Construction Financing Act Grants 4910-050 to 085-14-61X
Criteria or Specific Requirement:
State of New Jersey Compliance Supplement.
Condition:
See Finding 2015-005.
Questioned Costs:
None- Audit adjustment was made.
Context:
Cause:
Effect:
Expenditures in the amount of $38,232 were originally charged to the Capital Projects Fund. An audit entry reclassified those expenses to the General Fund.
Unknown.
The Capital Projects Fund expenditure reports did not accurately reflect all allowable project costs.
Recommendation:
Only allowable project expenditures be charged to the Capital Projects Fund.
View of Responsible Officials and Planned Corrective Action:
Management has reviewed this finding and has indicated that corrective action will be taken.
138
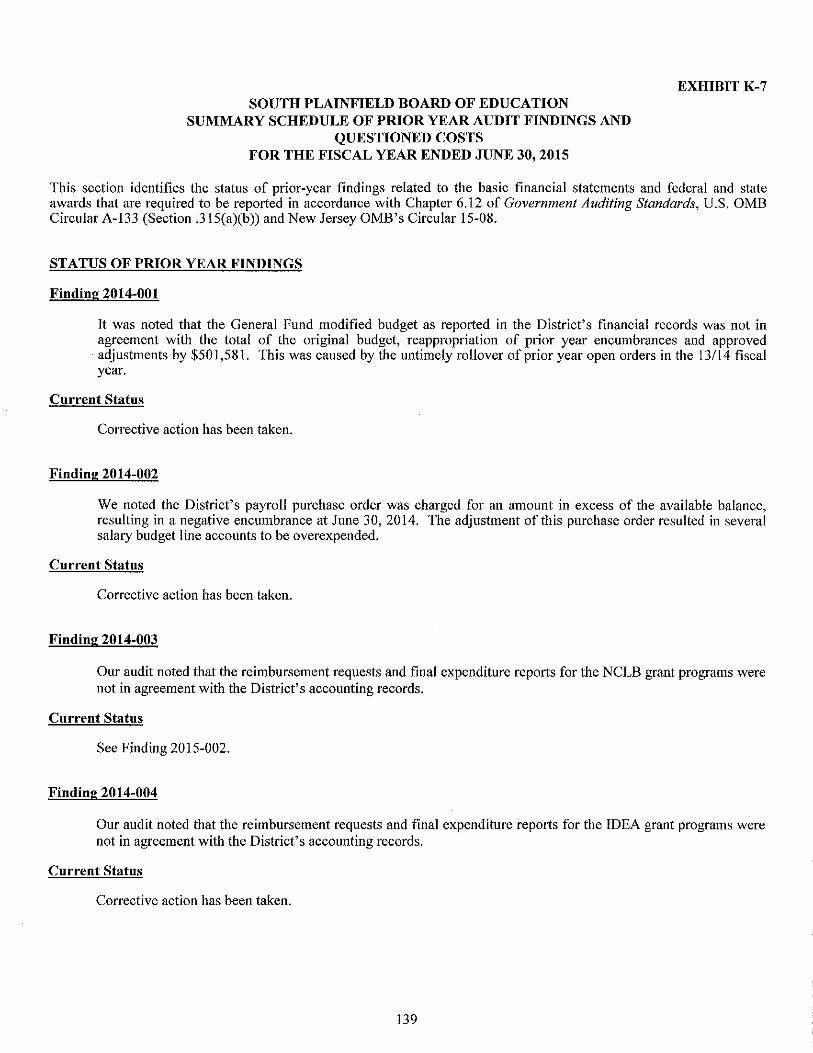
SOUTH PLAINFIELD BOARD OF EDUCATION SUMMARY SCHEDULE OF PRIOR YEAR AUDIT FINDINGS AND
QUESTIONED COSTS FOR THE FISCAL YEAR ENDED JUNE 30, 2015
EXHIBIT K-7
This section identifies the status of prior-year findings related to the basic financial statements and federal and state awards that are required to be reported in accordance with Chapter 6.12 of Government Auditing Standards, U.S. OMB Circular A-133 (Section .315(a)(b)) and New Jersey OMB's Circular 15-08.
STATUS OF PRIOR YEAR FINDINGS
Finding 2014-001
It was noted that the General Fund modified budget as reported in the District's financial records was not in agreement with the total of the original budget, reappropriation of prior year encumbrances and approved adjustments by $501,581. This was caused by the untimely rollover of prior year open orders in the 13114 fiscal year.
Current Status
Corrective action has been taken.
Finding 2014-002
We noted the District's payroll purchase order was charged for an amount in excess of the available balance, resulting in a negative encumbrance at June 30, 2014. The adjustment of this purchase order resulted in several salary budget line accounts to be overexpended.
Current Status
Corrective action has been taken.
Finding 2014-003
Our audit noted that the reimbursement requests and final expenditure reports for the NCLB grant programs were not in agreement with the District's accounting records.
Current Status
See Finding 2015-002.
Finding 2014-004
Our audit noted that the reimbursement requests and final expenditure reports for the IDEA grant programs were not in agreement with the District's accounting records.
Current Status
Corrective action has been taken.
139
SOUTH PLAINFIELD BOARD OF EDUCATION SUMMARY SCHEDULE OF PRIOR YEAR AUDIT FINDINGS AND
QUESTIONED COSTS FOR THE FISCAL YEAR ENDED JUNE 30, 2015
EXHIBITK-7
This section identifies the status of prior-year findings related to the basic financial statements and federal and state awards that are required to be reported in accordance with Chapter 6.12 of Government Auditing Standards, U.S. OMB Circular A-133 (Section .315(a)(b)) and New Jersey OMB's Circular 15-08
STATUS OF PRIOR YEAR FINDINGS
Finding 2014-005
Our audit noted that the salaries of certain Directors and Supervisors were not charged to the proper budget account code.
Current Status
Corrective action has been taken.
Finding 2014-006:
The monthly and year to date I 0% transfer reports were not submitted to the Executive County Superintendent for approval. We noted certain budget transfers that required Executive County Superintendent approval.
Current Status
Corrective action has been taken.
Finding 2014-007
Our audit noted several instances where an incorrect budget account code was charged for a travel and expense reimbursement.
Current Status
Corrective action has been taken.
Finding 2014-008
Our audit revealed:
• There were two instances where transportation expenses for trips in the Adult School exceeded the quote threshold where quotes were not obtained. In addition, the vendor was paid $55,335 in the aggregate for the school year.
• Our review of invoices for bus repairs revealed certain per unit labor costs and the markup in parts were not in accordance with the bid award terms.
• The District did not obtain bids for garbage disposal services even though the vendor was paid $43,700 for the school year.
Current Status
See Finding 2015-003.
140
SOUTH PLAINFIELD BOARD OF EDUCATION SUMMARY SCHEDULE OF PRIOR YEAR AUDIT FINDINGS AND
QUESTIONED COSTS FOR THE FISCAL YEAR ENDED JUNE 30, 2015
This section identifies the status of prior-year findings related to the basic financial statements and federal and state awards that are required to be reported in accordance with Chapter 6.12 of Government Auditing Standards, U.S. OMB Circular A-133 (Section .315(a)(b )) and New Jersey OMB's Circular 15-08.
STATUS OF PRIOR YEAR FINDINGS
Finding 2014-009:
Our audit of the District's Application for State School Aid (ASSA) revealed that amounts reported were not always in agreement with supporting workpapers and documentation for the respective categories.
Current Status
Corrective action has been taken.
141