south florida workforce housing needs assessment
TRANSCRIPT

Prepared for: South Florida Regional Business Alliance
Prepared by: The Metropolitan Centerat Florida International University
South Florida Workforce Housing Needs AssessmentBroward, Miami-Dade and Palm Beach Counties
November 2008

South Florida Workforce Housing Needs Assessment
Acknowledgements
The South Florida Regional Business Alliance gratefully acknowledges the
John D. and Catherine T. MacArthur Foundation
for its support of regional partnerships and initiatives in the area of affordable and workforce housing. This regional study would not have been possible without their support.
The South Florida Regional Business Alliance would also like to acknowledge the following organizations for their time and support of this regional effort.
Broward Housing Partnership
Broward Workshop
Economic Council of Palm Beach County, Inc.
FAU Center for Environmental and Urban Solutions
FIU Metropolitan Center
Greater Miami Chamber of Commerce & the Chamber's Workforce Housing Committee
Housing Leadership Council of Palm Beach County, Inc.
South Florida Regional Planning Council
ULI Southeast Florida / Caribbean

South Florida Workforce Housing Needs Assessment
FIU Metropolitan Center Research Team
Ned Murray, Ph.D., A.I.C.P., Associate Director, Principal Investigator Dario Moreno, Ph..D., Director Amanda Gorski, M.A., Research Associate Dario Gonzalez, M.A., Research Associate Victoria Lerma, M.A., Research Associate Candy Hurtado, Research Assistant Stephanie Smith, M.H.S.A., Research Assistant
Cover Design & Report Design and Layout: Candy Hurtado

South Florida Workforce Housing Needs Assessment
Table of ContentsExecutive Summary 1 Chapter III Tables Continued:
Chapter I: Introduction 3 Table 3.6: Palm Beach County Multi-Family Affordability 2007 18
Chapter II: South Florida Workforce Housing Demand Analysis 5 Table 3.7: Palm Beach County Multi-Family Affordability 2008 18
Chapter II Tables: Table 3.8: Broward County Single Family Affordability 2007 19
Table 2.1: Regional Business Trends 5 Table 3.9: Broward County Single Family Affordability 2008 19
Table 2.2: County Business Trends 5 Table 3.10:Broward County Multi-Family Affordability 2007 19
Table 2.3: South Florida Top 5 Industries by County, 2007 7 Table 3.11: Broward County Multi-Family Affordability 2008 19
Table 2.4: South Florida Top 5 Occupations by County, 2007 7 Table 3.12: Miami-Dade County Single Family Affordability 2007 20
Table 2.5: Cost Burden by County 8 Table 3.13: Miami-Dade County Single Family Affordability 2008 20
Table 2.6: Broward County Annual Average Housing Demand Projections 2000-2030 9 Table 3.14: Miami-Dade County Multi-Family Affordability 2007 20
Table 2.7: Miami-Dade Annual Average Housing Demand Projections 2000-2030 9 Table 3.15: Miami-Dade County Multi-Family Affordability 2008 20
Table 2.8: Palm Beach County Annual Average Housing Demand Projections 2000-2030 9 Table 3.16: Rental Affordability by County, 3rd Quarter 2008 21
Table 2.9: South Florida Region Annual Average Housing Demand Projections 2000-2030 9 Table 3.17: South Florida Foreclosures by County and Zip Code 23 Table 2.10: South Florida Region Projected Annual Average Housing Demand by Tenure and Income Category 2000-2025 10
Table 2.11: Broward County Projected Annual Average Housing Demand by Tenure and Income Category 2000-2025 10
Table 2.12: Miami-Dade County Projected Annual Average Housing Demand by Tenure and Income Category 2000-2025 11 Chapter III Figures:
Table 2.13: Palm Beach County Projected Annual Average Housing Demand by Tenure and Income Category 2000-2025 11 Figure 3.1: South Florida Foreclosures by County 23
Table 2.14: South Florida Private Sector Job Loss January 2007-July 2008 13 Figure 3.2: Palm Beach County Home Foreclosures, July 2008 24
Chapter II Figures Figure 3.3: Broward County Home Foreclosures, July 2008 25
Figure 2.1: South Florida Business Trends 6 Figure 3.4: Miami-Dade County Home Foreclosures, July 2008 26
Figure 2.2: Broward County Projected Low-Moderate and Workforce Annual Demand 2000-2025 10
Figure 2.3: Miami-Dade County Projected Low-Moderate and Workforce Annual Demand 2000-2025 11
Figure 2.4: Palm Beach County Projected Housing Low-Moderate and Workforce Annual Demand 2000-2025 11
Figure 2.5: South Florida Housing Affordability Demand Spectrum 12
Chapter III: South Florida Workforce Housing Supply Analysis 14 Chapter IV: Conclusion 27 Chapter III Tables:
Table 3.1: South Florida Inventory by Type, 2006 14 Appendix i
Table 3.2: South Florida Housing Vacancy 14
Table 3.3: South Florida Region Affordability 2007, 2008 17
Table 3.4: Palm Beach County Single Family Affordability 2007 18
Table 3.5: Palm Beach County Single Family Affordability 2008 18

South Florida Workforce Housing Needs Assessment
1
EXECUTIVE SUMMARY
The South Florida Workforce Housing Needs Assessment is the culmination of on-going efforts over the past two years of the Broward Housing Partnership, Inc. (BHP), Housing Leadership Council of Palm Beach County, Inc. (HLC/PBC) and the Workforce Housing Committee of the Greater Miami Chamber of Commerce (GMCC) to address workforce housing issues in their respective counties. The South Florida “regional assessment” brings these mission-driven, private/public partnerships initiatives together with the support of the South Florida Regional Business Alliance (RBA). The assessment provides a current regional perspective on the economy and housing needs of South Florida’s workforce. The study compares and contrasts key housing and economic factors among Broward, Miami-Dade, and Palm Beach Counties. The housing and market analysis provides the underpinnings for the study’s recommendations and subsequent public policy action agenda to be finalized as part of the Regional Workforce Housing Conference to be held on November 12, 2008.
Affordable Workforce Housing in South Florida (2003 – 2008) A basic premise of all housing markets is the need to create and maintain a spectrum of housing choice and opportunity for all local residents. This axiom establishes that housing choice and needs differ within most community settings due to a variety of factors including: household income, population age, proximity of employment and mere preference.
The growing demand for and insufficient access to affordable/ workforce housing continues to be a top public policy issue in South Florida. Local housing studies have documented the extent and ramifications of South Florida’s three-year housing boom from 2003-2005 that resulted in a severe shortage of workforce housing and extreme affordability gaps for all housing types. The studies have shown that South Florida’s workforce housing supply and affordability mismatch was exacerbated by speculative investment which resulted in multiple conversions of rental units to condominiums and an overall development trend in recent years toward a more upscale housing demand external to the local market. Since 2007, South Florida has had to endure the collapse of a highly speculative housing market. During the aftermath, South Florida communities have been beset with unstable housing market conditions intensified by rising home foreclosures, increasing job loss and an overall tightening of the
mortgage credit market. These economic conditions have combined to essentially paralyze the local housing market despite steady decreases in housing values during the past year.
KEY FINDINGS:
There is a critical need and large unmet demand for affordable rental housing in South Florida. This finding has been substantiated on previous county-based studies as well as this Assessment;
A spectrum of rental housing choice and opportunity is particularly important as an adequate supply of affordable rental housing provides choice and opportunity to working individuals and families with modest incomes. Prior studies have established that these families and individuals comprise the vast majority of South Florida’s workforce;
South Florida has lost 40,000 private sector jobs since January, 2007;
There are currently 70,000 South Florida homes in foreclosure;
The de-valuation of South Florida’ s housing has resulted in significant negative equity and loss of wealth;
700,000 units (30 percent) of South Florida’s housing supply are now over 40 years old;
South Florida’s growing number of housing vacancies now totals 365,295 units, of which 46 percent are seasonal homes;
Despite decreasing home values, South Florida’s current single-family home price-to-median household income ratios range between 5:1-6:1, significantly above what is considered the standard manageable ratio of 3:1;
South Florida’s $1,200 average monthly rent is unaffordable to all households earning between 50-80 percent of South Florida’s area median income (AMI) of $54,000;
Approximately 85 percent of South Florida’s renters earning 50-80 percent of the AMI are cost-burdened; and
In November, 2008, South Florida’s existing housing demand totaled approximately 527,000 units for households earning 50-80 percent of the AMI and 193,000 units for households earning 81-120 percent of the AMI.
During the past three years the Metropolitan Center at Florida International University (MC/FIU) worked with the Broward Housing Partnership, Inc. and Housing Leadership Council of Palm Beach County to develop a “scorecard” mechanism to monitor and evaluate the performance of local governments, county and municipal, in addressing their workforce housing needs. A performance evaluation tool, the Municipal Scorecard for Affordable Housing Delivery© (MS-AHD) model was created to monitor and evaluate the progress of local governments in developing and implementing workforce/affordable housing policies and building management and institutional capacities to address these issues long-term.
The MS-AHD enabled the MC/FIU to highlight local municipalities and agencies that serve as “best practice” workforce housing examples in South Florida. Best practice and showcase communities are highlighted in the accompanying study, South Florida Workforce Housing Best Practices (2008). The study includes recommended policies and strategies divided into the four elements of the MS-AHD model: 1) Policy and Management; 2) Planning and Land Use; 3) Local Dedicated Funding; and 4) Institutional Capacity-Building.

South Florida Workforce Housing Needs Assessment
2
I Introduction
A. Background
The South Florida Workforce Housing Needs Assessment is the culmination of on-going efforts over the past two years of the Broward Housing Partnership, Inc. (BHP), Housing Leadership Council of Palm Beach County, Inc. (HLC/PBC) and the Workforce Housing Committee of the Greater Miami Chamber of Commerce (GMCC) to address affordable workforce housing issues in their respective counties. The South Florida “regional assessment” brings these mission-driven, private/public partnership initiatives together with the support of the South Florida Regional Business Alliance (RBA).
The need to preserve and create an adequate supply of workforce affordable housing is a growing community and economic development challenge in all of South Florida. Inflated housing values during 2003-2005 induced by external market demand forces and speculative investment diminished the supply of affordable owner and renter units and created a severe mismatch with the housing demand of South Florida’s workforce. The housing demand imbalance was exacerbated by two critical supply factors: 1) the lack of production of workforce affordable owner and renter housing units, and 2) the wholesale conversion of multi-family rental housing into condominiums resulting in a substantial loss of South Florida’s rental housing inventory.
As the previous workforce/affordable housing needs assessment have shown, Broward, Miami-Dade and Palm Beach Counties are part of a larger South Florida regional economy. Monroe County, particularly the upper Florida Keys, also factors into the South Florida regional economy. Prior housing needs assessments clearly demonstrated the important link between an adequate supply of workforce affordable housing and sustainable economic growth. The studies documented that many of South Florida’s leading industrial sectors, including health care, professional services and retail trade are finding it increasingly
difficult to attract and maintain workers in entry and management level positions.
There is also now hard evidence that working families have begun moving to locations outside of South Florida that offer more affordable housing and economic opportunities, thus disrupting the social fabric of many South Florida communities.
A basic premise of all housing markets is the need to create and maintain a spectrum of housing choice and opportunity for all local residents. This axiom establishes that housing choice and needs differ within most community settings due to a variety of factors including: household income, population age, proximity of employment and mere preference. A critical finding of the prior housing needs assessments is the large unmet demand for affordable rental housing throughout South Florida. A spectrum of rental housing choice and opportunity is particularly important as an adequate supply of affordable rental housing provides choice and opportunity to working individuals and families with more modest incomes. Prior studies have established that these families and individuals comprise the vast majority of South Florida’s workforce.
A number of housing studies in recent years have shown a clear correlation between workforce housing demand and transportation costs. The critical link between housing and transportation costs has significant implications with respect to housing choice and affordability. Housing and transportation costs can severely limit a working household’s choice both in terms of housing and job location. Unfortunately, for many working households in South Florida limited choice in terms of housing affordability has created mounting transportation expenditures. In fact, South Florida’s sprawl development pattern over the past twenty years has created increasing spatial separation between where workers live and their places of employment.
Statistics show that the sprawl development pattern has significantly increased commute times. In 1990, 81,160 South Florida workers (4 percent of all workers) commuted 60+ minutes to their place of
employment. By 2000, that number more than doubled to 170,609 (8 percent of all workers). From 2000-2006, the South Florida worker population commuting 60+ minutes to their place of employment grew to 236,396 (10 percent) workers.
The most recent studies prepared on behalf of the BHP, HLC/PBC and GMCC concluded that South Florida’s housing market is in a severe state of flux marked by growing instability and uncertainty. The studies highlighted the extent and ramifications of South Florida’s explosive three-year housing boom during the period 2003-2005 that resulted in a severe shortage of workforce housing and extreme affordability gaps for all housing types. The gross mismatch between housing values and workforce demand created an inflated housing inventory that has continued to grow in backlog as both buyers and sellers await some level of market normalcy. Market instability and the rise in home foreclosures have essentially paralyzed the local housing market despite steady decreases in housing values during the past year. The rise in home foreclosures in South Florida is the result of several factors, including the proliferation of the sub-prime lending market during the height of the building boom, speculative investment and predatory lending practices. The state of South Florida’s housing market and regional economy has further deteriorated over the past two years with rising job loss and unemployment due to the spillover effects of the housing bubble and lost government revenues. Over the past year alone South Florida has lost over 16,000 jobs, thus adding to the plight of many worker households.
The South Florida Workforce Housing Needs Assessment provides an important regional perspective on the economy and housing market. The study compares and contrasts key housing and economic factors and conditions among the Tri-counties and then provides recommended solutions for moving forward. Solutions were formulated based on “best practice” research in South Florida conducted by the FIU Metropolitan Center applying the Municipal Scorecard for Affordable Housing Delivery (MS-AHD) model. The study findings and recommendations are intended to serve as discussions points for the BHP, HLC/PBC and GMCC housing partnerships and the RBA in crafting a South Florida workforce housing action agenda.
.
2
Working families have begun moving to locations outside of South Florida that offer more affordable housing and economic opportunities, thus disrupting the social fabric of many South Florida communities
South Florida’s sprawl development pattern over the past twenty years has created increasing spatial separation between where workers live and their places of employment
South Florida Workforce Housing Needs Assessment
3
B. Defining and Measuring Housing Affordability
Housing Affordability is generally defined as the capacity of households to consume housing services and, specifically, the relationship between household incomes and prevailing housing prices and rents. The standard most frequently used by various units of government is that households should spend no more than 30 percent of their income on housing costs. This is the standard definition for housing programs administered by the Department of Housing and Urban Development (HUD) and most state programs, including housing programs administered through the State of Florida’s Housing Finance Corporation (FHFC) and the Department of Community Affairs (DCA). However, this definition has its limitations because of the inability to determine whether households spend more than 30 percent of their income on housing due to necessity or by choice. Specifically, the definition does not consider that upper income and smaller households are able to afford spending far above 30 percent of their incomes on housing, and have sufficient income left over to satisfy other basic needs; whereas low income households that pay only 10 percent of their incomes on housing costs may be forced to forgo essential medical care and healthy food (The Brookings Institution, 2002). Therefore, it is important to develop a clear understanding of the demand for housing based on local employment and wages and the supply of housing based on workforce affordability and accessibility.
C. Affordability Indices
One measure of housing affordability is the cost of homeownership, commonly conveyed through housing affordability indices. These indices generally indicate that affordability increased substantially toward the end of the last decade, primarily as a result of lower interest rates during that period. A housing affordability index for an area brings together the price and the income elements that contribute to housing affordability. While housing affordability indices are useful tools, they typically examine affordability only from an ownership perspective. For households of lower income in a rapidly appreciating housing market, rent price increases have far exceeded growth in incomes, deepening the housing affordability problem. The following describes the most recognized affordability indices:
National Association of Realtors (NAR) Index
The most common index is that produced by the National Association of Realtors (NAR). The NAR index measures the ability of the median income household in an area to afford a median priced house. In addition to the median income and median house price in an area, the NAR index considers current mortgage interest rates, assumptions about the down payment required to purchase the median price home, and the maximum percentage of household income that can be spent on housing. An index of 100 indicates the typical (median) family in the area has sufficient income to purchase a single-family home selling at the median price (Shimberg Center for Affordable Housing, 2004).
The Median House Price-to-Income Ratio
The “median house price-to-income ratio” used by the National Association of Realtors and other housing analysts is a key economic indicator in assessing local market trends and vitality. The index compares the median sales price of an existing single-family home to the median household income in a given market. Nationally, the median house price-to-income ratio has more than tripled in the past five years in many high priced metropolitan markets including New York City, Boston and Los Angeles. In South Florida, the median house price-to-income ratio widened from 4:1 at the beginning of the housing boom in 2003 to greater than 7:1 at the height of the market in 2005. Currently, South Florida ratios vary between 5:1 and 6:1.
Housing and Transportation Affordability Index
The Housing and Transportation Affordability Index, aka “Affordability Index,” evolved from research on the Location Efficient Mortgage ® (LEM) developed by the Centers for Neighborhood Technology and Transit Oriented Development. The Affordability Index calculates the sum of average housing costs plus the average transportation costs for a neighborhood divided by average neighborhood income. Basically, total housing costs equal current housing sales prices and rents, and total transportation costs equal the sum of the costs for auto ownership, auto use and transit.
The Affordability Index would calculate the affordability of a home based on its market value and the transportation cost incurred by its location. Nationally, transportation is the second largest household expenditure after housing. Transportation expenditures range from 10 percent of the average household’s expenditures in transit-rich areas to 25 percent in more auto-dependent areas of the country. The Brookings Institution has calculated that the average U.S. household spends 19 percent of its budget on transportation.1
The link between housing affordability and transportation expenditures was further impacted with the increase in gas prices to over $4.00 per gallon from 2007 to 2008. In fact, the average household increased its transportation expenditures by 14 percent or $1,200 per year during this time period. In South Florida, the increase in transportation expenditures represented 3 percent of the typical working household’s annual earnings. Rising transportation costs have significant impacts on the rental housing market. The location of affordable rental housing is particularly relevant as proximity to job centers and public transportation is vital to a renter-dominated workforce principally comprised of low- and moderate-income households.
D. Income Categories
Federal and state housing programs have established income guidelines for the purpose of determining local program eligibility. There is some flexibility and certain variations in federal and state programs, but standard definitions have existed for some time, particularly with respect to lower income categories. The Department of Housing and Urban Development (HUD) established income guidelines under the Housing and Community Development Act of 1974 and in reauthorizing legislation that includes the Community Development Block Grant (CDBG) and HOME programs. The Act defines "persons of low- and moderate-income" and "low- and moderate-income persons" as families and individuals whose incomes do not exceed 80 percent of the median income of the area involved. Families of persons under 80 percent of the median income are defined as follows:
1 The Brookings Institution, Urban Markets Initiative, Market Innovation Brief, January 2006.
It is important to develop a clear understanding of the demand for housing based on local employment and wages and the supply of housing based on workforce affordability and accessibility
The location of affordable rental housing is particularly relevant as proximity to job centers and public transportation is vital to a renter dominated workforce principally comprised of low- and moderate-income households

South Florida Workforce Housing Needs Assessment
4
Extremely Low-Income: Families and individuals whose income is between 0 and 30 percent of the median income for the area, as determined by HUD, with adjustments for smaller and larger families. The usual benchmark is based on a family of four earning the area median income (AMI). The larger the household, the greater the income limits, which allow for multiple wage earners and higher income requirements for family expenses. HUD may establish income ceilings higher or lower than 30 percent of the median for the area on the basis of HUD’s findings that such variations are necessary because of prevailing levels of construction costs or fair market rents, or unusually high or low family incomes. [Source: 24 CFR 91.5]
Low-Income: Families or individuals whose income does not exceed 50 percent of the median income for the area, as determined by HUD, with adjustments for smaller and larger families. HUD may establish income ceilings higher or lower than 50 percent of the median for the area on the basis of HUD’s findings that such variations are necessary because of prevailing levels of construction costs or fair market rents, or unusually high or low family incomes. (This term corresponds to low-income households in the CDBG Programs.) [Source: 24 CFR 91.5]
Moderate-Income: Families or individuals whose income does not exceed 80 percent of the median income for the area, as determined by HUD, with adjustments for smaller and larger families. HUD may establish income ceilings higher or lower than 80 percent of the median for the area on the basis of HUD’s findings that such variations are necessary because of prevailing levels of construction costs or fair market rents, or unusually high or low family incomes. (This term corresponds to low- and moderate-income households in the CDBG Programs.) [Source: 24 CFR 91.5]
For the purposes of this study, the above standard HUD definitions are used for the lower income categories. This provides clarity for discussing the federal resources available for addressing low- and moderate-income housing demand. For income categories above 80 percent of the area median, the study separates the categories “workforce income” (80-120 percent), “middle Income” (120-150 percent) and “upper income” (greater than 150 percent).
E. Methodology and Scope of Study
The methodology of the South Florida Workforce Housing Needs Assessment involved a comparative analysis of the economies and housing markets of Broward, Miami-Dade and Palm Beach Counties. The analysis builds on the prior workforce housing needs assessments performed by the FIU Metropolitan Center on behalf of the three county housing partnerships by providing updated economic and housing market data and combining the research into one comprehensive regional study. The best practice research, which provides the underpinning for the study’s proposed solutions, utilized the findings from the Municipal Scorecard for Affordable Housing Delivery (MS-AHD) model applied in Broward and Palm Beach Counties. Miami-Dade County best practice research was conducted through interviews with individual municipalities and housing organizations.
The study includes the following elements:
A. Workforce Housing Demand Analysis: This section provides a comparative analysis of the economies and workforce affordable housing needs of Broward, Miami-Dade, and Palm Beach Counties.
B. Workforce Housing Supply Analysis: This section provides a comparative analysis of the key workforce housing supply factors and conditions of Broward, Miami-Dade, and Palm Beach Counties.
C. Workforce Housing Affordability Analysis: This section extrapolates the key data findings from the workforce housing demand and supply sections and provides a comparative analysis of workforce housing affordability in Broward, Miami-Dade, and Palm Beach Counties.
D. Best Practice Research: This section provides workforce housing “best practice” case study examples from Broward, Miami-Dade, and Palm Beach Counties utilizing the findings from the Municipal Scorecard for Affordable Housing Delivery (MS-AHD) model and local interviews. The Scorecards and best practice research provide the basis for the recommended “solutions” in the concluding Chapter V of the study.

South Florida Workforce Housing Needs Assessment
5
II South Florida Workforce Housing Demand Analysis
A. Background This section provides a regional workforce housing demand analysis comparing the economies and workforce housing needs of Broward, Miami-Dade, and Palm Beach Counties. Workforce housing demand is largely determined by ongoing and planned economic development activities that result in sustained and expanded employment opportunities. Employment growth occurs through the retention and expansion of existing firms and new economic growth resulting from start-ups, spin-offs and relocations to South Florida. Populations follow jobs and the demand for workforce housing can be determined by the location, occupation types and wage levels of South Florida’s major employment sectors.
B. The South Florida Economy In order to effectively develop regional policies and strategies that address the demand for workforce housing, it is important to first understand the spatial dimension of the South Florida regional economy. The first step is to determine the labor market area (LMA). LMAs are designated by the Bureau of Labor Statistics (BLS) in
reporting key employment and unemployment data. LMAs are intended to capture economic integration, which is determined by population density and commuting patterns. Within a defined LMA, workers can generally change their jobs without changing their places of residence. Based on an analysis of employment and population centers and residential commuting patterns among the Tri-counties of Broward, Miami-Dade and Palm Beach, South Florida can be classified as a “major” LMA. (See maps-Appendix) Once the LMA is defined, planners and policy-makers must consider the critical relationship between housing supply and demand and the dynamics of the regional economy and labor market. Regional economies defined by labor markets are fairly structured and have a certain level of geographic arrangement that relates to housing supply and demand. A spectrum of housing choice and opportunity within close commuting distance (30 minutes of less) of employment centers helps create and support sustainable regional economies. C. Industrial Base Prior economic analyses of South Florida (Broward, Miami-Dade and Palm Beach Counties) have clearly shown that the regional economy is comprised of four major industries: Retail; Health Care and Social Services; Accommodation and Food Services; and Administrative Support, Waste Management and Remediation Services. A seven-
year (2000-2006) trend analysis of County Business Patterns data substantiates both the preponderance and growth of these industries. Together, these industries total 62,364 establishments (35 percent of total) and 965,608 jobs (50 percent of total) in South Florida.
Table 2.1: Regional Business Trends
Totals South Florida Region
2000 2006 % Change 00-06 Industry
Number of Employees
Number of Establishments
Number of Employees
Number of Establishments
Number of Employees
Number of Establishments
Retail trade 280,064 21,793 308,884 23,337 10.3% 7.1% Health care and social assistance 235,378 14,809 261,447 18,196 11.1% 22.9% Admin, support, waste mgt, remediation services 200,950 9,799 181,139 10,551 -9.9% 7.7% Accom. & food services 178,673 8,951 214,138 10,280 19.8% 14.8%
Construction 106,931 11,183 135,402 14,308 26.6% 27.9% Totals South
Florida Region 1,001,996 66,535 1,101,010 76,672 9.9% 15.2%
Source: U.S. Census County Business Patterns, 2007.
Table 2.2: County Business Trends
Miami Dade County Broward County Palm Beach County
2000 2006 2000 2006 2000 2006 Industry
Number of Employees
Number of Establishments
Number of Employees
Number of Establishments
Number of Employees
Number of Establishments
Number of Employees
Number of Establishments
Number of Employees
Number of Establishments
Number of Employees
Number of Establishments
Retail Trade 115,010 9,650 125,025 10,377 97,919 7,051 107,036 7,435 67,135 5,092 76,823 5,525
Health Care and Social Assistance 101,404 6,450 112,674 8,011 74,933 4,606 84,426 5,562 59,041 3,753 64,347 4,623
Administrative Support, Waste Mgmt., Remediation Services 72,802 3,512 72,300 3,588 69,987 3,531 64,408 3,894 58,161 2,756 44,431 3,069
Accommodation & Food Services 78,818 3,694 88,189 4,183 57,608 3,162 70,561 3,590 42,247 2,095 55,388 2,507
Construction 35,534 3,740 41,092 4,906 41,754 4,037 51,705 4,978 29,643 3,406 42,605 4,424
Totals 403,568 27,046 439,280 31,065 342,201 22,387 378,136 25,459 256,227 17,102 283,594 20,148 Source: U.S. Census County Business Patterns, 2000-2006.
A spectrum of housing choice and opportunity within close commuting distance of employment centers helps create and support sustainable regional economies

South Florida Workforce Housing Needs Assessment
6
125,025
10,377
107,036
7,435
5,525
8,011
84,426
5,562
64,347
4,623
72,300
3,588
64,408
3,894
44,431
3,069
88,189
4,183
70,561
3,590
2,507
41,092
4,906
51,705
4,978
42,605
4,424
76,823
112,674
55,388
0 20,000 40,000 60,000 80,000 100,000 120,000 140,000
Number of Employees
Number of Establishments
Number of Employees
Number of Establishments
Number of Employees
Number of Establishments
Mia
mi-D
ade
Cou
nty
Bro
war
d C
ount
yPa
lm B
each
Cou
nty
Retail Trade Health Care and Social Assistance Administrative Support, Waste Mgmt., Remediation Services Accommodation & Food Services Construction
Figure 2.1: South Florida Business Trends
Source: U.S. Census County Business Patterns, 2000-2006.

South Florida Workforce Housing Needs Assessment
7
Future projections (2007-2015) by the Florida Agency for Workforce Innovation (AWI) show that South Florida’s economic growth will continue to occur within the same industry and employment mix (Table 2.2). Private sector employment growth will be greatest in Retail Trade, Administrative and Support and Waste Management, and Accommodation and Food Services. Of particular note, AWI projects that “Local Government” will generate more employment growth than all private industry sectors with the exception of Retail Trade.
The AWI’s Labor Market Statistics report provides important occupational employment and wage data that provides a clearer understanding of individual and household income in South Florida. The 2007 Labor Market Statistics report provides total employment figures and hourly wage estimates for all occupations, including mean, median, entry- and experienced-level wage rates.
Table 2.3 indicates that South Florida’s largest occupational employment is found in the service providing industries. These occupations generally have low entry and median hourly wage rates. In fact, many of the leading occupations that comprise South Florida’s employment base-retail salespersons, cashiers, and waiters/waitresses, represent the bottom of the occupation wage scale.
Employment Annual Change 2007 2015 Total Percent
Total South Florida Region All industries 2,705,986 3,078,486 46,563 0.05
Total South Florida Region Top 5 Industries 439,109 565,227 15,765 1.72
Miami-Dade County Total, All Industries 1,166,643 1,275,841 13,650 1.17 Professional, Scientific, and Technical Services 69,880 89,590 2,464 3.53 Waste Management and Remediation Service 1,883 2,366 60 3.21 Social Assistance 16,915 21,249 542 3.20 Ambulatory Health Care Services 46,129 56,626 1,312 2.84 Administrative and Support Services 80,829 97,544 2,089 2.58 Top Five Total 215,636 267,375 6,467 3.00
Broward County Total, All Industries 869,603 997,089 15,936 1.83 Educational Services 18,069 24,150 760 4.21 Nonstore Retailers 2,786 3,712 116 4.15 Social Assistance 11,459 14,996 442 3.86 Ambulatory Health Care Services 40,311 51,803 1,436 3.56 Professional, Scientific, and Technical Services 54,680 69,906 1,903 3.48 Top Five Total 127,305 164,567 4,658 3.66
Palm Beach County Total, All Industries 669,740 805,556 16,977 2.53 Management of Companies and Enterprises 9,654 13,853 525 5.44 Ambulatory Health Care Services 32,742 46,433 1,711 5.23 Museums, Historical Sites, and Similar Institutions 699 962 33 4.70 Professional, Scientific, and Technical Services 39,663 54,207 1,818 4.58 Amusement, Gambling, and Recreation Industries 13,410 17,830 552 4.12 Top Five Total 96,168 133,285 16,660 4.82
Table 2.3: South Florida Top 5 Industries by County, 2007
Top 5 Occupations by County, 2007
Occupation 2007
Employment
Median Hourly Wage
Median Annual Wage
Total South Florida Region 317,020 10.18 $27,202 Miami-Dade County
Retail Salespersons 35,420 11.09 $23,067 Cashiers 30,050 7.84 $16,307 Office Clerks, General 26,500 11.22 $23,338 Stock Clerks and Order Fillers 21,840 9.42 $19,594 Security Guards 20,210 10.00 $20,800
Broward County Retail Salespersons 27,470 11.53 $23,982 Cashiers 22,780 8.35 $17,368 Office Clerks, General 19,820 11.25 $23,400 Customer Service Representatives 18,380 13.48 $28,038 Stock Clerks and Order Fillers 16,910 9.58 $19,926
Palm Beach County Retail Salespersons 21,240 11.96 $24,877 Waiters and Waitresses 15,690 9.83 $20,446 Cashiers 15,560 8.53 $17,742 Registered Nurses 12,790 30.69 $63,835 Stock Clerks and Order Fillers 12,360 9.86 $20,509 Source: FL AWI, Occupation and Employment Statistics, 2008.
Source: FL AWI, Occupation and Employment Statistics, 2008
Table 2.4: South Florida Top 5 Occupations by County, 2007

South Florida Workforce Housing Needs Assessment
8
D. Workforce Housing Demand
As previously noted, the level of workforce housing demand is largely determined by job growth and retention. The affordability component of workforce housing demand, however, is based on local wages and salaries that are then translated into household income. The previous industry and employment analysis clearly shows that South Florida’s economic base is principally comprised of service-providing industries, most notably, Retail Trade, Health Care and Social Assistance, Accommodation and Food Services and Administrative Support & Waste Management, Remediation Services. In total, service-providing industries account for over 80 percent of all jobs in South Florida. While service-providing industries are essential to South Florida’s tourism-based economy and do offer livable wages among many of the associated occupations, the vast preponderance of employment is found in low-wage earning occupations. In fact, the 2008 median annual wage for all occupations in South Florida is approximately $30,500. The annual wage level translates to worker households with median incomes generally below the area median income (AMI) for Broward ($54,211), Miami-Dade ($46,549) and Palm Beach ($60,736) Counties.
Low- and moderate-income households have been especially impacted by rising housing costs in South Florida. The level of impact can be readily determined by calculating the growth in cost-burdened households (households spending more than 30 percent of income on housing costs). According to the 2006 American Community Survey (ACS), the percentage of South Florida households that are cost-burdened has risen significantly in the past few years. The percentages are
particularly striking for those households (owner and renter) earning less than $35,000 annually. In Miami-Dade County, 72.6 percent of owner households earning less than $35,000 annually are cost-burdened. For lower income renters the percentage (83-86 percent) of cost-burdened households is extreme in Broward, Miami-Dade and Palm Beach Counties.
The recent Tri-county housing needs assessments calculated “existing” and “future” housing demand by tenure and household income category. South Florida’s existing housing demand totals approximately 18,092 owner units and 10,443 renter units with a future (2010-2030) “annual” demand of approximately 18,117 owner and 8,752 renter housing units. The studies indicate that “low and moderate” income (<80 percent AMI) and “workforce” income households (80-120 percent AMI) comprise a significant percentage of South Florida’s existing and future housing demand.
Given the high level of cost-burdened owner and renter households and the growing incidence of “severely” cost-burdened renter households (>50 percent of income on housing costs) in South Florida, it is understandable why the greatest housing demand is driven by low- and moderate-income worker households (<80 percent of AMI). In the Tri-counties, low- and moderate-income “owner” housing comprises greater than one-third of existing and future annual owner housing demand. By comparison, low- and moderate-income “renter” housing comprises greater than 60 percent of the existing and future annual rental housing demand in Broward, Miami-Dade and Palm Beach Counties.
All Occupied Units Owner Occupied Units Renter Occupied Units
Miami Dade
County Broward County Palm Beach
County Miami Dade
County Broward CountyPalm Beach
County Miami Dade
County Broward CountyPalm Beach
County Total Occupied Housing 828,794 682,105 682,105 495,733 482,079 380,000 333,061 200,026 124,518
Total Cost Burden Occupied Housing South Florida Region 1,001,108 624,766 657,605
Total Cost Burdened Occupied Housing 54.2% 48.2% 44.2% 49.9% 45.9% 41.2% 60.6% 53.9% 53.5%Less than $20,000: 22.8% 16.4% 15.9% 13.8% 13.4% 14.0% 36.3% 23.9% 21.4%
30 percent or more 88.4% 89.2% 88.1% 86.3% 85.8% 84.6% 89.6% 94.0% 95.3%
$20,000 to $34,999: 17.8% 17.1% 16.3% 15.2% 13.4% 14.6% 21.7% 23.7% 21.3%
30 percent or more 78.0% 74.8% 66.8% 72.6% 85.8% 58.9% 83.6% 86.7% 83.4%
Table 2.5: Household Cost Burden by County
Source: U.S. Census Bureau, American Community Survey, 2006.
The annual wage level translates to worker households with median incomes generally below the area median income (AMI) for Broward, Miami-Dade and Palm Beach Counties

South Florida Workforce Housing Needs Assessment
9
Previous housing needs assessments have shown the highest concentrations of “low and moderate” and “worker” households are found in South Florida’s larger municipalities. Significantly, many of South Florida’s fastest growing cities in the western suburbs are far removed from the employment centers east of I-95. Prior analysis has also shown that low and moderate-income households constitute the vast majority of working households in South Florida. In fact, the median household income of many of South Florida’s larger
municipalities is significantly lower than the area median income (AMI). Such is the case in Deerfield Beach ($42,945), Pompano Beach ($45,508), Hollywood ($46,317) and Fort Lauderdale ($47,797) in Broward County; the City of Miami ($28,275), Homestead ($32,239), Miami Beach ($32,898) and Hialeah ($35,511) in Miami-Dade County; and, West Palm Beach ($46,393), Boynton Beach ($50,267) and Delray Beach ($54,717) in Palm Beach County.
Table 2.6: Broward County Annual Average Housing Demand Projections 2000-2030
Annual Average Demand 2000-2010 2010-2015 2015-2020 2020-2025 2025-2030 Total Occupied Housing Units 7,557 7,450 7,182 6,687 5,964Renter Occupied 1,931 2,235 2,155 2,006 1,789Owner Occupied 5,626 5,215 5,027 4,681 4,175
Source: U.S. Census Bureau, Census 2000 and American Community Survey, 2006 tabulated by the FIU Metropolitan Center, 2007 and Broward Office of Urban Planning and Redevelopment, Planning Services Division, Broward County Population Forecasting Model
Table 2.8: Palm Beach County Annual Average Housing Demand Projections 2000-2030
Annual Average Demand 2000-2010 2010-2015 2015-2020 2020-2025 2025-2030
Renter Housing Units 2,128 2,960 2,762 2,470 2,297
Owner Housing Units 7,391 8,426 7,862 7,032 6,538
Total Occupied Housing Units 9,519 11,386 10,624 9,502 8,834 Source: 2006 U.S. Census American Community Survey and Florida Bureau of Economic and Business Research 2007 Population and Household Projections.
Table 2.7: Miami-Dade County Annual Average Housing Demand Projections 2010-2030
Annual Average Demand 2000-2010 2010-2015 2015-2020 2020-2025 2025-2030Total Occupied Housing Units 20,129 9,496 10,209 10,187 9,951Owner-Occupied Units 12,810 5,603 6,024 6,010 5,871Renter-Occupied Units 7,319 3,894 4,186 4,177 4,080 Source: U.S. Census Bureau, Census 2000 and American Community Survey 2006 Miami-Dade County Department of Planning and Zoning, Research Section, 2006. Analyzed by F.I.U. Metropolitan Center, 2008.
2000-2010 2010-2015 2015-2020 2020-2025 2025-2030 Total Occupied Housing Units 37,205 28,332 28,015 26,376 24,749Renter Occupied 11,378 9,089 9,103 8,653 8,166Owner Occupied 25,827 19,244 18,913 17,723 16,584
Table 2.9: South Florida Region Annual Average Housing Demand Projections 2000-2030
Source: Analyzed by F.I.U. Metropolitan Center, 2008.

South Florida Workforce Housing Needs Assessment
10
Table 2.11: Broward County Projected Annual Average Housing Demand by Tenure and Income Category 2000-2025
Annual Average Demand 2000-2010 2010-2015 2015-2020 2020-2025
Renter-Occupied Units 1,931 2,235 2,155 2,006
Low & Moderate Income (<80% of Median) 1,176 1,361 1,312 1,222
Workforce Income (80% to 120% of Median) 377 265 256 238
Owner-Occupied 5,626 5,215 5,027 4,681
Low & Moderate Income (<80% of Median) 2,194 2,034 1,961 1,826
Workforce Income (80% to 120% of Median) 1,052 975 940 875
Figure 2.2: Broward County Projected Low-Moderate and Workforce Annual Demand 2000-2025
Source: U.S. Census Bureau, Census 2000 and American Community Survey, 2006. Tabulated by the FIU Metropolitan Center, 2007 and Broward Office of Urban Planning and Redevelopment, Planning Services Division, Broward County Population.
Source: U.S. Census Bureau, Census 2000 and American Community Survey, 2006.
0
2,000
4,000
6,000
8,000
0,000
2,000
4,000
Owner-OccupiedUnits
Low- andModerate-
Income Units<80%
Workforce Units80% to 120%
Renter-OccupiedUnits
Low- andModerate-
Income Units<80%
Workforce Units80% to 120%
Owner-Occupied Units Renter-Occupied Units
2000-2010 2010-2015 2015-2020 2020-2025
Annual Average Demand 2000-2010 2010-2015 2015-2020 2020-2025 Renter Housing Units 11,378 9,089 9,103 8,653 Low and Moderate Income (<80% AMI) 7,107 5,649 5,662 5,385 Workforce Units (80% to 120% AMI) 1,568 1,241 1,227 1,153 Owner Housing Units 25,827 19,244 18,913 17,723 Low and Moderate Income (<80% AMI) 9,096 7,203 7,023 6,540 Workforce Units (80% to 120% AMI) 4,593 3,464 3,399 3,182
Source: U.S. Census Bureau, Census 2000 and American Community Survey 2006. Table analyzed by the FIU Metropolitan Center.
Table 2.10: South Florida Region Projected Annual Average Housing Demand by Tenure and Income Category 2000-2025

South Florida Workforce Housing Needs Assessment
11
Figure 2.3: Miami-Dade County Projected Low-Moderate and Workforce Annual Demand 2000-2025
-
1,000
2,000
3,000
4,000
5,000
6,000
Owner Occupied Low & ModerateIncome (<80% of
Median)
WorkforceIncome (80% to120% of Median)
Renter OccupiedUnits
Low & ModerateIncome (<80% of
Median)
WorkforceIncome (80% to120% of Median)
Owner Occupied Renter Occupied
2000-2010 2010-2015 2015-2020 2020-2025
Figure 2.4: Palm Beach County Projected Housing Low-Moderate and Workforce Annual Demand 2000-2025
0
1,000
2,000
3,000
4,000
5,000
6,000
7,000
8,000
9,000
Owner-OccupiedUnits
Low- andModerate-Income
Units <80%
Workforce Units80% to 120%
Renter-OccupiedUnits
Low- andModerate-Income
Units <80%
Workforce Units80% to 120%
Owner-Occupied Units Renter-Occupied Units
2000-2010 2010-2015 2015-2020 2020-2025
Table 2.13: Palm Beach County Projected Annual Housing Demand by Tenure and Income Category 2000-2025
Annual Average Demand 2000-2010 2010-2015 2015-2020 2020-2025
Renter Housing Units 7,319 3,894 4,186 4,177
Low and Moderate Income (<80% AMI) 4,611 2,453 2,637 2,631
Workforce Units (80% to 120% AMI) 793 422 454 453
Owner Housing Units 12,810 5,603 6,024 6,010
Low and Moderate Income (<80% AMI) 3,842 1,681 1,807 1,803
Workforce Units (80% to 120% AMI) 2,203 964 1,036 1,034
Source: U.S. Census Bureau, Census 2000 and American Community Survey, 2006.
Table 2.12: Miami Dade County Projected Annual Housing Demand by Tenure and by Income Category 2000-2025
Annual Average Demand 2000-2010 2010-2015 2015-2020 2020-2025
Renter-Occupied Units 2,128 2,960 2,762 2,470
Low- and Moderate-Income Units <80% 1,320 1,835 1,713 1,532
Workforce Units 80% to 120% 398 554 517 462
Owner-Occupied Units 7,391 8,426 7,862 7,032
Low- and Moderate-Income Units <80% 3,060 3,488 3,255 2,911
Workforce Units 80% to 120% 1,338 1,525 1,423 1,273
Source: U.S. Census Bureau, Census 2000 and American Community Survey, 2006.
Source: U.S. Census Bureau, Census 2000 and American Community Survey, 2006. Miami-Dade Department of Planning and Zoning, Research Section, 2006. Tabulated by the FIU Metropolitan Center, 2008.
Source: U.S. Census Bureau, Census 2000 and American Community Survey, 2006. Tabulated by the FIU Metropolitan Center, 2008.

South Florida Workforce Housing Needs Assessment
12
. E. Translating Workforce Housing Demand into Workforce Housing Delivery As previously noted, workforce housing demand requires the existence or the need to create a spectrum of “housing choice” and “opportunity.” Housing choice means a range of workforce housing types, e.g. single-family, town home, garden apartment, public housing. Housing opportunity equates to workforce “accessibility” by community and neighborhood and the general “availability” of affordable owner and renter housing. A critical finding of the prior workforce housing needs assessments is the large unmet demand for affordable rental housing throughout South Florida. A spectrum of rental housing choice and opportunity is particularly important as the aforementioned economic analysis clearly establishes the pressing housing need for South Florida working households who earn less than the area median income (AMI) and are currently cost-burdened. Additionally, affordable home ownership at these income levels may not be option, particularly with the recent tightening of mortgage credit.
The translation of workforce housing demand into a regional system of workforce housing delivery begins with a determination of the
total number of households in South Florida that fall within each household income category (see Figure 2.5 below). This is a critical understanding as the spectrum of housing choice and opportunity is either limited or enhanced based on household income. Those within the lowest household income category (Extremely Low-Income < 30% of AMI) are the most restricted in terms of choices and opportunities, while those households at the highest household income category (generally, above Workforce Household Income >120% of AMI) have the most choices and opportunities. Together, these household income categories represent South Florida’s total workforce housing demand.
Once total housing demand is determined by various household income categories, total workforce housing demand is then calculated for those household income categories that are representative of South Florida’s workforce. The previous economic analysis shows that the majority of South Florida’s worker households fall within the “Moderate-Income” (50-80% of AMI) and “Workforce-Income” (80-120% of AMI) categories.
Once housing demand is determined by household income category, housing policies and program activities can be designed to respond to the issues of housing choice and opportunity. Traditionally, households in the “Extremely Low Income” (30% of AMI) and “Low Income” (30-50% of AMI) categories have limited choice and opportunity and are, therefore, typically in need of either emergency housing or some form of subsidized rental housing, e.g. public housing, Section 8 Vouchers. Households of “Moderate Income” (50-80% of AMI) have generally greater housing choice and opportunity but are typically limited to the rental versus homeowner market. Rental housing production and preservation programs expand choice and opportunity for “Low Income” and “Moderate Income” households. Ownership programs for the “Moderate Income” household category provide expanded opportunity, but require substantial public subsidies in higher-priced housing markets. Households within the “Workforce Income” (80-120%) category are generally suited for assisted first-time homebuyer programs, e.g. second mortgages, purchase/rehab loans, on the lower end of the income category, and “entry-level” market rate housing with minimal public assistance, e.g. down payment assistance, homeowner counseling, on the upper end.
Figure: 2.5: South Florida Housing Affordability Demand Spectrum
Source: U.S. Census 2007 American Community Survey, figure created by FIU Metropolitan Center

South Florida Workforce Housing Needs Assessment
13
F. Changing Workforce Housing Demand Factors The 2007 and 2008 housing market updates for Broward, Miami-Dade and Palm Beach Counties documented the housing market downturn and economic spillover effects of the residential real estate boom period and resultant housing bubble. Instability and uncertainty in the housing market was the first stage of decline followed by a steady decrease in housing values and rising home foreclosures throughout the South Florida region. Beginning in 2007 the larger economic effects of the housing market downturn began to occur. Rising job loss and unemployment is now prevalent throughout South Florida along with new data showing population decline. As previously reported, working individuals and families had initially begun to leave South Florida due to the rising cost of housing. Now, working individuals and families are being forced to leave South Florida in search of new employment opportunities as well.
According to the Florida Agency for Workforce Innovation (AWI), South Florida has lost 39,600 private sector jobs since January, 2007 (Table 2.11). The highest job loss occurred in Broward County (17,100 jobs), followed by Palm Beach (12,400 jobs) and Miami-Dade (10,100 jobs) Counties. South Florida’s Construction industry, which was particularly impacted by housing market downturn, lost the most jobs (17,600 jobs) during the last 18 months, followed by Finance & Insurance (9,000 jobs) and Retail (5,900 jobs). While the Construction industry has accounted for a significant portion of the job loss in South Florida, there are differences among the three counties with respect to job loss within other industry sectors. In Broward County, the highest job loss occurred in Finance & Insurance (7,000 jobs) followed by Construction (4,900 jobs) and Retail Trade (2,000 jobs). In Miami-Dade County, the highest job loss occurred in Construction (7,600 jobs) followed by Administrative & Waste Services (4,000 jobs) and Professional and Business Services (3,300 jobs). In Palm Beach County, Construction (5,100 jobs) had the highest job loss followed by Retail Trade (2,800 jobs) and Manufacturing (1,700 jobs).
South Florida’s increasing job loss since 2007 has created significant spikes in the unemployment rates in the Tri-counties. According to AWI’s July, 2008 employment figures, Palm Beach County experienced the largest increase in the unemployment rate (4.9 to 6.9 percent), followed by Broward County (3.9 to 5.8 percent) and Miami-Dade County (4.1 to 5.4 percent).
The combination of the 18-month trend in private sector job loss and slowdown in South Florida’s overall population growth may require an adjustment to future workforce housing demand projections at some point. However, given the cyclical nature of housing and employment markets, current workforce housing demand projections, notwithstanding a protracted housing and employment decline, should remain valid estimates for South Florida for the near future.
Industry Title Jan-07 Jul-08 Job Loss % ChangeTotal South Florida Region Nonagricultural Employment 2,428,500 2,363,800 64,700 2.7%
Total Nonagricultural Employment 1,054,400 1,029,700 24,700 2.3%Total Private 897,700 887,600 10,100 1.1%Goods Producing 102,700 91,700 11,000 10.7%Construction 54,200 45,800 8,400 15.5%Total Government 156,700 142,100 14,600 9.3%Administrative and Waste Services 75,900 67,300 8,600 11.3%Total Government 156,700 142,100 14,600 9.3%Manufacturing 47,900 45,400 2,500 5.2%Professional and Business Services 148,700 141,100 7,600 5.1%
Total Nonagricultural Employment 789,000 766,900 22,100 2.8%Total Private 684,900 667,800 17,100 2.5%Goods Producing 93,100 84,100 9,000 9.7%Finance and Insurance 44,900 39,700 5,200 11.6%Construction 61,200 54,800 6,400 10.5%Financial Activities 67,300 60,800 6,500 9.7%Manufacturing 31,800 29,200 2,600 8.2%Total Government 104,100 99,100 5,000 4.8%Transportation, Warehousing, and Utilities 24,400 23,400 1,000 4.1%Retail Trade 103,700 100,100 3,600 3.5%
Total Nonagricultural Employment 585,100 567,200 17,900 3.1%Total Private 519,400 507,000 12,400 2.4%Goods Producing 65,800 56,900 8,900 13.5%Construction 45,700 39,500 6,200 13.6%Manufacturing 20,000 17,300 2,700 13.5%Total Government 65,700 60,200 5,500 8.4%Leisure and Hospitality 73,700 69,400 4,300 5.8%Wholesale Trade 24,000 22,800 1,200 5.0%Accommodation and Food Services 56,900 54,200 2,700 4.7%Retail Trade 74,500 71,000 3,500 4.7%
Broward County
Palm Beach County
Miami Dade County
Table 2.14: South Florida Private Sector Job Loss January 2007- July 2008
Source: FL AWI, July 2008.

South Florida Workforce Housing Needs Assessment
14
A. Background
This section provides a regional analysis of the key market factors and conditions effecting South Florida’s workforce housing supply, including a comparative profile of current housing values and affordability in Broward, Miami-Dade, and Palm Beach Counties.
Housing supply factors include the total number of units by type, price range, tenure (owner/renter) and absorption (units sold/rented). Housing supply analysis also considers development trends and conditions impacting the overall housing market such as the current foreclosure and mortgage credit issues in South Florida. Previous housing supply analyses of the Tri-counties have captured the dynamics of South Florida’s housing “boom and bust” aftermath with its spillover effects on both the regional housing market and larger economy. When combined with key housing demand factors, the data can be extrapolated to determine the relative balance between workforce housing demand and supply in South Florida.
B. Housing Inventory According to the 2006 American Community Survey, South Florida has a current housing inventory of 2,380,712 units. Miami-Dade County has the largest current inventory (953,031 units) followed by Broward (796,535 units) and Palm Beach (631,146 units) Counties. South Florida’s housing supply grew substantially since 2000, with accelerated growth occurring during the 2003-2005 residential building boom period followed by a sharp decrease in residential construction activity in the aftermath. South Florida’s housing inventory increased by 230,963 units (10.7 percent) from 2000-2006 an average of 32,995 units per year (Table 3.1 below). Miami-Dade County experienced the largest increase (100,753 units) followed by Palm Beach (74,718 units) and Broward (55,492 units) Counties.
Table 3.1: South Florida Inventory by Type, 2006
Miami-Dade
County Broward County Palm Beach
County South Florida
Region Single-family homes 505,904 329,531 343,402 1,178,837
Multi-family homes 432,110 441,577 268,004 1,141,691
Mobile homes and others 15,017 25,427 19,740 60,184
Total 953,031 796,535 631,146 2,380,712 Source: U.S Census, American Community Survey 2006.
C. Housing Occupancy and Vacancies Housing Occupancy South Florida’s housing is comprised of 1,357,812 owner-occupied units (57 percent) and 657,605 renter-occupied units (27.6 percent). From 2000-2006, South Florida had an increase of 99,828 owner occupied units and 10,195 renter-occupied units. Miami-Dade County had the largest increase (46,400 units) in owner-occupied units followed by Broward (27,454 units) and Palm Beach (25,974 units) Counties. The increase in renter-occupied units was small in comparison. Miami-Dade County had an increase of 5,620 renter-occupied units (1.7 percent increase) followed by Palm Beach County with an increase of 4,369 renter-occupied units (3.6 percent increase). Broward County had an increase of only 206 renter-occupied units (0.1 percent), though the County actually declined by 6,172 units from 2004 as a result of condominium conversions. South Florida’s small growth in renter-occupied units, as a whole, is attributable to the loss of existing rental units through condominium conversions and the general decline in new rental housing production activity. Housing Vacancies One of the critical findings from the recently completed workforce housing needs assessments of the Tri-counties is the substantial increase in housing vacancies that has occurred since 2000. There are currently 365,295 vacant units in South Florida. Since 2000, South Florida’s vacancies increased by 120,940 housing units or 49.4 percent. The largest increase in vacant units occurred in Miami-Dade County (48,733 units/64.5 percent increase) followed by Palm Beach (44,375 units/53.9 percent increase) and Broward (27,832 units/32.1 percent increase) Counties. The increases are attributed to the growing number of seasonal or second homes (168,372 vacant units) and the growing inventory of unsold vacant units on the market. The large increase in the number of vacant housing units held for seasonal use has become a major housing supply and demand factor in South Florida.
Miami-Dade County Broward County Palm Beach
County South Florida Region 2000 2006 2000 2006 2000 2006 2000 2006 Total: 75,504 124,237 86,598 114,430 82,253 126,628 244,355 365,295 For rent 20,508 20,581 13,975 14,360 11,396 13,970 45,879 48,911 Rented or sold, not occupied 5,529 6,180 5,636 12,355 4,186 10,061 15,351 28,596 For sale only 10,986 18,088 12,129 14,988 7,046 13,915 30,161 46,991 For seasonal, recreational, or occasional use 31,316 42,636 46,470 58,225 52,874 67,511 130,660 168,372 For migrant workers 78 387 12 0 270 167 360 554 Other vacant 7,087 26,678 8,376 14,502 6,481 21,004 21,944 62,184
III South Florida Workforce Housing Supply Analysis
Table 3.2: South Florida Housing Vacancy
Source: U.S Census, American Community Survey 2006.

South Florida Workforce Housing Needs Assessment
15
D. South Florida Residential Sales Activity As previously noted, South Florida’s unbridled residential real estate boom period left counties and individual municipalities with an “oversupply” of price-inflated, single-family homes and condominiums. Much of new residential construction activity targeted an external higher-end market rather than the housing demand of South Florida’s workforce. Higher sale prices for “new” single-family homes and condominiums also affected “existing” single-family home and condominium values. Prior housing needs assessments of the Tri-counties documented the inception and gradual demise of South Florida’s residential boom period. Residential sales activity peaked during 2003-2004 and coincided with the first substantial increases in the median sale price of existing single-family homes. Appreciating home values were fueled by a voracious level of sales activity and speculative investment.
Existing Single-Family Homes As previously noted, South Florida’s “existing” single-family home market began to escalate in 2003. Broward County’s existing single-family home sales activity peaked during 2003 with 15,163 sales at a median sale price of $228,600. The 2003 median sales price represented a 16 percent increase from 2002. In 2004 and 2005 Broward County’s median sales price sales would increase by 22 and 29 percent, respectively, while sales activity steadily declined. Miami-Dade and Palm Beach Counties experienced a very similar pattern. In Miami-Dade County the level of existing single-family home sales activity peaked in 2004 with 12,622 sales at a median sale price of $273,900. The median sales price represented a 21 percent increase from 2002. In 2004 and 2005 the median sales price of an existing single-family home in Miami-Dade County increased by 23 and 28 percent, respectively. In Palm Beach County existing single-family home sales activity peaked in 2003 with 15,417 sales at a median sale price of $241,300. The 2003 median sales price represented a 24 percent increase from 2002. In 2004 and 2005 the median sales price of an existing single-family home in Palm Beach County increased by 25 and 30 percent, respectively. In 2006 the year-end median sales price of an existing single-family home peaked in Broward ($367,800) and Palm Beach Counties ($384,700). In Miami-Dade County the year-end median sales price ($380,100) peaked in 2007. During 2006-2007 the level of sales activity plummeted in all three counties. While median sales prices peaked during this period, the level of sales activity from 2003 to 2007 decreased by 60 percent (6,127 units) in Broward County; 58 percent (5,289 units) in Miami-Dade County; and 55 percent (6,971 units) in Palm Beach County.
During the first 7 months of 2008 existing single-family home sales activity continued to decline in all three counties with a coinciding decrease in the median sales price from 2007. Through July 2008, there were 3,398 sales in Broward County with a 15.8 percent decrease ($305,400) in the median sales price. In Miami-Dade County there were 2,250 sales through July with a 15.5 percent decrease ($320,900) in the median sales price. In Palm Beach County there were 4,102 sales through July, 2008 and a 10.4 percent decrease ($330,900) in the median sales price.
New Single-Family Homes South Florida’s “new” single-family home market has varied considerably from the existing single-family home market. The variance is largely due to the location of new single-family home construction activity. In Broward County, new single-family home sales activity peaked in 1997 (11,622 sales) during the height of the county’s westward expansion and gradual build-out. Broward County has since experienced a steady decrease in new single-family home sales with only 1,748 units sold in 2006 and 2,227 in 2007. The increase in sales during 2007 was attributed to higher-priced new construction activity in the Hollywood/Hallandale/Pembroke Pines sub-market. New single-family home prices have been trending higher since 2006. The median sales price of a new single-family home increased from $317,727 in 2005 to $533,490 in 2006, representing a 67.9 percent median price increase in one year. In 2007, the median sales price decreased slightly to $526,865 (1.2 percent decrease). In Miami-Dade County, new single-family homes sales peaked (12,749 sales) in 2005 and held steady in 2006. In 2007 new single-family home sales activity plummeted to 5,420 sales representing a 55.2 percent decrease. The median sales price reached a high of $356,813 during the Fourth Quarter of 2006. The median sales price in 2007 was $330,092, which represented a 7.2 percent decrease from 2006. The largest construction of activity occurred in the Perine/Cutler Ridge sub-market. Palm Beach County’s new single-family home sales peaked in 2003 (12,242 sales) and have steadily declined from 2004-2007. In 2007 there were 3,101 sales which were down from 7,865 sales (60 percent decrease) in 2006. A 37.5 percent drop in sales during the second quarter of 2007 was the largest decrease in sales since the downturn in the residential market began in the latter part of 2005. The 2007 median sales price of $476,031 represented a 4.3 percent decrease from 2006. The highest level of sales activity in 2007 occurred in the Boynton Beach and Jupiter/Tequesta/Juno Beach/Singer Island sub-market. Existing Condominiums South Florida’s existing condominium prices and sales activity peaked later than the existing single-family home market. In Broward County the year-end median sale price increased from $189,900 in 2005 to $208,600 in 2006 or 10 percent. However, in 2006 and 2007 existing condominium sales activity plummeted with the number of sold units decreasing from 13,253 in 2005 to 6,533 in 2007 or 50 percent. The 2007 median sales price of $187,600 represented an additional 10 percent decrease from 2006. In Miami-Dade County the year-end median sale price of an existing condominium increased from $255,100 in

South Florida Workforce Housing Needs Assessment
16
2005 to $257,500 in 2006 and $272,000 in 2007. However, a significant decrease in sales activity was evident by 2006 with a more substantial decrease occurring in 2007. Miami-Dade County’s existing condominium sales activity plummeted from 13,009 units sold in 2005 to 5,772 units in 2007, a decrease of 56 percent. In Palm Beach County the year-end median sales price of an existing condominium increased from $193,100 in 2005 to $220,400 in 2006 or 14 percent. Similar to Broward and Miami-Dade Counties, sales activity in Palm Beach County decreased significantly in 2006 and again in 2007 accompanied by a 10 percent decline in the median price to $198,000. Existing condominium sales activity in Palm Beach County decreased from 8,558 units sold in 2005 to 5,674 units in 2007 or 34 percent. While there has been some increase in monthly sales activity during
the first 7 months of 2008, the overall sales of existing condominiums in South Florida is lower than 2007. Through July, 2008 there have been 3,364 existing condominium sales in Broward County, 3,041 sales in Miami-Dade County and 3,739 sales in Palm Beach County. Only in Palm Beach County are existing condominium sales on a pace to exceed 2007 sales activity. Existing condominium sales prices in South Florida have continued to decrease through the first 7 months of 2008. Palm Beach County has experienced the largest decrease ($156,400/ 21 percent decrease) among the Tri-counties followed by Broward ($153,000/18 percent decrease) and Miami-Dade ($263,900/3 percent increase) Counties. New Condominiums South Florida’s “new” condominium sales activity peaked in 2005-2006 and subsided in 2007. In Broward County, new condominium sales activity has steadily decreased since 2006. Following a brief increase in activity during the first two quarters of 2006, activity sharply declined in the Third Quarter (55 percent decrease) of 2006 and has remained soft through 2007. New condominium sales activity decreased from 14,233 units in 2006 to 7,904 units in 2007, representing a 44.5 percent reduction in sales. The median sales price of new condominium units in Broward County increased significantly during 2006 and 2007 reflecting more upscale new construction and sales activity within an overall condominium market that has seen steady median price decreases. The median sales price of $265,891 in 2007 represented a 14.7 percent increase from 2006. During the Fourth Quarter of 2007, the highest number of sales was in the $250,000-$349,999 price range. In Miami-Dade County, new condominium sales activity peaked in 2005 and steadily decreased in 2006 and 2007. Sales decreased from 19,654 units in 2006 to 13,516 units in 2007, representing a 31.2 percent reduction in sales. Similar to Broward County, a rise in the median sales price in 2007 reflected more upscale construction and sales activity. The 2007 median sales price of $273,900 represented a 17.7 increase from 2006 with the highest number of sales during the Fourth Quarter occurring in the $350,000-$499,999 price range.
New condominium sales activity in Palm Beach County peaked during the first half of 2006 and then decreased in the second half and throughout 2007. There were 7,585 sales in 2006 followed by 4,647 sales in 2007, representing a 38.7 percent decrease. The $260,857 median sales price represented a 6.5 percent reduction in price from 2006. During the Fourth Quarter of 2007, the highest number of sales occurred in the $250,000-$349,999 price range. E. Rental Housing Market As previously discussed, growth in South Florida’s rental housing market has been minimal in comparison to the homebuyer market. The small growth in South Florida’s rental housing supply has been largely impacted by widespread condominium conversions during 2003-2005 and the general decline in new rental housing production activity. Rental housing production in the past two years has been limited to several Lower Income Tax Credit developments. In Broward County, rental housing starts decreased from a high of 3,978 units in 2003 to only 646 units in 2007. Rental housing completions have decreased from a high of 2,820 units in 2004 to 650 units in 2007. Recent rental housing development activity has largely occurred in the Pembroke Pines/Miramar sub-market. Broward County’s rental vacancy rate in February 2008 was 5.5 percent which was up slightly from the previous year. The average monthly rent is currently $1,220 which is 1.1 percent higher than 2007.
In Miami-Dade County, rental housing starts decreased from a high of 4,372 units in 2003 to 141 units in 2006. In 2007, Miami-Dade’s rental housing starts increased to 741 units. Rental housing completions decreased from a high of 2,528 units in 2002 to 179 units in 2006. Completions also increased slightly in 2007 to 305 units. Rental development activity in 2007 occurred in the N.E./N.W. Miami and Miami Lakes/Hialeah/Miami Springs/Flagler North sub-markets. Miami-Dade County’s vacancy rate in February 2008 was a low 3.0 percent and down slightly from 3.5 percent in 2006. The average monthly rent of $1,216 is up 2.9 percent from 2007.
In Palm Beach County, rental housing starts decreased from a high of 3,403 units in 2002 to only 50 units in 2007. Rental housing completions have decreased from a high of 3,713 units in 2002 to 128 units in 2007. The only recent rental housing development activity has occurred in the West Palm Beach sub-market. Palm Beach County’s rental vacancy rate in February 2008 was 7.0 percent up from 5.8 percent the previous year. The average monthly rent is currently $1,189 which is 2.9 percent lower than 2007.
South Florida’s Tax Credit developments represent a significant share of the affordable housing supply. There are currently 120 Tax Credit developments in the Tri-counties totaling 24,115 rental housing units. The average monthly rents range from $771 in Miami-Dade County to $852 in Broward County. Vacancy rates are extremely low in Miami-Dade (0.5 percent) and Broward (1.4 percent) Counties. Palm Beach
The small growth in South Florida’s rental housing supply has been largely impacted by widespread condominium conversions during 2003-2005 and the general decline in new rental housing production activity

South Florida Workforce Housing Needs Assessment
17
County has a significantly higher vacancy rate (7.4 percent) among Tax Credit developments which is reflective of the overall vacancies in the county’s rental housing market.
F. Housing Affordability
Single-Family Homes A major finding in the 2006 and 2007 workforce/affordable housing needs assessments of Broward, Miami-Dade and Palm Beach Counties was the substantial gap created during South Florida’s residential real estate boom in the median single-family home price – to – median household income ratio, an important economic indicator in determining the general health and viability of a local housing market. The needs assessments showed that the ratio widened from approximately 4:1 in 2003-2004 to greater than 7:1 during the height of appreciation during 2005/2006.
As previously noted, the sharp increase in single-family home values in South Florida was largely due to external demand factors coupled with unbridled market speculation. During the height of the boom period (2003-2005) when single family home values in South Florida were appreciating an average of 25 percent per year, the median household income in South Florida was growing at only 2-3 percent annually. Since 2005, single-family home values in South Florida have steadily declined. Despite the overall decrease in home prices the current (July, 2008) median single-family price-to-median household income ratio is 5:1- 6:1 in Broward and Palm Beach Counties and over 7:1 in Miami-Dade County.
An updated affordability analysis of the Tri-counties and larger municipalities, where the largest concentrations of the resident workforce reside, shows significant affordability gaps persist for single-family homes in most areas of South Florida. In Broward County, the affordability gap is currently $38,749 with much higher gaps in individual municipalities, including Fort Lauderdale ($178,129), Lauderhill ($110,170) and Davie ($114,106). Miami-Dade County’s affordability gap ($145,123) is the largest among the three counties with extreme gaps in most municipalities. Palm Beach County’s current affordability gap for a single-family home is $78,467, with the highest municipal gaps found in Delray Beach ($149,312), Palm Beach Gardens ($113,306) and Jupiter ($85,227).
As previously noted, housing affordability is defined as housing costs that do not exceed 30 percent of a household’s monthly gross income. The computation to determine housing affordability (gap/surplus) was performed using the current median sales price for a single-family home and condominium/townhome in relation to the median household income of each municipality. Favorable financing terms are applied (fixed 30-year mortgage at 6.5 percent interest) with taxes, based on local millage rates, and insurance included. Debt ratios are not factored into the housing affordability calculations. Due to the recent tightening of the mortgage credit market, affordability calculations now include a 20 percent down payment. While a 20 percent down payment would reduce a homebuyer’s monthly payment on the principal, the substantial upfront cost coupled with a contracted mortgage credit market has created added obstacles to affordable home purchase in South Florida.
Table 3.3: South Florida Region Housing Affordability 2007, 2008 Affordable * Home Price
Affordability Gap
SF $385,000 $249,400MF $265,000 $129,400SF $310,000 $170,353MF $289,000 $149,353SF $385,000 $209,800MF $190,000 $14,800SF $300,000 $137,367MF $150,000 $12,633SF $362,250 $178,650MF $199,000 $15,400SF $315,000 $132,792MF $151,000 $31,208
Palm Beach County
2007 HH Income $61,200 $183,600
2008 HH Income $60,736 $182,208
Broward County
2007 HH Income $58,400 $175,200
2008 HH Income $54,211 $162,633
Median Selling Price
Miami-Dade County
$135,600
$139,647
$45,200
$46,549
2007 HH Income
2008 HH Income
Source: U.S. Census Bureau, American Community Survey 2006 and 2007. Bureau of Labor Statistics and Bankrate.com. Table tabulated by the FIU Metropolitan Center *Methodology is based on a 3:1home value to median household income ratio.
Despite the overall decrease in home prices the current (July, 2008) median single-family price-to-median household income ratio is 5:1 - 6:1 in Broward and Palm Beach Counties and over 7:1 in Miami-Dade County. This remains well-above the standard affordability ratio of approximately 3:1

South Florida Workforce Housing Needs Assessment
18
Table 3.4: Palm Beach County Single Family Affordability, 2007
Municipality
^2007 Median HH
Income
Affordable Home Price @
Median
Median Selling Price
2007Number of Sales 2007
Affordability Gap @ Median
Boca Raton $76,007 $326,194 $460,000 1,339 $133,806Boynton Beach $50,267 $215,729 $309,950 988 $94,221Delray Beach $54,715 $234,833 $425,000 613 $190,167Greenacres City $46,604 $200,019 $270,000 128 $69,981Jupiter $69,317 $297,461 $420,000 637 $122,539Lake Worth $37,890 $162,630 $297,000 97 $134,370Palm Beach Garden $75,411 $323,622 $495,000 587 $171,378Riviera Beach $40,510 $173,859 $183,000 54 $9,141Royal Palm Beach $69,091 $296,529 $310,000 288 $13,471Wellington $88,652 $380,472 $401,000 588 $20,528West Palm Beach $46,393 $199,096 $299,900 908 $100,804Palm Beach County $61,200 $262,645 $362,250 7,756 $99,605Source: FIU Metropolitan Center, U.S. Census Bureau, Bureau of Labor Statistics and Bankrate.com, 2008.
Table 3.5: Palm Beach County Multi-Family Affordability, 2007
Municipality
^2007 Median HH
Income
Affordable Home Price @
MedianMedian Selling
Price 2007Number of Sales 2007
Affordability Gap @ Median
Boca Raton $76,007 $325,590 $225,000 1,304 $100,590Boynton Beach $50,267 $219,391 $200,000 708 $19,391Delray Beach $54,715 $231,004 $145,000 978 $86,004Greenacres City $46,604 $204,657 $163,000 186 $41,657Jupiter $69,317 $308,871 $265,000 413 $43,871Lake Worth $37,890 $163,334 $130,000 312 $33,334Palm Beach Garden $75,411 $322,175 $219,000 278 $103,175Riviera Beach $40,510 $165,295 $230,000 45 $64,705Royal Palm Beach $69,091 $293,074 $190,000 129 $103,074Wellington $88,652 $375,281 $240,000 140 $135,281West Palm Beach $46,393 $201,660 $152,000 86 $49,660Palm Beach County $61,200 $265,725 $199,000 6,408 $66,725Source: FIU Metropolitan Center, U.S. Census Bureau, Bureau of Labor Statistics and Bankrate.com, 2008.
Table 3.6: Palm Beach County Single Family Affordability, 2008
Municipality^2008 Median
HH IncomeAffordable Home Price @ Median
Median Selling
Price 2008Number of Sales
2008Affordability Gap
@ MedianBoca Raton $78,341 $323,069 $400,000 552 $76,931Boynton Beach $51,811 $195,017 $265,000 460 $69,983Delray Beach $56,396 $215,688 $365,000 256 $149,312Greenacres City $48,035 $180,149 $170,000 48 $10,149Jupiter $71,446 $289,773 $375,000 276 $85,227Lake Worth $39,054 $135,308 $265,000 325 $85,227Palm Beach Garden $77,727 $315,194 $428,500 152 $113,306Riviera Beach $41,754 $145,986 $140,000 33 $5,986Royal Palm Beach $71,213 $286,635 $242,500 118 $44,135Wellington $91,374 $378,283 $381,000 252 $2,717West Palm Beach $47,818 $174,907 $240,000 351 $65,093Palm Beach County $60,736 $236,533 $315,000 3207 $78,467 Source: FIU Metropolitan Center, U.S. Census Bureau, Bureau of Labor Statistics and Bankrate.com, 2008.
Table 3.7 Palm Beach County Multi-Family Affordability, 2008
Municipality
^2008 Median HH
Income
Affordable Home Price @
Median
Median Selling Price
2008Number of Sales 2008
Affordability Gap @ Median
Boca Raton $78,341 $326,194 $178,000 569 $148,194Boynton Beach $51,811 $215,729 $157,500 324 $58,229Delray Beach $56,396 $234,833 $98,000 506 $136,833Greenacres City $48,035 $200,019 $122,000 64 $78,019Jupiter $71,446 $297,461 $251,850 210 $45,611Lake Worth $39,054 $162,630 $73,500 148 $89,130Palm Beach Garden $77,727 $323,622 $180,000 192 $143,622Riviera Beach $41,754 $173,859 $163,000 27 $10,859Royal Palm Beach $71,213 $296,529 $143,000 36 $153,529Wellington $91,374 $380,472 $240,000 53 $140,472West Palm Beach $47,818 $199,096 $96,000 398 $103,096Palm Beach County $60,736 $262,645 $151,000 2830 $111,645 Source: FIU Metropolitan Center, U.S. Census Bureau, Bureau of Labor Statistics and Bankrate.com, 2008.

South Florida Workforce Housing Needs Assessment
19
Table 3.8: Broward County Single Family Affordability, 2007
Municipality^2007 Median
HH Income
Affordable Home Price @
MedianMedian Selling
Price 2007Number of Sales 2007
Affordability Gap @ Median
Coral Springs $73,750 $295,841 $405,000 720 $109,159Davie $59,311 $226,597 $395,000 547 $168,403Deerfield Beach $42,945 $151,232 $300,000 215 $148,768Fort Lauderdale $47,797 $175,202 $370,000 932 $194,798Hallandale Beach $35,659 $119,632 $272,500 48 $152,868Hollywood $46,317 $165,502 $280,000 713 $114,498Lauderdale Lakes $33,977 $109,893 $265,000 71 $155,107Lauderhill $41,020 $142,423 $278,000 129 $135,577Miramar $63,443 $245,281 $375,000 669 $129,719Pembroke Pines $66,395 $260,417 $374,000 892 $113,583Plantation $67,804 $267,530 $385,000 409 $117,470Pompano Beach $45,508 $165,548 $257,500 382 $91,952Sunrise $51,722 $191,475 $294,950 390 $103,475Weston $101,291 $431,148 $540,000 628 $108,852Broward County $58,400 $223,567 $385,000 8918 $161,433 Source: FIU Metropolitan Center, U.S. Census Bureau, Bureau of Labor Statistics and Bankrate.com, 2008.
Table 3.9: Broward County Multi-Family Affordability, 2007
Municipality^2007 Median
HH Income
Affordable Home Price @
Median
Median Selling Price
2007Number of Sales 2007
Affordability Gap @ Median
Coral Springs $73,750 $316,512 $179,950 406 $136,562Davie $59,311 $254,557 $205,500 340 $49,057Deerfield Beach $42,945 $184,313 $110,000 704 $74,313Fort Lauderdale $47,797 $205,121 $329,000 1209 $123,879Hallandale Beach $35,659 $153,052 $215,000 539 $61,948Hollywood $46,317 $198,784 $200,000 674 $1,216Lauderdale Lakes $33,977 $145,797 $97,000 141 $48,797Lauderhill $41,020 $176,026 $113,450 350 $62,576Miramar $63,443 $272,275 $259,950 273 $12,325Pembroke Pines $66,395 $284,944 $190,000 737 $94,944Plantation $67,804 $290,972 $186,500 376 $104,472Pompano Beach $45,508 $195,287 $191,000 711 $4,287Sunrise $51,722 $221,962 $105,000 534 $116,962Weston $101,291 $434,703 $255,000 232 $179,703Broward County $58,400 $250,643 $190,000 9259 $60,643 Source: FIU Metropolitan Center, U.S. Census Bureau, Bureau of Labor Statistics and Bankrate.com, 2008.
Table 3.10: Broward County Single Family Affordability, 2008
Municipality^2008 Median
HH Income
Affordable Home Price @
Median
Median Selling Price
2008Number of Sales 2008
Affordability Gap @ Median
Coral Springs $76,015 $306,251 $345,000 304 $38,749Davie $61,133 $234,814 $349,000 173 $114,186Deerfield Beach $44,264 $157,194 $240,000 79 $82,806Fort Lauderdale $49,265 $181,871 $360,000 371 $178,129Hallandale Beach $36,755 $124,602 $194,900 21 $70,298Hollywood $47,740 $171,864 $240,000 273 $68,136Lauderdale Lakes $35,020 $114,591 $174,500 19 $59,909Lauderhill $42,280 $148,830 $259,000 43 $110,170Miramar $65,391 $254,107 $311,383 246 $57,276Pembroke Pines $68,434 $269,727 $317,000 318 $47,273Plantation $69,887 $277,082 $339,900 153 $62,818Pompano Beach $46,906 $171,969 $199,000 147 $27,031Sunrise $53,310 $198,697 $223,500 132 $24,803Weston $105,221 $449,494 $421,000 261 $28,494Broward County $54,211 $204,473 $300,000 3281 $38,749 Source: FIU Metropolitan Center, U.S. Census Bureau, Bureau of Labor Statistics and Bankrate.com, 2008.
Table 3.11: Broward County Multi-Family Affordability, 2008
Municipality
^2008 Median HH
Income
Affordable Home Price @
Median
Median Selling Price
2008Number of Sales 2008
Affordability Gap @ Median
Coral Springs $76,015 $326,243 $125,500 112 $200,743Davie $61,133 $262,339 $167,500 75 $94,839Deerfield Beach $44,264 $189,977 $66,000 344 $123,977Fort Lauderdale $49,265 $211,407 $299,900 497 $88,493Hallandale Beach $36,755 $157,741 $200,000 252 $42,259Hollywood $47,740 $204,866 $216,000 243 $11,134Lauderdale Lakes $35,020 $150,277 $65,000 54 $85,277Lauderhill $42,280 $181,433 $70,750 96 $110,683Miramar $65,391 $280,620 $195,000 84 $85,620Pembroke Pines $68,434 $293,697 $115,000 250 $178,697Plantation $69,887 $299,930 $161,500 96 $138,430Pompano Beach $46,906 $201,309 $161,500 338 $39,809Sunrise $53,310 $228,807 $55,000 199 $173,807Weston $105,221 $451,547 $200,000 55 $251,547Broward County $54,211 $232,670 $150,000 3,383 $82,670 Source: FIU Metropolitan Center, U.S. Census Bureau, Bureau of Labor Statistics and Bankrate.com, 2008.

South Florida Workforce Housing Needs Assessment
20
Table 3.12: Miami-Dade County Single Family Affordability, 2007
Municipality^2007 Median
HH Income
Affordable Home Price @
Median
Median Selling Price
2007Number of Sales 2007
Affordability Gap @ Median
Aventura $53,613 $204,746 $769,000 25 $564,254Coral Gables $80,479 $324,949 $849,000 329 $524,051Hialeah $35,511 $117,945 $339,900 284 $221,955Hialeah Gardens $46,788 $167,281 $320,000 29 $152,719Homestead $32,239 $101,545 $285,000 448 $183,455City of Miami $29,266 $87,470 $365,000 3992 $277,530Miami Beach $32,898 $132,625 $1,250,000 161 $1,117,375Miami Gardens $45,782 $162,328 $262,500 176 $100,172Miami Lakes $73,626 $295,060 $545,000 91 $249,940North Miami $35,855 $115,782 $299,900 129 $184,118North Miami Beach $37,780 $124,297 $285,000 133 $160,703Miami-Dade County $45,200 $158,876 $385,000 6984 $226,124Source: FIU Metropolitan Center, U.S. Census Bureau, Bureau of Labor Statistics and Bankrate.com, 2008.
Table 3.13: Miami-Dade County Multi-Family Affordability, 2007
Municipality^2007 Median
HH Income
Affordable Home Price @
Median
Median Selling Price
2007Number of Sales 2007
Affordability Gap @ Median
Aventura $53,613 $214,714 $325,000 560 $110,286Coral Gables $80,479 $334,916 $355,000 99 $20,084Hialeah $35,511 $127,912 $185,000 273 $57,088Hialeah Gardens $46,788 $177,248 $206,500 40 $29,252Homestead $32,239 $111,512 $163,750 151 $52,238City of Miami $29,266 $97,437 $230,000 2570 $132,563Miami Beach $32,898 $141,163 $340,000 1075 $198,837Miami Gardens $45,782 $172,295 $164,100 39 $8,195Miami Lakes $73,626 $305,028 $250,000 89 $55,028North Miami $35,855 $125,750 $158,250 690 $32,500North Miami Beach $37,780 $134,264 $160,000 181 $25,736Miami-Dade County $45,200 $168,843 $265,000 6358 $96,157Source: FIU Metropolitan Center, U.S. Census Bureau, Bureau of Labor Statistics and Bankrate.com, 2008.
Table 3.14: Miami-Dade County Single Family Affordability, 2008
Municipality
^2008 Median HH
Income
Affordable Home Price @
Median
Median Selling Price
2008Number of Sales 2008
Affordability Gap @ Median
Aventura $54,738 $209,971 $625,000 12 $415,029Coral Gables $82,168 $332,631 $665,000 128 $332,369Hialeah $36,256 $121,318 $265,000 84 $143,682Hialeah Gardens $47,770 $171,710 $295,000 8 $123,290Homestead $32,916 $104,561 $220,000 154 $115,439City of Miami $30,843 $94,663 $285,000 1222 $190,337Miami Beach $33,588 $108,206 $1,400,000 59 $1,291,794Miami Gardens $48,315 $173,690 $200,000 34 $26,310Miami Lakes $75,171 $302,176 $380,000 28 $77,824North Miami $36,607 $119,136 $217,500 34 $98,364North Miami Beach $38,573 $127,807 $194,000 33 $66,193Miami-Dade County $46,549 $164,877 $310,000 2188 $145,123 Source: FIU Metropolitan Center, U.S. Census Bureau, Bureau of Labor Statistics and Bankrate.com, 2008.
Table 3.15: Miami-Dade County Multi-Family Affordability, 2008
Municipality
^2008 Median HH
Income
Affordable Home Price @
MedianMedian Selling
Price 2008Number of Sales 2008
Affordability Gap @ Median
Aventura $54,738.00 $220,038.00 $299,000.00 275 $78,962Coral Gables $82,168.00 $342,598.00 $445,000.00 31 $102,402Hialeah $36,256.00 $131,285.00 $150,000.00 55 $18,715Hialeah Gardens $47,770.00 $181,677.00 $203,950.00 10 $22,273Homestead $32,916.00 $144,528.00 $120,000.00 49 $24,528City of Miami $30,843.00 $110,827.00 $220,000.00 814 $109,173Miami Beach $33,588.00 $118,174.00 $360,000.00 197 $241,826Miami Gardens $48,315.00 $183,657.00 $73,250.00 4 $110,407Miami Lakes $75,171.00 $312,143.00 $232,500.00 20 $79,643North Miami $36,607.00 $129,103.00 $104,000.00 34 $25,103North Miami Beach $38,573.00 $137,774.00 $134,950.00 41 $2,824Miami-Dade County $46,549.00 $174,845.00 $289,000.00 2362 $114,155 Source: FIU Metropolitan Center, U.S. Census Bureau, Bureau of Labor Statistics and Bankrate.com, 2008.

South Florida Workforce Housing Needs Assessment
21
Condominiums As previously noted, existing condominium sales prices in South Florida have continued to decrease through the first 7 months of 2008. Price decreases range from 3 percent in Miami-Dade County to 21 percent in Palm Beach County. New condominium unit prices increased in 2007 in Miami-Dade County (17.7 percent) and Broward County (14.7 percent) and decreased slightly in Palm Beach County (6.5 percent).
While the overall price of existing condominiums has steadily decreased in the past two years, the level of affordability is somewhat arbitrary due to increasing monthly condo fees and maintenance costs. In Broward County, there is an $82,670 affordability “surplus” based on the current (July, 2008) $150,000 median sale price of an existing condominium. However, substantial affordability gaps remain in Fort Lauderdale ($88,493), Hallandale Beach ($42,259) and Hollywood ($11,134). In Miami-Dade County, affordability gaps are more widespread. There is currently a $114,155 gap at the county level based on a median sale price of $289,000. Further, substantial gaps exist in Miami-Beach ($241,826), City of Miami ($109,155) and Coral Gables ($102,402). In Palm Beach County, an affordability surplus of $111,645 exists at the county level based on a current median sale price of $151,000. No affordability gaps currently exist in Palm Beach County’s major municipalities.
Rental Housing Previous workforce housing needs assessments have found that South Florida’s rental housing inventory is the principal source of available and affordable housing for low- and moderate-income households. This is due to the fact that 60-65 percent of South Florida’s renter households earn less than 50 percent of their respective area median income (AMI). Significantly, 85-90 percent of renter households earning less than $35,000 per year are cost-burdened (paying rent in excess of 30 percent of gross monthly income). The significant increase in “vacant seasonal” homes in South Florida since 2000 has impacted both the availability and affordability of rental housing. Decreasing vacancy rates in many locations have resulted in rising rent prices. In fact, rent affordability gaps are substantial in many municipalities with high concentrations of the resident workforce (see Tables 3.3-3.13). As previously noted, the average rent in South Florida’s Tri-counties has increased significantly since 2000. Despite general decreases in housing prices, average rents in Broward ($1,220) and Miami-Dade ($1,216) Counties increased during the past year and decreased only slightly in Palm Beach County ($1,189).
County
Median Household
Income
Low Income
50% AMI
Monthly Household
Income
Affordable Rent @ 30% of Income
Mean Rent
Affordability Gap @ Median
Broward County $54,211 $27,106 $2,259 $678 $1,222 $544 Miami-Dade County $46,549 $23,275 $1,940 $582 $1,212 $630 Palm Beach County $60,736 $30,368 $2,550 $765 $1,180 $415
County
Median Household
Income
Moderate Income
50%-80% AMI
Monthly Household
Income
Affordable Rent @ 30% of Income
Mean Rent
Affordability Gap @ Median
Broward County $54,211 $43,369 $3,614 $1,084 $1,222 $138 Miami-Dade County $46,549 $37,239 $3,103 $931 $1,212 $281 Palm Beach County $60,736 $48,589 $4,080 $1,224 $1,180 $44
Table 3.16: Rental Affordability by County, 3rd Quarter 2008
Source: Reinhold P. Woflf 3rd Quarter 2008, FIU Metropolitan Center, U.S. Census Bureau and Bureau of Labor Statistics.
Rent affordability gaps are substantial in many municipalities with high concentrations of the resident workforce

South Florida Workforce Housing Needs Assessment
22
G. Other Affordability Factors
Prior housing needs assessments have shown that South Florida’s housing affordability issues are the result of a combination of supply and demand factors. On the supply side of the equation, unbridled high-end residential development and speculative investment created an “oversupply” of new housing priced out-of-reach of most working households. This was coupled with the loss of a significant portion of the rental housing inventory through condominium conversions. On the demand side, working households in the service sector of the regional economy, which comprises South Florida’s largest employment base, had incomes that remained relatively stagnant during the height of the building boom. As a result, full-time working households in these fast-growing but low-wage occupations have become increasingly cost-burdened. South Florida’s housing market downturn has exacerbated what was already considered to be an affordable housing crisis. Increasing job loss and rising unemployment attributed to the spillover effects of the housing bust has made it increasingly difficult for many working households in South Florida. Housing foreclosures are currently impacting most neighborhoods in South Florida and the pipeline continues to grow with new delinquencies. Reports are now beginning to show that in addition to the subprime lending problem, a rise in both mortgage and overall debt is evident. Contributing to this problem is that many lenders severely relaxed loan-to-value ratios to attract customers. In addition, many households have substituted mortgage debt for other debt, using home equity loans and lines of credit to pay off credit cards and other expenses. By the Federal Reserve’s measure, nominal consumer debt rose by 21 percent between 2002 and 2006, while mortgage debt was up by 62 percent. As house prices climbed during the recent boom, homeowners used their equity gains to add nearly equal amounts to their debt rather than strengthen their balance sheets. Meanwhile, American Housing Survey estimates indicate that the share of homeowners with negative net equity (owing more than their homes are worth) was already over three percent in 2005, and up to 13 percent among owners that had bought in the prior two years.

South Florida Workforce Housing Needs Assessment
23
H. Home Foreclosures
The national home foreclosure crisis and accompanying economic effects have impacted most states. However, much of fallout from foreclosures is being driven by the level of activity among a few states including the State of Florida. According to the Mortgage Bankers Association (MBA) National Delinquency Survey for the First Quarter of 2008, Florida has the highest “seriously delinquent” and “foreclosure inventory” rates in the country. Second Quarter 2008 statistics showed an increase in foreclosure activity from 2007. Foreclosure actions include default notices, auction notices and bank possessions or REOs. Foreclosure actions in Florida involved 12.82 per 1,000 households, an increase of 181.8 percent from the Second Quarter of 2007. In addition, July, 2008 figures from the Federal Reserve Bank show 20.4 percent of Florida’s subprime mortgages in foreclosure, a 2.4 percent increase from last year. Future problems also exist as 60.4 percent of subprime mortgagees show at least one late payment in the past 12 months and 38.6 percent will have adjustable rate mortgage (ARM) resettings in the next 12 months.
In South Florida, each of the Tri-counties was included in the “Top 20” metropolitan areas in the country with the highest foreclosure rates in the Second Quarter, 2008. The Fort Lauderdale MSA with a 19.53 foreclosure rate per 1,000 households ranked 6th in the country followed by the Miami (16.01/ranked 10th) and Palm Beach (11.32/ranked 18th) MSAs. The rise in home foreclosures in South Florida is the result of several factors, including the proliferation of the subprime lending market during the height of the building boom, speculative investment and predatory lending practices.
The home foreclosure crisis exacerbated an already volatile market in South Florida brought on by an oversupply of price-inflated housing. Foreclosure auctions and the downward pressure they create as banks try to unload distressed properties have depressed sales prices in neighborhoods and municipalities. In addition, “short sales,” wherein lenders often forgive the remaining debt on a home to complete the sale and list properties with an asking price below the amount due on a mortgage, have further depressed surrounding home values. While no county or municipality in South Florida has been spared from the rampant increase in home foreclosures, there are discernible spatial concentrations of foreclosure activity. In all three counties, the level of foreclosure activity is generally highest in zip codes that experienced significant levels of new housing construction during the South Florida building boom. In Miami-Dade County, the highest level of foreclosure activity has occurred in the areas in and around Homestead, Hialeah, Miami Lakes and SW Miami-Dade County. In Broward County, the highest foreclosure activity has occurred in Miramar and Pembroke Pines. Other areas with high levels of activity include Lauderdale Lakes, Margate and the western neighborhoods of Pompano Beach. In Palm Beach County, the highest levels of activity have occurred in Royal Palm Beach, Wellington, Greenacres and the western neighborhoods of West Palm Beach.
10,230
18,126
18,525
23,506
2,966
10,139
46,881
10,401
0 5,000 10,000 15,000 20,000 25,000 30,000 35,000 40,000 45,000 50,000
South Florida Region
Palm Beach
Broward
Miami-Dade
# Preforeclosures # Bank Owned
Zipcode County Pre-foreclosures Zipcode CountyBank
Owned33015 Miami-Dade 650 33033 Miami-Dade 48033033 Miami-Dade 649 33032 Miami-Dade 31433176 Miami-Dade 544 33177 Miami-Dade 30033157 Miami-Dade 539 33160 Miami-Dade 29633177 Miami-Dade 532 33131 Miami-Dade 29533025 Broward 852 33064 Broward 76233065 Broward 776 33025 Broward 46433023 Broward 775 33313 Broward 44333068 Broward 728 33065 Broward 43533321 Broward 706 33063 Broward 38433411 Palm Beach 779 33411 Palm Beach 23933463 Palm Beach 622 33414 Palm Beach 16133414 Palm Beach 518 33463 Palm Beach 14733415 Palm Beach 470 33470 Palm Beach 12833409 Palm Beach 434 33415 Palm Beach 127
Figure 3.1: South Florida Foreclosures by County
Table 3.17: South Florida Foreclosures by County and Zip Code
Source: RealtyTrac, 2008.
Source: RealtyTrac, 2008.
The rise in home foreclosures in South Florida is the result of several factors, including the proliferation of the subprime lending market during the height of the building boom, speculative investment and predatory lending practices

South Florida Workforce Housing Needs Assessment
24
Figure 3.2: Palm Beach County Home Foreclosures, July 2008

South Florida Workforce Housing Needs Assessment
25
Figure 3.3: Broward County Home Foreclosures, July 2008
Source: RealtyTrac, 2008. Map Created by the FIU Metropolitan Center.
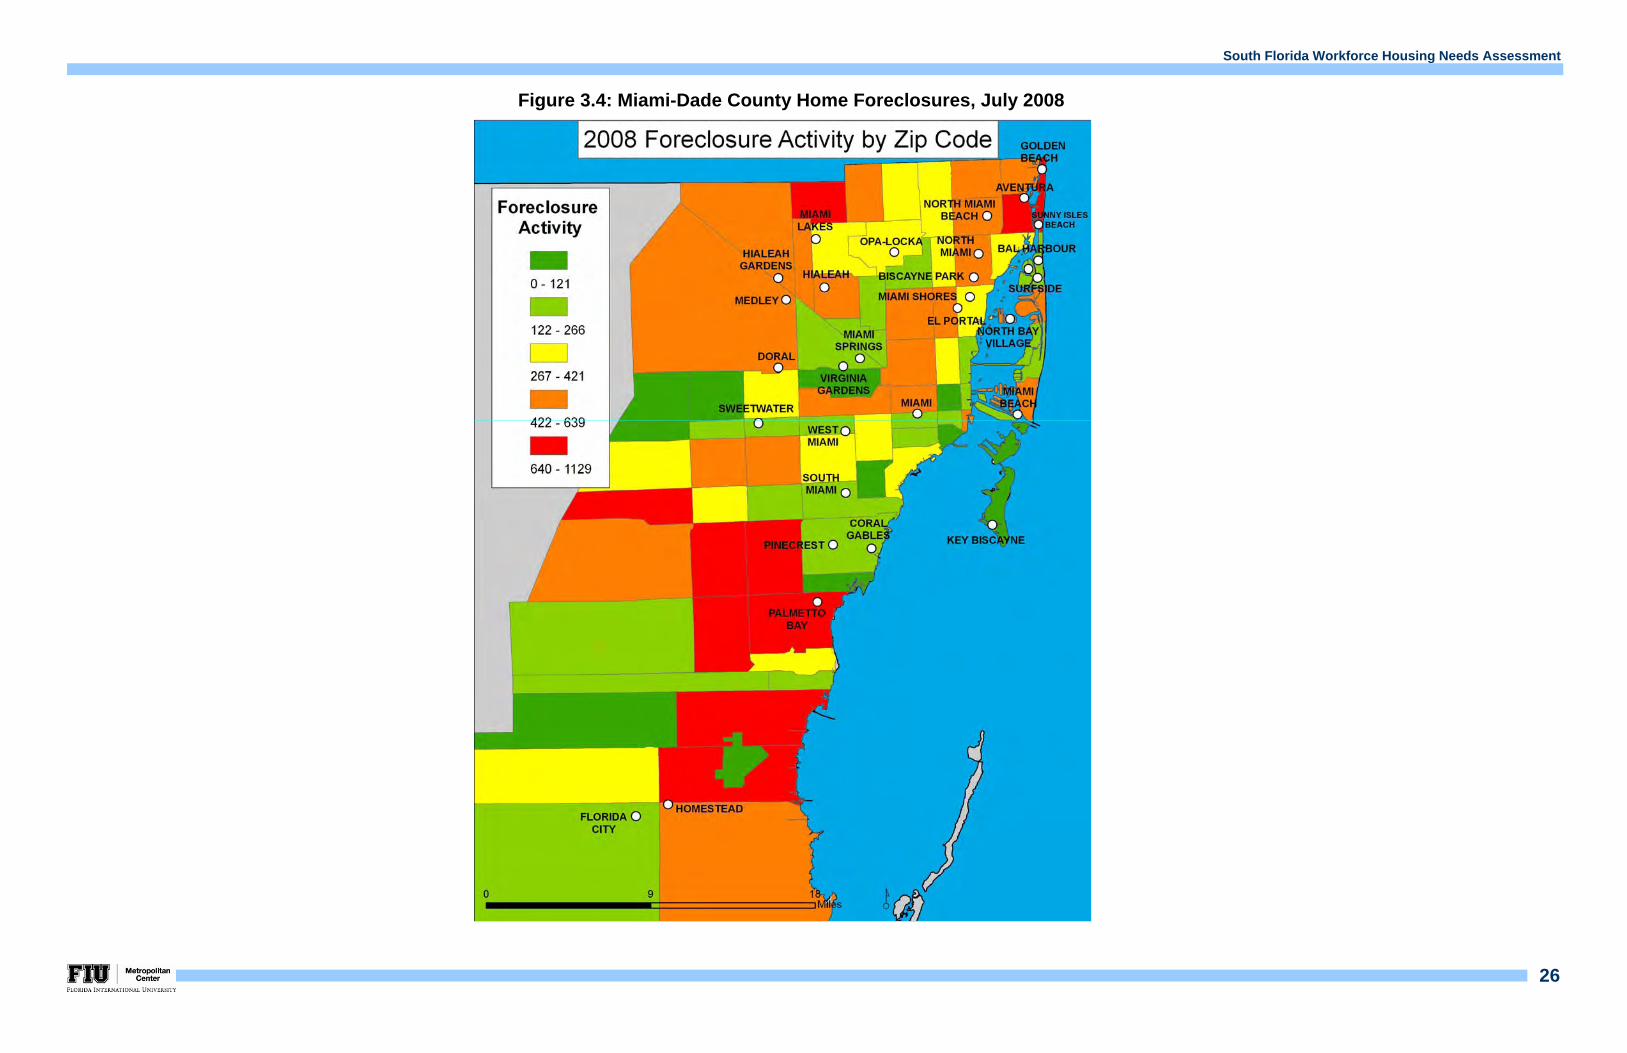
South Florida Workforce Housing Needs Assessment
26
Figure 3.4: Miami-Dade County Home Foreclosures, July 2008

South Florida Workforce Housing Needs Assessment
27
IV Conclusion
The growing demand for and insufficient access to workforce housing continues to be a top public policy issue in South Florida. As previous workforce and affordable housing needs assessments have shown, Broward, Miami-Dade and Palm Beach Counties are part of a larger South Florida regional economy. These studies have clearly demonstrated the important link between an adequate supply of workforce affordable housing and sustainable economic growth. The studies established that many of South Florida’s leading industrial sectors, including health care, professional services and retail trade are finding it increasingly difficult to attract and maintain workers in entry and management level positions
Recent workforce and affordable housing studies prepared on behalf of the Broward Housing Partnership, Inc., Housing Leadership Council of Palm Beach County and Greater Miami Chamber of Commerce documented the extent and ramifications of South Florida’s three-year housing boom from 2003-2005 that resulted in a severe shortage of workforce housing and extreme affordability gaps for all housing types. The studies showed that South Florida’s workforce housing supply and affordability mismatch was exacerbated by speculative investment which resulted in multiple conversions of rental units to condominiums and an overall development trend toward upscale housing demand external to the local market.
Since 2007, South Florida has had to endure the collapse of a highly speculative housing market. During the aftermath, South Florida communities have been beset with unstable housing market conditions intensified by rising home foreclosures, increasing job loss and an overall tightening of the mortgage credit market. The gross mismatch between housing values and workforce demand created an inflated housing inventory that has continued to grow in backlog as both buyers and sellers await some level of market normalcy.
Market instability and the rise in home foreclosures have essentially paralyzed the local housing market despite steady decreases in housing values during the past year. The rise in home foreclosures in South Florida is the result of several factors, including the proliferation of the sub-prime lending market during the height of the building boom, speculative investment and predatory lending practices. The state of South Florida’s housing market and regional economy has further deteriorated over the past two years with rising job loss and unemployment due to the spillover effects of the housing bubble and lost government revenues. Over the past year alone South Florida has lost over 16,000 jobs, thus adding to the plight of many worker households.
A basic premise of all housing markets is the need to create and maintain a spectrum of housing choice and opportunity for all local residents. This axiom establishes that housing choice and needs differ within most community settings due to a variety of factors including: household income, population age, proximity of employment and mere preference. A critical finding of this and previous housing needs assessments is the large unmet demand for affordable rental housing throughout South Florida. A spectrum of rental housing choice and opportunity is particularly important as an adequate supply of affordable rental housing provides choice and opportunity to working individuals and families with more modest incomes. Prior studies have established that these families and individuals comprise the vast majority of South Florida’s workforce.
Therefore, despite declining home prices during the past two years, overall market and economic conditions continue to limit housing choice and opportunity for South Florida’s workforce. The following are the key findings of this Assessment:
KEY FINDINGS:
There is a critical need and large unmet demand for affordable rental housing in South Florida. This finding has been substantiated on previous county-based studies as well as this Assessment;
A spectrum of rental housing choice and opportunity is particularly important as an adequate supply of affordable rental housing provides choice and opportunity to working individuals and families with modest incomes. Prior studies have established that these families and individuals comprise the vast majority of South Florida’s workforce;
South Florida has lost 40,000 private sector jobs since January, 2007;
There are currently 70,000 South Florida homes in foreclosure;
The de-valuation of South Florida’ s housing has resulted in significant negative equity and loss of wealth;
700,000 units (30 percent) of South Florida’s housing supply are now over 40 years old;
South Florida’s growing number of housing vacancies now totals 365,295 units, of which 46 percent are seasonal homes;
Despite decreasing home values, South Florida’s current single-family home price-to-median household income ratios range between 5:1-6:1, significantly above what is considered the standard manageable ratio of 3:1;
South Florida’s $1,200 average monthly rent is unaffordable to all households earning between 50-80 percent of the AMI (South Florida AMI approximately $54,000);
Approximately 85 percent of South Florida’s renters earning 50-80 percent of the AMI are cost-burdened; and
South Florida’s existing housing demand totals approximately 527,000 units for households earning 50-80 percent of the AMI and 193,000 units for households earning 81-120 percent of the AMI.

South Florida Workforce Housing Needs Assessment
i

South Florida Workforce Housing Needs Assessment
ii