south florida water management district · pamela brooks-thomas nicolás j. gutiérrez, jr.,esq....
TRANSCRIPT
SOUTH FLORIDA WATER MANAGEMENT DISTRICT
Report on Employee Benefits
Report # 04-06
Prepared by Office of Inspector General
John W. Williams, Esq., Inspector General
J. Timothy Beirnes, CPA, Director of Auditing Chris Flierl, CPA, Lead Consulting Auditor
SOUTH FLORIDA WATER MANAGEMENT DISTRICT____________________
3301 Gun Club Road, West Palm Beach, Florida 33406 • (561) 686-8800 • FL WATS 1-800-432-2045 • TDD (561) 697-2574 Mailing Address: P.O. Box 24680, West Palm Beach, FL 33416-4680 • www.sfwmd.gov
GOVERNING BOARD EXECUTIVE OFFICE
Kevin McCarty, Chair Alice Carlson Lennart E. Lindahl, P.E. Henry Dean, Executive Director Irela M. Bagué, Vice Chair Michael Collins Harkley R. Thornton Pamela Brooks-Thomas Nicolás J. Gutiérrez, Jr.,Esq. Malcolm S. Wade, Jr.
March 29, 2005 Audit and Finance Committee Members:
Mr. Lennart Lindahl, Chairman Mr. Michael Collins, Member Ms Alice Carlson, Member Mr. Malcolm Wade, Jr., Member
Re: Report on Employee Benefits, Report No. 04-06
This review was performed pursuant to the Inspector General’s authority set forth in Chapter 20.055, F.S and is part of the approved Audit Plan. The objective of the review was to compare the District’s benefits to those of other organizations. Hence, the report does not constitute an audit in accordance with generally accepted government auditing standards. We concluded that the District’s benefits are competitive with those of other organizations. The review also included examining the effectiveness of the Sick Leave Incentive Program from the time of its reinstatement in FY 1997. We concluded that the program is effective.
Sincerely,
John W. Williams, Esq. Inspector General
Enclosure c: Henry Dean Carol Wehle
______________________________________________________________________________ Report on Employee Benefits Office of Inspector General
TABLE OF CONTENTS
BACKGROUND............................................................................................1 OBJECTIVE, SCOPE, AND METHODOLOGY .....................................3 REVIEW RESULTS
Executive Summary ............................................................................4
District Benefits Are Comparable to Other Organizations in Palm Beach County ...............................................4 Overall, The Sick Leave Incentive Program Has Increased Productivity..............................................14 Nationwide, District Benefits Are Slightly Higher Than For-Profit Organizations But Comparable to Other Governments................................................18
BACKGROUND
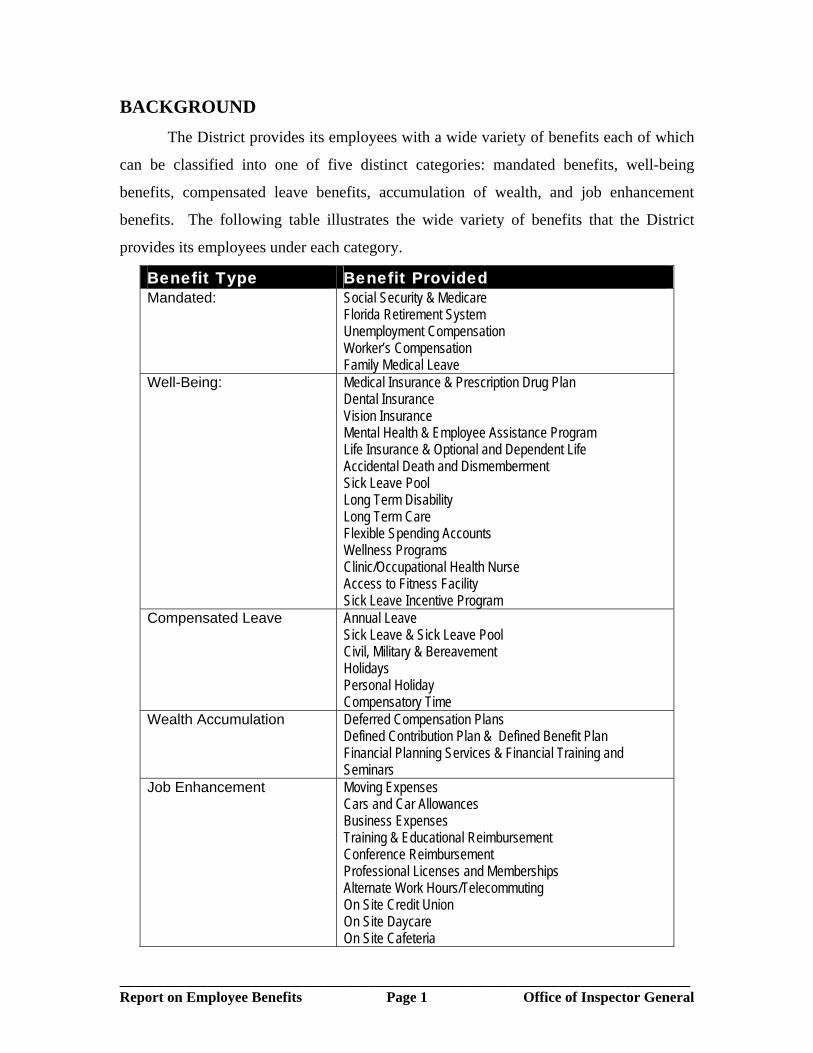
The District provides its employees with a wide variety of benefits each of which
can be classified into one of five distinct categories: mandated benefits, well-being
benefits, compensated leave benefits, accumulation of wealth, and job enhancement
benefits. The following table illustrates the wide variety of benefits that the District
provides its employees under each category.
Benefit Type Benefit Provided Mandated: Social Security & Medicare
Florida Retirement System Unemployment Compensation Worker’s Compensation Family Medical Leave
Well-Being: Medical Insurance & Prescription Drug Plan Dental Insurance Vision Insurance Mental Health & Employee Assistance Program Life Insurance & Optional and Dependent Life Accidental Death and Dismemberment Sick Leave Pool Long Term Disability Long Term Care Flexible Spending Accounts Wellness Programs Clinic/Occupational Health Nurse Access to Fitness Facility Sick Leave Incentive Program
Compensated Leave Annual Leave Sick Leave & Sick Leave Pool Civil, Military & Bereavement Holidays Personal Holiday Compensatory Time
Wealth Accumulation Deferred Compensation Plans Defined Contribution Plan & Defined Benefit Plan Financial Planning Services & Financial Training and Seminars
Job Enhancement Moving Expenses Cars and Car Allowances Business Expenses Training & Educational Reimbursement Conference Reimbursement Professional Licenses and Memberships Alternate Work Hours/Telecommuting On Site Credit Union On Site Daycare On Site Cafeteria
______________________________________________________________________________ Report on Employee Benefits Page 1 Office of Inspector General
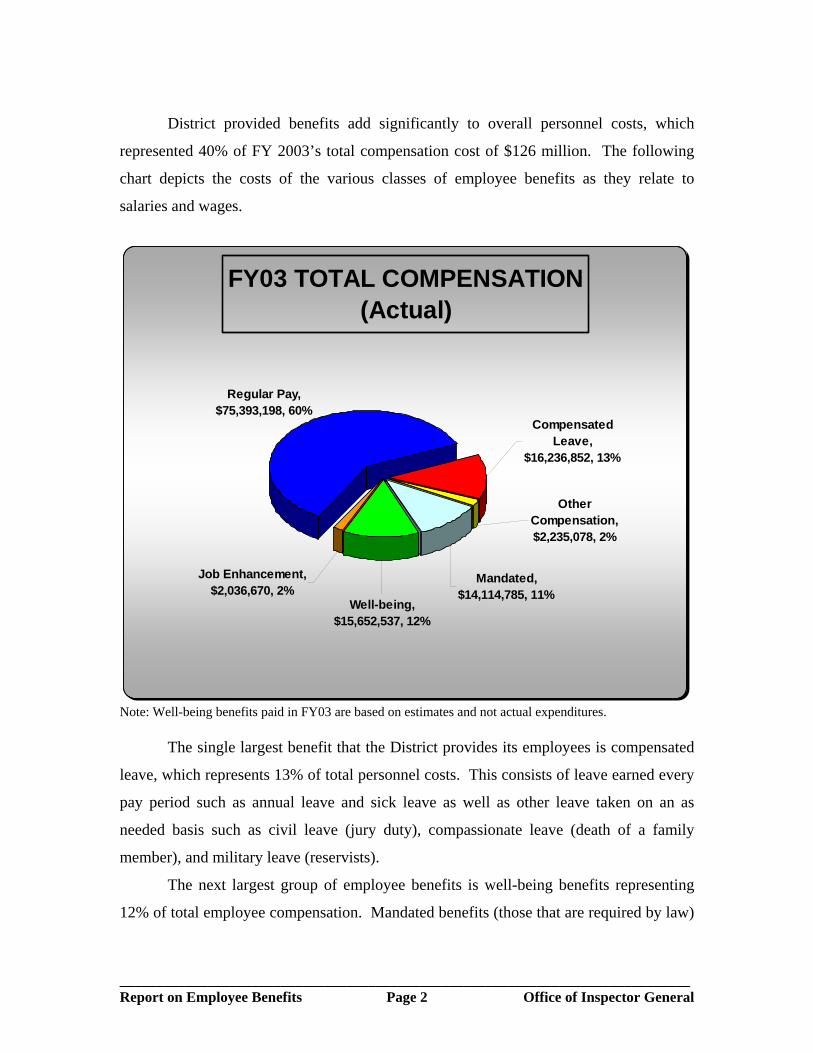
District provided benefits add significantly to overall personnel costs, which
represented 40% of FY 2003’s total compensation cost of $126 million. The following
chart depicts the costs of the various classes of employee benefits as they relate to
salaries and wages.
FY03 TOTAL COMPENSATION (Actual)
Well-being, $15,652,537, 12%
Mandated, $14,114,785, 11%
Other Compensation, $2,235,078, 2%
Compensated Leave,
$16,236,852, 13%
Job Enhancement, $2,036,670, 2%
Regular Pay, $75,393,198, 60%
Note: Well-being benefits paid in FY03 are based on estimates and not actual expenditures.
The single largest benefit that the District provides its employees is compensated
leave, which represents 13% of total personnel costs. This consists of leave earned every
pay period such as annual leave and sick leave as well as other leave taken on an as
needed basis such as civil leave (jury duty), compassionate leave (death of a family
member), and military leave (reservists).
The next largest group of employee benefits is well-being benefits representing
12% of total employee compensation. Mandated benefits (those that are required by law)
______________________________________________________________________________ Report on Employee Benefits Page 2 Office of Inspector General
represent the next largest class of employee benefits at 11% of total compensation.
Opportunities to control costs in this category are limited.
Of the remaining two classes of benefits, job enhancement and other
compensation, the most significant expenditures consist of employee training (about $1.2
million) and retirement contributions made on behalf of managers1 (about $380,000) as
well as overtime ($1.1 million) and the payment of accrued sick and annual leave hours at
termination ($575,000).
OBJECTIVES, SCOPE, AND METHODOLOGY
The objectives of this report are to determine how District health and welfare
benefits compare with other local governmental agencies in Palm Beach County and
whether the sick leave incentive program reinstated in 1996 has improved the
productivity of the District’s workforce. Objectives also included comparing the
District’s fringe benefit costs to for-profit organizations as well as governmental/not-for-
profit organizations based on nationwide survey data.
We reviewed and analyzed a survey that was performed in 2003 by the Palm
Beach County Healthcare District of 12 organizations, which included the District, to
determine how the District’s benefits compared to other governmental organizations in
Palm Beach County. In addition, a model was developed that was used to determine the
impact of the sick leave incentive program on employee productivity using various
scenarios and assumptions.
The above methodology does not entail the extent of substantive procedures that
are characteristic of an audit performed in accordance with generally accepted
government auditing standards.
1 The only wealth accumulation benefit with any cost to the District.
______________________________________________________________________________ Report on Employee Benefits Page 3 Office of Inspector General
REVIEW RESULTS
Executive Summary
Overall, the District’s Employee benefits are comparable to those of other
governmental organizations in Palm Beach County. However, in comparing specific
benefits, the District excelled in some areas and lagged in other. For example, the
District’s health insurance costs for “employee-only” and “family” plans were lower than
other organizations for both the Health Maintenance Organization (HMO) and Preferred
Provider Organization (PPO) options. Benefits provided under the District education
reimbursement program were also above average. Some areas where the District lagged
were higher health insurance cost for “employee-plus-one” plans, dental insurance
premiums, and vision insurance premiums for the “family” plan. Compensated absences
benefits were comparable overall; however, the maximum vacations days provided were
below average while the sick days allotted were above average.
The District’s benefit costs are slightly higher than For-Profit organizations;
however, Governmental/Not-for-Profit organization’s fringe benefits also tend to be
slightly higher than the For-Profit sector based on the Wyatt Survey’s nationwide data.
The District’s benefit costs appear to be in line when compared to the nationwide average
for Governmental/Not-For Profit organizations.
The Sick Leave Incentive Program was reinstituted as a result of our Audit of the
Human Resources Division issued in October 1996. Since then, the average number of
sick leave hours has decreased, which has resulted in an overall increase in productivity
of the District’s workforce.
District Benefits Are Comparable to Other Organizations in Palm Beach County
The District participated in a survey conducted by The Health Care District of
Palm Beach County (the “HCD”). The HCD is an independent special district
established pursuant to chapter 189, Florida Statutes. Its mission is to maximize the
health and well-being of Palm Beach County residents by addressing health care needs
and planning for the access and delivery of health services.
______________________________________________________________________________ Report on Employee Benefits Page 4 Office of Inspector General
Twelve organizations participated in the HCD’s 2003 Benefits Survey (the
“Survey”) including the following:
• The Health Care District of Palm Beach County
• South Florida Water Management District
• The City of West Palm Beach
• The City of Palm Beach Gardens
• The City of Delray Beach
• The City of Riviera Beach
• Palm Beach County Sheriff’s Office
• Palm Beach County Clerk of the Circuit Court
• Palm Beach County Property Appraiser
• Palm Beach County Tax Collector
• Solid Waste Authority of Palm Beach County
• The Children’s Services Council (a not-for-profit agency)
The Survey required respondents to answer various questions about benefits such
as health, dental, and vision insurance, as well as other benefits offered to employees.
HCD released the results of its Survey on November 24, 2003.
Health Insurance
The Survey asked numerous questions about health insurance including the
provider and the types of insurances; such as HMO, Point of Service (POS), or PPO. The
survey also asked for the premium for various levels of coverage. The levels of coverage
included “employee-only” coverage, “employee-plus-one2”, and “family” coverage. The
survey also asked participants how their insurance premiums were allocated between the
organization and their employees. Following is a summary of the responses to the health
insurance questions and how the District compared to the other organizations surveyed.
2 Some of the surveyed organizations made a distinction between “employee plus spouse” and "employee plus child.”
______________________________________________________________________________ Report on Employee Benefits Page 5 Office of Inspector General
HMO Coverage
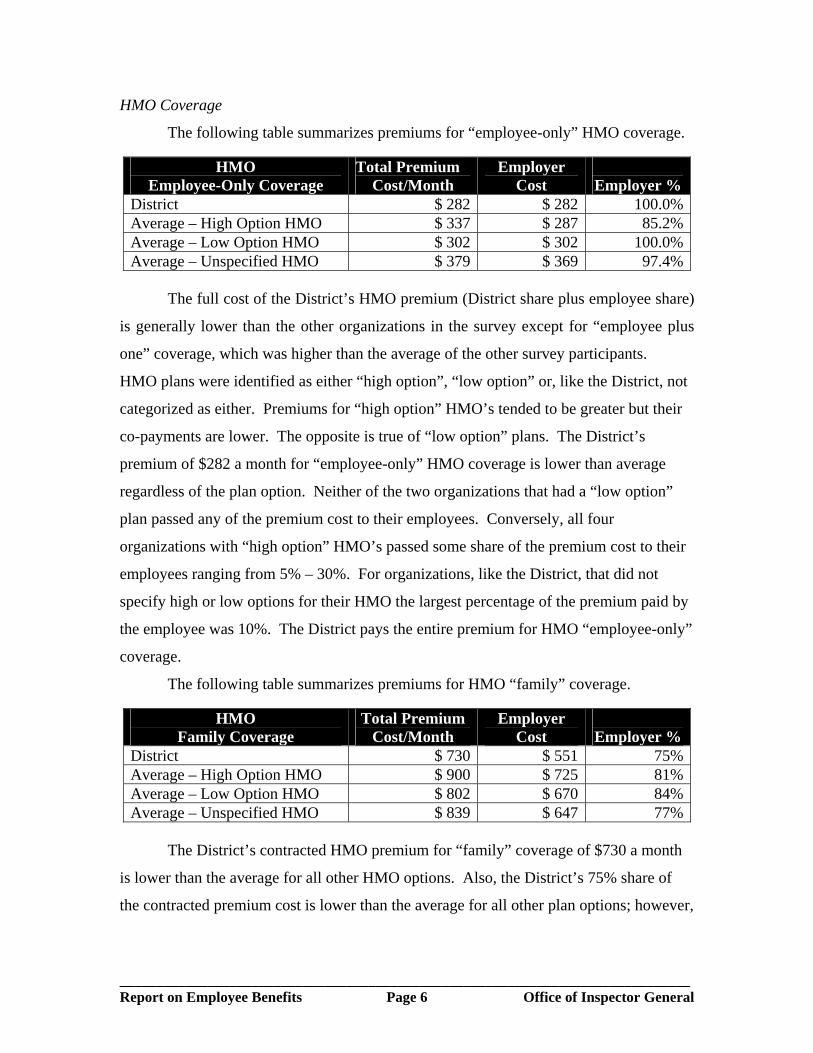
The following table summarizes premiums for “employee-only” HMO coverage.
HMO Employee-Only Coverage
Total Premium Cost/Month
Employer Cost
Employer %
District $ 282 $ 282 100.0%Average – High Option HMO $ 337 $ 287 85.2%Average – Low Option HMO $ 302 $ 302 100.0%Average – Unspecified HMO $ 379 $ 369 97.4%
The full cost of the District’s HMO premium (District share plus employee share)
is generally lower than the other organizations in the survey except for “employee plus
one” coverage, which was higher than the average of the other survey participants.
HMO plans were identified as either “high option”, “low option” or, like the District, not
categorized as either. Premiums for “high option” HMO’s tended to be greater but their
co-payments are lower. The opposite is true of “low option” plans. The District’s
premium of $282 a month for “employee-only” HMO coverage is lower than average
regardless of the plan option. Neither of the two organizations that had a “low option”
plan passed any of the premium cost to their employees. Conversely, all four
organizations with “high option” HMO’s passed some share of the premium cost to their
employees ranging from 5% – 30%. For organizations, like the District, that did not
specify high or low options for their HMO the largest percentage of the premium paid by
the employee was 10%. The District pays the entire premium for HMO “employee-only”
coverage.
The following table summarizes premiums for HMO “family” coverage.
HMO Family Coverage
Total Premium Cost/Month
Employer Cost
Employer %
District $ 730 $ 551 75%Average – High Option HMO $ 900 $ 725 81%Average – Low Option HMO $ 802 $ 670 84%Average – Unspecified HMO $ 839 $ 647 77%
The District’s contracted HMO premium for “family” coverage of $730 a month
is lower than the average for all other HMO options. Also, the District’s 75% share of
the contracted premium cost is lower than the average for all other plan options; however,
______________________________________________________________________________ Report on Employee Benefits Page 6 Office of Inspector General
the dollar amount the District pays is significantly less than the average of other survey
participants since the total premium is notably lower.
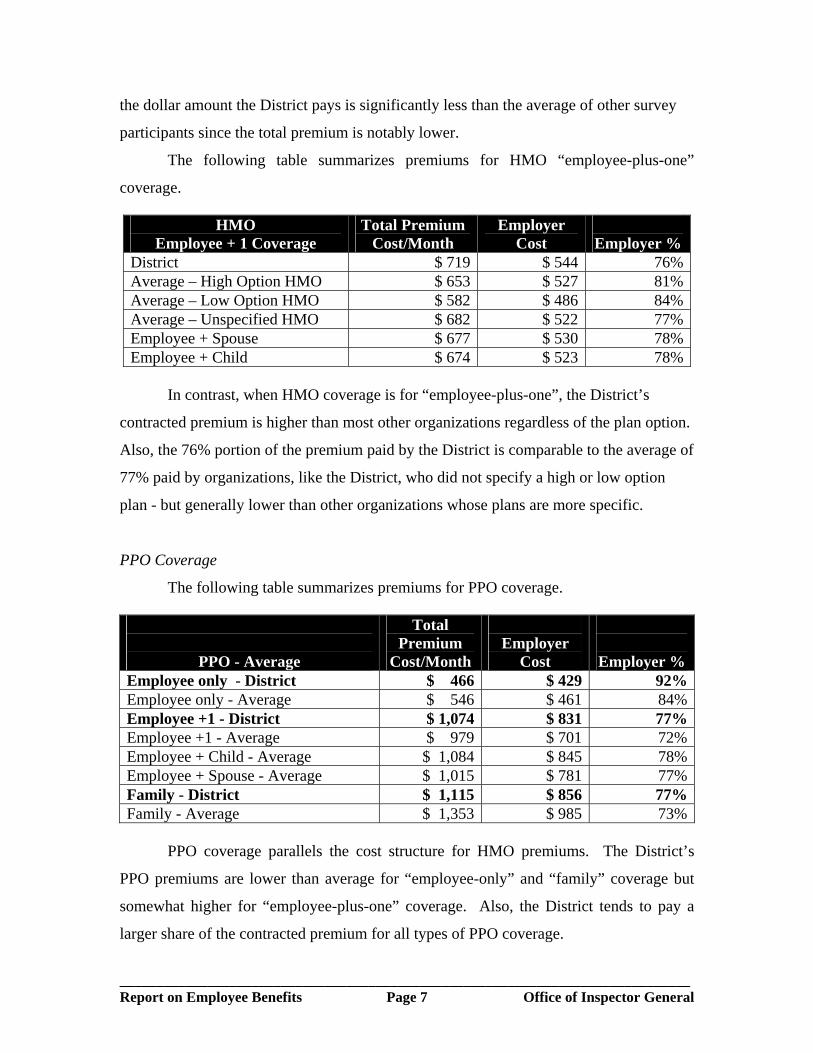
The following table summarizes premiums for HMO “employee-plus-one”
coverage.
HMO Employee + 1 Coverage
Total Premium Cost/Month
Employer Cost
Employer %
District $ 719 $ 544 76%Average – High Option HMO $ 653 $ 527 81%Average – Low Option HMO $ 582 $ 486 84%Average – Unspecified HMO $ 682 $ 522 77%Employee + Spouse $ 677 $ 530 78%Employee + Child $ 674 $ 523 78%
In contrast, when HMO coverage is for “employee-plus-one”, the District’s
contracted premium is higher than most other organizations regardless of the plan option.
Also, the 76% portion of the premium paid by the District is comparable to the average of
77% paid by organizations, like the District, who did not specify a high or low option
plan - but generally lower than other organizations whose plans are more specific.
PPO Coverage
The following table summarizes premiums for PPO coverage.
PPO - Average
Total Premium
Cost/Month
Employer
Cost
Employer % Employee only - District $ 466 $ 429 92%Employee only - Average $ 546 $ 461 84%Employee +1 - District $ 1,074 $ 831 77%Employee +1 - Average $ 979 $ 701 72%Employee + Child - Average $ 1,084 $ 845 78%Employee + Spouse - Average $ 1,015 $ 781 77%Family - District $ 1,115 $ 856 77%Family - Average $ 1,353 $ 985 73%
PPO coverage parallels the cost structure for HMO premiums. The District’s
PPO premiums are lower than average for “employee-only” and “family” coverage but
somewhat higher for “employee-plus-one” coverage. Also, the District tends to pay a
larger share of the contracted premium for all types of PPO coverage.
______________________________________________________________________________ Report on Employee Benefits Page 7 Office of Inspector General
For “employee-only” PPO coverage the District’s contracted premium of $466 is
below the average of the other survey participants. Further, the $429 dollar amount the
District pays is lower than the average paid by other employers even though the District
pays a larger share of the premium.
Similarly, the District’s contracted premium for PPO “family” coverage is less
than the average of the other surveyed organizations. The $856 the District pays for
“family” coverage is less than the average of what the other organizations pay even
though the District pays a larger share of the premium cost.
Comparing the District’s “employee-plus-one” premium to the other survey
participants’ yields mixed results depending on the policy coverage. When compared to
similar organizations who do not specify the employee’s relationship with the additional
insured, the District’s contracted premium of $1,074 is higher than the $979 average.
Further, the District pays a larger portion of the premium under this scenario, 77%
compared to the average of 72%. The District fares slightly better when compared to
organizations whose insurance plans specify the additional insured. The District’s
premium is slightly lower than the average premium for “employee + child” coverage but
is higher than the “employee + spouse” average. Also note that the other employers paid
a larger portion of the premium than the District when that additional insured was
specified.
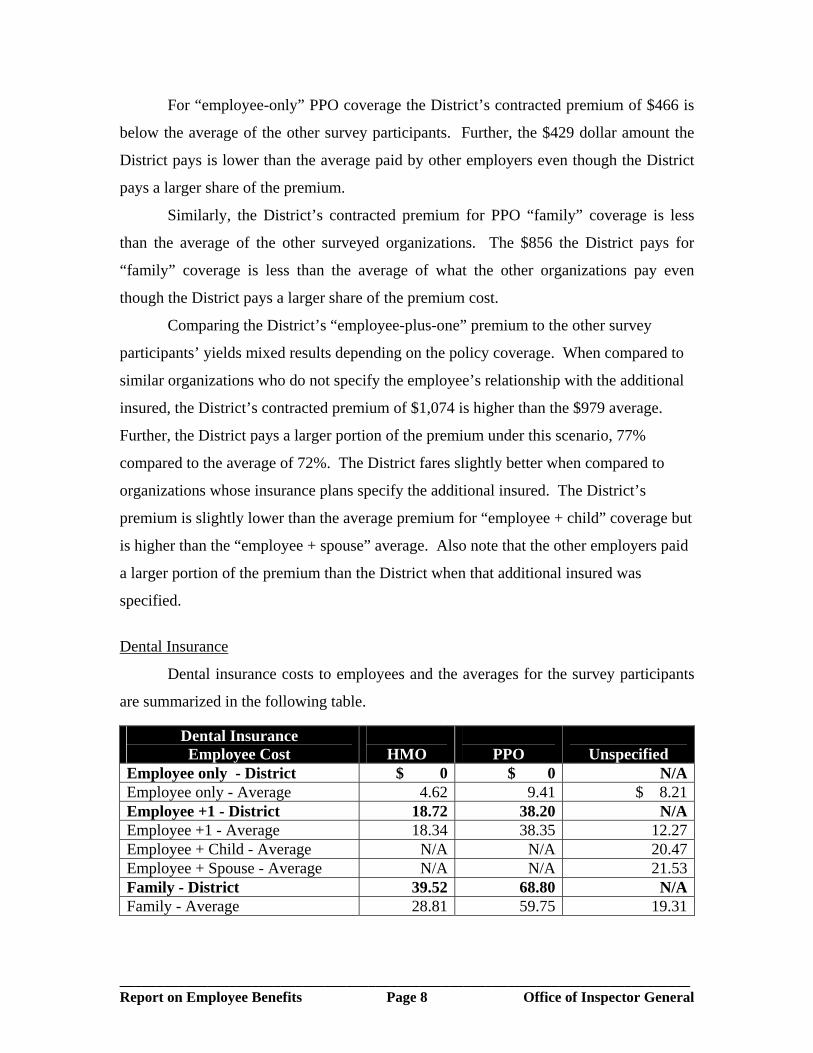
Dental Insurance
Dental insurance costs to employees and the averages for the survey participants
are summarized in the following table.
Dental Insurance Employee Cost
HMO
PPO
Unspecified
Employee only - District $ 0 $ 0 N/AEmployee only - Average 4.62 9.41 $ 8.21Employee +1 - District 18.72 38.20 N/AEmployee +1 - Average 18.34 38.35 12.27Employee + Child - Average N/A N/A 20.47Employee + Spouse - Average N/A N/A 21.53Family - District 39.52 68.80 N/AFamily - Average 28.81 59.75 19.31
______________________________________________________________________________ Report on Employee Benefits Page 8 Office of Inspector General

Unlike the health insurance portion of the survey, where respondents provided the
employee’s and employer’s premium costs, dental insurance premiums in the survey are
limited to what the employee pays per month. As such, we were not able to compare
contracted premium amounts with other organizations. Regardless, the most that the
District pays for dental insurance is $18.64 for the dental HMO and $41.18 for the dental
PPO, which is 100% of the contract premium for “employee-only” coverage. The
additional cost of insuring other family members under the dental policies is borne
entirely by the employee.
All twelve survey participants offer dental coverage to their employees. Four of
the participant’s employers pay the entire amount of the premium regardless of the
number of individuals covered under the plan. Of the remaining eight organizations, the
amount paid by the employee varies based on the number of insured. Seven
organizations, including the District, pay the entire premium for “employee-only”
coverage. Four survey participants require a payment from their employees for
“employee-only” coverage ranging from $6 to $40 and one participant’s dental plan is
combined with their health care plan. The payments made for HMO dental plans were
generally less than those required for PPO plans.
The amount District employee’s paid for “employee + one” dental coverage
depends on whether the plan is an HMO or a PPO. Three other survey participants along
with the District indicated that they offer both types of dental plans to their employees.
District employees pay $18.72 per month for “employee-plus-one” coverage in the dental
HMO. This is second only to another organization, whose employees pay $24.16. The
lowest3 other organizations pay for “employee-plus-one” dental HMO is $15.12. The
same holds true for the PPO plan. District employees pay the second highest PPO dental
premium for “employee-plus-one” coverage of $38.20 with the highest being $43.38.
Also at the high end of the premium range is the amount that District employees pay for
“family” dental coverage. The cost to District employees for “family” HMO dental
coverage is $39.52 - the highest of all four organizations who offer a dental HMO. The
$68.80 District employees pay for dental PPO “family” coverage is the second highest of
the four organizations who offer such a plan.
3 Exclusive of those organizations who pay 100% of employee dental insurance premiums.
______________________________________________________________________________ Report on Employee Benefits Page 9 Office of Inspector General
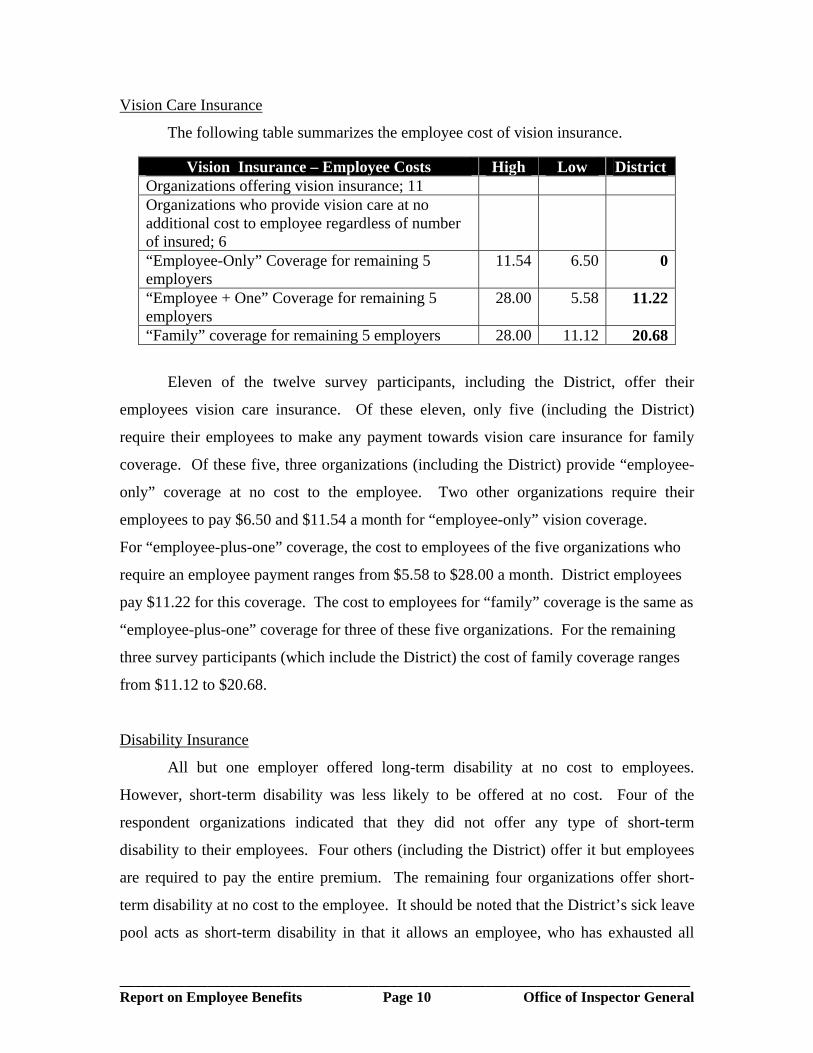
Vision Care Insurance
The following table summarizes the employee cost of vision insurance.
Vision Insurance – Employee Costs High Low District Organizations offering vision insurance; 11 Organizations who provide vision care at no additional cost to employee regardless of number of insured; 6
“Employee-Only” Coverage for remaining 5 employers
11.54 6.50 0
“Employee + One” Coverage for remaining 5 employers
28.00 5.58 11.22
“Family” coverage for remaining 5 employers 28.00 11.12 20.68
Eleven of the twelve survey participants, including the District, offer their
employees vision care insurance. Of these eleven, only five (including the District)
require their employees to make any payment towards vision care insurance for family
coverage. Of these five, three organizations (including the District) provide “employee-
only” coverage at no cost to the employee. Two other organizations require their
employees to pay $6.50 and $11.54 a month for “employee-only” vision coverage.
For “employee-plus-one” coverage, the cost to employees of the five organizations who
require an employee payment ranges from $5.58 to $28.00 a month. District employees
pay $11.22 for this coverage. The cost to employees for “family” coverage is the same as
“employee-plus-one” coverage for three of these five organizations. For the remaining
three survey participants (which include the District) the cost of family coverage ranges
from $11.12 to $20.68.
Disability Insurance
All but one employer offered long-term disability at no cost to employees.
However, short-term disability was less likely to be offered at no cost. Four of the
respondent organizations indicated that they did not offer any type of short-term
disability to their employees. Four others (including the District) offer it but employees
are required to pay the entire premium. The remaining four organizations offer short-
term disability at no cost to the employee. It should be noted that the District’s sick leave
pool acts as short-term disability in that it allows an employee, who has exhausted all
______________________________________________________________________________ Report on Employee Benefits Page 10 Office of Inspector General

other leave, up to 480 hours of additional sick leave for an initial donation of 8 hours.
Participants are periodically required to contribute additional hours if the sick leave
pool’s hours are near depletion. Participation in the District’s sick leave pool is at the
employee’s discretion.
Education Reimbursement
All of the survey respondents indicated that they provided an education
reimbursement benefit to their employees; however, the amount of the reimbursement
varied widely. In some cases a maximum number of hours or classes were specified
while in other organizations the benefit was measured in terms of a maximum dollar
amount. For example, 12 semester hours annually, three courses per semester, or up to
four classes a year. Benefits expressed in terms of dollar limits ranged between $1,200
and $5,250 per year. The District’s education reimbursement program is unique in that
the maximum reimbursement is tied to the cost per credit hour established by the State
University System up to 24 hours annually. This translates into $2,250 for undergraduate
courses and $4,500 for graduate level courses.
Life Insurance
Participants were asked whether their organizations provided basic life insurance
at no cost to the employee and what were the limits. All but one provided this benefit,
which ranged from one times salary to $300,000. In addition, all but one of the
organizations surveyed provided optional life insurance.
The District provides term life insurance at no cost to employees at one times
salary. Managers are provided life insurance at two times salary at no cost to the
employee. However, employees making over $50,000 a year must agree to pay imputed
income tax on the portion of the premium related to the coverage over $50,000.
Annual/Vacation Leave
Survey participants provided information about the number of days of vacation
employees earn annually. The number of vacation days that District employees earn is
consistent with that of the other organizations surveyed.
______________________________________________________________________________ Report on Employee Benefits Page 11 Office of Inspector General
In most cases earned vacation varied with the number of years of continuous
service to the organization. Based on the survey responses, 12 -13 days is the minimum
number of compensated leave days that can be earned annually. Eight organizations
reported 12 days as the minimum while the District and two other organizations reported
13 days. Generally, the amount of vacation leave increased with the number of years of
employment. In only one instance was this not the case. On average, the maximum
number of additional days that can be earned through continued employment was just
under seven days. This is consistent with the District who allows employees to increase
their earned vacation time from 13 days in the first year to a maximum of 19.5 days
annually after ten years of service. The District’s 19.5 day maximum number of earned
leave days is slightly below the average of 23.65 days for the other organizations.
Holidays/Personal Leave
The number of holidays/personal leave offered by the surveyed organizations
ranges between 9 and 13 annually. The District’s ten recognized holidays plus one
personal day falls squarely in the middle of that range. Four other organizations allow 11
holidays while five other organizations give their employees 12.
Sick Leave
The number of sick leave days allowed at the surveyed organizations ranged from
six to thirteen. The District is at the high end of the range, which allows its employees to
earn 13 sick days annually. Two other organizations also gave their employees 13 days
while six give their employees 12 days of sick leave annually.
The survey asked whether sick leave payments were made at the end of the year
or upon termination of employment. Three organizations, including the District,
indicated that sick leave was paid out during the year. The District’s method of doing
this is through the sick leave incentive program whereby employees can get paid for up to
40 hours of unused sick leave annually. The District also pays out sick leave at
termination after ten years of service. However, unlike the District, two other
organizations that pay sick leave at year end do not pay any sick leave upon termination.
The remaining nine respondents all indicated a payment upon termination ranging from
______________________________________________________________________________ Report on Employee Benefits Page 12 Office of Inspector General

25% of the hours accrued to 100%. Some organizations specified a range indicating that
the percentage paid out varied with the length of service while others, like the District,
provided a single percentage. The District is at the low end of the sick leave termination
payment range allowing for payment of 25% of the hours after 10 years service. Seven
other organizations indicated that a sick leave payout is available after 5 years.
Pension Plan
Survey participants were asked if they provided a pension plan for their
employees, and if so, what percentage contribution is made. All but one of the
respondents said that they had a pension plan. Five, including the District, indicated that
it was through the Florida Retirement System (FRS). The amount contributed by the
employer ranged from 6% to 22% depending on employee classification and/or length of
service. Contributions are generally higher for high-risk positions such as police officers
and fire fighters.
Retirement Plan
All but two of the organizations surveyed offer some sort of retirement plan,
either a 401(k) or 457(b). Of those ten organizations, which included the District, four
indicated that the employer made a matching contribution to the plan. The District makes
a contribution only for management employees up to a 5% match.
Conclusion
Overall, the District’s benefits appear to be competitive with the other participants
in the survey. One area where the District excelled was lower health insurance costs for
“employee-only” and “family” plans for both the HMO and PPO options. The District
education reimbursement program was also above average. Some areas where the
District lagged were higher health insurance cost for “employee-plus-one” plans, dental
insurance premiums, and vision insurance premiums for the “family” plan. The District’s
compensated absences policy, overall, is comparable to other survey participants. While
the number of vacation days an employee can accrue is less than other survey
participants, the number of sick days allotted is higher. Among employers that provide a
______________________________________________________________________________ Report on Employee Benefits Page 13 Office of Inspector General
payout of sick leave upon termination, the District is at the low end of the range at 25%
of accrued sick leave.
Overall, the Sick Leave Incentive Program Has Increased Efficiency
The average number of sick leave hours taken has decreased from 81 to 61 since
reinstituting the sick leave incentive program as recommended in our Audit of the Human
Resources Department, issued in September 1996. Prior to this, the District had a sick
leave incentive program but ended it in 1991. The sick leave incentive program allows
for a payment to non-management employees for any portion of the first 40 hours of sick
leave earned and not used during each calendar year. On the average, this decrease in
sick leave taken has increased productivity; however, there are instances, particularly
when an employee took little sick leave prior to the sick leave incentive program, where
the hourly cost of that employee has increased due to the sick leave incentive program.
When we made our recommendation to reinstate the sick leave incentive program
at the end of FY’96, employees used approximately 81 sick leave hours annually. In
FY’03, usage had dropped 25% to approximately 61 hours – about the same as it was in
1991 when the program was terminated.
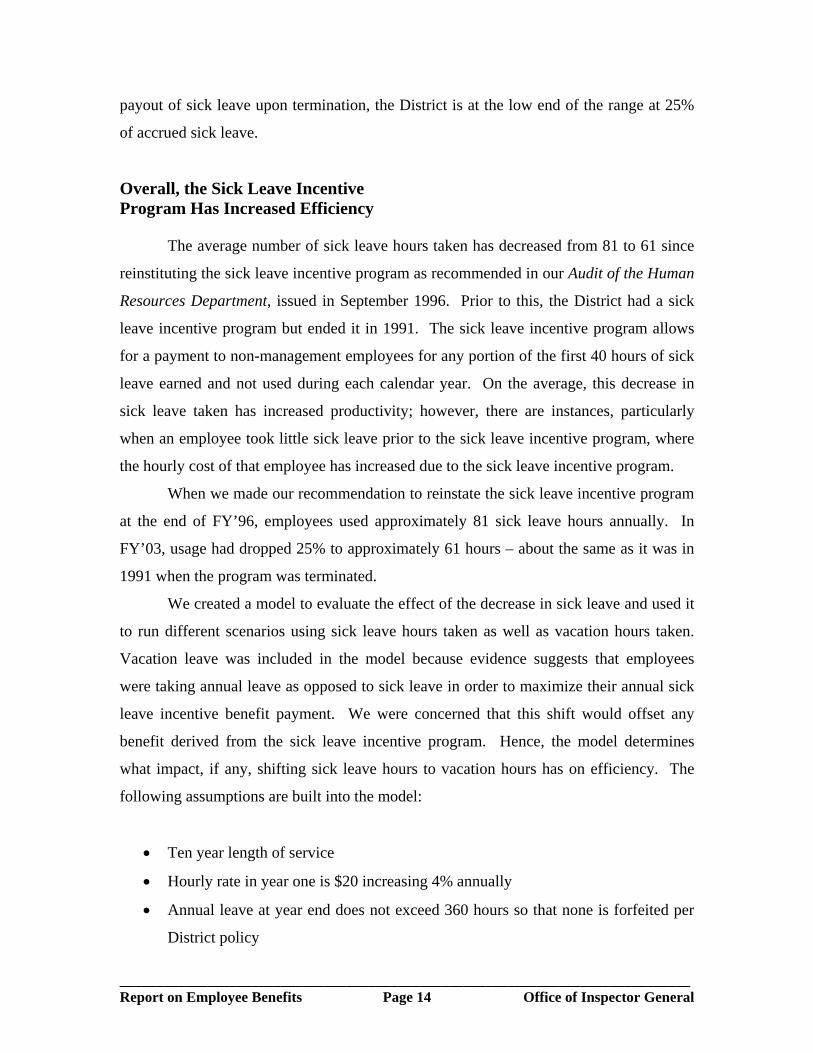
We created a model to evaluate the effect of the decrease in sick leave and used it
to run different scenarios using sick leave hours taken as well as vacation hours taken.
Vacation leave was included in the model because evidence suggests that employees
were taking annual leave as opposed to sick leave in order to maximize their annual sick
leave incentive benefit payment. We were concerned that this shift would offset any
benefit derived from the sick leave incentive program. Hence, the model determines
what impact, if any, shifting sick leave hours to vacation hours has on efficiency. The
following assumptions are built into the model:
• Ten year length of service
• Hourly rate in year one is $20 increasing 4% annually
• Annual leave at year end does not exceed 360 hours so that none is forfeited per
District policy
______________________________________________________________________________ Report on Employee Benefits Page 14 Office of Inspector General
• Efficiency is measured in terms of dollars per hour paid over the employee’s 10
year service period.
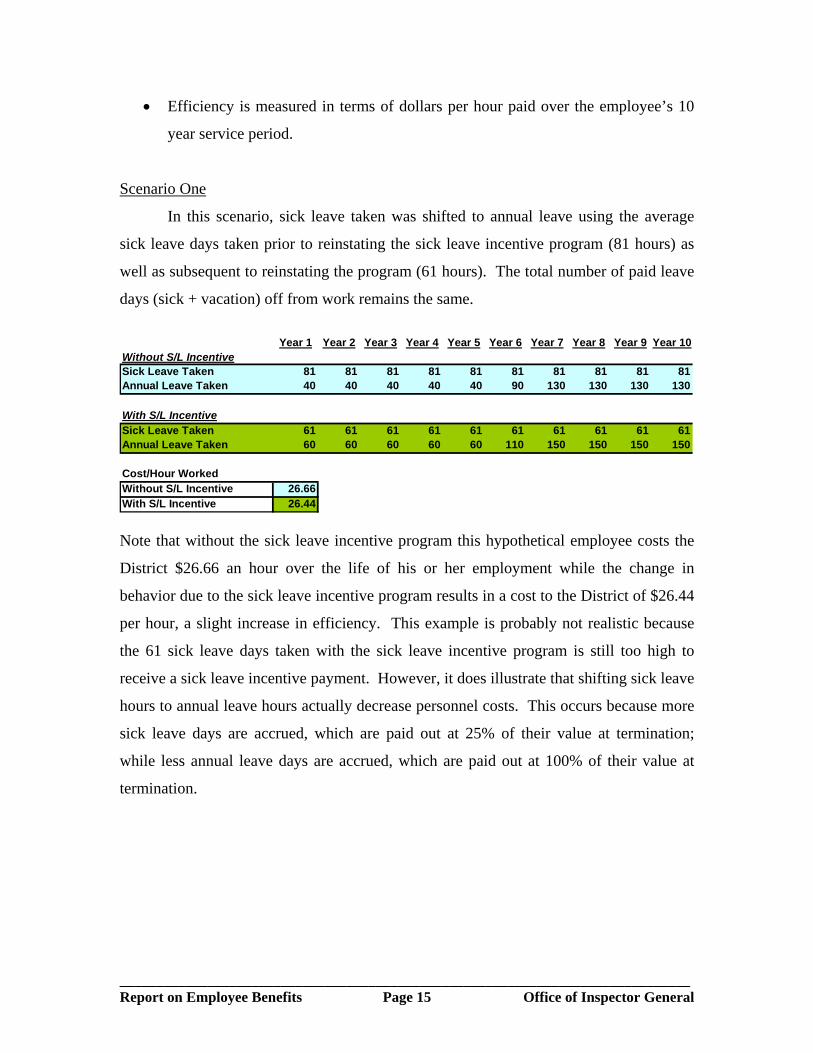
Scenario One
In this scenario, sick leave taken was shifted to annual leave using the average
sick leave days taken prior to reinstating the sick leave incentive program (81 hours) as
well as subsequent to reinstating the program (61 hours). The total number of paid leave
days (sick + vacation) off from work remains the same.
Year 1 Year 2 Year 3 Year 4 Year 5 Year 6 Year 7 Year 8 Year 9 Year 10
Without S/L IncentiveSick Leave Taken 81 81 81 81 81 81 81 81 81 81Annual Leave Taken 40 40 40 40 40 90 130 130 130 130
With S/L IncentiveSick Leave Taken 61 61 61 61 61 61 61 61 61 61Annual Leave Taken 60 60 60 60 60 110 150 150 150 150
Cost/Hour WorkedWithout S/L Incentive 26.66With S/L Incentive 26.44 Note that without the sick leave incentive program this hypothetical employee costs the
District $26.66 an hour over the life of his or her employment while the change in
behavior due to the sick leave incentive program results in a cost to the District of $26.44
per hour, a slight increase in efficiency. This example is probably not realistic because
the 61 sick leave days taken with the sick leave incentive program is still too high to
receive a sick leave incentive payment. However, it does illustrate that shifting sick leave
hours to annual leave hours actually decrease personnel costs. This occurs because more
sick leave days are accrued, which are paid out at 25% of their value at termination;
while less annual leave days are accrued, which are paid out at 100% of their value at
termination.
______________________________________________________________________________ Report on Employee Benefits Page 15 Office of Inspector General
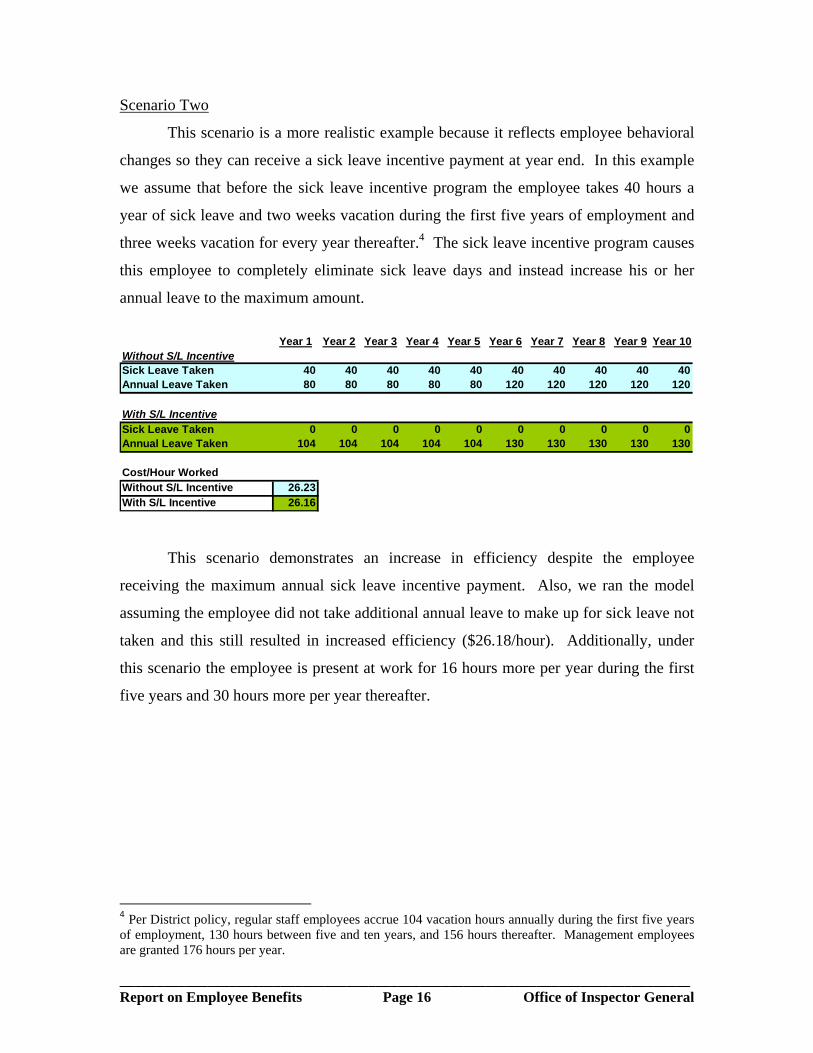
Scenario Two
This scenario is a more realistic example because it reflects employee behavioral
changes so they can receive a sick leave incentive payment at year end. In this example
we assume that before the sick leave incentive program the employee takes 40 hours a
year of sick leave and two weeks vacation during the first five years of employment and
three weeks vacation for every year thereafter.4 The sick leave incentive program causes
this employee to completely eliminate sick leave days and instead increase his or her
annual leave to the maximum amount.
Year 1 Year 2 Year 3 Year 4 Year 5 Year 6 Year 7 Year 8 Year 9 Year 10
Without S/L IncentiveSick Leave Taken 40 40 40 40 40 40 40 40 40 40Annual Leave Taken 80 80 80 80 80 120 120 120 120 120
With S/L IncentiveSick Leave Taken 0 0 0 0 0 0 0 0 0 0Annual Leave Taken 104 104 104 104 104 130 130 130 130 130
Cost/Hour WorkedWithout S/L Incentive 26.23With S/L Incentive 26.16
This scenario demonstrates an increase in efficiency despite the employee
receiving the maximum annual sick leave incentive payment. Also, we ran the model
assuming the employee did not take additional annual leave to make up for sick leave not
taken and this still resulted in increased efficiency ($26.18/hour). Additionally, under
this scenario the employee is present at work for 16 hours more per year during the first
five years and 30 hours more per year thereafter.
4 Per District policy, regular staff employees accrue 104 vacation hours annually during the first five years of employment, 130 hours between five and ten years, and 156 hours thereafter. Management employees are granted 176 hours per year.
______________________________________________________________________________ Report on Employee Benefits Page 16 Office of Inspector General
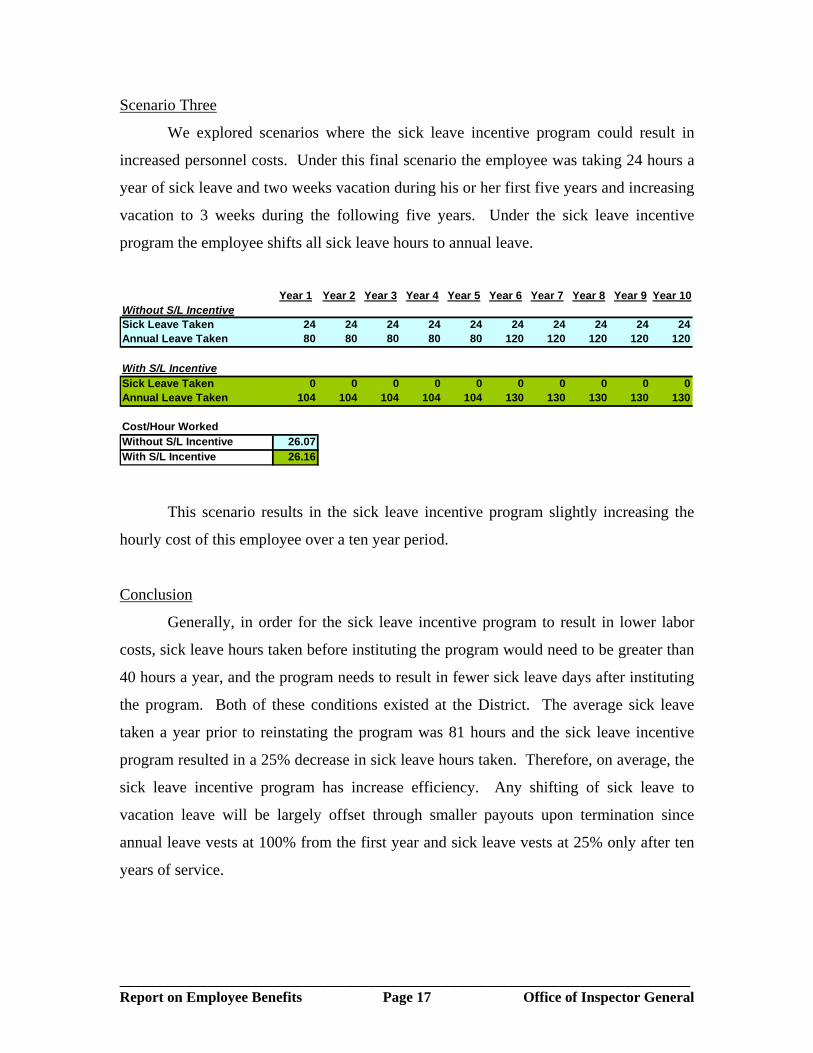
Scenario Three
We explored scenarios where the sick leave incentive program could result in
increased personnel costs. Under this final scenario the employee was taking 24 hours a
year of sick leave and two weeks vacation during his or her first five years and increasing
vacation to 3 weeks during the following five years. Under the sick leave incentive
program the employee shifts all sick leave hours to annual leave.
Year 1 Year 2 Year 3 Year 4 Year 5 Year 6 Year 7 Year 8 Year 9 Year 10
Without S/L IncentiveSick Leave Taken 24 24 24 24 24 24 24 24 24 24Annual Leave Taken 80 80 80 80 80 120 120 120 120 120
With S/L IncentiveSick Leave Taken 0 0 0 0 0 0 0 0 0 0Annual Leave Taken 104 104 104 104 104 130 130 130 130 130
Cost/Hour WorkedWithout S/L Incentive 26.07With S/L Incentive 26.16
This scenario results in the sick leave incentive program slightly increasing the
hourly cost of this employee over a ten year period.
Conclusion
Generally, in order for the sick leave incentive program to result in lower labor
costs, sick leave hours taken before instituting the program would need to be greater than
40 hours a year, and the program needs to result in fewer sick leave days after instituting
the program. Both of these conditions existed at the District. The average sick leave
taken a year prior to reinstating the program was 81 hours and the sick leave incentive
program resulted in a 25% decrease in sick leave hours taken. Therefore, on average, the
sick leave incentive program has increase efficiency. Any shifting of sick leave to
vacation leave will be largely offset through smaller payouts upon termination since
annual leave vests at 100% from the first year and sick leave vests at 25% only after ten
years of service.
______________________________________________________________________________ Report on Employee Benefits Page 17 Office of Inspector General
Nationwide, District Benefits Are Slightly Higher than For-Profit Organizations But Comparable to Other Governments
We also compared the District’s fringe benefit costs to those nationwide based on
a survey conducted by Watson Wyatt Data Services (the “Wyatt Survey”). Watson
Wyatt Data Services is a division of Watson Wyatt Worldwide, which is a global
consulting firm specializing in employee benefits. The Wyatt Survey encompassed 213
organizations covering 633,000 employees that included For-Profit and
Government/Non-Profit organizations. For-Profit organizations represented 63.8% of the
Wyatt Survey participants and the remaining 36.2% were non-profit and government
organizations.
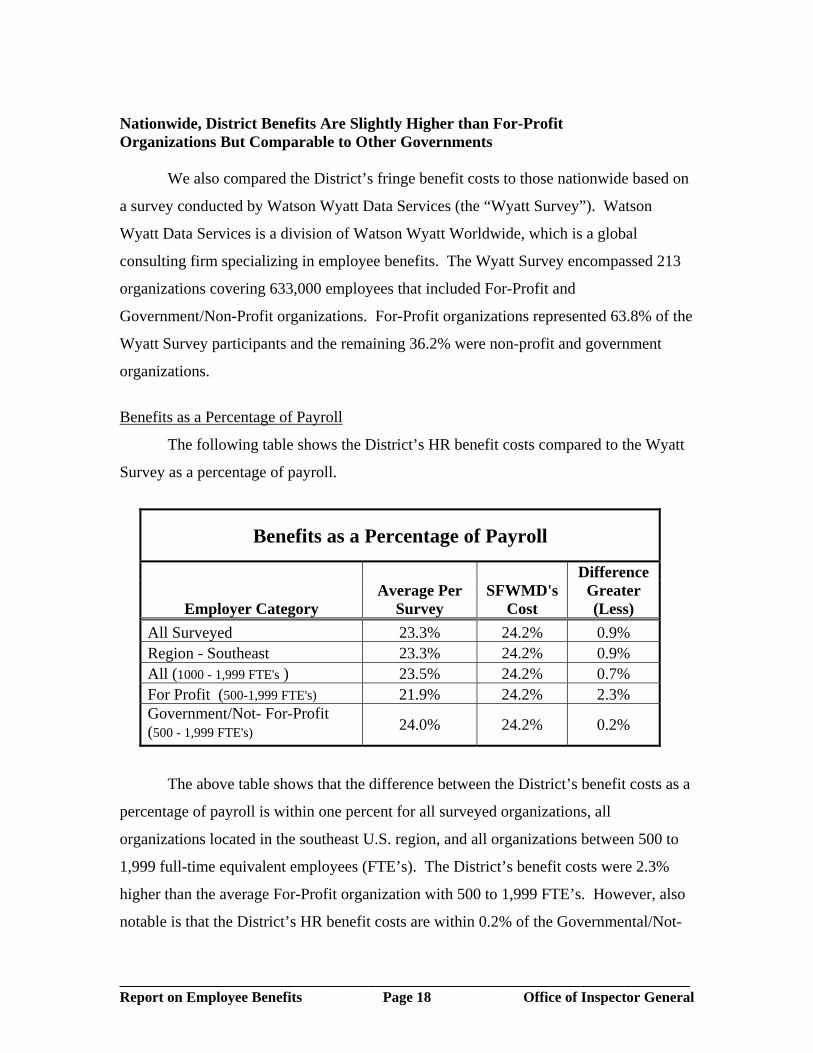
Benefits as a Percentage of Payroll
The following table shows the District’s HR benefit costs compared to the Wyatt
Survey as a percentage of payroll.
Benefits as a Percentage of Payroll
Difference Average Per SFWMD's Greater
Employer Category Survey Cost (Less) All Surveyed 23.3% 24.2% 0.9% Region - Southeast 23.3% 24.2% 0.9% All (1000 - 1,999 FTE's ) 23.5% 24.2% 0.7% For Profit (500-1,999 FTE's) 21.9% 24.2% 2.3% Government/Not- For-Profit (500 - 1,999 FTE's) 24.0% 24.2% 0.2%
The above table shows that the difference between the District’s benefit costs as a
percentage of payroll is within one percent for all surveyed organizations, all
organizations located in the southeast U.S. region, and all organizations between 500 to
1,999 full-time equivalent employees (FTE’s). The District’s benefit costs were 2.3%
higher than the average For-Profit organization with 500 to 1,999 FTE’s. However, also
notable is that the District’s HR benefit costs are within 0.2% of the Governmental/Not-
______________________________________________________________________________ Report on Employee Benefits Page 18 Office of Inspector General
For-Profit category with 500 to 1,999 FTE’s. Thus, Governmental/Not-for-Profit
organizations fringe benefits nationwide appear to be about two percentage points higher
than For-Profit organizations. One possible explanation for this trend maybe that many
For-Profit organizations provide employees with stock based compensation in addition to
fringe benefits. Since such compensation methods are not available to
Governmental/Not-For-Profit organizations they must compensate for this difference in
other ways in order to be competitive when recruiting employees.
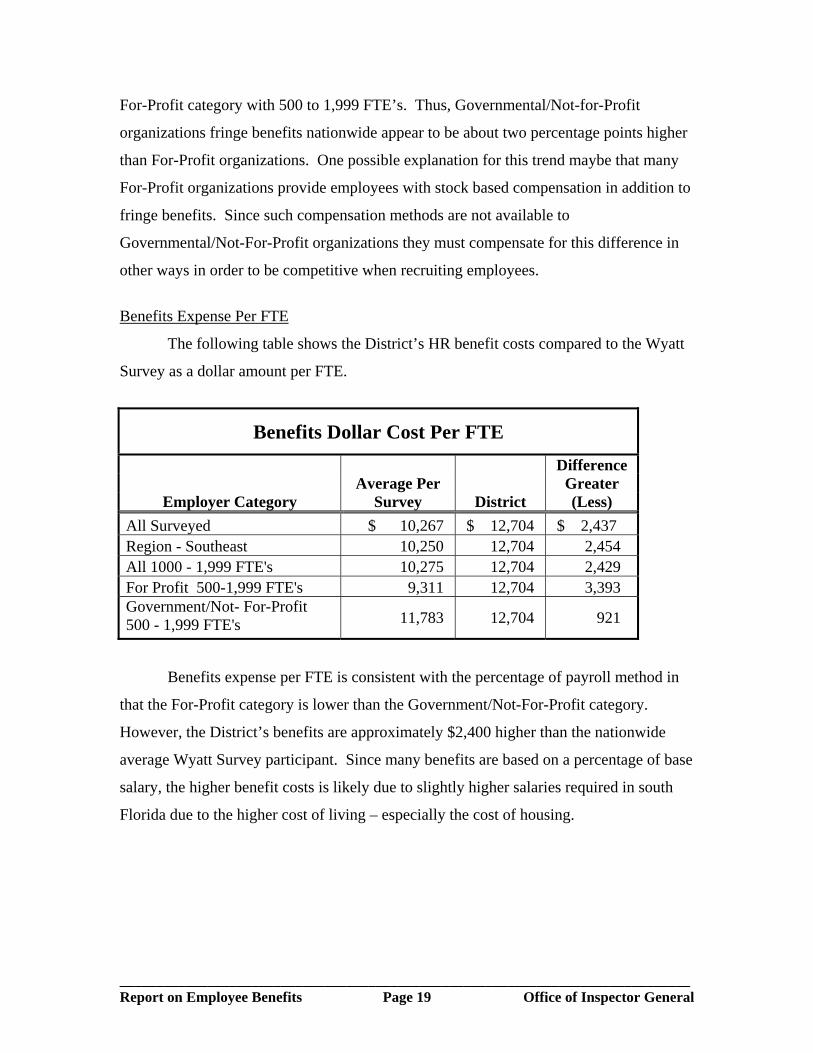
Benefits Expense Per FTE
The following table shows the District’s HR benefit costs compared to the Wyatt
Survey as a dollar amount per FTE.
Benefits Dollar Cost Per FTE
Difference Average Per Greater
Employer Category Survey District (Less) All Surveyed $ 10,267 $ 12,704 $ 2,437 Region - Southeast 10,250 12,704 2,454 All 1000 - 1,999 FTE's 10,275 12,704 2,429 For Profit 500-1,999 FTE's 9,311 12,704 3,393 Government/Not- For-Profit 500 - 1,999 FTE's 11,783 12,704 921
Benefits expense per FTE is consistent with the percentage of payroll method in
that the For-Profit category is lower than the Government/Not-For-Profit category.
However, the District’s benefits are approximately $2,400 higher than the nationwide
average Wyatt Survey participant. Since many benefits are based on a percentage of base
salary, the higher benefit costs is likely due to slightly higher salaries required in south
Florida due to the higher cost of living – especially the cost of housing.
______________________________________________________________________________ Report on Employee Benefits Page 19 Office of Inspector General
Conclusion
The District’s benefit costs are slightly higher than For-Profit organizations;
however, Governmental/Not-for-Profit organization’s fringe benefits also tend to be
slightly higher than the For-Profit sector based on the Wyatt Survey’s nationwide data.
The District’s benefit costs appear to be in line when compared to the nationwide average
for Governmental/Not-For Profit organizations.
______________________________________________________________________________ Report on Employee Benefits Page 20 Office of Inspector General