south eastern europe journal of economics 1 (2004) 35-58
TRANSCRIPT

1. Introduction
A large number of studies have been devoted to the estimation of systematic risk, i.e.beta, since the Capital Asset Pricing Model (CAPM) of Sharpe (1964), Lintner (1965)and Black (1972) was introduced for the first time. However, the empirical evidenceto date on the CAPM prediction has been inconclusive. The literature on CAPM tests
ASECUASECU
CAPM Anomalies and the Efficiency of Stock Marketsin Transition: Evidence from Bulgaria
MIROSLAV MATTEEVDepartment of Business, American University in Bulgaria
AbstractThis paper investigates empirically the relation between average return andbeta in the Bulgarian stock market. First, using a sample of common stockstraded on the BSE-Sofia, the study examines the effects of infrequent tradingon beta estimates, measured from daily, weekly and monthly return intervals.It aims to find out whether the differences in the stability of systematic riskestimates can be explained by infrequent trading. Second, the study investigatesthe role of beta and other commonly recognized variables (size, book-to-marketequity, asset-to-market equity, asset-to-book equity and price) in explainingcross-sectional variations in average returns over the period from January1998 to December 2002. Evidence indicates that beta, size, market and bookleverages are priced, whereas significant book-to-market equity and priceeffects are not observed on the BSE-Sofia. These findings are in contrast tothe evidence from other markets that the relation between average returnand beta is flat, and size and book-to-market equity effects are significant.
JEL Classification: G12
Keywords: average return, beta, cross-sectional regression, emergingmarkets, market in transition.
South Eastern Europe Journal of Economics 1 (2004) 35-58
Corresponding address: International Projects and Research Department, Institute of Public Ad-ministration and EU Integration, 1000 Sofia, Bulgaria, e-mail: [email protected]
I am grateful for the support of Atanas Videv, a broker of the UnionBank, for providing relevantfinancial and market data.

36 M. MATEEV, South-Eastern Europe Journal of Economics 1 (2004) 35-58
has documented at the same time a number of CAPM anomalies1 which give causeto doubt that beta is the only relevant measure of the systematic risk.
In their seminal study Fama and French (1992) found that (a) beta does not seemto help explain the cross-section of average stock returns, i.e. the relation betweenbeta and average return is flat, and (b) the combination of size and book-to-marketequity seems to absorb the roles of leverage and earnings/price ratio in average stockreturns, at least during the 1963-1990 sample period. The Fama and French (FF)results lead to a number of other investigations of the beta-expected return relation-ship. Within a similar two-step Fama and MacBeth (1973) procedure using U.S.stock data Davis (1994) and He and Ng (1994) both found considerable evidence tosupport FF results, while Kothari et al. (1995) find an economically and statisticallysignificant role for beta, although there remains a statistically significant role for sizein their cross-sectional regressions, with the slope coefficient estimated to be stronglynegative, a result similar to the original results of FF.
Some recent studies have tended to counter the findings of Fama and French(1992). These studies suggest some support for a positive relationship between re-turn and beta (e.g., Chan and Lakonishok, 1993, Kothari et al., 1995, Kim, 1995,and Jagannathan and Wang, 1996). The differences between their results and FFevidence seem to be due to the time period examined, return interval over which betais estimated, the form in which the CAPM is estimated and statistical issues. Pettengillet al. (1995) developed a conditional relationship between return and beta whichdepends on whether the excess return on the market index is positive or negative.They found that in periods when the excess market return is positive (up market)there is a significant positive relationship between beta and return. In periods whenthe excess market return is negative (down market), there is a negative relationshipbetween beta and return.2 Fletcher (1997) examined the conditional relationship be-tween beta and return proposed by Pettengill et al. (1995) to UK stock market andfound that when monthly cross-sectional regressions of portfolio returns on betaand size are used the evidence suggests that there is no significant positive riskpremium on beta. His finding is consistent with Fama and French (1992) and Jagan-nathan and Wang (1996) for the U.S. stock market and also with Strong and Xu(1994) on UK stock returns.
1. The variables (other than beta) that were found to have relations with returns include primarily firmsize (ME), book-to-market equity (BE/ME), financial leverage (A/ME), earnings-price (E/P) ratio,dividend yield (DY) and stock price (P) (e.g., Fama and French, 1992).2. This is because high beta stocks are more sensitive to the negative market excess return and have alower return than low beta stocks.

37M. MATEEV, South-Eastern Europe Journal of Economics 1 (2004) 35-58
Kothari, Shanken and Sloan (KSS, 1995) found that using betas estimated fromannual rather than monthly returns produces a stronger positive relation betweenaverage return and beta. They contend that the relation between average returns andBE/ME observed by Fama and French (1992) and others3, is seriously exaggeratedby survivor bias in the COMPUSTAT sample. KSS (1995) find also that size (marketcapitalization) adds to explanation of average return provided by beta. Variables that(unlike size) seem to be correlated with beta, such as earnings/price, cash flow/price, BE/ME and past sales growth, add even more significantly to the explanationof average return provided by beta. This finding is in line with other studies (e.g.,Basu, 1983, Chan and Chen, 1991, Fama and French, 1992, 1993 and 1996, andLakonishok et al., 1994).
In contrast to the extensive research in the U.S. and Japan relating the cross-sectional behavior of stock returns to market risk and firm characteristics, there hasbeen very limited research related to the emerging markets. Chui and Wei (1998)examine the relationship between average stock return and market beta, book-to-market equity and size in five emerging markets in the Pacific-Basin region: Hong-Kong, Korea, Malaysia, Taiwan and Thailand. The results from the cross-sectionalregressions show that except for Taiwan and Thailand, average excess returns in allmarkets are positively related to book-to-market equity and, in general, are negative-ly related to size. At the same time the relation between stocks returns and marketbeta is ‘flat’ for all the markets.4
Given the scarce evidence on CAMP anomalies based on data from emergingmarkets and the fact that no work of a type similar to Fama and French (1992) hasbeen performed on transition markets, this study attempts to look into the role playedby different risk factors, in addition to beta, in pricing Bulgarian equity stocks. Thepaper is organized as follows. In the next section the beta estimation model and thedata used are described. The empirical analysis is carried out using the two-stepregression technique. Then, the empirical results from the regressions are presentedand discussed in breadth. In the following section the cross-sectional regressions
3. Fama and French (1996) argue that survivor bias cannot explain the relation between average returnand BE/ME. They formed 100 equal-weight portfolios on size and beta and run univariate cross-sectionregressions of monthly and annual portfolio returns on their betas and natural log of the average sizeof the stocks in each of the 100 portfolios. Confirming Banz (1981) the results reject the centralCAPM hypothesis that beta suffices to explain expected return.4. When stocks are used in the regressions, similar to the results found from using size-BE/ME portfo-lios, the market beta does not have any power to explain the cross-sectional variation of the stockreturns. Chui and Wei (1998) use Scholes and Williams’ (1977) beta, where the beta coefficient is thesum of the slopes in the regression of the monthly returns on a stock on the lead, the current, and thelag month’s value-weighted market return.

38 M. MATEEV, South-Eastern Europe Journal of Economics 1 (2004) 35-58
and the test results are presented in an attempt to estimate the role of the major riskfactors (variables), included in the model. Finally, in the last section conclusions aredrawn.
2. Beta estimation for assets traded on the BSE-Sofia
2.1 Model structure and data used
Apart from the difficulties connected with the lack of a sufficiently reliable databaseon stock prices, the estimation of beta coefficients using historical data faces somestatistical problems. For instance, with the so-called ‘intervalling’ effect, one is usu-ally referring to the problems caused by measuring stock returns from different timeintervals.5 The basic implication of the intervalling effect is the non-synchronousbias in the estimation of market betas. The effect of non-synchronous bias is due tothe fact that, because of the thin trade, stock returns are not measured from identicaltime intervals (for evidence when daily betas are estimated see e.g., Hawawini, 1983).Unlike other similar studies, where only monthly returns are used, this study exam-ines betas estimated from daily, weekly and monthly return intervals. Assuming thatthe differences between beta estimates are entirely due to larger standard errors ofthe betas based on longer return intervals (in this case a month), these betas shouldbe less related to the return variations. On the other hand, if the beta estimates basedon shorter return intervals are significantly biased by infrequent trading, their abilityto explain return variation will be low (for evidence see e.g., Martikainen, 1991 onFinnish data).
The beta coefficients are calculated using Sharpe’s market model (Sharpe, 1964),i.e. from the following regression equation:
t,it,miit,i rr ε+β+α= , (1)
where: rit = excess return of stock i in period trmt = return of market portfolio m in period tαi = estimated intercept term for stock iβi = estimated beta coefficient of stock iεi = residual term (estimated unsystematic return component of stock i in period t)
5. Cohen et al. (1983) argued that the fundamental cause of the intervalling effect bias is the frictionin the trading process which delays the adjustment of a security price to informational change, andshowed how price adjustment makes security returns serially correlated and hence lead to biasedestimates of the true betas.

39M. MATEEV, South-Eastern Europe Journal of Economics 1 (2004) 35-58
Estimating beta from equation (1) is sensitive to the choice of appropriate marketindex6 used as a proxy of the market portfolio. The study uses the value-weightedapproach when computing the market index. Two market indices have been used inthe empirical tests – an index that includes all stocks in the sample and an officialmarket index. Because the official index of Bulgarian stock exchange (BSE)-Sofiawas introduced for the first time in October 2000, the market index returns over theperiod 1998-2000 had to be additionally computed. This was done by using theprices of the same stocks that were subsequently included in the official index andweighted by the market capitalization of the companies at the moment when thestock enters the index. The study uses continuously compounded returns deter-mined as changes in the logarithmic price indices.7 Here prices are corrected for paiddividends, splits and new issues.
One of the most crucial aspects when measuring beta from different return inter-vals is that of their stability over time. A study of Dimson and Marsh (1983) indicat-ed that betas of stocks listed on thin markets seem to be of markedly stable nature.In addition, they reported that daily returns would generate more stable beta esti-mates than weekly returns, and the betas based on weekly returns would be morestable than betas measures from monthly returns. Martikainen (1991), using datafrom the Finnish stock market, provided evidence that betas estimated from dailyand weekly return intervals were found to be more stationary than betas on monthlyreturn. A plausible explanation for this phenomenon in the economic literature is thatthe thin trading creates the impression of stability as regards the beta coefficients.8
Based on these findings we expect that the results for betas estimated from shorterreturn intervals would be similar for stocks traded on BSE-Sofia.
6. According to Fama and French (1996) it is possible that the apparent empirical failures of theCAPM are due to bad proxies for the market portfolio. In other words, the true market is mean-variance-efficient, but the proxies used in empirical tests are not.7. The changes in the logarithmic price indices can be regarded as good approximations of the returnsin case of thin trading. For a day with no trade, the true price is proxied by the bid quotation. Whenseveral bid prices for the same stock on the same day have occurred, the weighted average of theseprices has been computed. The weekly returns are calculated using Friday-to-Friday returns. Themonthly returns are calculated using differences between the closing values of price indices for eachmonth. The returns are computed for the whole sample period from January 1998 to December 2002.8. In addition, more stable estimates for beta can be obtained by lengthening the estimation period, i.e.by increasing the number of observations in a given return interval (see e.g., Martikainen, 1991 onFinnish data).

40 M. MATEEV, South-Eastern Europe Journal of Economics 1 (2004) 35-58
2.2 Empirical results and discussion
The sample data set contains 160 common stocks traded on the Bulgarian stockexchange during the sample period from January 1998 to December 2002. We applythe following two criteria for the selection of sample stocks. First, a stock musthave active trading. Any stock without a trading record during the whole test period(01/2000-12/2002) is disregarded (with a few exceptions). Second, a stock shouldhave at least 9 monthly returns in the 24-month period before January 2000. Thus,the total number of stocks, listed on the BSE-Sofia by the end of 2002, is reduced to160 (see Appendix 1). In this way, the problem with thin trading on the Bulgarianstock exchange can be partially overcome, which is important when determiningstock returns on different time intervals, especially those on daily intervals. Thus,the stock returns on daily, weekly, and monthly time intervals are computed usingchanges in the price indices. The obtained excess returns (over the risk-free rate ofreturn) are then used to estimate the beta coefficients. The regression equation (1) isrun for each sample stock using time-series data for the whole sample period. Theestimates for betas are calculated using the OLS technique.
The results of the regressions are in line with other similar studies and indicatethat beta coefficients, estimated on longer return intervals (in this case on monthlyreturn) have higher values than betas measured from daily returns. Another interest-ing observation is that the average betas are clearly less than unity. This phenomenonis mainly due to the thin trading with the stocks of most of the companies includedin the sample, and partially to the value-weighted market index9 (VWI) used in theregressions. One possible explanation is that the returns of the small companies inthe sample are probably less correlated with the value-weighted returns of the index(dominated by the large firms) than the returns of the large companies with the indexreturns. As a result the larger companies have higher beta estimates than the othercompanies in the sample. When the official market index (SOFIX), computed forthe whole sample period, is used as a proxy of the market portfolio in equation (1),the estimated beta coefficients have lower values (compared to betas from the re-gressions using VWI). However, the number of the statistically significant coeffi-cients (at the usual 5% and 10% levels) remains relatively small. This number variesfrom 25 (for betas estimated on weekly return intervals) to 51 (for betas estimatedon daily return intervals).
9. The index includes all the 160 common stocks in the sample weighted with the market capitalizationof the sample companies by the end of each time interval (day, week or month).

41M. MATEEV, South-Eastern Europe Journal of Economics 1 (2004) 35-58
The basic statistical properties of the beta coefficients are reported in Table 1.The whole sample period is divided into two sub-periods: 1998-1999 and 2000-2002, because frequent trading on the BSE-Sofia is observed after May 2000. Theresults indicate that beta coefficients estimated for the whole sample period (5 years)are more significant than betas estimated for each of the two sub-periods (becauseof the smaller number of observations in the sub-periods).
Table 1. Basic statistical properties of the estimated beta coefficients for the wholesample period and sub-periods
The following conclusions can be drawn from the statistics in Table 1:1. Betas estimated on monthly return intervals have higher values than betas
measured from daily and weekly returns (for both cases of regressions based onVWI and SOFIX indices). Their mean for the whole sample period is 0.1757, whereasthe means of daily and weekly betas are respectively 0.1135 and 0.1229.
2. Betas based on weekly return intervals seem to be more stable within thesample, as well as over time, when compared to betas estimated on daily and month-ly returns. At the same time, the monthly betas have the highest standard deviation(0.3672) compared to the daily and weekly betas – respectively 0.2611 and 0.2511.When the official index SOFIX is used in the tests instead of the value-weightedindex (VWI), the daily beta estimates have the lowest standard deviation (0.1280).
Mean Standard deviation Number of negative betas
VWI SOFIX VWI SOFIX VWI SOFIX Daily betas 1998 - 2002 0.1135 0.0264 0.2611 0.1280 46 68 1998 - 1999 0.1395 0.0207 0.3783 0.2010 50 75 2000 - 2002 0.0892 0.0222 0.2330 0.1386 40 57 Weekly betas 1998 - 2002 0.1229 0.0299 0.2511 0.1383 46 63 1998 - 1999 0.1657 0.0210 0.4493 0.1986 61 81 2000 - 2002 0.0861 0.0318 0.2489 0.1554 52 58 Monthly betas 1998 - 2002 0.1757 0.0898 0.3672 0.2217 46 50 1998 - 1999 0.1549 0.0856 0.5949 0.4473 62 65 2000 - 2002 0.1565 0.0910 0.3303 0.2156 47 54

42 M. MATEEV, South-Eastern Europe Journal of Economics 1 (2004) 35-58
3. The number of stocks with negative betas is remarkably small in the case ofregressions using the value-weighted market index, VWI (46 for the whole sample,regardless of the return intervals), compared to the case of regressions based on theofficial index SOFIX (68 for whole sample when using daily return intervals). Themain reason for negative beta estimates is the negative excess returns of most of thesample stocks over the observation period.
4. The low values of the determination coefficient, R2 (not reported here), indi-cate that the market risk (beta) could account for only a small part of the variationsin the stock returns, listed at the BSE-Sofia. Furthermore, the number of statisticallysignificant betas is too small, no matter which market index is used in the model (1).
In conclusion, the results from the study of Bulgarian stock returns support theevidence that beta coefficients, estimated on daily and weekly return intervals, seemto be more stable than betas, based on monthly returns, and are consistent with theresults from other countries (e.g., Martikainen, 1991 on Finnish data). This findingjustifies the use of weekly betas in the following cross-sectional regressions.
3. Cross-sectional regressions and empirical results
3.1 Data and methodology used
According to the basic assumptions of CAPM, the relation between expected returnand beta is linear. At the same time, some authors, among them Fama and French(1992), find out that the risk-return relationship is flat, while the combination be-tween size (ME) and book-to-market equity (BE/ME) has a higher pricing effect inthe cross-regressions of expected return.10 According to them the two variables(size and BE/ME) are sufficient to explain the cross-variations in the average return.The study of the CAPM prediction in Bulgarian stock market gives some preliminaryevidence that, despite the thin trading and impossible short sales, there is a linearpositive relation between beta and expected return (e.g., Mateev, 2000). This studyaims to corroborate or to repudiate these preliminary results, and to provide addi-tional evidence on the existing CAPM anomalies in the Bulgarian stock market.
The data set includes 160 common stocks, traded on the BSE-Sofia, during thesample period from January 1998 to December 2002 (259 weeks). Relevant marketdata of these sample companies are compiled from the BSE-Sofia database (daily
10. Like Fama and French some other authors (e.g., Chan and Chui, 1996) find that it is not the beta,but the BE/ME variable that is statistically significant for the estimation of the average return. Inaddition to this they contend that there is a considerable estimated effect, caused by the dividend yield(DY) and not by the market equity (ME).

43M. MATEEV, South-Eastern Europe Journal of Economics 1 (2004) 35-58
and weekly bulletins), and are used to compute the variables used in the model,namely beta (β), market equity (ME), and market indices return (VWI and SOFIX).As in most studies (e.g., Fama and French, 1992), financial institutions are excludedfrom this study11 with two exceptions: The Economic and Investment Bank (EIB)and The Central Cooperative Bank (CCB). In addition, the value-weighted returns ofa portfolio, including all sample stocks and the return of three-month governmentbonds (Treasury bills) are used as proxies respectively for the return of marketportfolio and the risk-free rate of return. The returns of sample stocks and that ofthe market index are computed as excess return above the risk-free rate of return,and used in the two-step regression procedure, set forth below.
The research methodology follows Ho et al. (2000) and consists of four basicsteps to testing the model, namely portfolios formation, post-ranking betas estima-tion, regression procedure of Fama and MacBeth (1973) and testing the zero hy-potheses.
First, the 160 sample stocks are grouped into 16 portfolios of 8 to 11 stocks eachon the basis of firm size (ME) and then beta. For this purpose, the logarithm of sizeas at the end of December 1999 is computed for each of the stocks as a proxy of thesize (market equity). Then, the so-called ‘pre-ranking’ betas are estimated for theindividual stocks in each group of portfolios using time-series data for 24 months or96 weeks (01/1998 –12/1999). The 160 stocks are first ranked in an ascendingorder of the logarithm of size, and then sorted into four size groups (quartiles) fromthe smallest (ME1) to the largest (ME4) group, each of which contains 36-40 stocks.The stocks within each sub-group (size quartile) are then ranked in an ascendingorder of their pre-ranking beta estimates12 (based on weekly return interval) andsorted into four risk sub-groups (quartiles) from the lowest risk (β1) to the highestrisk (β4).
11. There are two reasons why the financial institutions are not included in the research of Fama andFrench (1992). First, the majority of the book assets of most financial institutions, such as loans ofcommercial banks and investment portfolios held by insurance companies or investment trusts, areaccounted according to their market value. Therefore, it is possible that financial ratios of thesecompanies in which the book assets is a component, e.g. BE/ME, A/ME and A/BE, may not have thesame interpretation as those of the other companies. Second, since the financial institutions typicallyhave a higher leverage, this high level of leverage for financial companies may not have the samemeaning as for non-financial companies.12. Since the trade with some of the sample stocks, listed on the BSE-Sofia, started after the beginningof the observation period (January 1998), the number of observations of the weekly returns of thesestocks, used to estimate the pre-ranking betas, varies from 12 to 103. This is another reason whymonthly betas cannot be used in the study.

44 M. MATEEV, South-Eastern Europe Journal of Economics 1 (2004) 35-58
Thus, a total number of 16 portfolios, namely ME1/β1, ME1/β2,….., ME4/β4,each containing between 8 and 11 sample stocks13, are formed (see Table 2). Theportfolios are formed on size because size produces a wide spread of average re-turns and betas, but size and betas of portfolios (ranked on size) are highly correlat-ed so that traditional asset pricing tests lack power to separate size from beta effectsin average returns (for evidence see e.g., Chan and Chen, 1988). Therefore, theformation of portfolios on size and then pre-ranking betas allows for variations inbetas that are not related to size. This makes the two-step procedure appropriate forthe purposes of this study.
Table 2. Number of stocks in portfolios ranked on size and then pre-ranking betas
The next step is to estimate the so-called ‘post-ranking’ betas for each of the 16portfolios, grouped on size and then pre-ranking betas, using time-series data for a154- week period (01/2000 – 12/2002). For this purpose the value-weighted returnsof the 16 portfolios are computed for each week of the sample period. Then, theregression equation (1) of the weekly excess returns is run on the market indexreturns for the full test period to estimate the portfolio post-ranking betas. The test-period post-ranking beta estimates of a size-beta portfolio are then assigned to eachstock in that portfolio.
The Fama and MacBeth (1973) cross-regressions are then run for each of the154 weeks of the test period (01/2000 – 12/2002). The excess returns (dependentvariable) of the 156 individual stocks for each of the 26 weeks from January to Juneof year t are regressed cross-sectionally on the explanatory variables, computed on
beta 1 beta 2 beta 3 beta 4 МЕ 1 8 8 8 8 33 МЕ 2 10 10 10 9 39 МЕ 3 11 11 11 10 43 МЕ 4 10 10 10 11 41 Total: 156
13. The actual number of stocks, included in the 16 size-beta portfolios, is 156 because there is nosufficient number of observations of four companies (BSH, ASTEH, ARMHL and KTEX) during theperiod 01/1998-12/1999, in order to estimate their pre-ranking betas. These companies were listed onthe Bulgarian stock exchange considerably later than the others in the sample.

45M. MATEEV, South-Eastern Europe Journal of Economics 1 (2004) 35-58
the basis of data available at the end of June of year t - 1. For the next 26 weeks fromJuly to December of year t the regressions are run based on data available at the endof December of year t - 1.14 This approach represents a modification of the traditio-nal Fama and MacBeth (1973) methodology in two aspects. First, the use of full-period post-ranking betas helps minimize the ‘error in the variables’ problem andenhances also the precision of beta estimation. Second, the allocation of portfoliopost-ranking betas to individual stocks in the portfolio makes possible the use ofindividual stock data rather than portfolio data in the cross-sectional regressions,thus improving the statistical power of the tests (for evidence see e.g. Ho et al.,2000).
Finally, the time-series average values of the γ-coefficients from the cross-re-gressions are computed for the whole test period (01/2000 – 12/2002). The t-statis-tics are then calculated to test the null hypothesis that these average γ estimates areequal to zero, i.e. to determine whether the explanatory variables are on averagepriced in the marketplace.
As a result, it is possible to estimate the role of the variables in cross-sectionalregressions in explaining the variations in asset returns on the Bulgarian stock mar-ket. The post-ranking betas used in the regressions are estimated based on the value-weighted index VWI and the official market index SOFIX.
3.2 Empirical tests and preliminary results
Table 3 contains the estimated values of the post-ranking betas, while Table 4 showsthe average excess returns of the 16 size-beta portfolios. The statistics in Table 3provide information on relevant features of the Bulgarian stock market. The firsttwo have important implications for the test methodology, whereas the second twoprovide preliminary evidence on size and beta effects on the average return of stocks,traded on the BSE-Sofia.
First, in each group of portfolios, ranked by size, the post-ranking betas followto a certain extent the ordering of the pre-ranking betas. This finding confirms theassumption that the post-ranking beta estimates are informative about the orderingof the true betas. This provides support to the use of post-ranking portfolio betasinstead of individual stock betas in the cross-sectional regressions. It is obviousfrom the statistics in Table 3 that, in any size quartile, the pre-ranking betas sort
14. The gap between the financial statements data and the stock returns (in this case six months) is toensure that the financial information for the companies, included in the sample, is made publiclyavailable before the stock returns it is used to explain.

46 M. MATEEV, South-Eastern Europe Journal of Economics 1 (2004) 35-58
achieves its goal in producing strong variations in post-ranking beta estimates thatare unrelated to the size.
Second, in contrast to the findings from the U.S. market (e.g., Fama and French,1992), but consistent with evidence on the Finnish market (e.g., Martikainen, 1991)and Hong Kong market (see Ho et al., 2000), the post-ranking betas generally varypositively with the size (except for the first group ME1). This implies that stockswhich form portfolios of higher size have higher beta estimates. The high correlationbetween the two variables (beta and size) is evidence supporting the relevance of thetwo-pass sort of portfolios on size and then beta in separating beta and size effectsin average returns.
Table 3. Post-ranking beta estimates over the period 01/2000-12/2002
* Statistically significant at 5% level** Statistically significant at 10% level
Third, comparing the results across the size quartiles, it becomes obvious thatthe average excess return (see Table 4) tends to decrease with increasing size (ex-cept for the last group ME4). This is in line with the results from the Fama andMacBeth cross-sectional regressions15 that a negative size effect exists. Anotherfeature noticeable from the statistics is that each of the four beta portfolios in thegroup with the smallest size (ME1) has higher average return than the correspondingportfolios in the group with the highest size (ME4). The negative average returns ofsome of the 16 size-beta portfolios indicate that the prices of stocks, included inthese portfolios, tend to decrease during the sample period. This phenomenon isoften observed at the BSE-Sofia.
Beta 1 Beta 2 Beta 3 Beta 4 МЕ 1 0.2219 0.2767 0.0412 -0.2254 МЕ 2 0.1015 0.0133 0.0341 0.0816 МЕ 3 0.1443* 0.4366** 0.0406 -0.0930 МЕ 4 0.4006* 0.3028* 0.6053* 1.1786*
15. The evidence on UK stock returns based on 100 portfolios grouped first by size and then by pre-ranking betas, indicates that the relationship between the size of the portfolios and the average returnappears U-shaped for many of the pre-ranking beta deciles (see e.g., Fletcher, 1997).

47M. MATEEV, South-Eastern Europe Journal of Economics 1 (2004) 35-58
Table 4. Average weekly excess returns over the period 01/2000-12/2000
Finally, and more important, Tables 3 and 4, together with Figure 1, provideevidence for a strong negative relation between the post-ranking betas and the aver-age returns of the 16 size-beta portfolios over the sample period. This implies that,on average, the systematic risk might not have been priced in the Bulgarian stockmarket. Another interesting result from the analysis (see Table 3) is that the system-atic risk might have been priced differently across companies of different size. Thoughthe results from Fama and MacBeth regressions cannot delineate clearly this differ-ential pricing effect across companies of different size, they do confirm the preli-
Beta 1 Beta 2 Beta 3 Beta 4 МЕ 1 0.0985 0.2041 0.3362 0.8632 МЕ 2 0.0108 0.1324 -0.3083 0.4487 МЕ 3 -0.2612 -0.0607 -0.2717 -0.1074 МЕ 4 -0.1551 0.1622 -0.2147 -0.1636
-0.60
-0.40
-0.20
0.00
0.20
0.40
0.60
0.80
1.00-0.40
-0.20
0.00
0.20
0.40
0.60
0.80
1.00
1.20
1.40
beta
aver
age
retu
rn, %
Figure 1. Post-ranking betas versus average excess returns of the size-beta sorted portfolios on theBSE-Sofia.

48 M. MATEEV, South-Eastern Europe Journal of Economics 1 (2004) 35-58
minary evidence from other similar works that market risk (beta) is not priced in theBSE-Sofia.16
3.3 Fama and MacBeth (1973) cross-sectional regression results
The model used in the empirical tests is a slightly modified version of Fama andFrench’s (1992) cross-sectional estimation model as follows:
(2)
where: Ri,t = excess return of stock i in period t βp = post-ranking beta of portfolio p, allocated to individual
stock i, included in portfolio p MEt-1 = market equity of stock i in period (t - 1)
BE/MEt-1 = book-to-market equity in period (t - 1) A/MEt-1 = asset-to-market equity in period (t - 1) A/BEt-1 = asset-to-book equity in period (t - 1) Pi,t-1 = price per share of stock i in period (t - 1)
Each of the explanatory variables in equation (2) is taken in natural logarithmrespectively of market equity, book-to-market equity, asset-to-market equity, asset-to-book equity, and price, in order to mitigate the problem of heteroscedasticity. TheFama and MacBeth (1973) cross-sectional regressions of the excess returns (depen-dent variable) of the 156 individual stocks in the sample are run on the explanatoryvariables (β, ME, BE/ME, A/ME, A/BE and P) for each week of the test period (01/2000- 12/2002).17 The residual term in the regression (2) is the estimated unsystem-atic risk component of the stock returns.
Table 5 summarizes the time-series mean values of the γ-coefficients estimatedfrom the cross-sectional regressions for full test period. The statistics in Table 5
i1t,i6
1t,i51t,i41t,i31t,i2p10t,i
u)P()BE/Aln()ME/Aln()ME/BEln()MEln(R
+γ+
γ+γ+γ+γ+βγ+γ=
−
−−−−
16. It is relevant to point out that the beta estimates and the size-beta portfolio returns are computedbased on publicly available data on stock prices and trade volumes on Bulgarian stock exchange for theperiod 1998-2002.17. The explanatory variables in the model (2) in period (t - 1) are computed on the basis of financialstatements data (e.g. BE, A) as at the end of the latest six-month reporting period that coincides with(t – 1), or market data (e.g. ME, P) as at the end of that period. In Bulgaria, financial statements datafor public companies are made available within six months of the end of the reporting period (onannual or semiannual base).

49M. MATEEV, South-Eastern Europe Journal of Economics 1 (2004) 35-58
provide relevant information on the role of the variables used in the model in pricingassets on the Bulgarian stock market.
First, the statistical results indicate that in both univariate regressions with betaas the only explanatory variable and multivariate regressions with beta in combina-tion with other explanatory variables, the estimated risk premium on beta is actuallynegative, although significant, which suggests a downward sloping relation betweenbeta and return (with average slope of -0.9755 when using the value-weighted mar-ket index VWI and -1.1421 when using the official market index SOFIX) (see PanelsA and B of Table 5). This confirms the preliminary evidence on beta role discussedabove. The result is in line with the evidence of some other studies (e.g., Fletcher,1997 in the UK and Ho et al., 2000 in Hong Kong). However, it contradicts theresults of many of the earlier works (e.g., Kothati et al., 1995), which suggestgenerally a positive relation between average return and beta. While the institutionaland structural features of developed stock markets do contribute to the negative betaeffect, the results of this study suggest that, in Bulgaria, the traditional CAPM mayindeed be misspecified so that some properties of the assets cannot be priced usingbeta or some risks other than beta are rewarded in the Bulgarian Stock market. Someauthors argue for a better applicability of the zero-beta CAPM rather than the stan-dard CAPM (e.g., Martikainen, 1991).
Second, the data from Table 5 indicate a marginally significant size effect in theBulgarian stock market with a positive risk premium (average slope respectively of0.278 and 0.1966) (see Panels A and B of Table 5). The result does not departsubstantially from the evidence for strong size effect in America, Hong Kong andother countries. To the extent that size reflects diversification of activities, marketliquidity, timeliness and quality of corporate information, available to all investors inthe market place, and level of the transactional costs, larger companies tend to havea lower risk and hence, lower return. In case of the Bulgarian capital market the sizeeffect, however, is positive. The result is not unexpected, bearing in mind that therelation between average return and beta is negative (see Figure 1).
Third, the ‘book-to-market equity’ variable plays no role in explaining the cross-sectional average return. The pricing effect of ln(BE/ME) is positive but statisticallyinsignificant in both cases of regressions (using VWI and SOFIX indices). Thisfinding is not consistent with those found in other developed markets (e.g., Famaand French, 1992 in the USA, and Chan and Chui, 1996 in the UK), and also in someemerging markets (e.g. Ho et al., 2000 in Hong Kong). In fact, according to Chanand Chen (1991), the risk captured by BE/ME might be the relative corporate dis-tress factor, i.e. companies that the market judges to have poor perspectives, sig-naled by high BE/ME ratio, have higher expected returns than companies with strongperspectives. Such evidence, however, is not found on the Bulgarian stock market.

50 M. MATEEV, South-Eastern Europe Journal of Economics 1 (2004) 35-58
Fourth, when the BE/ME variable is broken down into two components – marketleverage (A/ME) and book leverage (A/BE) - the relation between the average returnand these two variables (more precisely the logarithm of A/ME and A/BE) is signif-icant, although negative (with average slope of –0.3960 and –0.3640) (see Panel Aof Table 5). The evidence from other studies indicates that the BE/ME effect isalmost entirely due to the presence of market leverage but not of book leverage. Thatis, the market leverage subsumes the book leverage and thus captures the wholeeffect of the BE/ME variable. Hence, the market leverage may have properties sim-ilar to the book leverage, as is the case with UK and Hong Kong companies.18 This isnot observed in the Bulgarian stock market as the BE/ME effect is substituted by A/ME and A/BE variables. In fact, it is the difference between market and book lever-age that helps explain average returns; and the difference between the two leveragevariables is equal to BE/ME, i.e. ln(BE/ME) = ln(A/ME) – ln(A/BE). A high BE/MEratio indicates that a company’s market leverage is high relative to its book leverage.A company has a higher degree of market-imposed leverage because the marketjudges that its perspectives are poor and discounts its stock prices relative to theirbook value.
Finally, unlike the evidence from other countries this study finds an insignificantstock price effect, with a positive risk premium (average slope between 0.0465 and0.066). The low pricing effect of this variable can be partially accounted for by thelarger transaction costs for lower priced stocks in the marketplace – commissionsand bid-ask spread as a percentage of market price are negatively related to price ingeneral. On the Bulgarian stock market the relation between average return and priceis positive. This can be explained by the fact that stock price might be a proxy forcompany size. Table 5 indicates that the relation between average return and size onthe Bulgarian stock exchange is positive too.
In conclusion, the cross-sectional regression analysis helps disclose importantmarket variables (other than beta) that can explain the variations in the average re-turns on the Bulgarian stock market, when portfolio betas instead of individual stockbetas are used. Such variables are ME, A/ME, and A/BE. Some other significantvariables such as BE/ME and P are not priced in the marketplace. Table 6 summariz-es and compares the evidence from the Bulgarian stock market and those from othermarkets.
18. This might be attributed at least to the fact that certain assets of UK and Hong Kong companieshave been revalued so that they are recorded in the financial statements at their market value insteadof historical price (Chan and Chui, 1996 in the UK and Ho et al., 2000 in Hong Kong).

51M. MATEEV, South-Eastern Europe Journal of Economics 1 (2004) 35-58Ta
ble
5. A
vera
ge γ
-coe
ffic
ient
s fr
om c
ross
-sec
tiona
l re
gres
sion
s of
exc
ess
retu
rn o
n be
ta, s
ize,
boo
k-to
-mar
ker
equi
ty, m
arke
t lev
erag
e bo
ok le
vera
ge a
nd p
rice
for t
he fu
ll-te
st p
erio
d 01
/200
0 - 1
2/20
02
i1
t,i6
1t,i
51
t,i4
1t,i
31
t,i2
p1
0t,i
u)P
ln(
)B
E/
Aln
()
ME
/A
ln(
)M
E/
BE
ln(
)M
Eln
(R
+γ
+γ
+γ
+γ
+γ
+β
γ+
γ=
−−
−−
−
PAN
EL А
. Ave
rage
γ -es
timat
es a
nd v
alue
-wei
ghte
d in
dex
(VW
I)а
0γ
1γ
2γ
3γ
4γ
5γ
6γ
coef
ficie
nts
-3.1
879
-0.9
755*
0.
2783
**
0.14
43
-0.3
960*
-0
.364
4**
0.04
66
t-sta
tistic
s -1
.345
1 -2
.195
9 1.
7382
1.
2559
-2
.859
5 -1
.911
2 0.
3837
PA
NEL
B. A
vera
ge γ -
estim
ates
and
off
icia
l mar
ket i
ndex
(SO
FIX
)b
0γ
1γ
2γ
3γ
4γ
5γ
6γ
coef
ficie
nts
-2.1
018
-1.1
421
0.19
66
0.12
38
-0.4
060*
-0
.349
1**
0.05
61
t-sta
tistic
s -0
.896
1 -1
.545
3 1.
2538
1.
0771
-2
.971
9 -1
.838
5 0.
4562
a Pa
nel A
of
Tabl
e 5
uses
bet
a co
effic
ient
s es
timat
ed o
n th
e ba
sis
of th
e va
lue-
wei
ghte
d in
dex
(VW
I) th
at in
clud
es a
ll st
ocks
in th
e sa
mpl
eb P
anel
B o
f Tab
le 5
use
s be
ta c
oeff
icie
nts
estim
ated
on
the
basi
s of
the
offic
ial m
arke
t ind
ex (S
OFI
X) c
ompu
ted
for t
he w
hole
sam
ple
perio
d*
Stat
istic
ally
sig
nific
ant a
t 5%
leve
l**
Sta
tistic
ally
sig
nific
ant
at 1
0% l
evel

52 M. MATEEV, South-Eastern Europe Journal of Economics 1 (2004) 35-58
Table 6. CAPM anomalies: comparing evidence from prior studies and from thisstudy
The results in Table 6 indicate that the relation between average return and beta isflat for all stock markets except for Bulgaria. Still, beta plays a role in explainingaverage stock returns on the BSE-Sofia. On the other hand, the size effect is margin-ally positive in contrast to the evidence from other markets that a negative or flatrelation between average return and size exists. At the same time the effect of book-to-market equity on average returns is insignificant on the Bulgarian stock marketand is replaced by A/ME and A/BE variables. Finally, the stock price is found to playno role in the pricing of the Bulgarian equity stocks, a result similar to that in someother markets. The evidence on CAPM anomalies confirms the finding that the Bul-garian stock market is inefficient.
4. Conclusions
This paper examines empirically the relation between average return and beta on theBulgarian stock market, using a sample of 160 common stocks traded on the BSE-Sofia. In the first part, the study investigates the effects of infrequent trading onsystematic risk estimates, based on daily, weekly and monthly return intervals. Sig-nificant trading frequency effects on the values of beta estimates were found. Thesewere assumed to be caused by the effects of non-synchronous trading bias whenmeasuring stock returns from different time intervals. The non-synchronous tradingleads to the underestimation of betas of infrequently traded stocks. The effect ofinfrequent trading was found to be strongest when daily return intervals were usedin beta estimation. Concerning the stability of the beta estimates, the betas based on
Relation with average return Explanatory
variables Developed markets
(USA, UK and Japan) Emerging markets (Hong Kong, Korea, Malaysia, Taiwan and Thailand )
Markets in transition (Bulgaria)
β Positive or 0 0 Negative ME Negative or 0 Negative or 0 Marginally positive BE/ME Positive Positive or 0 0 A/ME Positive Positive or 0 Negative A/BE Negative or 0 0 Marginally negative E/P Positive or 0 0 n.a. DY Positive or 0 0 n.a. P Negative or 0 Negative or 0 0

53M. MATEEV, South-Eastern Europe Journal of Economics 1 (2004) 35-58
daily and weekly returns were found to be more stable than the betas based onmonthly returns. In addition, it was found, in contrast to evidence from other coun-tries, that beta coefficients are much less than unity. This phenomenon is mainly dueto the thin trading and the value-weighted market index used in the tests.
In the second part of the study the relation between average stock return andbeta, size, book-to-market equity, market leverage, book leverage and price is exam-ined. The Fama and MacBeth cross-sectional regressions are used to explain thevariations in average returns on the Bulgarian stock market, when portfolio post-ranking betas instead of individual stock betas are used in the tests. The resultsindicate, in contrast to the evidence from other markets, that beta, size, market andbook leverages are priced on the Bulgarian stock market, whereas significant book-to-market equity and price effects are not observed in the marketplace. The vari-ables (except beta) that are found to have a significant role in pricing the Bulgarianequity stocks might be proxies for certain firm-specific characteristics, which betafails to capture fully, or proxies for certain risks (other than systematic risk) andcosts. The observed anomalies on the BSE-Sofia imply that the traditional CAMPmight be misspecified and does not correctly and adequately describe price behaviorin the Bulgarian stock market, or that the market is inefficient. Further empiricalwork is required to examine the reasons that would explain these anomalies and tofind other relevant and appropriate variables that determine the average returns onthe BSE-Sofia.

54 M. MATEEV, South-Eastern Europe Journal of Economics 1 (2004) 35-58
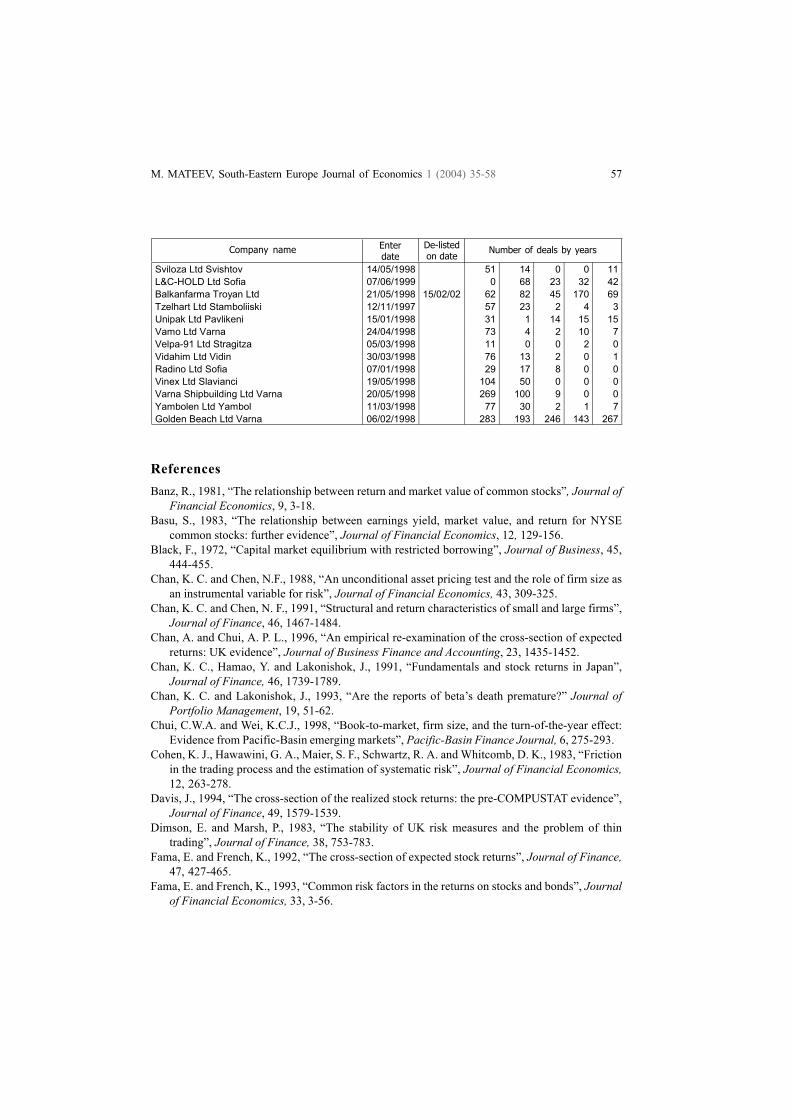
Appendix 1. Number of companies included in the sample based on the frequencyof trading (number of deals)
Company name Enter date De-listed on date Number of deals by years
1998 1999 2000 2001 2002 Akcioner Favorit Holding Ltd Sofia 06/04/1999 0 85 131 129 251 Agrobiohim Ltd Stara Zagora 06/05/1998 148 30 1 3 0 Agria Ltd Plovdiv 19/05/1998 14 11 1 0 0 AKB Corporation Holding Ltd Sofia 30/10/1998 9 0 5 1 2 Albena Ltd - tourist resource Albena 31/10/1997 362 745 512 344 448 Albena Invest Holding Ltd Sofia 09/11/1998 117 530 584 521 689 Alen Mak Ltd Plovdiv 20/11/1997 88 24 3 10 31 Alkomet Ltd Shoumen 06/02/1998 145 12 11 4 9 Balkanfarma Razgrad Ltd 19/05/1998 18/10/01 228 144 122 62 0 Andela Ltd Burgas 19/10/1998 6 3 7 0 0 Antikoroza Ltd Knega 19/12/1997 0 0 0 8 19 Ariana Ltd Sofia 21/10/1997 21 43 15 11 29 Army Holding Sofia 07/12/1999 0 0 34 2 0 Asenovgrad BT Ltd Asenovgrad 28/10/1997 54 11 4 4 3 Asenova Krepost Ltd Asenovgrad 19/05/1998 42 7 13 7 16 Asansiorna Technica Ltd Dupnitza 18/02/2000 0 0 13 6 0 Balkankeramik Ltd Novi Iskar 09/04/1998 12 0 1 1 0 Balkan Ltd Lovetch 08/05/1998 15 3 0 0 66 Bulgar-Czech Invest Holding Ltd Smolian 03/04/2000 0 0 2 4 11 Belopal Ltd Beloslav /Turgovishte/ 14/05/1998 2 1 1 0 1 Bentonit Ltd Kurdgali 21/09/1999 0 11 17 2 2 Mashproektengineering Ltd Stara Zagora 10/12/1998 2 11 3 4 7 Bestur Ltd Pazardjik 05/02/1998 5 19 1 0 0 Bulgarian Holding Company Ltd Sofia 08/04/1999 0 131 273 137 305 Bimas Ltd Rousse 29/04/1998 97 78 1 3 0 Biovet Ltd Peshtera 19/05/1998 199 81 112 70 380 Biser Oliva Ltd Stara Zagora 18/11/1997 1 2 3 148 7 Blagoevgrad BT Ltd Blagoevgrad 06/11/1997 317 348 214 218 303 TB Economic and Invetsment Bank Sofia 22/06/1998 40 6 4 8 2 Briz Ltd Sevlievo 06/02/1998 3 17 3 0 0 Bulgartabac Holding Ltd Sofia 21/11/1997 496 489 216 121 206 Buket Ltd Nova Zagora 05/08/1998 32 4 2 6 3 Bulgaria-K Ltd Kazanluk 31/03/1998 39 2 0 2 3 Bulgaria-29 Ltd Sofia 03/02/1998 23 26 1 124 47 Bulgarian Rose-Plovdiv Ltd Plovdiv 20/05/1998 21 22 12 99 48 Bulgarian Shugar Ltd Dolna Mitropolia 20/05/1998 17 7 4 8 7 TB Central Cooperative Bank Sofia 08/03/1999 0 116 63 112 80 Stara Planina Holding Ltd Sofia 11/03/1999 0 48 29 29 65 Dekotex Ltd Sliven 19/05/1998 70 55 3 3 7 Child World Ltd Yablanica 19/12/1997 3 1 0 6 1 Diamant Ltd Razgrad 17/06/1998 9 7 2 0 14 Dinamo Sliven Ltd 06/04/1998 34 0 20 9 1 Dobrudga Holding Ltd Dobritch 28/07/1998 57 36 18 1 0 Dobrotitza-BSK Ltd Dobritch 01/06/1998 2 10 3 1 1 Doverie United Holding Ltd Sofia 06/07/1998 904 899 797 300 488

55M. MATEEV, South-Eastern Europe Journal of Economics 1 (2004) 35-58
Drugba Ltd Plovid 07/01/1998 88 11 0 3 17 Drugba Ltd Razgrad 15/05/1998 88 38 11 2 3 Drugba Stil Ltd Varna 20/05/1998 23 16 1 0 2 Despred Ltd Sofia 04/06/1998 3 5 1 7 52 Djuni Ltd Sozopol 19/05/1998 101 20 10 10 0 Dupnitza BT Ltd Dupnitza 29/01/1998 12 2 0 1 9 DZU Ltd Stara Zagora 20/05/1998 60 31 0 1 30 Elenite Ltd Nesebar 11/06/1998 30 2 0 0 2 Elhim Iskra Ltd Pazardjik 05/12/1997 37 0 15 30 54 Elektronika Ltd Sofia 01/07/1998 1 2 3 4 7 Elkabel Ltd Sofia 12/01/1998 221 22 3 4 4 Elma Ltd Troyan 30/03/1998 79 23 5 4 1 ELPO Ltd Nikolaevo 15/05/1998 16 1 2 1 7 Sparki Eltos Ltd Lovetch 13/05/1998 72 20 3 42 71 EMKA Ltd Sevlievo 24/04/1998 15 3 4 5 6 Energy Ltd Turgovishte 05/12/1997 3 16 1 1 11 Energokabel Ltd Sofia 05/02/1998 27 4 0 8 12 Roka Bulgaria Ltd Kaspitchan 19/05/1998 126 58 42 18 28 Balkanfarma Dupnitza Ltd Dupnitza 19/05/1998 15/02/02 84 70 83 268 107 Fazan Ltd Rousse 20/05/1998 35 10 0 1 6 Formoplast Ltd Kurdgali 08/12/1997 7 0 0 3 0 Plovdiv Jurii Gagarin BT Ltd Plovdiv 19/05/1998 105 20 10 9 23 Severkoop Gumza Holding Ltd Sofia 02/03/1999 0 433 994 777 768 Garant Ltd Biala Slatina 10/03/1998 1 2 8 65 0 General Ganetzki Ltd Pleven 28/04/1998 13 0 0 7 0 Grand Hotel Varna Ltd Varna 18/06/1998 29 1 21 4 2 Tchernomorsko zlato Ltd Pomorie 19/05/1998 28 20 4 3 0 Han Asparuh Ltd Isperih 18/02/1998 37 13 15 22 12 Holding Center Ltd Stara Zagora 28/09/1999 0 2 4 36 33 Hebros-P Ltd Pazardjik 02/02/1998 3 1 34 0 0 Hidroelements and Systems Ltd Yambol 01/06/1998 22 8 4 5 8 Kostenetz-HHI Ltd Kostenetz 05/03/1998 15 5 5 0 33 Himko Ltd Vratza 03/11/1997 428 806 177 112 85 Himmash Ltd Haskovo 19/05/1998 36 9 1 5 0 Holding Sveta Sofia Ltd Sofia 15/09/1999 0 21 169 13 95 Holding Coop-South Ltd Sofia 21/04/1999 0 26 99 168 257 Industrial Holding Bulgaria Ltd Sofia 17/08/1998 52 168 298 229 435 Izgrev-66 Ltd Plovdiv 22/05/1998 5 0 1 1 34 Jiti Ltd Rousse 28/10/1997 13 21 6 32 0 Kaproni Ltd Kazanluk 18/12/1997 178 359 193 241 14 Captain Djado Nikola Ltd Gabrovo 03/06/1998 29 4 0 3 76 Paper Factory-Belovo Ltd Belovo 16/06/1998 12 10 25 9 0 Kotlostroene Ltd Sofia 16/02/1998 15 5 17 11 5 Kremikovtzi Ltd Sofia 11/11/1997 272 219 75 22 30 Krepegni Izdelia Ltd Plovdiv 03/02/1998 22 31 13 16 12 Katex Ltd Kazanluk 28/01/2000 0 0 38 24 12 Lavena Ltd Shoumen 19/12/1997 29 17 22 17 24 Investment Company "Zlaten Lev" Ltd Sofia 14/12/1998 8 556 190 306 556 Lion Ltd Gabrovo 20/05/1998 54 19 0 0 0 Lotos Ltd Troyan 22/05/1998 2 7 7 4 0
Company name Enterdate
De-listedon date
Number of deals by years

56 M. MATEEV, South-Eastern Europe Journal of Economics 1 (2004) 35-58
M+S Hidravlik Ltd Kazanluk 15/12/1997 67 19 17 28 28 Medika Ltd Sandanski 06/05/1998 26 5 34 54 78 Minning and Extracting Factory Ltd Pirdop 03/11/1997 79 12 13 9 24 Mel Invest Holding Ltd Sliven 29/06/1998 235 164 65 4 5 MG Elit Holding Ltd Sofia 15/09/1998 30 26 13 30 49 Park Hotel Moskva Ltd Sofia 22/05/1998 3 19 0 22 24 Investment Company "Nadegda" Ltd Sofia 07/04/1999 0 126 38 85 52 LukOil Heftohim Ltd Burgas 19/12/1997 1 703 1740 500 834 1435 Black See Holding Ltd Burgas 11/11/1998 77 236 38 11 88 Neohim Ltd Dimitrovgrad 18/05/1998 183 8 2 15 175 Novoselska Gumza Ltd Vidin 01/06/1998 51 13 4 1 0 Ship Repairing Factory "Odesos" Ltd Varna 28/05/1998 52 1 8 20 7 Optela - Optic Technologies Ltd Plovdiv 05/06/1998 13 5 26 7 7 Orgahim Ltd Rousse 20/05/1998 100 29 4 15 36 Lead-Zinc Processing Factory Ltd Kurdgali 04/11/1997 82 31 23 22 46 Non-Ferrous Metal Processing Factory Ltd Sofia 12/05/1998 18 16 3 3 4 Pamporovo Ltd Pamporovo 29/01/1998 106 3 17 9 6 Pazardjik BT Ltd Pazardjik 30/01/1998 45 7 1 3 3 Petrol Ltd Sofia 22/05/1998 94 139 140 191 316 Sinergon Holding Ltd Sofia 29/06/1998 1 317 1857 1092 1406 1484 Pirinsko Pivo Ltd Blagoevgrad 20/05/1998 5 13 21 0 49 Petar Karaminchev Ltd Rousse 04/12/1997 78 10 1 0 2 Pleven BT Ltd Pleven 20/05/1998 37 34 0 2 2 Plovdiv BT Ltd Plovidv 28/10/1997 172 49 29 18 7 Plevensko Pivo Ltd Pleven 28/05/1998 31 7 2 4 0 Agropolihim Ltd Devnja 19/03/1998 192 19 14 17 0 Polimeri Ltd Devnja 03/11/1997 378 342 73 11 87 Programming Products and Systems Ltd Sofia 06/05/1998 39 41 10 1 0 Preslav-AN Ltd Preslav 19/03/1998 2 13 12 0 0 Best-technique TM Ltd Radomir 06/02/1998 47 13 17 6 2 Development Industrial Holding Ltd Sofia 04/01/1999 0 24 21 15 18 Record Ltd Gabrovo 03/06/1998 19 12 3 12 18 Balkankar-Record Ltd Plovdiv 22/05/1998 15 5 1 2 0 Riviera Ltd Varna 23/10/1997 31 20 14 4 5 Bulgarian Rose Ltd Karlovo 14/05/1998 136 52 2 6 8 Rozahim Ltd Gorna Oriahovitza 05/02/1998 2 0 8 25 0 Rubin Ltd Pleven 19/05/1998 16 10 2 26 39 Sinergon Tekstil Ltd Sofia 19/12/1997 12 0 5 4 171 Nord Holding Ltd Veliko Turnovo 26/05/1999 0 38 6 4 3 Sofarma Ltd Sofia 20/01/1998 404 371 132 214 610 Sheraton Sofia Balkan Ltd Sofia 12/05/1998 25 51 66 79 143 Shoumen BT Ltd Shoumen 23/01/1998 42 11 1 1 8 Skladova Technica Ltd Gorna Oriahovitza 06/02/1998 74 86 10 34 23 Sunny Beach Ltd - turist resource Sunny Beach 29/01/1998 240 118 55 203 553 Slitex Ltd Sliven 21/10/1997 29/05/00 61 6 38 0 0 Solvey Sodi Ltd Devnia 15/12/1997 22/11/01 822 1489 474 983 0 Sofia BT Ltd Sofia 24/11/1997 18 21 14 31 44 Stomana Ltd Pernik 04/02/1998 82 37 1 0 5 Sun Stara Zagora BT Ltd 26/01/1998 37 9 25 13 35
Company name Enterdate
De-listedon date
Number of deals by years
57M. MATEEV, South-Eastern Europe Journal of Economics 1 (2004) 35-58
ReferencesBanz, R., 1981, “The relationship between return and market value of common stocks”, Journal of
Financial Economics, 9, 3-18.Basu, S., 1983, “The relationship between earnings yield, market value, and return for NYSE
common stocks: further evidence”, Journal of Financial Economics, 12, 129-156.Black, F., 1972, “Capital market equilibrium with restricted borrowing”, Journal of Business, 45,
444-455.Chan, K. C. and Chen, N.F., 1988, “An unconditional asset pricing test and the role of firm size as
an instrumental variable for risk”, Journal of Financial Economics, 43, 309-325.Chan, K. C. and Chen, N. F., 1991, “Structural and return characteristics of small and large firms”,
Journal of Finance, 46, 1467-1484.Chan, A. and Chui, A. P. L., 1996, “An empirical re-examination of the cross-section of expected
returns: UK evidence”, Journal of Business Finance and Accounting, 23, 1435-1452.Chan, K. C., Hamao, Y. and Lakonishok, J., 1991, “Fundamentals and stock returns in Japan”,
Journal of Finance, 46, 1739-1789.Chan, K. C. and Lakonishok, J., 1993, “Are the reports of beta’s death premature?” Journal of
Portfolio Management, 19, 51-62.Chui, C.W.A. and Wei, K.C.J., 1998, “Book-to-market, firm size, and the turn-of-the-year effect:
Evidence from Pacific-Basin emerging markets”, Pacific-Basin Finance Journal, 6, 275-293.Cohen, K. J., Hawawini, G. A., Maier, S. F., Schwartz, R. A. and Whitcomb, D. K., 1983, “Friction
in the trading process and the estimation of systematic risk”, Journal of Financial Economics,12, 263-278.
Davis, J., 1994, “The cross-section of the realized stock returns: the pre-COMPUSTAT evidence”,Journal of Finance, 49, 1579-1539.
Dimson, E. and Marsh, P., 1983, “The stability of UK risk measures and the problem of thintrading”, Journal of Finance, 38, 753-783.
Fama, E. and French, K., 1992, “The cross-section of expected stock returns”, Journal of Finance,47, 427-465.
Fama, E. and French, K., 1993, “Common risk factors in the returns on stocks and bonds”, Journalof Financial Economics, 33, 3-56.
Company name Enterdate
De-listedon date
Number of deals by years
Sviloza Ltd Svishtov 14/05/1998 51 14 0 0 11 L&C-HOLD Ltd Sofia 07/06/1999 0 68 23 32 42 Balkanfarma Troyan Ltd 21/05/1998 15/02/02 62 82 45 170 69 Tzelhart Ltd Stamboliiski 12/11/1997 57 23 2 4 3 Unipak Ltd Pavlikeni 15/01/1998 31 1 14 15 15 Vamo Ltd Varna 24/04/1998 73 4 2 10 7 Velpa-91 Ltd Stragitza 05/03/1998 11 0 0 2 0 Vidahim Ltd Vidin 30/03/1998 76 13 2 0 1 Radino Ltd Sofia 07/01/1998 29 17 8 0 0 Vinex Ltd Slavianci 19/05/1998 104 50 0 0 0 Varna Shipbuilding Ltd Varna 20/05/1998 269 100 9 0 0 Yambolen Ltd Yambol 11/03/1998 77 30 2 1 7 Golden Beach Ltd Varna 06/02/1998 283 193 246 143 267
58 M. MATEEV, South-Eastern Europe Journal of Economics 1 (2004) 35-58
Fama, E. and French, K., 1996, “The CAMP is wanted, dead or alive”, Journal of Finance, 51,1947-1958.
Fama, E. and MacBeth, J. D., 1973, “Risk, return and equilibrium: Empirical tests”, Journal ofPolitical Economy, 81, 607-636.
Fletcher, J., 1997, “An examination of the cross-sectional relationship of beta and return: UKevidence”, Journal of Economics and Business, 49, 211-221.
Hawawini, G. A., 1983, “Why beta shifts as the return interval changes”, Financial AnalystsJournal, May/June, 73-77.
He, J. and Ng, L. K., 1994, “Economic forces, fundamental variables and equity returns”, Journalof Business, 67, 599-639.
Ho, Yui-Wah, Strange, R. and Piesser, J., 2000, “CAPM anomalies and the pricing of equity:evidence from the Hong Kong marke”, Applied Economics, 32, 1629-1636.
Jagannathan, R. and Wang, Z., 1996, “The conditional CAPM and the cross-section of expectedreturns”, Journal of Finance, 51, 3-53.
Kim, D., 1995, “The errors in the variables problems in the cross-section of expected stockreturns”, Journal of Finance, 50, 1605-1634.
Kothari, S. P., Shanken, J. and Sloan, R. G., 1995, “Another look at the cross-section of expectedstock returns”, Journal of Finance, 50, 185-224.
Lakonishok, J., Shleifer, A. and Vishny, R., 1994, “Contrarian’s investment, extrapolation andrisk”, Journal of Finance, 49, 1541-1578.
Lintner, J., 1965, “The valuation of risk assets and the selection of risky investment in stockportfolios and capital budgeting”, Review of Economics and Statistics, 47, 13-37.
Martikainen, T., 1991, “The impact of infrequent trading on betas based on daily, weekly andmonthly return intervals: empirical evidence with Finnish data”, Finnish Economic Papers, 4,52-64.
Mateev, M., 2000, Analysis and Evaluation of Risk of Investment Decisions, Sofia: UniversityPrinting House.
Pettengill, G., Sundaram, S. and Mathur, I., 1995, “The conditional relation between beta andreturn”, Journal of Finance and Quantitative Analysis, 30, 101-116.
Sharpe, W.F., 1964, “Capital asset prices: a theory of market equilibrium under conditions of risk”,Journal of Finance, 19, 425-442.
Scholes, M. and Williams, J., 1977, “Estimating betas from nonsynchronous data”, Journal ofFinancial Economics, 5, 309-327.
Strong, N. and Xu, X., 1994, “Explaining the cross-section of UK expected stock returns”, WorkingPaper, University of Manchester.
The Bulgarian Stock Exchange, 1998-2002, Daily and Weekly Bulletins, BSE-Sofia.