south-east asia japan cable system (sjc) hong kong segment
TRANSCRIPT

South-East Asia Japan Cable System (SJC)
Hong Kong Segment
Post Environmental Impact Monitoring and Site
Audit Report
November 2012


South-East Asia Japan Cable System (SJC)
Hong Kong Segment
Post Environmental Impact Monitoring and Site Audit Report P. i
Project Title: South-East Asia Japan Cable System (SJC), Hong Kong Segment
Project No.: 4575
Document No.: 4575-OR026 Controlled Copy No.:
Document Title:
Final Environmental Impact Monitoring and Site Audit Report
Covering Letter/Transmittal Ref. No.: Date of Issue:
4575/OC475/SH/EY/twc 09 November 2012
Revision, Review and Approval Records
/ / /
/ / /
/ / /
00 Final Environmental Impact Monitoring and Site Audit Report
Various/
09 November 2012
Enid Yung/
09 November 2012
Susana Halliday/
09 November 2012
Revision Description Prepared by /
date Reviewed by /
date Approved by /
date
Distribution (if insufficient space, please use separate paper)
Controlled Copy No. Issued to
1 WEN
2-4 EPD
5 IEC
6 ACL

South-East Asia Japan Cable System (SJC)
Hong Kong Segment
Post Environmental Impact Monitoring and Site Audit Report P. ii
Table of Contents
EXECUTIVE SUMMARY ........................................................................................................ 1
1. INTRODUCTION .................................................................................................. 3
1.1 Background of the Project .................................................................................... 3
1.2 Summary of Impact EM&A Requirements ............................................................ 3
1.3 Major Works undertaken during Reporting Period ............................................... 3
2. MONITORING RESULTS .................................................................................... 4
2.1 Water Quality ....................................................................................................... 4
2.2 Marine Mammals .................................................................................................. 9
2.3 Construction and Demolition Waste Management ............................................. 10
3. ENVIRONMENTAL NON-COMPLIANCE AND COMPLAINTS .......................... 11
3.1 Environmental Exceedances .............................................................................. 11
3.2 Site Inspections .................................................................................................. 12
3.3 Environmental Complaint ................................................................................... 13
4. CONCLUSION ................................................................................................... 14
List of Tables
Table 2-1 – Water Quality Monitoring Programme
Table 2-2 – Impact Water Quality Monitoring Stations
Table 2-3 – Calculated Action and Limit Levels for Water Quality
Table 3-1 – Summary of Environmental Site Inspections
List of Figures
Figure 2-1 Water Quality Monitoring Stations
List of Annex
Annex A Calibration Certificates for Water Quality Monitoring Equipment
Annex B Summary of Weekly Water Quality Monitoring Data
Annex C Water Quality Monitoring Data and Laboratory Results

South-East Asia Japan Cable System (SJC)
Hong Kong Segment
Post Monitoring Report P. 1
EXECUTIVE SUMMARY
The site preparation works for the SJC cable network system commenced on 21 June 2012 and all construction activities within HKSAR boundary was completed on 11 October 2012. Atkins China Limited (ACL) has been appointed as the Environmental Team (ET) to undertake environmental management and monitoring work in accordance with the EM&A Manual.
This is the Post Monitoring Report for the works specified in the Environmental Permit (EP-423/2011/A) and Environmental Monitoring and Audit (EM&A) Manual. This report summarises the findings and results of the EM&A during the reporting period of the twelve weeks of works and covers the reporting period 21 June 2012 to 14 October 2012.
Environmental Monitoring and Audit Progress
The EM&A programme have been undertaken in accordance with the approved EM&A Manual. A summary of the monitoring activities performed in the reporting period is summarised below:
Water quality monitoring was conducted on 28 June 2012, 6, 12, 14, 17 and 19 July 2012, 1, 4, 6 and 7 September, and 11 October 2012 during mid-ebb and mid-flood tide periods.
Marine mammal monitoring was undertaken from 20 July 2012 to 21 July 2012. No marine mammals were observed during the monitoring period.
Exceedance of Action and Limit Levels
During the water quality monitoring period, exceedances of Limit Level (LL) of DO were recorded on 28 June, 6, 12 and 14 July 2012. Action Level (AL) exceedances of DO were recorded on 12, 14 and 19 July 2012. AL exceedances of Turbidity were recorded on 6 July 2012 and AL exceedances of SS were recorded on 14 July. All exceedances were considered as non-project related.
Complaint Log
No complaints were received in relation to environmental impact during the reporting period.
Notifications of Summons and Prosecutions
No notifications of summons and prosecutions received during the reporting period.
Site Inspection and Audit
Environmental site inspections for shore based works were undertaken on 22 and 25 June, 5, 13, 19, 27 and 30 July, 9, 15 and 23 August 2012.
According to Contractor and based on the site inspection on 23 August 2012. Shore based construction and reinstatements were completed and no more shore based site activities were anticipated. Therefore, no onwards site inspection was necessary undertaken for the

South-East Asia Japan Cable System (SJC)
Hong Kong Segment
Post Monitoring Report P. 2
project.

South-East Asia Japan Cable System (SJC)
Hong Kong Segment
Post Monitoring Report P. 3
1. INTRODUCTION
1.1 Background of the Project
1.1.1 South-East Asia Japan Cable System (SJC) is a submarine cable system linking South-East Asia to Japan. SJC will provide direct access and diverse routing between Singapore, the Philippines, Hong Kong, China, Brunei and Japan. The cable system will span approx. 8,900km and will be mainly composed of a seven-fibre pair high capacity submarine cable system with a design capacity of 17.9 terabits per second. The project will increase the broadband capacity of Hong Kong.
1.1.2 The Project is classified as a Designated Project under Item C12 of Part I Schedule 2 of the Environmental Impact Assessment Ordinance (EIAO): ―A dredging operation which is (a) less than 500 metres from the nearest boundary of an existing or planned (iii) bathing beach; and (vii) coastal protection area”.
1.1.3 In accordance with the EIAO, an environmental assessment was undertaken and a Project Profile was submitted to the Environmental Protection Department (EPD) (PP-444/2011) for an Application for Permission to Apply Directly for Environmental Permit for the project (Application No. DIR-213/2011) (DIR). The DIR was granted by EPD on 1
st August 2011 with conditions.
1.1.4 Atkins China Limited (ACL) has been appointed as the Environmental Team (ET) to undertake environmental management and monitoring work in accordance with the EM&A Manual and required under the Variation of Environmental Permit (No. EP-423/2011/A) issued to China Telecom (Hong Kong) International Limited in October 2011 for the Project of South-East Asia Japan Cable System (SJC) — Hong Kong Segment.
1.1.5 This is the Post Monitoring Report for the works specified in the Environmental Monitoring and Audit (EM&A) Manual. This report summarises the results and findings of the EM&A during the reporting period 21 June 2012 to 14 October 2012.
1.2 Summary of Impact EM&A Requirements
1.2.1 The EM&A programme requires environmental monitoring for water quality, marine mammals and construction and demolition waste management, as specified in the EM&A Manual. This has been conducted accordingly.
1.3 Major Works undertaken during Reporting Period
Minor excavation of a trench from beach manhole to allow cable laying;
Injection jetting works;
Cable laying and burial works;

South-East Asia Japan Cable System (SJC)
Hong Kong Segment
Post Environmental Impact Monitoring and Site Audit Report P. 4
2. MONITORING RESULTS
2.1 Water Quality
Programme
2.1.1 The water quality monitoring programme for this reporting period is presented in
Table 2.1- Water Quality Monitoring Programme.
Table 2.1- Water Quality Monitoring Programme
Date of Sampling Tidal State Time of Sampling
28 June 2012 Mid-Ebb 06:25- 09:05
Mid-Flood 11:25- 14:05
6 July 2012 Mid-Ebb 05:35- 09:05
Mid-Flood 12:25- 15:55
12 July 2012 Mid-Ebb 11:30- 14:10
Mid-Flood 06:40- 09:20
14 July 2012 Mid-Ebb 08:30- 11:10
Mid-Flood 14:50- 17:10
17 July 2012 Mid-Ebb 10:30- 11:10
Mid-Flood 18:00- 18:40
19 July 2012 Mid-Ebb 12:30- 13:10
Mid-Flood 19:00- 19:40
1 September 2012 Mid-Ebb 11:00- 14:30
Mid-Flood 04:32- 08:02
4 September 2012 Mid-Ebb 12:40- 16:10
Mid-Flood 06:37- 10:07
6 September 2012 Mid-Ebb 13:42- 17:12
Mid-Flood 08:03- 11:33
7 September 2012 Mid-Ebb 14:11- 17:41
Mid-Flood 08:57- 12:27
11 October 2012 Mid-Ebb 07:45-10.25
Mid-Flood 14:20-17:00
Monitoring Stations
2.1.2 Seventeen water quality monitoring stations were sampled during the impact water
quality monitoring (See Figure 2-1) and listed in Table 2-2 as follows. These stations are applicable for works undertaken during installation of the cable in Stanley Bay.

South-East Asia Japan Cable System (SJC)
Hong Kong Segment
Post Environmental Impact Monitoring and Site Audit Report P. 5
Table 2.2- Impact Water Quality Monitoring Stations
Monitoring Station Co-ordinates Station Purpose
A1 839451 808265 180m from point A
A2 839511 808265 120m from point A
A3 839571 808265 60m from point A
A4 839691 808265 60m from point A
A5 839751 808265 120m from point A
A6 839811 808265 180m from point A
B1 839408 808160 180m from point B
B2 839468 808160 120m from point B
B3 839528 808160 60m from point B
B4 839648 808160 60m from point B
B5 839708 808160 120m from point B
B6 839768 808160 180m from point B
C 840081 808353 Control Station
D1 839429 808641 100m from point D
D2 839540 808552 100m from point D
D3 839453 808443 100m from point D
D4 839344 808531 100m from point D
Methodology
2.1.3 Water quality monitoring was conducted in accordance with the methodology described in the EM&A Manual.
2.1.4 The water quality parameters monitored included dissolved oxygen (DO) (% saturation and mg/L), temperature, turbidity (NTU), salinity and suspended solids (SS). DO, temperature, turbidity and salinity were measured in-situ whereas SS was determined by laboratory analysis.
2.1.5 Laboratory analysis of SS was carried out at ALS Laboratory Group, a recognised HOKLAS accredited laboratory. The calibration certificates for the monitoring
equipment are presented in Annex A.
Action & Limited Levels
2.1.6 The calculated Action Level and Limit Levels are shown in Table 2-3.
Table 2.3- Calculated Action and Limit Levels for Water Quality
Parameter Depth Action Level Limit Level
DO in mg/L Surface & Middle 6.30 5.70
Bottom 6.10 5.20
Turbidity in NTU* Depth-averaged 7.41 13.7
SS in mg/L Depth-averaged 8.00 15.46
* Extreme Data (Turbidity > 20 NTU) were excluded when calculating the Action and Limit Levels

South-East Asia Japan Cable System (SJC)
Hong Kong Segment
Post Environmental Impact Monitoring and Site Audit Report P. 6
Results
2.1.7 The water quality monitoring was undertaken on 28 June, 6, 12, 14, 17 and 19 July, 1, 4, 6 and 7 September and 11 October 2012.
2.1.8 The summarised data of the weekly water quality monitoring at each monitoring
location during marine works are presented in Annex B. All water quality monitoring
data and laboratory results at each monitoring location are provided in full in Annex
C. The recorded field transcripts of the water quality monitoring data were checked in hard copy with the electronic version of the results and were found to be accurate.
2.1.9 The analysis of weekly water quality monitoring data is demonstrated as in followed:
Mid-Ebb
28 June 2012
2.1.10 During mid-ebb survey, the range of DO level from 3.5mg/L to 8.7mg/L with and saturation level from 51.8% to 123.6%. The range of turbidity measurement was 1.5 to 6.1 NTU with SS content from <2 mg/L to 8 mg/L. The recorded temperature was within the expected range and values for these waters during the time of monitoring.
2.1.11 The DO Limit level and Action level exceedances were found on the middle and bottom level. A moderate thermocline and halocline was observed for the exceeding stations, which would limit water exchange with the surface and thus result in depleted oxygen levels measures on the bottom. This is a natural phenomenon common during Summer time when surface temperatures are high and surface salinities low compared with bottom waters. Therefore, the exceedances of Limit Level of DO were considered non-project related.
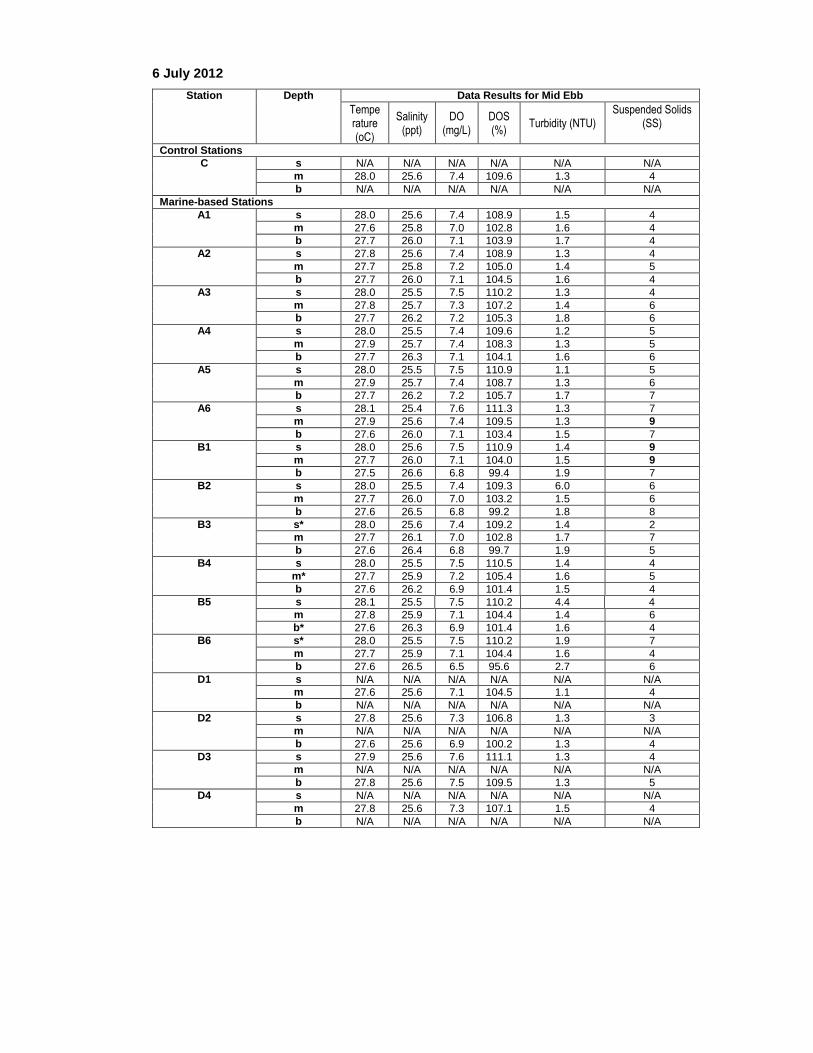
6 July 2012
2.1.12 During mid-ebb survey, the range of DO level from 6.5mg/L to 7.6mg/L with and saturation level form 95.6% to 111.3%. The range of turbidity measurement was 1.1 to 6 NTU with SS content from 2 mg/L to 9 mg/L. The recorded temperature was within the expected range and values for these waters during the time of monitoring.
2.1.13 The SS Action Level exceedances were found on the surface and middle level. According the site observation and contractor record, No injection jetting by cable laying vessel was conducted on the sampling day. Therefore, the exceedances of Limit Level of DO were considered non-project related.
12 and 14 July 2012
2.1.14 During mid-ebb survey, the range of DO level from 2.3mg/L to 10.1mg/L with and saturation level from 32.9% to 149.5%. The range of turbidity measurement was 1.1 to 6.9 NTU with SS content from <2 mg/L to 10 mg/L. The recorded temperature was within the expected range and values for these waters during the time of monitoring.
2.1.15 The DO Limit Level and Action Level exceedances were found on the middle and

South-East Asia Japan Cable System (SJC)
Hong Kong Segment
Post Environmental Impact Monitoring and Site Audit Report P. 7
bottom level. A moderate thermocline and halocline was observed for the exceeding stations, which would limit water exchange with the surface and thus result in depleted oxygen levels measures on the bottom. This is a natural phenomenon common during the summer when surface temperatures are high and surface salinities low compared with bottom waters. Therefore, the exceedances of Limit Level of DO were considered non-project related.
2.1.16 The SS Action Level exceedance was found at the bottom of D2. According the site observation and contractor record, No cable laying vessel and marine works by diver was conducted near the monitoring location on the sampling day. Therefore, the exceedances of Action Level of SS were considered non-project related.
17 and 19 July 2012
2.1.17 During mid-ebb survey, the range of DO level from 2.7mg/L to 8.5mg/L with a saturation level from 38.2% to 126.8%. The range of turbidity measurement was 1.1 to 3.6 NTU with SS content from <2 mg/L to 6 mg/L. The recorded temperature was within the expected range and values for these waters during the time of monitoring.
2.1.18 The DO Action Level exceedances were found on the middle and bottom levels at station D1, D2 and D3. Also, a Limit Level exceedance was found at the middle level of D4. A moderate thermocline and halocline was observed for the exceeding stations, which would limit water exchange with the surface and thus result in depleted oxygen levels measures on the bottom. This is a natural phenomenon common during the summer when surface temperatures are high and surface salinities low compared with bottom waters. Therefore, the exceedance of Limit Level of DO was considered non-project related.
1 September 2012
2.1.19 During mid-ebb survey, the range of DO level from 7.5mg/L to 7.8mg/L with an saturation level form 112.7% to 118.2%. The range of turbidity measurement was 1.0 to 2.2 NTU with SS content from 2 mg/L to 4 mg/L. The recorded temperature was within the expected range and values for these waters during the time of monitoring.
2.1.20 No DO and SS exceedance was found during the monitoring period.
4, 6 and 7 September 2012
2.1.21 During mid-ebb survey, the range of DO level from 6.7mg/L to 8mg/L with a saturation level form 100.1% to 120.1%. The range of turbidity measurement was 1.4 to 4 NTU with SS content from 2 mg/L to 5 mg/L. The recorded temperature was within the expected range and values for these waters during the time of monitoring.
2.1.22 No DO and SS exceedances were found during the monitoring period.
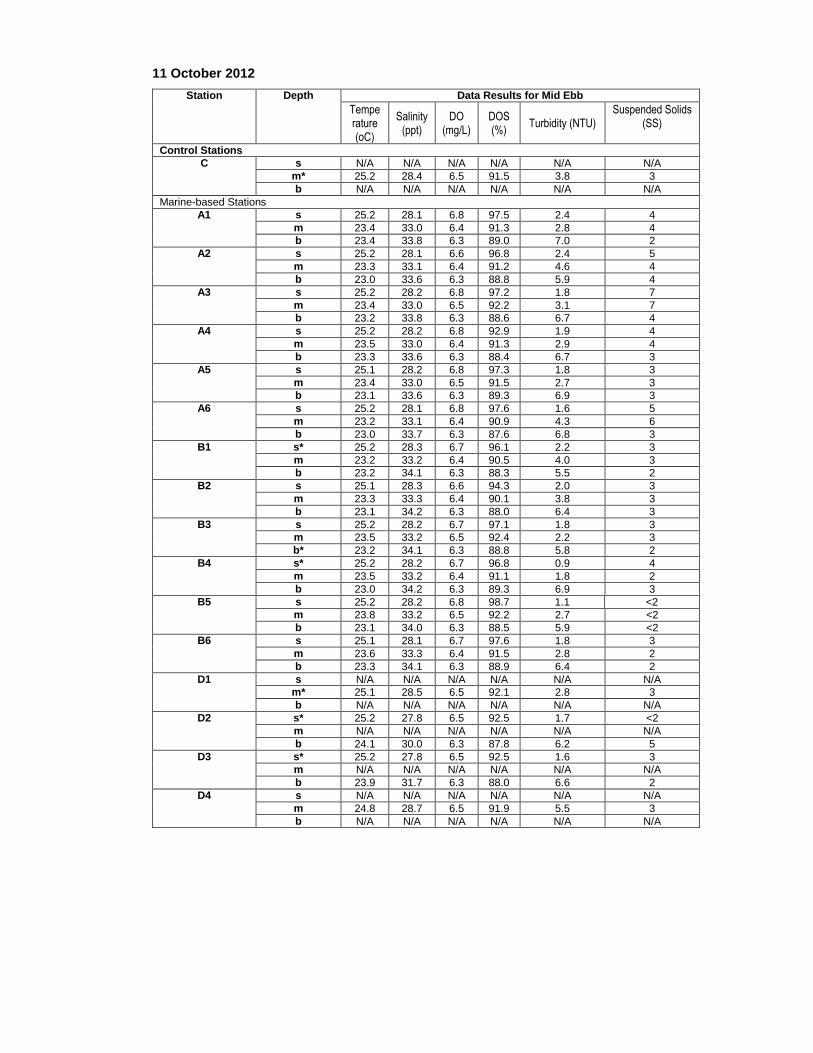
11 October 2012
2.1.23 No DO, Turbidity and SS Level exceedances were found during the proposed water quality monitoring.

South-East Asia Japan Cable System (SJC)
Hong Kong Segment
Post Environmental Impact Monitoring and Site Audit Report P. 8
Mid-Flood
28 June 2012
2.1.24 During mid-flood survey, the range of DO level from 3.6mg/L to 14.5mg/L with and saturation level from 52.5% to 210.9%. The range of turbidity measurement was 1.9 to 6.7 NTU with SS content from <2 mg/L to 5 mg/L. The recorded temperature was within the expected range and values for these waters during the time of monitoring.
2.1.25 The DO Limit level and Action level exceedances were found on the middle and bottom level. A moderate thermocline and halocline was observed for the exceeding stations, which would limit water exchange with the surface and thus result in depleted oxygen levels measures on the bottom. This is a natural phenomenon common during the summer when surface temperatures are high and surface salinities low compared with bottom waters. Therefore, the exceedances of Limit Level of DO were considered non-project related.
6 July 2012
2.1.26 During mid-flood survey, the range of DO level from 3.9mg/L to 9.6mg/L with and saturation level from 56.3% to 142.0%. The range of turbidity measurement was 0.9 to 7.5 NTU with SS content from <2 mg/L to 9 mg/L. The recorded temperature was within the expected range and values for these waters during the time of monitoring.
2.1.27 The DO Limit Level and Action Level exceedances were found on the middle and bottom level. A moderate thermocline and halocline was observed for the exceeding stations, which would limit water exchange with the surface and thus result in depleted oxygen levels measures on the bottom. This is a natural phenomenon common during the summer when surface temperatures are high and surface salinities low compared with bottom waters. Therefore, the exceedances of Limit Level of DO were considered non-project related.
2.1.28 The Turbidity Action Level exceedance was found at the bottom of B6. According the site observation and contractor record, No injection jetting by cable laying vessel was conducted on the sampling day. Therefore, the exceedances of Limit Level of DO were considered non-project related.
12 and 14 July 2012
2.1.29 During mid-flood survey, the range of DO level from 2.3mg/L to 8.7mg/L with and saturation level from 32.9% to 126.6%. The range of turbidity measurement was 1.2 to 7 NTU with SS content from <2 mg/L to 11 mg/L. The recorded temperature was within the expected range and values for these waters during the time of monitoring.
2.1.30 The DO Limit Level and Action Level exceedances were found on the middle and bottom level. A moderate thermocline and halocline was observed for the exceeding stations, which would limit water exchange with the surface and thus result in depleted oxygen levels measures on the bottom. This is a natural phenomenon common during the summer when surface temperatures are high and surface salinities low compared with bottom waters. Therefore, the exceedances of Limit Level of DO were considered non-project related.

South-East Asia Japan Cable System (SJC)
Hong Kong Segment
Post Environmental Impact Monitoring and Site Audit Report P. 9
2.1.31 The SS Action Level exceedance was found at the bottom of D2 and B2. According the site observation and contractor record, no cable laying vessel was conducted near the monitoring location on the monitoring period. Therefore, the exceedances of Action Level of SS were considered non-project related.
17 and 19 July 2012
2.1.32 During mid-flood survey, the range of DO level from 7.2mg/L to 10.2mg/L with a saturation level from 106.0% to 152.3%. The range of turbidity measurement was 1.3 to 3.0 NTU with SS content from <2 mg/L to 6 mg/L. The recorded temperature was within the expected range and values for these waters during the time of monitoring.
2.1.33 No DO Limit and Action Levels exceedances were found of surface, middle and bottom levels.
1 September 2012
2.1.34 During mid-flood survey, the range of DO level from 7.5mg/L to 8.0mg/L with an saturation level form 113.1% to 120.1%. The range of turbidity measurement was 0.8 to 2.5 NTU with SS content from 2 mg/L to 5 mg/L. The recorded temperature was within the expected range and values for these waters during the time of monitoring.
2.1.35 No DO and SS exceedances were found during the monitoring period.
4, 6 and 7 September 2012
2.1.36 During mid-flood survey, the range of DO level from 6mg/L to 7.2mg/L with an saturation level form 91.2% to 109.1%. The range of turbidity measurement was 1.3 to 3.8 NTU with SS content from 2 mg/L to 7 mg/L. The recorded temperature was within the expected range and values for these waters during the time of monitoring.
2.1.37 No DO and SS exceedances were found during the monitoring period.
11 October 2012
2.1.38 No DO, Turbidity and SS Level exceedances were found during the proposed water quality monitoring.
2.2 Marine Mammals
2.2.1 The marine works within marine mammals inspection area in accordance with the EM&A manual were undertaken from the 20 July 2012 to 21 July 2012. This took place during cable laying works by injection jetting method on 20 July 2012 and 21 July 2012. No marine mammals were observed during the monitoring period.
2.2.2 The marine work was finished the section of marine mammals inspection area on 21 July 2012. No marine mammal inspection was necessary for the project.

South-East Asia Japan Cable System (SJC)
Hong Kong Segment
Post Environmental Impact Monitoring and Site Audit Report P. 10
2.3 Construction and Demolition Waste Management
2.3.1 The weekly environmental site inspections were undertaken on 22 and 25 June, 5, 13, 19, 27 and 30 July, as well as, 9, 15 and 23 August 2012 during the reporting period.
2.3.2 According to the Contractor and based on the site inspection on 23 August 2012,shore-based construction and reinstatement were completed and no more shore-based site activities were anticipated. Therefore, no construction and demolition waste was generated during onwards project time.

South-East Asia Japan Cable System (SJC)
Hong Kong Segment
Post Environmental Impact Monitoring and Site Audit Report P. 11
3. ENVIRONMENTAL NON-COMPLIANCE AND COMPLAINTS
3.1 Environmental Exceedances
Water Quality
3.1.1 For weekly water quality during marine works, the exceedances of DO, turbidity and
SS in water quality criteria are shown in Annex B.
3.1.2 Water quality monitoring was conducted on 28 June 2012 during reporting period. Exceedances of Limit Level of DO were recorded on 28 June 2012. No injection jetting by cable laying vessel was conducted on the sampling days due to a fault in the cable. A moderate thermocline and halocline was observed for the exceeding stations, which would limit water exchange with the surface and thus result in depleted oxygen levels measures on the bottom. This is a natural phenomenon common during Summer time when surface temperatures are high and surface salinities low compared with bottom waters. Therefore, the exceedances of Limit Level of DO were considered non-project related.
3.1.3 Water quality monitoring was conducted on 6 July 2012. Exceedance of Action and Limit Level of DO was recorded during mid-flood tide on 6 July 2012. No injection jetting by cable laying vessel was conducted on the sampling day. A moderate thermocline and halocline was observed for the exceeding stations, which would limit water exchange with the surface and thus result in depleted oxygen levels measures on the bottom. This is a natural phenomenon common during Summer time when surface temperatures are high and surface salinities low compared with bottom waters. Therefore, the exceedance of Limit Level of DO was considered that the exceedances were not related to the project works.
3.1.4 The Turbidity Action Level exceedance was found at the bottom level at B6 during mid-flood tide and SS Action Level exceedances were found on the surface and middle level during mid-ebb tide. According the site observation and contractor record, No injection jetting by cable laying vessel was conducted on the sampling day. Therefore, the exceedances of Limit Level of DO were considered non-project related.
3.1.5 Water quality monitoring was conducted on 12 and 14 July 2012. The DO Limit Level and Action Level exceedances were found during mid-ebb tide (14 July 2012) and mid-flood tide (12 and 14 July 2012). A moderate thermocline and halocline was observed for the exceeding stations, which would limit water exchange with the surface and thus result in depleted oxygen levels measures on the bottom. This is a natural phenomenon common during the summer when surface temperatures are high and surface salinities low compared with bottom waters. Therefore, the exceedances of Limit Level of DO were considered non-project related.
3.1.6 The SS Action Level exceedance was found at the bottom of D2 (mid-ebb tide) and B2 (mid-flood tide) on 14 July 2012. According the site observation and contractor record, no cable laying vessel was conducted near the monitoring location on the monitoring period. Therefore, the exceedances of Action Level of SS were considered non-project related.
3.1.7 Water quality monitoring was conducted on 19 July 2012. During mid-ebb tide, the

South-East Asia Japan Cable System (SJC)
Hong Kong Segment
Post Environmental Impact Monitoring and Site Audit Report P. 12
DO Action Level exdeendances were recorded at the middle and bottom levels of D4. On the same date and monitoring station, a Limit Level exceedance was found at the middle level. A moderate thermocline and halocline was observed for the exceeding stations, which would limit water exchange with the surface and thus result in depleted oxygen levels measures on the bottom. This is a natural phenomenon common during the summer when surface temperatures are high and surface salinities low compared with bottom waters. Therefore, the exceedance of Limit Level of DO was considered non-project related.
3.1.8 Water quality monitoring was conducted on 1 September 2012. No DO and SS exceedances were record in the reporting period.
3.1.9 Water quality monitoring was conducted on 4, 6 and 7 September 2012. No DO and SS exceedances were record in the reporting period.
3.1.10 No DO, Turbidity and SS Level exceedances were found during the proposed water quality monitoring undertaken on 11 October 2012.
3.2 Site Inspections
3.2.1 A summary of findings of the environmental site inspections conducted during the
monitoring is presented in Table 3-1. No-compliances were recorded for the reporting period.

South-East Asia Japan Cable System (SJC)
Hong Kong Segment
Post Environmental Impact Monitoring and Site Audit Report P. 13
Table 3.1- Summary of Environmental Site Inspections
Date of Inspection Observation Action
22 June 2012 Nil.
No environmental observation was found during the site inspection. The contractor was reminded to pay particular attention during fuel/chemical handling to avoid contamination.
25 June 2012 Nil.
No environmental observation was found during the site inspection. The contractor was reminded to avoid the sandy water flow to sea directly during excavation.
5 July 2012 Nil. No environmental observation was found during the site inspection.
13 July 2012 General refuses were found in the shore area but it is not project-related.
Nil.
19 July 2012 General refuse were found in the shore area but it is not project-related.
Nil.
27 July 2012
No beach works were carried out since 20 July 2012. General refuses were found in the shore area but it is not project-related.
Nil.
30 July 2012
No beach works were carried out since 20 July 2012. General refuses were found in the shore area but it is not project-related.
Nil.
9 August 2012
The paved works were carried out since 8 August 2012. General refuses were found in the shore area but it is not project-related.
Nil.
15 August 2012
The paved works were almost completed. The general refuses were found in the shore area butt it is not project-related.
Nil.
23 August 2012
The shore based works were completed. The general refuses were found in the shore area but it is not project-related.
Nil.
3.2.2 According to Contractor and based on the site inspection on 23 August 2012, shore based construction and reinstatements were completed and no more shore based site activities were anticipated. Therefore, no onwards site inspections were undertaken for the project.
3.3 Environmental Complaint
3.3.1 No complaints were received in relation to environmental impact during the reporting period.
South-East Asia Japan Cable System (SJC)
Hong Kong Segment
Post Environmental Impact Monitoring and Site Audit Report P. 14
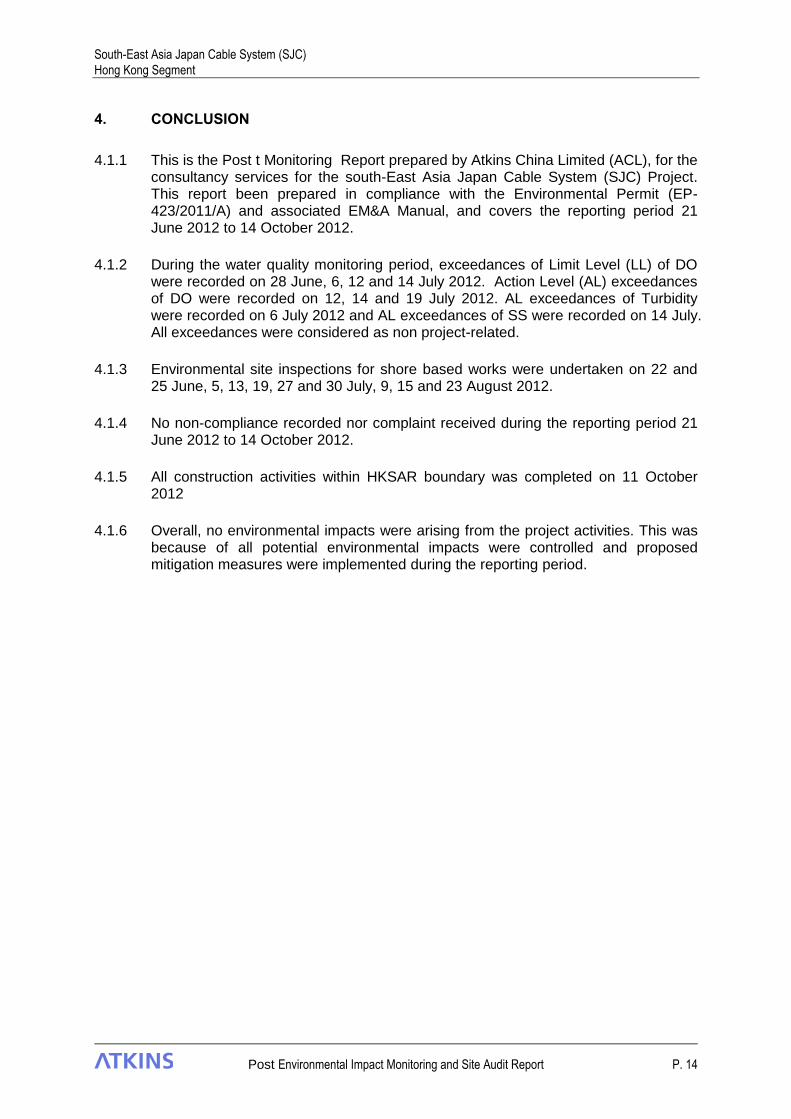
4. CONCLUSION
4.1.1 This is the Post t Monitoring Report prepared by Atkins China Limited (ACL), for the consultancy services for the south-East Asia Japan Cable System (SJC) Project. This report been prepared in compliance with the Environmental Permit (EP-423/2011/A) and associated EM&A Manual, and covers the reporting period 21 June 2012 to 14 October 2012.
4.1.2 During the water quality monitoring period, exceedances of Limit Level (LL) of DO were recorded on 28 June, 6, 12 and 14 July 2012. Action Level (AL) exceedances of DO were recorded on 12, 14 and 19 July 2012. AL exceedances of Turbidity were recorded on 6 July 2012 and AL exceedances of SS were recorded on 14 July. All exceedances were considered as non project-related.
4.1.3 Environmental site inspections for shore based works were undertaken on 22 and 25 June, 5, 13, 19, 27 and 30 July, 9, 15 and 23 August 2012.
4.1.4 No non-compliance recorded nor complaint received during the reporting period 21 June 2012 to 14 October 2012.
4.1.5 All construction activities within HKSAR boundary was completed on 11 October 2012
4.1.6 Overall, no environmental impacts were arising from the project activities. This was because of all potential environmental impacts were controlled and proposed mitigation measures were implemented during the reporting period.

South-East Asia Japan Cable System (SJC)
Hong Kong Segment
Post Monitoring Report
Figures

Indicative boundaryof St. Stephen's bathingbeach (Stanley Bay) fromDeposit Plan
500 m from St. Stephen's bathing beach
Control Station (Point C)840081E , 808353N #S
Nearshore Point D839441E, 808542N
#
ProposedCableAlignment
Offshore Point A839631E, 808265N#
Offshore Point B839588E, 808160N
#
Montioring Point A6
180 m from Point A
Montioring Point A5
120 m from Point A
Montioring Point A4
60 m from Point A
#S#S#SMontioring
Point A360 m from
Point A
Montioring Point A2
120 m from Point A
Montioring Point A1
180 m from Point A
#S#S#S
Montioring Point D4
100 m from Point D
Montioring Point D3
100 m from Point D
Montioring Point D2
100 m from Point D
Montioring Point D1
100 m from Point D
#S
#S
#S
#S
Montioring Point B1
180 m from Point B
Montioring Point B2
120 m from Point B
Montioring Point B3
60 m from Point B
Montioring Point B4
60 m from Point B
Montioring Point B5
120 m from Point B
Montioring Point B6
180 m from Point B
#S #S #S #S #S #S
0 50 100 Meters
2-1
Title
Scale at A1 Date Figure:
Indicative Location of Water Quality Monitoring Stations
June 2012NTS
South East Asia Japan Cable System (SJC) - Hong Kong Segment


South-East Asia Japan Cable System (SJC)
Hong Kong Segment
Post Monitoring Report
Annex A
Calibration Certificates for
Water Quality Monitoring Equipment


South-East Asia Japan Cable System (SJC)
Hong Kong Segment
Post Monitoring Report
Annex B
Summary of Weekly Water
Quality Monitoring Data

Mid-Ebb - Summary of Water Quality Data
Notes: s – 1 m below the surface; m – mid depth; b – 1 m above the seabed XX : Limit Level Exceedance; XX: Action Level Exceedance
* – Average value of duplicate sample
28 June 2012
Station Depth Data Results for Mid Ebb
Temperature (oC)
Salinity (ppt)
DO (mg/L)
DOS (%)
Turbidity (NTU) Suspended Solids
(SS)
Control Stations
C s N/A N/A N/A N/A N/A N/A
m 28.9 17.5 8.0 115.0 1.7 4
b N/A N/A N/A N/A N/A N/A
Marine-based Stations
A1 s 28.7 17.5 8.2 116.4 1.7 <2
m 27.6 25.9 5.3 77.9 2.2 <2
b 26.1 30.8 3.5 51.8 5.1 <2
A2 s 28.7 18.4 8.2 118.0 1.7 <2
m 28.1 23.2 6.1 89.4 2.2 3
b 26.2 30.6 3.5 52.0 6.1 <2
A3 s 28.7 17.2 8.4 119.3 1.8 <2
m 28.1 23.3 6.0 87.8 2.9 <2
b 27.2 27.2 4.5 66.2 3.7 <2
A4 s 28.7 17.2 8.4 119.7 2.1 3
m 28.8 19.7 7.6 110.0 2.2 <2
b 27.4 26.7 5.0 73.0 2.9 <2
A5 s 28.6 17.3 8.3 118.0 1.7 <2
m 28.4 22.8 6.9 101.0 2.1 <2
b 27.0 28.4 4.3 62.9 3.2 <2
A6 s 28.8 17.5 8.7 123.6 1.5 <2
m 29.1 18.4 8.1 117.3 2.0 <2
b 27.3 27.1 4.9 71.8 2.2 <2
B1 s* 28.7 17.4 8.0 113.1 1.6 5
m 26.7 29.1 4.3 63.5 1.9 5
b 25.5 31.5 3.6 51.9 4.2 8
B2 s 28.8 17.4 8.2 117.4 1.7 3
m* 27.0 28.6 4.4 64.0 1.8 3
b 25.8 31.1 3.6 52.3 4.5 3
B3 s 28.8 17.5 8.3 117.8 1.7 2
m 27.2 27.8 4.7 68.7 1.7 2
b* 26.3 31.1 3.7 54.0 3.3 <2
B4 s* 28.8 18.0 8.0 114.1 1.7 5
m 27.4 26.6 5.1 74.0 1.8 2
b 25.9 31.1 3.6 52.4 3.6 4
B5 s 28.7 17.8 8.1 116.1 1.8 2
m 27.4 26.7 5.0 73.4 2.0 3
b 26.3 30.8 3.7 54.2 3.3 2
B6 s 28.8 17.9 8.1 116.2 1.6 2
m 27.4 26.6 5.0 73.3 2.0 5
b 26.0 30.9 3.5 51.8 2.4 2
D1 s N/A N/A N/A N/A N/A N/A
m 28.7 17.4 8.4 119.2 1.7 <2
b N/A N/A N/A N/A N/A N/A
D2 s 28.8 17.5 8.6 123.0 1.6 2
m N/A N/A N/A N/A N/A N/A
b 28.5 18.5 7.0 100.2 2.3 <2
D3 s 28.7 17.3 8.5 120.8 1.7 <2
m N/A N/A N/A N/A N/A N/A
b 28.4 22.0 6.5 94.9 2.3 <2
D4 s N/A N/A N/A N/A N/A N/A
m 28.7 17.5 8.1 115.7 1.5 <2
b N/A N/A N/A N/A N/A N/A
6 July 2012
Station Depth Data Results for Mid Ebb
Temperature (oC)
Salinity (ppt)
DO (mg/L)
DOS (%)
Turbidity (NTU) Suspended Solids
(SS)
Control Stations
C s N/A N/A N/A N/A N/A N/A
m 28.0 25.6 7.4 109.6 1.3 4
b N/A N/A N/A N/A N/A N/A
Marine-based Stations
A1 s 28.0 25.6 7.4 108.9 1.5 4
m 27.6 25.8 7.0 102.8 1.6 4
b 27.7 26.0 7.1 103.9 1.7 4
A2 s 27.8 25.6 7.4 108.9 1.3 4
m 27.7 25.8 7.2 105.0 1.4 5
b 27.7 26.0 7.1 104.5 1.6 4
A3 s 28.0 25.5 7.5 110.2 1.3 4
m 27.8 25.7 7.3 107.2 1.4 6
b 27.7 26.2 7.2 105.3 1.8 6
A4 s 28.0 25.5 7.4 109.6 1.2 5
m 27.9 25.7 7.4 108.3 1.3 5
b 27.7 26.3 7.1 104.1 1.6 6
A5 s 28.0 25.5 7.5 110.9 1.1 5
m 27.9 25.7 7.4 108.7 1.3 6
b 27.7 26.2 7.2 105.7 1.7 7
A6 s 28.1 25.4 7.6 111.3 1.3 7
m 27.9 25.6 7.4 109.5 1.3 9
b 27.6 26.0 7.1 103.4 1.5 7
B1 s 28.0 25.6 7.5 110.9 1.4 9
m 27.7 26.0 7.1 104.0 1.5 9
b 27.5 26.6 6.8 99.4 1.9 7
B2 s 28.0 25.5 7.4 109.3 6.0 6
m 27.7 26.0 7.0 103.2 1.5 6
b 27.6 26.5 6.8 99.2 1.8 8
B3 s* 28.0 25.6 7.4 109.2 1.4 2
m 27.7 26.1 7.0 102.8 1.7 7
b 27.6 26.4 6.8 99.7 1.9 5
B4 s 28.0 25.5 7.5 110.5 1.4 4
m* 27.7 25.9 7.2 105.4 1.6 5
b 27.6 26.2 6.9 101.4 1.5 4
B5 s 28.1 25.5 7.5 110.2 4.4 4
m 27.8 25.9 7.1 104.4 1.4 6
b* 27.6 26.3 6.9 101.4 1.6 4
B6 s* 28.0 25.5 7.5 110.2 1.9 7
m 27.7 25.9 7.1 104.4 1.6 4
b 27.6 26.5 6.5 95.6 2.7 6
D1 s N/A N/A N/A N/A N/A N/A
m 27.6 25.6 7.1 104.5 1.1 4
b N/A N/A N/A N/A N/A N/A
D2 s 27.8 25.6 7.3 106.8 1.3 3
m N/A N/A N/A N/A N/A N/A
b 27.6 25.6 6.9 100.2 1.3 4
D3 s 27.9 25.6 7.6 111.1 1.3 4
m N/A N/A N/A N/A N/A N/A
b 27.8 25.6 7.5 109.5 1.3 5
D4 s N/A N/A N/A N/A N/A N/A
m 27.8 25.6 7.3 107.1 1.5 4
b N/A N/A N/A N/A N/A N/A

12 July 2012
Station Depth Data Results for Mid Ebb
Temperature (oC)
Salinity (ppt)
DO (mg/L)
DOS (%)
Turbidity (NTU) Suspended Solids
(SS)
Control Stations
C s N/A N/A N/A N/A N/A N/A
m 29.4 20.2 8.0 117.2 3.1 3
b N/A N/A N/A N/A N/A N/A
Marine-based Stations
A1 s* 29.5 20.6 10.0 146.6 2.2 4
m 29.2 20.5 9.9 146.1 2.6 3
b 28.4 24.1 8.3 122.5 5.3 6
A2 s 229.4 20.5 9.4 137.3 2.4 4
m 29.0 21.1 8.8 128.3 2.5 4
b* 27.9 24.7 8.3 121.3 2.6 4
A3 s 29.4 20.5 9.3 138.7 2.4 3
m* 29.2 21.2 9.0 133.6 2.5 4
b 29.0 20.8 8.6 126.2 2.5 3
A4 s* 29.5 20.5 9.9 146.6 2.2 4
m 29.4 20.5 10.0 149.5 2.2 4
b 29.2 20.7 10.1 148.2 2.1 3
A5 s 29.4 20.5 9.7 142.9 2.3 3
m 29.1 20.8 9.6 140.4 2.4 3
b 28.7 21.7 8.2 119.0 3.1 4
A6 s 29.4 20.4 9.3 135.1 1.9 3
m 29.0 20.6 8.6 125.9 2.4 2
b 28.9 21.5 8.3 122.0 2.5 4
B1 s 29.5 20.6 10.1 147.0 2.3 3
m 29.0 21.1 9.2 135.5 1.7 5
b 27.4 26.3 8.2 120.4 2.1 3
B2 s 29.4 20.8 9.4 137.8 2.5 4
m 29.0 21.1 8.5 125.7 2.3 3
b 28.4 24.6 8.1 119.3 2.1 3
B3 s 29.4 20.5 9.4 137.5 2.1 4
m 28.9 21.1 9.2 135.2 2.0 3
b 27.9 25.3 7.8 115.0 3.1 4
B4 s 29.3 20.4 9.2 133.6 1.9 4
m 28.7 21.5 8.7 127.0 2.2 3
b 27.7 25.1 7.3 106.8 2.4 3
B5 s 29.4 20.4 9.3 135.7 4.4 4
m 28.8 21.1 9.3 135.6 1.4 5
b 27.8 25.8 7.5 110.8 1.6 3
B6 s 29.3 20.3 9.0 131.3 2.5 4
m 29.1 20.6 8.7 126.8 2.6 3
b 28.0 25.1 8.0 117.4 5.9 4
D1 s N/A N/A N/A N/A N/A N/A
m 29.5 20.4 8.1 119.3 3.7 5
b N/A N/A N/A N/A N/A N/A
D2 s 29.4 20.5 8.8 129.4 3.3 5
m N/A N/A N/A N/A N/A N/A
b 29.4 20.6 7.7 113.6 3.6 5
D3 s 29.2 20.7 9.0 130.8 3.8 3
m N/A N/A N/A N/A N/A N/A
b 28.9 21.1 8.1 118.2 3.6 3
D4 s N/A N/A N/A N/A N/A N/A
m 29.3 20.5 8.3 121.1 2.4 4
b N/A N/A N/A N/A N/A N/A

14 July 2012
Station Depth Data Results for Mid Ebb
Temperature (oC)
Salinity (ppt)
DO (mg/L)
DOS (%)
Turbidity (NTU) Suspended Solids
(SS)
Control Stations
C s N/A N/A N/A N/A N/A N/A
m 30.5 19.7 7.7 114.2 2.1 4
b N/A N/A N/A N/A N/A N/A
Marine-based Stations
A1 s* 29.6 20.1 9.0 132.3 1.3 <2
m 29.4 20.3 8.9 130.2 1.4 <2
b 26.8 27.5 4.2 61.3 3.1 <2
A2 s 30.1 19.9 8.5 125.8 1.4 <2
m 29.5 20.5 8.8 129.0 1.1 2
b* 28.9 21.6 8.2 118.4 6.1 <2
A3 s 30.1 19.8 8.6 127.4 1.4 <2
m* 29.6 20.2 8.9 130.8 1.6 <2
b 26.6 27.7 5.5 79.8 3.9 4
A4 s* 30.1 19.7 8.6 126.8 1.5 <2
m 29.8 19.9 8.8 129.9 1.5 <2
b 29.4 20.5 9.0 131.9 2.2 <2
A5 s 30.3 19.6 8.5 125.2 1.7 <2
m 29.8 19.9 8.8 129.4 1.5 <2
b 29.4 20.6 8.8 129.6 1.9 7
A6 s 30.2 19.6 8.4 123.9 1.4 <2
m 29.8 19.7 8.7 127.1 1.3 4
b 29.1 21.0 8.6 125.7 2.1 2
B1 s 29.6 19.7 9.0 131.2 1.2 3
m 29.0 21.3 8.3 121.5 2.4 2
b 26.2 28.3 3.6 51.6 3.8 3
B2 s
Blocked by barge, no monitoring and sampling can be done.
m
b
B3 s
m
b
B4 s 29.7 19.8 8.8 129.6 5.1 2
m 29.6 20.2 8.8 129.6 2.2 3
b 27.0 27.5 4.2 60.9 3.6 <2
B5 s 29.9 20.0 8.6 127.3 1.4 4
m 29.0 21.6 8.2 119.6 2.8 3
b 25.4 31.2 2.3 32.9 6.7 8
B6 s 29.7 20.1 8.8 129.7 1.5 <2
m 29.2 21.0 8.6 126.0 2.4 4
b 25.7 30.8 3.1 45.6 6.9 <2
D1 s N/A N/A N/A N/A N/A N/A
m 30.4 19.5 7.6 113.3 3.0 2
b N/A N/A N/A N/A N/A N/A
D2 s 30.2 19.7 8.1 119.7 2.2 2
m N/A N/A N/A N/A N/A N/A
b 29.2 20.9 8.4 123.1 6.9 10
D3 s 30.2 19.7 8.1 119.3 2.1 2
m N/A N/A N/A N/A N/A N/A
b 29.4 20.5 8.6 126.3 1.8 4
D4 s N/A N/A N/A N/A N/A N/A
m 30.5 19.7 7.8 116.3 2.1 3
b N/A N/A N/A N/A N/A N/A

17July 2012
Station Depth Data Results for Mid Ebb
Temperature (oC)
Salinity (ppt)
DO (mg/L)
DOS (%)
Turbidity (NTU)
Suspended Solids (SS)
Control Stations
C s N/A N/A N/A N/A N/A N/A
m 30.2* 20.8* 8.5* 126.8* 1.3* 4*
b N/A N/A N/A N/A N/A N/A
Marine-based Stations
D1 s N/A N/A N/A N/A N/A N/A
m 30.2 21.1 8.4 124.8 2.0 6
b N/A N/A N/A N/A N/A N/A
D2 s 30.2 21.0 8.3 122.8 1.8 4
m N/A N/A N/A N/A N/A N/A
b 29.6 21.5 8.2 121.8 3.6 3
D3 s 30.0 21.2 8.7 129.6 1.5 4
m N/A N/A N/A N/A N/A N/A
b 29.2 22.1 8.2 121.3 2.4 4
D4 s N/A N/A N/A N/A N/A N/A
m 30.1 21.2 8.4 124.2 1.8 6
b N/A N/A N/A N/A N/A N/A
19 July 2012
Station Depth Data Results for Mid Ebb
Temperature (oC)
Salinity (ppt)
DO (mg/L)
DOS (%)
Turbidity (NTU)
Suspended Solids (SS)
Control Stations
C s N/A N/A N/A N/A N/A N/A
m 29.0* 24.3* 7.5* 110.5* 1.1* 2*
b N/A N/A N/A N/A N/A N/A
Marine-based Stations
D1 s N/A N/A N/A N/A N/A N/A
m 26.6 28.2 4.8 70.4 1.9 2
b N/A N/A N/A N/A N/A N/A
D2 s 29.3 24.9 7.0 105.3 1.5 <2
m N/A N/A N/A N/A N/A N/A
b 24.7 31.4 2.7 38.2 2.6 <2
D3 s 28.6 25.3 7.0 103.5 1.6 2
m N/A N/A N/A N/A N/A N/A
b 25.4 30.2 3.0 44.1 1.9 2
D4 s N/A N/A N/A N/A N/A N/A
m 27.2 27.1 6.2 91.2 1.8 2
b N/A N/A N/A N/A N/A N/A

1 September 2012
Station Depth Data Results for Mid Ebb
Temperature (oC)
Salinity (ppt)
DO (mg/L)
DOS (%)
Turbidity (NTU) Suspended Solids
(SS)
Control Stations
C* s N/A N/A N/A N/A N/A N/A
m 28.9 27.7 7.8 118.2 1.5 4
b N/A N/A N/A N/A N/A N/A
Marine-based Stations
D1 s N/A N/A N/A N/A N/A
m 28.9 27.4 7.6 115.2 1.0 2
b N/A N/A N/A N/A N/A
D2 s 28.8 27.5 7.7 115.5 1.1 2
m N/A N/A N/A N/A N/A
b 28.8 27.5 7.8 118.1 1.3 2
D3 s 28.9 27.3 7.6 114.3 1.1 4
m N/A N/A N/A N/A N/A
b 28.8 27.6 7.8 117.1 1.1 3
D4 s N/A N/A N/A N/A N/A
m 28.8 27.5 7.5 112.7 2.2 4
b N/A N/A N/A N/A N/A
4 September 2012
Station Depth Data Results for Mid Ebb
Temperature (oC)
Salinity (ppt)
DO (mg/L)
DOS (%)
Turbidity (NTU) Suspended Solids
(SS)
Control Stations
C s N/A N/A N/A N/A N/A N/A
m 28.5 27.4 7.5 113.2 1.2 4
b N/A N/A N/A N/A N/A N/A
Marine-based Stations
D1* s N/A N/A N/A N/A N/A N/A
m 28.6 28.3 6.9 104.4 2.2 3
b N/A N/A N/A N/A N/A N/A
D2 s 28.7 27.5 7.7 116.2 2.1 3
m N/A N/A N/A N/A N/A N/A
b 28.8 27.4 7.5 113.3 4.0 4
D3 s 28.9 27.6 7.6 114.9 1.4 3
m N/A N/A N/A N/A N/A N/A
b 28.8 27.7 7.3 109.9 1.8 2
D4 s N/A N/A N/A N/A N/A N/A
m 28.8 27.4 6.9 104.8 1.8 5
b N/A N/A N/A N/A N/A N/A

6 September 2012
Station Depth Data Results for Mid Ebb
Temperature (oC)
Salinity (ppt)
DO (mg/L)
DOS (%)
Turbidity (NTU) Suspended Solids
(SS)
Control Stations
C s N/A N/A N/A N/A N/A N/A
m 28.6 27.9 7.6 114.0 1.6 3
b N/A N/A N/A N/A N/A N/A
Marine-based Stations
D1 s N/A N/A N/A N/A N/A N/A
m 28.6 27.6 7.5 113.5 1.8 2
b N/A N/A N/A N/A N/A N/A
D2 s 28.7 27.6 7.7 116.2 2.5 4
m N/A N/A N/A N/A N/A N/A
b 28.5 27.3 6.7 100.1 3.5 4
D3 s 28.8 27.7 7.7 116.7 2.1 <2
m N/A N/A N/A N/A N/A N/A
b 28.4 27.5 6.8 102.5 2.0 <2
D4* s N/A N/A N/A N/A N/A N/A
m 28.7 27.6 7.8 117.4 2.2 4
b N/A N/A N/A N/A N/A N/A
7 September 2012
Station Depth Data Results for Mid Ebb
Temperature (oC)
Salinity (ppt)
DO (mg/L)
DOS (%)
Turbidity (NTU) Suspended Solids
(SS)
Control Stations
C* s N/A N/A N/A N/A N/A N/A
m 28.6 27.8 7.1 106.0 2.5 3
b N/A N/A N/A N/A N/A N/A
Marine-based Stations
D1 s N/A N/A N/A N/A N/A N/A
m 28.7 27.9 7.7 116.7 3.0 3
b N/A N/A N/A N/A N/A N/A
D2 s 28.7 27.7 7.8 118.2 3.8 3
m N/A N/A N/A N/A N/A N/A
b 28.7 27.6 6.7 101.7 3.8 5
D3 s 28.8 27.7 8.0 120.1 3.2 3
m N/A N/A N/A N/A N/A N/A
b 28.6 27.6 7.0 104.7 3.5 3
D4 s N/A N/A N/A N/A N/A N/A
m 28.7 27.5 7.9 119.5 2.9 5
b N/A N/A N/A N/A N/A N/A
11 October 2012
Station Depth Data Results for Mid Ebb
Temperature (oC)
Salinity (ppt)
DO (mg/L)
DOS (%)
Turbidity (NTU) Suspended Solids
(SS)
Control Stations
C s N/A N/A N/A N/A N/A N/A
m* 25.2 28.4 6.5 91.5 3.8 3
b N/A N/A N/A N/A N/A N/A
Marine-based Stations
A1 s 25.2 28.1 6.8 97.5 2.4 4
m 23.4 33.0 6.4 91.3 2.8 4
b 23.4 33.8 6.3 89.0 7.0 2
A2 s 25.2 28.1 6.6 96.8 2.4 5
m 23.3 33.1 6.4 91.2 4.6 4
b 23.0 33.6 6.3 88.8 5.9 4
A3 s 25.2 28.2 6.8 97.2 1.8 7
m 23.4 33.0 6.5 92.2 3.1 7
b 23.2 33.8 6.3 88.6 6.7 4
A4 s 25.2 28.2 6.8 92.9 1.9 4
m 23.5 33.0 6.4 91.3 2.9 4
b 23.3 33.6 6.3 88.4 6.7 3
A5 s 25.1 28.2 6.8 97.3 1.8 3
m 23.4 33.0 6.5 91.5 2.7 3
b 23.1 33.6 6.3 89.3 6.9 3
A6 s 25.2 28.1 6.8 97.6 1.6 5
m 23.2 33.1 6.4 90.9 4.3 6
b 23.0 33.7 6.3 87.6 6.8 3
B1 s* 25.2 28.3 6.7 96.1 2.2 3
m 23.2 33.2 6.4 90.5 4.0 3
b 23.2 34.1 6.3 88.3 5.5 2
B2 s 25.1 28.3 6.6 94.3 2.0 3
m 23.3 33.3 6.4 90.1 3.8 3
b 23.1 34.2 6.3 88.0 6.4 3
B3 s 25.2 28.2 6.7 97.1 1.8 3
m 23.5 33.2 6.5 92.4 2.2 3
b* 23.2 34.1 6.3 88.8 5.8 2
B4 s* 25.2 28.2 6.7 96.8 0.9 4
m 23.5 33.2 6.4 91.1 1.8 2
b 23.0 34.2 6.3 89.3 6.9 3
B5 s 25.2 28.2 6.8 98.7 1.1 <2
m 23.8 33.2 6.5 92.2 2.7 <2
b 23.1 34.0 6.3 88.5 5.9 <2
B6 s 25.1 28.1 6.7 97.6 1.8 3
m 23.6 33.3 6.4 91.5 2.8 2
b 23.3 34.1 6.3 88.9 6.4 2
D1 s N/A N/A N/A N/A N/A N/A
m* 25.1 28.5 6.5 92.1 2.8 3
b N/A N/A N/A N/A N/A N/A
D2 s* 25.2 27.8 6.5 92.5 1.7 <2
m N/A N/A N/A N/A N/A N/A
b 24.1 30.0 6.3 87.8 6.2 5
D3 s* 25.2 27.8 6.5 92.5 1.6 3
m N/A N/A N/A N/A N/A N/A
b 23.9 31.7 6.3 88.0 6.6 2
D4 s N/A N/A N/A N/A N/A N/A
m 24.8 28.7 6.5 91.9 5.5 3
b N/A N/A N/A N/A N/A N/A

Mid-Flood- Summary of Water Quality Data
Notes: s – 1 m below the surface; m – mid depth; b – 1 m above the seabed XX : Limit Level Exceedance; XX: Action Level Exceedance
* – Average value of duplicate sample
28 June 2012
Station Depth Data Results for Mid Ebb
Temperature (oC)
Salinity (ppt)
DO (mg/L)
DOS (%)
Turbidity (NTU) Suspended Solids
(SS)
Control Stations
C s N/A N/A N/A N/A N/A N/A
m 29.8 17.6 14.1 205.2 2.1 3
b N/A N/A N/A N/A N/A N/A
Marine-based Stations
A1 s* 29.8 17.7 12.9 187.0 2.2 5
m 27.5 26.2 5.3 77.9 2.2 3
b 26.7 29.5 4.2 62.4 3.2 2
A2 s 30.0 17.7 13.2 192.1 2.0 3
m* 27.3 26.6 4.9 71.5 2.8 4
b 26.5 30.5 3.9 57.2 3.0 4
A3 s 29.7 17.8 12.4 180.4 2.0 3
m 28.1 21.8 6.0 87.2 2.4 4
b* 27.2 26.6 4.9 71.4 2.9 4
A4 s* 29.6 17.8 12.7 183.5 2.2 4
m 28.2 22.5 6.4 92.8 2.2 4
b 27.0 28.1 4.5 66.4 3.4 3
A5 s 29.7 17.7 13.0 189.0 2.1 5
m 28.6 19.9 7.7 111.4 1.9 4
b 28.1 22.9 6.0 87.2 2.3 3
A6 s 29.4 17.8 12.4 179.1 2.3 3
m 28.8 18.7 8.1 116.2 2.1 3
b 27.0 28.4 4.6 67.0 3.4 4
B1 s 29.4 17.6 11.8 170.8 2.0 3
m 26.7 28.8 3.9 56.7 2.9 3
b 25.0 32.7 3.8 54.7 4.1 2
B2 s 29.2 17.6 11.8 170.2 2.1 4
m 28.0 22.6 5.1 74.0 2.6 3
b 25.3 32.4 3.8 55.5 3.3 3
B3 s 29.2 17.8 11.4 164.2 6.1 3
m 27.3 27.1 4.8 70.6 3.7 <2
b 25.0 32.5 3.8 55.3 3.3 2
B4 s 29.3 17.8 11.7 169.1 2.8 3
m 27.2 27.2 4.8 70.8 2.9 2
b 25.6 32.1 3.7 54.9 2.8 2
B5 s 29.7 17.5 12.8 185.4 2.0 4
m 26.7 29.5 4.2 61.5 2.8 3
b 25.2 32.4 3.6 52.5 6.7 3
B6 s 29.3 17.6 13.5 195.1 2.2 4
m 26.9 29.1 4.6 67.0 1.9 4
b 25.6 32.2 3.8 56.0 3.5 4
D1 s N/A N/A N/A N/A N/A N/A
m 29.8 17.5 14.5 210.3 2.3 4
b N/A N/A N/A N/A N/A N/A
D2 s 30.1 17.5 14.5 210.9 2.5 <2
m N/A N/A N/A N/A N/A N/A
b 28.0 23.3 6.4 92.8 4.3 3
D3 s 30.1 17.4 13.9 202.4 2.3 3
m N/A N/A N/A N/A N/A N/A
b 27.5 26.0 5.4 79.5 2.5 2
D4 s N/A N/A N/A N/A N/A N/A
m 29.4 18.2 11.2 162.6 2.4 2
b N/A N/A N/A N/A N/A N/A

6 July 2012
Station Depth Data Results for Mid Ebb
Temperature (oC)
Salinity (ppt)
DO (mg/L)
DOS (%)
Turbidity (NTU) Suspended Solids
(SS)
Control Stations
C s N/A N/A N/A N/A N/A N/A
m 28.5 25.6 9.7 143.8 1.2 4
b N/A N/A N/A N/A N/A N/A
Marine-based Stations
A1 s 28.9 25.6 9.3 138.3 1.6 6
m 26.7 29.4 5.5 80.7 2.9 7
b 26.4 29.8 5.0 73.9 4.5 9
A2 s 28.9 25.6 9.3 138.6 0.9 4
m 26.8 29.2 5.6 81.9 2.5 6
b 26.4 29.8 5.1 75.1 4.1 8
A3 s* 28.7 25.6 9.4 140.2 1.2 5
m 26.7 29.3 5.5 81.2 2.6 5
b 26.3 28.0 5.0 73.3 4.8 5
A4 s 28.1 26.3 8.4 124.3 1.7 6
m* 27.0 28.8 5.9 86.6 2.5 4
b 26.4 29.8 5.2 76.4 2.9 6
A5 s 28.8 25.6 9.1 135.6 0.9 6
m 27.1 28.8 6.0 88.0 2.0 4
b* 26.7 29.4 5.5 80.5 3.1 6
A6 s* 28.7 25.6 9.2 137.5 1.0 5
m 27.4 28.5 6.1 90.6 1.6 5
b 26.9 29.0 5.6 83.0 3.3 5
B1 s 28.9 25.6 9.0 134.7 1.0 <2
m 27.0 28.8 5.9 86.3 1.8 4
b 25.1 31.2 4.2 60.0 2.8 4
B2 s 28.7 25.6 9.2 136.8 1.1 3
m 27.0 28.9 5.9 87.4 1.7 4
b 24.8 31.6 3.9 56.3 2.5 5
B3 s 28.7 25.5 9.2 136.8 1.1 4
m 27.1 28.6 6.0 88.2 1.9 4
b 25.5 30.8 4.5 65.5 5.3 4
B4 s 28.3 25.7 9.2 135.4 1.4 3
m 26.9 28.9 5.8 85.9 3.8 4
b 26.1 30.1 4.9 71.1 3.6 4
B5 s 28.0 25.6 8.7 128.1 2.9 7
m 26.8 29.0 5.7 83.8 2.4 6
b 26.1 30.2 4.9 71.7 4.7 4
B6 s 28.4 25.3 9.6 142.0 1.0 5
m 26.8 29.0 5.5 81.4 3.6 7
b 25.9 30.4 4.7 68.6 7.5 7
D1 s N/A N/A N/A N/A N/A N/A
m 28.5 26.3 8.1 120.7 2.7 5
b N/A N/A N/A N/A N/A N/A
D2 s 28.9 25.7 8.8 131.1 2.2 6
m N/A N/A N/A N/A N/A N/A
b 26.8 29.1 5.3 77.5 3.1 6
D3 s 28.9 25.7 9.2 137.3 1.2 5
m N/A N/A N/A N/A N/A N/A
b 26.7 29.3 5.8 85.4 2.5 6
D4 s N/A N/A N/A N/A N/A N/A
m 28.6 26.2 8.3 124.0 2.7 7
b N/A N/A N/A N/A N/A N/A

12 July 2012
Station Depth Data Results for Mid Ebb
Temperature (oC)
Salinity (ppt)
DO (mg/L)
DOS (%)
Turbidity (NTU) Suspended Solids
(SS)
Control Stations
C s N/A N/A N/A N/A N/A N/A
m 28.7 20.3 7.4 107.0 2.2
b N/A N/A N/A N/A N/A N/A
Marine-based Stations
A1 s 28.8 20.5 8.0 117.2 3.5 5
m 28.6 23.6 7.8 113.8 4.0 3
b 26.8 28.5 5.9 86.6 5.4 2
A2 s 28.8 20.5 8.5 123.7 2.9 3
m 28.8 20.6 8.2 118.6 3.1 3
b 28.2 24.6 7.7 113.6 3.5 3
A3 s 28.8 20.4 8.4 121.7 2.6 3
m 28.9 20.5 8.0 117.8 3.2 2
b 28.6 24.3 7.9 114.8 3.3 3
A4 s 28.9 20.4 8.7 126.6 2.3 4
m 28.9 20.5 8.6 125.1 2.4 5
b 28.9 20.5 8.6 124.6 2.4 3
A5 s 28.9 20.3 8.5 123.3 3.0 4
m 28.9 20.4 8.4 121.2 3.3 3
b 28.9 20.5 8.0 116.2 4.1 5
A6 s 28.9 20.4 8.5 123.5 2.5 4
m 28.9 20.4 8.1 117.6 3.1 4
b 29.0 22.3 6.6 97.0 4.3 2
B1 s* 28.9 20.7 8.4 121.5 2.2 5
m 28.5 22.9 8.2 119.5 2.4 4
b 25.2 31.4 3.2 52.4 2.7 4
B2 s 28.8 20.6 7.8 116.1 2.4 4
m* 28.7 25.9 7.9 114.6 2.6 3
b 25.3 31.4 5.6 80.8 3.1 4
B3 s 28.7 20.5 8.5 122.8 2.7 3
m 28.9 20.7 8.0 116.3 2.8 5
b* 26.2 29.1 5.5 79.6 3.4 4
B4 s* 28.8 20.4 8.3 120.3 2.2 3
m 29.0 20.8 7.4 107.3 2.7 4
b 26.9 27.9 7.0 102.7 2.8 4
B5 s 28.6 20.6 8.2 119.7 2.2 4
m 28.9 20.6 7.2 104.1 2.3 3
b 27.2 27.4 6.9 100.5 2.8 3
B6 s 28.9 20.5 8.2 119.7 2.5 3
m 28.9 20.5 7.7 111.6 2.8 2
b 28.0 27.2 5.4 79.0 5.9 2
D1 s N/A N/A N/A N/A N/A N/A
m 28.8 20.4 8.4 122.4 3.4 3
b N/A N/A N/A N/A N/A N/A
D2 s 28.8 20.4 8.4 122.2 2.0 4
m N/A N/A N/A N/A N/A N/A
b 28.9 20.4 8.1 116.9 2.2 2
D3 s 28.8 20.5 8.4 121.5 3.0 2
m N/A N/A N/A N/A N/A N/A
b 28.9 20.6 7.7 112.1 3.3 3
D4 s N/A N/A N/A N/A N/A N/A
m 28.8 20.5 7.7 111.1 2.3 3
b N/A N/A N/A N/A N/A N/A

14 July 2012
Station Depth Data Results for Mid Ebb
Temperature (oC)
Salinity (ppt)
DO (mg/L)
DOS (%)
Turbidity (NTU) Suspended Solids
(SS)
Control Stations
C s N/A N/A N/A N/A N/A N/A
m 29.4 19.5 7.7 112.6 1.6 6
b N/A N/A N/A N/A N/A N/A
Marine-based Stations
A1 s 29.3 19.9 8.4 122.8 1.2 3
m 29.0 20.5 8.6 125.0 1.5 <2
b 26.3 28.6 4.5 65.5 5.4 2
A2 s 29.4 19.9 8.4 121.9 1.2 3
m 29.2 20.1 8.7 126.6 1.2 3
b 27.5 24.5 5.5 79.6 6.3 4
A3 s 29.3 19.9 8.4 122.5 1.2 2
m 29.2 19.9 8.6 124.8 1.2 6
b 28.5 21.7 6.7 97.3 5.5 <2
A4 s 29.4 19.7 8.4 121.9 1.7 <2
m 29.4 19.8 8.4 122.4 1.5 <2
b 28.9 21.1 7.8 114.4 2.5 <2
A5 s 29.4 19.7 8.4 122.4 1.5 3
m 29.3 19.7 8.5 123.5 1.3 <2
b 29.0 21.0 7.2 105.5 3.4 3
A6 s 29.3 19.7 8.4 121.9 1.3 <2
m 29.3 19.7 8.5 123.2 1.4 3
b 29.0 20.9 7.7 112.6 2.3 5
B1 s* 29.2 19.8 8.4 121.8 1.4 5
m 27.3 26.1 4.7 68.7 2.7 5
b 25.2 30.9 2.3 32.9 6.3 6
B2 s 29.2 19.8 8.2 119.8 3.0 2
m* 28.5 22.5 6.5 94.2 3.2 4
b 25.0 31.4 3.3 48.2 5.6 11
B3 s 29.2 19.9 8.4 122.2 1.5 6
m 28.6 21.4 6.4 92.8 2.9 4
b* 24.5 32.1 2.8 40.4 6.1 8
B4 s* 29.2 20.0 8.5 123.8 1.3 3
m 28.9 20.9 8.0 117.0 1.7 3
b 25.0 31.4 2.8 40.3 4.5 6
B5 s 29.2 19.9 8.5 123.6 1.3 2
m 28.6 21.9 7.4 107.8 2.1 6
b 26.3 28.4 3.6 52.7 6.4 3
B6 s 29.3 19.9 8.5 123.3 1.3 3
m 28.9 20.9 8.0 117.1 1.9 4
b 26.7 27.5 4.0 58.1 7.0 4
D1 s N/A N/A N/A N/A N/A N/A
m 29.5 19.4 7.6 110.4 1.6 4
b N/A N/A N/A N/A N/A N/A
D2 s 29.5 19.4 7.6 111.4 2.1 6
m N/A N/A N/A N/A N/A N/A
b 29.2 20.0 8.3 120.4 2.1 5
D3 s 29.5 19.6 8.2 119.0 2.0 6
m N/A N/A N/A N/A N/A N/A
b 29.2 20.1 8.7 126.2 1.6 4
D4 s N/A N/A N/A N/A N/A N/A
m 29.4 19.7 8.2 118.9 1.8 5
b N/A N/A N/A N/A N/A N/A

17 July 2012
Station Depth Data Results for Mid Flood
Temperature (oC)
Salinity (ppt)
DO (mg/L)
DOS (%)
Turbidity (NTU)
Suspended Solids (SS)
Control Stations
C s N/A N/A N/A N/A N/A N/A
m 30.5* 21.2* 9.4* 141.0* 1.7* 4.5*
b N/A N/A N/A N/A N/A N/A
Marine-based Stations
D1 s N/A N/A N/A N/A N/A N/A
m 30.3 21.5 9.4 140.6 2.4 4
b N/A N/A N/A N/A N/A N/A
D2 s 30.2 21.5 10.2 152.3 1.6 6
m N/A N/A N/A N/A N/A N/A
b 29.3 22.1 9.5 139.8 2.0 4
D3 s 30.2 21.5 9.7 145.4 2.1 6
m N/A N/A N/A N/A N/A N/A
b 29.5 21.9 9.7 144.1 1.9 6
D4 s N/A N/A N/A N/A N/A N/A
m 30.4 21.4 9.6 144.4 2.0 6
b N/A N/A N/A N/A N/A N/A
19July 2012
Station Depth Data Results for Mid Flood
Temperature (oC)
Salinity (ppt)
DO (mg/L)
DOS (%)
Turbidity (NTU)
Suspended Solids (SS)
Control Stations
C s N/A N/A N/A N/A N/A N/A
m 30.1* 23.8* 9.1* 137.5* 1.3* 3.5*
b N/A N/A N/A N/A N/A N/A
Marine-based Stations
D1 s N/A N/A N/A N/A N/A N/A
m 28.9 25.3 8.5 126.6 2.1 4
b N/A N/A N/A N/A N/A N/A
D2 s 28.8 25.3 8.4 125.8 1.7 <2
m N/A N/A N/A N/A N/A N/A
b 27.8 26.6 7.2 106.0 3.0 6
D3 s 28.8 25.3 8.4 124.4 2.0 4
m N/A N/A N/A N/A N/A N/A
b 27.7 26.8 7.4 109.5 1.5 6
D4 s N/A N/A N/A N/A N/A N/A
m 29.1 25.1 8.7 129.6 1.7 <2
b N/A N/A N/A N/A N/A N/A

1 September 2012
Station Depth Data Results for Mid Ebb
Temperature (oC)
Salinity (ppt)
DO (mg/L)
DOS (%)
Turbidity (NTU) Suspended Solids
(SS)
Control Stations
C* s N/A N/A N/A N/A N/A N/A
m 28.9 28.0 8.0 120.1 0.9 4
b N/A N/A N/A N/A N/A N/A
Marine-based Stations
D1 s N/A N/A N/A N/A N/A N/A
m 28.8 27.5 7.8 118.2 0.8 2
b N/A N/A N/A N/A N/A N/A
D2 s 28.8 27.5 7.5 113.5 0.9 2
m N/A N/A N/A N/A N/A N/A
b 28.8 27.8 7.7 116.1 1.0 2
D3 s 28.8 27.4 7.5 113.1 2.5 5
m N/A N/A N/A N/A N/A N/A
b 28.8 27.6 7.7 116.0 1.0 3
D4 s N/A N/A N/A N/A N/A N/A
m 28.8 27.5 7.8 117.0 1.0 5
b N/A N/A N/A N/A N/A N/A
4 September 2012
Station Depth Data Results for Mid Ebb
Temperature (oC)
Salinity (ppt)
DO (mg/L)
DOS (%)
Turbidity (NTU) Suspended Solids
(SS)
Control Stations
C s N/A N/A N/A N/A N/A N/A
m 28.6 28.7 6.6 99.2 1.3 4
b N/A N/A N/A N/A N/A N/A
Marine-based Stations
D1* s N/A N/A N/A N/A N/A N/A
m 28.5 28.9 6.6 99.5 1.5 4
b N/A N/A N/A N/A N/A N/A
D2 s 28.6 28.7 6.8 102.8 1.4 5
m N/A N/A N/A N/A N/A N/A
b 28.5 29.0 6.2 93.9 1.9 3
D3 s 28.6 28.7 6.7 101.2 1.3 7
m N/A N/A N/A N/A N/A N/A
b 28.4 29.1 6.0 91.2 2.0 5
D4 s N/A N/A N/A N/A N/A N/A
m 28.5 28.7 6.6 100.4 1.3 5
b N/A N/A N/A N/A N/A N/A

6 September 2012
Station Depth Data Results for Mid Ebb
Temperature (oC)
Salinity (ppt)
DO (mg/L)
DOS (%)
Turbidity (NTU) Suspended Solids
(SS)
Control Stations
C s N/A N/A N/A N/A N/A N/A
m 28.5 28.6 6.4 97.3 1.6 6
b N/A N/A N/A N/A N/A N/A
Marine-based Stations
D1 s N/A N/A N/A N/A N/A N/A
m 28.4 28.9 6.6 99.8 1.7 5
b N/A N/A N/A N/A N/A N/A
D2 s 28.4 28.6 6.4 96.4 1.6 3
m N/A N/A N/A N/A N/A N/A
b 28.5 28.7 6.3 94.7 1.5 2
D3 s 28.5 28.8 6.7 101.4 1.8 2
m N/A N/A N/A N/A N/A N/A
b 28.4 29.2 6.2 93.8 1.6 3
D4* s N/A N/A N/A N/A N/A N/A
m 28.7 28.0 7.2 109.1 1.9 5
b N/A N/A N/A N/A N/A N/A
7 September 2012
Station Depth Data Results for Mid Ebb
Temperature (oC)
Salinity (ppt)
DO (mg/L)
DOS (%)
Turbidity (NTU) Suspended Solids
(SS)
Control Stations
C* s N/A N/A N/A N/A N/A N/A
m 28.5 27.7 6.5 98.0 2.1 4
b N/A N/A N/A N/A N/A N/A
Marine-based Stations
D1 s N/A N/A N/A N/A N/A N/A
m 28.6 27.6 6.6 99.2 2.3 5
b N/A N/A N/A N/A N/A N/A
D2 s 28.6 27.4 6.6 99.7 2.5 3
m N/A N/A N/A N/A N/A N/A
b 28.4 27.6 6.6 97.6 3.8 2
D3 s 28.7 27.5 6.5 100.1 2.5 3
m N/A N/A N/A N/A N/A N/A
b 28.6 27.7 6.5 97.6 3.1 2
D4 s N/A N/A N/A N/A N/A N/A
m 28.6 27.6 6.6 99.7 2.9 2
b N/A N/A N/A N/A N/A N/A

11October 2012
Station Depth Data Results for Mid Ebb
Temperature (oC)
Salinity (ppt)
DO (mg/L)
DOS (%)
Turbidity (NTU) Suspended Solids
(SS)
Control Stations
C s N/A N/A N/A N/A N/A N/A
m* 25.8 28.9 6.5 91.0 4.3 2
b N/A N/A N/A N/A N/A N/A
Marine-based Stations
A1 s 25.8 28.7 6.7 96.9 3.4 2
m 33.6 33.6 6.4 90.5 4.4 3
b 33.9 33.9 6.3 88.5 6.8 4
A2 s 28.6 28.6 6.5 95.1 2.4 3
m 33.7 33.7 6.4 90.3 3.7 4
b 34.1 34.1 6.3 88.0 6.3 6
A3 s 28.7 28.7 6.7 96.1 2.7 2
m 33.8 33.8 6.4 91.2 4.1 6
b 34.0 34.0 6.3 86.8 6.9 3
A4 s 28.7 28.7 6.7 96.2 2.4 2
m 33.6 33.6 6.4 91.0 3.4 8
b 34.4 34.4 6.3 86.9 5.9 4
A5 s 28.7 28.7 6.7 96.8 2.9 3
m 33.6 33.6 6.5 93.5 5.0 4
b 34.3 34.3 6.3 88.8 6.7 4
A6 s 28.7 28.7 6.7 96.8 4.1 3
m 33.5 33.5 6.4 89.5 5.3 2
b 34.1 34.1 6.3 88.2 6.7 3
B1 s 25.8 28.8 6.7 95.0 2.5 4
m 34.0 34.0 6.4 89.5 4.3 2
b 34.7 34.7 6.3 87.2 6.4 3
B2 s 28.8 28.8 6.6 95.5 3.0 2
m 34.1 34.1 6.4 89.2 5.2 3
b 34.8 34.8 6.3 87.4 5.4 4
B3 s 28.7 28.7 6.7 96.2 2.2 2
m 34.1 34.1 6.5 89.0 3.2 3
b 34.7 34.7 6.3 88.9 5.5 3
B4 s 28.8 28.8 6.7 95.8 1.9 4
m 34.1 34.1 6.4 90.3 2.7 4
b 34.8 34.8 6.3 88.8 5.9 3
B5 s 28.9 28.9 6.8 96.6 1.8 2
m 34.0 34.0 6.5 90.1 2.7 3
b 34.5 34.5 6.3 89.1 6.4 2
B6 s 28.8 28.8 6.7 97.2 1.8 4
m 34.1 34.1 6.4 89.8 3.0 <2
b 34.7 34.7 6.3 87.4 7.0 <2
D1 s N/A N/A N/A N/A N/A N/A
m* 25.6 29.1 6.5 91.2 3.8 ≤2
b N/A N/A N/A N/A N/A N/A
D2 s* 25.8 28.1 6.5 92.2 3.2 3
m N/A N/A N/A N/A N/A N/A
b 23.9 32.5 6.3 87.3 4.4 2
D3 s* 25.7 28.3 6.5 92.6 2.7 <2
m N/A N/A N/A N/A N/A N/A
b 23.9 32.5 6.3 87.9 5.3 <2
D4 s N/A N/A N/A N/A N/A N/A
m 25.0 28.7 6.4 90.0 6.6 <2
b N/A N/A N/A N/A N/A N/A

South-East Asia Japan Cable System (SJC)
Hong Kong Segment
Post Monitoring Report
Annex C
Water Quality Monitoring Data and Laboratory Result

Marine Water Quality Monitoring - Data Record Sheet
Project Name: Stanley Bay marine water monitoring
Date of Monitoring: __________________________ Weather : Sunny Tide: ebb Sea Condition: Calm
Monitoring Equipment
YSI Sonde 6920 V2
1.0
28.7 17.5 8.2
26.1 30.8 3.5
28.1 23.2 6.1
Turbidity (NTU)
3.7
Monitoring
Location
Time Water Depth
(m)
4.6
8.2
A1 08:25
1.0
Salinity (ppt) DO (mg/L)Sampling Depth
(m)DOS (%)
28/06/2012
5.1
1.0
9.2
Equipment No.
Temperature (oC)
10.2
A2 08:15 9.2
1.0
A3 08:05 8.2 4.1
7.2
A4 07:55 7.3
6.3
A5 07:45 6.4
1.0
3.2
5.4
A6 07:35 6.7
1.0
3.4
5.7
116.4 1.7
27.6 25.9 5.3 77.9 2.2
51.8 5.1
28.7 18.4 8.2 118.0 1.7
89.4 2.2
26.2 30.6 3.5 52.0 6.1
28.7 17.2 8.4 119.3 1.8
28.1 23.3 6.0 87.8 2.9
27.2 27.2 4.5 66.2 3.7
28.7 17.2 8.4 119.7 2.1
28.8 19.7 7.6 110.0 2.2
27.4 26.7 5.0 73.0 2.9
28.6 17.3 8.3 118.0 1.7
28.4 22.8 6.9 101.0 2.1
27.0 28.4 4.3 62.9 3.2
28.8 17.5 8.7 123.6 1.5
29.1 18.4 8.1 117.3 2.0
27.3 27.1 4.9 71.8 2.2
P:\General\Forms\Water\A05704\Stanley_Bay_20120628 (2).xls

Project Name: Stanley Bay marine water monitoring
Date of Monitoring: __________________________ Weather : Sunny Tide: ebb Sea Condition: Calm
Monitoring Equipment
YSI Sonde 6920 V2
DOS (%) Turbidity (NTU)
Equipment No.
28.7
26.7
25.5
1.6
1.9
3.6 51.9
B3 06:45 11.7
1.0
5.9
10.7
B2 06:35 11.4
1.0
5.7
10.4
28/06/2012
Salinity (ppt) DO (mg/L)
B1 06:25 12.8
1.0
6.4
11.8
Monitoring
Location
Time Water Depth
(m)
Sampling Depth
(m)Temperature (oC)
B4 06:55 11.3
1.0
5.7
10.3
B5 07:05 10.6
1.0
5.3
9.6
B6 07:15 10.2
1.0
5.1
9.2
28.8
26.8
25.8
28.8
27.2
26.3
28.8
27.4
25.9
28.7
27.4
26.3
28.8
27.4
26.0
17.4 8.0 114.4
29.1 4.3 63.5
31.5 4.2
17.4 8.2 117.4 1.7
28.9 4.4 63.9 1.9
31.1 3.6 52.3 4.5
17.5 8.3 117.8 1.7
27.8 4.7 68.7 1.7
31.1 3.7 54.0 3.3
18.2 8.0 114.5 1.8
26.6 5.1 74.0 1.8
31.1 3.6 52.4 3.6
17.8 8.1 116.1 1.8
73.3 2.0
26.7 5.0 73.4 2.0
30.8 3.7 54.2 3.3
30.9 3.5 51.8 2.4
17.9 8.1 116.2 1.6
26.6 5.0

Project Name: Stanley Bay marine water monitoring
Date of Monitoring: __________________________ Weather : Sunny Tide: ebb Sea Condition: Calm
Monitoring Equipment
YSI Sonde 6920 V2
DOS (%) Turbidity (NTU)
D3
1.0
DO (mg/L)
09:05 2.5
D2
4.0
C 07:25 2.6
D1 1.3
08:55 5.0
28/06/2012
Equipment No.
Salinity (ppt)
1.3
Monitoring
Location
Time Water Depth
(m)
Sampling Depth
(m)Temperature (oC)
5.3
4.3
D4 08:45 2.6 1.3
1.0
28.7 17.4
08:35
8.4 119.2 1.7
28.9 17.5 8.0 115.0 1.7
28.8 17.5 8.6 123.0 1.6
28.5 18.5 7.0 100.2 2.3
28.7 17.3 8.5 120.8 1.7
28.4 22.0 6.5 94.9 2.3
28.7 17.5 8.1 115.7 1.5

Marine Water Quality Monitoring - Data Record Sheet
Project Name: Stanley Bay marine water monitoring
Date of Monitoring: __________________________ Weather : Cloudy Tide: Flood Sea Condition: Calm
Monitoring Equipment
YSI Sonde 6920 V2
12.4 179.1 2.3
28.8 18.7 8.1 116.2 2.1
4.6 67.0 3.4
A6 12:35 6.4
1.0 29.4 17.8
5.4 27.0 28.4
3.2
5.4 28.1 22.9 6.0 87.2 2.3
189.0 2.1
3.2 28.6 19.9 7.7 111.4 1.9
4.5 66.4 3.4
A5 12:45 6.4
1.0 29.7 17.7 13.0
12.1 174.9 2.2
3.8 28.2 22.5 6.4 92.8 2.2A4 12:55 7.5
1.0 29.4 17.9
6.5 27.0 28.1
8.0 26.3 30.3 3.7 54.0 3.2
180.4 2.0
4.5 28.1 21.8 6.0 87.2 2.4
3.9 57.2 3.0
A3 13:05 9.0
1.0 29.7 17.8 12.4
13.2 192.1 2.0
4.6 28.0 22.9 6.1 88.7 2.4A2 13:15 9.2
1.0 30.0 17.7
8.2 26.5 30.5
8.2 26.7 29.5 4.2 62.4 3.2
17.6 13.2 192.1 2.2
4.6 27.5 26.2 5.3 77.9 2.2
Temperature (oC) Salinity (ppt) DO (mg/L) DOS (%) Turbidity (NTU)
A1 13:25 9.2
1.0 29.8
28/06/2012
Equipment No.
Monitoring
Location
Time Water Depth
(m)
Sampling Depth
(m)
P:\General\Forms\Water\A05704\Stanley_Bay_20120628 (2).xls

Project Name: Stanley Bay marine water monitoring
Date of Monitoring: __________________________ Weather : Cloudy Tide: Flood Sea Condition: Calm
Monitoring Equipment
YSI Sonde 6920 V2
13.5 195.1 2.2
26.9 29.1 4.6 67.0 1.9
3.8 56.0 3.5
B6 12:15 10.1
1.0 29.3 17.6
9.1 25.6 32.2
5.1
11.4 25.2 32.4 3.6 52.5 6.7
185.4 2.0
6.2 26.7 29.5 4.2 61.5 2.8
3.7 54.9 2.8
B5 12:05 12.4
1.0 29.7 17.5 12.8
11.7 169.1 2.8
5.2 27.2 27.2 4.8 70.8 2.9B4 11:55 10.4
1.0 29.3 17.8
9.4 25.6 32.1
10.3 25.0 32.5 3.8 55.3 3.3
164.2 6.1
5.7 27.3 27.1 4.8 70.6 3.7
3.8 55.5 3.3
B3 11:45 11.3
1.0 29.2 17.8 11.4
11.8 170.2 2.1
5.4 28.0 22.6 5.1 74.0 2.6B2 11:35 10.8
1.0 29.2 17.6
9.8 25.3 32.4
11.4 25.0 32.7 3.8 54.7 4.1
17.6 11.8 170.8 2.0
6.2 26.7 28.8 3.9 56.7 2.9
Temperature (oC) Salinity (ppt) DO (mg/L) DOS (%) Turbidity (NTU)
B1 11:25 12.4
1.0 29.4
28/06/2012
Equipment No.
Monitoring
Location
Time Water Depth
(m)
Sampling Depth
(m)

Project Name: Stanley Bay marine water monitoring
Date of Monitoring: __________________________ Weather : Cloudy Tide: Flood Sea Condition: Calm
Monitoring Equipment
YSI Sonde 6920 V2
1.3 29.4 18.2 11.2 162.6 2.4
5.4 79.5 2.5
D4 13:45 2.5
13.9 202.4 2.3
D3 13:35 5.1
1.0 30.1 17.4
4.1 27.5 26.0
4.1 28.0 23.3 6.4 92.8 4.3
210.9 2.5
D2 13:55 5.1
1.0 30.1 17.5 14.5
0.6 29.8 17.5 14.5 210.3 2.3D1 14:05 1.2
1.2 29.8 17.6 14.1 205.2 2.1
Temperature (oC) Salinity (ppt) DO (mg/L) DOS (%) Turbidity (NTU)
C 12:25 2.4
28/06/2012
Equipment No.
Monitoring
Location
Time Water Depth
(m)
Sampling Depth
(m)

Project Name: Stanley Bay marine water monitoring
Date of Monitoring: __________________________ Weather : Tide: Sea Condition:
Monitoring Equipment
YSI Sonde 6920 V2
B1-S-E
B2-M-E
B3-B-E
B4-S-E
A4-S-F
A3-B-F
A2-M-F
A1-S-F 29.8 17.6 13.2 192.0 2.2
3.7 54.3 3.1
28.0 22.9 6.1 88.7 2.5
8.0 113.7 1.6
29.7 17.8 12.5 181.8 2.1
28.7 17.7
26.5 30.3
26.3 31.1 3.7 54.0 3.3
1.6
27.1 28.2 4.4 64.1 1.7
Temperature (oC) Salinity (ppt) DO (mg/L) DOS (%) Turbidity (NTU)
28.6 17.3 7.9 111.8
Equipment No.
Monitoring
Location
Time Water Depth
(m)
Sampling Depth
(m)

False
CERTIFICATE OF ANALYSIS
ATKINS CHINA LTD 1 of 5 Page :Laboratory :Client : ALS Technichem HK Pty Ltd
Contact :
Address :
Contact :
Address :5TH FLOOR,
WHARF T&T CENTRE,
HARBOUR CITY,
TSIM SHA TSUI HONG KONG
:MS ENID YUNG Chan Kwok Fai, Godfrey HK121651211/F., Chung Shun Knitting Centre, 1 - 3 Wing
Yip Street, Kwai Chung, N.T., Hong Kong
Work Order
E-mail : E-mail :[email protected] [email protected]
Telephone :
Facsimile :
Telephone :
Facsimile :
+852 2972 1802 +852 2610 1044
+852 2890 6343 +852 2610 2021
Date received :Project : QUOTATION OF WATER TEST - STANLEY Quote number : ---- 28-JUN-2012
Date of issue : 06-JUL-2012Order number : ----
No. of samples - 94Received :C-O-C number : ----
----Site : Analysed : 94-
Report Comments
This report for ALS Technichem (HK) Pty Ltd work order reference HK1216512 supersedes any previous reports with this reference. The completion date of analysis is 06-JUL-2012. Results apply to
sample(s) as submitted. All pages of this report have been checked and approved for release. When date(s) and/or time(s) are shown bracketed, these have been assumed by the laboratory for
process purposes. Abbreviations: CAS number = Chemical Abstract Services number. LOR = Limit of reporting.
Specific comments for Work Order HK1216512 : Sample(s) were collected by ALS Technichem (HK) staff on 28/06/2012.
Temperature, Salinity, Dissolved Oxygen and Turbidity were measured on-site by ALS Technichem (HK) staff.
Water sample(s) analysed and reported on an as received basis.
This report may not be reproduced except with prior written
approval from ALS Technichem (HK) Pty Ltd.
This document has been electronically signed by those names that appear on this report and are the authorised signatories.
Electronic signing has been carried out in compliance with procedures specified in the 'Electronic Transactions Ordinance'
of Hong Kong, Chapter 553, Section 6.Signatory Authorised results for:-Position
Fung Lim Chee, Richard InorganicsGeneral Manager
Fung Lim Chee, Richard SamplingGeneral Manager
11/F., Chung Shun Knitting Centre, 1-3 Wing Yip Street, Kwai Chung, N.T., Hong Kong
Tel: +852 2610 1044 Fax: +852 2610 2021 www.alsenviro.com

Client : ATKINS CHINA LTD
2 of 5 Page Number :
Work Order HK1216512
Analytical Results
EP025-SAMP:
Dissolved Oxygen
EA045-SAMP:
Turbidity
EA020-SAMP: SalinityEA012-SAMP:
Temperature
Sub-Matrix: MARINE WATER Compound EA025: Suspended
Solids (SS)
0.1 mg/L1 NTU0.1 g/L0.1 °C2 mg/LLOR Unit
OS: On-Site MeasurementOS: On-Site MeasurementOS: On-Site MeasurementOS: On-Site MeasurementEA/ED: Physical and
Aggregate Properties
Client sample ID Client sampling date /
time
Laboratory sample
ID
<2 28.7 17.5 2 8.2A1-S MID-EBB 28-JUN-2012 08:25 HK1216512-001
<2 27.6 25.9 2 5.3A1-M MID-EBB 28-JUN-2012 08:25 HK1216512-002
<2 26.1 30.8 5 3.5A1-B MID-EBB 28-JUN-2012 08:25 HK1216512-003
<2 28.7 18.4 2 8.2A2-S MID-EBB 28-JUN-2012 08:15 HK1216512-004
3 28.1 23.2 2 6.1A2-M MID-EBB 28-JUN-2012 08:15 HK1216512-005
<2 26.2 30.6 6 3.5A2-B MID-EBB 28-JUN-2012 08:15 HK1216512-006
<2 28.7 17.2 2 8.4A3-S MID-EBB 28-JUN-2012 08:05 HK1216512-007
<2 28.1 23.3 3 6.0A3-M MID-EBB 28-JUN-2012 08:05 HK1216512-008
<2 27.2 27.2 4 4.5A3-B MID-EBB 28-JUN-2012 08:05 HK1216512-009
3 28.7 17.2 2 8.4A4-S MID-EBB 28-JUN-2012 07:55 HK1216512-010
<2 28.8 19.7 2 7.6A4-M MID-EBB 28-JUN-2012 07:55 HK1216512-011
<2 27.4 26.7 3 5.0A4-B MID-EBB 28-JUN-2012 07:55 HK1216512-012
<2 28.6 17.3 2 8.3A5-S MID-EBB 28-JUN-2012 07:45 HK1216512-013
<2 28.4 22.8 2 6.9A5-M MID-EBB 28-JUN-2012 07:45 HK1216512-014
<2 27.0 28.4 3 4.3A5-B MID-EBB 28-JUN-2012 07:45 HK1216512-015
<2 28.8 17.5 2 8.7A6-S MID-EBB 28-JUN-2012 07:35 HK1216512-016
<2 29.1 18.4 2 8.1A6-M MID-EBB 28-JUN-2012 07:35 HK1216512-017
<2 27.3 27.1 2 4.9A6-B MID-EBB 28-JUN-2012 07:35 HK1216512-018
6 28.7 17.4 2 8.0B1-S MID-EBB 28-JUN-2012 06:25 HK1216512-019
5 26.7 29.1 2 4.3B1-M MID-EBB 28-JUN-2012 06:25 HK1216512-020
8 25.5 31.5 4 3.6B1-B MID-EBB 28-JUN-2012 06:25 HK1216512-021
3 28.8 17.4 2 8.2B2-S MID-EBB 28-JUN-2012 06:35 HK1216512-022
2 26.8 28.9 2 4.4B2-M MID-EBB 28-JUN-2012 06:35 HK1216512-023
3 25.8 31.1 4 3.6B2-B MID-EBB 28-JUN-2012 06:35 HK1216512-024
2 28.8 17.5 2 8.3B3-S MID-EBB 28-JUN-2012 06:45 HK1216512-025
2 27.2 27.8 2 4.7B3-M MID-EBB 28-JUN-2012 06:45 HK1216512-026
<2 26.3 31.1 3 3.7B3-B MID-EBB 28-JUN-2012 06:45 HK1216512-027
5 28.8 18.2 2 8.0B4-S MID-EBB 28-JUN-2012 06:55 HK1216512-028
2 27.4 26.6 2 5.1B4-M MID-EBB 28-JUN-2012 06:55 HK1216512-029
4 25.9 31.1 4 3.6B4-B MID-EBB 28-JUN-2012 06:55 HK1216512-030
2 28.7 17.8 2 8.1B5-S MID-EBB 28-JUN-2012 07:05 HK1216512-031
3 27.4 26.7 2 5.0B5-M MID-EBB 28-JUN-2012 07:05 HK1216512-032
2 26.3 30.8 3 3.7B5-B MID-EBB 28-JUN-2012 07:05 HK1216512-033
2 28.8 17.9 2 8.1B6-S MID-EBB 28-JUN-2012 07:15 HK1216512-034
5 27.4 26.6 2 5.0B6-M MID-EBB 28-JUN-2012 07:15 HK1216512-035

Client : ATKINS CHINA LTD
3 of 5 Page Number :
Work Order HK1216512
EP025-SAMP:
Dissolved Oxygen
EA045-SAMP:
Turbidity
EA020-SAMP: SalinityEA012-SAMP:
Temperature
Sub-Matrix: MARINE WATER Compound EA025: Suspended
Solids (SS)
0.1 mg/L1 NTU0.1 g/L0.1 °C2 mg/LLOR Unit
OS: On-Site MeasurementOS: On-Site MeasurementOS: On-Site MeasurementOS: On-Site MeasurementEA/ED: Physical and
Aggregate Properties
Client sample ID Client sampling date /
time
Laboratory sample
ID
2 26.0 30.9 2 3.5B6-B MID-EBB 28-JUN-2012 07:15 HK1216512-036
4 28.9 17.5 2 8.0CM MID-EBB 28-JUN-2012 07:25 HK1216512-037
<2 28.7 17.4 2 8.4D1-M MID-EBB 28-JUN-2012 09:05 HK1216512-038
2 28.8 17.5 2 8.6D2-S MID-EBB 28-JUN-2012 08:55 HK1216512-039
<2 28.5 18.5 2 7.0D2-B MID-EBB 28-JUN-2012 08:55 HK1216512-040
<2 28.7 17.3 2 8.5D3-S MID-EBB 28-JUN-2012 08:35 HK1216512-041
<2 28.4 22.0 2 6.5D3-B MID-EBB 28-JUN-2012 08:35 HK1216512-042
<2 28.7 17.5 2 8.1D4-M MID-EBB 28-JUN-2012 08:45 HK1216512-043
4 29.8 17.6 2 13.2A1-S MID-FLOOD 28-JUN-2012 13:25 HK1216512-044
3 27.5 26.2 2 5.3A1-M MID-FLOOD 28-JUN-2012 13:25 HK1216512-045
2 26.7 29.5 3 4.2A1-B MID-FLOOD 28-JUN-2012 13:25 HK1216512-046
3 30.0 17.7 2 13.2A2-S MID-FLOOD 28-JUN-2012 13:15 HK1216512-047
3 28.0 22.9 2 6.1A2-M MID-FLOOD 28-JUN-2012 13:15 HK1216512-048
4 26.5 30.5 3 3.9A2-B MID-FLOOD 28-JUN-2012 13:15 HK1216512-049
3 29.7 17.8 2 12.4A3-S MID-FLOOD 28-JUN-2012 13:05 HK1216512-050
4 28.1 21.8 2 6.0A3-M MID-FLOOD 28-JUN-2012 13:05 HK1216512-051
4 26.3 30.3 3 3.7A3-B MID-FLOOD 28-JUN-2012 13:05 HK1216512-052
5 29.4 17.9 2 12.1A4-S MID-FLOOD 28-JUN-2012 12:55 HK1216512-053
4 28.2 22.5 2 6.4A4-M MID-FLOOD 28-JUN-2012 12:55 HK1216512-054
3 27.0 28.1 3 4.5A4-B MID-FLOOD 28-JUN-2012 12:55 HK1216512-055
5 29.7 17.7 2 13.0A5-S MID-FLOOD 28-JUN-2012 12:45 HK1216512-056
4 28.6 19.9 2 7.7A5-M MID-FLOOD 28-JUN-2012 12:45 HK1216512-057
3 28.1 22.9 2 6.0A5-B MID-FLOOD 28-JUN-2012 12:45 HK1216512-058
3 29.4 17.8 2 12.4A6-S MID-FLOOD 28-JUN-2012 12:35 HK1216512-059
3 28.8 18.7 2 8.1A6-M MID-FLOOD 28-JUN-2012 12:35 HK1216512-060
4 27.0 28.4 3 4.6A6-B MID-FLOOD 28-JUN-2012 12:35 HK1216512-061
3 29.4 17.6 2 11.8B1-S MID-FLOOD 28-JUN-2012 11:25 HK1216512-062
3 26.7 28.8 3 3.9B1-M MID-FLOOD 28-JUN-2012 11:25 HK1216512-063
2 25.0 32.7 4 3.8B1-B MID-FLOOD 28-JUN-2012 11:25 HK1216512-064
4 29.2 17.6 2 11.8B2-S MID-FLOOD 28-JUN-2012 11:35 HK1216512-065
3 28.0 22.6 3 5.1B2-M MID-FLOOD 28-JUN-2012 11:35 HK1216512-066
3 25.3 32.4 3 3.8B2-B MID-FLOOD 28-JUN-2012 11:35 HK1216512-067
3 29.2 17.8 6 11.4B3-S MID-FLOOD 28-JUN-2012 11:45 HK1216512-068
<2 27.3 27.1 4 4.8B3-M MID-FLOOD 28-JUN-2012 11:45 HK1216512-069
2 25.0 32.5 3 3.8B3-B MID-FLOOD 28-JUN-2012 11:45 HK1216512-070
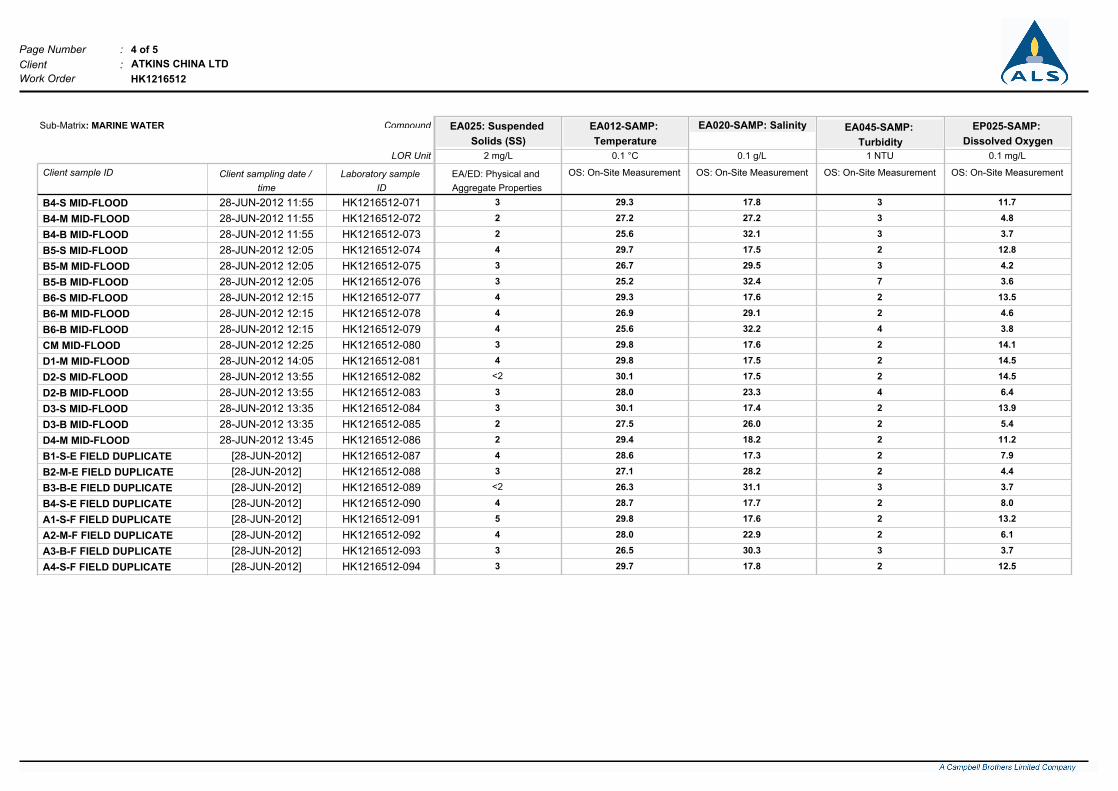
Client : ATKINS CHINA LTD
4 of 5 Page Number :
Work Order HK1216512
EP025-SAMP:
Dissolved Oxygen
EA045-SAMP:
Turbidity
EA020-SAMP: SalinityEA012-SAMP:
Temperature
Sub-Matrix: MARINE WATER Compound EA025: Suspended
Solids (SS)
0.1 mg/L1 NTU0.1 g/L0.1 °C2 mg/LLOR Unit
OS: On-Site MeasurementOS: On-Site MeasurementOS: On-Site MeasurementOS: On-Site MeasurementEA/ED: Physical and
Aggregate Properties
Client sample ID Client sampling date /
time
Laboratory sample
ID
3 29.3 17.8 3 11.7B4-S MID-FLOOD 28-JUN-2012 11:55 HK1216512-071
2 27.2 27.2 3 4.8B4-M MID-FLOOD 28-JUN-2012 11:55 HK1216512-072
2 25.6 32.1 3 3.7B4-B MID-FLOOD 28-JUN-2012 11:55 HK1216512-073
4 29.7 17.5 2 12.8B5-S MID-FLOOD 28-JUN-2012 12:05 HK1216512-074
3 26.7 29.5 3 4.2B5-M MID-FLOOD 28-JUN-2012 12:05 HK1216512-075
3 25.2 32.4 7 3.6B5-B MID-FLOOD 28-JUN-2012 12:05 HK1216512-076
4 29.3 17.6 2 13.5B6-S MID-FLOOD 28-JUN-2012 12:15 HK1216512-077
4 26.9 29.1 2 4.6B6-M MID-FLOOD 28-JUN-2012 12:15 HK1216512-078
4 25.6 32.2 4 3.8B6-B MID-FLOOD 28-JUN-2012 12:15 HK1216512-079
3 29.8 17.6 2 14.1CM MID-FLOOD 28-JUN-2012 12:25 HK1216512-080
4 29.8 17.5 2 14.5D1-M MID-FLOOD 28-JUN-2012 14:05 HK1216512-081
<2 30.1 17.5 2 14.5D2-S MID-FLOOD 28-JUN-2012 13:55 HK1216512-082
3 28.0 23.3 4 6.4D2-B MID-FLOOD 28-JUN-2012 13:55 HK1216512-083
3 30.1 17.4 2 13.9D3-S MID-FLOOD 28-JUN-2012 13:35 HK1216512-084
2 27.5 26.0 2 5.4D3-B MID-FLOOD 28-JUN-2012 13:35 HK1216512-085
2 29.4 18.2 2 11.2D4-M MID-FLOOD 28-JUN-2012 13:45 HK1216512-086
4 28.6 17.3 2 7.9B1-S-E FIELD DUPLICATE [28-JUN-2012] HK1216512-087
3 27.1 28.2 2 4.4B2-M-E FIELD DUPLICATE [28-JUN-2012] HK1216512-088
<2 26.3 31.1 3 3.7B3-B-E FIELD DUPLICATE [28-JUN-2012] HK1216512-089
4 28.7 17.7 2 8.0B4-S-E FIELD DUPLICATE [28-JUN-2012] HK1216512-090
5 29.8 17.6 2 13.2A1-S-F FIELD DUPLICATE [28-JUN-2012] HK1216512-091
4 28.0 22.9 2 6.1A2-M-F FIELD DUPLICATE [28-JUN-2012] HK1216512-092
3 26.5 30.3 3 3.7A3-B-F FIELD DUPLICATE [28-JUN-2012] HK1216512-093
3 29.7 17.8 2 12.5A4-S-F FIELD DUPLICATE [28-JUN-2012] HK1216512-094

Client : ATKINS CHINA LTD
5 of 5 Page Number :
Work Order HK1216512
Laboratory Duplicate (DUP) Report
Matrix: WATER Laboratory Duplicate (DUP) Report
Original Result RPD (%)Laboratory sample ID Client sample ID Method: Compound CAS Number LOR Unit Duplicate Result
EA/ED: Physical and Aggregate Properties (QC Lot: 2388098)
EA025: Suspended Solids (SS) ---- 2 mg/L <2 <2 0.0A1-S MID-EBBHK1216512-001
EA025: Suspended Solids (SS) ---- 2 mg/L <2 <2 0.0A4-M MID-EBBHK1216512-011
EA/ED: Physical and Aggregate Properties (QC Lot: 2388099)
EA025: Suspended Solids (SS) ---- 2 mg/L 8 7 0.0B1-B MID-EBBHK1216512-021
EA025: Suspended Solids (SS) ---- 2 mg/L 2 3 38.2B5-S MID-EBBHK1216512-031
EA/ED: Physical and Aggregate Properties (QC Lot: 2388100)
EA025: Suspended Solids (SS) ---- 2 mg/L <2 <2 0.0D3-S MID-EBBHK1216512-041
EA025: Suspended Solids (SS) ---- 2 mg/L 4 6 45.4A3-M MID-FLOODHK1216512-051
EA/ED: Physical and Aggregate Properties (QC Lot: 2388101)
EA025: Suspended Solids (SS) ---- 2 mg/L 4 3 0.0A6-B MID-FLOODHK1216512-061
EA025: Suspended Solids (SS) ---- 2 mg/L 3 5 34.4B4-S MID-FLOODHK1216512-071
EA/ED: Physical and Aggregate Properties (QC Lot: 2388102)
EA025: Suspended Solids (SS) ---- 2 mg/L 4 3 35.0D1-M MID-FLOODHK1216512-081
EA025: Suspended Solids (SS) ---- 2 mg/L 5 3 40.2A1-S-F FIELD DUPLICATEHK1216512-091
Method Blank (MB), Laboratory Control Spike (LCS) and Laboratory Control Spike Duplicate (DCS) Report
Matrix: WATER Method Blank (MB) Report Laboratory Control Spike (LCS) and Laboratory Control Spike Duplicate (DCS) Report
RPDs (%)Spike Spike Recovery (%) Recovery Limits (%)
Control LimitValueResult Concentration HighLowLCS DCSMethod: Compound CAS Number LOR Unit
EA/ED: Physical and Aggregate Properties (QCLot: 2388098)
2 mg/L----EA025: Suspended Solids (SS) <2 ----100 ----20 mg/L 11385 ----
EA/ED: Physical and Aggregate Properties (QCLot: 2388099)
2 mg/L----EA025: Suspended Solids (SS) <2 ----102 ----20 mg/L 11385 ----
EA/ED: Physical and Aggregate Properties (QCLot: 2388100)
2 mg/L----EA025: Suspended Solids (SS) <2 ----99.5 ----20 mg/L 11385 ----
EA/ED: Physical and Aggregate Properties (QCLot: 2388101)
2 mg/L----EA025: Suspended Solids (SS) <2 ----99.5 ----20 mg/L 11385 ----
EA/ED: Physical and Aggregate Properties (QCLot: 2388102)
2 mg/L----EA025: Suspended Solids (SS) <2 ----103 ----20 mg/L 11385 ----
Matrix Spike (MS) and Matrix Spike Duplicate (MSD) Report
l No Matrix Spike (MS) or Matrix Spike Duplicate (MSD) Results are required to be reported.

Marine Water Quality Monitoring - Data Record Sheet
Project Name: Stanley Bay marine water monitoring
Date of Monitoring: __________________________ Weather : Sunny Tide: ebb Sea Condition: Calm
Monitoring Equipment
YSI Sonde 6920 V2
1.0
28.7 17.5 8.2
26.1 30.8 3.5
28.1 23.2 6.1
Turbidity (NTU)
3.7
Monitoring
Location
Time Water Depth
(m)
4.6
8.2
A1 08:25
1.0
Salinity (ppt) DO (mg/L)Sampling Depth
(m)DOS (%)
28/06/2012
5.1
1.0
9.2
Equipment No.
Temperature (oC)
10.2
A2 08:15 9.2
1.0
A3 08:05 8.2 4.1
7.2
A4 07:55 7.3
6.3
A5 07:45 6.4
1.0
3.2
5.4
A6 07:35 6.7
1.0
3.4
5.7
116.4 1.7
27.6 25.9 5.3 77.9 2.2
51.8 5.1
28.7 18.4 8.2 118.0 1.7
89.4 2.2
26.2 30.6 3.5 52.0 6.1
28.7 17.2 8.4 119.3 1.8
28.1 23.3 6.0 87.8 2.9
27.2 27.2 4.5 66.2 3.7
28.7 17.2 8.4 119.7 2.1
28.8 19.7 7.6 110.0 2.2
27.4 26.7 5.0 73.0 2.9
28.6 17.3 8.3 118.0 1.7
28.4 22.8 6.9 101.0 2.1
27.0 28.4 4.3 62.9 3.2
28.8 17.5 8.7 123.6 1.5
29.1 18.4 8.1 117.3 2.0
27.3 27.1 4.9 71.8 2.2
P:\General\Forms\Water\A05704\Stanley_Bay_20120628 (2).xls

Project Name: Stanley Bay marine water monitoring
Date of Monitoring: __________________________ Weather : Sunny Tide: ebb Sea Condition: Calm
Monitoring Equipment
YSI Sonde 6920 V2
DOS (%) Turbidity (NTU)
Equipment No.
28.7
26.7
25.5
1.6
1.9
3.6 51.9
B3 06:45 11.7
1.0
5.9
10.7
B2 06:35 11.4
1.0
5.7
10.4
28/06/2012
Salinity (ppt) DO (mg/L)
B1 06:25 12.8
1.0
6.4
11.8
Monitoring
Location
Time Water Depth
(m)
Sampling Depth
(m)Temperature (oC)
B4 06:55 11.3
1.0
5.7
10.3
B5 07:05 10.6
1.0
5.3
9.6
B6 07:15 10.2
1.0
5.1
9.2
28.8
26.8
25.8
28.8
27.2
26.3
28.8
27.4
25.9
28.7
27.4
26.3
28.8
27.4
26.0
17.4 8.0 114.4
29.1 4.3 63.5
31.5 4.2
17.4 8.2 117.4 1.7
28.9 4.4 63.9 1.9
31.1 3.6 52.3 4.5
17.5 8.3 117.8 1.7
27.8 4.7 68.7 1.7
31.1 3.7 54.0 3.3
18.2 8.0 114.5 1.8
26.6 5.1 74.0 1.8
31.1 3.6 52.4 3.6
17.8 8.1 116.1 1.8
73.3 2.0
26.7 5.0 73.4 2.0
30.8 3.7 54.2 3.3
30.9 3.5 51.8 2.4
17.9 8.1 116.2 1.6
26.6 5.0

Project Name: Stanley Bay marine water monitoring
Date of Monitoring: __________________________ Weather : Sunny Tide: ebb Sea Condition: Calm
Monitoring Equipment
YSI Sonde 6920 V2
DOS (%) Turbidity (NTU)
D3
1.0
DO (mg/L)
09:05 2.5
D2
4.0
C 07:25 2.6
D1 1.3
08:55 5.0
28/06/2012
Equipment No.
Salinity (ppt)
1.3
Monitoring
Location
Time Water Depth
(m)
Sampling Depth
(m)Temperature (oC)
5.3
4.3
D4 08:45 2.6 1.3
1.0
28.7 17.4
08:35
8.4 119.2 1.7
28.9 17.5 8.0 115.0 1.7
28.8 17.5 8.6 123.0 1.6
28.5 18.5 7.0 100.2 2.3
28.7 17.3 8.5 120.8 1.7
28.4 22.0 6.5 94.9 2.3
28.7 17.5 8.1 115.7 1.5

Marine Water Quality Monitoring - Data Record Sheet
Project Name: Stanley Bay marine water monitoring
Date of Monitoring: __________________________ Weather : Cloudy Tide: Flood Sea Condition: Calm
Monitoring Equipment
YSI Sonde 6920 V2
12.4 179.1 2.3
28.8 18.7 8.1 116.2 2.1
4.6 67.0 3.4
A6 12:35 6.4
1.0 29.4 17.8
5.4 27.0 28.4
3.2
5.4 28.1 22.9 6.0 87.2 2.3
189.0 2.1
3.2 28.6 19.9 7.7 111.4 1.9
4.5 66.4 3.4
A5 12:45 6.4
1.0 29.7 17.7 13.0
12.1 174.9 2.2
3.8 28.2 22.5 6.4 92.8 2.2A4 12:55 7.5
1.0 29.4 17.9
6.5 27.0 28.1
8.0 26.3 30.3 3.7 54.0 3.2
180.4 2.0
4.5 28.1 21.8 6.0 87.2 2.4
3.9 57.2 3.0
A3 13:05 9.0
1.0 29.7 17.8 12.4
13.2 192.1 2.0
4.6 28.0 22.9 6.1 88.7 2.4A2 13:15 9.2
1.0 30.0 17.7
8.2 26.5 30.5
8.2 26.7 29.5 4.2 62.4 3.2
17.6 13.2 192.1 2.2
4.6 27.5 26.2 5.3 77.9 2.2
Temperature (oC) Salinity (ppt) DO (mg/L) DOS (%) Turbidity (NTU)
A1 13:25 9.2
1.0 29.8
28/06/2012
Equipment No.
Monitoring
Location
Time Water Depth
(m)
Sampling Depth
(m)
P:\General\Forms\Water\A05704\Stanley_Bay_20120628 (2).xls

Project Name: Stanley Bay marine water monitoring
Date of Monitoring: __________________________ Weather : Cloudy Tide: Flood Sea Condition: Calm
Monitoring Equipment
YSI Sonde 6920 V2
13.5 195.1 2.2
26.9 29.1 4.6 67.0 1.9
3.8 56.0 3.5
B6 12:15 10.1
1.0 29.3 17.6
9.1 25.6 32.2
5.1
11.4 25.2 32.4 3.6 52.5 6.7
185.4 2.0
6.2 26.7 29.5 4.2 61.5 2.8
3.7 54.9 2.8
B5 12:05 12.4
1.0 29.7 17.5 12.8
11.7 169.1 2.8
5.2 27.2 27.2 4.8 70.8 2.9B4 11:55 10.4
1.0 29.3 17.8
9.4 25.6 32.1
10.3 25.0 32.5 3.8 55.3 3.3
164.2 6.1
5.7 27.3 27.1 4.8 70.6 3.7
3.8 55.5 3.3
B3 11:45 11.3
1.0 29.2 17.8 11.4
11.8 170.2 2.1
5.4 28.0 22.6 5.1 74.0 2.6B2 11:35 10.8
1.0 29.2 17.6
9.8 25.3 32.4
11.4 25.0 32.7 3.8 54.7 4.1
17.6 11.8 170.8 2.0
6.2 26.7 28.8 3.9 56.7 2.9
Temperature (oC) Salinity (ppt) DO (mg/L) DOS (%) Turbidity (NTU)
B1 11:25 12.4
1.0 29.4
28/06/2012
Equipment No.
Monitoring
Location
Time Water Depth
(m)
Sampling Depth
(m)

Project Name: Stanley Bay marine water monitoring
Date of Monitoring: __________________________ Weather : Cloudy Tide: Flood Sea Condition: Calm
Monitoring Equipment
YSI Sonde 6920 V2
1.3 29.4 18.2 11.2 162.6 2.4
5.4 79.5 2.5
D4 13:45 2.5
13.9 202.4 2.3
D3 13:35 5.1
1.0 30.1 17.4
4.1 27.5 26.0
4.1 28.0 23.3 6.4 92.8 4.3
210.9 2.5
D2 13:55 5.1
1.0 30.1 17.5 14.5
0.6 29.8 17.5 14.5 210.3 2.3D1 14:05 1.2
1.2 29.8 17.6 14.1 205.2 2.1
Temperature (oC) Salinity (ppt) DO (mg/L) DOS (%) Turbidity (NTU)
C 12:25 2.4
28/06/2012
Equipment No.
Monitoring
Location
Time Water Depth
(m)
Sampling Depth
(m)

Project Name: Stanley Bay marine water monitoring
Date of Monitoring: __________________________ Weather : Tide: Sea Condition:
Monitoring Equipment
YSI Sonde 6920 V2
B1-S-E
B2-M-E
B3-B-E
B4-S-E
A4-S-F
A3-B-F
A2-M-F
A1-S-F 29.8 17.6 13.2 192.0 2.2
3.7 54.3 3.1
28.0 22.9 6.1 88.7 2.5
8.0 113.7 1.6
29.7 17.8 12.5 181.8 2.1
28.7 17.7
26.5 30.3
26.3 31.1 3.7 54.0 3.3
1.6
27.1 28.2 4.4 64.1 1.7
Temperature (oC) Salinity (ppt) DO (mg/L) DOS (%) Turbidity (NTU)
28.6 17.3 7.9 111.8
Equipment No.
Monitoring
Location
Time Water Depth
(m)
Sampling Depth
(m)

False
CERTIFICATE OF ANALYSIS
ATKINS CHINA LTD 1 of 5 Page :Laboratory :Client : ALS Technichem HK Pty Ltd
Contact :
Address :
Contact :
Address :5TH FLOOR,
WHARF T&T CENTRE,
HARBOUR CITY,
TSIM SHA TSUI HONG KONG
:MS ENID YUNG Chan Kwok Fai, Godfrey HK121651211/F., Chung Shun Knitting Centre, 1 - 3 Wing
Yip Street, Kwai Chung, N.T., Hong Kong
Work Order
E-mail : E-mail :[email protected] [email protected]
Telephone :
Facsimile :
Telephone :
Facsimile :
+852 2972 1802 +852 2610 1044
+852 2890 6343 +852 2610 2021
Date received :Project : QUOTATION OF WATER TEST - STANLEY Quote number : ---- 28-JUN-2012
Date of issue : 06-JUL-2012Order number : ----
No. of samples - 94Received :C-O-C number : ----
----Site : Analysed : 94-
Report Comments
This report for ALS Technichem (HK) Pty Ltd work order reference HK1216512 supersedes any previous reports with this reference. The completion date of analysis is 06-JUL-2012. Results apply to
sample(s) as submitted. All pages of this report have been checked and approved for release. When date(s) and/or time(s) are shown bracketed, these have been assumed by the laboratory for
process purposes. Abbreviations: CAS number = Chemical Abstract Services number. LOR = Limit of reporting.
Specific comments for Work Order HK1216512 : Sample(s) were collected by ALS Technichem (HK) staff on 28/06/2012.
Temperature, Salinity, Dissolved Oxygen and Turbidity were measured on-site by ALS Technichem (HK) staff.
Water sample(s) analysed and reported on an as received basis.
This report may not be reproduced except with prior written
approval from ALS Technichem (HK) Pty Ltd.
This document has been electronically signed by those names that appear on this report and are the authorised signatories.
Electronic signing has been carried out in compliance with procedures specified in the 'Electronic Transactions Ordinance'
of Hong Kong, Chapter 553, Section 6.Signatory Authorised results for:-Position
Fung Lim Chee, Richard InorganicsGeneral Manager
Fung Lim Chee, Richard SamplingGeneral Manager
11/F., Chung Shun Knitting Centre, 1-3 Wing Yip Street, Kwai Chung, N.T., Hong Kong
Tel: +852 2610 1044 Fax: +852 2610 2021 www.alsenviro.com

Client : ATKINS CHINA LTD
2 of 5 Page Number :
Work Order HK1216512
Analytical Results
EP025-SAMP:
Dissolved Oxygen
EA045-SAMP:
Turbidity
EA020-SAMP: SalinityEA012-SAMP:
Temperature
Sub-Matrix: MARINE WATER Compound EA025: Suspended
Solids (SS)
0.1 mg/L1 NTU0.1 g/L0.1 °C2 mg/LLOR Unit
OS: On-Site MeasurementOS: On-Site MeasurementOS: On-Site MeasurementOS: On-Site MeasurementEA/ED: Physical and
Aggregate Properties
Client sample ID Client sampling date /
time
Laboratory sample
ID
<2 28.7 17.5 2 8.2A1-S MID-EBB 28-JUN-2012 08:25 HK1216512-001
<2 27.6 25.9 2 5.3A1-M MID-EBB 28-JUN-2012 08:25 HK1216512-002
<2 26.1 30.8 5 3.5A1-B MID-EBB 28-JUN-2012 08:25 HK1216512-003
<2 28.7 18.4 2 8.2A2-S MID-EBB 28-JUN-2012 08:15 HK1216512-004
3 28.1 23.2 2 6.1A2-M MID-EBB 28-JUN-2012 08:15 HK1216512-005
<2 26.2 30.6 6 3.5A2-B MID-EBB 28-JUN-2012 08:15 HK1216512-006
<2 28.7 17.2 2 8.4A3-S MID-EBB 28-JUN-2012 08:05 HK1216512-007
<2 28.1 23.3 3 6.0A3-M MID-EBB 28-JUN-2012 08:05 HK1216512-008
<2 27.2 27.2 4 4.5A3-B MID-EBB 28-JUN-2012 08:05 HK1216512-009
3 28.7 17.2 2 8.4A4-S MID-EBB 28-JUN-2012 07:55 HK1216512-010
<2 28.8 19.7 2 7.6A4-M MID-EBB 28-JUN-2012 07:55 HK1216512-011
<2 27.4 26.7 3 5.0A4-B MID-EBB 28-JUN-2012 07:55 HK1216512-012
<2 28.6 17.3 2 8.3A5-S MID-EBB 28-JUN-2012 07:45 HK1216512-013
<2 28.4 22.8 2 6.9A5-M MID-EBB 28-JUN-2012 07:45 HK1216512-014
<2 27.0 28.4 3 4.3A5-B MID-EBB 28-JUN-2012 07:45 HK1216512-015
<2 28.8 17.5 2 8.7A6-S MID-EBB 28-JUN-2012 07:35 HK1216512-016
<2 29.1 18.4 2 8.1A6-M MID-EBB 28-JUN-2012 07:35 HK1216512-017
<2 27.3 27.1 2 4.9A6-B MID-EBB 28-JUN-2012 07:35 HK1216512-018
6 28.7 17.4 2 8.0B1-S MID-EBB 28-JUN-2012 06:25 HK1216512-019
5 26.7 29.1 2 4.3B1-M MID-EBB 28-JUN-2012 06:25 HK1216512-020
8 25.5 31.5 4 3.6B1-B MID-EBB 28-JUN-2012 06:25 HK1216512-021
3 28.8 17.4 2 8.2B2-S MID-EBB 28-JUN-2012 06:35 HK1216512-022
2 26.8 28.9 2 4.4B2-M MID-EBB 28-JUN-2012 06:35 HK1216512-023
3 25.8 31.1 4 3.6B2-B MID-EBB 28-JUN-2012 06:35 HK1216512-024
2 28.8 17.5 2 8.3B3-S MID-EBB 28-JUN-2012 06:45 HK1216512-025
2 27.2 27.8 2 4.7B3-M MID-EBB 28-JUN-2012 06:45 HK1216512-026
<2 26.3 31.1 3 3.7B3-B MID-EBB 28-JUN-2012 06:45 HK1216512-027
5 28.8 18.2 2 8.0B4-S MID-EBB 28-JUN-2012 06:55 HK1216512-028
2 27.4 26.6 2 5.1B4-M MID-EBB 28-JUN-2012 06:55 HK1216512-029
4 25.9 31.1 4 3.6B4-B MID-EBB 28-JUN-2012 06:55 HK1216512-030
2 28.7 17.8 2 8.1B5-S MID-EBB 28-JUN-2012 07:05 HK1216512-031
3 27.4 26.7 2 5.0B5-M MID-EBB 28-JUN-2012 07:05 HK1216512-032
2 26.3 30.8 3 3.7B5-B MID-EBB 28-JUN-2012 07:05 HK1216512-033
2 28.8 17.9 2 8.1B6-S MID-EBB 28-JUN-2012 07:15 HK1216512-034
5 27.4 26.6 2 5.0B6-M MID-EBB 28-JUN-2012 07:15 HK1216512-035

Client : ATKINS CHINA LTD
3 of 5 Page Number :
Work Order HK1216512
EP025-SAMP:
Dissolved Oxygen
EA045-SAMP:
Turbidity
EA020-SAMP: SalinityEA012-SAMP:
Temperature
Sub-Matrix: MARINE WATER Compound EA025: Suspended
Solids (SS)
0.1 mg/L1 NTU0.1 g/L0.1 °C2 mg/LLOR Unit
OS: On-Site MeasurementOS: On-Site MeasurementOS: On-Site MeasurementOS: On-Site MeasurementEA/ED: Physical and
Aggregate Properties
Client sample ID Client sampling date /
time
Laboratory sample
ID
2 26.0 30.9 2 3.5B6-B MID-EBB 28-JUN-2012 07:15 HK1216512-036
4 28.9 17.5 2 8.0CM MID-EBB 28-JUN-2012 07:25 HK1216512-037
<2 28.7 17.4 2 8.4D1-M MID-EBB 28-JUN-2012 09:05 HK1216512-038
2 28.8 17.5 2 8.6D2-S MID-EBB 28-JUN-2012 08:55 HK1216512-039
<2 28.5 18.5 2 7.0D2-B MID-EBB 28-JUN-2012 08:55 HK1216512-040
<2 28.7 17.3 2 8.5D3-S MID-EBB 28-JUN-2012 08:35 HK1216512-041
<2 28.4 22.0 2 6.5D3-B MID-EBB 28-JUN-2012 08:35 HK1216512-042
<2 28.7 17.5 2 8.1D4-M MID-EBB 28-JUN-2012 08:45 HK1216512-043
4 29.8 17.6 2 13.2A1-S MID-FLOOD 28-JUN-2012 13:25 HK1216512-044
3 27.5 26.2 2 5.3A1-M MID-FLOOD 28-JUN-2012 13:25 HK1216512-045
2 26.7 29.5 3 4.2A1-B MID-FLOOD 28-JUN-2012 13:25 HK1216512-046
3 30.0 17.7 2 13.2A2-S MID-FLOOD 28-JUN-2012 13:15 HK1216512-047
3 28.0 22.9 2 6.1A2-M MID-FLOOD 28-JUN-2012 13:15 HK1216512-048
4 26.5 30.5 3 3.9A2-B MID-FLOOD 28-JUN-2012 13:15 HK1216512-049
3 29.7 17.8 2 12.4A3-S MID-FLOOD 28-JUN-2012 13:05 HK1216512-050
4 28.1 21.8 2 6.0A3-M MID-FLOOD 28-JUN-2012 13:05 HK1216512-051
4 26.3 30.3 3 3.7A3-B MID-FLOOD 28-JUN-2012 13:05 HK1216512-052
5 29.4 17.9 2 12.1A4-S MID-FLOOD 28-JUN-2012 12:55 HK1216512-053
4 28.2 22.5 2 6.4A4-M MID-FLOOD 28-JUN-2012 12:55 HK1216512-054
3 27.0 28.1 3 4.5A4-B MID-FLOOD 28-JUN-2012 12:55 HK1216512-055
5 29.7 17.7 2 13.0A5-S MID-FLOOD 28-JUN-2012 12:45 HK1216512-056
4 28.6 19.9 2 7.7A5-M MID-FLOOD 28-JUN-2012 12:45 HK1216512-057
3 28.1 22.9 2 6.0A5-B MID-FLOOD 28-JUN-2012 12:45 HK1216512-058
3 29.4 17.8 2 12.4A6-S MID-FLOOD 28-JUN-2012 12:35 HK1216512-059
3 28.8 18.7 2 8.1A6-M MID-FLOOD 28-JUN-2012 12:35 HK1216512-060
4 27.0 28.4 3 4.6A6-B MID-FLOOD 28-JUN-2012 12:35 HK1216512-061
3 29.4 17.6 2 11.8B1-S MID-FLOOD 28-JUN-2012 11:25 HK1216512-062
3 26.7 28.8 3 3.9B1-M MID-FLOOD 28-JUN-2012 11:25 HK1216512-063
2 25.0 32.7 4 3.8B1-B MID-FLOOD 28-JUN-2012 11:25 HK1216512-064
4 29.2 17.6 2 11.8B2-S MID-FLOOD 28-JUN-2012 11:35 HK1216512-065
3 28.0 22.6 3 5.1B2-M MID-FLOOD 28-JUN-2012 11:35 HK1216512-066
3 25.3 32.4 3 3.8B2-B MID-FLOOD 28-JUN-2012 11:35 HK1216512-067
3 29.2 17.8 6 11.4B3-S MID-FLOOD 28-JUN-2012 11:45 HK1216512-068
<2 27.3 27.1 4 4.8B3-M MID-FLOOD 28-JUN-2012 11:45 HK1216512-069
2 25.0 32.5 3 3.8B3-B MID-FLOOD 28-JUN-2012 11:45 HK1216512-070

Client : ATKINS CHINA LTD
4 of 5 Page Number :
Work Order HK1216512
EP025-SAMP:
Dissolved Oxygen
EA045-SAMP:
Turbidity
EA020-SAMP: SalinityEA012-SAMP:
Temperature
Sub-Matrix: MARINE WATER Compound EA025: Suspended
Solids (SS)
0.1 mg/L1 NTU0.1 g/L0.1 °C2 mg/LLOR Unit
OS: On-Site MeasurementOS: On-Site MeasurementOS: On-Site MeasurementOS: On-Site MeasurementEA/ED: Physical and
Aggregate Properties
Client sample ID Client sampling date /
time
Laboratory sample
ID
3 29.3 17.8 3 11.7B4-S MID-FLOOD 28-JUN-2012 11:55 HK1216512-071
2 27.2 27.2 3 4.8B4-M MID-FLOOD 28-JUN-2012 11:55 HK1216512-072
2 25.6 32.1 3 3.7B4-B MID-FLOOD 28-JUN-2012 11:55 HK1216512-073
4 29.7 17.5 2 12.8B5-S MID-FLOOD 28-JUN-2012 12:05 HK1216512-074
3 26.7 29.5 3 4.2B5-M MID-FLOOD 28-JUN-2012 12:05 HK1216512-075
3 25.2 32.4 7 3.6B5-B MID-FLOOD 28-JUN-2012 12:05 HK1216512-076
4 29.3 17.6 2 13.5B6-S MID-FLOOD 28-JUN-2012 12:15 HK1216512-077
4 26.9 29.1 2 4.6B6-M MID-FLOOD 28-JUN-2012 12:15 HK1216512-078
4 25.6 32.2 4 3.8B6-B MID-FLOOD 28-JUN-2012 12:15 HK1216512-079
3 29.8 17.6 2 14.1CM MID-FLOOD 28-JUN-2012 12:25 HK1216512-080
4 29.8 17.5 2 14.5D1-M MID-FLOOD 28-JUN-2012 14:05 HK1216512-081
<2 30.1 17.5 2 14.5D2-S MID-FLOOD 28-JUN-2012 13:55 HK1216512-082
3 28.0 23.3 4 6.4D2-B MID-FLOOD 28-JUN-2012 13:55 HK1216512-083
3 30.1 17.4 2 13.9D3-S MID-FLOOD 28-JUN-2012 13:35 HK1216512-084
2 27.5 26.0 2 5.4D3-B MID-FLOOD 28-JUN-2012 13:35 HK1216512-085
2 29.4 18.2 2 11.2D4-M MID-FLOOD 28-JUN-2012 13:45 HK1216512-086
4 28.6 17.3 2 7.9B1-S-E FIELD DUPLICATE [28-JUN-2012] HK1216512-087
3 27.1 28.2 2 4.4B2-M-E FIELD DUPLICATE [28-JUN-2012] HK1216512-088
<2 26.3 31.1 3 3.7B3-B-E FIELD DUPLICATE [28-JUN-2012] HK1216512-089
4 28.7 17.7 2 8.0B4-S-E FIELD DUPLICATE [28-JUN-2012] HK1216512-090
5 29.8 17.6 2 13.2A1-S-F FIELD DUPLICATE [28-JUN-2012] HK1216512-091
4 28.0 22.9 2 6.1A2-M-F FIELD DUPLICATE [28-JUN-2012] HK1216512-092
3 26.5 30.3 3 3.7A3-B-F FIELD DUPLICATE [28-JUN-2012] HK1216512-093
3 29.7 17.8 2 12.5A4-S-F FIELD DUPLICATE [28-JUN-2012] HK1216512-094

Client : ATKINS CHINA LTD
5 of 5 Page Number :
Work Order HK1216512
Laboratory Duplicate (DUP) Report
Matrix: WATER Laboratory Duplicate (DUP) Report
Original Result RPD (%)Laboratory sample ID Client sample ID Method: Compound CAS Number LOR Unit Duplicate Result
EA/ED: Physical and Aggregate Properties (QC Lot: 2388098)
EA025: Suspended Solids (SS) ---- 2 mg/L <2 <2 0.0A1-S MID-EBBHK1216512-001
EA025: Suspended Solids (SS) ---- 2 mg/L <2 <2 0.0A4-M MID-EBBHK1216512-011
EA/ED: Physical and Aggregate Properties (QC Lot: 2388099)
EA025: Suspended Solids (SS) ---- 2 mg/L 8 7 0.0B1-B MID-EBBHK1216512-021
EA025: Suspended Solids (SS) ---- 2 mg/L 2 3 38.2B5-S MID-EBBHK1216512-031
EA/ED: Physical and Aggregate Properties (QC Lot: 2388100)
EA025: Suspended Solids (SS) ---- 2 mg/L <2 <2 0.0D3-S MID-EBBHK1216512-041
EA025: Suspended Solids (SS) ---- 2 mg/L 4 6 45.4A3-M MID-FLOODHK1216512-051
EA/ED: Physical and Aggregate Properties (QC Lot: 2388101)
EA025: Suspended Solids (SS) ---- 2 mg/L 4 3 0.0A6-B MID-FLOODHK1216512-061
EA025: Suspended Solids (SS) ---- 2 mg/L 3 5 34.4B4-S MID-FLOODHK1216512-071
EA/ED: Physical and Aggregate Properties (QC Lot: 2388102)
EA025: Suspended Solids (SS) ---- 2 mg/L 4 3 35.0D1-M MID-FLOODHK1216512-081
EA025: Suspended Solids (SS) ---- 2 mg/L 5 3 40.2A1-S-F FIELD DUPLICATEHK1216512-091
Method Blank (MB), Laboratory Control Spike (LCS) and Laboratory Control Spike Duplicate (DCS) Report
Matrix: WATER Method Blank (MB) Report Laboratory Control Spike (LCS) and Laboratory Control Spike Duplicate (DCS) Report
RPDs (%)Spike Spike Recovery (%) Recovery Limits (%)
Control LimitValueResult Concentration HighLowLCS DCSMethod: Compound CAS Number LOR Unit
EA/ED: Physical and Aggregate Properties (QCLot: 2388098)
2 mg/L----EA025: Suspended Solids (SS) <2 ----100 ----20 mg/L 11385 ----
EA/ED: Physical and Aggregate Properties (QCLot: 2388099)
2 mg/L----EA025: Suspended Solids (SS) <2 ----102 ----20 mg/L 11385 ----
EA/ED: Physical and Aggregate Properties (QCLot: 2388100)
2 mg/L----EA025: Suspended Solids (SS) <2 ----99.5 ----20 mg/L 11385 ----
EA/ED: Physical and Aggregate Properties (QCLot: 2388101)
2 mg/L----EA025: Suspended Solids (SS) <2 ----99.5 ----20 mg/L 11385 ----
EA/ED: Physical and Aggregate Properties (QCLot: 2388102)
2 mg/L----EA025: Suspended Solids (SS) <2 ----103 ----20 mg/L 11385 ----
Matrix Spike (MS) and Matrix Spike Duplicate (MSD) Report
l No Matrix Spike (MS) or Matrix Spike Duplicate (MSD) Results are required to be reported.
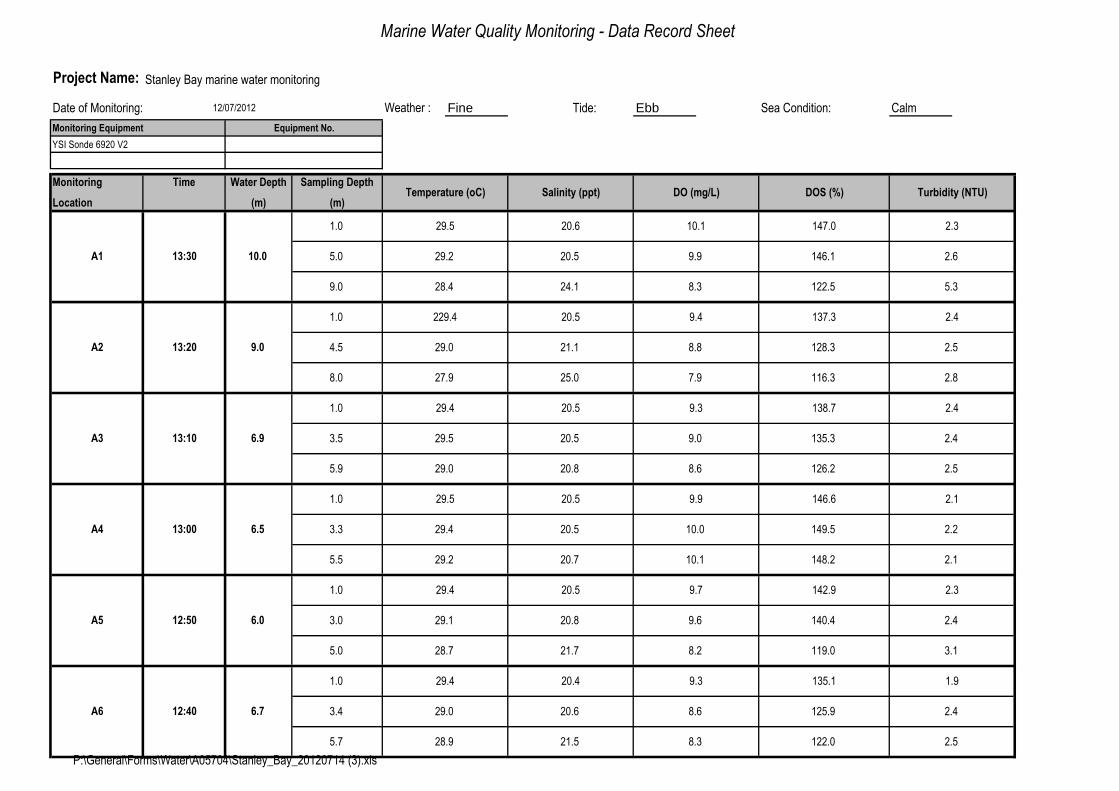
Marine Water Quality Monitoring - Data Record Sheet
Project Name: Stanley Bay marine water monitoring
Date of Monitoring: __________________________ Weather : Fine Tide: Ebb Sea Condition: Calm
Monitoring Equipment
YSI Sonde 6920 V2
8.3 122.0 2.5
9.3 135.1 1.9
3.4 29.0 20.6 8.6 125.9 2.4A6 12:40 6.7
1.0 29.4 20.4
5.7 28.9 21.5
5.0 28.7 21.7 8.2 119.0 3.1
142.9 2.3
3.0 29.1 20.8 9.6 140.4 2.4
10.1 148.2 2.1
A5 12:50 6.0
1.0 29.4 20.5 9.7
9.9 146.6 2.1
3.3 29.4 20.5 10.0 149.5 2.2A4 13:00 6.5
1.0 29.5 20.5
5.5 29.2 20.7
5.9 29.0 20.8 8.6 126.2 2.5
138.7 2.4
3.5 29.5 20.5 9.0 135.3 2.4
7.9 116.3 2.8
A3 13:10 6.9
1.0 29.4 20.5 9.3
9.4 137.3 2.4
4.5 29.0 21.1 8.8 128.3 2.5A2 13:20 9.0
1.0 229.4 20.5
8.0 27.9 25.0
9.0 28.4 24.1 8.3 122.5 5.3
20.6 10.1 147.0 2.3
5.0 29.2 20.5 9.9 146.1 2.6
Temperature (oC) Salinity (ppt) DO (mg/L) DOS (%) Turbidity (NTU)
A1 13:30 10.0
1.0 29.5
12/07/2012
Equipment No.
Monitoring
Location
Time Water Depth
(m)
Sampling Depth
(m)
P:\General\Forms\Water\A05704\Stanley_Bay_20120714 (3).xls

Project Name: Stanley Bay marine water monitoring
Date of Monitoring: __________________________ Weather : Fine Tide: Ebb Sea Condition: Calm
Monitoring Equipment
YSI Sonde 6920 V2
8.0 117.4 5.9
9.0 131.3 2.5
5.3 29.1 20.6 8.7 126.8 2.6B6 12:20 10.5
1.0 29.3 20.3
9.5 28.0 25.1
9.3 27.8 25.8 7.5 110.8 1.6
135.7 4.4
5.2 28.8 21.1 9.3 135.6 1.4
7.3 106.8 2.4
B5 12:10 10.3
1.0 29.4 20.4 9.3
9.2 133.6 1.9
5.4 28.7 21.5 8.7 127.0 2.2B4 12:00 10.8
1.0 29.3 20.4
9.8 27.7 25.1
10.1 27.9 25.3 7.8 115.0 3.1
137.5 2.1
5.6 28.9 21.1 9.2 135.2 2.0
8.1 119.3 2.1
B3 11:50 11.1
1.0 29.4 20.5 9.4
9.4 137.8 2.5
5.6 29.0 21.1 8.5 125.7 2.3B2 11:40 11.1
1.0 29.4 20.8
10.1 28.4 24.6
10.4 27.4 26.3 8.2 120.4 2.1
21.0 9.7 141.6 1.5
5.7 29.0 21.1 9.2 135.5 1.7
Temperature (oC) Salinity (ppt) DO (mg/L) DOS (%) Turbidity (NTU)
B1 11:30 11.4
1.0 29.8
12/07/2012
Equipment No.
Monitoring
Location
Time Water Depth
(m)
Sampling Depth
(m)

Project Name: Stanley Bay marine water monitoring
Date of Monitoring: __________________________ Weather : Fine Tide: Ebb Sea Condition: Calm
Monitoring Equipment
YSI Sonde 6920 V2
1.3 29.3 20.5 8.3 121.1 2.4
8.1 118.2 3.6
D4 13:50 2.6
9.0 130.8 3.8
D3 13:40 5.3
1.0 29.2 20.7
4.3 28.9 21.1
3.7 29.4 20.6 7.7 113.6 3.6
129.4 3.3
D2 14:00 4.7
1.0 29.4 20.5 8.8
1.3 29.5 20.4 8.1 119.3 3.7D1 14:10 2.6
1.2 29.4 20.2 8.0 117.2 3.1
Temperature (oC) Salinity (ppt) DO (mg/L) DOS (%) Turbidity (NTU)
C 12:30 2.3
12/07/2012
Equipment No.
Monitoring
Location
Time Water Depth
(m)
Sampling Depth
(m)

Marine Water Quality Monitoring - Data Record Sheet
Project Name: Stanley Bay marine water monitoring
Date of Monitoring: __________________________ Weather : Fine Tide: Flood Sea Condition: Calm
Monitoring Equipment
YSI Sonde 6920 V2
6.6 97.0 4.3
8.5 123.5 2.5
4.4 28.9 20.4 8.1 117.6 3.1A6 07:50 8.8
1.0 28.9 20.4
7.8 29.0 22.3
7.9 28.9 20.5 8.0 116.2 4.1
123.3 3.0
4.5 28.9 20.4 8.4 121.2 3.3
8.6 124.6 2.4
A5 08:00 8.9
1.0 28.9 20.3 8.5
8.7 126.6 2.3
4.3 28.9 20.5 8.6 125.1 2.4A4 08:10 8.5
1.0 28.9 20.4
7.5 28.9 20.5
6.8 28.6 24.3 7.9 114.8 3.3
121.7 2.6
3.9 28.9 20.5 8.0 117.8 3.2
7.7 113.6 3.5
A3 08:20 7.8
1.0 28.8 20.4 8.4
8.5 123.7 2.9
4.4 28.8 20.6 8.2 118.6 3.1A2 08:30 8.7
1.0 28.8 20.5
7.7 28.2 24.6
9.3 26.8 28.5 5.9 86.6 5.4
20.5 8.0 117.2 3.5
5.2 28.6 23.6 7.8 113.8 4.0
Temperature (oC) Salinity (ppt) DO (mg/L) DOS (%) Turbidity (NTU)
A1 08:40 10.3
1.0 28.8
12/07/2012
Equipment No.
Monitoring
Location
Time Water Depth
(m)
Sampling Depth
(m)
P:\General\Forms\Water\A05704\Stanley_Bay_20120714 (3).xls

Project Name: Stanley Bay marine water monitoring
Date of Monitoring: __________________________ Weather : Fine Tide: Flood Sea Condition: Calm
Monitoring Equipment
YSI Sonde 6920 V2
5.4 79.0 5.9
8.2 119.7 2.5
5.3 28.9 20.5 7.7 111.6 2.8B6 07:30 10.5
1.0 28.9 20.5
9.5 28.0 27.2
9.3 27.2 27.4 6.9 100.5 2.8
119.7 2.2
5.2 28.9 20.6 7.2 104.1 2.3
7.0 102.7 2.8
B5 07:20 10.3
1.0 28.6 20.6 8.2
8.3 120.3 2.2
5.4 29.0 20.8 7.4 107.3 2.7B4 07:10 10.8
1.0 28.8 20.4
9.8 26.9 27.9
11.0 26.1 29.1 5.4 77.9 3.4
122.8 2.7
6.0 28.9 20.7 8.0 116.3 2.8
5.6 80.8 3.1
B3 07:00 12.0
1.0 28.7 20.5 8.5
7.8 116.1 2.4
5.6 28.5 26.0 7.7 112.3 2.7B2 06:50 11.1
1.0 28.8 20.6
10.1 25.3 31.4
11.0 25.2 31.4 3.2 52.4 2.7
20.7 8.4 121.5 2.2
6.0 28.5 22.9 8.2 119.5 2.4
Temperature (oC) Salinity (ppt) DO (mg/L) DOS (%) Turbidity (NTU)
B1 06:40 12.0
1.0 28.8
12/07/2012
Equipment No.
Monitoring
Location
Time Water Depth
(m)
Sampling Depth
(m)

Project Name: Stanley Bay marine water monitoring
Date of Monitoring: __________________________ Weather : Fine Tide: Flood Sea Condition: Calm
Monitoring Equipment
YSI Sonde 6920 V2
1.4 28.8 20.5 7.7 111.1 2.3
7.7 112.1 3.3
D4 09:00 2.7
8.4 121.5 3.0
D3 08:50 5.2
1.0 28.8 20.5
4.2 28.9 20.6
4.3 28.9 20.4 8.1 116.9 2.2
122.2 2.0
D2 09:10 5.3
1.0 28.8 20.4 8.4
1.2 28.8 20.4 8.4 122.4 3.4D1 09:20 2.4
1.1 28.7 20.3 7.4 107.0 2.2
Temperature (oC) Salinity (ppt) DO (mg/L) DOS (%) Turbidity (NTU)
C 07:40 2.2
12/07/2012
Equipment No.
Monitoring
Location
Time Water Depth
(m)
Sampling Depth
(m)

Project Name: Stanley Bay marine water monitoring
Date of Monitoring: __________________________ Weather : Tide: Sea Condition:
Monitoring Equipment
YSI Sonde 6920 V2
B1-S-F
B2-M-F
B3-B-F
B4-S-F
A4-S-E
A3-M-E
A2-B-E
A1-S-E 29.5 20.6 9.9 146.1 2.1
27.9 24.3 8.6 126.2 2.4
28.8 21.9 9.0 131.9 2.5
29.5 20.5 10.0 146.6 2.2
28.9 20.4 8.3 120.2 2.2
26.2 29.1 5.6 81.2 3.3
2.2
28.8 25.8 8.0 116.8 2.5
Temperature (oC) Salinity (ppt) DO (mg/L) DOS (%) Turbidity (NTU)
28.9 20.7 8.4 121.4
Equipment No.
Monitoring
Location
Time Water Depth
(m)
Sampling Depth
(m)

Marine Water Quality Monitoring - Data Record Sheet
Project Name: Stanley Bay marine water monitoring
Date of Monitoring: __________________________ Weather : Fine Tide: Flood Sea Condition: Moderate
Monitoring Equipment
YSI Sonde 6920 V2
1.0
29.3 19.9 8.4
26.3 28.6 4.5
29.2 20.1 8.7
Turbidity (NTU)
3.3
Monitoring
Location
Time Water Depth
(m)
4.4
7.7
A1 10:30
1.0
Salinity (ppt) DO (mg/L)Sampling Depth
(m)DOS (%)
14/07/2012
4.5
1.0
8.0
Equipment No.
Temperature (oC)
9.0
A2 10:20 8.7
1.0
A3 10:10 7.4 3.7
6.4
A4 10:00 6.6
5.6
A5 09:50 6.5
1.0
3.3
5.5
A6 09:40 6.1
1.0
3.1
5.1
122.8 1.2
29.0 20.5 8.6 125.0 1.5
65.5 5.4
29.4 19.9 8.4 121.9 1.2
126.6 1.2
27.5 24.5 5.5 79.6 6.3
29.3 19.9 8.4 122.5 1.2
29.2 19.9 8.6 124.8 1.2
28.5 21.7 6.7 97.3 5.5
29.4 19.7 8.4 121.9 1.7
29.4 19.8 8.4 122.4 1.5
28.9 21.1 7.8 114.4 2.5
29.4 19.7 8.4 122.4 1.5
29.3 19.7 8.5 123.5 1.3
29.0 21.0 7.2 105.5 3.4
29.3 19.7 8.4 121.9 1.3
29.3 19.7 8.5 123.2 1.4
29.0 20.9 7.7 112.6 2.3
P:\General\Forms\Water\A05704\Stanley_Bay_20120714 (3).xls

Project Name: Stanley Bay marine water monitoring
Date of Monitoring: __________________________ Weather : Fine Tide: Flood Sea Condition: Moderate
Monitoring Equipment
YSI Sonde 6920 V2
DOS (%) Turbidity (NTU)
Equipment No.
29.2
27.3
25.2
1.4
2.7
2.3 32.9
B3 08:50 11.2
1.0
5.6
10.2
B2 08:40 11.6
1.0
5.8
10.6
14/07/2012
Salinity (ppt) DO (mg/L)
B1 08:30 11.2
1.0
5.6
10.2
Monitoring
Location
Time Water Depth
(m)
Sampling Depth
(m)Temperature (oC)
B4 09:00 9.6
1.0
4.8
8.6
B5 09:10 11.0
1.0
5.5
10.0
B6 09:20 9.4
1.0
4.7
8.4
29.2
28.5
25.0
29.2
28.6
24.5
29.2
28.9
25.0
29.2
28.6
26.3
29.3
28.9
26.7
19.8 8.4 121.8
26.1 4.7 68.7
30.9 6.3
19.8 8.2 119.8 3.0
22.5 6.5 94.2 3.2
31.4 3.3 48.2 5.6
19.9 8.4 122.2 1.5
21.4 6.4 92.8 2.9
32.1 2.8 40.4 6.1
20.0 8.5 123.8 1.3
20.9 8.0 117.0 1.7
31.4 2.8 40.3 4.5
19.9 8.5 123.6 1.3
117.1 1.9
21.9 7.4 107.8 2.1
28.4 3.6 52.7 6.4
27.5 4.0 58.1 7.0
19.9 8.5 123.3 1.3
20.9 8.0

Project Name: Stanley Bay marine water monitoring
Date of Monitoring: __________________________ Weather : Fine Tide: Flood Sea Condition: Moderate
Monitoring Equipment
YSI Sonde 6920 V2
DOS (%) Turbidity (NTU)
D3
1.0
DO (mg/L)
11:10 2.3
D2
4.2
C 09:30 2.2
D1 1.2
11:00 5.2
14/07/2012
Equipment No.
Salinity (ppt)
1.1
Monitoring
Location
Time Water Depth
(m)
Sampling Depth
(m)Temperature (oC)
4.8
3.8
D4 10:50 2.4 1.2
1.0
29.5 19.4
10:40
7.6 110.4 1.6
29.4 19.5 7.7 112.6 1.6
29.5 19.4 7.6 111.4 2.1
29.2 20.0 8.3 120.4 2.1
29.5 19.6 8.2 119.0 2.0
29.2 20.1 8.7 126.2 1.6
29.4 19.7 8.2 118.9 1.8

Marine Water Quality Monitoring - Data Record Sheet
Project Name: Stanley Bay marine water monitoring
Date of Monitoring: __________________________ Weather : Cloudy Tide: Ebb Sea Condition: Calm
Monitoring Equipment
YSI Sonde 6920 V2
8.4 123.9 1.4
29.8 19.7 8.7 127.1 1.3
8.6 125.7 2.1
A6 15:40 6.2
1.0 30.2 19.6
5.2 29.1 21.0
3.1
5.2 29.4 20.6 8.8 129.6 1.9
125.2 1.7
3.1 29.8 19.9 8.8 129.4 1.5
9.0 131.9 2.2
A5 15:50 6.2
1.0 30.3 19.6 8.5
8.6 126.6 1.4
3.3 29.8 19.9 8.8 129.9 1.5A4 16:00 6.6
1.0 30.1 19.7
5.6 29.4 20.5
6.6 26.6 27.7 5.5 79.8 3.9
127.4 1.4
3.8 29.6 20.2 8.9 130.4 1.7
8.2 119.2 6.2
A3 16:10 7.6
1.0 30.1 19.8 8.6
8.5 125.8 1.4
4.4 29.5 20.5 8.8 129.0 1.1A2 16:20 8.8
1.0 30.1 19.9
7.8 28.9 21.6
8.5 26.8 27.5 4.2 61.3 3.1
20.1 9.0 131.4 1.2
4.8 29.4 20.3 8.9 130.2 1.4
Temperature (oC) Salinity (ppt) DO (mg/L) DOS (%) Turbidity (NTU)
A1 16:30 9.5
1.0 29.6
14/07/2012
Equipment No.
Monitoring
Location
Time Water Depth
(m)
Sampling Depth
(m)
P:\General\Forms\Water\A05704\Stanley_Bay_20120714 (3).xls

Project Name: Stanley Bay marine water monitoring
Date of Monitoring: __________________________ Weather : Cloudy Tide: Ebb Sea Condition: Calm
Monitoring Equipment
YSI Sonde 6920 V2
8.8 129.7 1.5
29.2 21.0 8.6 126.0 2.4
3.1 45.6 6.9
B6 15:20 9.6
1.0 29.7 20.1
8.6 25.7 30.8
4.8
10.4 25.4 31.2 2.3 32.9 6.7
127.3 1.4
5.7 29.0 21.6 8.2 119.6 2.8
4.2 60.9 3.6
B5 15:10 11.4
1.0 29.9 20.0
4.4 29.6 20.2 8.8 129.6 2.2
27.0 27.5
8.6
8.8 129.6 5.1
B2
Blocked by barge, no monitoring and sampling can be done.
B3
B4 15:00 8.8
1.0 29.7 19.8
7.8
10.0 26.2 28.3 3.6 51.6 3.8
19.7 9.0 131.2 1.2
5.5 29.0 21.3 8.3 121.5 2.4
Temperature (oC) Salinity (ppt) DO (mg/L) DOS (%) Turbidity (NTU)
B1 14:50 11.0
1.0 29.6
14/07/2012
Equipment No.
Monitoring
Location
Time Water Depth
(m)
Sampling Depth
(m)

Project Name: Stanley Bay marine water monitoring
Date of Monitoring: __________________________ Weather : Cloudy Tide: Ebb Sea Condition: Calm
Monitoring Equipment
YSI Sonde 6920 V2
1.3 30.5 19.7 7.8 116.3 2.1
8.6 126.3 1.8
D4 16:50 2.5
8.1 119.3 2.1
D3 16:40 5.0
1.0 30.2 19.7
4.0 29.4 20.5
4.3 29.2 20.9 8.4 123.1 6.9
119.7 2.2
D2 17:00 5.3
1.0 30.2 19.7 8.1
1.3 30.4 19.5 7.6 113.3 3.0D1 17:10 2.5
1.2 30.5 19.7 7.7 114.2 2.1
Temperature (oC) Salinity (ppt) DO (mg/L) DOS (%) Turbidity (NTU)
C 15:30 2.4
14/07/2012
Equipment No.
Monitoring
Location
Time Water Depth
(m)
Sampling Depth
(m)

Project Name: Stanley Bay marine water monitoring
Date of Monitoring: __________________________ Weather : Tide: Sea Condition:
Monitoring Equipment
YSI Sonde 6920 V2
B1-S-F
B2-M-F
B3-B-F
B4-S-F
A4-S-E
A3-M-E
A2-B-E
A1-S-E 29.6 20.1 9.0 133.2 1.3
8.9 131.2 1.5
28.9 21.6 8.2 117.6 5.9
8.5 124.0 1.4
30.1 19.7 8.6 127.0 1.6
29.2 20.0
29.6 20.2
24.5 32.1 2.8 40.3 5.9
1.4
28.5 22.5 6.5 94.1 3.1
Temperature (oC) Salinity (ppt) DO (mg/L) DOS (%) Turbidity (NTU)
29.2 19.8 8.4 121.9
Equipment No.
Monitoring
Location
Time Water Depth
(m)
Sampling Depth
(m)

False
CERTIFICATE OF ANALYSIS
ATKINS CHINA LTD 1 of 5 Page :Laboratory :Client : ALS Technichem HK Pty Ltd
Contact :
Address :
Contact :
Address :5TH FLOOR,
WHARF T&T CENTRE,
HARBOUR CITY,
TSIM SHA TSUI HONG KONG
:MS ENID YUNG Chan Kwok Fai, Godfrey HK121838311/F., Chung Shun Knitting Centre, 1 - 3 Wing
Yip Street, Kwai Chung, N.T., Hong Kong
Work Order
E-mail : E-mail :[email protected] [email protected]
Telephone :
Facsimile :
Telephone :
Facsimile :
+852 2972 1802 +852 2610 1044
+852 2890 6343 +852 2610 2021
Date received :Project : QUOTATION OF WATER TEST - STANLEY Quote number : ---- 12-JUL-2012
Date of issue : 20-JUL-2012Order number : ----
No. of samples - 94Received :C-O-C number : ----
STANLEY BAYSite : Analysed : 94-
Report Comments
This report for ALS Technichem (HK) Pty Ltd work order reference HK1218383 supersedes any previous reports with this reference. The completion date of analysis is 20-JUL-2012. Results apply to
sample(s) as submitted. All pages of this report have been checked and approved for release. When date(s) and/or time(s) are shown bracketed, these have been assumed by the laboratory for
process purposes. Abbreviations: CAS number = Chemical Abstract Services number. LOR = Limit of reporting.
Specific comments for Work Order HK1218383 : Sample(s) were collected by ALS Technichem (HK) staff on 12 July, 2012.
Water sample(s) analysed and reported on an as received basis.
Temperature, Salinity, Dissolved Oxygen and Turbidity were measured on-site by ALS Technichem (HK) staff.
This report may not be reproduced except with prior written
approval from ALS Technichem (HK) Pty Ltd.
This document has been electronically signed by those names that appear on this report and are the authorised signatories.
Electronic signing has been carried out in compliance with procedures specified in the 'Electronic Transactions Ordinance'
of Hong Kong, Chapter 553, Section 6.Signatory Authorised results for:-Position
Fung Lim Chee, Richard InorganicsGeneral Manager
Fung Lim Chee, Richard SamplingGeneral Manager
11/F., Chung Shun Knitting Centre, 1-3 Wing Yip Street, Kwai Chung, N.T., Hong Kong
Tel: +852 2610 1044 Fax: +852 2610 2021 www.alsenviro.com

Client : ATKINS CHINA LTD
2 of 5 Page Number :
Work Order HK1218383
Analytical Results
EP025-SAMP:
Dissolved Oxygen
EA045-SAMP:
Turbidity
EA020-SAMP: SalinityEA012-SAMP:
Temperature
Sub-Matrix: MARINE WATER Compound EA025: Suspended
Solids (SS)
0.1 mg/L1 NTU0.1 g/L0.1 °C2 mg/LLOR Unit
OS: On-Site MeasurementOS: On-Site MeasurementOS: On-Site MeasurementOS: On-Site MeasurementEA/ED: Physical and
Aggregate Properties
Client sample ID Client sampling date /
time
Laboratory sample
ID
3 29.5 20.6 2 10.1A1-S MID-EBB 12-JUL-2012 13:30 HK1218383-001
3 29.2 20.5 3 9.9A1-M MID-EBB 12-JUL-2012 13:30 HK1218383-002
6 28.4 24.1 5 8.3A1-B MID-EBB 12-JUL-2012 13:30 HK1218383-003
4 29.4 20.5 2 9.4A2-S MID-EBB 12-JUL-2012 13:20 HK1218383-004
4 29.0 21.1 2 8.8A2-M MID-EBB 12-JUL-2012 13:20 HK1218383-005
4 27.9 25.0 3 7.9A2-B MID-EBB 12-JUL-2012 13:20 HK1218383-006
3 29.4 20.5 2 9.3A3-S MID-EBB 12-JUL-2012 13:10 HK1218383-007
3 29.5 20.5 2 9.0A3-M MID-EBB 12-JUL-2012 13:10 HK1218383-008
3 29.0 20.8 2 8.6A3-B MID-EBB 12-JUL-2012 13:10 HK1218383-009
4 29.5 20.5 2 9.9A4-S MID-EBB 12-JUL-2012 13:00 HK1218383-010
4 29.4 20.5 2 10.0A4-M MID-EBB 12-JUL-2012 13:00 HK1218383-011
3 29.2 20.7 2 10.1A4-B MID-EBB 12-JUL-2012 13:00 HK1218383-012
3 29.4 20.5 2 9.7A5-S MID-EBB 12-JUL-2012 12:50 HK1218383-013
3 29.1 20.8 2 9.6A5-M MID-EBB 12-JUL-2012 12:50 HK1218383-014
4 28.7 21.7 3 8.2A5-B MID-EBB 12-JUL-2012 12:50 HK1218383-015
3 29.4 20.4 2 9.3A6-S MID-EBB 12-JUL-2012 12:40 HK1218383-016
2 29.0 20.6 2 8.6A6-M MID-EBB 12-JUL-2012 12:40 HK1218383-017
4 28.9 21.5 2 8.3A6-B MID-EBB 12-JUL-2012 12:40 HK1218383-018
3 29.8 21.0 2 9.7B1-S MID-EBB 12-JUL-2012 11:30 HK1218383-019
5 29.0 21.1 2 9.2B1-M MID-EBB 12-JUL-2012 11:30 HK1218383-020
3 27.4 26.3 2 8.2B1-B MID-EBB 12-JUL-2012 11:30 HK1218383-021
4 29.4 20.8 2 9.4B2-S MID-EBB 12-JUL-2012 11:40 HK1218383-022
3 29.0 21.1 2 8.5B2-M MID-EBB 12-JUL-2012 11:40 HK1218383-023
3 28.4 24.6 2 8.1B2-B MID-EBB 12-JUL-2012 11:40 HK1218383-024
4 29.4 20.5 2 9.4B3-S MID-EBB 12-JUL-2012 11:50 HK1218383-025
3 28.9 21.1 2 9.2B3-M MID-EBB 12-JUL-2012 11:50 HK1218383-026
4 27.9 25.3 3 7.8B3-B MID-EBB 12-JUL-2012 11:50 HK1218383-027
4 29.3 20.4 2 9.2B4-S MID-EBB 12-JUL-2012 12:00 HK1218383-028
3 28.7 21.5 2 8.7B4-M MID-EBB 12-JUL-2012 12:00 HK1218383-029
3 27.7 25.1 2 7.3B4-B MID-EBB 12-JUL-2012 12:00 HK1218383-030
4 29.4 20.4 4 9.3B5-S MID-EBB 12-JUL-2012 12:10 HK1218383-031
5 28.8 21.1 1 9.3B5-M MID-EBB 12-JUL-2012 12:10 HK1218383-032
3 27.8 25.8 2 7.5B5-B MID-EBB 12-JUL-2012 12:10 HK1218383-033
4 29.3 20.3 2 9.0B6-S MID-EBB 12-JUL-2012 12:20 HK1218383-034
3 29.1 20.6 3 8.7B6-M MID-EBB 12-JUL-2012 12:20 HK1218383-035

Client : ATKINS CHINA LTD
3 of 5 Page Number :
Work Order HK1218383
EP025-SAMP:
Dissolved Oxygen
EA045-SAMP:
Turbidity
EA020-SAMP: SalinityEA012-SAMP:
Temperature
Sub-Matrix: MARINE WATER Compound EA025: Suspended
Solids (SS)
0.1 mg/L1 NTU0.1 g/L0.1 °C2 mg/LLOR Unit
OS: On-Site MeasurementOS: On-Site MeasurementOS: On-Site MeasurementOS: On-Site MeasurementEA/ED: Physical and
Aggregate Properties
Client sample ID Client sampling date /
time
Laboratory sample
ID
4 28.0 25.1 6 8.0B6-B MID-EBB 12-JUL-2012 12:20 HK1218383-036
3 29.4 20.2 3 8.0CM MID-EBB 12-JUL-2012 12:30 HK1218383-037
5 29.5 20.4 4 8.1D1-M MID-EBB 12-JUL-2012 14:10 HK1218383-038
5 29.4 20.5 3 8.8D2-S MID-EBB 12-JUL-2012 14:00 HK1218383-039
5 29.4 20.6 4 7.7D2-B MID-EBB 12-JUL-2012 14:00 HK1218383-040
3 29.2 20.7 4 9.0D3-S MID-EBB 12-JUL-2012 13:40 HK1218383-041
3 28.9 21.1 4 8.1D3-B MID-EBB 12-JUL-2012 13:40 HK1218383-042
4 29.3 20.5 2 8.3D4-M MID-EBB 12-JUL-2012 13:50 HK1218383-043
5 28.8 20.5 4 8.0A1-S MID-FLOOD 12-JUL-2012 08:40 HK1218383-044
3 28.6 23.6 4 7.8A1-M MID-FLOOD 12-JUL-2012 08:40 HK1218383-045
2 26.8 28.5 5 5.9A1-B MID-FLOOD 12-JUL-2012 08:40 HK1218383-046
3 28.8 20.5 3 8.5A2-S MID-FLOOD 12-JUL-2012 08:30 HK1218383-047
3 28.8 20.6 3 8.2A2-M MID-FLOOD 12-JUL-2012 08:30 HK1218383-048
3 28.2 24.6 4 7.7A2-B MID-FLOOD 12-JUL-2012 08:30 HK1218383-049
3 28.8 20.4 3 8.4A3-S MID-FLOOD 12-JUL-2012 08:20 HK1218383-050
2 28.9 20.5 3 8.0A3-M MID-FLOOD 12-JUL-2012 08:20 HK1218383-051
3 28.6 24.3 3 7.9A3-B MID-FLOOD 12-JUL-2012 08:20 HK1218383-052
4 28.9 20.4 2 8.7A4-S MID-FLOOD 12-JUL-2012 08:10 HK1218383-053
5 28.9 20.5 2 8.6A4-M MID-FLOOD 12-JUL-2012 08:10 HK1218383-054
3 28.9 20.5 2 8.6A4-B MID-FLOOD 12-JUL-2012 08:10 HK1218383-055
4 28.9 20.3 3 8.5A5-S MID-FLOOD 12-JUL-2012 08:00 HK1218383-056
3 28.9 20.4 3 8.4A5-M MID-FLOOD 12-JUL-2012 08:00 HK1218383-057
5 28.9 20.5 4 8.0A5-B MID-FLOOD 12-JUL-2012 08:00 HK1218383-058
4 28.9 20.4 2 8.5A6-S MID-FLOOD 12-JUL-2012 07:50 HK1218383-059
4 28.9 20.4 3 8.1A6-M MID-FLOOD 12-JUL-2012 07:50 HK1218383-060
3 29.0 22.3 4 6.6A6-B MID-FLOOD 12-JUL-2012 07:50 HK1218383-061
4 28.8 20.7 22 8.4B1-S MID-FLOOD 12-JUL-2012 06:40 HK1218383-062
4 28.5 22.9 2 8.2B1-M MID-FLOOD 12-JUL-2012 06:40 HK1218383-063
4 25.2 31.4 3 3.2B1-B MID-FLOOD 12-JUL-2012 06:40 HK1218383-064
4 28.8 20.6 2 7.8B2-S MID-FLOOD 12-JUL-2012 06:50 HK1218383-065
4 28.5 26.0 3 7.7B2-M MID-FLOOD 12-JUL-2012 06:50 HK1218383-066
4 25.3 31.4 3 5.6B2-B MID-FLOOD 12-JUL-2012 06:50 HK1218383-067
3 28.7 20.5 3 8.5B3-S MID-FLOOD 12-JUL-2012 07:00 HK1218383-068
5 28.9 20.7 3 8.0B3-M MID-FLOOD 12-JUL-2012 07:00 HK1218383-069
4 26.1 29.1 3 5.4B3-B MID-FLOOD 12-JUL-2012 07:00 HK1218383-070

Client : ATKINS CHINA LTD
4 of 5 Page Number :
Work Order HK1218383
EP025-SAMP:
Dissolved Oxygen
EA045-SAMP:
Turbidity
EA020-SAMP: SalinityEA012-SAMP:
Temperature
Sub-Matrix: MARINE WATER Compound EA025: Suspended
Solids (SS)
0.1 mg/L1 NTU0.1 g/L0.1 °C2 mg/LLOR Unit
OS: On-Site MeasurementOS: On-Site MeasurementOS: On-Site MeasurementOS: On-Site MeasurementEA/ED: Physical and
Aggregate Properties
Client sample ID Client sampling date /
time
Laboratory sample
ID
3 28.8 20.4 2 8.3B4-S MID-FLOOD 12-JUL-2012 07:10 HK1218383-071
4 29.0 20.8 3 7.4B4-M MID-FLOOD 12-JUL-2012 07:10 HK1218383-072
4 26.9 27.9 3 7.0B4-B MID-FLOOD 12-JUL-2012 07:10 HK1218383-073
4 28.6 20.6 2 8.2B5-S MID-FLOOD 12-JUL-2012 07:20 HK1218383-074
3 28.9 20.6 2 7.2B5-M MID-FLOOD 12-JUL-2012 07:20 HK1218383-075
3 27.2 27.4 3 6.9B5-B MID-FLOOD 12-JUL-2012 07:20 HK1218383-076
3 28.9 20.5 2 8.2B6-S MID-FLOOD 12-JUL-2012 07:30 HK1218383-077
2 28.9 20.5 3 7.7B6-M MID-FLOOD 12-JUL-2012 07:30 HK1218383-078
2 28.0 27.2 6 5.4B6-B MID-FLOOD 12-JUL-2012 07:30 HK1218383-079
2 28.7 20.3 2 7.4CM MID-FLOOD 12-JUL-2012 07:40 HK1218383-080
3 28.8 20.4 3 8.4D1-M MID-FLOOD 12-JUL-2012 09:20 HK1218383-081
4 28.8 20.4 2 8.4D2-S MID-FLOOD 12-JUL-2012 09:10 HK1218383-082
2 28.9 20.4 2 8.1D2-B MID-FLOOD 12-JUL-2012 09:10 HK1218383-083
2 28.8 20.5 3 8.4D3-S MID-FLOOD 12-JUL-2012 08:50 HK1218383-084
3 28.9 20.6 3 7.7D3-B MID-FLOOD 12-JUL-2012 08:50 HK1218383-085
3 28.8 20.5 2 7.7D4-M MID-FLOOD 12-JUL-2012 09:00 HK1218383-086
5 28.9 20.7 2 8.4B1-S-F FIELD DUPLICATE [12-JUL-2012] HK1218383-087
2 28.8 25.8 2 8.0B2-M-F FIELD DUPLICATE [12-JUL-2012] HK1218383-088
3 26.2 29.1 3 5.6B3-B-F FIELD DUPLICATE [12-JUL-2012] HK1218383-089
3 28.9 20.4 2 8.3B4-S-F FIELD DUPLICATE [12-JUL-2012] HK1218383-090
3 29.5 20.5 2 10.0A4-S-E FIELD DUPLICATE [12-JUL-2012] HK1218383-091
4 28.8 21.9 2 9.0A3-M-E FIELD DUPLICATE [12-JUL-2012] HK1218383-092
3 27.9 24.3 2 8.6A2-B-E FIELD DUPLICATE [12-JUL-2012] HK1218383-093
4 29.5 20.6 2 9.9A1-S-E FIELD DUPLICATE [12-JUL-2012] HK1218383-094

Client : ATKINS CHINA LTD
5 of 5 Page Number :
Work Order HK1218383
Laboratory Duplicate (DUP) Report
Matrix: WATER Laboratory Duplicate (DUP) Report
Original Result RPD (%)Laboratory sample ID Client sample ID Method: Compound CAS Number LOR Unit Duplicate Result
EA/ED: Physical and Aggregate Properties (QC Lot: 2412327)
EA025: Suspended Solids (SS) ---- 2 mg/L 3 3 0.0A1-S MID-EBBHK1218383-001
EA025: Suspended Solids (SS) ---- 2 mg/L 4 3 0.0A4-M MID-EBBHK1218383-011
EA/ED: Physical and Aggregate Properties (QC Lot: 2412328)
EA025: Suspended Solids (SS) ---- 2 mg/L 3 3 0.0B1-B MID-EBBHK1218383-021
EA025: Suspended Solids (SS) ---- 2 mg/L 4 5 0.0B5-S MID-EBBHK1218383-031
EA/ED: Physical and Aggregate Properties (QC Lot: 2412329)
EA025: Suspended Solids (SS) ---- 2 mg/L 3 3 0.0D3-S MID-EBBHK1218383-041
EA025: Suspended Solids (SS) ---- 2 mg/L 2 3 0.0A3-M MID-FLOODHK1218383-051
EA/ED: Physical and Aggregate Properties (QC Lot: 2412330)
EA025: Suspended Solids (SS) ---- 2 mg/L 3 4 34.4A6-B MID-FLOODHK1218383-061
EA025: Suspended Solids (SS) ---- 2 mg/L 3 4 35.9B4-S MID-FLOODHK1218383-071
EA/ED: Physical and Aggregate Properties (QC Lot: 2412331)
EA025: Suspended Solids (SS) ---- 2 mg/L 3 4 0.0D1-M MID-FLOODHK1218383-081
EA025: Suspended Solids (SS) ---- 2 mg/L 3 4 0.0A4-S-E FIELD DUPLICATEHK1218383-091
Method Blank (MB), Laboratory Control Spike (LCS) and Laboratory Control Spike Duplicate (DCS) Report
Matrix: WATER Method Blank (MB) Report Laboratory Control Spike (LCS) and Laboratory Control Spike Duplicate (DCS) Report
RPDs (%)Spike Spike Recovery (%) Recovery Limits (%)
Control LimitValueResult Concentration HighLowLCS DCSMethod: Compound CAS Number LOR Unit
EA/ED: Physical and Aggregate Properties (QCLot: 2412327)
2 mg/L----EA025: Suspended Solids (SS) <2 ----101 ----20 mg/L 11385 ----
EA/ED: Physical and Aggregate Properties (QCLot: 2412328)
2 mg/L----EA025: Suspended Solids (SS) <2 ----102 ----20 mg/L 11385 ----
EA/ED: Physical and Aggregate Properties (QCLot: 2412329)
2 mg/L----EA025: Suspended Solids (SS) <2 ----101 ----20 mg/L 11385 ----
EA/ED: Physical and Aggregate Properties (QCLot: 2412330)
2 mg/L----EA025: Suspended Solids (SS) <2 ----99.0 ----20 mg/L 11385 ----
EA/ED: Physical and Aggregate Properties (QCLot: 2412331)
2 mg/L----EA025: Suspended Solids (SS) <2 ----101 ----20 mg/L 11385 ----
Matrix Spike (MS) and Matrix Spike Duplicate (MSD) Report
l No Matrix Spike (MS) or Matrix Spike Duplicate (MSD) Results are required to be reported.

False
CERTIFICATE OF ANALYSIS
ATKINS CHINA LTD 1 of 5 Page :Laboratory :Client : ALS Technichem HK Pty Ltd
Contact :
Address :
Contact :
Address :5TH FLOOR,
WHARF T&T CENTRE,
HARBOUR CITY,
TSIM SHA TSUI HONG KONG
:MS ENID YUNG Chan Kwok Fai, Godfrey HK121838611/F., Chung Shun Knitting Centre, 1 - 3 Wing
Yip Street, Kwai Chung, N.T., Hong Kong
Work Order
E-mail : E-mail :[email protected] [email protected]
Telephone :
Facsimile :
Telephone :
Facsimile :
+852 2972 1802 +852 2610 1044
+852 2890 6343 +852 2610 2021
Date received :Project : QUOTATION OF WATER TEST - STANLEY Quote number : ---- 16-JUL-2012
Date of issue : 25-JUL-2012Order number : ----
No. of samples - 88Received :C-O-C number : ----
STANLEY BAYSite : Analysed : 88-
Report Comments
This report for ALS Technichem (HK) Pty Ltd work order reference HK1218386 supersedes any previous reports with this reference. The completion date of analysis is 23-JUL-2012. Results apply to
sample(s) as submitted. All pages of this report have been checked and approved for release. When date(s) and/or time(s) are shown bracketed, these have been assumed by the laboratory for
process purposes. Abbreviations: CAS number = Chemical Abstract Services number. LOR = Limit of reporting.
Specific comments for Work Order HK1218386 : Sample(s) were collected by ALS Technichem (HK) staff on 14 July, 2012.
Water sample(s) analysed and reported on an as received basis.
Temperature, Salinity, Dissolved Oxygen and Turbidity were measured on-site by ALS Technichem (HK) staff.
This report may not be reproduced except with prior written
approval from ALS Technichem (HK) Pty Ltd.
This document has been electronically signed by those names that appear on this report and are the authorised signatories.
Electronic signing has been carried out in compliance with procedures specified in the 'Electronic Transactions Ordinance'
of Hong Kong, Chapter 553, Section 6.Signatory Authorised results for:-Position
Fung Lim Chee, Richard InorganicsGeneral Manager
Fung Lim Chee, Richard SamplingGeneral Manager
11/F., Chung Shun Knitting Centre, 1-3 Wing Yip Street, Kwai Chung, N.T., Hong Kong
Tel: +852 2610 1044 Fax: +852 2610 2021 www.alsenviro.com

Client : ATKINS CHINA LTD
2 of 5 Page Number :
Work Order HK1218386
Analytical Results
EP025-SAMP:
Dissolved Oxygen
EA045-SAMP:
Turbidity
EA020-SAMP: SalinityEA012-SAMP:
Temperature
Sub-Matrix: MARINE WATER Compound EA025: Suspended
Solids (SS)
0.1 mg/L1 NTU0.1 g/L0.1 °C2 mg/LLOR Unit
OS: On-Site MeasurementOS: On-Site MeasurementOS: On-Site MeasurementOS: On-Site MeasurementEA/ED: Physical and
Aggregate Properties
Client sample ID Client sampling date /
time
Laboratory sample
ID
<2 29.6 20.1 1 9.0A1-S MID-EBB 14-JUL-2012 16:30 HK1218386-001
<2 29.4 20.3 1 8.9A1-M MID-EBB 14-JUL-2012 16:30 HK1218386-002
<2 26.8 27.5 3 4.2A1-B MID-EBB 14-JUL-2012 16:30 HK1218386-003
<2 30.1 19.9 1 8.5A2-S MID-EBB 14-JUL-2012 16:20 HK1218386-004
2 29.5 20.5 1 8.8A2-M MID-EBB 14-JUL-2012 16:20 HK1218386-005
<2 28.9 21.6 6 8.2A2-B MID-EBB 14-JUL-2012 16:20 HK1218386-006
<2 30.1 19.8 1 8.6A3-S MID-EBB 14-JUL-2012 16:10 HK1218386-007
<2 29.6 20.2 2 8.9A3-M MID-EBB 14-JUL-2012 16:10 HK1218386-008
4 26.6 27.7 4 5.5A3-B MID-EBB 14-JUL-2012 16:10 HK1218386-009
<2 30.1 19.7 1 8.6A4-S MID-EBB 14-JUL-2012 16:00 HK1218386-010
<2 29.8 19.9 2 8.8A4-M MID-EBB 14-JUL-2012 16:00 HK1218386-011
<2 29.4 20.5 2 9.0A4-B MID-EBB 14-JUL-2012 16:00 HK1218386-012
<2 30.3 19.6 2 8.5A5-S MID-EBB 14-JUL-2012 15:50 HK1218386-013
<2 29.8 19.9 2 8.8A5-M MID-EBB 14-JUL-2012 15:50 HK1218386-014
7 29.4 20.6 2 8.8A5-B MID-EBB 14-JUL-2012 15:50 HK1218386-015
<2 30.2 19.6 1 8.4A6-S MID-EBB 14-JUL-2012 15:40 HK1218386-016
4 29.8 19.7 1 8.7A6-M MID-EBB 14-JUL-2012 15:40 HK1218386-017
2 29.1 21.0 2 8.6A6-B MID-EBB 14-JUL-2012 15:40 HK1218386-018
3 29.6 19.7 1 9.0B1-S MID-EBB 14-JUL-2012 14:50 HK1218386-019
2 29.0 21.3 2 8.3B1-M MID-EBB 14-JUL-2012 14:50 HK1218386-020
3 26.2 28.3 4 3.6B1-B MID-EBB 14-JUL-2012 14:50 HK1218386-021
2 29.7 19.8 5 8.8B4-S MID-EBB 14-JUL-2012 15:00 HK1218386-028
3 29.6 20.2 2 8.8B4-M MID-EBB 14-JUL-2012 15:00 HK1218386-029
<2 27.0 27.5 4 4.2B4-B MID-EBB 14-JUL-2012 15:00 HK1218386-030
4 29.9 20.0 1 8.6B5-S MID-EBB 14-JUL-2012 15:10 HK1218386-031
3 29.0 21.6 3 8.2B5-M MID-EBB 14-JUL-2012 15:10 HK1218386-032
8 25.4 31.2 7 2.3B5-B MID-EBB 14-JUL-2012 15:10 HK1218386-033
<2 29.7 20.1 2 8.8B6-S MID-EBB 14-JUL-2012 15:20 HK1218386-034
4 29.2 21.0 2 8.6B6-M MID-EBB 14-JUL-2012 15:20 HK1218386-035
<2 25.7 30.8 7 3.1B6-B MID-EBB 14-JUL-2012 15:20 HK1218386-036
4 30.5 19.7 2 7.7CM MID-EBB 14-JUL-2012 15:30 HK1218386-037
2 30.4 19.5 3 7.6D1-M MID-EBB 14-JUL-2012 17:10 HK1218386-038
2 30.2 19.7 2 8.1D2-S MID-EBB 14-JUL-2012 17:00 HK1218386-039
10 29.2 20.9 7 8.4D2-B MID-EBB 14-JUL-2012 17:00 HK1218386-040
2 30.2 19.7 2 8.1D3-S MID-EBB 14-JUL-2012 16:40 HK1218386-041

Client : ATKINS CHINA LTD
3 of 5 Page Number :
Work Order HK1218386
EP025-SAMP:
Dissolved Oxygen
EA045-SAMP:
Turbidity
EA020-SAMP: SalinityEA012-SAMP:
Temperature
Sub-Matrix: MARINE WATER Compound EA025: Suspended
Solids (SS)
0.1 mg/L1 NTU0.1 g/L0.1 °C2 mg/LLOR Unit
OS: On-Site MeasurementOS: On-Site MeasurementOS: On-Site MeasurementOS: On-Site MeasurementEA/ED: Physical and
Aggregate Properties
Client sample ID Client sampling date /
time
Laboratory sample
ID
4 29.4 20.5 2 8.6D3-B MID-EBB 14-JUL-2012 16:40 HK1218386-042
3 30.5 19.7 2 7.8D4-M MID-EBB 14-JUL-2012 16:50 HK1218386-043
3 29.3 19.9 1 8.4A1-S MID-FLOOD 14-JUL-2012 10:30 HK1218386-044
<2 29.0 20.5 2 8.6A1-M MID-FLOOD 14-JUL-2012 10:30 HK1218386-045
2 26.3 28.6 5 4.5A1-B MID-FLOOD 14-JUL-2012 10:30 HK1218386-046
3 29.4 19.9 1 8.4A2-S MID-FLOOD 14-JUL-2012 10:20 HK1218386-047
3 29.2 20.1 1 8.7A2-M MID-FLOOD 14-JUL-2012 10:20 HK1218386-048
4 27.5 24.5 6 5.5A2-B MID-FLOOD 14-JUL-2012 10:20 HK1218386-049
2 29.3 19.9 1 8.4A3-S MID-FLOOD 14-JUL-2012 10:10 HK1218386-050
6 29.2 19.9 1 8.6A3-M MID-FLOOD 14-JUL-2012 10:10 HK1218386-051
<2 28.5 21.7 6 6.7A3-B MID-FLOOD 14-JUL-2012 10:10 HK1218386-052
<2 29.4 19.7 2 8.4A4-S MID-FLOOD 14-JUL-2012 10:00 HK1218386-053
<2 29.4 19.8 2 8.4A4-M MID-FLOOD 14-JUL-2012 10:00 HK1218386-054
<2 28.9 21.1 2 7.8A4-B MID-FLOOD 14-JUL-2012 10:00 HK1218386-055
3 29.4 19.7 2 8.4A5-S MID-FLOOD 14-JUL-2012 09:50 HK1218386-056
<2 29.3 19.7 1 8.5A5-M MID-FLOOD 14-JUL-2012 09:50 HK1218386-057
3 29.0 21.0 3 7.2A5-B MID-FLOOD 14-JUL-2012 09:50 HK1218386-058
<2 29.3 19.7 1 8.4A6-S MID-FLOOD 14-JUL-2012 09:40 HK1218386-059
3 29.3 19.7 1 8.5A6-M MID-FLOOD 14-JUL-2012 09:40 HK1218386-060
5 29.0 20.9 2 7.7A6-B MID-FLOOD 14-JUL-2012 09:40 HK1218386-061
5 29.2 19.8 1 8.4B1-S MID-FLOOD 14-JUL-2012 08:30 HK1218386-062
5 27.3 26.1 3 4.7B1-M MID-FLOOD 14-JUL-2012 08:30 HK1218386-063
6 25.2 30.9 6 2.3B1-B MID-FLOOD 14-JUL-2012 08:30 HK1218386-064
2 29.2 19.8 3 8.2B2-S MID-FLOOD 14-JUL-2012 08:40 HK1218386-065
3 28.5 22.5 3 6.5B2-M MID-FLOOD 14-JUL-2012 08:40 HK1218386-066
11 25.0 31.4 6 3.3B2-B MID-FLOOD 14-JUL-2012 08:40 HK1218386-067
6 29.2 19.9 2 8.4B3-S MID-FLOOD 14-JUL-2012 08:50 HK1218386-068
4 28.6 21.4 3 6.4B3-M MID-FLOOD 14-JUL-2012 08:50 HK1218386-069
7 24.5 32.1 6 2.8B3-B MID-FLOOD 14-JUL-2012 08:50 HK1218386-070
3 29.2 20.0 1 8.5B4-S MID-FLOOD 14-JUL-2012 09:00 HK1218386-071
3 28.9 20.9 2 8.0B4-M MID-FLOOD 14-JUL-2012 09:00 HK1218386-072
6 25.0 31.4 4 2.8B4-B MID-FLOOD 14-JUL-2012 09:00 HK1218386-073
2 29.2 19.9 1 8.5B5-S MID-FLOOD 14-JUL-2012 09:10 HK1218386-074
6 28.6 21.9 2 7.4B5-M MID-FLOOD 14-JUL-2012 09:10 HK1218386-075
3 26.3 28.4 6 3.6B5-B MID-FLOOD 14-JUL-2012 09:10 HK1218386-076

Client : ATKINS CHINA LTD
4 of 5 Page Number :
Work Order HK1218386
EP025-SAMP:
Dissolved Oxygen
EA045-SAMP:
Turbidity
EA020-SAMP: SalinityEA012-SAMP:
Temperature
Sub-Matrix: MARINE WATER Compound EA025: Suspended
Solids (SS)
0.1 mg/L1 NTU0.1 g/L0.1 °C2 mg/LLOR Unit
OS: On-Site MeasurementOS: On-Site MeasurementOS: On-Site MeasurementOS: On-Site MeasurementEA/ED: Physical and
Aggregate Properties
Client sample ID Client sampling date /
time
Laboratory sample
ID
3 29.3 19.9 1 8.5B6-S MID-FLOOD 14-JUL-2012 09:20 HK1218386-077
4 28.9 20.9 2 8.0B6-M MID-FLOOD 14-JUL-2012 09:20 HK1218386-078
4 26.7 27.5 7 4.0B6-B MID-FLOOD 14-JUL-2012 09:20 HK1218386-079
6 29.4 19.5 2 7.7CM MID-FLOOD 14-JUL-2012 09:30 HK1218386-080
4 29.5 19.4 2 7.6D1-M MID-FLOOD 14-JUL-2012 11:10 HK1218386-081
6 29.5 19.4 2 7.6D2-S MID-FLOOD 14-JUL-2012 11:00 HK1218386-082
5 29.2 20.0 2 8.3D2-B MID-FLOOD 14-JUL-2012 11:00 HK1218386-083
6 29.5 19.6 2 8.2D3-S MID-FLOOD 14-JUL-2012 10:40 HK1218386-084
4 29.2 20.1 2 8.7D3-B MID-FLOOD 14-JUL-2012 10:40 HK1218386-085
5 29.4 19.7 2 8.2D4-M MID-FLOOD 14-JUL-2012 10:50 HK1218386-086
4 29.2 19.8 1 8.4B1-S-F FIELD DUPLICATE [14-JUL-2012] HK1218386-087
4 28.5 22.5 3 6.5B2-M-F FIELD DUPLICATE [14-JUL-2012] HK1218386-088
8 24.5 32.1 6 2.8B3-B-F FIELD DUPLICATE [14-JUL-2012] HK1218386-089
2 29.2 20.0 1 8.5B4-S-F FIELD DUPLICATE [14-JUL-2012] HK1218386-090
2 30.1 19.7 2 8.6A4-S-E FIELD DUPLICATE [14-JUL-2012] HK1218386-091
2 29.6 20.2 2 8.9A3-M-E FIELD DUPLICATE [14-JUL-2012] HK1218386-092
4 28.6 21.6 6 8.2A2-B-E FIELD DUPLICATE [14-JUL-2012] HK1218386-093
3 29.6 20.1 1 9.0A1-S-E FIELD DUPLICATE [14-JUL-2012] HK1218386-094
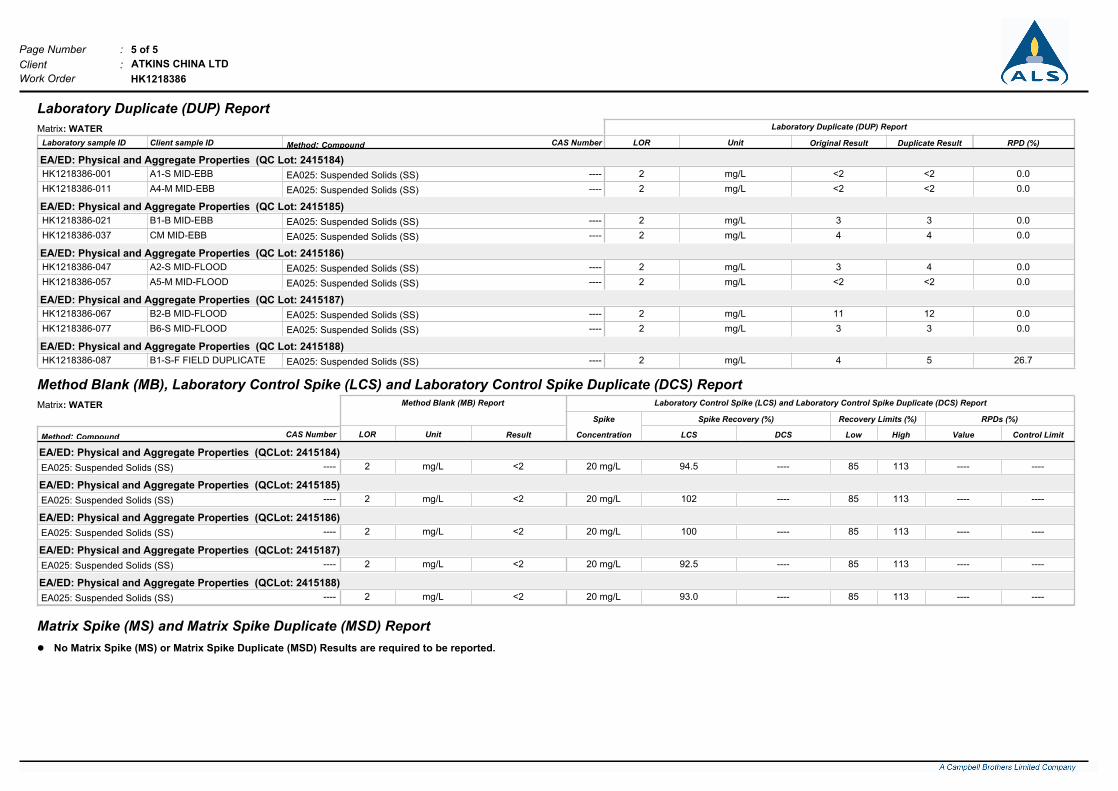
Client : ATKINS CHINA LTD
5 of 5 Page Number :
Work Order HK1218386
Laboratory Duplicate (DUP) Report
Matrix: WATER Laboratory Duplicate (DUP) Report
Original Result RPD (%)Laboratory sample ID Client sample ID Method: Compound CAS Number LOR Unit Duplicate Result
EA/ED: Physical and Aggregate Properties (QC Lot: 2415184)
EA025: Suspended Solids (SS) ---- 2 mg/L <2 <2 0.0A1-S MID-EBBHK1218386-001
EA025: Suspended Solids (SS) ---- 2 mg/L <2 <2 0.0A4-M MID-EBBHK1218386-011
EA/ED: Physical and Aggregate Properties (QC Lot: 2415185)
EA025: Suspended Solids (SS) ---- 2 mg/L 3 3 0.0B1-B MID-EBBHK1218386-021
EA025: Suspended Solids (SS) ---- 2 mg/L 4 4 0.0CM MID-EBBHK1218386-037
EA/ED: Physical and Aggregate Properties (QC Lot: 2415186)
EA025: Suspended Solids (SS) ---- 2 mg/L 3 4 0.0A2-S MID-FLOODHK1218386-047
EA025: Suspended Solids (SS) ---- 2 mg/L <2 <2 0.0A5-M MID-FLOODHK1218386-057
EA/ED: Physical and Aggregate Properties (QC Lot: 2415187)
EA025: Suspended Solids (SS) ---- 2 mg/L 11 12 0.0B2-B MID-FLOODHK1218386-067
EA025: Suspended Solids (SS) ---- 2 mg/L 3 3 0.0B6-S MID-FLOODHK1218386-077
EA/ED: Physical and Aggregate Properties (QC Lot: 2415188)
EA025: Suspended Solids (SS) ---- 2 mg/L 4 5 26.7B1-S-F FIELD DUPLICATEHK1218386-087
Method Blank (MB), Laboratory Control Spike (LCS) and Laboratory Control Spike Duplicate (DCS) Report
Matrix: WATER Method Blank (MB) Report Laboratory Control Spike (LCS) and Laboratory Control Spike Duplicate (DCS) Report
RPDs (%)Spike Spike Recovery (%) Recovery Limits (%)
Control LimitValueResult Concentration HighLowLCS DCSMethod: Compound CAS Number LOR Unit
EA/ED: Physical and Aggregate Properties (QCLot: 2415184)
2 mg/L----EA025: Suspended Solids (SS) <2 ----94.5 ----20 mg/L 11385 ----
EA/ED: Physical and Aggregate Properties (QCLot: 2415185)
2 mg/L----EA025: Suspended Solids (SS) <2 ----102 ----20 mg/L 11385 ----
EA/ED: Physical and Aggregate Properties (QCLot: 2415186)
2 mg/L----EA025: Suspended Solids (SS) <2 ----100 ----20 mg/L 11385 ----
EA/ED: Physical and Aggregate Properties (QCLot: 2415187)
2 mg/L----EA025: Suspended Solids (SS) <2 ----92.5 ----20 mg/L 11385 ----
EA/ED: Physical and Aggregate Properties (QCLot: 2415188)
2 mg/L----EA025: Suspended Solids (SS) <2 ----93.0 ----20 mg/L 11385 ----
Matrix Spike (MS) and Matrix Spike Duplicate (MSD) Report
l No Matrix Spike (MS) or Matrix Spike Duplicate (MSD) Results are required to be reported.

Project Name: Stanley Bay marine water monitoring
Date of Monitoring: __________________________ Weather : Fine Tide: Ebb Sea Condition: Calm
Monitoring Equipment
YSI Sonde 6920 V2
30.1 21.2 8.4 124.2 1.8
29.2 22.1 8.2 121.3 2.4
30.0 21.2 8.7 129.6 1.5
29.6 21.5 8.2 121.8 1.8
30.2 21.0 8.3 122.8 1.8
8.4 124.8 2.0
30.2 20.8 8.5 126.8 1.3
30.2 21.1
11:00 5.3
4.3
D4 11:10 2.6 1.3
1.0
Monitoring
Location
Time Water Depth
(m)
Sampling Depth
(m)Temperature (oC)
10:50 5.1
17/07/2012
Equipment No.
Salinity (ppt)
1.1C 10:30 2.2
D1 1.2
D3
1.0
DO (mg/L)
10:40 2.4
D2
4.1
DOS (%) Turbidity (NTU)

Project Name: Stanley Bay marine water monitoring
Date of Monitoring: __________________________ Weather : Fine Tide: Flood Sea Condition: Calm
Monitoring Equipment
YSI Sonde 6920 V2
17/07/2012
Equipment No.
Monitoring
Location
Time Water Depth
(m)
Sampling Depth
(m)Temperature (oC) Salinity (ppt) DO (mg/L) DOS (%) Turbidity (NTU)
C 18:00 2.4 1.2 30.4 21.2 9.4 141.0 1.7
D1 18:10 2.5 1.3 30.3 21.5 9.4 140.6 2.4
D2 18:20 5.2
1.0 30.2 21.5 10.2 152.3 1.6
4.2 29.3 22.1 9.5 139.8 2.0
D3 18:30 5.4
1.0 30.2 21.5
4.4 29.5 21.9
9.7 145.4 2.1
2.0
9.7 144.1 1.9
D4 18:40 2.5 1.3 30.4 21.4 9.6 144.4
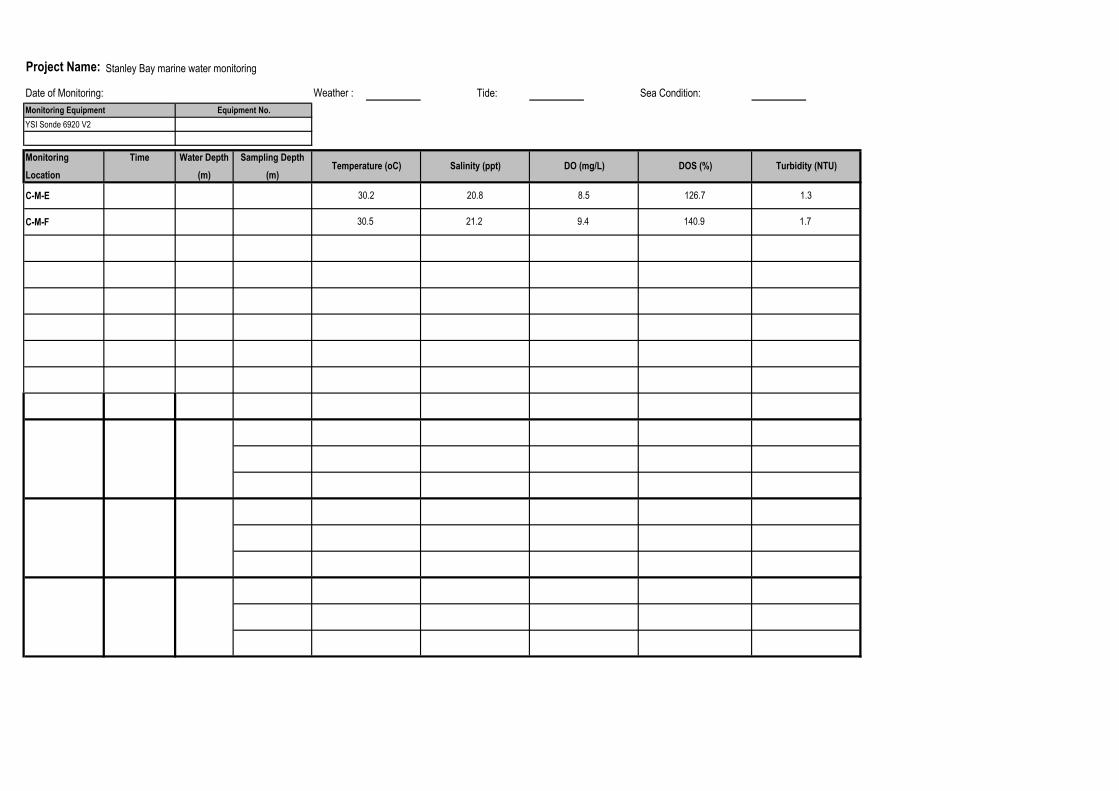
Project Name: Stanley Bay marine water monitoring
Date of Monitoring: __________________________ Weather : Tide: Sea Condition:
Monitoring Equipment
YSI Sonde 6920 V2
C-M-E
C-M-F
Equipment No.
Monitoring
Location
Time Water Depth
(m)
Sampling Depth
(m)Temperature (oC) Salinity (ppt) DO (mg/L) DOS (%) Turbidity (NTU)
30.2 20.8 8.5 126.7 1.3
30.5 21.2 9.4 140.9 1.7

False
CERTIFICATE OF ANALYSIS
ATKINS CHINA LTD 1 of 3 Page :Laboratory :Client : ALS Technichem HK Pty Ltd
Contact :
Address :
Contact :
Address :5TH FLOOR,
WHARF T&T CENTRE,
HARBOUR CITY,
TSIM SHA TSUI HONG KONG
:MS ENID YUNG Chan Kwok Fai, Godfrey HK121779811/F., Chung Shun Knitting Centre, 1 - 3 Wing
Yip Street, Kwai Chung, N.T., Hong Kong
Work Order
E-mail : E-mail :[email protected] [email protected]
Telephone :
Facsimile :
Telephone :
Facsimile :
+852 2972 1802 +852 2610 1044
+852 2890 6343 +852 2610 2021
Date received :Project : QUOTATION OF WATER TEST - STANLEY Quote number : ---- 17-JUL-2012
Date of issue : 26-JUL-2012Order number : ----
No. of samples - 16Received :C-O-C number : ----
STANLEY BAYSite : Analysed : 16-
Report Comments
This report for ALS Technichem (HK) Pty Ltd work order reference HK1217798 supersedes any previous reports with this reference. The completion date of analysis is 26-JUL-2012. Results apply to
sample(s) as submitted. All pages of this report have been checked and approved for release. When date(s) and/or time(s) are shown bracketed, these have been assumed by the laboratory for
process purposes. Abbreviations: CAS number = Chemical Abstract Services number. LOR = Limit of reporting.
Specific comments for Work Order HK1217798 : Sample(s) were collected by ALS Technichem (HK) staff on 17 July, 2012.
Water sample(s) analysed and reported on an as received basis.
Temperature, Salinity, Dissolved Oxygen and Turbidity were measured on-site by ALS Technichem (HK) staff.
This report may not be reproduced except with prior written
approval from ALS Technichem (HK) Pty Ltd.
This document has been electronically signed by those names that appear on this report and are the authorised signatories.
Electronic signing has been carried out in compliance with procedures specified in the 'Electronic Transactions Ordinance'
of Hong Kong, Chapter 553, Section 6.Signatory Authorised results for:-Position
Fung Lim Chee, Richard InorganicsGeneral Manager
Fung Lim Chee, Richard SamplingGeneral Manager
11/F., Chung Shun Knitting Centre, 1-3 Wing Yip Street, Kwai Chung, N.T., Hong Kong
Tel: +852 2610 1044 Fax: +852 2610 2021 www.alsenviro.com

Client : ATKINS CHINA LTD
2 of 3 Page Number :
Work Order HK1217798
Analytical Results
EP025-SAMP:
Dissolved Oxygen
EA045-SAMP:
Turbidity
EA020-SAMP: SalinityEA012-SAMP:
Temperature
Sub-Matrix: MARINE WATER Compound EA025: Suspended
Solids (SS)
0.1 mg/L1 NTU0.1 g/L0.1 °C2 mg/LLOR Unit
OS: On-Site MeasurementOS: On-Site MeasurementOS: On-Site MeasurementOS: On-Site MeasurementEA/ED: Physical and
Aggregate Properties
Client sample ID Client sampling date /
time
Laboratory sample
ID
5 30.2 21.1 2 8.4D1-M MID-EBB 17-JUL-2012 10:40 HK1217798-001
4 30.2 21.0 2 8.3D2-S MID-EBB 17-JUL-2012 10:50 HK1217798-002
3 29.6 21.5 2 8.2D2-B MID-EBB 17-JUL-2012 10:50 HK1217798-003
4 30.0 21.2 2 8.7D3-S MID-EBB 17-JUL-2012 11:00 HK1217798-004
4 29.2 22.1 2 8.2D3-B MID-EBB 17-JUL-2012 11:00 HK1217798-005
5 30.1 21.2 2 8.4D4-M MID-EBB 17-JUL-2012 11:10 HK1217798-006
4 30.3 21.5 2 9.4D1-M MID-FLOOD 17-JUL-2012 18:10 HK1217798-007
5 30.2 21.5 2 10.2D2-S MID-FLOOD 17-JUL-2012 18:20 HK1217798-008
4 29.3 22.1 2 9.5D2-B MID-FLOOD 17-JUL-2012 18:20 HK1217798-009
5 30.2 21.5 2 9.7D3-S MID-FLOOD 17-JUL-2012 18:30 HK1217798-010
5 29.5 21.9 2 9.7D3-B MID-FLOOD 17-JUL-2012 18:30 HK1217798-011
5 30.4 21.4 2 9.6D4-M MID-FLOOD 17-JUL-2012 18:40 HK1217798-012
4 30.2 20.8 1 8.5C-M-E 17-JUL-2012 10:30 HK1217798-013
5 30.4 21.2 2 9.4C-M-F 17-JUL-2012 18:00 HK1217798-014
4 30.2 20.8 1 8.5C-M-E FIELD DUPLICATE [17-JUL-2012] HK1217798-015
3 30.5 21.2 2 9.4C-M-F FIELD DUPLICATE [17-JUL-2012] HK1217798-016

Client : ATKINS CHINA LTD
3 of 3 Page Number :
Work Order HK1217798
Laboratory Duplicate (DUP) Report
Matrix: WATER Laboratory Duplicate (DUP) Report
Original Result RPD (%)Laboratory sample ID Client sample ID Method: Compound CAS Number LOR Unit Duplicate Result
EA/ED: Physical and Aggregate Properties (QC Lot: 2421140)
EA025: Suspended Solids (SS) ---- 2 mg/L 5 4 0.0D1-M MID-EBBHK1217798-001
EA025: Suspended Solids (SS) ---- 2 mg/L 5 6 25.5D3-B MID-FLOODHK1217798-011
Method Blank (MB), Laboratory Control Spike (LCS) and Laboratory Control Spike Duplicate (DCS) Report
Matrix: WATER Method Blank (MB) Report Laboratory Control Spike (LCS) and Laboratory Control Spike Duplicate (DCS) Report
RPDs (%)Spike Spike Recovery (%) Recovery Limits (%)
Control LimitValueResult Concentration HighLowLCS DCSMethod: Compound CAS Number LOR Unit
EA/ED: Physical and Aggregate Properties (QCLot: 2421140)
2 mg/L----EA025: Suspended Solids (SS) <2 ----101 ----20 mg/L 11385 ----
Matrix Spike (MS) and Matrix Spike Duplicate (MSD) Report
l No Matrix Spike (MS) or Matrix Spike Duplicate (MSD) Results are required to be reported.

Project Name: Stanley Bay marine water monitoring
Date of Monitoring: __________________________ Weather : Sunny Tide: Ebb Sea Condition: Calm
Monitoring Equipment
YSI Sonde 6920 V2
27.2 27.1 6.2 91.2 1.8
25.4 30.2 3.0 44.1 1.9
28.6 25.3 7.0 103.5 1.6
24.7 31.4 2.7 38.2 2.6
29.3 24.9 7.0 105.3 1.5
4.8 70.4 1.9
29.7 23.1 7.8 116.2 1.0
26.6 28.2
13:10 5.1
4.1
D4 12:40 2.6 1.3
1.0
Monitoring
Location
Time Water Depth
(m)
Sampling Depth
(m)Temperature (oC)
13:00 5.2
19/07/2012
Equipment No.
Salinity (ppt)
1.2C 12:30 2.3
D1 1.2
D3
1.0
DO (mg/L)
12:50 2.4
D2
4.2
DOS (%) Turbidity (NTU)

Project Name: Stanley Bay marine water monitoring
Date of Monitoring: __________________________ Weather : Sunny Tide: Ebb Sea Condition: Calm
Monitoring Equipment
YSI Sonde 6920 V2
19/07/2012
Equipment No.
Monitoring
Location
Time Water Depth
(m)
Sampling Depth
(m)Temperature (oC) Salinity (ppt) DO (mg/L) DOS (%) Turbidity (NTU)
C 19:00 2.4 1.2 30.1 23.7 9.1 137.7 1.3
D1 19:20 2.3 1.2 28.9 25.3 8.5 126.6 2.1
D2 19:30 5.1
1.0 28.8 25.3 8.4 125.8 1.7
4.1 27.8 26.6 7.2 106.0 3.0
D3 19:40 5.6
1.0 28.8 25.3
4.6 27.7 26.8
8.4 124.4 3.1
1.7
7.4 109.5 1.5
D4 19:10 2.2 1.1 29.1 25.1 8.7 129.6

Project Name: Stanley Bay marine water monitoring
Date of Monitoring: __________________________ Weather : Tide: Sea Condition:
Monitoring Equipment
YSI Sonde 6920 V2
C-M-E
C-M-F
Equipment No.
Monitoring
Location
Time Water Depth
(m)
Sampling Depth
(m)Temperature (oC) Salinity (ppt) DO (mg/L) DOS (%) Turbidity (NTU)
28.2 25.4 7.1 104.7 1.2
30.1 23.8 9.1 137.2 1.3

False
CERTIFICATE OF ANALYSIS
ATKINS CHINA LTD 1 of 3 Page :Laboratory :Client : ALS Technichem HK Pty Ltd
Contact :
Address :
Contact :
Address :5TH FLOOR,
WHARF T&T CENTRE,
HARBOUR CITY,
TSIM SHA TSUI HONG KONG
:MS ENID YUNG Chan Kwok Fai, Godfrey HK121903711/F., Chung Shun Knitting Centre, 1 - 3 Wing
Yip Street, Kwai Chung, N.T., Hong Kong
Work Order
E-mail : E-mail :[email protected] [email protected]
Telephone :
Facsimile :
Telephone :
Facsimile :
+852 2972 1802 +852 2610 1044
+852 2890 6343 +852 2610 2021
Date received :Project : QUOTATION OF WATER TEST - STANLEY Quote number : ---- 19-JUL-2012
Date of issue : 30-JUL-2012Order number : ----
No. of samples - 16Received :C-O-C number : ----
STANLEY BAYSite : Analysed : 16-
Report Comments
This report for ALS Technichem (HK) Pty Ltd work order reference HK1219037 supersedes any previous reports with this reference. The completion date of analysis is 30-JUL-2012. Results apply to
sample(s) as submitted. All pages of this report have been checked and approved for release. When date(s) and/or time(s) are shown bracketed, these have been assumed by the laboratory for
process purposes. Abbreviations: CAS number = Chemical Abstract Services number. LOR = Limit of reporting.
Specific comments for Work Order HK1219037 : Sample(s) were collected by ALS Technichem (HK) staff on 19 July, 2012.
Water sample(s) analysed and reported on an as received basis.
Temperature, Salinity, Dissolved Oxygen and Turbidity were measured on-site by ALS Technichem (HK) staff.
This report may not be reproduced except with prior written
approval from ALS Technichem (HK) Pty Ltd.
This document has been electronically signed by those names that appear on this report and are the authorised signatories.
Electronic signing has been carried out in compliance with procedures specified in the 'Electronic Transactions Ordinance'
of Hong Kong, Chapter 553, Section 6.Signatory Authorised results for:-Position
Fung Lim Chee, Richard InorganicsGeneral Manager
Fung Lim Chee, Richard SamplingGeneral Manager
11/F., Chung Shun Knitting Centre, 1-3 Wing Yip Street, Kwai Chung, N.T., Hong Kong
Tel: +852 2610 1044 Fax: +852 2610 2021 www.alsenviro.com

Client : ATKINS CHINA LTD
2 of 3 Page Number :
Work Order HK1219037
Analytical Results
EP025-SAMP:
Dissolved Oxygen
EA045-SAMP:
Turbidity
EA020-SAMP: SalinityEA012-SAMP:
Temperature
Sub-Matrix: MARINE WATER Compound EA025: Suspended
Solids (SS)
0.1 mg/L1 NTU0.1 g/L0.1 °C2 mg/LLOR Unit
OS: On-Site MeasurementOS: On-Site MeasurementOS: On-Site MeasurementOS: On-Site MeasurementEA/ED: Physical and
Aggregate Properties
Client sample ID Client sampling date /
time
Laboratory sample
ID
2 29.7 23.1 1 7.8C-M MID-EBB 19-JUL-2012 12:30 HK1219037-001
2 26.6 28.2 2 4.8D1-M MID-EBB 19-JUL-2012 12:50 HK1219037-002
<2 29.3 24.9 2 7.0D2-S MID-EBB 19-JUL-2012 13:00 HK1219037-003
<2 24.7 31.4 3 2.7D2-B MID-EBB 19-JUL-2012 13:00 HK1219037-004
2 28.6 25.3 2 7.0D3-S MID-EBB 19-JUL-2012 13:10 HK1219037-005
2 25.4 30.2 2 3.0D3-B MID-EBB 19-JUL-2012 13:10 HK1219037-006
2 27.2 27.1 2 6.2D4-M MID-EBB 19-JUL-2012 12:40 HK1219037-007
2 30.1 23.7 1 9.1C-M MID-FLOOD 19-JUL-2012 19:00 HK1219037-008
4 28.9 25.3 2 8.5D1-M MID-FLOOD 19-JUL-2012 19:20 HK1219037-009
<2 28.8 25.3 2 8.4D2-S MID-FLOOD 19-JUL-2012 19:30 HK1219037-010
5 27.8 26.6 3 7.2D2-B MID-FLOOD 19-JUL-2012 19:30 HK1219037-011
4 28.8 25.3 3 8.4D3-S MID-FLOOD 19-JUL-2012 19:40 HK1219037-012
5 27.7 26.8 2 7.4D3-B MID-FLOOD 19-JUL-2012 19:40 HK1219037-013
<2 29.1 25.1 2 8.7D4-M MID-FLOOD 19-JUL-2012 19:10 HK1219037-014
3 30.1 23.8 1 9.1C-M-F FIELD DUPLICATE [19-JUL-2012] HK1219037-015
2 28.2 25.4 1 7.1C-M-E FIELD DUPLICATE [19-JUL-2012] HK1219037-016

Client : ATKINS CHINA LTD
3 of 3 Page Number :
Work Order HK1219037
Laboratory Duplicate (DUP) Report
Matrix: WATER Laboratory Duplicate (DUP) Report
Original Result RPD (%)Laboratory sample ID Client sample ID Method: Compound CAS Number LOR Unit Duplicate Result
EA/ED: Physical and Aggregate Properties (QC Lot: 2424848)
EA025: Suspended Solids (SS) ---- 2 mg/L 2 2 0.0C-M MID-EBBHK1219037-001
EA025: Suspended Solids (SS) ---- 2 mg/L 5 5 0.0D2-B MID-FLOODHK1219037-011
Method Blank (MB), Laboratory Control Spike (LCS) and Laboratory Control Spike Duplicate (DCS) Report
Matrix: WATER Method Blank (MB) Report Laboratory Control Spike (LCS) and Laboratory Control Spike Duplicate (DCS) Report
RPDs (%)Spike Spike Recovery (%) Recovery Limits (%)
Control LimitValueResult Concentration HighLowLCS DCSMethod: Compound CAS Number LOR Unit
EA/ED: Physical and Aggregate Properties (QCLot: 2424848)
2 mg/L----EA025: Suspended Solids (SS) <2 ----102 ----20 mg/L 11385 ----
Matrix Spike (MS) and Matrix Spike Duplicate (MSD) Report
l No Matrix Spike (MS) or Matrix Spike Duplicate (MSD) Results are required to be reported.

Project Name: Stanley Bay marine water monitoring
Date of Monitoring: __________________________ Weather : Sunny Tide: Flood Sea Condition: CalmMonitoring EquipmentYSI Sonde 6920 V2
28.8 27.5 7.8 117.0 1.0
28.8 27.6 7.7 116.0 1.0
28.8 27.4 7.5 113.1 2.5
28.8 27.8 7.7 116.1 1.0
28.8 27.5 7.5 113.5 0.9
7.8 118.2 0.8
28.9 27.9 7.9 119.7 1.0
28.8 27.5
06:45 4.5
3.5
D4 06:55 2.6 1.3
1.0
Monitoring
Location
Time Water Depth
(m)
Sampling Depth
(m)Temperature (oC)
06:35 5.1
01/09/2012
Equipment No.
Salinity (ppt)
1.4C 06:15 2.7
D1 1.3
D3
1.0
DO (mg/L)
06:25 2.6
D2
4.1
DOS (%) Turbidity (NTU)

Project Name: Stanley Bay marine water monitoring
Date of Monitoring: __________________________ Weather : Sunny Tide: Ebb Sea Condition: CalmMonitoring EquipmentYSI Sonde 6920 V2
01/09/2012
Equipment No.
Monitoring
Location
Time Water Depth
(m)
Sampling Depth
(m)Temperature (oC) Salinity (ppt) DO (mg/L) DOS (%) Turbidity (NTU)
C 12:30 2.6 1.3 28.9 27.7 7.7 116.8 1.8
D1 12:40 2.8 1.4 28.9 27.4 7.6 115.2 1.0
D2 12:50 5.3
1.0 28.8 27.5 7.7 115.5 1.1
4.3 28.8 27.5 7.8 118.1 1.3
D3 13:00 5.3
1.0 28.9 27.3
4.3 28.8 27.6
7.6 114.3 1.1
2.2
7.8 117.1 1.1
D4 13:05 2.6 1.3 28.8 27.5 7.5 112.7

Project Name: Stanley Bay marine water monitoring
Date of Monitoring: __________________________ Weather : Tide: Sea Condition:Monitoring EquipmentYSI Sonde 6920 V2
C-M-F
C-M-E
Equipment No.
Monitoring
Location
Time Water Depth
(m)
Sampling Depth
(m)Temperature (oC) Salinity (ppt) DO (mg/L) DOS (%) Turbidity (NTU)
middle 28.9
middle 28.9 27.7 7.9 119.6 1.2
28.0 8.0 120.5 0.8

False
CERTIFICATE OF ANALYSIS
ATKINS CHINA LTD 1 of 3 Page :Laboratory :Client : ALS Technichem HK Pty Ltd
Contact :
Address :
Contact :
Address :5TH FLOOR,
WHARF T&T CENTRE,
HARBOUR CITY,
TSIM SHA TSUI HONG KONG
:MS ENID YUNG Chan Kwok Fai, Godfrey HK122314311/F., Chung Shun Knitting Centre, 1 - 3 Wing
Yip Street, Kwai Chung, N.T., Hong Kong
Work Order
E-mail : E-mail :[email protected] [email protected]
Telephone :
Facsimile :
Telephone :
Facsimile :
+852 2972 1802 +852 2610 1044
+852 2890 6343 +852 2610 2021
Date received :Project : QUOTATION OF WATER TEST - STANLEY Quote number : ---- 01-SEP-2012
Date of issue : 11-SEP-2012Order number : ----
No. of samples - 16Received :C-O-C number : ----
STANLEY BAYSite : Analysed : 16-
Report Comments
This report for ALS Technichem (HK) Pty Ltd work order reference HK1223143 supersedes any previous reports with this reference. The completion date of analysis is 07-SEP-2012. Results apply to
sample(s) as submitted. All pages of this report have been checked and approved for release. When date(s) and/or time(s) are shown bracketed, these have been assumed by the laboratory for
process purposes. Abbreviations: CAS number = Chemical Abstract Services number. LOR = Limit of reporting.
Specific comments for Work Order HK1223143 : Water sample(s) analysed and reported on an as received basis.
Sample(s) were collected by ALS Technichem (HK) staff on 01 September, 2012
Temperature, Salinity, Dissolved Oxygen and Turbidity were measured on-site by ALS Technichem (HK) staff.
This report may not be reproduced except with prior written
approval from ALS Technichem (HK) Pty Ltd.
This document has been electronically signed by those names that appear on this report and are the authorised signatories.
Electronic signing has been carried out in compliance with procedures specified in the 'Electronic Transactions Ordinance'
of Hong Kong, Chapter 553, Section 6.Signatory Authorised results for:-Position
Fung Lim Chee, Richard InorganicsGeneral Manager
Fung Lim Chee, Richard SamplingGeneral Manager
11/F., Chung Shun Knitting Centre, 1-3 Wing Yip Street, Kwai Chung, N.T., Hong Kong
Tel: +852 2610 1044 Fax: +852 2610 2021 www.alsenviro.com

Client : ATKINS CHINA LTD
2 of 3 Page Number :
Work Order HK1223143
Analytical Results
EP025-SAMP:
Dissolved Oxygen
EA045-SAMP:
Turbidity
EA020-SAMP: SalinityEA012-SAMP:
Temperature
Sub-Matrix: MARINE WATER Compound EA025: Suspended
Solids (SS)
0.1 mg/L1 NTU0.1 g/L0.1 °C2 mg/LLOR Unit
OS: On-Site MeasurementOS: On-Site MeasurementOS: On-Site MeasurementOS: On-Site MeasurementEA/ED: Physical and
Aggregate Properties
Client sample ID Client sampling date /
time
Laboratory sample
ID
4 28.9 27.7 2 7.7C-M MID-EBB 01-SEP-2012 12:30 HK1223143-001
2 28.9 27.4 1 7.6D1-M MID-EBB 01-SEP-2012 12:40 HK1223143-002
2 28.8 27.5 1 7.7D2-S MID-EBB 01-SEP-2012 12:50 HK1223143-003
2 28.8 27.5 1 7.8D2-B MID-EBB 01-SEP-2012 12:50 HK1223143-004
4 28.9 27.3 1 7.6D3-S MID-EBB 01-SEP-2012 13:00 HK1223143-005
3 28.8 27.6 1 7.8D3-B MID-EBB 01-SEP-2012 13:00 HK1223143-006
4 28.8 27.5 2 7.5D4-M MID-EBB 01-SEP-2012 13:05 HK1223143-007
2 28.9 27.9 1 7.9C-M MID-FLOOD 01-SEP-2012 06:15 HK1223143-008
2 28.8 27.5 <1 7.8D1-M MID-FLOOD 01-SEP-2012 06:25 HK1223143-009
2 28.8 27.5 <1 7.5D2-S MID-FLOOD 01-SEP-2012 06:35 HK1223143-010
2 28.8 27.8 1 7.7D2-B MID-FLOOD 01-SEP-2012 06:35 HK1223143-011
5 28.8 27.4 2 7.5D3-S MID-FLOOD 01-SEP-2012 06:45 HK1223143-012
3 28.8 27.6 1 7.7D3-B MID-FLOOD 01-SEP-2012 06:45 HK1223143-013
5 28.8 27.5 1 7.8D4-M MID-FLOOD 01-SEP-2012 06:55 HK1223143-014
4 28.9 27.7 1 7.9C-M-MID-EBB FIELD
DUPLICATE
[01-SEP-2012] HK1223143-015
5 28.9 28.0 <1 8.0C-M-MID-FLOOD FIELD
DUPLICATE
[01-SEP-2012] HK1223143-016

Client : ATKINS CHINA LTD
3 of 3 Page Number :
Work Order HK1223143
Laboratory Duplicate (DUP) Report
Matrix: WATER Laboratory Duplicate (DUP) Report
Original Result RPD (%)Laboratory sample ID Client sample ID Method: Compound CAS Number LOR Unit Duplicate Result
EA/ED: Physical and Aggregate Properties (QC Lot: 2483444)
EA025: Suspended Solids (SS) ---- 2 mg/L 4 3 0.0C-M MID-EBBHK1223143-001
EA025: Suspended Solids (SS) ---- 2 mg/L 2 3 0.0D2-B MID-FLOODHK1223143-011
Method Blank (MB), Laboratory Control Spike (LCS) and Laboratory Control Spike Duplicate (DCS) Report
Matrix: WATER Method Blank (MB) Report Laboratory Control Spike (LCS) and Laboratory Control Spike Duplicate (DCS) Report
RPDs (%)Spike Spike Recovery (%) Recovery Limits (%)
Control LimitValueResult Concentration HighLowLCS DCSMethod: Compound CAS Number LOR Unit
EA/ED: Physical and Aggregate Properties (QCLot: 2483444)
2 mg/L----EA025: Suspended Solids (SS) <2 ----102 ----20 mg/L 11385 ----
Matrix Spike (MS) and Matrix Spike Duplicate (MSD) Report
l No Matrix Spike (MS) or Matrix Spike Duplicate (MSD) Results are required to be reported.

Project Name: Stanley Bay marine water monitoring
Date of Monitoring: __________________________ Weather : Cloudy Tide: Flood Sea Condition: Calm
Monitoring Equipment
YSI Sonde 6920 V2
DOS (%) Turbidity (NTU)
D3
1.0
DO (mg/L)
08:10 2.6
D2
4.3
C 08:00 2.5
D1 1.3
08:20 5.3
04/09/2012
Equipment No.
Salinity (ppt)
1.3
Monitoring
Location
Time Water Depth
(m)
Sampling Depth
(m)Temperature (oC)
5.3
4.3
D4 08:40 2.5 1.3
1.0
28.5 28.8
08:30
6.6 99.7 1.5
28.6 28.7 6.6 99.2 1.3
28.6 28.7 6.8 102.8 1.4
28.5 29.0 6.2 93.9 1.9
28.6 28.7 6.7 101.2 1.3
28.4 29.1 6.0 91.2 2.0
28.5 28.7 6.6 100.4 1.3

Project Name: Stanley Bay marine water monitoring
Date of Monitoring: __________________________ Weather : Cloudy Tide: Ebb Sea Condition: Calm
Monitoring Equipment
YSI Sonde 6920 V2
1.3 28.8 27.4 6.9 104.8 1.8
7.3 109.9 1.8
D4 14:40 2.5
7.6 114.9 1.4
D3 14:30 5.4
1.0 28.9 27.6
4.4 28.8 27.7
4.2 28.8 27.4 7.5 113.3 4.0
116.2 2.1
D2 14:20 5.2
1.0 28.7 27.5 7.7
1.3 28.6 27.5 7.6 114.5 2.2D1 14:10 2.6
1.2 28.5 27.4 7.5 113.2 1.2
Temperature (oC) Salinity (ppt) DO (mg/L) DOS (%) Turbidity (NTU)
C 14:00 2.4
04/09/2012
Equipment No.
Monitoring
Location
Time Water Depth
(m)
Sampling Depth
(m)
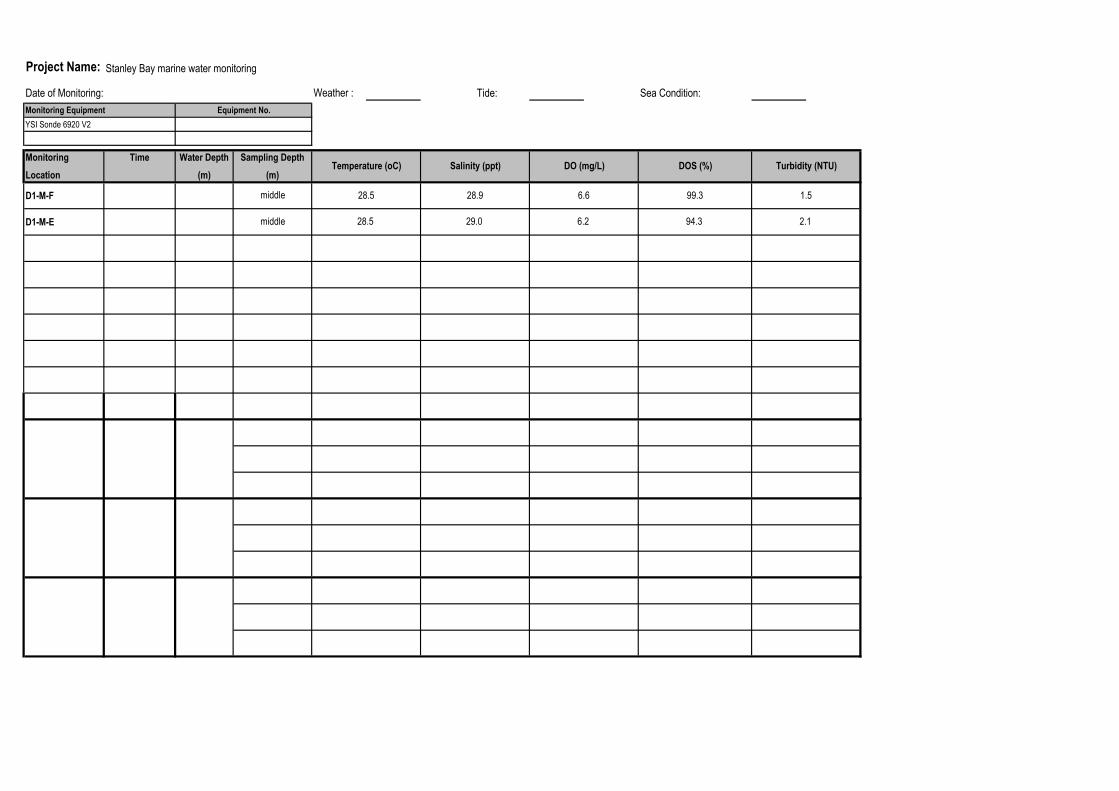
Project Name: Stanley Bay marine water monitoring
Date of Monitoring: __________________________ Weather : Tide: Sea Condition:
Monitoring Equipment
YSI Sonde 6920 V2
D1-M-F
D1-M-E
28.9 6.6 99.3 1.5
middle 28.5 29.0 6.2 94.3 2.1
Temperature (oC) Salinity (ppt) DO (mg/L) DOS (%) Turbidity (NTU)
middle 28.5
Equipment No.
Monitoring
Location
Time Water Depth
(m)
Sampling Depth
(m)

Project Name: Stanley Bay marine water monitoring
Date of Monitoring: __________________________ Weather : Sunny Tide: Flood Sea Condition: Calm
Monitoring Equipment
YSI Sonde 6920 V2
28.6 28.5 6.6 100.5 1.4
28.4 29.2 6.2 93.8 1.6
28.5 28.8 6.7 101.4 1.8
28.5 28.7 6.3 94.7 1.5
28.4 28.6 6.4 96.4 1.6
6.6 99.8 1.7
28.5 28.6 6.4 97.3 1.6
28.4 28.9
09:45 5.4
4.4
D4 09:55 2.2 1.1
1.0
Monitoring
Location
Time Water Depth
(m)
Sampling Depth
(m)Temperature (oC)
09:35 5.3
06/09/2012
Equipment No.
Salinity (ppt)
1.2C 09:15 2.4
D1 1.3
D3
1.0
DO (mg/L)
09:25 2.5
D2
4.3
DOS (%) Turbidity (NTU)

Project Name: Stanley Bay marine water monitoring
Date of Monitoring: __________________________ Weather : Sunny Tide: Ebb Sea Condition: Calm
Monitoring Equipment
YSI Sonde 6920 V2
06/09/2012
Equipment No.
Monitoring
Location
Time Water Depth
(m)
Sampling Depth
(m)Temperature (oC) Salinity (ppt) DO (mg/L) DOS (%) Turbidity (NTU)
C 15:00 2.4 1.2 28.6 27.9 7.6 114.0 1.6
D1 15:10 2.5 1.3 28.6 27.6 7.5 113.5 1.8
D2 15:20 5.4
1.0 28.7 27.6 7.7 116.2 2.5
4.4 28.5 27.3 6.7 100.1 3.5
D3 15:30 5.5
1.0 28.8 27.7
4.5 28.4 27.5
7.7 116.7 2.1
2.1
6.8 102.5 2.0
D4 15:40 2.5 1.3 28.7 27.6 7.8 117.2

Project Name: Stanley Bay marine water monitoring
Date of Monitoring: __________________________ Weather : Tide: Sea Condition:
Monitoring Equipment
YSI Sonde 6920 V2
D4-M-F
D4-M-E
Equipment No.
Monitoring
Location
Time Water Depth
(m)
Sampling Depth
(m)Temperature (oC) Salinity (ppt) DO (mg/L) DOS (%) Turbidity (NTU)
middle 28.5
middle 28.7 27.5 7.8 117.6 2.3
28.5 6.6 100.7 1.6

Project Name: Stanley Bay marine water monitoring
Date of Monitoring: __________________________ Weather : Sunny Tide: Flood Sea Condition: Moderate
Monitoring Equipment
YSI Sonde 6920 V2
DOS (%) Turbidity (NTU)
D3
1.0
DO (mg/L)
10:25 2.6
D2
4.3
C 10:15 2.6
D1 1.3
10:35 5.3
07/09/2012
Equipment No.
Salinity (ppt)
1.3
Monitoring
Location
Time Water Depth
(m)
Sampling Depth
(m)Temperature (oC)
5.2
4.2
D4 10:55 2.6 1.3
1.0
28.6 27.6
10:45
6.6 99.2 2.3
28.4 27.6 6.5 97.8 2.0
28.6 27.4 6.6 99.7 2.5
28.4 27.6 6.6 97.6 3.8
28.7 27.5 6.5 100.1 2.5
28.6 27.7 6.5 97.6 3.1
28.6 27.6 6.6 99.7 2.9

Project Name: Stanley Bay marine water monitoring
Date of Monitoring: __________________________ Weather : Sunny Tide: Ebb Sea Condition: Moderate
Monitoring Equipment
YSI Sonde 6920 V2
1.2 28.7 27.5 7.9 119.5 2.9
7.0 104.7 3.5
D4 16:10 2.4
8.0 120.1 3.2
D3 16:00 5.3
1.0 28.8 27.7
4.3 28.6 27.6
4.2 28.7 27.6 6.7 101.7 3.8
118.2 3.8
D2 15:50 5.2
1.0 28.7 27.7 7.8
1.4 28.7 27.9 7.7 116.7 3.0D1 15:40 2.8
1.3 28.6 27.9 7.6 113.8 2.8
Temperature (oC) Salinity (ppt) DO (mg/L) DOS (%) Turbidity (NTU)
C 15:30 2.6
07/09/2012
Equipment No.
Monitoring
Location
Time Water Depth
(m)
Sampling Depth
(m)

Project Name: Stanley Bay marine water monitoring
Date of Monitoring: __________________________ Weather : Tide: Sea Condition:
Monitoring Equipment
YSI Sonde 6920 V2
C-M-F
C-M-E
27.7 6.5 98.1 2.2
middle 28.5 27.9 7.6 114.1 2.7
Temperature (oC) Salinity (ppt) DO (mg/L) DOS (%) Turbidity (NTU)
middle 28.5
Equipment No.
Monitoring
Location
Time Water Depth
(m)
Sampling Depth
(m)
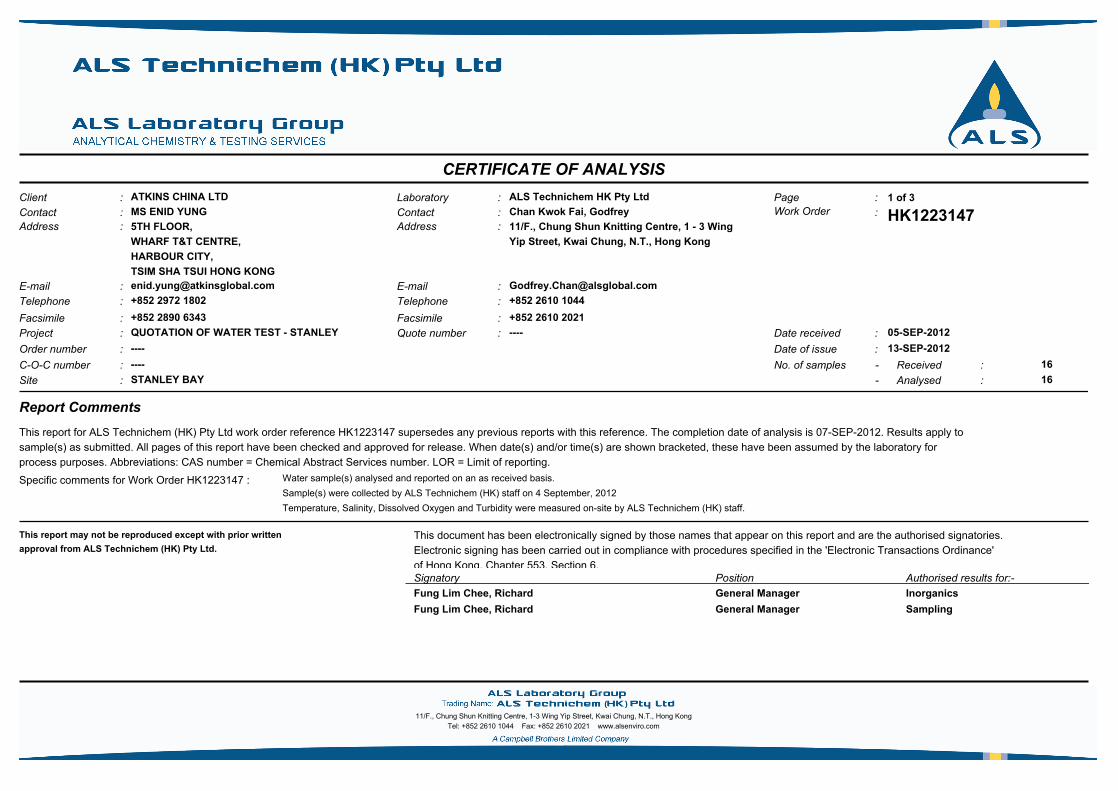
False
CERTIFICATE OF ANALYSIS
ATKINS CHINA LTD 1 of 3 Page :Laboratory :Client : ALS Technichem HK Pty Ltd
Contact :
Address :
Contact :
Address :5TH FLOOR,
WHARF T&T CENTRE,
HARBOUR CITY,
TSIM SHA TSUI HONG KONG
:MS ENID YUNG Chan Kwok Fai, Godfrey HK122314711/F., Chung Shun Knitting Centre, 1 - 3 Wing
Yip Street, Kwai Chung, N.T., Hong Kong
Work Order
E-mail : E-mail :[email protected] [email protected]
Telephone :
Facsimile :
Telephone :
Facsimile :
+852 2972 1802 +852 2610 1044
+852 2890 6343 +852 2610 2021
Date received :Project : QUOTATION OF WATER TEST - STANLEY Quote number : ---- 05-SEP-2012
Date of issue : 13-SEP-2012Order number : ----
No. of samples - 16Received :C-O-C number : ----
STANLEY BAYSite : Analysed : 16-
Report Comments
This report for ALS Technichem (HK) Pty Ltd work order reference HK1223147 supersedes any previous reports with this reference. The completion date of analysis is 07-SEP-2012. Results apply to
sample(s) as submitted. All pages of this report have been checked and approved for release. When date(s) and/or time(s) are shown bracketed, these have been assumed by the laboratory for
process purposes. Abbreviations: CAS number = Chemical Abstract Services number. LOR = Limit of reporting.
Specific comments for Work Order HK1223147 : Water sample(s) analysed and reported on an as received basis.
Sample(s) were collected by ALS Technichem (HK) staff on 4 September, 2012
Temperature, Salinity, Dissolved Oxygen and Turbidity were measured on-site by ALS Technichem (HK) staff.
This report may not be reproduced except with prior written
approval from ALS Technichem (HK) Pty Ltd.
This document has been electronically signed by those names that appear on this report and are the authorised signatories.
Electronic signing has been carried out in compliance with procedures specified in the 'Electronic Transactions Ordinance'
of Hong Kong, Chapter 553, Section 6.Signatory Authorised results for:-Position
Fung Lim Chee, Richard InorganicsGeneral Manager
Fung Lim Chee, Richard SamplingGeneral Manager
11/F., Chung Shun Knitting Centre, 1-3 Wing Yip Street, Kwai Chung, N.T., Hong Kong
Tel: +852 2610 1044 Fax: +852 2610 2021 www.alsenviro.com

Client : ATKINS CHINA LTD
2 of 3 Page Number :
Work Order HK1223147
Analytical Results
EP025-SAMP:
Dissolved Oxygen
EA045-SAMP:
Turbidity
EA020-SAMP: SalinityEA012-SAMP:
Temperature
Sub-Matrix: MARINE WATER Compound EA025: Suspended
Solids (SS)
0.1 mg/L1 NTU0.1 g/L0.1 °C2 mg/LLOR Unit
OS: On-Site MeasurementOS: On-Site MeasurementOS: On-Site MeasurementOS: On-Site MeasurementEA/ED: Physical and
Aggregate Properties
Client sample ID Client sampling date /
time
Laboratory sample
ID
4 28.5 27.4 1 7.5C-M MID-EBB 04-SEP-2012 14:00 HK1223147-001
2 28.6 27.5 2 7.6D1-M MID-EBB 04-SEP-2012 14:10 HK1223147-002
3 28.7 27.5 2 7.7D2-S MID-EBB 04-SEP-2012 14:20 HK1223147-003
4 28.8 27.4 4 7.5D2-B MID-EBB 04-SEP-2012 14:20 HK1223147-004
3 28.9 27.6 1 7.6D3-S MID-EBB 04-SEP-2012 14:30 HK1223147-005
2 28.8 27.7 2 7.3D3-B MID-EBB 04-SEP-2012 14:30 HK1223147-006
5 28.8 27.4 2 6.9D4-M MID-EBB 04-SEP-2012 14:40 HK1223147-007
4 28.6 28.7 1 6.6C-M MID-FLOOD 04-SEP-2012 08:00 HK1223147-008
3 28.5 28.8 2 6.6D1-M MID-FLOOD 04-SEP-2012 08:10 HK1223147-009
5 28.6 28.7 1 6.8D2-S MID-FLOOD 04-SEP-2012 08:20 HK1223147-010
3 28.5 29.0 2 6.2D2-B MID-FLOOD 04-SEP-2012 08:20 HK1223147-011
7 28.6 28.7 1 6.7D3-S MID-FLOOD 04-SEP-2012 08:30 HK1223147-012
5 28.4 29.1 2 6.0D3-B MID-FLOOD 04-SEP-2012 08:30 HK1223147-013
5 28.5 28.7 1 6.6D4-M MID-FLOOD 04-SEP-2012 08:40 HK1223147-014
4 28.5 29.0 2 6.2D1-M-E FIELD DUPLICATE [04-SEP-2012] HK1223147-015
4 28.5 28.9 2 6.6D1-M-F FIELD DUPLICATE [04-SEP-2012] HK1223147-016

Client : ATKINS CHINA LTD
3 of 3 Page Number :
Work Order HK1223147
Laboratory Duplicate (DUP) Report
Matrix: WATER Laboratory Duplicate (DUP) Report
Original Result RPD (%)Laboratory sample ID Client sample ID Method: Compound CAS Number LOR Unit Duplicate Result
EA/ED: Physical and Aggregate Properties (QC Lot: 2487801)
EA025: Suspended Solids (SS) ---- 2 mg/L 4 3 0.0C-M MID-EBBHK1223147-001
EA025: Suspended Solids (SS) ---- 2 mg/L 3 3 0.0D2-B MID-FLOODHK1223147-011
Method Blank (MB), Laboratory Control Spike (LCS) and Laboratory Control Spike Duplicate (DCS) Report
Matrix: WATER Method Blank (MB) Report Laboratory Control Spike (LCS) and Laboratory Control Spike Duplicate (DCS) Report
RPDs (%)Spike Spike Recovery (%) Recovery Limits (%)
Control LimitValueResult Concentration HighLowLCS DCSMethod: Compound CAS Number LOR Unit
EA/ED: Physical and Aggregate Properties (QCLot: 2487801)
2 mg/L----EA025: Suspended Solids (SS) <2 ----106 ----20 mg/L 11385 ----
Matrix Spike (MS) and Matrix Spike Duplicate (MSD) Report
l No Matrix Spike (MS) or Matrix Spike Duplicate (MSD) Results are required to be reported.

False
CERTIFICATE OF ANALYSIS
ATKINS CHINA LTD 1 of 3 Page :Laboratory :Client : ALS Technichem HK Pty Ltd
Contact :
Address :
Contact :
Address :5TH FLOOR,
WHARF T&T CENTRE,
HARBOUR CITY,
TSIM SHA TSUI HONG KONG
:MS ENID YUNG Chan Kwok Fai, Godfrey HK122322111/F., Chung Shun Knitting Centre, 1 - 3 Wing
Yip Street, Kwai Chung, N.T., Hong Kong
Work Order
E-mail : E-mail :[email protected] [email protected]
Telephone :
Facsimile :
Telephone :
Facsimile :
+852 2972 1802 +852 2610 1044
+852 2890 6343 +852 2610 2021
Date received :Project : QUOTATION OF WATER TEST - STANLEY Quote number : ---- 06-SEP-2012
Date of issue : 14-SEP-2012Order number : ----
No. of samples - 16Received :C-O-C number : ----
STANLEY BAYSite : Analysed : 16-
Report Comments
This report for ALS Technichem (HK) Pty Ltd work order reference HK1223221 supersedes any previous reports with this reference. The completion date of analysis is 13-SEP-2012. Results apply to
sample(s) as submitted. All pages of this report have been checked and approved for release. When date(s) and/or time(s) are shown bracketed, these have been assumed by the laboratory for
process purposes. Abbreviations: CAS number = Chemical Abstract Services number. LOR = Limit of reporting.
Specific comments for Work Order HK1223221 : Sample(s) were collected by ALS Technichem (HK) staff on 06 September, 2012.
Water sample(s) analysed and reported on an as received basis.
Temperature, Salinity, Dissolved Oxygen and Turbidity were measured on-site by ALS Technichem (HK) staff.
This report may not be reproduced except with prior written
approval from ALS Technichem (HK) Pty Ltd.
This document has been electronically signed by those names that appear on this report and are the authorised signatories.
Electronic signing has been carried out in compliance with procedures specified in the 'Electronic Transactions Ordinance'
of Hong Kong, Chapter 553, Section 6.Signatory Authorised results for:-Position
Fung Lim Chee, Richard InorganicsGeneral Manager
Fung Lim Chee, Richard SamplingGeneral Manager
11/F., Chung Shun Knitting Centre, 1-3 Wing Yip Street, Kwai Chung, N.T., Hong Kong
Tel: +852 2610 1044 Fax: +852 2610 2021 www.alsenviro.com

Client : ATKINS CHINA LTD
2 of 3 Page Number :
Work Order HK1223221
Analytical Results
EP025-SAMP:
Dissolved Oxygen
EA045-SAMP:
Turbidity
EA020-SAMP: SalinityEA012-SAMP:
Temperature
Sub-Matrix: MARINE WATER Compound EA025: Suspended
Solids (SS)
0.1 mg/L1 NTU0.1 g/L0.1 °C2 mg/LLOR Unit
OS: On-Site MeasurementOS: On-Site MeasurementOS: On-Site MeasurementOS: On-Site MeasurementEA/ED: Physical and
Aggregate Properties
Client sample ID Client sampling date /
time
Laboratory sample
ID
3 28.6 27.9 2 7.6C-M MID-EBB 06-SEP-2012 15:00 HK1223221-001
2 28.6 27.6 2 7.5D1-M MID-EBB 06-SEP-2012 15:10 HK1223221-002
4 28.7 27.6 2 7.7D2-S MID-EBB 06-SEP-2012 15:20 HK1223221-003
4 28.5 27.3 4 6.7D2-B MID-EBB 06-SEP-2012 15:20 HK1223221-004
<2 28.8 27.7 2 7.7D3-S MID-EBB 06-SEP-2012 15:30 HK1223221-005
<2 28.4 27.5 2 6.8D3-B MID-EBB 06-SEP-2012 15:30 HK1223221-006
2 28.7 27.6 2 7.8D4-M MID-EBB 06-SEP-2012 15:40 HK1223221-007
6 28.5 28.6 2 6.4C-M MID-FLOOD 06-SEP-2012 09:15 HK1223221-008
5 28.4 28.9 2 6.6D1-M MID-FLOOD 06-SEP-2012 09:25 HK1223221-009
3 28.4 28.6 2 6.4D2-S MID-FLOOD 06-SEP-2012 09:35 HK1223221-010
2 28.5 28.7 2 6.3D2-B MID-FLOOD 06-SEP-2012 09:35 HK1223221-011
2 28.5 28.8 2 6.7D3-S MID-FLOOD 06-SEP-2012 09:45 HK1223221-012
3 28.4 29.2 2 6.2D3-B MID-FLOOD 06-SEP-2012 09:45 HK1223221-013
4 28.6 28.5 1 6.6D4-M MID-FLOOD 06-SEP-2012 09:55 HK1223221-014
6 28.7 27.5 2 7.8D4-M-F FIELD DUPLICATE [06-SEP-2012] HK1223221-015
5 28.5 28.5 2 6.6D4-M-F FIELD DUPLICATE [06-SEP-2012] HK1223221-016

Client : ATKINS CHINA LTD
3 of 3 Page Number :
Work Order HK1223221
Laboratory Duplicate (DUP) Report
Matrix: WATER Laboratory Duplicate (DUP) Report
Original Result RPD (%)Laboratory sample ID Client sample ID Method: Compound CAS Number LOR Unit Duplicate Result
EA/ED: Physical and Aggregate Properties (QC Lot: 2489393)
EA025: Suspended Solids (SS) ---- 2 mg/L 3 3 0.0C-M MID-EBBHK1223221-001
EA025: Suspended Solids (SS) ---- 2 mg/L 2 4 50.7D2-B MID-FLOODHK1223221-011
Method Blank (MB), Laboratory Control Spike (LCS) and Laboratory Control Spike Duplicate (DCS) Report
Matrix: WATER Method Blank (MB) Report Laboratory Control Spike (LCS) and Laboratory Control Spike Duplicate (DCS) Report
RPDs (%)Spike Spike Recovery (%) Recovery Limits (%)
Control LimitValueResult Concentration HighLowLCS DCSMethod: Compound CAS Number LOR Unit
EA/ED: Physical and Aggregate Properties (QCLot: 2489393)
2 mg/L----EA025: Suspended Solids (SS) <2 ----100 ----20 mg/L 11385 ----
Matrix Spike (MS) and Matrix Spike Duplicate (MSD) Report
l No Matrix Spike (MS) or Matrix Spike Duplicate (MSD) Results are required to be reported.

False
CERTIFICATE OF ANALYSIS
ATKINS CHINA LTD 1 of 3 Page :Laboratory :Client : ALS Technichem HK Pty Ltd
Contact :
Address :
Contact :
Address :5TH FLOOR,
WHARF T&T CENTRE,
HARBOUR CITY,
TSIM SHA TSUI HONG KONG
:MS ENID YUNG Chan Kwok Fai, Godfrey HK122322211/F., Chung Shun Knitting Centre, 1 - 3 Wing
Yip Street, Kwai Chung, N.T., Hong Kong
Work Order
E-mail : E-mail :[email protected] [email protected]
Telephone :
Facsimile :
Telephone :
Facsimile :
+852 2972 1802 +852 2610 1044
+852 2890 6343 +852 2610 2021
Date received :Project : QUOTATION OF WATER TEST - STANLEY Quote number : ---- 07-SEP-2012
Date of issue : 17-SEP-2012Order number : ----
No. of samples - 16Received :C-O-C number : ----
STANLEY BAYSite : Analysed : 16-
Report Comments
This report for ALS Technichem (HK) Pty Ltd work order reference HK1223222 supersedes any previous reports with this reference. The completion date of analysis is 13-SEP-2012. Results apply to
sample(s) as submitted. All pages of this report have been checked and approved for release. When date(s) and/or time(s) are shown bracketed, these have been assumed by the laboratory for
process purposes. Abbreviations: CAS number = Chemical Abstract Services number. LOR = Limit of reporting.
Specific comments for Work Order HK1223222 : Sample(s) were collected by ALS Technichem (HK) staff on 07 September, 2012.
Water sample(s) analysed and reported on an as received basis.
Temperature, Salinity, Dissolved Oxygen and Turbidity were measured on-site by ALS Technichem (HK) staff.
This report may not be reproduced except with prior written
approval from ALS Technichem (HK) Pty Ltd.
This document has been electronically signed by those names that appear on this report and are the authorised signatories.
Electronic signing has been carried out in compliance with procedures specified in the 'Electronic Transactions Ordinance'
of Hong Kong, Chapter 553, Section 6.Signatory Authorised results for:-Position
Fung Lim Chee, Richard InorganicsGeneral Manager
Fung Lim Chee, Richard SamplingGeneral Manager
11/F., Chung Shun Knitting Centre, 1-3 Wing Yip Street, Kwai Chung, N.T., Hong Kong
Tel: +852 2610 1044 Fax: +852 2610 2021 www.alsenviro.com

Client : ATKINS CHINA LTD
2 of 3 Page Number :
Work Order HK1223222
Analytical Results
EP025-SAMP:
Dissolved Oxygen
EA045-SAMP:
Turbidity
EA020-SAMP: SalinityEA012-SAMP:
Temperature
Sub-Matrix: MARINE WATER Compound EA025: Suspended
Solids (SS)
0.1 mg/L1 NTU0.1 g/L0.1 °C2 mg/LLOR Unit
OS: On-Site MeasurementOS: On-Site MeasurementOS: On-Site MeasurementOS: On-Site MeasurementEA/ED: Physical and
Aggregate Properties
Client sample ID Client sampling date /
time
Laboratory sample
ID
2 28.6 27.9 3 7.6C-M MID-EBB 07-SEP-2012 15:30 HK1223222-001
3 28.7 27.9 3 7.7D1-M MID-EBB 07-SEP-2012 15:40 HK1223222-002
3 28.7 27.7 4 7.8D2-S MID-EBB 07-SEP-2012 15:50 HK1223222-003
5 28.7 27.6 4 6.7D2-B MID-EBB 07-SEP-2012 15:50 HK1223222-004
3 28.8 27.7 3 8.0D3-S MID-EBB 07-SEP-2012 16:00 HK1223222-005
3 28.6 27.6 4 7.0D3-B MID-EBB 07-SEP-2012 16:00 HK1223222-006
5 28.7 27.5 3 7.9D4-M MID-EBB 07-SEP-2012 16:10 HK1223222-007
3 28.4 27.6 2 6.5C-M MID-FLOOD 07-SEP-2012 10:15 HK1223222-008
5 529 27.6 2 6.6D1-M MID-FLOOD 07-SEP-2012 10:25 HK1223222-009
3 28.6 27.4 2 6.6D2-S MID-FLOOD 07-SEP-2012 10:35 HK1223222-010
2 28.4 27.6 4 6.6D2-B MID-FLOOD 07-SEP-2012 10:35 HK1223222-011
3 28.7 27.5 2 6.5D3-S MID-FLOOD 07-SEP-2012 10:45 HK1223222-012
2 28.6 27.7 3 6.5D3-B MID-FLOOD 07-SEP-2012 10:45 HK1223222-013
2 28.6 27.6 3 6.6D4-M MID-FLOOD 07-SEP-2012 10:55 HK1223222-014
3 28.5 27.7 2 6.5C-M-F FIELD DUPLICATE [07-SEP-2012] HK1223222-015
4 28.5 27.9 3 7.6C-M-E FIELD DUPLICATE [07-SEP-2012] HK1223222-016
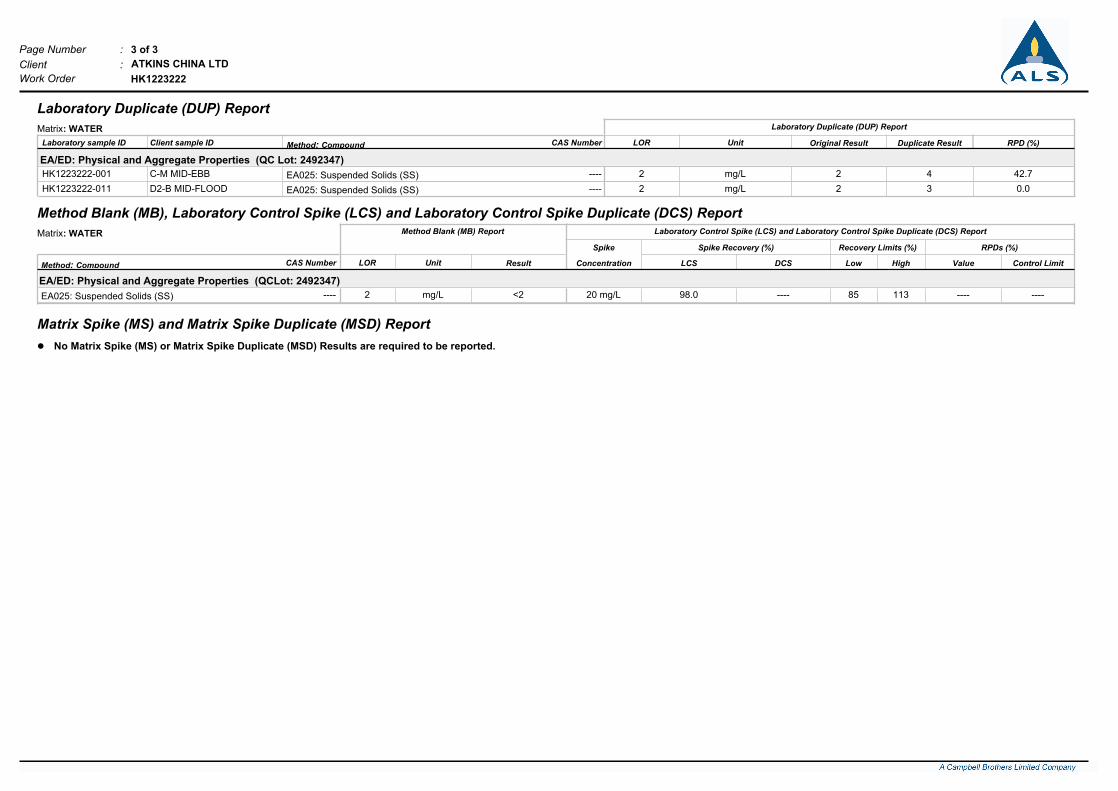
Client : ATKINS CHINA LTD
3 of 3 Page Number :
Work Order HK1223222
Laboratory Duplicate (DUP) Report
Matrix: WATER Laboratory Duplicate (DUP) Report
Original Result RPD (%)Laboratory sample ID Client sample ID Method: Compound CAS Number LOR Unit Duplicate Result
EA/ED: Physical and Aggregate Properties (QC Lot: 2492347)
EA025: Suspended Solids (SS) ---- 2 mg/L 2 4 42.7C-M MID-EBBHK1223222-001
EA025: Suspended Solids (SS) ---- 2 mg/L 2 3 0.0D2-B MID-FLOODHK1223222-011
Method Blank (MB), Laboratory Control Spike (LCS) and Laboratory Control Spike Duplicate (DCS) Report
Matrix: WATER Method Blank (MB) Report Laboratory Control Spike (LCS) and Laboratory Control Spike Duplicate (DCS) Report
RPDs (%)Spike Spike Recovery (%) Recovery Limits (%)
Control LimitValueResult Concentration HighLowLCS DCSMethod: Compound CAS Number LOR Unit
EA/ED: Physical and Aggregate Properties (QCLot: 2492347)
2 mg/L----EA025: Suspended Solids (SS) <2 ----98.0 ----20 mg/L 11385 ----
Matrix Spike (MS) and Matrix Spike Duplicate (MSD) Report
l No Matrix Spike (MS) or Matrix Spike Duplicate (MSD) Results are required to be reported.
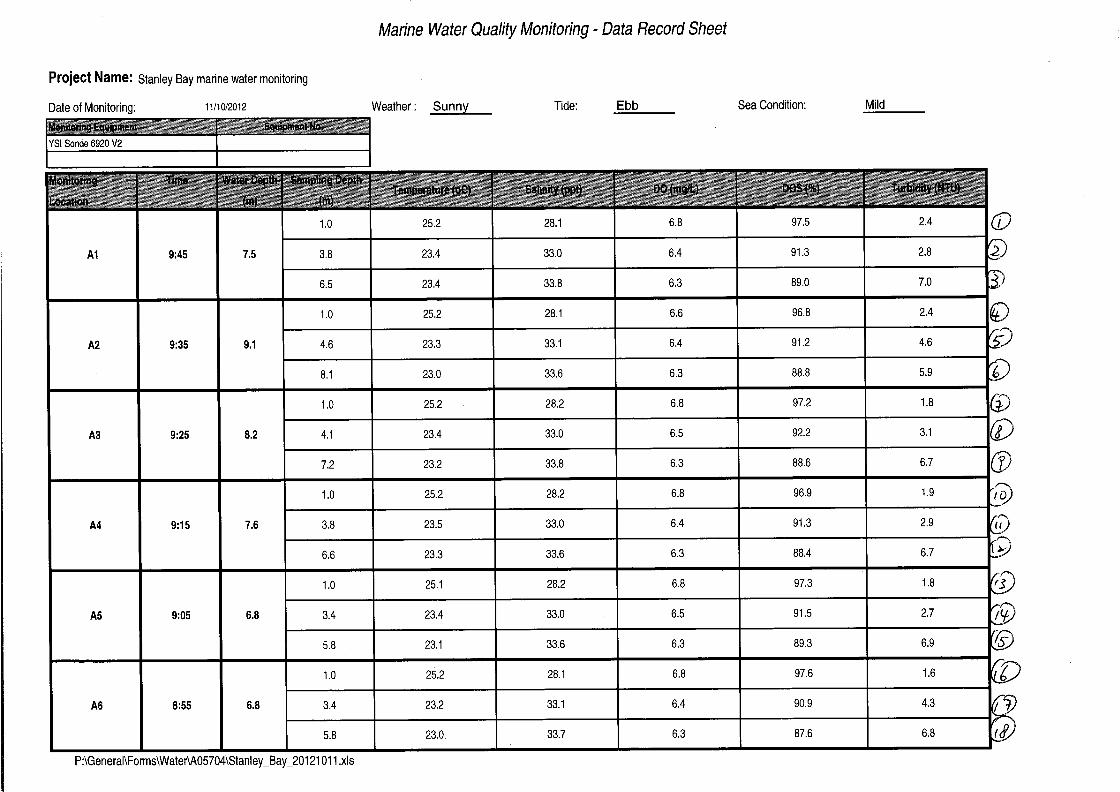
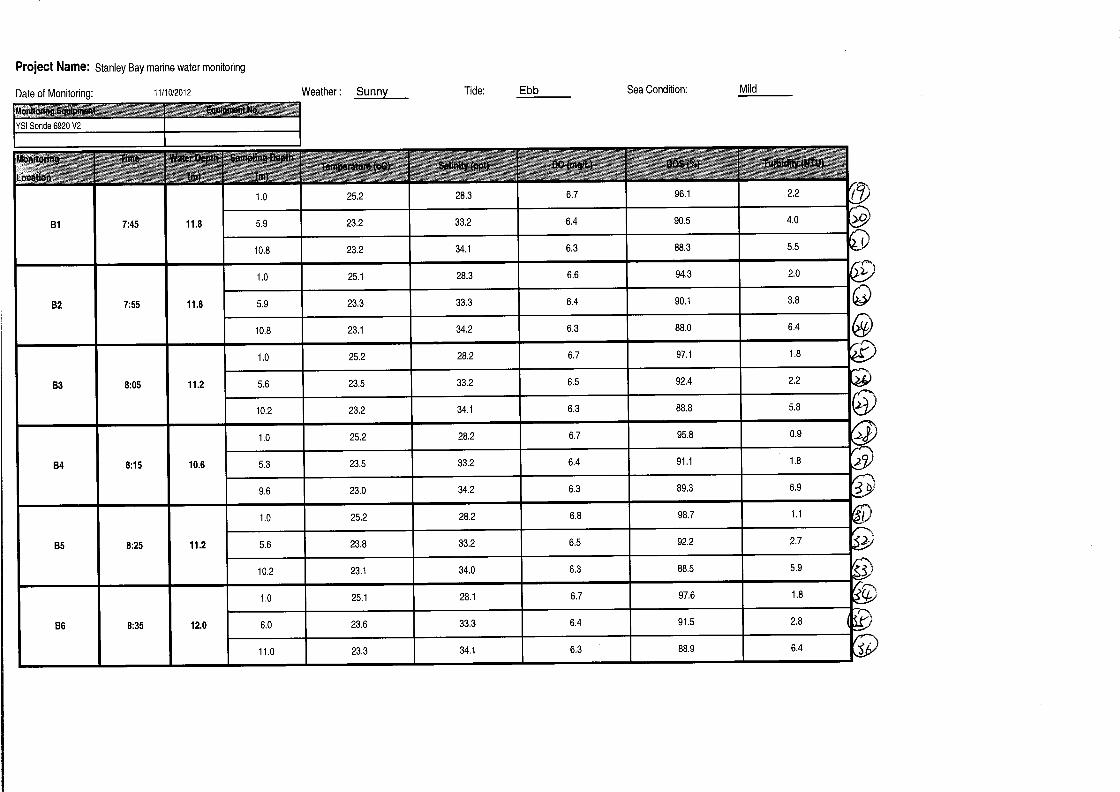


False
CERTIFICATE OF ANALYSIS
ATKINS CHINA LTD 1 of 8 Page :Laboratory :Client : ALS Technichem HK Pty Ltd
Contact :
Address :
Contact :
Address :5TH FLOOR,
WHARF T&T CENTRE,
HARBOUR CITY,
TSIM SHA TSUI HONG KONG
:MS ENID YUNG Chan Kwok Fai, Godfrey HK122711611/F., Chung Shun Knitting Centre, 1 - 3 Wing
Yip Street, Kwai Chung, N.T., Hong Kong
Work Order
E-mail : E-mail :[email protected] [email protected]
Telephone :
Facsimile :
Telephone :
Facsimile :
+852 2972 1802 +852 2610 1044
+852 2890 6343 +852 2610 2021
Date received :Project : QUOTATION OF WATER TEST - STANLEY Quote number : ---- 11-OCT-2012
Date of issue : 22-OCT-2012Order number : ----
No. of samples - 94Received :C-O-C number : ----
STANLEY BAYSite : Analysed : 94-
Report Comments
This report for ALS Technichem (HK) Pty Ltd work order reference HK1227116 supersedes any previous reports with this reference. The completion date of analysis is 17-OCT-2012. Results apply
to sample(s) as submitted. All pages of this report have been checked and approved for release. When date(s) and/or time(s) are shown bracketed, these have been assumed by the laboratory for
process purposes. Abbreviations: CAS number = Chemical Abstract Services number. LOR = Limit of reporting.
Specific comments for Work Order HK1227116 : Sample(s) were collected by ALS Technichem (HK) staff on 11 October, 2012.
Water sample(s) analysed and reported on an as received basis.
Temperature, Salinity, Dissolved Oxygen and Turbidity were measured on-site by ALS Technichem (HK) staff.
This report may not be reproduced except with prior written
approval from ALS Technichem (HK) Pty Ltd.
This document has been electronically signed by those names that appear on this report and are the authorised signatories.
Electronic signing has been carried out in compliance with procedures specified in the 'Electronic Transactions Ordinance'
of Hong Kong, Chapter 553, Section 6.Signatory Authorised results for:-Position
Fung Lim Chee, Richard InorganicsGeneral Manager
Fung Lim Chee, Richard SamplingGeneral Manager
11/F., Chung Shun Knitting Centre, 1-3 Wing Yip Street, Kwai Chung, N.T., Hong Kong
Tel: +852 2610 1044 Fax: +852 2610 2021 www.alsenviro.com

Client : ATKINS CHINA LTD
2 of 8 Page Number :
Work Order HK1227116
Analytical Results
EP025-SAMP:
Dissolved Oxygen
EA045-SAMP:
Turbidity
EA020-SAMP: SalinityEA012-SAMP:
Temperature
Sub-Matrix: WATER Compound EA025: Suspended
Solids (SS)
0.1 mg/L1 NTU0.1 g/L0.1 °C2 mg/LLOR Unit
OS: On-Site MeasurementOS: On-Site MeasurementOS: On-Site MeasurementOS: On-Site MeasurementEA/ED: Physical and
Aggregate Properties
Client sample ID Client sampling date /
time
Laboratory sample
ID
4 25.2 28.1 2 6.8A1-S MID-EBB [11-OCT-2012] HK1227116-001
4 23.4 33.0 3 6.4A1-M MID-EBB [11-OCT-2012] HK1227116-002
2 23.4 33.8 7 6.3A1-B MID-EBB [11-OCT-2012] HK1227116-003
5 25.2 28.1 2 6.6A2-S MID-EBB [11-OCT-2012] HK1227116-004
4 23.3 33.1 5 6.4A2-M MID-EBB [11-OCT-2012] HK1227116-005
4 23.0 33.6 6 6.3A2-B MID-EBB [11-OCT-2012] HK1227116-006
7 25.2 28.2 2 6.8A3-S MID-EBB [11-OCT-2012] HK1227116-007
7 23.4 33.0 3 6.5A3-M MID-EBB [11-OCT-2012] HK1227116-008
4 23.2 33.8 7 6.3A3-B MID-EBB [11-OCT-2012] HK1227116-009
4 25.2 28.2 2 6.8A4-S MID-EBB [11-OCT-2012] HK1227116-010
4 23.5 33.0 3 6.4A4-M MID-EBB [11-OCT-2012] HK1227116-011
3 23.3 33.6 7 6.3A4-B MID-EBB [11-OCT-2012] HK1227116-012
3 25.1 28.2 2 6.8A5-S MID-EBB [11-OCT-2012] HK1227116-013
3 23.4 33.0 3 6.5A5-M MID-EBB [11-OCT-2012] HK1227116-014
3 23.1 33.6 7 6.3A5-B MID-EBB [11-OCT-2012] HK1227116-015
5 25.2 28.1 2 6.8A6-S MID-EBB [11-OCT-2012] HK1227116-016
6 23.2 33.1 4 6.4A6-M MID-EBB [11-OCT-2012] HK1227116-017
3 23.0 33.7 7 6.3A6-B MID-EBB [11-OCT-2012] HK1227116-018
3 25.2 28.3 2 6.7B1-S MID-EBB [11-OCT-2012] HK1227116-019
3 23.2 33.2 4 6.4B1-M MID-EBB [11-OCT-2012] HK1227116-020
2 23.2 34.1 6 6.3B1-B MID-EBB [11-OCT-2012] HK1227116-021
3 25.1 28.3 2 6.6B2-S MID-EBB [11-OCT-2012] HK1227116-022
3 23.3 33.3 4 6.4B2-M MID-EBB [11-OCT-2012] HK1227116-023
3 23.1 34.2 6 6.3B2-B MID-EBB [11-OCT-2012] HK1227116-024
3 25.2 28.2 2 6.7B3-S MID-EBB [11-OCT-2012] HK1227116-025
3 23.5 33.2 2 6.5B3-M MID-EBB [11-OCT-2012] HK1227116-026
2 23.2 34.1 6 6.3B3-B MID-EBB [11-OCT-2012] HK1227116-027
4 25.2 28.2 <1 6.7B4-S MID-EBB [11-OCT-2012] HK1227116-028
2 23.5 33.2 2 6.4B4-M MID-EBB [11-OCT-2012] HK1227116-029
3 23.0 34.2 7 6.3B4-B MID-EBB [11-OCT-2012] HK1227116-030
<2 25.2 28.2 1 6.8B5-S MID-EBB [11-OCT-2012] HK1227116-031
<2 23.8 33.2 3 6.5B5-M MID-EBB [11-OCT-2012] HK1227116-032
<2 23.1 34.0 6 6.3B5-B MID-EBB [11-OCT-2012] HK1227116-033
3 25.1 28.1 2 6.7B6-S MID-EBB [11-OCT-2012] HK1227116-034
2 23.6 33.3 3 6.4B6-M MID-EBB [11-OCT-2012] HK1227116-035

Client : ATKINS CHINA LTD
3 of 8 Page Number :
Work Order HK1227116
EP025-SAMP:
Dissolved Oxygen
EA045-SAMP:
Turbidity
EA020-SAMP: SalinityEA012-SAMP:
Temperature
Sub-Matrix: WATER Compound EA025: Suspended
Solids (SS)
0.1 mg/L1 NTU0.1 g/L0.1 °C2 mg/LLOR Unit
OS: On-Site MeasurementOS: On-Site MeasurementOS: On-Site MeasurementOS: On-Site MeasurementEA/ED: Physical and
Aggregate Properties
Client sample ID Client sampling date /
time
Laboratory sample
ID
2 23.0 34.1 6 6.3B6-B MID-EBB [11-OCT-2012] HK1227116-036
4 25.2 28.4 4 6.5CM MID-EBB [11-OCT-2012] HK1227116-037
4 25.1 28.5 3 6.5D1-M MID-EBB [11-OCT-2012] HK1227116-038
3 25.2 27.8 2 6.5D2-S MID-EBB [11-OCT-2012] HK1227116-039
5 24.1 30.0 6 6.3D2-B MID-EBB [11-OCT-2012] HK1227116-040
3 25.2 27.8 2 6.5D3-S MID-EBB [11-OCT-2012] HK1227116-041
2 23.9 31.7 7 6.3D3-B MID-EBB [11-OCT-2012] HK1227116-042
3 24.8 28.7 6 6.5D4-M MID-EBB [11-OCT-2012] HK1227116-043
2 25.8 28.7 3 6.7A1-S MID-FLOOD [11-OCT-2012] HK1227116-044
3 23.7 33.6 4 6.4A1-M MID-FLOOD [11-OCT-2012] HK1227116-045
4 23.5 33.9 7 6.3A1-B MID-FLOOD [11-OCT-2012] HK1227116-046
3 25.8 28.6 2 6.5A2-S MID-FLOOD [11-OCT-2012] HK1227116-047
4 23.7 33.7 4 6.4A2-M MID-FLOOD [11-OCT-2012] HK1227116-048
6 23.5 34.1 6 6.3A2-B MID-FLOOD [11-OCT-2012] HK1227116-049
2 25.8 28.7 3 6.7A3-S MID-FLOOD [11-OCT-2012] HK1227116-050
6 23.6 33.8 4 6.4A3-M MID-FLOOD [11-OCT-2012] HK1227116-051
3 23.4 34.0 7 6.3A3-B MID-FLOOD [11-OCT-2012] HK1227116-052
2 26.0 28.7 2 6.7A4-S MID-FLOOD [11-OCT-2012] HK1227116-053
8 23.7 33.6 3 6.4A4-M MID-FLOOD [11-OCT-2012] HK1227116-054
4 23.6 34.4 6 6.3A4-B MID-FLOOD [11-OCT-2012] HK1227116-055
3 25.8 28.7 3 6.7A5-S MID-FLOOD [11-OCT-2012] HK1227116-056
4 23.8 33.6 5 6.5A5-M MID-FLOOD [11-OCT-2012] HK1227116-057
4 23.4 34.3 7 6.3A5-B MID-FLOOD [11-OCT-2012] HK1227116-058
3 25.7 28.7 4 6.7A6-S MID-FLOOD [11-OCT-2012] HK1227116-059
2 23.7 33.5 5 6.4A6-M MID-FLOOD [11-OCT-2012] HK1227116-060
3 23.3 34.1 7 6.3A6-B MID-FLOOD [11-OCT-2012] HK1227116-061
4 25.8 28.8 2 6.7B1-S MID-FLOOD [11-OCT-2012] HK1227116-062
2 23.8 34.0 4 6.4B1-M MID-FLOOD [11-OCT-2012] HK1227116-063
3 23.6 34.7 6 6.3B1-B MID-FLOOD [11-OCT-2012] HK1227116-064
2 25.8 28.8 3 6.6B2-S MID-FLOOD [11-OCT-2012] HK1227116-065
3 23.7 34.1 5 6.4B2-M MID-FLOOD [11-OCT-2012] HK1227116-066
4 23.6 34.8 5 6.3B2-B MID-FLOOD [11-OCT-2012] HK1227116-067
2 25.8 28.7 2 6.7B3-S MID-FLOOD [11-OCT-2012] HK1227116-068
3 23.7 34.1 3 6.5B3-M MID-FLOOD [11-OCT-2012] HK1227116-069
3 23.7 34.7 6 6.3B3-B MID-FLOOD [11-OCT-2012] HK1227116-070

Client : ATKINS CHINA LTD
4 of 8 Page Number :
Work Order HK1227116
EP025-SAMP:
Dissolved Oxygen
EA045-SAMP:
Turbidity
EA020-SAMP: SalinityEA012-SAMP:
Temperature
Sub-Matrix: WATER Compound EA025: Suspended
Solids (SS)
0.1 mg/L1 NTU0.1 g/L0.1 °C2 mg/LLOR Unit
OS: On-Site MeasurementOS: On-Site MeasurementOS: On-Site MeasurementOS: On-Site MeasurementEA/ED: Physical and
Aggregate Properties
Client sample ID Client sampling date /
time
Laboratory sample
ID
4 25.9 28.8 2 6.7B4-S MID-FLOOD [11-OCT-2012] HK1227116-071
4 23.6 34.1 3 6.4B4-M MID-FLOOD [11-OCT-2012] HK1227116-072
3 23.4 34.8 6 6.3B4-B MID-FLOOD [11-OCT-2012] HK1227116-073
2 25.8 28.9 2 6.8B5-S MID-FLOOD [11-OCT-2012] HK1227116-074
3 23.8 34.0 3 6.5B5-M MID-FLOOD [11-OCT-2012] HK1227116-075
2 23.5 34.5 6 6.3B5-B MID-FLOOD [11-OCT-2012] HK1227116-076
4 25.7 28.8 2 6.7B6-S MID-FLOOD [11-OCT-2012] HK1227116-077
<2 23.6 34.1 3 6.4B6-M MID-FLOOD [11-OCT-2012] HK1227116-078
<2 23.4 34.7 7 6.3B6-B MID-FLOOD [11-OCT-2012] HK1227116-079
2 25.8 28.9 4 6.5CM MID-FLOOD [11-OCT-2012] HK1227116-080
<2 25.6 29.1 4 6.5D1-M MID-FLOOD [11-OCT-2012] HK1227116-081
2 25.8 28.1 3 6.5D2-S MID-FLOOD [11-OCT-2012] HK1227116-082
2 23.9 32.5 4 6.3D2-B MID-FLOOD [11-OCT-2012] HK1227116-083
<2 25.7 28.3 3 6.5D3-S MID-FLOOD [11-OCT-2012] HK1227116-084
<2 23.9 32.5 5 6.3D3-B MID-FLOOD [11-OCT-2012] HK1227116-085
<2 25.0 28.7 7 6.4D4-M MID-FLOOD [11-OCT-2012] HK1227116-086
2 25.2 28.4 4 6.5C-M-E [11-OCT-2012] HK1227116-087
<2 25.1 28.5 3 6.5D1-M-E [11-OCT-2012] HK1227116-088
<2 25.2 27.8 2 6.5D2-S-E [11-OCT-2012] HK1227116-089
3 25.2 27.8 2 6.5D3-S-E [11-OCT-2012] HK1227116-090
3 25.8 28.9 4 6.5C-M-F [11-OCT-2012] HK1227116-091
2 25.6 29.1 4 6.5D1-M-F [11-OCT-2012] HK1227116-092
4 25.8 28.2 3 6.5D2-S-F [11-OCT-2012] HK1227116-093
<2 25.7 28.3 3 6.5D3-S-F [11-OCT-2012] HK1227116-094

Client : ATKINS CHINA LTD
5 of 8 Page Number :
Work Order HK1227116
Sub-Matrix: WATER Compound EP025-SAMP:
Dissolved Oxygen - %
Saturation
0.1 %LOR Unit
OS: On-Site MeasurementClient sample ID Client sampling date /
time
Laboratory sample
ID
97.5A1-S MID-EBB [11-OCT-2012] HK1227116-001
91.3A1-M MID-EBB [11-OCT-2012] HK1227116-002
89.0A1-B MID-EBB [11-OCT-2012] HK1227116-003
96.8A2-S MID-EBB [11-OCT-2012] HK1227116-004
91.2A2-M MID-EBB [11-OCT-2012] HK1227116-005
88.8A2-B MID-EBB [11-OCT-2012] HK1227116-006
97.2A3-S MID-EBB [11-OCT-2012] HK1227116-007
92.2A3-M MID-EBB [11-OCT-2012] HK1227116-008
88.6A3-B MID-EBB [11-OCT-2012] HK1227116-009
96.9A4-S MID-EBB [11-OCT-2012] HK1227116-010
91.3A4-M MID-EBB [11-OCT-2012] HK1227116-011
88.4A4-B MID-EBB [11-OCT-2012] HK1227116-012
97.3A5-S MID-EBB [11-OCT-2012] HK1227116-013
91.5A5-M MID-EBB [11-OCT-2012] HK1227116-014
89.3A5-B MID-EBB [11-OCT-2012] HK1227116-015
97.6A6-S MID-EBB [11-OCT-2012] HK1227116-016
90.9A6-M MID-EBB [11-OCT-2012] HK1227116-017
87.6A6-B MID-EBB [11-OCT-2012] HK1227116-018
96.1B1-S MID-EBB [11-OCT-2012] HK1227116-019
90.5B1-M MID-EBB [11-OCT-2012] HK1227116-020
88.3B1-B MID-EBB [11-OCT-2012] HK1227116-021
94.3B2-S MID-EBB [11-OCT-2012] HK1227116-022
90.1B2-M MID-EBB [11-OCT-2012] HK1227116-023
88.0B2-B MID-EBB [11-OCT-2012] HK1227116-024
97.1B3-S MID-EBB [11-OCT-2012] HK1227116-025
92.4B3-M MID-EBB [11-OCT-2012] HK1227116-026
88.8B3-B MID-EBB [11-OCT-2012] HK1227116-027
95.8B4-S MID-EBB [11-OCT-2012] HK1227116-028
91.1B4-M MID-EBB [11-OCT-2012] HK1227116-029
89.3B4-B MID-EBB [11-OCT-2012] HK1227116-030
98.7B5-S MID-EBB [11-OCT-2012] HK1227116-031
92.2B5-M MID-EBB [11-OCT-2012] HK1227116-032
88.5B5-B MID-EBB [11-OCT-2012] HK1227116-033
97.6B6-S MID-EBB [11-OCT-2012] HK1227116-034

Client : ATKINS CHINA LTD
6 of 8 Page Number :
Work Order HK1227116
Sub-Matrix: WATER Compound EP025-SAMP:
Dissolved Oxygen - %
Saturation
0.1 %LOR Unit
OS: On-Site MeasurementClient sample ID Client sampling date /
time
Laboratory sample
ID
91.5B6-M MID-EBB [11-OCT-2012] HK1227116-035
88.9B6-B MID-EBB [11-OCT-2012] HK1227116-036
91.5CM MID-EBB [11-OCT-2012] HK1227116-037
92.1D1-M MID-EBB [11-OCT-2012] HK1227116-038
92.6D2-S MID-EBB [11-OCT-2012] HK1227116-039
87.8D2-B MID-EBB [11-OCT-2012] HK1227116-040
92.7D3-S MID-EBB [11-OCT-2012] HK1227116-041
88.0D3-B MID-EBB [11-OCT-2012] HK1227116-042
91.9D4-M MID-EBB [11-OCT-2012] HK1227116-043
96.9A1-S MID-FLOOD [11-OCT-2012] HK1227116-044
90.5A1-M MID-FLOOD [11-OCT-2012] HK1227116-045
88.5A1-B MID-FLOOD [11-OCT-2012] HK1227116-046
95.1A2-S MID-FLOOD [11-OCT-2012] HK1227116-047
90.3A2-M MID-FLOOD [11-OCT-2012] HK1227116-048
88.0A2-B MID-FLOOD [11-OCT-2012] HK1227116-049
96.1A3-S MID-FLOOD [11-OCT-2012] HK1227116-050
91.2A3-M MID-FLOOD [11-OCT-2012] HK1227116-051
86.8A3-B MID-FLOOD [11-OCT-2012] HK1227116-052
96.2A4-S MID-FLOOD [11-OCT-2012] HK1227116-053
91.0A4-M MID-FLOOD [11-OCT-2012] HK1227116-054
86.9A4-B MID-FLOOD [11-OCT-2012] HK1227116-055
96.8A5-S MID-FLOOD [11-OCT-2012] HK1227116-056
93.5A5-M MID-FLOOD [11-OCT-2012] HK1227116-057
88.8A5-B MID-FLOOD [11-OCT-2012] HK1227116-058
96.8A6-S MID-FLOOD [11-OCT-2012] HK1227116-059
89.5A6-M MID-FLOOD [11-OCT-2012] HK1227116-060
88.2A6-B MID-FLOOD [11-OCT-2012] HK1227116-061
95.0B1-S MID-FLOOD [11-OCT-2012] HK1227116-062
89.5B1-M MID-FLOOD [11-OCT-2012] HK1227116-063
87.2B1-B MID-FLOOD [11-OCT-2012] HK1227116-064
95.5B2-S MID-FLOOD [11-OCT-2012] HK1227116-065
89.2B2-M MID-FLOOD [11-OCT-2012] HK1227116-066
87.4B2-B MID-FLOOD [11-OCT-2012] HK1227116-067
96.2B3-S MID-FLOOD [11-OCT-2012] HK1227116-068

Client : ATKINS CHINA LTD
7 of 8 Page Number :
Work Order HK1227116
Sub-Matrix: WATER Compound EP025-SAMP:
Dissolved Oxygen - %
Saturation
0.1 %LOR Unit
OS: On-Site MeasurementClient sample ID Client sampling date /
time
Laboratory sample
ID
89.0B3-M MID-FLOOD [11-OCT-2012] HK1227116-069
86.9B3-B MID-FLOOD [11-OCT-2012] HK1227116-070
95.8B4-S MID-FLOOD [11-OCT-2012] HK1227116-071
90.3B4-M MID-FLOOD [11-OCT-2012] HK1227116-072
88.8B4-B MID-FLOOD [11-OCT-2012] HK1227116-073
96.6B5-S MID-FLOOD [11-OCT-2012] HK1227116-074
90.1B5-M MID-FLOOD [11-OCT-2012] HK1227116-075
89.1B5-B MID-FLOOD [11-OCT-2012] HK1227116-076
97.2B6-S MID-FLOOD [11-OCT-2012] HK1227116-077
89.8B6-M MID-FLOOD [11-OCT-2012] HK1227116-078
87.4B6-B MID-FLOOD [11-OCT-2012] HK1227116-079
90.9CM MID-FLOOD [11-OCT-2012] HK1227116-080
91.2D1-M MID-FLOOD [11-OCT-2012] HK1227116-081
92.2D2-S MID-FLOOD [11-OCT-2012] HK1227116-082
87.3D2-B MID-FLOOD [11-OCT-2012] HK1227116-083
92.7D3-S MID-FLOOD [11-OCT-2012] HK1227116-084
87.9D3-B MID-FLOOD [11-OCT-2012] HK1227116-085
90.0D4-M MID-FLOOD [11-OCT-2012] HK1227116-086
91.5C-M-E [11-OCT-2012] HK1227116-087
92.0D1-M-E [11-OCT-2012] HK1227116-088
92.3D2-S-E [11-OCT-2012] HK1227116-089
92.3D3-S-E [11-OCT-2012] HK1227116-090
91.1C-M-F [11-OCT-2012] HK1227116-091
91.2D1-M-F [11-OCT-2012] HK1227116-092
92.1D2-S-F [11-OCT-2012] HK1227116-093
92.5D3-S-F [11-OCT-2012] HK1227116-094

Client : ATKINS CHINA LTD
8 of 8 Page Number :
Work Order HK1227116
Laboratory Duplicate (DUP) Report
Matrix: WATER Laboratory Duplicate (DUP) Report
Original Result RPD (%)Laboratory sample ID Client sample ID Method: Compound CAS Number LOR Unit Duplicate Result
EA/ED: Physical and Aggregate Properties (QC Lot: 2550574)
EA025: Suspended Solids (SS) ---- 2 mg/L 4 5 23.1A1-S MID-EBBHK1227116-001
EA025: Suspended Solids (SS) ---- 2 mg/L 4 2 0.0A4-M MID-EBBHK1227116-011
EA/ED: Physical and Aggregate Properties (QC Lot: 2550575)
EA025: Suspended Solids (SS) ---- 2 mg/L 2 2 0.0B1-B MID-EBBHK1227116-021
EA025: Suspended Solids (SS) ---- 2 mg/L <2 <2 0.0B5-S MID-EBBHK1227116-031
EA/ED: Physical and Aggregate Properties (QC Lot: 2550576)
EA025: Suspended Solids (SS) ---- 2 mg/L 3 3 0.0D3-S MID-EBBHK1227116-041
EA025: Suspended Solids (SS) ---- 2 mg/L 6 7 15.8A3-M MID-FLOODHK1227116-051
EA/ED: Physical and Aggregate Properties (QC Lot: 2550577)
EA025: Suspended Solids (SS) ---- 2 mg/L 3 3 0.0A6-B MID-FLOODHK1227116-061
EA025: Suspended Solids (SS) ---- 2 mg/L 4 4 0.0B4-S MID-FLOODHK1227116-071
EA/ED: Physical and Aggregate Properties (QC Lot: 2550578)
EA025: Suspended Solids (SS) ---- 2 mg/L <2 <2 0.0D1-M MID-FLOODHK1227116-081
EA025: Suspended Solids (SS) ---- 2 mg/L 3 4 44.8C-M-FHK1227116-091
Method Blank (MB), Laboratory Control Spike (LCS) and Laboratory Control Spike Duplicate (DCS) Report
Matrix: WATER Method Blank (MB) Report Laboratory Control Spike (LCS) and Laboratory Control Spike Duplicate (DCS) Report
RPDs (%)Spike Spike Recovery (%) Recovery Limits (%)
Control LimitValueResult Concentration HighLowLCS DCSMethod: Compound CAS Number LOR Unit
EA/ED: Physical and Aggregate Properties (QCLot: 2550574)
2 mg/L----EA025: Suspended Solids (SS) <2 ----98.5 ----20 mg/L 11385 ----
EA/ED: Physical and Aggregate Properties (QCLot: 2550575)
2 mg/L----EA025: Suspended Solids (SS) <2 ----87.5 ----20 mg/L 11385 ----
EA/ED: Physical and Aggregate Properties (QCLot: 2550576)
2 mg/L----EA025: Suspended Solids (SS) <2 ----103 ----20 mg/L 11385 ----
EA/ED: Physical and Aggregate Properties (QCLot: 2550577)
2 mg/L----EA025: Suspended Solids (SS) <2 ----94.0 ----20 mg/L 11385 ----
EA/ED: Physical and Aggregate Properties (QCLot: 2550578)
2 mg/L----EA025: Suspended Solids (SS) <2 ----101 ----20 mg/L 11385 ----
Matrix Spike (MS) and Matrix Spike Duplicate (MSD) Report
l No Matrix Spike (MS) or Matrix Spike Duplicate (MSD) Results are required to be reported.