south carolina budget and control board · pdf fileprograms and services of the institution....
TRANSCRIPT

SOUTH CAROLINA BUDGET AND CONTROL BOARD ACCOUNTABILITY REPORT
2011-2012

2
TABLE OF CONTENTS Section I - Executive Summary ........................................................................................... 3 Section II - Organizational Profile ...................................................................................... 8 Section III – Elements of Malcolm Baldrige Award Criteria
Category 1 – Senior Leadership, Governance and Social Responsibility ............ 17
Category 2 – Strategic Planning ............................................................................ 20
Category 3 – Student, Stakeholder and Market Focus .......................................... 29
Category 4 – Measurement, Analysis and Knowledge Management ................... 33
Category 5 – Workforce Focus ............................................................................. 38
Category 6 – Process Management ....................................................................... 40
Category 7 – Organizational Performance Results ............................................... 46

3
SECTION I – Executive Summary
I.1 Purpose, Mission and Values Clemson University’s mission, “...to fulfill the covenant between its founder and the people of South Carolina to establish a ‘high seminary of learning’ through its historical land-grant responsibilities of teaching, research and extended public service,” is the keystone to all activities, programs and services of the institution. Our Vision and Mission are pathways to excellence that help direct our service as a land-grant research institution, and to become one of the nation's top-20 public universities. I.2 Major Achievements of 2011-2012 The University has received both honor and recognition during the past year. Clemson’s extensive achievements are recorded in the President’s Report Card, a quarterly report to the institution’s Board of Trustees. These achievements include:
• Clemson University ranks 25th among national public institutions, according to U.S. News & World Report’s annual guide to “America’s Best Colleges.” Additionally, Clemson ranks 7th among “up-and-coming schools” that have made “the most promising and innovative changes in academics, faculty, students, campus or facilities.” The university also is recognized for writing in the disciplines.
• Princeton Review and USA TODAY named Clemson among the nation’s 75 best values in public colleges and universities in “The Princeton Review Best Value Colleges for 2012.”
• Freshman applications for fall 2012 are running 9% ahead of 2011, which set record for most in single year.
• Over 3,000 new freshmen and transfer students participated in Diversity Dialogues during fall 2011. Dialogues were co-facilitated by 12 trained undergraduate Peer Dialogue Facilitators. The Fall 2011entering class has an increase of 25% in African-American freshmen vs. 2010 as well as record number of African-American transfers. CU-ICAR STEM efforts to support young women were recognized by InnoVision. Diverse Issues in Higher Education recognized Clemson as tied for ninth top U.S. producer of African-American engineering Ph.D. graduates and eighth for B.S. graduates.
• The ETS Proficiency Profile (locally referred to as the Clemson Educational Profile) was successfully administered to 2,878 new first-year students during Clemson Connect.
• Enrollment in doctoral programs in health, biomedical, biotechnology focus area increased by 11% since 2010.
• Among 12 Fulbright nominees submitted from Clemson, two students won grants — Elizabeth Mills, Germany, and Tom Kudlacz, Poland — and three others were formally recommended
• by national screening committee: Lauren Hock, Ecuador; Ryan Need, United Kingdom; Lauren Harroff, Uganda.
• Two School of Architecture teams won top awards in Dow Chemical Company’s Solar Design to Zero Competition: First Place, Eric Laine and Suzanne Steelman; Second Place, Daniel Kim and
• Caitlin Ranson. Three additional Clemson teams received honorable mention and ancillary awards
• In 2011-12, 978 students enrolled in co-op courses, and 1,267 students enrolled in internship courses.

4
• Of 2011-2012 graduates, 34% had accepted full-time jobs (compared to 2011 national average of 18% as reported by NACE), 4% had offers, 20% were accepted into graduate/professional schools.
• The Best 300 Professors book by The Princeton Review profiles five Clemson educators — Paul Christopher Anderson, Robert Kosinski, Robin Kowalski, Karen Pressprich and Stephen Schvaneveldt — selected from list of 42,000 professors in more than 60 fields and 122 colleges and universities across nation.
• April 2012 edition of “Success Stories” by National Office of Juvenile Justice and Delinquency Prevention features Clemson University and EMpower Clemson/law enforcement accomplishments in prevention of underage drinking.
• Student satisfaction scores on the National Survey on Student Engagement (NSSE) exceed both peers and the national average
• In the 2011-12 academic year 3,100 students participated in 371 Creative Inquiry teams and 10.5% of undergraduate students participated in service-learning activities.
• The Princeton Review’s Guide to 311 Green Colleges ranks Clemson as one of the country’s most environmentally responsible colleges.
• Political and industry leaders met at CU-ICAR for the 2nd Automotive Transatlantic Summit, a leading automotive conference that addresses competitiveness, economic development and the global auto industry’s future.
I.3 Key Strategic Goals for the Present and Future Years The Clemson 2020 Road Map is a 10-year strategic plan that calls for investments in faculty hires, student engagement, upgraded facilities and technology, and faculty and staff compensation – with most of the funding to come from existing resources and new revenues. The plan was approved by the Board of Trustees on April 15, 2011.
President James F. Barker said the plan puts Clemson “back on offense. For the past two years, we’ve been playing defense – waiting for the next budget cut and looking over our shoulders. We had a good excuse – the Great Recession – but it’s time to start building for the future.”
Core Components of the Road Map
Vision Clemson will be one of the nation’s top-20 public universities.
Goals Fulfill Clemson’s responsibility to students and the state of South Carolina
• to provide talent for the new economy by recruiting and retaining outstanding students and faculty and providing an exceptional educational experience grounded in engagement;
• to drive innovation, through research and service, that stimulates economic growth and solves problems;
• to serve the public good by focusing on emphasis areas that address some of the great challenges of the 21st century — national priorities such as health, energy, transportation and sustainable environment.

5
Objectives Invest in four strategic priorities:
• Enhance student quality and performance • Provide engagement and leadership opportunities for all students • Attract, retain and reward top people • Build to compete — facilities, infrastructure and technology The 2020 Road Map is discussed fully in Section III, Category 2. I.4 Key Strategic Challenges On Wednesday, January 19th, 2011 Clemson University President James F. Barker made his E&G (Education and General) budget presentation to the Higher Education Subcommittee of the House Ways & Means Committee in Columbia. The major points made by President Barker in the budget presentation are: Fact Number 1 — Clemson is Affordable for South Carolina Students. The positive financial impact of the state scholarships — Palmetto Fellows, LIFE and Hope scholarships: These scholarships have the direct result of lowering the cost for South Carolina students to attend Clemson. In Fall 2010, every single one of our 1,824 incoming freshmen from South Carolina received a scholarship — 99 percent of them were State scholarships you provide. The average amount was $7,902. The average first-time in-state freshmen at Clemson last year actually paid $3,462 in academic fees, compared to the sticker price of $10,848. The real tuition cost to in-state students is about 32 percent of sticker price. The second part of the affordability equation is that there is a difference between cost and value. The marketplace is speaking, and demand for a quality Clemson education remains strong. Clemson continues to set records for both freshman and transfer applications. This tells us that students and parents continue to see a Clemson education as a good value and a good investment. The ultimate measure of affordability is whether or not students apply, enroll, and persist to graduation with a Clemson degree and this is happening. Fact Number 2 — Clemson is Efficient For almost a decade, Clemson has had an aggressive discovery process to find ways to deliver better service at a lower cost — that is, to improve efficiency. Cost savings were re-directed to other priorities. Two years ago in the first year of the Great Recession, Clemson eliminated 450 positions, offered retirement incentives and consolidated administrative units. We shifted even more spending from administration and staff support to instruction and our core academic programs. Today, Clemson University has gone from a lean operation to an extremely lean operation. We graduate 27 percent more undergraduate students now than we did in FY 2000, and our retention rate has increased from 87 percent in 2000 to 91 percent in 2009. Institutional support costs per student at far lower at Clemson than at peer institutions — 23 percent lower than the University of Georgia, 32 percent lower than NC State, 44 percent lower than

6
Georgia Tech, and 53 percent lower than UNC. Operations and maintenance of plant costs are lower by even larger percentages, ranging from 47 percent lower than Georgia to 68 percent lower than UNC. Fact Number 3 — Clemson is Accessible for South Carolina Students In 2010-11 87 percent of in-state applicants were offered either August or January admission, or the Bridge to Clemson program. The Clemson resident/non-resident student ratio of 65-35 has remained remarkably constant for decades, and the University is educating more South Carolina students today than ever before in the 120-year history of Clemson University. Fact Number 4 — Clemson is Productive Clemson University continues to make progress towards its goal to become one of the nation’s Top 20 Public Institutions. We have maintained our ranking as 23rd among public colleges and universities despite the current economic environment. Clemson has increased retention and graduation rates. The total number of graduates has increased 21.3 percent since FY 2000. Clemson continues to improve upon our aging infrastructure as well as build upon our competitiveness through the investment in new facilities. With state funding provided in 2007 and 2008, we began work on the IT infrastructure for the C-Light Regional Optical Network and the South Carolina Light Rail, which links researchers in communities across South Carolina with national and international research networks and enables full-speed access to national cyberinfrastructure. In July 2010, the Clemson University Research Foundation received a $1.4 million grant from the National Science Foundation to improve cyberinfrastructure in South Carolina, which has allowed us to build upon the state’s investment. These are just a few of the indicators of what a productive Clemson University means to South Carolina and its economy. Fact Number 5 — Clemson is Delivering for South Carolina We have built an up-and-coming graduate program in automotive engineering that is helping CU-ICAR attract private sector partners like Proterra, a maker of hybrid and electric transit vehicles, and Sage Automotive, a spin-off of Milliken that makes fabric for the auto market. These two companies alone have announced that they expect to create 1,700 new jobs in South Carolina in the coming years. We have begun construction of a wind turbine drivetrain testing facility in North Charleston that promises to make South Carolina a hub of the wind energy economy. Already, IMO Group has announced that it selected the Charleston region for a new manufacturing plant that will add 190 jobs in part because of this facility. Clemson remains committed to the role in economic development that we can play for the State.
I.5 Use of the Accountability Report Accountability is a key component of all university activities. The Accountability Report is composed of selected data points that measure Clemson University’s performance in key success areas. Insights gleaned from this report and other sources such as the Institutional Effectiveness Report (prepared annually for the South Carolina Commission on Higher Education) accentuate awareness of successes and problem areas and supports data-driven decision-making. Data

7
collection and analysis is an activity that is ongoing throughout the year. This activity contributes to a culture of quality enhancement and institutional effectiveness.

8
SECTION II - Organizational Profile
II.1 Main Educational Programs, Offerings, and Services Academic programming, research, student services and administrative staff directly support Clemson’s tripartite mission of teaching, research and service. The teaching mission prepares an educated, well-rounded workforce trained through innovative programs and by a dedicated faculty. Students typically receive classroom and laboratory instruction, but online instruction is also available. The research mission provides structure for moving new knowledge from the laboratory to the classroom and to the world. The findings are disseminated through professional papers, presentations, websites, and the registration of intellectual properties. The economic development and public service mission provides an interface between faculty, students and the citizens of South Carolina in community-based projects, consultations and publications. II.2 Stakeholder Groups and Key Requirements Students, parents, other internal and external stakeholders and the higher education marketplace exhibit various expectations as listed in Table II.2-1. Clemson welcomes feedback from all stakeholders, and responds to requirements and expectations through its strategic planning process and through a variety of programming. Table II.2-1 Stakeholder Groups and Key Requirements/Expectations
Stakeholder Group Key Requirements/Expectations
Students (undergraduate and graduate)
Quality educational/degree programs Classes and research/inquiry experiences Quality faculty Quality facilities: classrooms, laboratories, libraries Safe campus environment Rich student life experiences; social, emotional, physical, spiritual support services/programs
Faculty and Staff Safe work environment Support for teaching, research and service activities
Alumni
Opportunities for continued relationship with the University Contribute toward the enhancement of the University Stewardship of the funds provided to the University Quality programs and activities
Parents Safe campus environment Quality educational/degree programs Support systems for students
Future students Information about the University Variety of educational/degree/program options Opportunity to attend the University
State (legislators, CHE, citizens) Wise use of resources Quality education for South Carolina residents Contribution to South Carolina’s economic development
Federal funding agencies Compliance with federal policies

9
Completion and reporting relative to federal policies
Accreditation bodies Compliance with established standards Participation in voluntary activities
II.3 Operating Locations The physical resources needed to fulfill the University’s teaching, research, and service missions are extensive, and include land holdings, buildings, and equipment. Service to South Carolina and her citizens can be substantially documented through extension, teaching, and research facilities in each county of the state. Clemson’s main campus, located in the northwestern corner of the state on the shores of Lake Hartwell, is surrounded by 19,700 acres of land used for research, teaching, and recreation. The University also owns overseas property used for teaching and research in Genoa, Italy (Charles E. Daniel Center), and on the Caribbean island of Dominica. Other off-campus facilities include the University Center of Greenville (South Carolina); Universitat Politecnica de Catalunya in Barcelona, Spain; and the Charleston Architectural Center (Charleston, South Carolina). Other land held for research and education includes camps and centers. II.4 Employees In 2011, the University employed 4,395 full and part-time personnel as shown in Table II.4-1. These numbers are based on budgeted salaries (instruction, research, public service, administration, etc.) Table II.4-1
2011 Employees by Category and Status Full Time Part Time Total Administrator 197 0 197 Administrator with Faculty Rank 102 0 102 Instructional Faculty 1013 109 1122 Other Professional with Faculty Rank 58 22 80 Public Service Faculty 11 1 12 Research Faculty 28 83 111 Staff 2089 682 2771 Total 3498 897 4395 Source: CUBS HR System, October 1, 2011 ^Classification of research faculty includes an evaluation of salary distribution, title, and home department. A faculty member may receive this designation if the majority of salary funding is for research programming; one’s position title is ‘research faculty,’ or department is other than an academic department.
II.5 Regulatory Environment As a research institution, Clemson operates under many regulatory systems at state and federal levels. Reporting systems allow the University to document compliance and maintain accreditation. Accreditation entities include, but are not limited to, The Joint Commission (Redfern Health Center), SACSCOC (Southern Association of Colleges and Schools Commission on Colleges), and professional agencies including:

10
• American Assembly of Collegiate Schools of Business-International Association for Management Education
• Accrediting Board for Engineering and Technology with Computing Science Accreditation Board
• American Council for Construction Education • American Society of Landscape Architects • Commission on Collegiate Nursing Education • Council for Accreditation of Counseling and Related Education Programs • National Architectural Accrediting Board, Inc. • National Association of Schools of Art and Design • National Council for Accreditation of Teacher Education • Society of American Foresters
II.6 Governance System The Trustee Manual clearly delineates the responsibilities of the Board of Trustees, Clemson University’s governing body. The relationship between the Board of Trustees and senior leadership is noted in Table II.11-1 Organizational Structure. II.7 Key Suppliers and Partners The University is guided by the state procurement codes for supplies and equipment. II.8 Key Competitors The University competes with public and private colleges and universities in South Carolina and across the country to enroll the best students. Competition for federal and industry funding between research universities is more vigorous than ever. This has encouraged Clemson to seek funding and partnership collaborations with several institutions. This is intended to improve overall chances of funding, broaden research opportunities, and reduce competition for limited resources and opportunities. With many faculty members retiring in the next several years, and the concomitant wage expectations of new hires, Clemson continues to seek funding to attract and hire quality teachers and researchers. The search for qualified staff to support the faculty and students also remains competitive, but the University is committed to increasing quality through new hires. Contributions from alumni, businesses, and other donors remains a challenge for development officers, especially in the current economic climate. II.9 Competitive Success In Clemson’s Vision Statement, the University has established a primary goal to be ranked a top-20 public university. Clemson uses the 16 U.S. News & World Report criteria as one benchmark of institutional quality and success. The 27 goals go beyond the 16 criteria used in the U.S. News and World Report ranking. For example, the University’s goal of $100 million in funded research was set when the university was significantly below that amount. Since then, Clemson has exceeded $100 million, and has set a new goal of $150 million-a notable level for a university having neither a medical school nor a law school. Clemson’s successful budget alignment with institutional priorities within the strategic plan has kept the institution focused on foundational goals. Planning and assessment activities facilitate implementation at all levels.

11
II.10 Performance Improvement Systems • Office for Institutional Effectiveness and Assessment (Annual Assessment Plans and
Reports, IE Reports to the South Carolina Commission on Higher Education, Accountability Reports)
• Faculty Systems (Promotion, Tenure and Reappointment Processes, Post-Tenure Review, Faculty Activity System)
• Office of Institutional Research (Annual System of Reports, Departmental Activities Summaries, multiple reports and analysis of data as requested)
• Master Campus Planning • Research Compliance • Office of Teaching Effectiveness and Innovation • Faculty and Staff Evaluations (Annual Faculty Evaluations, Employee Performance
Management System) • Compliance Reports • Accreditation Reports, Program Reviews, Self-Studies, Site Visits
II.11 Organizational Structure Three vice presidents (Academic Affairs and Provost, Research, and Economic Development) lead the University’s teaching, research and public service missions. The University’s broad organization is noted in Table II.11-1 Organizational Structure.
Table II.11-1 Organizational Structure
Board of Trustees President
The following report directly to the President:
Vice President for Academic Affairs and Provost Vice President for Research Vice President for Economic Development Vice President for Advancement Vice President for Student Affairs Chief Financial Officer General Counsel and Assistant to the President Director of Athletics Assistants to the President and Chief of Staff
Dual appointment:
Executive Secretary to the Board of Trustees and Assistant to the President

12

13
II.12 Expenditures/Appropriations Table The following page provides an Expenditures/Appropriations Table (Table II.12-1).
Base Budget Expenditures and Appropriations
FY 10-11 Actual Expenditures* FY 11-12 Actual Expenditures FY 12-13 Appropriations
Act Major Budget Total Funds General Total Funds General Total Funds General
Categories Funds Funds Funds
Personal Service $250,968,915 $54,154,702 $274,947,238 $47,402,720 $291,655,676
$46,624,204
Other Operating $259,098,180 $250,912,494 $259,931,764
Special Items $96,221,211 $96,055,003 $125,184,109
Permanent Improvements $7,601,970 $6,774,463 $6,523,070
Case Services
Distributions to Subdivisions
Fringe Benefits $69,106,503 $8,505,147 $73,175,082 $12,372,710 $90,047,159
$13,122,712
Non-recurring (ARRA Stimulus) $22,332,330 $3,693,120
Total $705,329,109 $62,659,849 $705,557,401 $59,746,916 $773,341,778
$59,746,916
*Revised from prior year's report.

14
Other Expenditures
Sources of FY 10-11 Actual FY 11-12 Actual Funds Expenditures Expenditures
Supplemental Bills
Capital Reserve Funds $6,195,597
Bonds

15
II.13 Major Program Areas Table
Program Number and Title
Major Program Area Purpose (Brief)
Key Cross-
Reference for Financial Results*
FY 10-11 Budget Expenditures** FY 11-12 Budget Expenditures
I.A. Educational and General-Unrestricted
State: 54,154,702.00 State: 50,883,858.00 Federal: 9,767,000.00 Federal: 10,188,429.00 Other: 305,385,633.00 Other: 327,547,214.00 7.3 Total: 369,307,335.00 Total: 388,619,501.00
% of Total Budget: 47% % of Total Budget: 49%
I.B. Educational and General-Restricted
State: 0.00 State:
Federal: 66,222,801.00 Federal: 74,241,207.00 Other: 123,634,417.00 Other: 117,271,411.00 7.4 Total: 189,857,218.00 Total: 191,512,618.00
% of Total Budget: 24% % of Total Budget: 24%
II.A. Auxiliary Enterprises-Unrestricted
State: 0.00 State: 0.00 Federal: 0.00 Federal: 0.00 Other: 123,542,299.00 Other: 131,831,291.00 7.5 Total: 123,542,299.00 Total: 131,831,291.00
% of Total Budget: 16% % of Total Budget: 16%
III.C. Employee Benefits-State Employer
State: 8,505,147.00 State: 8,863,058.00 Federal: 4,832,846.00 Federal: 5,240,609.00 Other: 72,352,013.00 Other: 74,036,726.00 Total: 85,690,006.00 Total: 88,140,393.00
% of Total Budget: 11% % of Total Budget: 11%
SUBTOTAL
State: 62,659,849.00 State: 59,746,916.00 Federal: 80,822,647.00 Federal: 89,670,245.00 Other: 624,914,362.00 Other: 650,686,642.00 Total: 768,396,858.00 Total: 800,103,803.00
% of Total Budget: 98% % of Total Budget: 100%

16
* Key Cross-References are a link to the Category 7 - Organizational Performance Results. These References provide a chart number that is included in section7.
Below: List any programs not included above and show the remainder of expenditures by source of funds. FY 10-11 $16,484,608 ARRA Stabilization Funds (Stimulus)
Remainder of Expenditures: State: 0.00 State:
Federal: 16,484,608.00 Federal:
Other: 0.00 Other:
Total: 16,484,608.00 Total:
% of Total Budget: 2% % of Total Budget: 0%
GRAND TOTAL State: 62,659,849.00 State: 59,746,916.00 Federal: 97,307,255.00 Federal: 89,670,245.00 Other: 624,914,362.00 Other: 650,686,642.00 Total: 784,881,466.00 Total: 800,103,803.00 % of Total Budget: 100% % of Total Budget: 100%
**Revised from prior year's report.

17
SECTION III – Elements of Malcolm Baldrige Award Criteria
III. Category 1 – Senior Leadership, Governance and Social Responsibility III.1.1 Develop and Deploy Vision and Values Clemson University’s organizational structure is designed to meet the University’s mission. The three mission vice-presidents (Academic Affairs and Provost; Economic Development; and Research) lead the teaching, extended public service, and research missions of the University. President Barker developed a Three Core Missions Organizational Concept designed to reduce administrative layers, increase interactions among budget categories (E&G, PS, and external) and provide a collaboration and evaluation link between the mission areas. The University’s goals are broad-based, requiring multiple years to complete. The senior leadership meets annually to set measurable goals for the year. Vice-presidents solicit input from their constituents prior to the formal retreat. This retreat provides an opportunity for planning and directing those activities linked to the goals. Once finalized, goals are shared throughout the University. Throughout the year, quarterly reports monitor, evaluate, and report progress. Many forms of information sharing are utilized including: town meetings; focus groups; forums and summits. These meetings are held across campus and involve various constituent groups. Strategic planning at vice-presidential and college levels coordinates the University’s resource allocations to best support and achieve institutional goals. The President’s Advisory Board and the President’s Board of Visitors are composed of stakeholders from alumni groups, industry, and leaders from the state and nation. College and departmental advisory groups provide feedback to the senior administrative team. The commitment to University goals is reflected in the consistent reporting of progress in each area. President’s Report Cards are prepared and distributed to the Board of Trustees, the President’s Advisory Board, the Board of Visitors, and to community leaders. This open process ensures that all areas of the University share in the planning and evaluation process. The commitment of senior leaders to organizational values is reflected in many activities undertaken by the President and senior leaders. In April 2011, the Board of Trustees approved the 2020 Road Map that guides the University strategic planning process described in Category 2. The Objectives of the Road Map are: To invest in four strategic priorities:
• Enhance student quality and performance • Provide engagement and leadership opportunities for all students • Attract, retain and reward top people • Build to compete — facilities, infrastructure and technology

18
III.1.2 Create Sustainable Organization A sustainable organization must have core values that support the achievement of its vision. At Clemson, all planning priorities are linked to University goals and clearly aligned with funding strategies. Road Map filters provide measurement of programs, and allow decisions to be weighed in support of any designated program or activity area. Those programs or activities supportive in achieving the vision will be given proper consideration for funding. III.1.3 Promote and Support Legal and Ethical Environment The senior leaders support an environmental model of legal and ethical behavior, promoting accountability at all levels including fiscal, legal, and regulatory. This is a central tenet of all levels of the administration. The General Counsel’s office serves on the President’s leadership team regarding legal or ethical issues. III.1.4 Create Learning Environment Organizational and workforce learning thrive at Clemson University. This is a direct result of Clemson’s institutional values as reflected in the Planning Principles. These guiding principles buttress the program planning priority of ‘increase resources and promote good management’. This principle provides an environment for enhanced organizational and workforce learning that is supported by both planning processes and institutional priorities. III.1.5 Promote Development of Future Leaders Senior leaders are offered opportunities for on-going professional development, and funding is available to attend and present at professional meetings. Faculty administrative fellowships are available, and senior leaders encourage faculty participation that affords interaction with peers. It further allows future leaders the experience of interacting in a professional and ethical setting that is

19
reflective of best practices. Mentoring programs provide valuable information and training in succession planning and development of future leaders. Each year the University supports participants at the Executive Institute sponsored by the South Carolina Budget and Control Board. III.1.6 Communicate, Motivate, Reward and Recognize Consistent with the goals of the 2020 Road Map, Clemson employs multiple communication channels and technologies, but no prescribed structure for dissemination. Information to engage, motivate, and empower is typically delivered by the President or one of the three vice-presidents. Paper communication has been replaced for the most part by electronic messaging or Web postings. The EPMS process links the goals of the employee to the University goals. Each employee has the opportunity to identify how one’s job duties link directly to University goals and how they contribute to the accomplishment of those goals. Evaluation and merit-based rewards provide recognition of performance related to personal goals. Faculty Awards and Staff Awards offer the Board of Trustees the opportunity to recognize outstanding contributors on an annual basis. III.1.7 Evaluate Senior Leaders The evaluation form for State Agency Heads is published by Human Resources and used by the Trustees to evaluate the performance of the chief executive officer. There is a university-wide system of annual evaluation of academic administrators holding faculty rank, and for other high-level administrators holding unclassified positions. Annual evaluations of chairs and deans are conducted in addition to the required Faculty Manual schedule, and are confirmed by an audit of the Provost and dean’s offices. Similar results are available in the President’s office and the offices of all vice-presidents. III.1.8 Use Performance Measures The University is committed to the evaluation process and to making data-informed decisions. Specific, measurable goals have been identified for each planning priority, and progress toward these goals are reported in the President’s Report Card. III.1.9 Address and Anticipate Adverse Impacts The 2020 Road Map planning process identified programs and services that will contribute to Clemson’s ability to achieve its Vision. However, the design is not focused solely on items that require improvement or enhancement. The process also seeks to sustain programs and services of excellence. Table III. 2.4-1 aligns Clemson’s assessment of priorities with Category 7 reporting areas, which includes other measures. III.1.10 Support and Strengthen Involvement in Community The 2020 Road Map goals includes a specific goal of serving the public good. In addition, the other two goals also address Clemson’s commitment to being a force for positive change to have a significant impact on social and economic development. The three goals of the 2020 Road Map are: • to provide talent for the new economy by recruiting and retaining outstanding students and faculty
and providing an exceptional educational experience grounded in engagement; • to drive innovation, through research and service, that stimulates economic growth and solves
problems; • to serve the public good by focusing on emphasis areas that address some of the great challenges
of the 21st century — national priorities such as health, energy, transportation and sustainable

20
environment. Senior leaders are involved in many community-based projects and activities such as town-gown relationship with the City of Clemson. Campus and city police departments work closely to develop programs that address student life issues affecting the campus and surrounding communities. One such life issue is promoting alcohol awareness in an effort to reduce underage drinking and improve safety. The University actively participates in community activities in Greenville and Anderson such as community groups and chambers of commerce. Leaders speak at luncheons, dinners, meetings and other invited activities. They are active in several professional organizations, and hold elected offices. President James F. Barker served on the Division I Committee of the NCAA Board of Directors, three of those years as chair. He has chaired the Southern Association of Colleges and Schools Commission on Colleges (SACSCOC), and led the ACC Council of Presidents during the league’s expansion to 12 schools. President Barker delivered a keynote address on CU-ICAR at a 2009 symposium in Washington D.C. on Global Best Practices in science and technology parks sponsored by the U.S. National Academy of Sciences, and at the Society for College and University Planning in October 2010. Provost Doris Helms chaired the University Center of Greenville. Provost Helms has served on the Board of Directors of APLU (formerly NASULGC) for many years. She was the chairperson of the Voluntary Accountability Committee and was instrumental in the development of the VSA/CollegePortrait. Faculty and students are engaged in community service activities, service learning, K-12 and other programs. III. Category 2 – Strategic Planning III.2.1 Strategic Planning Process a. Strengths, weaknesses, opportunities and threats The institution’s strategic plan is based upon Clemson’s 2020 Road Map, which is built upon its recognition of the institution’s strengths and with a sound structure to succeed in meeting the Road Map goals. The planning parameters include serving more South Carolina residents as undergraduate and graduate students, increasing transfer students from the technical college system, and increasing opportunities for students to engage in leadership and co-operative work experiences and study abroad. Road Map Filters are strengths against which decisions can be measured, offering the opportunity to review the plan and make necessary adjustments. Filters allow Clemson to use its strengths to design a strategic plan, budget to the plan, and implement opportunities for reaching its objectives to enhance intellectual and economical development. All known risks such as financial, regulatory or other risks are always considered. Priorities are established to guide responsible and responsive decisions. Strategic plan filters align with the key elements of this report as noted below. b. Financial, regulatory, societal, and other potential risks Potential risks include long-term organizational sustainability and organizational continuity in emergencies. Fiscal resources, physical resources, and human resources are important areas of concern in emergency planning. These are addressed strategically as well as in operational plans and policies. Further support for continuity lies in legislative pieces, the strength and commitment of the Board of Trustees, prudent financial investments, and on-going evaluation of current policies and practices. Vigilance is maintained by using accountability measures that encourage recognition and attention to areas that may be problematic.

21
Filter: Safe and Well Campus Environment Safety (police, fire, EMS, traffic) Crisis management
Filter: Personal health Personal health and fitness Competitive athletics Leadership development
c. Shifts The recognition of shifts in technology, demographics, markets, and competition are the basis of 2020 Road Map. Strategies in the plan have purposely been developed to assure Clemson’s competitive edge by implementing an enrollment management plan and investing in academic resources. Emphasis on science and technology within the framework of a broad, well-rounded education that includes languages and arts further assure this competitive edge. Filter: Intellectual and Economic Excellence

22
Emphasis Areas Niches Centers and Institutes Ranked Ph.D. programs Relevant undergraduate research Centers of Economic Excellence (CoEE)
Filter: Successful Undergraduate and Graduate Students
High quality students Increased retention and graduation Global thinkers, leaders and entrepreneurs Good communicators Multicultural understandings and ethical behavior
Filter: Enhanced Reputation, Resources and Relationships
Improved awareness and reputation Improved development result
d. Human resource capabilities and needs One of the four objectives of the 2020 Road Map is to attract, retain, and reward top people. To attain this objective human resource needs must be critically examined. As faculty begin retiring, positions are reallocated to the strategic emphasis areas. The clear emphasis areas allowed Clemson to pursue opportunities offered by state incentive programs (scholarships, endowed chairs or infrastructure funds). Filter: Outstanding Faculty
Increased faculty resources Research and teaching support Increased percentage of faculty with terminal degrees Increased outreach and service to the community and state
Filter: Professional Staff
Recruitment and retention of high quality staff Strategic compensation levels Development of appropriate applicant screening programs
e. Organizational sustainability and continuity in emergencies The University has developed a plan of action for pandemic situations to protect both students and faculty in the event of a crisis. An RFP has been developed to address financial continuity in the event of a major crisis. Additional safety and health procedures have been developed and implemented. Filter: Quality Facilities and Infrastructure
Protecting and improving university infrastructure (Buildings, Technology, Utilities) Building infrastructure for current and next generation competitiveness
f. Plan implementation

23
The ability to execute the strategic plan lies in: Clemson’s unique form of governance; public-private partnerships; the land-grant mission; budget decisions that have been made to further the plan; the Road Map; and strategic investments in faculty, IT, the Academic Success Center, research and academic facilities, the libraries, and the graduate school. Filter: Competitive Organization
Maximized return on investments Efficient resource use Professional management/administration Assessment and accountability Governmental Affairs
The 2020 Road Map and the planning priorities derived from it are designed to deliver a top-20 educational experience to all students and to drive economic development for South Carolina. Clemson intends to successfully integrate the two. III.2.2 Strategic Objectives Address Strategic Challenges Clemson’s planning process addresses our strengths, weaknesses, and opportunities with a sincere desire to capitalize on those qualities that enhance the institution. This planning process is designed to reduce, change, or modify any limiting qualities. For example, financial and regulatory risks continue to be strategically addressed. Table III.2.2-1 displays the assessment of priorities of its current strategic plan, integrated into the general assessment of key strategic objectives for the academic year. Table III.2.2-1 Key Strategic Objectives
Program Number and
Title Supported, Organization, Strategic Planning, Goal/Objective
References for Performance Measures*
ACADEMICS, RESEARCH AND SERVICE I.A.
Educational and General-Unrestricted
1. Excel in teaching, at both the undergraduate and graduate levels. 2. Increase research and sponsored programs to exceed $100 million a year in research support. (This goal has been met and raised to $150 million.) 3. Set the standard in public service for land-grant universities by engaging the whole campus in service and outreach, including a focus on strategic emphasis areas. 4. Foster Clemson’s academic reputation through strong academic programs, mission-oriented research and academic centers of excellence, relevant public service and highly regarded faculty and staff. 5. Seek and cultivate areas where teaching, research and service overlap. 2020 Road Map Goal: to drive innovation, through research and service, that stimulates economic growth and solves problems
7.1, 7.2, 7.4
7.1, 7.4
7.1, 7.6
7.0, 7.4, 7.5
7.1, 7.4, 7.5

24
I.A. Educational and General-Unrestricted (continued)
EDUCATIONAL RESOURCES 1. Successfully complete our current capital campaign and a subsequent one.
7.3
2. Rededicate our energy and resources to improving the library. 7.4
3. Increase faculty compensation to a level competitive with top-20 public universities.
7.5
4. Increase academic expenditures per student to a level competitive with top-20 public universities.
7.5
5. Manage enrollment to ensure the highest quality classroom experiences. 2020 Road Map Strategic Objectives:
• Enhance student quality and performance • Provide engagement and leadership opportunities for all students • Build to compete — facilities, infrastructure and technology
7.2, 7.5
CLEMSON’S NATIONAL REPUTATION 1. Promote high integrity and professional demeanor among all members of the University community. 2. Establish a Phi Beta Kappa chapter. 3. Have at least two Clemson students win Rhodes Scholarships.
7.5, 7.6
7.5 Completed
7.5
STUDENT PERFORMANCE 1. Attract more students who are ranked in the top 10 percent of their high school classes and who perform exceptionally well on the SAT/ACT.
7.1
2. Promote high graduation rates through increasing freshman retention, meeting expectations of high achievers and providing support systems for all students. 3. Promote excellence in advising.
4. Increase the annual number of doctoral graduates to the level of a top-20 public research university.
5. Improve the national competitiveness of graduate student admissions and financial aid. 2020 Road Map Goal: to provide talent for the new economy by recruiting and retaining outstanding students and faculty and providing an exceptional educational experience grounded in engagement
7.1
7.2
7.1
7.1

25
4. Send student ensembles to perform at Carnegie Hall. 5. Have at least two Clemson faculty win recognition by national academies. 6. Publicize both national and international accomplishments of faculty, staff and students. 2020 Road Map Goal: to provide talent for the new economy by recruiting and retaining outstanding students and faculty and providing an exceptional educational experience grounded in engagement;
Completed
Completed
7.4,7.5
ACADEMICS, RESEARCH AND SERVICE
I.B. Educational and General-
Restricted
2. Increase research and sponsored programs to exceed $100 million a year in research support. (This goal has been met and raised to $150 million.) 2020 Road Map Goal: to drive innovation, through research and service, that stimulates economic growth and solves problems
7.1, 7.4,7.5
CAMPUS LIFE
II.A. Auxiliary
Enterprises-Unrestricted
1. Strengthen our sense of community and increase our diversity. 2. Recognize and appreciate Clemson’s distinctiveness. 3. Create greater awareness of international programs and increase activity in this area. 4. Increase our focus on collaboration. 5. Maintain an environment that is healthy, safe and attractive. 2020 Road Map Strategic Objective: Build to compete — facilities, infrastructure and technology
7.2,7.6
7.2
7.5, 7.6
7.4, 7.5
7.2, 7.5
CLEMSON’S NATIONAL REPUTATION 7. While maintaining full compliance, achieve notable recognition with another national football championship, two championships in Olympic sports and two Final-Four appearances in basketball.
III.C.
Employee Benefits-State
Employer Contributions
Provided benefits for employees 2020 Road Map Strategic Objective: Attract, retain and reward top people
7.5

26
III.2.3 Evaluation and Improvement of Strategic Planning Process Strategic planning is a dynamic process by which modifications or improvement may be made as needed. Improvements are made to assure that the process is both effective and efficient. Planning phases typically identify specific elements that may need improvement. These include goals, measurable outcomes/benchmarks/objectives, related funding sources(s), individuals responsible for implementation of policies, and methods to assess accomplishments. Dissemination of the strategic plan and its related assessments creates opportunities for participants and stakeholders to provide feedback. III.2.4 Action Plan and Resource Allocation and III. 2.6 Benchmarks and Measures of the Plan In 2008, the Board of Trustees set the framework for the planning parameters by accepting specific guiding principles and filters. Data supporting new as well as old initiatives were examined in the light of the filters. The outcome of ‘filtering’ then produced the first draft of a 5-year Road Map to which external and internal funding would apply. The Program Planning Priorities and the funding strategies are primary elements in the current process. Some of the funding strategies include reallocation to strategic priorities, tuition and fees, state appropriations, grants and contracts, fund raising/endowments/corporate, PSA, generated revenue, and direct federal funding. Table III.2.4-1 Assessment of Priorities Economic Development Planning Priorities University Goals Benchmarks Goals Emphasis Areas Niches (III.7.1)
Seek and cultivate areas where teaching, research and service overlap.
Implement the Centers of Economic Excellence approved by the state.
50% of seniors and 70% of graduate students in STEM disciplines will report participating in a learning experience at a CoEE. (Table III.7.1-8)
Increase the annual number of doctoral graduates to the level of a top-20 public research university.
Increase graduate enrollment in emphasis area graduate programs.
150 doctoral candidates will complete degrees annually. (Table III.7.1-4)
Intellectual Development Planning Priorities University Goals Benchmarks Goals Quality Instruction and Support (III.7.1)
Excel in teaching at both undergraduate and graduate level.
Increase MAPP Critical Thinking, Writing Level 3, and Math Level 3 senior proficiency scores.
60% of seniors will score proficient by 2013. (Tables III.7.1-13)
Living and Learning Communities (III.7.5)
Promote excellence in advising.
Provide an environment that contributes to the living and learning interaction.
Increase freshmen to sophomore retention to 95%. (Table III.7.1-3, Table III.7.5-4)
Improve student advising regarding curriculum requirements.
Gap between importance and satisfaction will drop below 0.50. (Table

27
III.7.5-6a) Improve student
registration for classes. Gap between importance and satisfaction will drop below 0.50. (Table III.7.5-7)
Improve student perception that faculty are available, helpful, or sympathetic.
70% of students will report an improved perception. (Table III.7.2-3k)
Engagement (III.7.2) Seek and cultivate areas where teaching, research and service overlap.
Increase the number of undergraduate students working with faculty on scholarly activities.
60% of seniors will report working with a faculty member. (Table III.7.1-8, Table III.7.2-3c. Table III.7.2-3e)
Manage enrollment to ensure the highest quality classroom experience.
Increase the number of classrooms supporting innovative teaching strategies.
60% of seniors will report satisfaction with teaching strategies. (Table III.7.2-3, Table III.7.5-8)
Community and Connectivity (III.7.6)
Strengthen our sense of community and increase our diversity.
Increase inclusion of diverse perspectives in undergraduate course work.
80% of students will report this occurs (Table III.7.6-1)
Increase opportunities for serious conversation with students of different race or ethnicity.
80% of seniors will report this occurs often. (Table III.7.6-2)
Improve our student/staff interactions.
75% of students will report satisfaction with staff interactions. (Table III.7.2-3j)
Create greater awareness of international programs and increase activities.
Increase student participation in study abroad.
30% of undergraduate students will have an international experience. (Table III.7.6-3)
Planning Priorities University Goals Benchmarks Goals Information Technology (III.7.5)
Rededicate our energy and resources to improving the library.
Improve the quality of IT programs and services.
Faculty report satisfaction equal to or greater than peers. (Table III.7.5-9)
Financial Access (III.7.3)
Improve the national competitiveness of graduate student admissions and financial aid.
Improve the quality of graduate students.
Faculty report satisfaction equal to or greater than peers. (Table III.7.4-5a)
Successfully complete our current campaign and a subsequent one.
Benchmarks to be set by Leadership Team.
Increase Resources and Promote Good
Increase faculty compensation to a level
Manage workloads to promote retention of
Faculty report satisfaction equal to or

28
Management (III.7.5) competitive with top-20 public universities.
quality faculty. greater than peers on the expectations for tenure. (Table III.7.4-5e)
Publish established guidelines for teaching, research, service and economic development that promote faculty success.
Faculty report satisfaction equal to or greater than peers on teaching obligations. (Table III.7.4-5g)
Provide childcare for faculty and graduate students.
Faculty report satisfaction equal to or greater than their peers related to family life and childcare (Table III.7.4-5b, c)
Support opportunities for faculty to interact with colleagues.
Faculty report satisfaction equal to or greater than their peers related to collegiality. (Table III.7.4-5h, i)
Regulatory and Legal Compliance, Unfunded Mandates and Inflation (III.7.6)
Promote high integrity and professional demeanor among all members of the University community.
Meet all required standards at the highest level.
Maintain full accreditation, and compliance with state and federal agencies. (Table II.5-1)

29
III.2.5 Communicate and Deploy Strategic Objectives, Action Plans and Performance Measures Dissemination of information is both formal and informal. Integrating the communication within the Administrative Council in conjunction with efforts of the three vice presidential areas, programs and services are implemented in line with the desire and direction of the Board of Trustees. The responsible department or program area deploys strategic initiatives. Clemson trusts and relies on each responsible entity to fulfill its goals of the University. Institutional effectiveness and accountability are important elements of Clemson’s culture, and were incorporated in the 2008-2013 Planning Process. III.2.7 Location of Strategic Plan The current Academic Plan is located on the Provost’s web site: http://www.clemson.edu/provost/documents/cuacademicplan.pdf. The vision, mission, and strategic university goals are found on the President’s home page: http://www.clemson.edu/president/goals.html. Details of the Clemson 2020 Road Map may be found at: http://www.clemson.edu/2020/ III. Category 3 – Student, Stakeholder, and Market Focus III. 3. 1 Program Identification Clemson University continuously assesses student needs and program success. As a result of the analysis of these assessments, Clemson implements processes for continuous program improvement. Having adopted a limit on undergraduate enrollment, the numbers and types of services and academic programs are aligned with the demands of the students and marketplace. Evidence such as the number of graduates, the enrollment, employment after graduation, and community and industry input are considered when examining programs. Clemson endeavors to provide students with the finest educational, financial and personal attention thereby promoting their best performance, creativity, and productivity. Organizational stability through systematic planning and evaluation builds strong educational programs, and an environment nurturing graduate loyalty and satisfaction. III.3.2 Collect Information for Student and Stakeholder Needs and Expectations Decisions concerning program modification are made after critical evaluations have occurred such as ensuring that the proposed change is congruent and furthers identified institutional objectives; appropriate funds are available to support the proposed change; and actual outcomes are consistent with desired outcomes. There are three integrated components to enhance institutional effectiveness: collect and analyze information, use information for improvement, and obtain feedback to determine if modifications or enhancements have effectively addressed any concerns, needs, or other critical issues. Table III.3.2-1 displays an institutional effectiveness model that integrates processes, initiatives, and data. Table III.3.2-1 Continuous Improvement for Institutional Effectiveness
30
Processes The Institutional Assessment Records, Professional and regional accreditation, Program
review, Annual Budget Plan, Discovery Council, President’s Report Card Strategic Initiatives
Enrollment management model (allows Clemson to integrate student enrollment with institutional capacity), Program and Capital Budget allocations, Academic Emphasis Areas, University and Academic Roadmaps (people and programs, operations, and infrastructure)
Data Triangulation
Multiple sources of data to support informed decision –making.
Faculty Productivity
Faculty Activity System Data, Research productivity, papers, honors & awards, collaboration, Collaborative on Academic Careers in Higher Education (COACHE) Survey, Faculty Surveys
Student Satisfaction
Departmental & university alumni surveys, Student Satisfaction Inventory (SSI), Housing Survey (EBI), Campus Safety Walk, Library evaluation (LibQUAL+), program advising, National Survey of Student Engagement (NSSE); Legacy applications; % Alumni Contributing
Student Success
Graduation rates, Participation in Creative Inquiry, class size, program review, persistence, graduate student enrollment, graduate theses and dissertations, scholarships / fellowships (NSF, National Defense Science and Engineering, Hertz, Marshall, Goldwater, etc.), ETS Proficiency Profile, Summer Reading, e-Portfolio, Living and Learning Communities
External Measurements
National or regional achievements; grants or other external funding, Program or Regional Accreditation
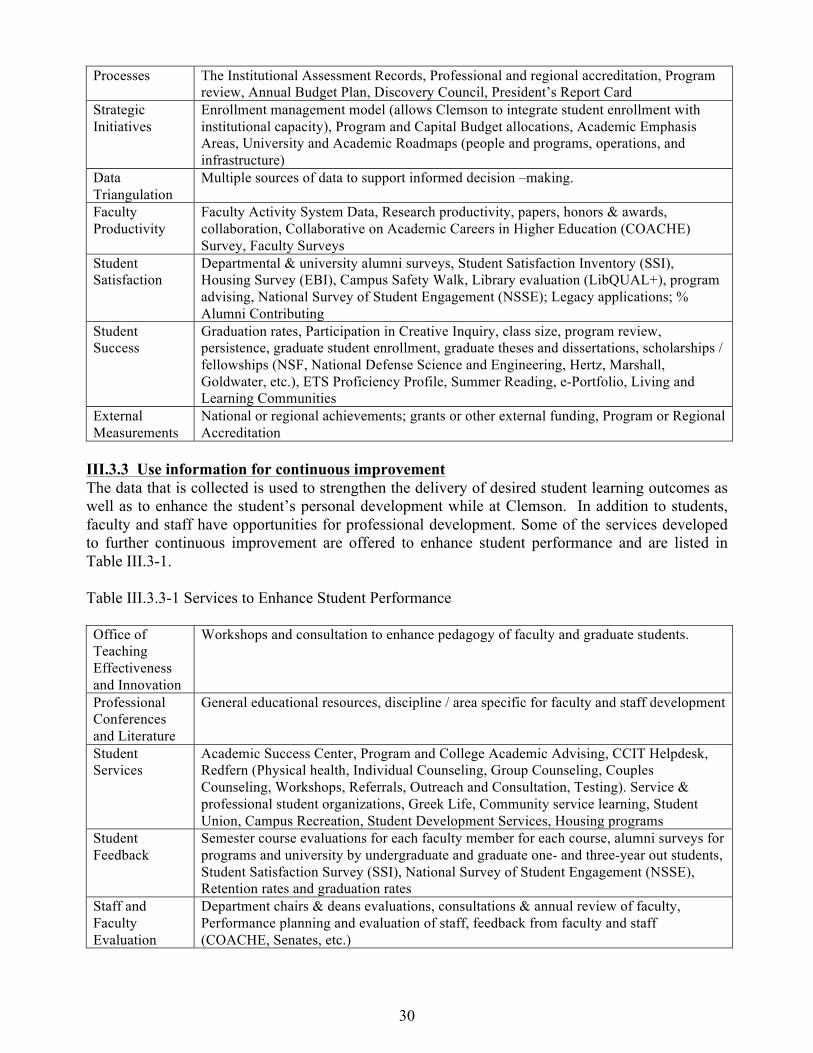
III.3.3 Use information for continuous improvement The data that is collected is used to strengthen the delivery of desired student learning outcomes as well as to enhance the student’s personal development while at Clemson. In addition to students, faculty and staff have opportunities for professional development. Some of the services developed to further continuous improvement are offered to enhance student performance and are listed in Table III.3-1. Table III.3.3-1 Services to Enhance Student Performance Office of Teaching Effectiveness and Innovation
Workshops and consultation to enhance pedagogy of faculty and graduate students.
Professional Conferences and Literature
General educational resources, discipline / area specific for faculty and staff development
Student Services
Academic Success Center, Program and College Academic Advising, CCIT Helpdesk, Redfern (Physical health, Individual Counseling, Group Counseling, Couples Counseling, Workshops, Referrals, Outreach and Consultation, Testing). Service & professional student organizations, Greek Life, Community service learning, Student Union, Campus Recreation, Student Development Services, Housing programs
Student Feedback
Semester course evaluations for each faculty member for each course, alumni surveys for programs and university by undergraduate and graduate one- and three-year out students, Student Satisfaction Survey (SSI), National Survey of Student Engagement (NSSE), Retention rates and graduation rates
Staff and Faculty Evaluation
Department chairs & deans evaluations, consultations & annual review of faculty, Performance planning and evaluation of staff, feedback from faculty and staff (COACHE, Senates, etc.)

31
III.3.4 Determine Stakeholder Satisfaction Stakeholder satisfaction is determined through many means depending upon the nature of the service, activity, or outcome to be evaluated. In Table III.3.3-1, strategies to collect information are listed. Clemson receives expert input from industrial advisory boards, committees and boards serving the President, and other external agents. Input may be solicited as well as volunteered. All communications from stakeholders is considered useful and examined in light of the strategic plan. III.3.5 Build Positive Relationships Attracting and retaining students is important in all areas of the academic community. Data collected is analyzed to help students succeed inside and outside of the classroom. Table III.3.5-1 provides examples of the many services and programs that are available to our students. An annual assessment activity (as recorded in WEAVEonline®) determines the extent to which the programs meet the desired goals. Table III.3.5-1 Synergistic Services to Attract and Retain Students Holistic Opportunities and Services
Academic Success Center, Redfern Health Center, secular opportunities, Fike Recreational Center and intramural programs, personal review of available financial aid (needs based grants, community scholarships, LIFE scholarships, Tiger Pool/Student Employment, assistantships)
Community and Social-based Engagement
Service & professional student organizations, Greek Life, Community service learning, Student Union, Campus Recreation, Student Development Services
Expanded Educational Boundaries
Collaboration with industries and community agencies (practicum, internship & co-operative learning), international programs & travel abroad
Clemson strives to build strong relationships with students that lead to satisfaction and loyalty. Integrated policies and practices employed by Clemson University ensure organizational stability and continuous improvement to enhance quality. III 3.6 Student, Stakeholder, and Market Focus Clemson University students, faculty and permanent staff have informal and formal methods available for resolving concerns and complaints whether academic or employment-related. The information below is a summary of the available procedures.
Undergraduate Students
Undergraduate students are encouraged to seek the assistance of the Ombudsman to resolve complaints and conflicts informally. The Ombudsman’s Office provides an independent, neutral, point of view in an informal and confidential environment for faculty members, graduate students, postdocs, undergraduate students and staff to discuss their concerns. For more information about the services of the Ombudsman or to request assistance, contact the Office of the Ombudsman at (864) 656-6353 or by e-mailing [email protected].
For those matters that cannot be resolved informally or with the assistance of the Ombudsman, the Academic Grievance Committee may hear grievances regarding:

32
• Complaints of discrimination in academics (excluding student employment) against a faculty or staff member based upon race, sex, religion, national origin, age, disability, sexual orientation or other legally protected status;
• Complaints of a personal or professional nature involving an individual undergraduate student and a faculty member;
• Claims of inequitable final grades; and • Claims of unfair treatment in an attendance related issue.
Detailed rules and procedures for filing an academic grievance, including important time periods and appeal rights, are set forth in the Undergraduate Announcements.
Graduate Students
Graduate students are encouraged to seek the assistance of the Ombudsman as an informal method for resolving complaints, problems and conflicts. For more information or to request assistance, call (864) 656-6353 or e-mail [email protected].
For matters that cannot be resolved informally or with the assistance of the Ombudsman, the Graduate Student Academic Grievance Committee may hear grievances regarding:
• complaints of a personal or professional nature involving an individual graduate student and a faculty member;
• claims of inequitable final grades; • cases involving graduate student employment; and • cases involving graduate student academic dishonesty.
Detailed rules and procedures for filing an academic grievance, including important time periods and appeal rights, are set forth in the Graduate Announcements.
Faculty
The Faculty Senate, through the Provost, provides an Ombudsman to help resolve disagreements or faculty issues before they reach the formal grievance process. The Ombudsman, a professor knowledgeable about the grievance process, may be reached at (864) 656-6353 or at [email protected].
For those matters that cannot be resolved through informal methods or with the assistance of the Faculty Ombudsman, there are two grievance procedures available to faculty members and academic administrators with faculty rank – Faculty Grievance Procedure I (GP-I) and Faculty Grievance Procedure II (GP-II). GP-I is reserved for grievances regarding:
• the dismissal or termination of tenured faculty; • the dismissal or termination of non-tenured faculty prior to the expiration of their
“employment” contract; • complaints of discrimination based upon race, sex, religion, national origin, age, disability,
sexual orientation or other legally protected status; and • complaints by non-tenured faculty that violations of academic freedom significantly
contributed to a decision to cease, in any manner, his/her appointment with the university.

33
GP-II is available for grievances not covered by GP-I, such as complaints of inequitable work assignments, unfair performance reviews, or improper implementation of policies and procedures.
Grievance counselors appointed by the Faculty Senate advisory committee are available to assist faculty in understanding which grievance procedure to use; however, they do not have the authority to render a decision on the merits of the grievance. For more detailed information regarding the Faculty Grievance Procedures, including important deadlines and the right to appeal, please refer to the Part V of the Faculty Manual.
Staff
Employees are encouraged to meet with their immediate supervisor in an effort to resolve any complaint informally. Alternatively, staff may wish to work with the Staff Ombudsman at http://www.clemson.edu/ombudsman to resolve complaints and conflicts informally. For more information about the Staff Ombudsman or to request assistance, call (864) 656-5353 or e-mail [email protected].
When informal resolution is not possible, permanent, non-faculty employees may seek resolution for adverse employment actions through the University's Employee Grievance Procedure. An "adverse employment action" means a demotion, including involuntary reassignment, salary decrease based on performance, suspension or termination. For more detailed information regarding the Employee Grievance Procedure, including important deadlines and the right to appeal, please refer to the Clemson University Personnel Policies and Procedures Manual.
Athletic coaches and employees in temporary, temporary grant and time-limited positions do not have grievance rights.
III. Category 4 – Measurement, Analysis, and Knowledge Management III.4.1 Strategy to Select Measures Clemson University’s performance is enhanced by processes and systems designed to strengthen all aspects of the institution. Data selection, analysis, and tracking methods, and measurements of progress are evaluated by external and internal standards. Data is collected by student performance on tests for professional accreditation standards, such as PRAXIS and NCLEX, ethical protocols for research such as CITI certification, and standardized nationally administered tests such as the ETS Proficiency Profile. Clemson relies on quantitative and qualitative data in making judgments about student and stakeholder needs, institutional effectiveness, and reporting to numerous external agencies, commissions and boards. In addition to institutional level data, each area collects, analyzes, and uses specific data relevant to the outcomes being measured. III.4.2 Strategies to Ensure Useful Data Data is used to measure the effectiveness of all areas: academic and administrative. Data from other institutions is used to provide comparison measures. The measures and the benchmarks are constantly updated to reflect best practices and quality standards in the field of assessment. For example, in Table III.2.4-1 Assessment of Priorities, each method of collecting data is relevant to the area being evaluated and is specifically designed to reflect Clemson’s needs. Based on the critical decisions that must be made using the results of the data, it is imperative that the sources of the data are accurate, appropriate and useful.

34
III.4.3 Process to Keep Measures Current The on-going strategic planning activities, the use of assessment data by departments and program areas, annual reports, individual evaluations, and other systematic reviews require that the best sources of data be used for evaluation. Consultants and professional conferences and publications provide insight into current practices. Clemson University continues to examine best practices and revise processes of data collection when necessary. III.4.4 Identify and Use Comparative Data Comparative data is gained by using surveys and standard assessment protocols used by others. The Collaborative on Academic Careers in Higher Education (COACHE) allows Clemson to select a peer group from participating institutions for comparison. Clemson University participated in the 2011-12 administration of COACHE. Clemson also participates in a national survey on faculty salaries prepared by Oklahoma State University and departmental standards developed by the University of Delaware. Both surveys provide national comparisons that can be used for data analysis. Clemson University participates in the Chronicle of Higher Education’s “Great Colleges to Work For” survey .The National Survey of Student Engagement (NSSE) and the Student Satisfaction Inventory (SSI) provide national comparative information as reported by the students. Also, the data from alumni surveys is used for comparisons. Table III.4.4-1 Comparative Data
Instruction • Quality of the Freshmen class (SAT, top 10% of high school class, acceptance rate), Freshmen to 2nd year; 2nd year to 3rd year, overall retention rate of first-time full-time Freshmen, 6-year graduation rate, and percent of classes under 20 and over 50
• Percentage of full-time faculty, faculty with terminal degrees, and faculty-student ratio
• Student learning as reported in annual Assessment Reports • Student opinion reported in alumni surveys of one-and three-year out graduates • Student satisfaction with degree programs, advising, and services • Reported engagement in academic practices • Performance on examinations (NCLEX, PRAXIS, FE etc.)
Research
• Revenues to fund infrastructure development • Number of undergraduate and graduate students engaged in research, independent
study, Creative Inquiry, capstone experiences (internships, co-op programs), etc. • Research activities related to economic development outcomes • Participation in Research Week/Month to highlight student and faculty research
activities • Number, type, and amount of sponsored research activities (grants, papers given,
and articles published) Public Service • Number and type of Community Service grants summarized by the level of
activities by students • Service learning in the classroom (electronic portfolio and program specific
evaluation strategies) • Student organization communities • Faculty service activities including lectures, concerts, conferences, special
programming, and other activities in which the student, faculty, and staff are available to the citizens of the state

35
Academic Support
• Graduation rates for undergraduate and graduate students • Opportunities for student success as noted by participation in Academic Success
Center tutoring, supplemental instruction, and study groups • Library activities, services, and use • Other support systems that optimize the opportunity for an individual to complete a
degree program, engage in campus activities, and grow as an individual • Student satisfaction with degree programs, advising, and services
Student Services
• Student programs • Leadership development activities for students engaged in student government • Opportunities for international activities, including study abroad • Student Satisfaction with student services including offices of admissions and
registrar and those activities whose primary purpose is to contribute to the student's emotional and physical well-being and to his/her intellectual, cultural, and social development
Institutional Support
• Cost of institutional support is assessed at a benchmark level and is reported as a percent of total E&G budget
• Efficient and effective administration in the implementation of the University's Goals and related activities that are important to the operation of a research university (i.e. President's Office, the Provost's Office, the General Counsel, Research, Business Office, Human Resources)
Scholarships and Fellowships
• Annual reports of scholarships and fellowships document distribution of funds • Needs based grants and community scholarships • Financial aid services to undergraduate and graduate students • LIFE scholarship retention rates • Number/percentage of Undergraduate students in the top 10 percent of their high
school classes • Number/percentage of Undergraduate students who perform exceptionally well on
the SAT/ACT Plant Operations • Progress on deferred maintenance
• Progress on preventive maintenance program • Report LEED certification program • Reports from students on the quality of the campus environment including the
Student Satisfaction Inventory Intercollegiate Athletics
• Graduation rates • Win/loss records in competitive sports • Compliance status
Auxiliary Services
• Annual surveys of Food Service satisfaction • Provide wholesome and attractive food service options to the students • Continue to seek out and award competitive privatized contract for bookstore to
meet the needs of the students to include availability of materials, reasonable costs, and convenience
• Self-supporting status with positive fund balance • Effective provision of non-educational services to the students, employees and the
public Municipal Services: court, fire protection
• Advisory boards and committee feedback • First response arrival within 4 minutes to scene • Monitor customer service feedback and reports • Increase in on-line activity and reduction in customer complaints

36
Center for Advanced Engineering Films and Fibers
• Number of graduate students involved in center activities • Graduation rates • Sponsored research activities (grants, papers given, and articles published)
Center for Wireless Communication
• Number of industry participation • Number of graduate students involved in center activities • Graduation rates • Sponsored research activities (grants, papers given, and articles published)
Center for Optical Materials Science and Engineering Technology
• Number of graduate students and graduation rates • Sponsored research activities in form of grants, papers given, and articles published • Development of technology-based new ventures, improved competitiveness of
existing firms, and wealth creation in the region III.4.5 Measurement, Analysis, and Knowledge Management Ensure Data Quality Clemson University provides data to its workforce, students, and stakeholders in an efficient and accessible environment. There are multiple data resources, including: (A) Institutional Research: The Office of Institutional Research serves as a comprehensive source for information about Clemson University. Some sources of data available on the IR website are:
• Mini Fact Book • The Clemson Fact Book • Historical Enrollment • Selected Presentations, Reports and Analyses • Common Data Set (information about Common Data Sets) • Historical Tuition and Fees • FAS–Faculty Activity System, tracks faculty credentials, publications, conference
presentations etc.
In addition, Institutional Research can provide any other information via the Request Form for Data and Mailing Lists.
(B) Student Data Warehouse: Another source of data for the workforce, students, and stakeholders is the Student Data Warehouse. The Student Data Warehouse is a web-based reporting application that provides faculty and staff with easy access to student information by semester (e.g., demographic, enrollment, and course information). Faculty and staff who require access to the Student Data Warehouse must first complete a course that provides a basic introduction to the data available. A security form must be completed and submitted to the instructor prior to attending the class to gain the appropriate access. (C) CUBS System: CUBS (Clemson University Business Systems) provides implementation and maintenance support for strategic administrative applications at Clemson. The core systems include Financials, Human Resources, Payroll, and Data Warehousing/Reporting.
(D) Blackboard: Blackboard® is Clemson University’s Learning Management System that instructors can use to deliver course content, communicate with students, enable student interaction, and provide on-line assignments and assessments. Whether the course is taught face to face, fully online, or as a hybrid, instructors can use Blackboard® to more fully engage students in learning activities while reducing some of the administrative overhead of managing a class.

37
Blackboard Features:
• Collaboration: discussion rooms, bulletin boards, blogs. • Course Content: books, documents, handouts. • Early Warning System • Keeping Students Informed: bulletin boards, mass emailing, automatic reminders, podcasts. • Measuring Student Performance: grade books, quizzes, surveys.
Data quality is assured by those who collect and use the data. The institution promotes the use of accurate and timely data in all accountability activities. Through professional development sessions, the academic community can learn how to protect and store data. Clemson Computing and Information Technology (CCIT) has developed a series of policies to guide the use of technology that will promote the responsible use of data and resources. http://www.clemson.edu/ccit/about/policies/index.html. Policies and guidelines include:
• Clemson University Policies: Delegation of Administrative Authority and Responsibility; Acceptable Use Policy For Employees; Acceptable Use Policy For Students; Userid and Password Policy
• CCIT Policies and Guidelines • User IDs and Passwords: Creating Strong Passwords • Network: CCIT Network Security Policy; Information on CCIT Provided File space • Software: CCIT Software Procedures
III.4.6 Use of Findings in Action Plans The Board of Trustees uses the President’s Report Card and other data sources to inform its decisions. Each Board of Trustees committee examines outcomes of on-going evaluations prepared as quarterly markers and judgments of policy or practices. The committees make recommendations to the full board and action plans are developed, executed, and evaluated to inform another cycle of institutional effectiveness. III.4.7 Preserve Institutional Knowledge Through the University Assessment Committee, the University Curriculum Committee, the Academic Council, the Provost’s Advisory Committee, Faculty Senate, Staff Senate, student governments, and other campus committees, boards, and councils, the institution shares and transfers best management practices, institutional memory, and program and institutional performance. Other groups address the maintenance, safety, and security of the institution. It is incumbent on each department and division to (1) acquire and utilize relevant data, (2) provide supporting evidence for decisions, recommendations, and conclusions, (3) maintain security of data, and (4) base decisions on accurate and timely data. Organizational performance review is an integrated, multi-level system of planning, evaluation, and on-going assessment to “close the loop”. Training and development are important concepts in ensuring efficient institutional procedures. One example is the “cross-training” implemented in many offices to facilitate operational continuity. In addition, policies and procedures are developed to guarantee documentation of processes. CCIT provides ongoing training opportunities for the campus in using many software systems needed to perform data analysis. The University is

38
fortunate to have invaluable resources of faculty expertise in statistics and an updated data management information system. III. Category 5 – Workforce Focus III. 5.1 Intentional Organization and Management An environment of collegiality where faculty, students, and staff work together toward common goals is an important aspect of Clemson University. The institution is organized by colleges and broad administrative groups. Colleges include academic departments that serve as home for faculty and staff. Aligned with research emphasis areas, centers and institutes across the campus create opportunities for collaboration and interdisciplinary teaching, research, and service. The academic departments and colleges align with the University Mission and Goals through their missions, plans and strategies. III.5.2 Sharing Across Departments Academic support units and institutional support units are organized by functional areas. The administration and staff at Clemson University have opportunities to develop and utilize their full potential and participate in furthering the University’s Vision, Mission, and Goals. All employees are required to align their performance with their job duties to include at least one of the University Goals. Clemson recognizes the significant role played by every employee of the University. Throughout the organization all employees, both faculty and staff, are valued and opportunities for personal and professional development are encouraged. The processes of promoting cooperation, initiative, empowerment, and innovation are inherent in the organizational culture. The “One Clemson” theme is a message provided by senior leadership to the campus. The close relationships between administrative units may be observed in many situations. Some examples are: the athletic department and the library conduct joint fund raising initiatives; Student Affairs representatives attend academic affairs meetings; the colleges collaborate in hiring faculty that can teach in two disciplines and fund centers or institutes that promote collaboration and communication with the other colleges of the University. The Clemson University Guiding Principles for Planning is another example of the University’s dedication to cooperation both within and outside the institution. III.5.3 Performance Management System The employee performance management system (EPMS) at Clemson focuses on the individual. An annual review of staff is monitored by the Human Resources Department. The President is reviewed by the Board of Trustees, and a formal agency head evaluation form is submitted to the Budget and Control Board annually following the July meeting of the Board of Trustees. All other administrative personnel are evaluated by their supervisor. Faculty members are evaluated for promotion, tenure, and post tenure through peer review of agreed upon standards of performance. Faculty who are not tenure-track are reviewed by their supervisors and a peer review team annually for reappointment. All faculty members complete an annual planning document (Faculty Activity System) with specific goals for the academic year. At the end of the year, faculty report their progress and a formal evaluation is completed. In addition, faculty qualifications or credentials are reviewed and documented with original transcripts of their degrees. III.5.4 Succession Planning

39
Succession planning is accomplished by providing opportunities for professional development to administrators, faculty, and staff. Annually, the President sends a University employee to the South Carolina Executive Leadership Institute. The representatives range from the Director of Financial Aid to the Executive Secretary to the Board of Trustees. Faculty members attend professional development programs at institutions known for preparing future leaders. Each year a faculty member is nominated for the American Council of Education (ACE) leadership program designed to prepare faculty for presidential positions. The institution provides many opportunities and resources for all employees in the “Clemson Family”. Professional development such as attending professional conferences or on campus training (computer, improving teaching skills and techniques, etc.) is available to administrators, faculty and staff. The major offices that provide training and development opportunities for administrators, faculty and staff are: the Office for Teaching Effectiveness and Innovation, Educational Technology Services, Human Resources Training and Development, Computing and Information Technology, and Clemson University Business Office. III.5.5 Training and Development Systems Address Clemson University offers orientation for new faculty and department chairs. In these orientations institutional procedures and expectations are shared with the participants. Administrative Council Retreats, Department Heads’ Retreat, Provost’s Retreats and other leadership retreats, sessions, and events are specifically designed to share organizational knowledge, ethical practices, core competencies, strategic challenges, and accomplishments of action plans. III.5.6-5.8 Performance Management System All employees are involved in annual development of goals and objectives prior to an annual evaluation. Faculty and administrators use a Clemson developed process. Faculty enter their goals and accomplishments using the Faculty Activity System (FAS). Administrators submit plans in writing. Staff members use the Employee Performance Management System (EPMS) and specify how their goals link to the university’s goals. III.5.9 Evaluation of Training and Development Systems Training and professional development opportunities are plentiful at Clemson. Training and professional development is a major topic of interest to both the Staff and Faculty Senates. Performance is assessed through the annual evaluation system (EPMS for staff, FAS for faculty). Performance and merit increases are tied to professional development and exceeding standard job performance. All training and professional development programs and activities offered on the Clemson University campus are assessed by program coordinators to ensure performance and continuous quality improvement. III.5.10 Motivation Procedures to increase employee motivation include both intrinsic as well as extrinsic measures such as: public recognition, pay increase, parking preference, release time, etc. Insight into employee motivation is obtained through surveys, focused discussion groups, Brown Bag lunches, departmental assessments, and analysis of problems or complaints. Clemson takes pride in the fact that individuals are afforded multiple channels to express concerns, make recommendations or highlight achievements. III.5.11 Methods to Obtain Workforce Well-being, Satisfaction and Motivation

40
All employees have at least one avenue of representation. There are committees and senates through which opinions can be expressed, recommendations provided to modify governance, or other appropriate actions suggested. These avenues enhance the organizational capacity to improve the productivity of the individual while meeting the needs of the institution in its endeavor to achieve the University’s Vision, Mission and Goals. Such groups include the Faculty Senate, the Staff Senate and other appointed or elected groups (President’s Commission on Black Faculty and Staff, President’s Commission on the Status of Women at Clemson, President’s Council on Community and Diversity). Individuals may address issues with their supervisors, the Office of Human Resources, Ombudsman, or other identified individuals. Formal grievance processes guide the faculty and staff in resolving issues. Formal faculty and staff surveys are conducted on a regular basis. The purpose of all assessment processes is to identify issues and to provide findings that guide decision-making in establishing priorities. Some of the methods of collecting data from faculty and staff include: Senate reports and recommendations, Faculty Activity System data, research productivity, papers, honors and awards, collaboration, Collaborative on Academic Careers in Higher Education (COACHE) Survey, The Chronicle of Higher Education’s “Great Colleges to Work For” survey and institutional faculty and staff surveys. III.5.12 Use Satisfaction for Improvement Workforce satisfaction is only one measure that is applied to the strategic planning process when considering priorities for improvement. The planning priorities of the institution are established by the Board of Trustees. Recommended programs, activities, and services are gathered by the Administrative Council from Deans, students, faculty, and staff. Through the strategic planning process these recommendations are filtered prior to consideration by the Board of Trustees. III.5.13 Safe and Secure Work Environment Specific resources promote safety and security of students, faculty, staff, students, and visitors. The voice alarm/siren system, newsletters, notices on doors regarding evacuation, cell phone emergency protocol, email correspondence regarding issues of immediate importance, and other strategies are employed to promote the safety of all who attend, work or visit the campus. The Office of Environmental Health and Safety (EHS) plays a key role at the University. Clemson University has a Comprehensive Environmental Health and Safety Plan. This Plan has been approved by the Clemson University Administrative Council, and applies to all Clemson University Faculty, Staff, and Students, as well as all activities carried out on Clemson property regardless of Clemson affiliation. EHS maintains a number of EPA/OSHA/DHEC/NRC required plans, provides training for employees, and monitors units to ensure compliance. The Disaster Management Plan has been revised and is available to the campus. In conjunction with this is the Fire and Emergency Medical department, which responds to on-campus emergency situations. III. Category 6 – Process Management III.6.1 Determining Core Competencies Maximizing student success at Clemson University is a priority. The key learning-centered processes for both academic programs and academic support services are developed, implemented, and continuously evaluated with the purpose of furthering effectiveness and efficiency in all areas. Activities must be aligned with the Strategic Plan to be funded. Since the Strategic Plan is tied

41
directly to the Vision, Mission, and Goals of the University, Clemson is assured that the competencies are comprehensive and appropriate. III.6.2 Key Work Processes Key learning-centered processes and support processes are institutionalized to maximize student success and involve a majority of the faculty and staff. The method of determining needed processes involves broad-based, comprehensive, and integrated examinations of the need as it meets or furthers the Vision, Mission, and Goals. The outcomes of initiatives and processes are evaluated and reported to the President, Board of Trustees, Provost, Deans and Department Chairs, University Vice Presidents and external constituents (press, newsletters, professional meetings/contacts). The standards for success and benchmarks for many measures are those that guide Clemson in becoming a top-20 public university and standards set by professional bodies including accreditation, national testing, and licensing. For each key learning-centered process and key academic support processes the University has identified specific expected results and measurable outcomes. III.6.3 Incorporating Input The core mission of educating students integrates academic programs, student life programs, and institutional support. New programs of study originate with the faculty whose expertise and professional knowledge of the most current activity in their fields qualifies them to be in the best position to foresee new degrees. The administration works with the faculty in determining the feasibility of a new program of study, the fit with the University mission, the financial implications, and physical needs. Needs assessments of future students, consultations with external stakeholders (industry, market forces), and others results in moving forward with new programs. The same steps are taken when programs are provided in off-campus or online locations or when enrollments are increased. The academic departments create and schedule classes according to the assessed needs of their students. Students are evaluated continuously throughout their programs of study. Students have opportunities to provide feedback routinely through end of course evaluations of instructors, surveys conducted by the University, and alumni surveys. All information is provided back to the faculty, chairs, and deans to make improvements to the teaching and learning environment. Clemson encourages new teaching strategies and faculty development in instruction and the use of technology in the classroom is provided by the Office of Teaching Effectiveness and Innovation and other agencies. The results of recent surveys demonstrate that the processes are in place and are making a difference. III.6.4 Incorporate Efficiency and Effectiveness Factors In the process design and delivery of programs and services, organizational knowledge, technology, cost controls, and other efficiency/effectiveness factors are considered. Organizational knowledge is embedded in the University’s Vision, Mission and Goals, and is reflected in the university budget process. Prior to the implementation of any program or service activity, the designing department must demonstrate a framework for support and clear educational or educational support outcomes that assist the institution in meeting its goals. The process of ensuring there are adequate budget and financial resources for current and new programs and services and that the proposal is congruent with the University’s Vision, Mission, and Goals, programs or services may be implemented. The management of these includes audits and other internal cost controls of accountability. Construction, maintenance, and upkeep of facilities, for example, are monitored not only by fiscal accountability but also in meeting design and operational standards.

42
III.6.5 Systematic Evaluation and Improvement Clemson continues to implement institutional effectiveness processes including program and department assessment. These annual practices include measurable objectives and use of direct measures (not solely opinion surveys) to analyze the extent to which the program, service, or other activity has achieved the desired outcome. These measurable outcomes and many others are reported, examined, analyzed, and used in decision-making at all levels and areas of the institution. Reporting of these measures includes internal strategies such as the Clemson University Fact Book, Assessment Reports, and President’s Report Card to the Board of Trustees. External reporting includes the Institutional Effectiveness Report and Performance Funding to the SC Commission on Higher Education, and other reports to the Southern Association of Colleges and Schools Commission on Colleges (SACSCOC). External entities such as IPEDS, data exchanges, and public analysis (U.S. News & World Report) rely on institutional data for many reasons including decision-making, developing opinions or evaluation. The foundation of the 2020 Road Map is a commitment to systematic, broad-based planning, conscientious and diverse data collection methods, and intensive data analysis. This process ensures continuous quality improvement. As expressed in the 2020 Road Map, Clemson University’s students, faculty, staff, the nation, and the world benefit from the University’s commitment to high quality.

43
Academic Rankings
U.S. News & World Report, America’s Best Colleges, 2012
• #25 Top Public National Universities
U.S. News & World Report, America’s Best Colleges, 2012
• Outstanding Academic Program, Writing Across the Curriculum • #12 Best Undergraduate Teaching • #7 Up and Coming Schools
U.S. News & World Report, Best Graduate Schools, 2010
U.S. News & World Report, Clemson is one of only five of the nation’s 172 public universities cited for commitment to undergraduate teaching. America’s Best Colleges, 2011
U.S. News & World Report, Named one of eighteen national universities to offer strong living/learning communities. America’s Best Colleges, 2011
U.S. News & World Report, America’s Best Colleges, 2010
• #20 Undergraduate Civil Engineering department
BusinessWeek magazine, 2009
• #27 Undergraduate Business School, Top Public National Universities
Kiplinger’s magazine, 2009
• #1 Best Value in Public Universities in South Carolina
SmartMoney magazine, 2009
• #8 in terms of student’ return on investment
Chronicle of Higher Education, Top Research Universities Faculty Scholarly Productivity Index, 2007
• #9 in nation for Ph.D. program in applied economics
Design Intelligence, 2009
• #11 Architecture Graduate Programs, Top Public National Universities • #12 Planning and Landscape Architecture Undergraduate Program
Diverse Issues, Number of African-American engineering baccalaureate graduates, 2008

44
• #19 among public universities • #20 overall • #12 among traditionally white universities
National Science Foundation research expenditures, 2008
• #17 for expenditures in engineering • #19 among public universities without a medical school
National Survey of Student Engagement (NSSE), 2012
• 94% of freshmen and 94% of seniors rated their educational experience at Clemson as “Good” to “Excellent.”
• 91% of Clemson seniors report that they would attend Clemson again if given the opportunity to start over at any institution.
• 82% of Clemson seniors believe the institution has a substantial commitment to their success.
• 87% of Clemson seniors believe the institution puts an emphasis on academics.
Planetizen Guide to Graduate Urban Planning Programs, 2008 • #7 among programs offering master’s degrees • One of the 10 best historic preservation programs in the U.S.
Princeton Review’s “Best 290 Business Schools,” 2008
• Clemson’s MBA program ranked among the best in the U.S.
Princeton Review 2012
• #1 in Town-Gown Relations • #2 Happiest Students • #3 in Career Services • #10 Quality of Life • Best Southeastern College • Best Value College-Public
The Scientist magazine, 2007
• #1 Place to Work in Academia
Nine Clemson seniors and graduate students won the prestigious National Science Foundation Graduate Research Fellowship in 2010. Five additional students won honorable mention.
The Clemson Academic Quiz Bowl Team took 2nd place at the National Academic Quiz Bowl Intercollegiate Championship Tournament.

45
III. Category 7 - Organizational Performance Results Performance measures associated with the University’s three key areas are aligned with the teaching, research and service missions of the institution. Additionally, achieving top-20 public institution recognition by U.S. News & World Report continues to be a primary measure of benchmarked success. 7.0 Top-20 Public Institution Clemson University continues to make progress toward recognition as a top-20 public institution by U.S. News & World Report.
7.0-1 Strides Toward the Top 20 It is Clemson’s goal to achieve top-20 recognition: this will demonstrate the institution’s unique organizational performance. This measure of achievement continues to be a key benchmark, along with elements that contribute to this measure. Clemson University was ranked number 25 in Top Public Schools by U.S. News and World Report for 2012.
0
10
20
30
40
50
60
70
80
1997-‐98 2001-‐02 2002-‐03 2003-‐04 2004-‐05 2005-‐06 2006-‐07 2007-‐08 2008-‐09 2009-‐10 2010-‐11 2011-‐12
Ranking (US News) Benchmark

46
7.1 Student Learning Improvements in student learning programming contribute to overall academic success, increased retention, maintaining LIFE and other scholarships, greater participation in learning opportunities, and increased graduation rates. Quality of the Freshman Class Tables 7.1-1 and 7.1-2 report Clemson’s progress in increasing the quality of the freshman class measured by mean SAT/ACT scores, rankings in the top 10% of high school classes, and the institution’s acceptance rate. The ACT Institutional Data File 2010 reports that SAT/ACT scores for selective institutions range 1030-1220, placing Clemson at the higher end with an average SAT score range of 1140-1330 in 2010. The percentage of freshmen in the top 10% of their class based on the ACT definition of selective institutions is 25%. For Fall 2011, 49% of applicants were in the top 10% of their high school class. The overall acceptance rate for Fall 2011 is 63%.
7.1-‐1 SAT /ACT Scores 7.1-‐2 Acceptance Rate/Top 10% of High School Class
Fall-to-Fall Cohort Retention Attracting and retaining undergraduate students continues to be a major focus for the institution. Since the 2003-04 academic year, Clemson has improved undergraduate retention. Clemson’s benchmark for retention is 95%. Over 90% of freshmen continue as sophomores (90.5% for the 2008 cohort). According to the 2008 ACT Institutional Data File, the average first-to-second-year persistence rate for public Ph.D.-granting institutions is 72.9%. The mean percentage of first-to-second-year persistence rates for selective institutions is 82%, a rate that Clemson clearly exceeds.
0
200
400
600
800
1000
1200
1400
1600
2005 2006 2007 2008 2009 2010 2011
Low High
0
20
40
60
80
100
2005 2006 2007 2008 2009 2010 2011
Acceptance Rate Top 10% of Class

47
7.1-3 Freshman to Sophomore and Sophomore to Junior Retention*
*Third-year retention data for 2010 cohort not yet available. Degrees Awarded Clemson University awards degrees to graduates at three ceremonies during the year. The number of doctoral degrees awarded has increased significantly in the past three academic years. 7.1-‐4 Doctoral Degrees (Ph.D.) 7.1-‐5 Masters and Education Specialists Degrees
0.00
10.00
20.00
30.00
40.00
50.00
60.00
70.00
80.00
90.00
100.00
2001 2002 2003 2004 2005 2006 2007 2008 2009 2010
Fresh. To Soph. Soph. to Jr.
0
50
100
150
200
250
Doctoral Degrees Benchmark
0 100 200 300 400 500 600 700 800 900 1000
Master Benchmark

48
7.1-6 Baccalaureate Degrees After large enrollment of freshmen undergraduate students in the late 1990’s, the University made a decision to hold freshmen enrollment to approximately 2,800 new students per year. The goal has remained the same until the last several years when it was adjusted to approximately 3,000 freshmen. In the 2011-12 academic year, 3314 baccalaureate degrees were conferred. The University’s benchmark is to graduate no less than 85% of each student cohort.
7.1-9 Sponsored Programs Many graduate students hold assistantships at Clemson. Undergraduates are also able to receive assistantships through sponsored research programs. After a decline in the number of undergraduate and graduate students funded from sponsored research, the numbers have shown an upward trend in the past three years. Clemson has added funding for tuition in federal grants.
0
500
1000
1500
2000
2500
3000
3500
2002-‐03 2003-‐04 2004-‐05 2005-‐06 2006-‐07 2007-‐08 2008-‐09 2009-‐10 2010-‐11 2011-‐12
0
100
200
300
400
500
600
700
800
2003-‐04 2004-‐05 2005-‐06 2006-‐07 2007-‐08 2008-‐09 2009-‐10 2010-‐11
Number of undergraduate students funded from sponsored programs (IR, IE Report)
Number of graduate students funded from sponsored programs (IR, IE Report)

49
7.1-10 Retention of LIFE Scholarships The percentage of undergraduate students at Clemson who retain their LIFE scholarship from their freshmen to their sophomore year continues to increase. The ability to maintain LIFE scholarships and the retention of students is closely monitored. One of the services offered by Clemson is the Academic Success Center (ASC), which enhances student success through tutoring, supplemental instruction, disability services and other instructional programs. Retention of LIFE Scholarship to Sophomore Year
First Year Sophomore Year
Cohort Year LIFE Scholars Number of Students Rate 2000 1,290 605 46.90% 2001 1,229 625 50.85% 2002 1,273 666 52.32% 2003 1,428 823 57.63% 2004 1,462 725 49.59% 2005 1,298 669 51.54% 2006 1,277 690 54.03% 2007 1,212 707 58.33% 2008 1,368 849 62.06% 2009 1,183 788 66.61% 2010 1,208 668 55.30%
7.1-11 University-wide GRE Performance The Graduate Record Examination (GRE) provides insight on the general performance of students who select to take the examination. The exam may be taken by either undergraduate or graduate students, and may be taken multiple times. In addition to quantative and verbal sections of the exam, students take a writing exam. The scale for this section is not the same as the other two scales, so results are not included in the chart below. Clemson students continue to perform at a higher rate on the quantitative section of the GRE. This is a consistent finding with other standardized exams (ETS Proficiency Profile, C-Base) that Clemson uses to assess general education.
0
200
400
600
800
2005 2006 2007 2008 2009 2010 2011 2012
GRE Verbal GRE QuanZtaZve

50
7.1-12 Standardized Test: Principles of Learning and Teaching and Specialty Area Tests Education students must take and pass both the Principles of Learning and Teaching and their specialty area test before a grade can be awarded for student teaching or an Initial Certification can be granted. Typically, these two tests are taken prior to the senior year. The following table displays the percentage of first-time students passing the examinations.
PRAXIS II Examination Pass Rates: Initial Teacher Certification Program Completers 2010-‐111
1TITLE II HEA Report, April 2012.
Name of Exam Date(s) Administered
# of Examinees
# of Examinees who Passed
% Examinees Passing
Teaching and Research Sectors
PRAXIS SERIES II: PRINCIPLES OF LEARNING & TEACHING (K-‐6) Bi-‐monthly 112 110 98% PRAXIS SERIES II: PRINCIPLES OF LEARNING & TEACHING (5-‐9) Bi-‐monthly 34 31 91% PRAXIS SERIES II: PRINCIPLES OF LEARNING & TEACHING (7-‐12) Bi-‐monthly 67 60 90%
PRAXIS SERIES II: SPECIALTY AREA TESTS Bi-‐monthly 213 194 91%
Table 7.1-13 Excel in Undergraduate Teaching and Learning The skills measured by the ETS Proficiency Profile are grouped into proficiency levels. In the Spring, 2012 administration, 650 Clemson seniors participated. The possible range of subscores is 100-130. Clemson seniors score significantly above the national average for mathematics and above the national average for critical thinking, reading, and writing.
115.03
120.85
116.18 118.11
105
110
115
120
125
130
CriZcal Thinking Reading WriZng MathemaZcs
ETS Proficiency Profile 2012

51
Learning Outside of Classrooms To enhance the educational experience beyond the classroom, undergraduate students are able to participate in residential communities, service learning and research projects. 7.1-14 Community Service and Service Learning The National Survey of Student Engagement (NSSE) asks seniors about their participation in community activities. Clemson recognizes the importance of activities beyond the classroom. Clemson adopted the benchmark for success to qualify for the classification of a Carnegie Engaged University. Clemson achieved that status in 2009. The percentage of seniors responding sometimes or often to participation in service activities as a part of a regular course is shown in Table 7.1-14(a). Table 7.1-14(b) is the percentage of seniors who have participated in either community service or volunteer work. 7.1-14(a) Participated in a community-based project as a part of a regular course
7.1-14(b) Participated in community service or volunteer work
0
20
40
60
80
100
2006-‐07 2007-‐08 2008-‐09 2009-‐10 2010-‐11 2011-‐12
0
20
40
60
80
100
2007-‐08 2008-‐09 2009-‐10 2010-‐11 2011-‐12

52
7.1-15 Learning Communities Clemson University continues to provide opportunities to students outside of the classroom. In recent years, learning communities have been successful components of student experiences and engagement. The number of students responding to National Survey of Student Engagement (NSSE) and participating in a learning community increased significantly in 2007. Clemson has received recognition for its Living and Learning Community programs. The benchmark for success will be continued recognition of Clemson’s programs.
0
10
20
30
40
50
60
70
80
90
100
2006-‐07 2007-‐08 2008-‐09 2009-‐10 2010-‐11 2011-‐12

53
7.2 Student Satisfaction Clemson University’s biannual administration of the Student Satisfaction Inventory (SSI) shows that the students have continually reported higher levels of satisfaction since 1998. Clemson students are statistically significantly more satisfied on nine scales compared to other four-year public institutions. The scale rating is 1-Not Satisfied at All to 7-Very Satisfied, and mean scores are displayed in the following table. These tables will be revised after the next administration in Fall, 2011. 7.2-1 Student Satisfaction Survey (SSI)
Satisfaction Scales
*difference between 2007 CU and group norm is statistically significant
1999 CU
2001 CU
2000 CU
2005 CU
2007 CU
4-‐year public 2007 Sig.
Student Centeredness 5.18 5.37 5.28 5.4 5.47 5.08 * Campus Support Services 5.1 5.31 5.18 5.42 5.43 5.23 * Campus Climate 5.07 5.33 5.21 5.32 5.34 5.05 * Instructional Effectiveness 5.1 5.24 5.18 5.25 5.29 5.12 * Campus Life 4.86 5.13 4.95 5.09 5.08 4.83 * Service Excellence 4.77 4.98 4.87 4.96 4.98 4.9 * Safety and Security 4.04 4.41 4.22 4.6 4.54 4.47 * Responsiveness to Diverse Populations 4.73 4.88 4.73 4.83 4.88 5.05 (-‐)* Registration Effectiveness 4.67 4.84 4.67 4.77 4.8 4.92 (-‐)* Academic Advising 5.2 5.3 5.13 5.12 5.11 5.2 (-‐)* Concern for the Individual 4.8 4.93 4.82 4.87 4.94 4.93 Recruitment and Financial Aid 4.66 4.85 4.74 4.74 4.83 4.8
7.2-2 Alumni Surveys Each year the institution conducts a survey of alumni to assess opinions about their educational experience at Clemson. All alumni are surveyed at one- and three-year intervals. In addition to general questions, targeted departmental questions regarding the curriculum are sent to alumni. For the first time, the alumni survey was conducted over the Web in Fall, 2009. The survey instrument itself has been improved to be program-centric, which allows individual programs to more closely follow the opinions and experiences of their alumni. For the 2010 administration, the survey has been further enhanced to satisfy the reporting requirements of outside accrediting agencies such as ABET (Accreditation Board for Engineering and Technology). The following three tables show the response to questions.

54
7.2-2(a) Alumni One Year Out: “My knowledge, skills, and abilities compare equally to those of my peers.”
When asked to indicate their agreement on a scale of 1- Not at all to 4-Much, Clemson alumni have historically indicated their knowledge, skills and abilities are comparable to peers. Clemson desires to continuously increase positive responses from alumni on their perception of preparation. The format of the alumni survey was changed in Fall, 2009. The questions were modified and ranked on a 5-point scale. Additionally, the survey was administered on-line for the first time, so a direct comparison with previous years’ responses is not possible. However, on the 2011-12 survey item, “The courses in my major prepared me well for a career”, the mean response was 3.83. 42% of respondents either agreed or strongly agreed with the statement. On the survey question: “The courses in my major prepared me well for graduate school”, the mean score was 4.07 with 47% answering agree or strongly agree (38.5) answering N/A).
0
1
2
3
4
5
6
2004-‐05 2005-‐06 2006-‐07 2007-‐08
1 Yr 3 Yr

55
7.2-2(b) Alumni Three Years Out: “How satisfied were you with your overall academic experience?” On a scale of 1-Very Dissatisfied to 6-Very Satisfied, Clemson alumni have historically reported a high level of satisfaction with their academic experience. The format of the alumni survey was changed in Fall, 2009. Questions were modified to be more program-specific, and ranked on a 5-point scale. Additionally, the survey was administered on-line for the first time, so a direct comparison with previous years’ responses is not possible. On the 2011-12 survey item, ‘Please provide a rating of your department in the following area: Overall Curriculum,’ the mean response was 4.29. 91.3% of respondents either agreed or strongly agreed with the statement.
0
1
2
3
4
2004-‐05 2005-‐06 2006-‐07 2007-‐08

56
7.2-2(c) Alumni One and Three Years Out: “Would you recommend your program to prospective students?” When asked to indicate their agreement on a scale of 1-Not at All to 4-Much, Clemson alumni have historically indicated they would recommend their program to prospective students. As seen in the graph below, there has been a steady increase in positive responses. The format of the alumni survey was changed in Fall, 2009. Questions were modified to be more program-specific, and ranked on a 5-point scale. Additionally, the survey was administered on-line for the first time, so a direct comparison with previous years’ responses is not possible. On the 2011-12 survey item, “I would recommend my major to potential students,” the mean response was 4.02. 76.2% of respondents either agreed or strongly agreed with the statement.
7.2-3 Student Engagement The National Survey of Student Engagement (NSSE) measures student engagement in campus activities and programming. The university has participated in NSSE for seven years. Clemson monitors and analyzes student responses for trends and seeks areas for improvement. In the NSSE Report, “Exploring Different Dimensions of Student Engagement,” Clemson University freshmen and senior responses are statistically compared against other students from selected peer and Carnegie Classification peer institutions. In 2005 the comparison consisted of doctoral extensive institutions rather than Carnegie peers. Of the five benchmarks for effective educational practice, Clemson students’ responses are statistically significantly higher than both groups. Clemson exceeded both groups for most of the items comprising each benchmark.
0
1
2
3
4
2004-‐05 2005-‐06 2006-‐07 2007-‐08

57
Table 7.2-3(a) Level of Academic Challenge (LAC) Challenging intellectual and creative work is central to student learning and collegiate quality. Colleges and universities promote high levels of student achievement by emphasizing the importance of academic effort and setting high expectations for student performance. Clemson seniors traditionally have a higher mean score than the Carnegie peers. Clemson strives to meet or exceed the Senior LAC scores for Carnegie Classification and top-20 peer institutions.
Table 7.2-3 (b) Supportive Campus Environment (SCE) Students perform better and are more satisfied at colleges that are committed to their success. For the past five years, seniors at Clemson seniors consistently score higher on this benchmark than their Carnegie Peers. Clemson strives to meet or exceed the Senior SCE scores for Carnegie Classification and top-20 peer institutions.
.0 10.0 20.0 30.0 40.0 50.0 60.0 70.0 80.0 90.0 100.0
2006-‐07 2007-‐08 2008-‐09 2009-‐10 2010-‐11 2011-‐12
Clemson Carnegie
0 10 20 30 40 50 60 70 80 90 100
2006-‐07 2007-‐08 2008-‐09 2009-‐10 2010-‐11 2011-‐12
Clemson Carnegie

58
Table 7.2-3 (c) Student-Faculty Interaction (SFI) Students learn first-hand how experts think about and solve practical problems by interacting with faculty members inside and outside the classroom. As a result, their teachers become role models, mentors and guides for continuous, life-long learning. Overall, student-faculty interaction at Clemson is statistically significantly higher than Carnegie Classification Peers. The institution strives to meet or exceed the SFI scores for Carnegie and top-20 peer institutions.
0 10 20 30 40 50 60 70 80 90 100
2006-‐07 2007-‐08 2008-‐09 2009-‐10 2010-‐11 2011-‐12
Clemson Carnegie

59
Table 7.2-3(d) Active and Collaborative Learning (ACL) Students learn more when they are intensely involved in their education and asked to think about what they are learning. Collaborating with others in solving problems or mastering difficult material prepares students for the problems they will encounter during and after college. Seniors rated this benchmark statistically significantly higher than Carnegie Classification Peers. Clemson strives to meet or exceed the Senior ACL scores for Carnegie Classification and top-20 peer institutions.
0 10 20 30 40 50 60 70 80 90 100
2006-‐07 2007-‐08 2008-‐09 2009-‐10 2010-‐11 2011-‐12
Clemson Carnegie

60
Table 7.2-3 (e) Enriching Educational Experiences (EEE) Academic programs are augmented by complementary learning opportunities in and out of class. Diversity experiences offer valuable life lessons to students. Technology facilitates collaboration between peers and instructors. Internships, community service and senior capstone courses provide opportunities to integrate and apply knowledge. Overall, seniors at Clemson have had statistically significantly higher responses than Carnegie Classification Peers. The institution strives to meet or exceed the Senior EEE scores for Carnegie Classification and top-20 peer institutions.
Table 7.2-3(f) “If you could start over again, would you go to the same institution you are now attending?” Seniors at Clemson continue to report significantly higher satisfaction with the University than Carnegie Classification Peers.
0 10 20 30 40 50 60 70 80 90 100
2006-‐07 2007-‐08 2008-‐09 2009-‐10 2010-‐11 2011-‐12
Clemson Carnegie
0 10 20 30 40 50 60 70 80 90
100
2006-‐07 2007-‐08 2008-‐09 2009-‐10 2010-‐11 2011-‐12
Clemson Carnegie

61
Table 7.2-3(g) “How would you evaluate your entire educational experience at this institution?” Seniors at Clemson continue to report significantly higher level of satisfaction with their educational experience than Carnegie Classification Peers. Clemson strives to meet or exceed the Senior ACL scores for Carnegie Classification and top-20 peer institutions.
Table 7.2-3(h) Improve Our Student/Staff Interactions The benchmark of success is 75% of students reporting satisfaction with staff interactions.
0
20
40
60
80
100
2006-‐07 2007-‐08 2008-‐09 2009-‐10 2010-‐11 2011-‐12
Clemson Carnegie
0
10
20
30
40
50
60
70
80
2006-‐07 2007-‐08 2008-‐09 2009-‐10 2010-‐11 2011-‐12
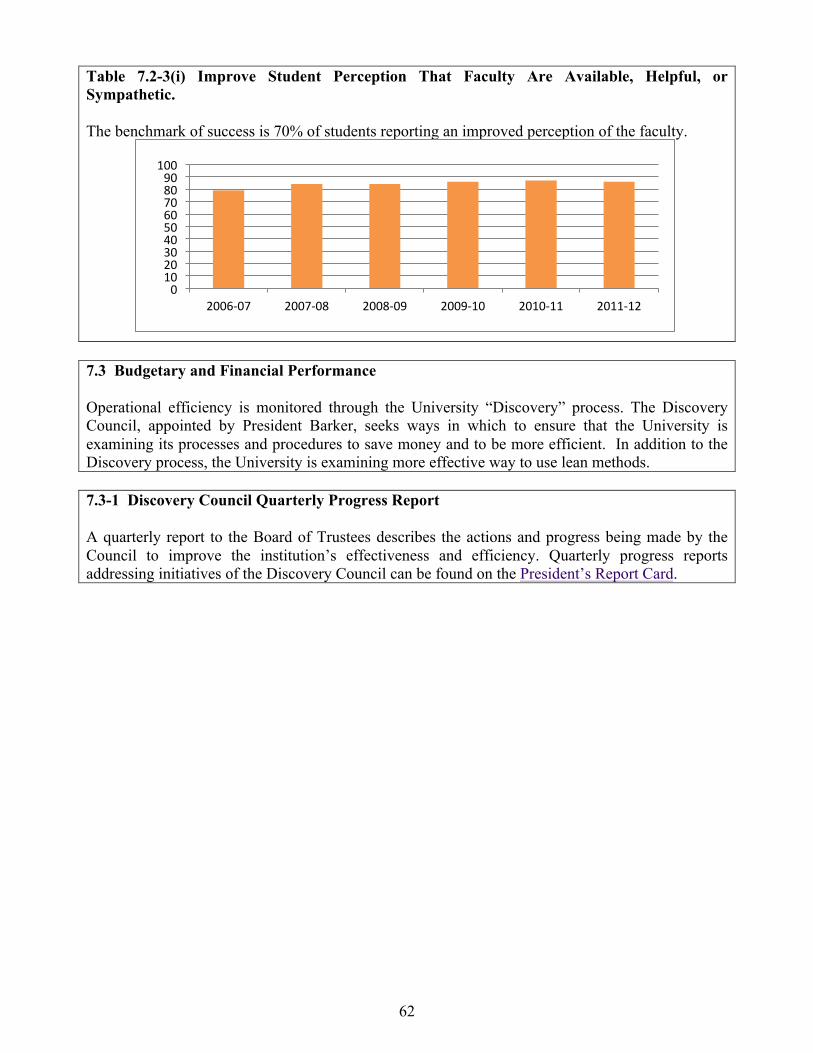
62
Table 7.2-3(i) Improve Student Perception That Faculty Are Available, Helpful, or Sympathetic. The benchmark of success is 70% of students reporting an improved perception of the faculty.
7.3 Budgetary and Financial Performance Operational efficiency is monitored through the University “Discovery” process. The Discovery Council, appointed by President Barker, seeks ways in which to ensure that the University is examining its processes and procedures to save money and to be more efficient. In addition to the Discovery process, the University is examining more effective way to use lean methods. 7.3-1 Discovery Council Quarterly Progress Report A quarterly report to the Board of Trustees describes the actions and progress being made by the Council to improve the institution’s effectiveness and efficiency. Quarterly progress reports addressing initiatives of the Discovery Council can be found on the President’s Report Card.
0 10 20 30 40 50 60 70 80 90 100
2006-‐07 2007-‐08 2008-‐09 2009-‐10 2010-‐11 2011-‐12

63
7.3-2 Alumni Giving A strong indicator of student satisfaction is related to alumni giving. There is a presumed connection between alumni giving and a positive Clemson experience. The Office of the Vice-President for Advancement identifies alumni by their graduation dates and their participation in undergraduate programs or activities. In the past year, Clemson alumni contributions have increased to an all-time high. Clemson’s alumni giving is one of the highest levels reported (27%) in the U.S. News & World Report ranking of top-50 public institutions. It is Clemson’s goal to maintain or enhance the current status.
0
5
10
15
20
25
30
2000 2001 2002 2003 2004 2005 2006 2007 2008 2009 2010 2011

64
7.4 Work Systems Performance, Faculty, and Staff Learning and Development, Faculty and Staff Well-being and Satisfaction External Grants External funding for University research is a strong indicator of the caliber of work being done at an institution. Two indicators of quality are the number of sponsored program awards and sponsored program expenditures. The following two tables show the continued increases in both measures. 7.4-1 Sponsored Program Awards
2007-‐08 2008-‐09 2009-‐10 2010-‐11 2011-‐12*
AAH $ 701,508 $ 5,134,154 $ 797,602 $ 2,210,473 $ 616,380
BBS $ 2,275,306 $ 1,144,021 $ 2,355,646 $ 2,113,743 $ 1,901,243
CAFLS $ 8,946,379 $ 10,926,153 $ 13,101,585 $ 10,807,057 $ 8,829,719
COES $ 62,411,903 $ 39,614,872 $ 60,206,114 $ 37,346,079 $ 38,126,978
HEHD $ 3,785,686 $ 3,246,291 $ 4,359,569 $ 5,240,372 $ 3,532,370
INTERDISCIPLINARY $ 1,732,120 $ 2,294,746 $ 853,093 $ 568,370 $ 424,424
PSAG & OTHERS1 $ 1,536,342 $ 5,928,876 $ 4,306,065 $ 3,992,000 $ 2,149,161
Grand Total $ 81,389,243 $ 68,289,112 $ 85,979,673 $ 62,278,095 $ 55,580,275 1PSGA stands for Public Service and Agriculture, other includes centers and institutes not in colleges *2011-‐12 Data has not been finalized. Will be available in October 2012.
7.4-2 Sponsored Program Expenditures
2007-‐08 2008-‐09 2009-‐10 2010-‐11 2011-‐12*
AAH $ 793,569 $ 996,114 $ 933,449 $ 719,189 $ 652,261
BBS $ 2,102,868 $ 2,106,952 $ 2,292,360 $ 1,959,161 $ 1,679,032
CAFLS $ 7,548,251 $ 8,557,432 $ 9,628,287 $ 11,240,530 $ 9,343,384
COES $ 29,789,842 $ 33,695,147 $ 35,198,899 $ 37,257,499 $ 31,834,096
HEHD $ 2,795,333 $ 3,423,711 $ 3,663,835 $ 4,109,065 $ 3,268,065
INTERDISCIPLINARY $ 2,092,802 $ 2,153,857 $ 1,003,950 $ 682,595 $ 530,268
PSAG & OTHERS1 $ 900,057 $ 1,153,182 $ 2,017,036 $ 3,009,948 $ 2,256,068
Grand Total $ 46,022,722 $ 52,086,395 $ 54,737,815 $ 58,977,987 $ 49,563,174 1PSGA stands for Public Service and Agriculture, other includes centers and institutes not in colleges
*2011-‐12 Data has not been finalized. Will be available in October 2012.

65
Peer Review Articles and Peer Review Presentations How a faculty is perceived by its peers is a frequent measure of the quality of the faculty. Counting the number of articles that are reviewed by a committee of peers and printed in professional journals is one measure of the quality and productivity of the faculty. The number of peer-reviewed publications and presentations shown in the following tables are only unique records; however, this does not eliminate the possibility of duplicate records found in the Faculty Activity System. Clemson continues to strongly support faculty productivity. 7.4-3 Number of peer-reviewed publications
7.4-4 Number of peer-reviewed presentations
Collaborative on Academic Careers in Higher Education (COACHE) In the 2007-08 academic year, the University participated in a national study of faculty in higher education coordinated by Harvard Graduate School of Education. Clemson participated again in Fall, 2011. In Clemson’s first administration, over 7,800 national faculty in tenure-track positions participated in the survey. The 2011-12 COACHE surveyed senior, tenured and tenure track faculty (full and associate professor). Clemson’s response rate for faculty eligible to participate in 2011-12 was 60% (509). The peer institutions chosen for comparison were: North Carolina State University, Purdue University, SUNY-Binghamton, UNC Chapel Hill, and the University of Tennessee. 7.4-5(a) Financial Access: Improve the Quality of Graduate Students
(+ higher than peers; = equal to peers; - less than peers)
2005-06 2007-08 2011-12
3.52 (-) 3.45 (-) 3.20 (-)
The 2020 Road Map stresses the importance of getting the best students and providing the best learning environment. The COACHE item “Nature of Work: Satisfaction with the quality of graduate students with whom they interact” will monitor the faculty’s attitude. As an assessment, the benchmark of success is that the faculty will report satisfaction equal to or greater than peers. This continues to be an area that needs improvement.
0
500
1000
1500
2000
2500
2007-‐08 2008-‐09 2009-‐10 2010-‐11 2011-‐12 0
200
400
600
800
1000
1200
1400
2007-‐08 2008-‐09 2009-‐10 2010-‐11 2011-‐12

66
7.4-5(b) and (c) Increase Resources and Promote Good Management: Provide Childcare for Faculty and Graduate students 7.4-5(b) Effectiveness of Childcare
2005-06 2007-08 2011-12 1.94 (-) 1.93 (-) 1.82 (-)
(+ higher than peers; = equal to peers; - less than peers)
Childcare continues to be an important issue for younger faculty. The metric for this is the COACHE item: Policies and Practices: Effectiveness of Childcare. As an assessment, the benchmark of success is that the faculty will report satisfaction equal to or greater than peers. Clemson’s mean scores still lag behind those of our peers.
7.4-5(c) Children and Tenure
2005-06 2007-08 2011-12
2.46 (-) 2.65 (-) 2.68 (-) (+ higher than peers; = equal to peers; - less than peers)
A second measure regarding childcare is another COACHE item: Policies and Practices: Institution does what it can to make having children and the tenure-track compatible. As an assessment, the benchmark of success is that the faculty will report satisfaction equal to or greater than peers. Although this issue is a matter of concern at our peer institutions, Clemson’s mean scores are below that of its peers.
7.4-5(d) Increase Resources and Promote Good Management: Publish Established Guidelines for Teaching, Research, Service and Economic Development That Promote Faculty Success.
2005-06 2007-08 2011-12
3.74 (-) 3.78 (-) 3.75 (-) (+ higher than peers; = equal to peers; - less than peers)
Regarding guidelines for tenure, Clemson monitors the faculty’s response on COACHE item: Nature of Work: Satisfied with the number of courses they teach. As an assessment, the benchmark of success is that the faculty will report satisfaction equal to or greater than peers.
Increase Resources and Promote Good Management: Manage Workloads to Promote Retention of Quality Faculty 7.4-5(e) Clarity of Prospects to Earn Tenure
2005-06 2007-08 2011-12
3.56 (-) 3.66 (-) 3.73 (=) (+ higher than peers; = equal to peers; -
Retaining quality faculty is challenging to any institution. The 2020 Road Map specifically identifies hiring, retaining, and rewarding the best people as an essential element in Clemson’s process of continual quality improvement. Clemson will monitor the faculty’s perception of the COACHE item: Tenure: Clarity of their own prospects for earning tenure. As an assessment, the benchmark of success is that the

67
less than peers) faculty will report satisfaction equal to or greater than peers. Clemson’s mean scores are below that of its peers improved in the 2011-12 administration compared to previous years.
Increase Resources and Promote Good Management: Manage Workloads to Promote Retention of Quality Faculty 7.4-5(f) Time to Conduct Research
2005-06 2007-08 2011-12
2.55 (-) 3.03 (=) 3.42 (-) (+ higher than peers; = equal to peers; - less than peers)
A second measure of the goal to retain quality faculty is based on the COACHE item Nature of Work: Satisfied with the amount of time they have to conduct research. Faculty success is, in part, based on research and sufficient time to undertake quality research is necessary for faculty to achieve tenure. As an assessment, the benchmark of success is that the faculty will report satisfaction equal to or greater than peers. Clemson’s mean score continues to improve.
7.4-5 (g) Satisfaction with Expectations for Teaching
2005-06 2007-08 2011-12
3.74(-) 3.78(-) 4.14 (=) (+ higher than peers; = equal to peers; - less than peers)
Several COACHE items relate to teaching obligations. Faculty expressed concerns over the number of courses being assigned during the tenure process that requires a high research commitment. As an assessment, the benchmark of success is that the faculty will report satisfaction equal to or greater than peers.
7.4-5(h) Support Opportunities for Faculty to Interact with Colleagues Increase Resources and Promote Good Management: Interaction with senior colleagues
2005-06 2007-08 2011-12
3.19(-) 3.25(-) 3.66 (=) (+ higher than peers; = equal to peers; - less than peers)
The COACHE item Climate, Culture, and Collegiality: Satisfaction with the amount of professional interaction they have with senior colleagues in their department provides insight into the faculty perception of collegiality and climate. As an assessment, the benchmark of success is that the faculty will report satisfaction equal to or greater than peers. However, this remains an area of concern at Clemson and its peer institutions.
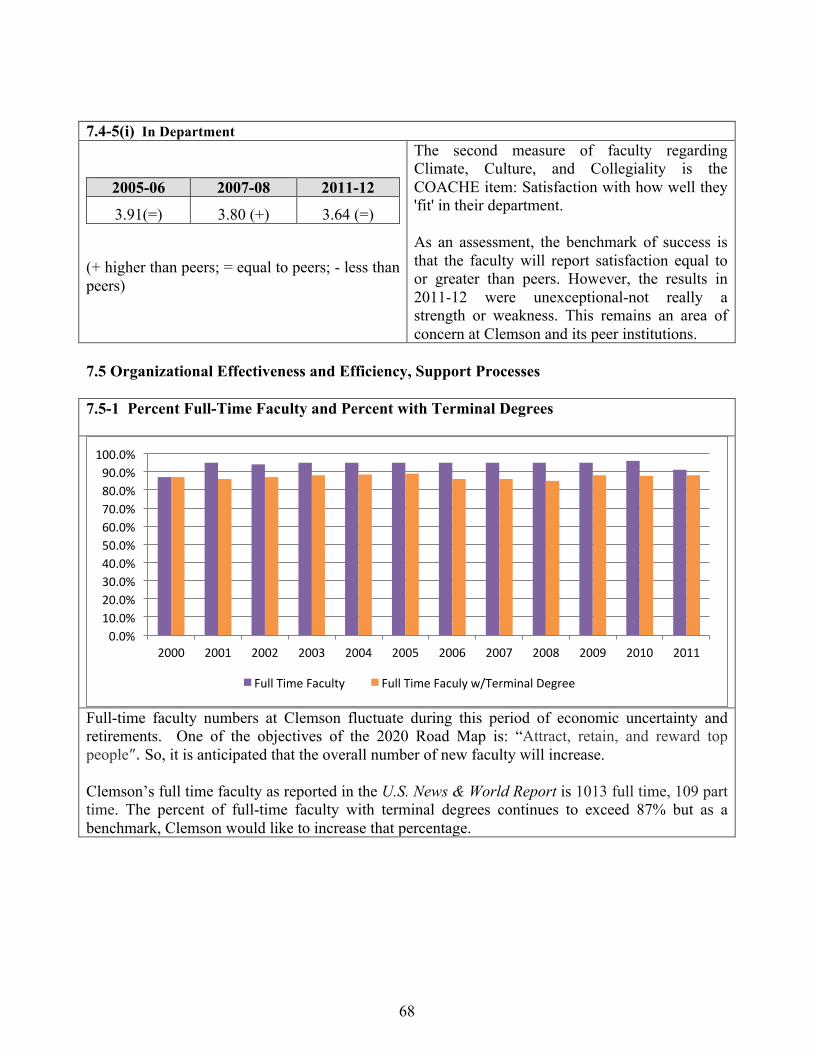
68
7.4-5(i) In Department
2005-06 2007-08 2011-12
3.91(=) 3.80 (+) 3.64 (=) (+ higher than peers; = equal to peers; - less than peers)
The second measure of faculty regarding Climate, Culture, and Collegiality is the COACHE item: Satisfaction with how well they 'fit' in their department. As an assessment, the benchmark of success is that the faculty will report satisfaction equal to or greater than peers. However, the results in 2011-12 were unexceptional-not really a strength or weakness. This remains an area of concern at Clemson and its peer institutions.
7.5 Organizational Effectiveness and Efficiency, Support Processes 7.5-1 Percent Full-Time Faculty and Percent with Terminal Degrees
Full-time faculty numbers at Clemson fluctuate during this period of economic uncertainty and retirements. One of the objectives of the 2020 Road Map is: “Attract, retain, and reward top people”. So, it is anticipated that the overall number of new faculty will increase. Clemson’s full time faculty as reported in the U.S. News & World Report is 1013 full time, 109 part time. The percent of full-time faculty with terminal degrees continues to exceed 87% but as a benchmark, Clemson would like to increase that percentage.
0.0% 10.0% 20.0% 30.0% 40.0% 50.0% 60.0% 70.0% 80.0% 90.0% 100.0%
2000 2001 2002 2003 2004 2005 2006 2007 2008 2009 2010 2011
Full Time Faculty Full Time Faculy w/Terminal Degree

69
7.5-2 Undergraduate Class Size Clemson values the atmosphere of being a “family” and part of a community. One element that contributes to this sense of caring is providing more interaction between faculty and students and the size of a class. Clemson continues to strive toward improvement in reducing the class size for undergraduate classes by increasing the percentage of all class sections with less than 20 students, and reducing the percentage of all class sections with more than 50 students. A smaller class size allows greater faculty interaction with students. Clemson contends that the percentage of classes with 50 or more students should be reduced. In spite of the current economic climate and other issues, the percentage of classes with less than 20 students increased in 2010 and 2011.
0.0%
10.0%
20.0%
30.0%
40.0%
50.0%
2000 2001 2002 2003 2004 2005 2006 2007 2008 2009 2010 2011
Less than 20 More than 50

70
7.5-3 Ratio of Students to Faculty The ratio of faculty members to students is another indicator of the quality of the educational environment at Clemson. In 2006, 2007 and 2008, Clemson achieved a ratio of 14:1. However, due to the current economic climate and other issues, the ratio of students to faculty increased slightly in the past 2 years.
7.5-4 Retention Rates Clemson has undertaken an extensive study of persistence patterns. The examination includes first- time, full-time students from the Fall, 1999 cohort. Demographic characteristics as well as indicators of engagement will comprise the longitudinal study. Additional data will enable examination of policies and practices to enhance retention rates. Clemson clearly demonstrates an extraordinarily high persistence rate of above 80%. The assessment of success of the 2008-2013 Strategic Plan is a benchmark increase in freshmen to sophomore, as well as sophomore to junior years, to yield at 95% retention rate.
Cohort Head Average %Continued %Continued Year Count SAT To 2nd Year To 3rd Year 1999 2,885 1158 87.10% 81.10% 2000 3,033 1172 87.60% 81.90% 2001 2,531 1191 89.30% 83.90% 2002 2,464 1205 89.60% 85.80% 2003 2,749 1204 88.70% 83.10% 2004 3,009 1203 87.70% 81.90% 2005 2,893 1225 88.90% 85.20% 2006 2758 1217 90.10% 86.30% 2007 2707 1221 91.50% 86.60% 2008 2868 1228 90.50% 86.6% 2009 3339 1220 88.90% 85.3% 2010 2979 1231 90.3%
0 1 2 3 4 5 6 7 8 9 10 11 12 13 14 15 16 17 18 19 20
2000 2001 2002 2003 2004 2005 2006 2007 2008 2009 2010 2011

71
7.5-5 Graduation Rates In addition to the study of retention rates, the University is examining graduation rates of first-time, full-time students. The progression of students through their course work culminates in graduation. Effective and efficient practices may assist students in achieving graduation in a timely manner. Clemson values the importance of monitoring time-to-graduation, and will use findings from on-going analyses to improve graduation rates.
7.5-6 Intellectual development: Promote excellence in advising Table 7.5-6(a) Student Satisfaction Inventory: Academic Advising
Importance
Satisfaction (Standard Deviation) Gap
2007 6.25 5.11 /1.27 1.14 2005 6.25 5.12/1.27 1.13 2001 6.27 5.30/1.20 0.97 2000 6.28 5.13/1.25 1.15
The assessment of success of the 2008-2013 Strategic Plan is a benchmark decrease in the difference between level of importance and level of satisfaction as reported on the Student Satisfaction Survey general scale for academic advising. The benchmark for success is that the gap between importance and satisfaction will drop below 0.50. Clemson will administer the SSI again in Spring 2013.
0
20
40
60
80
100
1999 2000 2001 2002 2003 2004 2005
4 year 6 year

72
Table 7.5-6(b) National Survey of Student Engagement (NSSE)
Another important measure being used to examine student satisfaction with academic advising is the National Survey of Student Engagement (NSSE). The percentage of senior students reporting good or excellent for their overall educational experience continues to rise. In this measure, Clemson continues to exceed its Carnegie Classification Peers. As a benchmark, Clemson strives to meet or exceed its Carnegie Classification and top-20 peer institutions.
Table 7.5-7 Registration Effectiveness (SSI)
Importance
Satisfaction (Standard Deviation) Gap
2007 6.03 4.80 / 1.00 1.23 2005 6.06 4.77/1.02 1.29 2001 6.12 4.84/.097 1.28 2000 6.14 4.67/1.04 1.47
Assessment of success of the 2008-2013 Strategic Plan is a benchmark decrease in the difference between level of importance and level of satisfaction as reported on the Student Satisfaction Survey general scale for academic advising. Although there has been a general improvement in the past years, it primarily results from students lowering their value of importance. Clemson has an opportunity to meet the benchmark for success, the gap between importance and satisfaction being lower than 0.50. Clemson will administer the SSI again in Fall 2010.
Table 7.5-8 Increase The Number of Classrooms Supporting Innovative Teaching Strategies In 2008, Clemson adopted a benchmark for success: 60% of seniors will report satisfaction with teaching strategies. This data will be collected in Spring, 2013 through unique institutional items on the Student Satisfaction Inventory Survey (SSI).
0
20
40
60
80
100
2006-‐07 2007-‐08 2008-‐09 2009-‐10 2010-‐11 2011-‐12
Clemson Seniors Carnegie Peers

73
Table 7.5-9 Information Technology: Continue to Improve the Quality of IT Programs and Services.
2005-06 2007-08 2011-12
3.56 (-) 3.47 (-) 3.53 (+)
Information technology support and services are critical to the success of a university. The COACHE item: Satisfaction with the quality of computing services, is a useful metric of satisfaction with IT facilities and support.
As an assessment, the benchmark of success is that the faculty will report satisfaction equal to or greater than peers. In the 2011-12 administration, Clemson showed a strength in this area compared to our peers.
In addition to the aforementioned trends and metrics, each University goal is also assessed qualitatively. The combination of quantitative data, survey results and observable measures is reported publically through the President’s Report Card. The report card addresses multiple organizational effectiveness and support process performance items. In addition, the University will meet all required standards at the highest level to maintain full accreditation and compliance with state and federal agencies. A list of accredited programs that are reported to the South Carolina Commission on Higher Education is noted in Table II.5-1. 7.6 Leadership and Social Responsibility University leaders are involved in many community and state initiatives that demonstrate social responsibility. The senior leadership team speaks with community groups about the university, higher education and the University’s mission. Administrators, faculty, and staff are engaged in community service projects and service learning activities. Students are engaged in the community as well. The current President’s Report Card provides details and examples in the section on Campus Life and Academics, Research and Service. Students are actively engaged in social development. Opportunities come both within the classroom as well as outside, such as the Clemson Service Alliance. The faculty has service learning groups that meet and discuss ideas and strategies. Clemson has been recognized by the South Carolina Commission on Higher Education for two statewide service-learning programs. National Survey of Student Engagement The National Survey of Student Engagement (NSSE) asks students to respond to a number of questions including diversity and study abroad. The following three items are a part of the assessment of the 2008-2013 Strategic Plan. Associated benchmarks are included in Tables III.7.6-1 through 7.6-3.

74
Table III.7.6-1 Strengthen the sense of community and increase diversity: Increase Inclusion of Diverse Perspectives in Undergraduate Coursework The benchmark of success is 80% of students reporting an improved perception.
Table III.7.6-2 Strengthen the Sense of Community and Increase Diversity: Increase Opportunities for Serious Conversation with Students of Different Race or Ethnicity
The benchmark for success is 80% of seniors will report this occurs often or very often.
0
10
20
30
40
50
60
70
80
90
100
2006-‐07 2007-‐08 2008-‐09 2009-‐10 2010-‐11 2011-‐12
0
10
20
30
40
50
60
70
80
90
100
2006-‐07 2007-‐08 2008-‐09 2009-‐10 2010-‐11 2011-‐12

75
Table III.7.6-3 Strengthen the Sense of Community and Increase Diversity: Increase Student Participation in Study Abroad
. The benchmark for success is that 30% of undergraduate senior students will report that they have had an international experience.
0
10
20
30
40
50
60
70
80
90
100
2006-‐07 2007-‐08 2008-‐09 2009-‐10 2010-‐11 2011-‐12

For information contact: Dr. David K. Knox, Director
Office for Institutional Assessment Clemson University [email protected]
864.656.0868