south australian public sector workforce information june
TRANSCRIPT

SOUTH AUSTRALIAN PUBLIC SECTOR WORKFORCE INFORMATION
JUNE 2012 – SUMMARY TABLES
Phone: (08) 8226 3492Email: [email protected] www.oper.sa.gov.au

List of Tables
Reconciliation Table
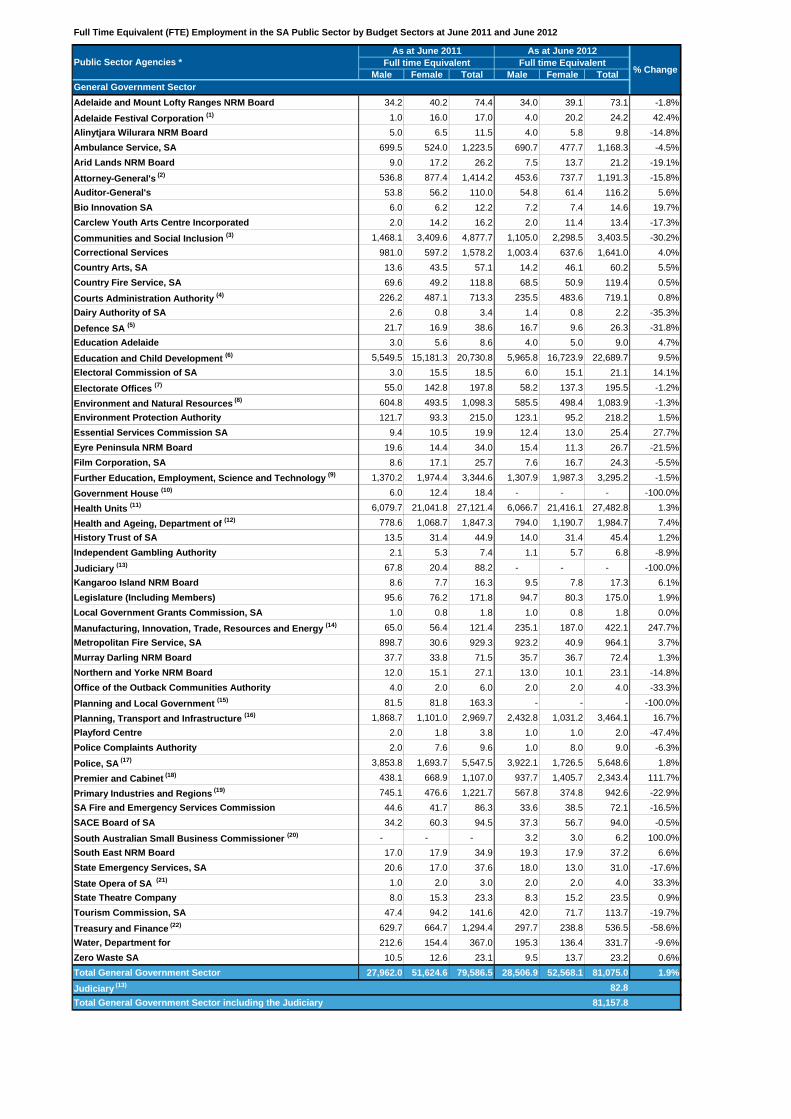
Full Time Equivalent (FTE) Employment in the SA Public Sector by Budget Sectors as at June 2012
Table 1 South Australian Public Sector Employment, June 2011 and June 2012
Table 2 Employees in the South Australian Public Sector as a Percentage of South Australian Population and Total Persons Employed in South Australia, June 2003 to June 2012
Table 3 Employees in the South Australian Public Sector by Age, Appointment Type and Gender, June 2012
Table 4 Employees in the South Australian Public Sector by Employee Type, Appointment Type and Gender, June 2012
Table 5 Employees in South Australian Public Sector Organisations by Appointment Type and Gender, June 2012
Table 6 Employees in Administrative Units by Employee Type and Gender, June 2012
Table 7 Employees (Full-time Equivalents) in Administrative Units by Employee Type, June 2012
Table 8 Employees in Other Public Sector Organisations by Employee Type and Gender, June 2012
Table 9 Employees (Full-time Equivalents) in Other Public Sector Organisations by Employee Type, June 2012
Table 10 Part time Employees in the South Australian Public Sector by Employee Type, Appointment Type and Gender, June 2012
Table 11 Executives in the South Australian Public Sector by Employee type, Appointment Type and Gender, June 2012
Table 12 Graduates and Trainees/Apprentices in the South Australian Public Sector by Employee Type and Gender, June 2012
Table 13 Employees in the South Australian Public Sector by Total Base Salary Group and Gender, June 2012
Table 14 Employees in Administrative Units by Age, Appointment Type and Gender, June 2012
Table 15 PS Act Employees in the Administrative Units by Stream, Appointment Type and Gender, June 2012
Table 16 Aboriginal and/or Torres Strait Islander Employees in the South Australian Public Sector by Employee Type, Appointment Type and Gender, June 2012
Table 17 Aboriginal and/or Torres Strait Islander Employees in the SA Public Sector, June 2003 to June 2012
Table 18 Employees in the SA Public Sector by Primary Work Location and Gender, June 2012
Table 19 Employees in the SA Public Sector by Occupation and Gender, June 2012
Table 20 (A) Length of Service of Employees in SA Public Sector Organisations by Gender, June 2012
Table 20 (P) Length of Total Service of Employees in the SA Public Sector by Gender, June 2012
Table 21 (R) Employees Recruited to SA Public Sector Organisations by Employee Type and Gender, July 2011 to June 2012
Table 21 (S) Employees Separated from SA Public Sector Organisations by Employee Type and Gender, July 2011 to June 2012
Table 22 Total Sick Leave Days (Paid and Unpaid) taken by Employee Type for the Period July 2011 to June 2012
Table 23 Family Carer’s Leave Days Taken by Employee Type for the Period July 2011 to June 2012
Table 24 Sick Leave Days (Paid and Unpaid) Taken for the Period July 2011 to June 2012
Table 25 Employees in the South Australian Public Sector on Leave Without Pay by Employee Type and Gender, June 2012

SOUTH AUSTRALIAN PUBLIC SECTOR WORKFORCE INFORMATION
JUNE 2012 – EXPLANATION OF TERMS
Phone: (08) 8226 3492Email: [email protected] www.oper.sa.gov.au

SA Public Sector The definition of the SA Public Sector is based on the Standard Institutional Sector Classification of Australia (SISCA) and other associated economic sector classifications. These have been developed by the Australian Bureau of Statistics (ABS) and are detailed in the ABS publication titled Standard Economic Sector Classifications of Australia, 2008 (Catalogue No. 1218.0). In October 1998 the ABS released a revised version of the SISCA and the accompanying classifications. Accordingly the structure of the SA Public Sector published in this workforce report reflects the revised institutional classification. The greatest change under the revised version of SISCA is that all three South Australian universities (Flinders, UniSA and Adelaide), while remaining classified to the general government sector, are now categorised as ‘multi-jurisdictional’ units and can therefore no longer be classified as state public sector organisations. In coming to this decision the ABS stated that the combined degree of control exercised in various forms over the universities by the commonwealth (financial control) and state governments (legislative control) meant that the universities could not be defined unambiguously as under the control of a single government jurisdiction. Under the SISCA and accompanying classifications the SA Public Sector is essentially defined as a combination of the bodies established under legislation and others that the state government controls through various mechanisms. Under this definition the SA Public Sector includes:
government departments formally established and maintained under the Public Sector Act, 2009 (the administrative units)
statutory bodies established to regulate or market commodities, industries and occupational groups
subsidiary organisations of public sector organisations other bodies where a public sector organisation has complete or majority
ownership of voting shares or other forms of voting capital which entitles them to control general corporate policy.
Workforce data for the public sector is presented in this report using three levels of reporting:
individual organisation total administrative units and/or total other public sector organisations total public sector.
Where the data is presented at the organisation level the organisations are classified and listed as administrative units or other public sector organisations. Administrative Units are administrative structures: (a) in which persons are to be employed (b) which are established, or continue in existence, under the Public Sector Act
2009 as a department or other administrative unit.
1
2
Other state public sector organisations include: (a) all statutory bodies (b) any company or organisation which an administrative unit or other state public
sector organisation controls or has more than 50% ownership. By adopting the ABS definition this report provides workforce information that is of comparative standard to relevant ABS data and which can accurately profile the broader SA Public Sector workforce. Individuals using this information may choose to amend the data provided by including/excluding the organisations, as they consider appropriate for their purposes. A significant number of organisations are classified as SA Public Sector organisations under this definition. However, the employees of many smaller organisations are included in the workforce figures of larger SA Public Sector organisations. Such organisations have not been identified separately. For example, the Public Trustee of South Australia is ultimately responsible to Parliament though the Attorney-General and is therefore included in the workforce figures for the Attorney-General’s Department. Members of boards and committees are not included in the workforce figures contained in this report as, while they may receive an honorarium payment for time spent attending board and committee meetings, they are not employees of the boards or committees. The organisation or function that they represent may be staffed by SA Public Sector employees. Historical employment information is available from June 1985 for many of the organisations included under the current definition of the SA Public Sector. Historical information on agencies which are no longer a part of the South Australian state public sector and those which were not included in the workforce figures from their inception is generally not available. It is possible that historical information gives an underestimation of the level of public sector employment. This is particularly the case for historical data, which was collected and reported prior to the adoption of the standardised ABS classification in 1992. Historical information in this report may differ slightly from previously published figures due to the subsequent correction of any errors or anomalies that have been discovered.

Explanation of Terms Persons counted as employees are those paid and/or in receipt of a salary in the last full pay period prior to the last day of June. Due to differing pay period end dates this may vary across public sector organisations. These include:
persons on the payroll persons on leave paid in advance persons receiving workers compensation payments persons paid from funds administered by the organisation statutory appointees eg. Judges, Commissioners casuals and persons paid on an hourly or sessional basis Education Act relief and contract teachers ministerial employees and electorate secretaries vacational students employees appointed on a term or contract basis supernumerary employees employed under special recruitment schemes persons employed and paid under the federal Government’s Australian
Apprenticeships Incentive Program or Career Start SA (formerly South Australian Government Youth Training Initiative) i.e.: trainees, apprentices.
persons employed and paid under the SA Public Sector Graduate Recruitment Register
National Indigenous Cadetship Program (NICP) participants who are undertaking a 12 month temporary placement
Government Ministers (included under Legislature only). Persons excluded from the calculation are:
persons on leave without pay (reported separately in Table 25) members of part time boards and committees persons working on a fee for service contract and paid on a non-time basis eg. cleaners paid per square metre
persons employed on a temporary hourly basis from external employment agencies
TAFE 84 employees, working for Further Education, Employment, Science, and Technology
persons working under the Work for the Dole scheme. Please note: Employment levels and Full time Equivalent (FTE) employment is subject to systematic and seasonal fluctuations which determines both the number of employees and the number of hours worked in any given pay period.
3

4
Full time Equivalent (FTE) The full time equivalent (FTE) of employees is the estimated number of full time personnel whose total work hours per week would be the same as that of existing full time and part time employees. To calculate a full-time equivalent, each part-time employee is counted as a decimal fraction by dividing the number of hours worked each week by the normal full time hours per week for that position. For example, in a position in which 37.5 hours each week is full-time: 30.0 hours =0.8 FTE 37.5 hours =1.0 FTE An employee cannot be expressed as more than one full-time equivalent (1.0). The FTE for Casuals worked in the last pay period is calculated based on hours worked/full time hours. For the purpose of this report they are not an average but a snapshot, casuals who did not work in the last pay period are not included in this reporting.
Average FTEs Over Period The average full-time equivalent (FTE) of employees is the estimated average number of full time personnel over a financial year. The number of intervals within the period will be used to calculate the average FTE figure over the period. Generally either fortnightly or monthly intervals are used. Once this is determined, the average FTE figure is calculated as follows: Sum of FTE’s at the end of each interval divided by the number of intervals, for example, to calculate the average FTE figure using monthly intervals for the period January 1 to June 30, assuming that the FTE figure for the last day of each month was 61.0 at January, 60.1 at February, 63.2 at March, 63.4 at April, 67.3 at May, 64.2 at June, the calculation would be: Average FTE = 61.0+ 60.1+ 63.2 + 63.4 + 67.3 + 64.2 divided by 6 (number of months) = 63.2.

Employee Type For the purposes of this report employees have been reported under the following broad employee type categories. These categories represent the major employee groups across the SA Public Sector: Children’s Service Act The Children’s Services Act workforce covers all persons engaged under the Children’s Services Act, 1985. Children's Services Act employees are pre-school teaching staff (including permanent, contract and relief Children's Services Officers), seconded teachers who are employed to develop curriculum, early childhood workers (engaged under the Early Childhood Workers Award) who provide a support and assistance function to South Australian public pre-school sites, and pre-school directors who teach children and manage staff/sites in South Australian public pre- schools. Children’s Services employees are employed by the Department for Education and Child Development. Disability Services Officers The disability services officer workforce covers those persons employed by Disability SA (Department for Communities and Social Inclusion) under the Intellectual Disability Services Award. These employees provide daily living support to residents who have an intellectual disability. Education Act The Education Act workforce encompasses all persons engaged under the Education Act, 1972, excluding School Services Officers and Aboriginal Education Workers who are reported elsewhere. Education Act employees include; teachers; seconded teachers employed to develop curriculum or provide specialist support such as training or advice; coordinators, assistant principals and deputy principals who manage a specific function, project(s) or a team of teachers (deputy principals also act in the principals’ absence); and principals who are responsible for the development and achievement of the schools’ goals and objectives, manage staff and the physical and financial resources of the school. Education Act employees also include hourly paid instructors and temporary relieving teachers who are employed on a casual or ad hoc basis to backfill teaching staff absent on leave (such as sick leave or leave without pay to a maximum of 20 continuous working days). Education Act employees are employed by the Department for Education and Child Development.
5
6
Emergency Services The emergency services workforce comprises fire fighters from the South Australian Metropolitan Fire Service and ambulance officers from the South Australian Ambulance Service. Volunteer fire fighters from the South Australian Country Fire Service and volunteer emergency workers from the SA Fire and Emergency Services Commission are not included as public sector employees. Executives Executives are defined as employees who: Receive a total salary equivalent to $106,608 per annum or more (equating to EL1 minimum under the public service structure). or Receives a Total Remuneration Package Value (TRPV) type contract equivalent to $134,013 per annum or more (equating to ExA minimum under the PS Act). A total remuneration package includes monetary benefits such as salary and allowances, plus employer superannuation contributions and other non-monetary benefits such as a vehicle. AND: Has professional or managerial ‘executive’ responsibilities (and therefore not receiving a salary or TRPV in the range described above based only on additional allowances paid for specialist skills or for the purposes of attraction and retention). or Occupies a position having a work value of 670 points or more (using the Cullen Egan Dell assessment tool). or Is appointed pursuant to either Part 6 (Division 3) or Part 7 (Division 2) of the PS Act 2009. or Is employed under the PS Act in any of the following classification types EL, EX, MLS, or SAES. A total remuneration package may include monetary benefits such as salary and allowances, plus non-monetary benefits such as the use of a vehicle and employer superannuation contribution. This definition does not include persons with non-executive responsibilities who are paid additional allowances for specialist skills or for the purposes of attraction and retention, which take them over the financial thresholds listed above. This employee type includes statutory appointments, managers, chief executive officers, professional specialists, medical officers, nurses and legal services officers employed at the executive level across the administrative units and other public sector organisations.

Medical Officers Medical Officers are all those persons engaged under the South Australian Medical Officers Award. It includes all senior registrars, medical officers, medical practitioners, visiting medical specialists and consultants. Nurses Award The nursing workforce covers all persons engaged under the Nurses (South Australian Public Sector) Award. It includes all registered and enrolled nurses, nurse educators, clinical nurses and nurse managers employed within the South Australian health sector. Other Acts and Awards Includes statutory appointees (for example Commissioners and the State Coroner, the Official and Deputy Secretaries of Government House, and the Employee Ombudsman), Ministerial appointees, electorate secretaries, parliamentary officers, Aboriginal Education Workers, Medical and Grant Funded Scientists, Clinical Academics and Dental Officers (dentists). This employee group also includes any other persons not categorised in the employee types listed who are employed in organisations that meet the definition of a public sector organisation. Police Act The Police Act workforce covers all persons engaged under the Police Act, 1998. Police Act employees are employed by South Australia Police and include police officers, police cadets and community constables. Public Sector (PS) Act Public Sector Act employees refer to those persons who are employed under the Public Sector Act, 2009 (PS Act). This group of employees generally include persons employed across the five major remuneration structures of Administrative Services, Operational Services, Professional Officers, Technical Grades and Allied Health Professionals. PS Act employees are employed as ongoing, contract short-term, contract long-term and contract casual employees. For the purposes of public sector wide reporting, the contract casual appointment type will be reported under the other appointment type.
7

8
Public Sector Salaried Award Public sector salaried employees are those persons employed under the SA Government (Public Sector Salaried Employees) Salaries Interim Award in ‘other public sector organisations’. This award mirrors the PS Act conditions of employment. It generally includes persons employed across the remuneration structures of Administrative Services, Operational Services, Professional Officers, Technical Grades and Allied Health Professionals. School Services Officers School services officers covers all persons engaged under the School Services Officers (Government Schools) Award. These employees provide an administration and support function to South Australia’s public schools and are employed by the Department for Education and Child Development. Technical and Further Education (TAFE) Act Technical and Further Education Act employees are lecturers and hourly paid instructors who work in the TAFE Institutions. These employees are employed under the Technical and Further Education Act, 1975 in the Department of Further Education, Employment, Science and Technology. Trainee, Apprenticeship and Graduate Entry Programs This employee type covers a range of trainee, apprenticeship and graduate entry programs through which people can be employed in the public sector workforce. It includes young people (17 to 24 years) engaged as entry level trainees through Career Start SA, and the Australian Apprenticeships Incentive Program, and those who enter the public sector workforce through a range of graduate recruitment programs including the SA Public Sector Graduate Recruitment Register. These employment programs can receive funding assistance from the Commonwealth Government and/or the State Government and the employing organisation. Weekly Paid Awards The weekly paid workforce refers to all persons employed under weekly paid awards. These employees are generally engaged in hourly, daily or weekly wages or piecework rates of pay and their wages are not based on an annual salary. They include health ancillary employees employed within the SA health sector and Government Service Officers across a range of departments. It excludes Education Act and TAFE Act hourly paid instructors.

Appointment Type Ongoing The employment is on an ongoing basis and does not have an end date, that is, it is considered to be ‘permanent’. This includes full time and part time employment. Term Employment The employment is on a fixed term basis and has a clear end date. That is the date at which that particular employment contract ends is clearly stated. The appointment can be on either a short term or long term basis. For reporting purposes, any contract appointment overrides the previous appointment type of an employee. For example, an ongoing employee who is subsequently appointed on a term basis is deemed to be contract, not ongoing. This appointment type does not include casuals. Persons employed on a full time and part time basis are included in this appointment type. Note that a portion of contract employees may have a right to ongoing employment in the SA Public Sector at the conclusion of their current contract, and this is commonly called a tenured or substantive position. Short term Contract The employment contract is for a period up to and including one year. Persons who have been appointed on a number of short term contracts should be recorded as contract short term regardless of the length of time they have been with a single employer or in a single position. For example, an employee appointed on a one year contract basis who is subsequently granted an extension or appointed on another one year contract basis is deemed to be contract short term, not contract long term or ongoing. Long term Contract The employment contract is for a period that extends beyond one year, which is from between one to five years. Persons who have been appointed on a number of long term contracts should be recorded as contract long term regardless of the length of time they have been with a single employer or in a single position. For example, an employee appointed on a three year contract basis who is subsequently granted an extension or appointed on
9

10
another three year contract basis is deemed to be contract long term not ongoing. Chief executives must be recorded as contract long term employees. Other PS Act and Weekly Paid casuals, Education Act relief teachers, TAFE Act hourly paid instructors, Children’s Services Act relief teachers and relief early childhood workers, and any other employees not appointed on an ongoing, short term or long term contract basis. Casual (PSM Act) PS Act casual employees have a term of employment of less than 12 months and usually 15 hours or less per week, or an irregular basis. For the purposes of public sector wide reporting the casual contract appointment type is reported under the appointment type “Other”.
Employment Status The majority of public sector employees are employed on a full time basis. Employees can also be employed on a part time basis. The definition of part time may differ between groups of employees as a full time workload can vary from 37.5 to 38.0 to 40.0 hours per week depending on the occupation and conditions of employment. Part-time employees are therefore persons who are engaged for less than the normal full time hours per week for that occupation or position. Casual employees by definition are recorded as part-time employees.
Aboriginal and/or Torres Strait Islanders Employment Aboriginal and/or Torres Strait Islander employees are those persons who are a descendant of an Australian Aboriginal and/or Torres Strait Islander, who identifies as an Aboriginal and/or Torres Strait Islander, and are recognised as Aboriginal and/or Torres Strait Islander by members of the community in which he or she lives or has lived in.

The workforce data presented in this report is likely to under represent the true level of Aboriginal and/or Torres Strait Islander employment in public sector agencies due to the difficulties associated with:
some agencies extracting characteristics of their workforce to this level of detail from their current information systems
collecting data that relies on self-identification.
Leave Balances Sick Leave The absence, whether paid or unpaid, resulting from an employee being too ill to work, and where the illness or injury is due to a cause which does not entitle the employee to workers’ compensation. Family Carer’s Leave Absences on account of family leave (with or without pay). FTE Sick Days for Period The total number of FTE sick days over a period is calculated by converting the total number of sick days and portions of days taken over the period into hours. Once this is determined the total FTE sick days for the period can be calculated by:
Sum the hours of sick leave taken and divide by the normal full time hours per day of that employee type (e.g. 6.0, 7.5 or 8.0 hour working day).
For example, to calculate the total FTE sick days leave for 8 employees
assuming that over the financial year period they took sick leave of 7.5 hours, 6.2 hours, 7.5 hours, 22.5 hours, 37.5 hours, 0.5 hours, 7.5 hours and 15.0 hours, the calculation would be:
Sum sick leave hours (7.5 + 6.2 + 7.5 + 22.5 + 37.5 + 0.5 + 7.5 + 15.0 =
104.2) and divide by the normal full time hours per day (7.5). This will give you the total FTE sick days for the period (=13.9).
11
12
Separation and Recruitment Separated employees include all employees who have left a public sector agency during a financial year. Excludes all temporary appointments/assignments to other public sector agencies and those on short or long term unpaid leave. Note, the workforce information present in this report only indicates the number of employees who permanently separated from a public sector position and therefore consequently may have undertaken further employment in another SA Public Sector position. Recruited employees includes employees who were appointed to a position within a public sector organisation during a financial year. Recruitment does not include employees who have returned from leave without pay, or were already employees of an agency (i.e. either have won the position in the same agency they are already working, or have returned from contract employment in another agency). Note that the workforce information present in this report only indicates the number of employees who have started new in a public sector organisation and therefore consequently may have originated from another SA Public Sector organisation.
Disability Reporting Disability is defined under Section 4 of the Commonwealth Disability Discrimination Act 1992 as:
total or partial loss of the person's bodily or mental functions; or total or partial loss of a part of the body; or the presence in the body of organisms causing disease or illness; or the presence in the body of organisms capable of causing disease or
illness; or the malfunction, malformation or disfigurement of a part of the person's
body; or a disorder or malfunction that results in the person learning differently from
a person without the disorder or malfunction; or a disorder, illness or disease that affects a person's thought processes,
perceptions of reality, emotions or judgment or that results in disturbed behavior.
Disability requiring adaptation is defined as: People with a permanent disability are those employees who, due to their disability, are considered to have an employment restriction because they:
are restricted in the type of work they could do

need modified hours of work (either a restriction in hours they could work, different time schedules, or flexible hours of attending)
require an employer to provide adaptive equipment, a modified work environment, or make other special work related arrangements
need to be given ongoing assistance or supervision to carry out their duties safely.
The workforce data presented in this report is likely to under represent the true level of disability employment in public sector agencies due to the difficulties associated with:
some agencies extracting characteristics of their workforce to this level of detail from their current information systems
collecting data that relies on self-identification.
Salary Non - Executives Total base salary is reported. This is pre-tax income excluding superannuation and Fringe Benefit Tax (FBT).
non-executive employees on salary sacrifice arrangements are shown as pre-sacrifice values
non-financial benefits and allowances are excluded from total base salary for non-executive employees
Executives
Executive employees report their Total Remuneration Package Value (TRPV). This is made up of the financial benefits component plus employer superannuation contributions and motor vehicle component
The salary brackets have been constructed as an approximation to the level of responsibility, and are based on the remuneration structures of the PS Act Administrative Services Stream at June The salary reported is what the employee would receive if they were employed on a full-time basis at their current classification, for the whole financial year, and should only be used as an indicator of responsibility level and not reflective of actual salary earnings for the financial year.
13

14
Length of Service to Agency Length of service to the agency provides an indication of the stability of the workforce and the continuity of employment within agencies and contributes to workforce planning research. The length of service of employees is calculated on an employees start date in a public sector agency in years from the last pay period of June.
Length of Service to Public Sector Length of service to the public sector provides an indication of the stability of the workforce and the continuity of employment across the sector and contributes to workforce planning research. The length of service of employees is calculated on an employee’s start date in the public sector in years from the last pay period of June.
Primary Work Location Primary Work Location is based on the Statistical Local Area (SLA) and is an Australian Standard Geographical Classification (ASGC) defined area. (Australian Bureau of Statistics (ABS), Statistical Geography Volume 1: Australian Standard Geographical Classification (ASGC) 2001 (cat. no. 1216.0)
Some public sector employees may work in multiple locations or travel constantly across the State as work requirements dictate. These employees have been recorded in the location where they spend the majority of their time, or in a smaller number of instances, the central location to which they report.

SOUTH AUSTRALIAN PUBLIC SECTOR WORKFORCE INFORMATION
RECONCILIATION OF THE 2012-2013 BUDGET PAPERS WORKFORCE FIGURES
Phone: (08) 8226 3492Email: [email protected] www.oper.sa.gov.au

Reconciliation of the 2012-13 Budget Papers Workforce Figures Figures published in the Department of Treasury and Finance 2012-13 Budget Papers provide estimated employment figures for individual agencies, for the general government sector and total South Australian Public Sector as at June 2012. The following table has been designed to align the SA Public Sector figures in this report with the 2012-13 Budget Papers. Please Note: The 2012-13 Budget Papers provided ‘estimated results’ for 30 June 2012 which were compiled prior to year-end and were established consistent with agency salary and wages budget expenditure levels. The SA Public Sector Workforce Information at June is designed to provide detail on workforce characteristics of the SA Public Sector only, and collects actual full time equivalent figures for the purposes of human resource policy, not budgeted salaries and wages information at the general government sector level. Discretion should therefore be executed when using, and care taken when comparing, these two sources.
Male Female Total Male Female Total
Adelaide and Mount Lofty Ranges NRM Board 34.2 40.2 74.4 34.0 39.1 73.1 -1.8%
Adelaide Festival Corporation (1) 1.0 16.0 17.0 4.0 20.2 24.2 42.4%Alinytjara Wilurara NRM Board 5.0 6.5 11.5 4.0 5.8 9.8 -14.8%Ambulance Service, SA 699.5 524.0 1,223.5 690.7 477.7 1,168.3 -4.5%Arid Lands NRM Board 9.0 17.2 26.2 7.5 13.7 21.2 -19.1%
Attorney-General's (2) 536.8 877.4 1,414.2 453.6 737.7 1,191.3 -15.8%Auditor-General's 53.8 56.2 110.0 54.8 61.4 116.2 5.6%Bio Innovation SA 6.0 6.2 12.2 7.2 7.4 14.6 19.7%Carclew Youth Arts Centre Incorporated 2.0 14.2 16.2 2.0 11.4 13.4 -17.3%
Communities and Social Inclusion (3) 1,468.1 3,409.6 4,877.7 1,105.0 2,298.5 3,403.5 -30.2%Correctional Services 981.0 597.2 1,578.2 1,003.4 637.6 1,641.0 4.0%Country Arts, SA 13.6 43.5 57.1 14.2 46.1 60.2 5.5%Country Fire Service, SA 69.6 49.2 118.8 68.5 50.9 119.4 0.5%
Courts Administration Authority (4) 226.2 487.1 713.3 235.5 483.6 719.1 0.8%Dairy Authority of SA 2.6 0.8 3.4 1.4 0.8 2.2 -35.3%
Defence SA (5) 21.7 16.9 38.6 16.7 9.6 26.3 -31.8%Education Adelaide 3.0 5.6 8.6 4.0 5.0 9.0 4.7%
Education and Child Development (6) 5,549.5 15,181.3 20,730.8 5,965.8 16,723.9 22,689.7 9.5%Electoral Commission of SA 3.0 15.5 18.5 6.0 15.1 21.1 14.1%
Electorate Offices (7) 55.0 142.8 197.8 58.2 137.3 195.5 -1.2%
Environment and Natural Resources (8) 604.8 493.5 1,098.3 585.5 498.4 1,083.9 -1.3%Environment Protection Authority 121.7 93.3 215.0 123.1 95.2 218.2 1.5%Essential Services Commission SA 9.4 10.5 19.9 12.4 13.0 25.4 27.7%Eyre Peninsula NRM Board 19.6 14.4 34.0 15.4 11.3 26.7 -21.5%Film Corporation, SA 8.6 17.1 25.7 7.6 16.7 24.3 -5.5%
1,370.2 1,974.4 3,344.6 1,307.9 1,987.3 3,295.2 -1.5%
Government House (10) 6.0 12.4 18.4 - - - -100.0%
Health Units (11) 6,079.7 21,041.8 27,121.4 6,066.7 21,416.1 27,482.8 1.3%
Health and Ageing, Department of (12) 778.6 1,068.7 1,847.3 794.0 1,190.7 1,984.7 7.4%
Full Time Equivalent (FTE) Employment in the SA Public Sector by Budget Sectors at June 2011 and June 2012
As at June 2011Full time Equivalent
As at June 2012Full time EquivalentPublic Sector Agencies *
General Government Sector
Further Education, Employment, Science and Technology (9)
% Change
g g pHistory Trust of SA 13.5 31.4 44.9 14.0 31.4 45.4 1.2%Independent Gambling Authority 2.1 5.3 7.4 1.1 5.7 6.8 -8.9%
Judiciary (13) 67.8 20.4 88.2 - - - -100.0%Kangaroo Island NRM Board 8.6 7.7 16.3 9.5 7.8 17.3 6.1%Legislature (Including Members) 95.6 76.2 171.8 94.7 80.3 175.0 1.9%Local Government Grants Commission, SA 1.0 0.8 1.8 1.0 0.8 1.8 0.0%
Manufacturing, Innovation, Trade, Resources and Energy (14) 65.0 56.4 121.4 235.1 187.0 422.1 247.7%Metropolitan Fire Service, SA 898.7 30.6 929.3 923.2 40.9 964.1 3.7%Murray Darling NRM Board 37.7 33.8 71.5 35.7 36.7 72.4 1.3%Northern and Yorke NRM Board 12.0 15.1 27.1 13.0 10.1 23.1 -14.8%Office of the Outback Communities Authority 4.0 2.0 6.0 2.0 2.0 4.0 -33.3%
Planning and Local Government (15) 81.5 81.8 163.3 - - - -100.0%
Planning, Transport and Infrastructure (16) 1,868.7 1,101.0 2,969.7 2,432.8 1,031.2 3,464.1 16.7%Playford Centre 2.0 1.8 3.8 1.0 1.0 2.0 -47.4%Police Complaints Authority 2.0 7.6 9.6 1.0 8.0 9.0 -6.3%
Police, SA (17) 3,853.8 1,693.7 5,547.5 3,922.1 1,726.5 5,648.6 1.8%
Premier and Cabinet (18) 438.1 668.9 1,107.0 937.7 1,405.7 2,343.4 111.7%
Primary Industries and Regions (19) 745.1 476.6 1,221.7 567.8 374.8 942.6 -22.9%SA Fire and Emergency Services Commission 44.6 41.7 86.3 33.6 38.5 72.1 -16.5%SACE Board of SA 34.2 60.3 94.5 37.3 56.7 94.0 -0.5%
South Australian Small Business Commissioner (20) - - - 3.2 3.0 6.2 100.0%South East NRM Board 17.0 17.9 34.9 19.3 17.9 37.2 6.6%State Emergency Services, SA 20.6 17.0 37.6 18.0 13.0 31.0 -17.6%
State Opera of SA (21) 1.0 2.0 3.0 2.0 2.0 4.0 33.3%State Theatre Company 8.0 15.3 23.3 8.3 15.2 23.5 0.9%Tourism Commission, SA 47.4 94.2 141.6 42.0 71.7 113.7 -19.7%
Treasury and Finance (22) 629.7 664.7 1,294.4 297.7 238.8 536.5 -58.6%Water, Department for 212.6 154.4 367.0 195.3 136.4 331.7 -9.6%Zero Waste SA 10.5 12.6 23.1 9.5 13.7 23.2 0.6%Total General Government Sector 27,962.0 51,624.6 79,586.5 28,506.9 52,568.1 81,075.0 1.9%Judiciary (13) 82.8Total General Government Sector including the Judiciary 81,157.8

Full Time Equivalent (FTE) Employment in the SA Public Sector by Budget Sectors at June 2011 and June 2012
Adelaide Cemeteries Authority 38.4 12.8 51.3 40.0 14.6 54.6 6.6%
Adelaide Convention Centre (21) 141.0 88.6 229.6 136.9 90.4 227.3 -1.0%
Adelaide Entertainments Corporation (21) 27.6 29.8 57.4 33.8 37.3 71.1 24.0%
Adelaide Festival Centre Trust (21) 119.3 117.8 237.1 123.2 113.3 236.5 -0.2%
Forestry SA 141.0 39.7 180.7 137.7 39.8 177.5 -1.8%
Housing Trust, SA (Housing SA) 383.7 584.6 968.2 314.0 539.3 853.3 -11.9%
Land Management Corporation (23) 53.8 37.8 91.6 - - - -100.0%
Lotteries Commission of SA 40.0 40.2 80.2 39.8 38.9 78.7 -1.9%
Motor Sport Board, SA 1.0 10.2 11.2 2.0 8.3 10.3 -8.0%
Public Trustee (24) 69.5 84.3 153.7 69.9 98.0 167.9 9.2%
RESI Corporation (25) 0.5 0.0 0.5 0.5 0.0 0.5 0.0%
TransAdelaide/Office of the Rail Commissioner (26) 629.5 101.6 731.1 - - - -100.0%
Urban Renewal Authority (27) - - - 109.9 77.7 187.6 100.0%
Water Corporation, SA (28) 1,138.2 391.7 1,529.9 1,191.6 403.8 1,595.4 4.3%
West Beach Trust 33.9 51.6 85.4 36.0 54.3 90.3 5.7%
Total Public Non-Financial Corporations Sector 2,817.3 1,590.6 4,407.9 2,235.3 1,515.7 3,751.1 -14.9%
Asset Management Corporation, SA 1.2 0.0 1.2 1.2 0.0 1.2 -0.8%
Funds SA 10.5 11.1 21.6 10.5 12.2 22.7 5.1%
HomeStart Finance 38.8 51.5 90.3 44.8 51.6 96.4 6.7%
Motor Accident Commission 7.8 18.0 25.8 10.4 17.8 28.2 9.4%
SA Government Financing Authority (SAFA) (29) 55.3 41.8 97.1 56.3 39.0 95.3 -1.8%
WorkCover Corporation 114.4 162.0 276.5 116.6 161.8 278.4 0.7%
Total Public Financial Corporations Sector 228.1 284.3 512.4 239.8 282.3 522.1 1.9%
Total Budgeted SA Public Sector Employment 31,007.3 53,499.5 84,506.8 30,982.0 54,366.1 85,348.1 1.0%
85,430.9
Public Non-Financial Corporations Sector
Public Financial Corporations Sector
Total Budgeted SA Public Sector Employment including the Judiciary
Non-Budget Entities **Male Female Total Male Female Total
Aboriginal Lands Trust (30) 4.0 3.6 7.6 - - - -100.0%
Citrus Industry Development Board, SA 1.0 2.3 3.3 1.0 2.3 3.3 0.0%
Disability Information & Resource Centre Inc 1.1 5.4 6.4 1.1 5.2 6.3 -2.5%
Jam Factory Contemporary Craft and Design Inc. 6.0 12.8 18.8 6.1 11.7 17.8 -5.4%
Legal Services Commission 54.7 131.2 185.9 51.3 139.7 191.0 2.7%
National Aboriginal Cultural Institute-Tandanya 4.3 9.0 13.3 4.2 5.0 9.2 -31.1%
Occupational Therapy Board of SA (31) 0.0 0.6 0.6 - - - -100.0%
Phylloxera and Grape Industry Board of SA 2.6 1.0 3.6 2.6 1.0 3.6 0.0%
Renmark Irrigation Trust 16.1 4.2 20.3 14.8 4.2 19.0 -6.4%
State Superannuation Office (SuperSA) (29) 42.6 53.4 96.0 46.5 63.0 109.5 14.1%
Teachers Registration Board 5.0 13.0 18.0 5.0 13.0 18.0 0.0%
Veterinary Surgeons Board 0.0 1.5 1.5 0.0 1.5 1.5 0.0%
Total Non-Budget Entities 137.4 238.0 375.3 132.5 246.5 379.1 1.0%
Full time Equivalent Full time EquivalentAs at June 2011 As at June 2012
% Change

Full Time Equivalent (FTE) Employment in the SA Public Sector by Budget Sectors at June 2011 and June 2012
*
**
(1)
(2)
(3)
(4)
(5)
(6)
(7)
(8)
(9) Excludes Bio Innovations SA, this entity is reported separately. For reporting purposes excludes TAFE84 employees as they do
Excludes the Office of the Public Trustee of South Australia and Police Complaints Authority employees, these entities are reported separately. Excludes employees in the Office for Youth, Office for Volunteers, Office for Women, and Multicultural SA, transferred to the Department for Communities and Social Inclusion on 1 January 2012.
Excludes persons employed under Special Acts and the Judicial Administration Act.
Also referred to as Electorate Services. Includes all persons employed under the Assistants to the Members of the South Australian Parliament Enterprise Agreement.
Excludes a number of employees transferred to Urban Renewal Authority on 1 March 2012
Includes employees in the Sustainability and Climate Change Division transferred from the Department of the Premier and Cabinet on 1 January 2012.
Formerly Department for Families and Communities. Includes employees in the Office for Youth, Office for Volunteers, Office for Women, and Multicultural SA transferred from the Attorney General's Department on 1 January 2012. Includes employees in the Office for the Southern Suburbs and Office for the Northern Suburbs transferred from the former Department of Planning and Local Government on 1 January 2012. Includes employees in the Social Inclusion Unit transferred from the Department of the Premier and Cabinet on 1 December 2011.
Excludes employees in Families SA (except employees substantively employed in the operational unit known as Youth Justice) and a number of employees transferred to the Department of Education and Child Development on 1 January 2012. Excludes employees in the Aged Care Assessment Team and a number of employees transferred to the Department for Health and Ageing on 1 January 2012. Excludes a number of employees transferred to the Urban Renewal Authority on 23 April 2012. Excludes SA Housing Trust (Housing SA), this entity is reported separately under Public Non-Financial Corporations Sector.
Formerly the Department of Education and Children's Services. Includes employees in Families SA (except employees substantively employed in the operational unit known as Youth Justice) and a number of employees transferred from the Department for Communities and Social Inclusion on 1 January 2012.
As the Adelaide Festival was previously held every second year, significant fluctuation could occur in temporary staff numbers between annual collections.
For reporting purposes administered items not individually listed on the above table are included under their administering organisation or department.
The entities listed under this category are outside the scope of the South Australian Public Sector for budget reporting purposes on the basis of the Australian Bureau of Statistics (ABS) Uniform Presentation Framework definitions for public sector financial reporting. However, as some employees of these non-budget entities meet the criteria set out for inclusion as public sector employees for the purposes of the Commissioner for Public Employment's workforce collection, they are included here to provide a reconciliation of total FTEs to the FTE totals reported throughout the remainder of this document.
( )
(10)
(11)
(12)
(13)
(14)
(15)
(16)
(17)
From June 2012, Government House is included as part of the Department of the Premier and Cabinet.
These figures incorporate the total workforce of the Health Units (SA Health Regions) incorporated under the SA Health Care Act, which took effect on 1 July 2008.
Formerly Department of Health. Includes employees in the Aged Care Assessment Team and a number of other employees transferred from the Department for Communities and Social Inclusion on 1 January 2012.
The Courts Administration Authority, which provides administrative support to the Judiciary, advised the Office of Public Employment and Review that it will no longer provide employee level data for the purposes of the workforce information collection because members of the Judiciary are not public sector employees.
In order to reconcile the Workforce Information Collection figures with the 2012-13 Budget Papers, the total FTE for the Judiciary is reported separately in these tables.
Formerly the Department of Trade and Economic Development. Includes employees in the Energy Division transferred from the Department of Planning, Transport and Infrastructure on 1 January 2012. Includes employees in Renewables SA transferred from the Department of the Premier and Cabinet on 1 January 2012. Includes employees in the Minerals and Energy Resources Division, Olympic Dam Task Force, and a number of employees transferred from the Department of Primary Industries and Regions on 1 January 2012.
Excludes a number of employees transferred to the Department of the Premier and Cabinet on 1 January 2012. Excludes a number of employees transferred to the Department of Primary Industries and Regions on 1 January 2012.
Includes Police Security and Police Band.
y p p y p g p p p y ynot meet the definition of a SA Public Sector employee. Includes employees in the Office of the Minister for Employment, Higher Education and Skills transferred from the former Department of Planning & Local Government on 1 January 2012.
Abolished in 2011. Employees transferred to the Department for Planning, Transport and Infrastructure, Department of the Premier and Cabinet, Department for Communities and Social Inclusion, and Department of Further Education, Employment, Science and Technology.
Formerly the Department for Transport, Energy and Infrastructure. Includes employees in the Office for Recreation and Sport and Office for Racing, and a number of other employees transferred from the former Department of Planning and Local Government on 1 December 2012. Includes employees transferred from TransAdelaide/Office of the Rail Commissioner in 2012.
Excludes employees in the Office of the Chief Information Officer and Services SA transferred to the Department of the Premier and Cabinet on 1 January 2012. Excludes employees in the Energy Division transferred to the Department of Manufacturing, Innovation, Trade, Resources and Energy on 1 January 2012.

Full Time Equivalent (FTE) Employment in the SA Public Sector by Budget Sectors at June 2011 and June 2012
(18)
(19)
(20)
(21)
(22)
(23)
(24)
(25)
(26)
Established in March 2012.
Previously known as ETSA Corporation. Holding company for RESI Power Corporation and Transmission Lessor Corporation. Other related organisations RESI OE Pty Ltd, RESI Power Pty Ltd and RESI Syn Pty Ltd currently have no employees. The Department of Treasury and Finance provide business and administrative services for these organisations.
Functions transferred from TransAdelaide (PNFC sector) to the Office of the Rail Commissioner (PNFC sector) in September 2010. Employees transferred to the Department for Planning, Transport and Infrastructure in 2012
Abolished in 2012. Employees transferred to the Urban Renewal Authority.
For reporting purposes excluded from the Attorney-General's Department.
The number and type of functions managed determines the amount of casual work available in each pay period. The figure provided is only representative of this organisation's workforce as at the reporting period and should not be considered a reflection of the overall workforce for the year.
Excludes Super SA and SAFA and Electorate Offices, these entities are reported separately. Includes a number of employees transferred from the former Department of Planning and Local Government on 1 December 2011. Excludes employees in Shared Services SA transferred to the Department of the Premier and Cabinet on 1 February 2012. This differs from the FTE figure reported in the 2012-13 Agency Statement for the Department of Treasury and Finance, which includes FTEs for SAFA and Super SA.
Includes a number of Boards (Art Gallery, Libraries, Carrick Hill, Museum) that are not included in the FTE figures reported in the 2012-13 Agency Statement for the Department of The Premier and Cabinet (Budget Paper 4, Volume 4).
Excludes SA Local Government Grants Commission and Outback Areas Community Development Trust, these entities are reported separately. Includes employees from Government House. Includes a number of employees transferred from the Department of Manufacturing, Innovation, Trade, Resources and Energy, employees in the Office for State/Local Government Relations transferred from the former Department of Planning and Local Government, employees in the Office of the Chief Information Officer and Services SA transferred from the Department of Planning, Transport and Infrastructure on 1 January 2012. Includes employees in Shared Services SA transferred from the Department of Treasury and Finance on 1 February 2012.
Excludes employees in the Social Inclusion Unit transferred to the Department for Communities and Social Inclusion on 1 December 2011. Excludes employees in Renewables SA transferred to the Department for Manufacturing, Innovation, Trade, Resources and Energey on 1 January 2012. Excludes employees in the Sustainability and Climate Change Division transferred to the Department for Environment and Natural Resources on 1 January 2012.
Formerly Department of Primary Industries and Resources. Includes a number of employees transferred from the Department for Manufacturing, Innovation, Trade, Resources and Energy on 1 January 2012. Excludes employees in the Minerals and Energy Resources Division, Olympic Dam Task Force and a number of employees transferred to the Department of Manufacturing, Innovation, Trade, Resources and Energy on 1 January 2012.
(27)
(28)
(29)
(30)
(31) From 1 July 2012 the Occupational Therapy Board of SA moved to the Australian Health Practitioner Regulation Agency and are no longer part of the South Australian Public Sector. Employee data for 30 June 2012 was unobtainable.
Established 1 March 2012. Includes all employees of the former Land Management Corporation transferred on 1 March 2012. Includes a number of employees transferred from Defence SA on 1 March 2012. Includes a number of employees transferred from the Department for Communities and Social Inclusion on 1 March 2012. This organisation trades as Renewals SA
This organisation trades as SA Water.
For reporting purposes excluded from the Department of Treasury and Finance.
The Aboriginal Lands Trust is not a public sector agency for the purposes of the Public Sector Act 2009 and are no longer included in the annual Workforce Information Collection

SOUTH AUSTRALIAN PUBLIC SECTOR WORKFORCE INFORMATION
JUNE 2012 – INFORMATION TABLES
Phone: (08) 8226 3492Email: [email protected] www.oper.sa.gov.au

Male Female Total Male Female Total
679 1,127 1,806 1,567.9 534 920 1,454 1,359.3 -19.5%
54 61 115 110.0 55 66 121 116.2 5.2%
1,951 4,477 6,428 5,845.9 1,627 3,432 5,059 4,256.8 -21.3%
1,005 648 1,653 1,578.2 1,030 688 1,718 1,641.0 3.9%
22 17 39 38.6 17 10 27 26.3 -30.8%
6,416 19,640 26,056 20,730.8 6,949 21,452 28,401 22,689.7 9.0%
3 16 19 18.5 6 16 22 21.1 15.8%
616 568 1,184 1,098.3 603 578 1,181 1,083.9 -0.3%
124 107 231 215.0 125 107 232 218.2 0.4%
1,638 2,643 4,281 3,344.6 1,539 2,607 4,146 3,295.2 -3.2%
796 1,180 1,976 1,847.3 803 1,300 2,103 1,984.7 6.4%
65 60 125 121.4 240 200 440 422.1 252.0%
84 92 176 163.3 - - - - -100.0%
1,903 1,219 3,122 2,969.7 2,467 1,127 3,594 3,464.1 15.1%
3,872 1,864 5,736 5,547.5 3,936 1,900 5,836 5,648.6 1.7%
456 744 1,200 1,107.0 960 1,557 2,517 2,343.4 109.8%
794 564 1,358 1,221.7 598 447 1,045 942.6 -23.1%
732 827 1,559 1,487.6 404 376 780 741.3 -50.0%
216 169 385 367.0 199 147 346 331.7 -10.1%
11 13 24 23.1 10 15 25 23.2 4.2%
Total Administrative Units 21,437 36,036 57,473 49,403.4 22,102 36,945 59,047 50,609.3 2.7%
Total FTE Administrative Units 19,945.4 29,458.0 49,403.4 20,500.4 30,108.9 50,609.3
Other Public Sector Organisations4 4 8 7.6 - - - - -100.0%
35 43 78 74 4 34 42 76 73 1 2 6%Ad l id d M t L ft R NRM B d
Planning and Local Government (9)
Police, SA (11)
Table 1 - South Australian Public Sector Employment, June 2011 and June 2012
Public Sector Agencies
As at June 2011 As at June 2012Persons
FTEsPersons
FTEs
Electoral Commission of SA
Administrative Units
Attorney-General's (1) *
Auditor-General's
Correctional Services
Defence SA (3) *
Education and Child Development (4) *
Premier and Cabinet (12) *
Primary Industries and Regions (13) *
Manufacturing, Innovation, Trade, Resources and Energy (8) *
Planning, Transport and Infrastructure (10) *
Environment and Natural Resources (5)
Environment Protection Authority
Communities and Social Inclusion (2) *
Further Education, Employment, Science and Technology (6) *
Health and Ageing, Department of (7)
Treasury and Finance (14) *
Water, Department for
Zero Waste SA
Aboriginal Lands Trust (15)
% Change in Headcount
35 43 78 74.4 34 42 76 73.1 -2.6%
39 15 54 51.3 41 17 58 54.6 7.4%
230 145 375 229.6 228 157 385 227.3 2.7%
54 84 138 57.4 93 118 211 71.1 52.9%
164 171 335 237.1 160 176 336 236.5 0.3%
1 18 19 17.0 4 22 26 24.2 36.8%
5 7 12 11.5 4 6 10 9.8 -16.7%
717 577 1,294 1,223.5 720 561 1,281 1,168.3 -1.0%
9 19 28 26.2 8 15 23 21.2 -17.9%
2 0 2 1.2 2 0 2 1.2 0.0%
7 7 14 12.2 9 9 18 14.6 28.6%
2 18 20 16.2 2 15 17 13.4 -15.0%
1 3 4 3.3 1 3 4 3.3 0.0%
29 87 116 57.1 35 85 120 60.2 3.5%
72 56 128 118.8 70 58 128 119.4 0.0%
247 553 800 713.3 257 547 804 719.1 0.5%
3 1 4 3.4 2 1 3 2.2 -25.0%
2 7 9 6.4 2 7 9 6.3 0.0%
3 6 9 8.6 4 5 9 9.0 0.0%
71 185 256 197.8 70 180 250 195.5 -2.3%
10 12 22 19.9 13 14 27 25.4 22.7%
21 18 39 34.0 16 14 30 26.7 -23.1%
Electorate Offices (19)
Essential Services Commission SA
Eyre Peninsula NRM Board
Dairy Authority of SA
Adelaide Cemeteries Authority
Adelaide Convention Centre (16)
Adelaide Entertainments Corporation (16)
Adelaide Festival Centre Trust (16)
Adelaide Festival Corporation (17)
Alinytjara Wilurara NRM Board
Adelaide and Mount Lofty Ranges NRM Board
Ambulance Service, SA
Arid Lands NRM Board
Asset Management Corporation, SA
Bio Innovation SA
Carclew Youth Arts Centre Incorporated
Citrus Industry Development Board, SA
Country Arts, SA
Country Fire Service, SA
Courts Administration Authority (18)
Disability Information & Resource Centre Inc
Education Adelaide

Male Female Total Male Female Total
Table 1 - South Australian Public Sector Employment, June 2011 and June 2012
Public Sector Agencies
As at June 2011 As at June 2012Persons
FTEsPersons
FTEs
% Change in Headcount
9 20 29 25.7 8 19 27 24.3 -6.9%
141 43 184 180.7 138 43 181 177.5 -1.6%
11 13 24 21.6 11 13 24 22.7 0.0%
6 14 20 18.4 - - - - -100.0%
7,069 27,501 34,570 27,121.4 7,114 28,667 35,781 27,482.8 3.5%
21 46 67 44.9 21 47 68 45.4 1.5%
39 61 100 90.3 45 58 103 96.4 3.0%
3 7 10 7.4 2 7 9 6.8 -10.0%
8 24 32 18.8 8 21 29 17.8 -9.4%
69 21 90 88.2 - - - - -100.0%
9 11 20 16.3 11 11 22 17.3 10.0%
54 40 94 91.6 - - - - -100.0%
56 150 206 185.9 53 160 213 191.0 3.4%
102 92 194 171.8 101 93 194 175.0 0.0%
1 1 2 1.8 1 1 2 1.8 0.0%
40 46 86 80.2 40 43 83 78.7 -3.5%
1,076 46 1,122 929.3 1,105 54 1,159 964.1 3.3%
8 19 27 25.8 11 19 30 28.2 11.1%
1 11 12 11.2 2 9 11 10.3 -8.3%
38 39 77 71.5 36 42 78 72.4 1.3%
5 9 14 13.3 5 5 10 9.2 -28.6%
12 18 30 27.1 13 12 25 23.1 -16.7%
0 1 1 0.6 - - - - -100.0%
4 2 6 6.0 2 2 4 4.0 -33.3%
3 1 4 3.6 3 1 4 3.6 0.0%
2 2 4 3.8 1 1 2 2.0 -50.0%
Occupational Therapy Board of SA (24)
Phylloxera and Grape Industry Board of SA
Playford Centre
Metropolitan Fire Service, SA
Motor Accident Commission
Motor Sport Board, SA
Murray Darling NRM Board
National Aboriginal Cultural Institute-Tandanya
Northern and Yorke NRM Board
Office of the Outback Areas Communities Authority
Legal Services Commission
Legislature (Including Members)
Local Government Grants Commission, SA
Lotteries Commission of SA
HomeStart Finance
Independent Gambling Authority
Jam Factory Contemporary Craft and Design Inc.
Judiciary (22)
Kangaroo Island NRM Board
Land Management Corporation (23)
Film Corporation, SA
Forestry SA
Funds SA
Government House (20)
Health Units (21)
History Trust of SA
2 10 12 9.6 1 10 11 9.0 -8.3%
18 6 24 20.3 16 6 22 19.0 -8.3%
1 0 1 0.5 1 0 1 0.5 0.0%
45 45 90 86.3 34 41 75 72.1 -16.7%
35 66 101 94.5 39 64 103 94.0 2.0%
- - - - 4 3 7 6.2 100.0%
20 20 40 34.9 21 20 41 37.2 2.5%
21 17 38 37.6 18 13 31 31.0 -18.4%
1 2 3 3.0 2 2 4 4.0 33.3%
8 18 26 23.3 9 18 27 23.5 3.9%
5 13 18 18.0 5 13 18 18.0 0.0%
48 104 152 141.6 43 81 124 113.7 -18.4%
631 105 736 731.1 - - - - -100.0%
- - - - 110 83 193 187.6 100.0%
0 2 2 1.5 0 2 2 1.5 0.0%
1,140 426 1,566 1,529.9 1,195 445 1,640 1,595.4 4.7%
39 82 121 85.4 40 85 125 90.3 3.3%
116 177 293 276.5 118 174 292 278.4 -0.3%
Total Other Public Sector Organisations 12,645 31,367 44,012 35,478.7 12,162 32,440 44,602 35,117.9 1.3%
Total FTE Other Public Sector Organisations 11,199.3 24,279.4 35,478.7 10,614.1 24,503.7 35,117.9
Total South Australian Public Sector (30) 34,082 67,403 101,485 84,882.1 34,264 69,385 103,649 85,727.2 2.1%Total South Australian Public Sector FTE 31,144.7 53,737.4 84,882.1 31,114.6 54,612.6 85,727.2
WorkCover Corporation
Urban Renewal Authority (28)
y
Police Complaints Authority
Renmark Irrigation Trust
RESI Corporation (25)
SA Fire and Emergency Services Commission
Teachers Registration Board
Tourism Commission, SA
TransAdelaide/Office of the Rail Commissioner (27)
Veterinary Surgeons Board
Water Corporation, SA (29)
West Beach Trust
SACE Board of SA
South East NRM Board
State Emergency Services, SA
State Opera of SA (16)
State Theatre Company
South Australian Small Business Commissioner (26)

*
(1)
(2)
(3)
(4)
(5)
(6)
(7)
(8)
(9)
(10)
(11)
(12)
Formerly the Department of Trade and Economic Development. Includes employees in the Energy Division transferred from the Department of Planning, Transport and Infrastructure on 1 January 2012. Includes employees in Renewables SA transferred from the Department of the Premier and Cabinet on 1 January 2012. Includes employees in the Minerals and Energy Resources Division, Olympic Dam Task Force, and a number of employees transferred from the Department of Primary Industries and Regions on 1 January 2012.
Excludes a number of employees transferred to the Department of the Premier and Cabinet on 1 January 2012. Excludes a number of employees transferred to the Department of Primary Industries and Regions on 1 January 2012.
Formerly the Department for Transport, Energy and Infrastructure. Includes employees in the Office for Recreation and Sport and Office for Racing, and a number of employees transferred from the former Department of Planning and Local Government on 1 December 2012. Includes employees transferred from TransAdelaide/Office othe Rail Commissioner in 2012.
Excludes employees in the Office of the Chief Information Officer and Service SA transferred to the Department of the Premier and Cabinet on 1 January 2012. Excludes employees in the Energy Division transferred to the Department of Manufacturing, Innovation, Trade, Resources and Energy on 1 January 2012.
Excludes Bio Innovations SA, this entity is reported separately under Other Public Sector organisations. For reporting purposes excludes TAFE84 employees as they do not meet the definition of a SA Public Sector employee. Includes employees in the Office of the Minister for Employment, Higher Education and Skills transferred from the former Department of Planning & Local Government on 1 January 2012.
Formerly Department for Families and Communities. Includes employees in the Office for Youth, Office for Volunteers, Office for Women, and Multicultural SA transferred from the Attorney General's Department on 1 January 2012. Includes employees in the Office for the Southern Suburbs and Office for the Northern Suburbs transferred from the former Department of Planning and Local Government on 1 January 2012. Includes employees in the Social Inclusion Unit transferred from the Department of the Premier and Cabinet on 1 December 2011.
Excludes employees in Families SA (except employees substantively employed in the operational unit known as Youth Justice) and a number of employees transferred to the Department of Education and Child Development on 1 January 2012. Excludes employees in the Aged Care Assessment Team and a number of employees transferred to the Department for Health and Ageing on 1 January 2012. Excludes a number of employees transferred to the Urban Renewal Authority on 23 April 2012.
Abolished in 2011. Employees transferred to the Department for Planning, Transport and Infrastructure, Department of the Premier and Cabinet, Department for Communities and Social Inclusion, and Department of Further Education, Employment, Science and Technology.
Includes Police Security and Police Band.
Excludes SA Local Government Grants Commission and Outback Areas Community Development Trust, these entities are reported separately under Other Public Sector organisations. Includes employees from Government House. Includes a number of employees transferred from the Department of Manufacturing, Innovation, Trade, Resources and Energy employees in the Office for State/Local Government Relations transferred from the former Department of Planning & Local Government
These agencies underwent extensive Machinery of Government Changes, therefore caution must be applied when comparing agency headcount and FTE between June 2011 to June 2012.
Formerly the Department of Education and Children's Services. Includes employees in Families SA (except employees substantively employed in the operational unit known as Youth Justice) and a number of employees transferred from the Department for Communities and Social Inclusion on 1 January 2012.
Includes the Office of the Public Trustee of South Australia. Excludes Police Complaints Authority employees, this entity is reported separately. Excludes employees in the Office for Youth, Office for Volunteers, Office for Women, and Multicultural SA, transferred to the Department for Communities and Social Inclusion on 1 January 2012.
Excludes a number of employees transferred to Urban Renewal Authority on 1 March 2012
Includes employees in the Sustainability and Climate Change Division transferred from the Department of the Premier and Cabinet on 1 January 2012.
Formerly Department of Health. Includes employees in the Aged Care Assessment Team and a number of other employees transferred from the Department for Communities and Social Inclusion on 1 January 2012.
(13)
(14)
(15)
(16)
(17)
(18)
(19)
(20)
(21)
(22)
Excludes persons employed under Special Acts and the Judicial Administration Act.
The number and type of functions managed determines the amount of casual work available in each pay period. The figure provided is only representative of this organisation's workforce as at the reporting period and should not be considered a reflection of the overall workforce for the year.
From June 2012, Government House is included as part of the Department of the Premier and Cabinet.
As the Adelaide Festival was previously held every second year, significant fluctuation could occur in temporary staff numbers between annual collections.
Formerly Department of Primary Industries and Resources. Includes a number of employees transferred from the Department for Manufacturing, Innovation, Trade, Resources and Energy on 1 January 2012. Excludes employees in the Minerals and Energy Resources Division, Olympic Dam Task Force and a number of employees transferred to the Department of Manufacturing, Innovation, Trade, Resources and Energy on 1 January 2012.
Resources and Energy, employees in the Office for State/Local Government Relations transferred from the former Department of Planning & Local Governmentemployees in the Office of the Chief Information Officer and Service SA transferred from the Department of Planning, Transport and Infrastructure on 1 January 2012. Includes employees in Shared Services SA transferred from the Department of Treasury and Finance on 1 February 2012.
Excludes employees in the Social Inclusion Unit transferred to the Department for Communities and Social Inclusion on 1 December 2011. Excludes employees in Renewables SA transferred to the Department for Manufacturing, Innovation, Trade, Resources and Energy on 1 January 2012. Excludes employees in the Sustainability and Climate Change Division transferred to the Department for Environment and Natural Resources on 1 January 2012.
Includes Super SA and SAFA. Excludes Electorate Offices, this entity is reported separately under Other Public Sector organisations. Includes a number of employees transferred from the former Department of Planning and Local Government on 1 December 2011. Excludes employees in Shared Services SA transferred to the Department of the Premier and Cabinet on 1 February 2012.
The Aboriginal Lands Trust is not a public sector agency for the purposes of the Public Sector Act 2009 and are no longer included in the annual Workforce Information Collection
Also referred to as Electorate Services. Includes all persons employed under the Assistants to the Members of the South Australian Parliament Enterprise Agreement.
These figures incorporate the total workforce of the Health Units (SA Health Regions) incorporated under the SA Health Care Act, which took effect on 1 July 2008.
The Courts Administration Authority, which provides administrative support to the Judiciary, advised the Office of Public Employment and Review that it will no longer provide employee level data for the purposes of the workforce information collection because members of the Judiciary are not public sector employees.

(23)
(24)
(25)
(26)
(27)
(28)
(29)
(30)
Established 1 March 2012. Includes all employees of the former Land Management Corporation transferred on 1 March 2012. Includes a number of employees transferred from Defence SA on 1 March 2012. Includes a number of employees transferred from the Department for Communities and Social Inclusion on 1 March 2012. This organisation trades as Renewals SA
From 1 July 2012 the Occupational Therapy Board of SA moved to the Australian Health Practitioner Regulation Agency and are no longer part of the South Australian Public Sector. Employee data for 30 June 2012 was unobtainable.
Established in March 2012.
Abolished in 2012. Employees transferred to the Urban Renewal Authority.
Previously known as ETSA Corporation. Holding company for RESI Power Corporation and Transmission Lessor Corporation. Other related organisations RESI OE Pty Ltd, RESI Power Pty Ltd and RESI Syn Pty Ltd currently have no employees. The Department of Treasury and Finance provide business and administrative services for these organisations.
This organisation trades as SA Water.
For reporting purposes administered items not individually listed on the above table are included under their administering organisation or department.
Functions transferred from TransAdelaide to the Office of the Rail Commissioner in September 2010. Employees transferred to the Department for Planning, Transport and Infrastructure in 2012

Table 2 - Employees in the South Australian Public Sector as a Percentage of South Australian Population and Total Persons Employed in South Australia, June 2003 to June 2012
Employees in Administrative Units (1)
- Full-time Equivalents (2) 41,409.3 41,962.4 43,453.8 44,530.9 46,595.8 47,565.9 48,556.7 48,817.8 49,403.4 50,609.3
- Persons 48,352 49,046 50,677 51,390 53,829 55,065 56,346 56,825 57,473 59,047
Employees in Other State Public Sector Organisations (1) (2)
- Full-time Equivalents 29,963.6 30,178.6 33,266.5 33,679.9 33,119.4 33,704.5 35,328.5 36,082.2 35,478.7 35,117.9
- Persons 37,224 37,839 39,302 41,458 40,951 41,840 44,251 44,599 44,012 44,602PS Act Employees in Administrative Units (Including Executives) (5)
- Full-time Equivalents 16,482.6 16,868.9 17,688.0 18,366.5 19,144.4 20,058.5 20,818.6 20,910.7 20,535.3 21,177.7
- Persons 17,488 17,976 18,787 19,578 20,455 21,516 22,417 22,550 22,156 22,809
Employees in South Australian Public Sector (1) (2)
- Full-time Equivalents 71,372.8 72,141.0 76,720.3 78,210.8 79,715.2 81,270.4 83,885.1 84,900.0 84,882.1 85,727.2
- Persons 85,576 86,885 89,979 92,848 94,780 96,905 100,597 101,424 101,485 103,649
South Australian Estimated Resident Population (Persons) (3)
1,531,278 1,540,434 1,552,514 1,567,888 1,582,559 1,597,343 1,614,375 1,629,434 1,638,232 1,650,603
Employees in Administrative Units Per 1000 Population- Full-time Equivalents 27.0 27.2 28.0 28.4 29.4 29.8 30.1 30.0 30.2 30.7
- Persons 31.6 31.8 32.6 32.8 34.0 34.5 34.9 34.9 35.1 35.8
Employees in Other State Public Sector Organisations Per 1000 Population- Full-time Equivalents 19.6 19.6 21.4 21.5 20.9 21.1 21.9 22.1 21.7 21.3
- Persons 24.3 24.6 25.3 26.4 25.9 26.2 27.4 27.4 26.9 27.0
PS Act Employees Per 1000 Population- Full-time Equivalents 10.8 11.0 11.4 11.7 12.1 12.6 12.9 12.8 12.5 12.8
- Persons 11.4 11.7 12.1 12.5 12.9 13.5 13.9 13.8 13.5 13.8
South Australian Public Sector Employees Per 1000 Population- Full-time Equivalents 46.6 46.8 49.4 49.9 50.4 50.9 52.0 52.1 51.8 51.9
- Persons 55.9 56.4 58.0 59.2 59.9 60.7 62.3 62.2 61.9 62.8
2012201120102003 2004 2005 2006 2007 2008 2009Type of Employment
Total Persons Employed In SA (4)
719,600 721,500 746,600 759,600 766,700 790,500 796,100 807,800 823,500 814,800
Employees in Administrative Units (Persons) as a Percentage of Persons Employed in SA6.7 6.8 6.8 6.8 7.0 7.0 7.1 7.0 7.0 7.2
Employees in Other State Public Sector Organisations (Persons) as a Percentage of Persons Employed in SA5.2 5.2 5.3 5.5 5.3 5.3 5.6 5.5 5.3 5.5
PS Act Employees (Persons) as a Percentage of Persons Employed in SA2.4 2.5 2.5 2.6 2.7 2.7 2.8 2.8 2.7 2.8
South Australian Public Sector Employees (Persons) as a Percentage of Persons Employed in SA11.9 12.0 12.1 12.2 12.4 12.3 12.6 12.6 12.3 12.7
(1) Refers to employment in Administrative Units, other South Australian public sector organisations and the South Australian Public Sectoras shown in Table 1.
(2) FTE Figure as at June 2006 amended June 2007. Refer to 2006 Errata as published by the Commissioner of Public Employment on 30/10/06.
(3) As per the Australian Bureau of Statistics figures for the period June 2003 to 2012 inclusive of the Intercensal Adjustment as per Note 6 of the ABS Explanatory Notes to the March 2012 Issue.Source: Australian Bureau of Statistics Australian Demographic Statistics, Catalogue No. 3101.0. Mar 2012 (Table 4).
(4)
(5) The PSM Act was repealed on the 1st February 2010 with the commencement of the Public Sector (PS) Act 2009
Provides most recent trend series figures for 2003 to 2012. Figures have been revised to incorporate additional information available from the latest Census of Population and Housing as per Note 12 of the ABS Explanatory Notes to the Septemeber 2012 Issue. The WIC 2012 data is at June 2012.Source: Australian Bureau of Statistics Labour Force Australia, Catalogue No.6202.0. September 2012 (Table 7).

Table 3 - Employees in the South Australian Public Sector by Age, Appointment Type, and Gender, June 2012
Appointment Type
Short Term Long Term% of all % of all % of Males Females Total
15-19 12 28 40 44 102 146 24 11 35 56 124 180 136 0.4% 265 0.4% 401 0.4%
20-24 589 1,217 1,806 403 1,434 1,837 81 130 211 241 662 903 1,314 3.8% 3,443 5.0% 4,757 4.6%
25-29 1,699 3,779 5,478 913 2,154 3,067 153 346 499 244 590 834 3,009 8.8% 6,869 9.9% 9,878 9.5%
30-34 2,241 4,404 6,645 801 1,531 2,332 223 391 614 206 654 860 3,471 10.1% 6,980 10.1% 10,451 10.1%
35-39 2,716 4,627 7,343 588 1,466 2,054 312 420 732 220 934 1,154 3,836 11.2% 7,447 10.7% 11,283 10.9%
40-44 3,198 5,626 8,824 445 1,503 1,948 359 515 874 209 1,171 1,380 4,211 12.3% 8,815 12.7% 13,026 12.6%
45-49 3,312 6,304 9,616 371 1,376 1,747 338 537 875 277 1,108 1,385 4,298 12.5% 9,325 13.4% 13,623 13.1%
50-54 3,899 7,738 11,637 353 1,218 1,571 442 688 1,130 296 1,058 1,354 4,990 14.6% 10,702 15.4% 15,692 15.1%
55-59 3,805 6,654 10,459 381 890 1,271 598 719 1,317 279 831 1,110 5,063 14.8% 9,094 13.1% 14,157 13.7%
60-64 2,076 3,632 5,708 222 436 658 266 305 571 347 625 972 2,911 8.5% 4,998 7.2% 7,909 7.6%
65+ 604 901 1,505 101 108 209 55 48 103 265 390 655 1,025 3.0% 1,447 2.1% 2,472 2.4%
24,151 44,910 69,061 4,622 12,218 16,840 2,851 4,110 6,961 2,640 8,147 10,787 34,264 100.0% 69,385 100.0% 103,649 100.0%
47.4 47.2 47.3 35.8 38.1 37.4 49.2 47.3 48.1 47.5 44.7 45.2 46.3 - 45.50 - 45.8 -
Total
Median Age
Male
Age Ongoing Contract Other TotalGroup
Male Female TotalFemale(yrs) Female TotalMale FemaleFemale Total Male Total MaleTotal
16
18
Age Profile of South Australian Public Sector Employees, June 2010, June 2011 and June 2012
0
2
4
6
8
10
12
14
Under 15 15-19 20-24 25-29 30-34 35-39 40-44 45-49 50-54 55-59 60-64 65+
Perc
enta
ge (%
)
Age (years)
2010 2011 2012

Table 4 - Employees in the South Australian Public Sector by Employee Type, Appointment Type and Gender, June 2012
Appointment Type
Male Female Male Female Male Female Male Female Male Female Total
Children's Services Act 5 493 13 429 6 232 11 689 35 1,843 1,878 1,146.5
Disability Services Officers 413 648 0 2 0 0 15 43 428 693 1,121 851.1
Education Act 2,073 5,365 1,109 3,135 760 1,361 674 1,713 4,616 11,574 16,190 13,588.0
Emergency Services (2) 1,658 397 1 0 0 0 19 12 1,678 409 2,087 1,818.6
Executives 22 9 39 63 735 522 0 0 796 594 1,390 1,381.1
Medical Officers 845 406 1,087 948 28 16 263 60 2,223 1,430 3,653 2,929.1
Nurses 1,500 11,215 207 1,626 18 176 156 1,578 1,881 14,595 16,476 12,464.7
Police Act 3,494 1,218 0 0 0 0 0 0 3,494 1,218 4,712 4,596.2
PS Act (3) 7,244 10,072 939 2,052 717 893 240 315 9,140 13,332 22,472 20,838.5
- Administrative Services (4) 4,314 7,273 582 1,448 383 646 38 104 5,317 9,471 14,788 13,872.4
- Operational Services 1,656 1,072 187 201 64 21 99 96 2,006 1,390 3,396 3,133.8
- Professional Officers 727 461 82 94 192 110 15 14 1,016 679 1,695 1,588.8
- Technical Services 230 60 6 10 17 20 4 5 257 95 352 338.0
- Allied Health Professionals 231 1,042 46 205 4 42 0 1 281 1,290 1,571 1,397.1
- Other PS Act 86 164 36 94 57 54 84 95 263 407 670 508.4
Public Sector Salaried 1,973 7,848 376 1,887 176 444 130 653 2,655 10,832 13,487 11,031.9
- Health Care Act 1,468 6,922 301 1,729 52 225 91 595 1,912 9,471 11,383 9,175.7
- Other Public Sector Salaried 505 926 75 158 124 219 39 58 743 1,361 2,104 1,856.2
School Services Officers 251 2,434 256 1,349 40 152 195 1,208 742 5,143 5,885 4,128.3
TAFE Act 689 713 86 119 7 6 263 469 1,045 1,307 2,352 1,699.2
Weekly Paid 2,082 2,642 296 186 146 69 301 972 2,825 3,869 6,694 4,901.3
- Health Ancillary Employees 659 2,453 28 137 3 8 128 763 818 3,361 4,179 2,798.0
- Government Services 340 88 192 40 73 13 68 97 673 238 911 657.4
- Other Weekly Paid 1,083 101 76 9 70 48 105 112 1,334 270 1,604 1,445.9Other 1,902 1,450 213 422 218 239 373 435 2,706 2,546 5,252 4,352.7
Total 24,151 44,910 4,622 12,218 2,851 4,110 2,640 8,147 34,264 69,385 103,649 85,727.2
Total FTE 23,054.2 37,449.9 4,249.3 10,232.2 2,779.2 3,779.5 1,031.9 3,151.1 31,114.6 54,612.6 85,727.2
FTEsEmployee Type (1) TotalShort Term Long Term
Ongoing Contract Other
(1) Executives under each employee type are reported under 'Executives' for the purposes of this table.(2) Includes Ambulance Service Officers and Fire Fighters.(3) Includes PS Act employees located in Other Public Sector Organisations. (4) Includes PS Act trainees.
Children's Services Act, 1.3%
Disability Services
Officers, 1.0%
Education Act, 15.9%
Emergency Services (2), 2.1%
Executives, 1.6%
Medical Officers, 3.4%
Nurses, 14.5%
Police Act, 5.4%
PS Act (3), 24.3%
Public Sector Salaried, 12.9%
School Services Officers, 4.8%
TAFE Act, 2.0%
Weekly Paid, 5.7%
Other, 5.1%
South Australian Public Sector Full-time Equivalent Employees by Employee Type, June 2012

Male Female Total Male Female Total Male Female Total Male Female Total Male Female Total
Administrative Units399 732 1,131 43 96 139 87 89 176 5 3 8 534 920 1,454
39 54 93 10 12 22 6 0 6 0 0 0 55 66 121
1,374 2,885 4,259 108 324 432 26 48 74 119 175 294 1,627 3,432 5,059
901 546 1,447 98 113 211 11 7 18 20 22 42 1,030 688 1,718
2 0 2 1 0 1 14 10 24 0 0 0 17 10 27
3,076 9,890 12,966 1,666 5,416 7,082 1,136 2,341 3,477 1,071 3,805 4,876 6,949 21,452 28,401
6 14 20 0 2 2 0 0 0 0 0 0 6 16 22
424 353 777 61 77 138 96 87 183 22 61 83 603 578 1,181
103 87 190 8 13 21 13 6 19 1 1 2 125 107 232
1,069 1,670 2,739 151 334 485 35 54 89 284 549 833 1,539 2,607 4,146
626 959 1,585 79 203 282 96 137 233 2 1 3 803 1,300 2,103
178 158 336 12 17 29 48 25 73 2 0 2 240 200 440
2,112 939 3,051 106 100 206 214 60 274 35 28 63 2,467 1,127 3,594
3,794 1,698 5,492 117 173 290 20 7 27 5 22 27 3,936 1,900 5,836
738 1,202 1,940 111 256 367 103 84 187 8 15 23 960 1,557 2,517
335 245 580 39 52 91 178 111 289 46 39 85 598 447 1,045
305 311 616 46 50 96 51 14 65 2 1 3 404 376 780
126 86 212 26 36 62 45 25 70 2 0 2 199 147 346
8 11 19 0 2 2 2 2 4 0 0 0 10 15 25
Total Administrative Units 15,615 21,840 37,455 2,682 7,276 9,958 2,181 3,107 5,288 1,624 4,722 6,346 22,102 36,945 59,047
Other Public Sector Organisations **
Adelaide and Mount Lofty Ranges NRM Board 12 7 19 2 4 6 20 31 51 0 0 0 34 42 76
Adelaide Cemeteries Authority 37 15 52 1 1 2 2 0 2 1 1 2 41 17 58
Adelaide Convention Centre (14) 85 51 136 1 1 2 8 9 17 134 96 230 228 157 385
Adelaide Entertainments Corporation (14) 13 17 30 0 0 0 3 0 3 77 101 178 93 118 211
Adelaide Festival Centre Trust (14) 33 27 60 21 18 39 33 46 79 73 85 158 160 176 336
Ambulance Service, SA 693 538 1,231 0 0 0 4 0 4 23 23 46 720 561 1,281
Country Arts, SA 0 2 2 0 5 5 11 37 48 24 41 65 35 85 120
Country Fire Service 64 54 118 2 2 4 4 2 6 0 0 0 70 58 128
Courts Administration Authority (15) 222 476 698 28 65 93 5 3 8 2 3 5 257 547 804
Electorate Offices (16) 34 91 125 19 46 65 5 6 11 12 37 49 70 180 250
Forestry SA 101 30 131 14 4 18 23 9 32 0 0 0 138 43 181
Health Units (17) 4,616 20,635 25,251 1,736 4,607 6,343 127 451 578 635 2,974 3,609 7,114 28,667 35,781
HomeStart Finance 39 51 90 2 6 8 4 1 5 0 0 0 45 58 103
Legal Services Commission 37 140 177 9 14 23 7 5 12 0 1 1 53 160 213
Legislature (Including Members) 39 57 96 2 5 7 52 25 77 8 6 14 101 93 194
Lotteries Commission of SA 34 37 71 2 5 7 4 1 5 0 0 0 40 43 83
Metropolitan Fire Service 1,102 53 1,155 1 1 2 2 0 2 0 0 0 1,105 54 1,159
Murray Darling NRM Board 13 2 15 6 17 23 17 23 40 0 0 0 36 42 78
23 26 49 6 11 17 5 4 9 0 0 0 34 41 75
SACE Board of SA 13 25 38 9 18 27 16 18 34 1 3 4 39 64 103
Tourism Commission, SA 15 26 41 7 16 23 19 37 56 2 2 4 43 81 124
Urban Renewal Authority (18) 39 30 69 11 6 17 60 47 107 0 0 0 110 83 193
Water Corporation, SA (19) 1,058 379 1,437 33 34 67 102 30 132 2 2 4 1,195 445 1,640
West Beach Trust 10 4 14 0 0 0 26 57 83 4 24 28 40 85 125
WorkCover Corporation 99 153 252 7 12 19 11 9 20 1 0 1 118 174 292
Remainder of Other Public Sector Organisations 105 144 249 21 44 65 100 152 252 17 26 43 243 366 609
Total Other Public Sector Organisations 8,536 23,070 31,606 1,940 4,942 6,882 670 1,003 1,673 1,016 3,425 4,441 12,162 32,440 44,602
Total South Australian Public Sector 24,151 44,910 69,061 4,622 12,218 16,840 2,851 4,110 6,961 2,640 8,147 10,787 34,264 69,385 103,649
*
**
(1)
(2)
(3)
(4)
(5)
Total
Excludes a number of employees transferred to Urban Renewal Authority on 1 March 2012
Formerly Department for Families and Communities. Includes employees in the Office for Youth, Office for Volunteers, Office for Women, and Multicultural SA transferred from the Attorney General's Department on 1 January 2012. Includes employees in the Office for the Southern Suburbs and Office for the Northern Suburbs transferred from the former Department of Planning and Local Government on 1 January 2012. Includes employees in the Social Inclusion Unit transferred from the Department of the Premier and Cabinet on 1 December 2011.
Excludes employees in Families SA (except employees substantively employed in the operational unit known as Youth Justice) and a number of employees transferred to the Department of Education and Child Development on 1 January 2012. Excludes employees in the Aged Care Assessment Team and a number of employees transferred to the Department for Health and Ageing on 1 January 2012. Excludes a number of employees transferred to the Urban Renewal Authority on 23 April 2012.
Table 5 - Employees in South Australian Public Sector Organisations by Appointment Type and Gender, June 2012
Public Sector Organisations
Appointment Type
Ongoing
Manufacturing, Innovation, Trade, Resources and Energy (8)*
Contract
SA Fire and Emergency Services Commission
Formerly the Department of Education and Children's Services. Includes employees in Families SA (except employees substantively employed in the operational unit known as Youth Justice) and a number of employees transferred from the Department for Communities and Social Inclusion on 1 January 2012.
Includes employees in the Sustainability and Climate Change Division transferred from the Department of the Premier and Cabinet on 1 January 2012.
Short TermOther
Long Term
Electoral Commission of South Australia
Attorney-General's (1) *
Auditor-General'sCommunities and Social Inclusion (2)*Correctional ServicesDefence SA (3)*Education and Child Development (4)*
Environment and Natural Resources (5)
Environment Protection Authority
Planning, Transport and Infrastructure (9)
Police, SA (10)
Premier and Cabinet (11)*
Primary Industries and Regions (12)*
Further Education, Employment, Science & Technology (6)*
Only other public sector organisations with 50.00 FTEs or greater have been listed individually.
Includes the Office of the Public Trustee of South Australia. Excludes Police Complaints Authority employees who are reported separately. Excludes employees in the Office for Youth, Office for Volunteers, Office for Women, and Multicultural SA, transferred to the Department for Communities and Social Inclusion on 1 January 2012.
Health and Ageing, Department of (7)
Treasury and Finance (13)*
These agencies underwent extensive Machinery of Government Changes, therefore caution must be applied when comparing agency headcount and FTE between June 2011 to June 2012.
Water, Department forZero Waste SA

Table 5 - Employees in South Australian Public Sector Organisations by Appointment Type and Gender, June 2012(6)
(7)
(8)
(9)
(10)(11)
(12)
(13)
(14)
(15)
(16)
(17)
(18)
(19)
Formerly the Department for Transport, Energy and Infrastructure. Includes employees in the Office for Recreation and Sport and Office for Racing, and a number of employees transferred from the former Department of Planning and Local Government on 1 December 2012. Includes employees transferred from TransAdelaide/Office of the Rail Commissioner in 2012.
Excludes employees in the Office of the Chief Information Officer and Service SA transferred to the Department of the Premier and Cabinet on 1 January 2012. Excludes employees in the Energy Division transferred to the Department of Manufacturing, Innovation, Trade, Resources and Energy on 1 January 2012.
Excludes persons employed under Special Acts and the Judicial Administration Act.
Excludes Bio Innovations SA, this entity is reported separately under Other Public Sector organisations. For reporting purposes excludes TAFE84 employees as they do not meet the definition of a SA Public Sector employee. Includes employees in the Office of the Minister for Employment, Higher Education and Skills transferred from the former Department of Planning & Local Government on 1 January 2012.
Formerly Department of Health. Includes employees in the Aged Care Assessment Team and a number of other employees transferred from the Department for Communities and Social Inclusion on 1 January 2012.
Formerly the Department of Trade and Economic Development. Includes employees in the Energy Division transferred from the Department of Planning, Transport and Infrastructure on 1 January 2012. Includes employees in Renewables SA transferred from the Department of the Premier and Cabinet on 1 January 2012. Includes employees in the Minerals and Energy Resources Division, Olympic Dam Task Force, and a number of employees transferred from the Department of Primary Industries and Regions on 1 January 2012.
Excludes a number of employees transferred to the Department of the Premier and Cabinet on 1 January 2012. Excludes a number of employees transferred to the Department of Primary Industries and Regions on 1 January 2012.
Excludes SA Local Government Grants Commission and Outback Areas Community Development Trust, these entities are reported separately under Other Public Sector organisations. Includes employees from Government House. Includes a number of employees transferred from the Department of Manufacturing, Innovation, Trade, Resources and Energy, employees in the Office for State/Local Government Relations transferred from the former Department of Planning & Local Government, employees in the Office of the Chief Information Officer and Service SA transferred from the Department of Planning, Transport and Infrastructure on 1 January 2012. Includes employees in Shared Services SA transferred from the Department of Treasury and Finance on 1 February 2012.
Excludes employees in the Social Inclusion Unit transferred to the Department for Communities and Social Inclusion on 1 December 2011. Excludes employees in Renewables SA transferred to the Department for Manufacturing, Innovation, Trade, Resources and Energy on 1 January 2012. Excludes employees in the Sustainability and Climate Change Division transferred to the Department for Environment and Natural Resources on 1 January 2012.
Also referred to as Electorate Services. Includes all persons employed under the Assistants to the Members of the South Australian Parliament Enterprise Agreement.
This organisation trades as SA Water.
The number and type of functions managed determines the amount of casual work available in each pay period. The figure provided is only representative of this organisation's workforce as at the reporting period and should not be considered a reflection of the overall workforce for the year.
These figures incorporate the total workforce of the Health Units (SA Health Regions) incorporated under the SA Health Care Act, which took effect on 1 July 2008.
Established 1 March 2012. Includes all employees of the former Land Management Corporation transferred on 1 March 2012. Includes a number of employees transferred from Defence SA on 1 March 2012. Includes a number of employees transferred from the Department for Communities and Social Inclusion on 1 March 2012. This organisation trades as Renewals SA
Includes Police Security and Police Band.
Formerly Department of Primary Industries and Resources. Includes a number of employees transferred from the Department for Manufacturing, Innovation, Trade, Resources and Energy on 1 January 2012. Excludes employees in the Minerals and Energy Resources Division, Olympic Dam Task Force and a number of employees transferred to the Department of Manufacturing, Innovation, Trade, Resources and Energy on 1 January 2012.
Includes Super SA and SAFA. Excludes Electorate Offices, this entity is reported separately under Other Public Sector organisations. Includes a number of employees transferred from the former Department of Planning and Local Government on 1 December 2011. Excludes employees in Shared Services SA transferred to the Department of the Premier and Cabinet on 1 February 2012.

Table 6 - Employees in Administrative Units by Employee Type and Gender, June 2012
Male Female Male Female Male Female Male Female Male Female Male Female Total461 864 4 2 48 43 0 0 21 11 534 920 1,454
49 66 0 0 6 0 0 0 0 0 55 66 121
1,064 2,367 448 830 15 30 100 205 0 0 1,627 3,432 5,059
992 652 0 0 9 4 23 15 6 17 1,030 688 1,718
10 9 0 0 7 1 0 0 0 0 17 10 27
763 2,254 5,393 18,558 214 297 413 32 166 311 6,949 21,452 28,401
5 15 0 0 1 1 0 0 0 0 6 16 22
475 484 0 0 17 6 108 86 3 2 603 578 1,181
121 106 0 0 4 1 0 0 0 0 125 107 232
415 1,139 1,045 1,307 19 24 55 48 5 89 1,539 2,607 4,146
543 923 142 335 39 25 78 13 1 4 803 1,300 2,103
207 188 0 0 27 10 1 0 5 2 240 200 440
1,629 1,037 0 0 58 17 730 65 50 8 2,467 1,127 3,594
325 650 3,495 1,218 10 2 106 30 0 0 3,936 1,900 5,836
887 1,495 0 0 45 31 8 9 20 22 960 1,557 2,517
547 429 0 0 19 3 28 10 4 5 598 447 1,045
335 370 0 0 35 5 30 0 4 1 404 376 780
182 143 0 0 10 4 7 0 0 0 199 147 346
9 15 0 0 1 0 0 0 0 0 10 15 25
Total 9,019 13,206 10,527 22,250 584 504 1,687 513 285 472 22,102 36,945 59,047
Table 7 - Employees in Administrative Units by Employee Type and FTE, June 2012
Headcount FTE Headcount FTE Headcount FTE Headcount FTE Headcount FTE Headcount1,325 1,233.2 6 5.3 91 90.6 0 0.0 32 30.1 1,454
115 110.2 0 0.0 6 6.0 0 0.0 0 0.0 121
3,431 3,024.9 1,278 974.0 45 44.7 305 213.3 0 0.0 5,059
1,644 1,587.6 0 0.0 13 13.0 38 31.9 23 8.5 1,718
19 18.3 0 0.0 8 8.0 0 0.0 0 0.0 27
3,017 2,744.8 23,951 18,860.8 511 510.7 445 302.1 477 271.4 28,401
20 19.1 0 0.0 2 2.0 0 0.0 0 0.0 22
959 913.5 0 0.0 23 23.0 194 142.3 5 5.0 1,181
227 213.2 0 0.0 5 5.0 0 0.0 0 0.0 232
1,554 1,402.2 2,352 1,699.2 43 42.0 103 79.7 94 72.24,146
1,466 1,389.9 477 438.9 64 63.6 91 87.7 5 4.6 2,103
395 379.2 0 0.0 37 36.3 1 0.4 7 6.2 440
2,666 2,560.4 0 0.0 75 75.0 795 772.2 58 56.5 3,594
975 904.6 4,713 4,597.2 12 12.0 136 134.8 0 0.0 5,836
2,382 2,211.2 0 0.0 76 75.3 17 15.3 42 41.6 2,517
976 885.4 0 0.0 22 22.0 38 26.2 9 9.0 1,045
705 667.1 0 0.0 40 39.5 30 29.7 5 5.0 780
325 310.7 0 0.0 14 14.0 7 7.0 0 0.0 346
24 22.2 0 0.0 1 1.0 0 0.0 0 0.0 25
Total 22,225 20,597.7 32,777 26,575.3 1,088 1,083.7 2,200 1,842.5 757 510.1 59,047
*
(1)
(2)
(3)
(4)
(5)(6)
(7)
(8)
(9)
(10)
Water, Department for
Zero Waste SA
Planning, Transport and Infrastructure (9)
Police, SA (10)
Premier and Cabinet (11)
Primary Industries and Regions (12)
Treasury and Finance (13)
942.6
741.3
331.7
23.2
50,609.3
Environment and Natural Resources (5)
Environment Protection Authority
Further Education, Employment, Science & Technology (6)
Health and Ageing, Department of (7)
Manufacturing, Innovation, Trade, Resources and Energy (8)
Communities and Social Inclusion (2)
Correctional Services
Defence SA (3)
Education and Child Development (4)
Electoral Commission of South Australia
Treasury and Finance (13)
Water, Department for
Zero Waste SA
Attorney-General's (1)
Auditor-General's
Manufacturing, Innovation, Trade, Resources and Energy (8)
Planning, Transport and Infrastructure (9)
Police, SA (10)
Premier and Cabinet (11)
Primary Industries and Regions (12)
Electoral Commission of South Australia
Environment and Natural Resources (5)
Environment Protection Authority
Further Education, Employment, Science & Technology (6)
Health and Ageing, Department of (7)
Auditor-General's
Communities and Social Inclusion (2)
Correctional Services
Defence SA (3)
Education and Child Development (4)
Other Major Employee Types include Education Act, Children's Services Act, Police Act, Public Sector Salaried, TAFE Act, Nurses Award, Disability Service Officers, Medical Officers Award and the School Services Officers Award.
Includes the Office of the Public Trustee of South Australia. Excludes Police Complaints Authority employees, this entity is reported separately. Excludes employees in the Office for Youth, Office for Volunteers, Office for Women, and Multicultural SA, transferred to the Department for Communities and Social Inclusion on 1 January 2012.
Excludes a number of employees transferred to Urban Renewal Authority on 1 March 2012
Excludes Bio Innovations SA, this entity is reported separately under Other Public Sector organisations. For reporting purposes excludes TAFE84 employees as they do not meet the definition of a SA Public Sector employee. Includes employees in the Office of the Minister for Employment, Higher Education and Skills transferred from the former Department of Planning & Local Government on 1 January 2012.
Formerly Department of Health. Includes employees in the Aged Care Assessment Team and a number of other employees transferred from the Department for Communities and Social Inclusion on 1 January 2012.
Formerly the Department for Transport, Energy and Infrastructure. Includes employees in the Office for Recreation and Sport and Office for Racing, and a number of employees transferred from the former Department of Planning and Local Government on 1 December 2012. Includes employees transferred from TransAdelaide/Office of the Rail Commissioner in 2012.
Excludes employees in the Office of the Chief Information Officer and Service SA transferred to the Department of the Premier and Cabinet on 1 January 2012. Excludes employees in the Energy Division transferred to the Department of Manufacturing, Innovation, Trade, Resources and Energy on 1 January 2012.
Formerly the Department of Education and Children's Services. Includes employees in Families SA (except employees substantively employed in the operational unit known as Youth Justice) and a number of employees transferred from the Department for Communities and Social Inclusion on 1 January 2012.
Formerly Department for Families and Communities. Includes employees in the Office for Youth, Office for Volunteers, Office for Women, and Multicultural SA transferred from the Attorney General's Department on 1 January 2012. Includes employees in the Office for the Southern Suburbs and Office for the Northern Suburbs transferred from the former Department of Planning and Local Government on 1 January 2012. Includes employees in the Social Inclusion Unit transferred from the Department of the Premier and Cabinet on 1 December 2011.
Excludes employees in Families SA (except employees substantively employed in the operational unit known as Youth Justice) and a number of employees transferred to the Department of Education and Child Development on 1 January 2012. Excludes employees in the Aged Care Assessment Team and a number of employees transferred to the Department for Health and Ageing on 1 January 2012. Excludes a number of employees transferred to the Urban Renewal Authority on 23 April 2012.
Includes Police Security and Police Band.
Formerly the Department of Trade and Economic Development. Includes employees in the Energy Division transferred from the Department of Planning, Transport and Infrastructure on 1 January 2012. Includes employees in Renewables SA transferred from the Department of the Premier and Cabinet on 1 January 2012. Includes employees in the Minerals and Energy Resources Division, Olympic Dam Task Force, and a number of employees transferred from the Department of Primary Industries and Regions on 1 January 2012.
Excludes a number of employees transferred to the Department of the Premier and Cabinet on 1 January 2012. Excludes a number of employees transferred to the Department of Primary Industries and Regions on 1 January 2012.
Includes employees in the Sustainability and Climate Change Division transferred from the Department of the Premier and Cabinet on 1 January 2012.
1,984.7
422.1
3,464.1
5,648.6
2,343.4
22,689.7
21.1
1,083.9
218.2
3,295.2
1,359.3
116.2
4,256.8
1,641.0
26.3
Total
FTE
Administrative Units PS Act Other Major Employee Types * Executives
Administrative UnitsPS Act Other Major Employee
Types * Executives Weekly Paid
Weekly Paid Other Total
Other
Attorney-General's (1)

Table 8 - Employees in Other Public Sector Organisations by Employee Type and Gender, June 2012
Other Public Sector Organisations * Total
Male Female Male Female Male Female Male Female Male Female Male Female Male Female Male Female TotalAdelaide and Mount Lofty Ranges NRM Board 0 0 0 0 0 0 0 0 34 42 0 0 0 0 34 42 76Adelaide Cemeteries Authority 0 0 1 0 0 0 0 0 0 0 27 4 13 13 41 17 58Adelaide Convention Centre (2) 0 0 6 0 0 0 0 0 0 0 0 0 222 157 228 157 385Adelaide Entertainments Corporation (2) 0 0 3 2 0 0 0 0 0 0 0 0 90 116 93 118 211Adelaide Festival Centre Trust (2) 0 0 7 1 0 0 0 0 0 0 107 93 46 82 160 176 336Ambulance Service, SA 582 373 4 0 1 0 0 0 23 79 12 0 98 109 720 561 1,281Country Arts, SA 0 0 1 0 0 0 0 0 34 85 0 0 0 0 35 85 120Country Fire Service 22 6 2 1 0 0 0 0 45 51 1 0 0 0 70 58 128Courts Administration Authority (3) 0 0 5 2 0 0 0 0 242 522 0 0 10 23 257 547 804Electorate Offices (4) 0 0 0 0 0 0 0 0 5 4 0 0 65 176 70 180 250Forestry SA 0 0 5 0 0 0 0 0 0 0 72 7 61 36 138 43 181Health Units (5) 0 0 23 28 2,211 1,417 1,856 14,405 1,760 9,127 843 3,156 421 534 7,114 28,667 35,781HomeStart Finance 0 0 4 1 0 0 0 0 1 0 0 0 40 57 45 58 103Legal Services Commission 0 0 5 2 0 0 0 0 48 158 0 0 0 0 53 160 213Legislature (Including Members) 0 0 51 22 0 0 0 0 43 59 0 0 7 12 101 93 194Lotteries Commission of SA 0 0 4 1 0 0 0 0 36 42 0 0 0 0 40 43 83Metropolitan Fire Service 1,074 30 2 0 0 0 0 0 15 23 14 1 0 0 1,105 54 1,159Murray Darling NRM Board 0 0 0 0 0 0 0 0 36 42 0 0 0 0 36 42 78SA Fire and Emergency Services Commission 0 0 1 0 0 0 0 0 33 41 0 0 0 0 34 41 75SACE Board of SA 0 0 3 1 0 0 0 0 36 63 0 0 0 0 39 64 103Tourism Commission, SA 0 0 3 3 0 0 0 0 20 52 5 2 15 24 43 81 124Urban Renewal Authority (6) 0 0 12 3 0 0 0 0 0 0 0 0 98 80 110 83 193
Weekly Paid Other (1)Emergency Services Executive Medical Officers Nurses Public Sector Salaried
Urban Renewal Authority 0 0 12 3 0 0 0 0 0 0 0 0 98 80 110 83 193Water Corporation, SA (7) 0 0 34 9 0 0 0 0 0 0 0 0 1,161 436 1,195 445 1,640West Beach Trust 0 0 0 1 0 0 0 0 12 15 28 69 0 0 40 85 125WorkCover Corporation 0 0 2 3 0 0 0 0 0 0 0 0 116 171 118 174 292Remainder of Other Public Sector Organisations 0 0 34 10 0 0 0 0 101 156 29 24 79 176 243 366 609
Total 1,678 409 212 90 2,212 1,417 1,856 14,405 2,524 10,561 1,138 3,356 2,542 2,202 12,162 32,440 44,602 * Only the other public sector organisations with 50.00 FTEs or greater have been listed individually.
(1)(2)
(3)(4)
(5)(6)
(7)
Also referred to as Electorate Services. Includes all persons employed under the Assistants to the Members of the South Australian Parliament Enterprise Agreement.
These figures incorporate the total workforce of the Health Units (SA Health Regions) incorporated under the SA Health Care Act, which took effect on 1 July 2008.
This organisation trades as SA Water.
Includes 'Other', Education Act and PS Act employee types.The number and type of functions managed determines the amount of casual work available in each pay period. The figure provided is only representative of this organisation's workforce as at the reporting period and should not be considered a reflection of the overall workforce for the year.Excludes persons employed under Special Acts and the Judicial Administration Act.
Established 1 March 2012. Includes all employees of the former Land Management Corporation transferred on 1 March 2012. Includes a number of employees transferred from Defence SA on 1 March 2012. Includes a number of employees transferred from the Department for Communities and Social Inclusion on 1 March 2012. This organisation trades as Renewals SA.

Table 9 - Employees (Full-time Equivalents) in Other Public Sector Organisations by Employee Type, June 2012
Other Public Sector Organisations * Employee Type PersonsEmergency Executives Medical Nurses Public Sector Weekly Other (1) Total FTE
Services Officers Salaried PaidAdelaide and Mount Lofty Ranges NRM Board 0.0 0.0 0.0 0.0 73.1 0.0 0.0 73.1 76Adelaide Cemeteries Authority 0.0 1.0 0.0 0.0 0.0 29.0 24.6 54.6 58Adelaide Convention Centre (2) 0.0 6.0 0.0 0.0 0.0 0.0 221.3 227.3 385Adelaide Entertainments Corporation (2) 0.0 5.0 0.0 0.0 0.0 0.0 66.1 71.1 211Adelaide Festival Centre Trust (2) 0.0 8.0 0.0 0.0 0.0 113.0 115.5 236.5 336Ambulance Service, SA 879.2 4.0 0.2 0.0 85.6 12.0 187.4 1,168.3 1,281Country Arts, SA 0.0 1.0 0.0 0.0 59.2 0.0 0.0 60.2 120Country Fire Service 28.0 3.0 0.0 0.0 87.4 1.0 0.0 119.4 128Courts Administration Authority (3) 0.0 7.0 0.0 0.0 679.5 0.0 32.6 719.1 804Electorate Offices (4) 0.0 0.0 0.0 0.0 8.0 0.0 187.5 195.5 250Forestry SA 0.0 5.0 0.0 0.0 0.0 78.4 94.1 177.5 181Health Units (5) 0.0 51.0 2,910.5 12,287.1 8,726.0 2,710.8 797.4 27,482.8 35,781HomeStart Finance 0.0 5.0 0.0 0.0 1.0 0.0 90.4 96.4 103Legal Services Commission 0.0 7.0 0.0 0.0 184.0 0.0 0.0 191.0 213Legislature (Including Members) 0.0 73.0 0.0 0.0 92.1 0.0 9.8 175.0 194Lotteries Commission of SA 0.0 5.0 0.0 0.0 73.7 0.0 0.0 78.7 83Metropolitan Fire Service 911.4 2.0 0.0 0.0 36.1 14.6 0.0 964.1 1,159Murray Darling NRM Board 0.0 0.0 0.0 0.0 72.4 0.0 0.0 72.4 78SA Fire and Emergency Services Commission 0.0 1.0 0.0 0.0 71.1 0.0 0.0 72.1 75SACE Board of SA 0.0 4.0 0.0 0.0 90.0 0.0 0.0 94.0 103Tourism Commission, SA 0.0 5.5 0.0 0.0 66.4 5.6 36.3 113.7 124Urban Renewal Authority (6) 0.0 15.0 0.0 0.0 0.0 0.0 172.6 187.6 193Water Corporation, SA (7) 0.0 42.7 0.0 0.0 0.0 0.0 1,552.7 1,595.4 1,640West Beach Trust 0.0 1.0 0.0 0.0 26.7 62.6 0.0 90.3 125WorkCover Corporation 0.0 5.0 0.0 0.0 0.0 0.0 273.4 278.4 292Remainder of Other Public Sector Organisations 0.0 40.2 0.0 0.0 227.6 31.8 223.9 523.5 609Total 1,818.6 297.4 2,910.7 12,287.1 10,659.8 3,058.8 4,085.5 35,117.9 44,602
* Only other public sector organisations with 50.00 FTEs or greater have been listed individually.(1)(2)
(3)
(4)(5)
(6)
(7)
Established 1 March 2012. Includes all employees of the former Land Management Corporation transferred on 1 March 2012. Includes a number of employees transferred from Defence SA on 1 March 2012. Includes a number of employees transferred from the Department for Communities and Social Inclusion on 1 March 2012. This organisation trades as Renewals SAThis organisation trades as SA Water.
Includes Education Act, PS Act, and 'Other' employee types.The number and type of functions managed determines the amount of casual work available in each pay period. The figure provided is only representative of this organisation's workforce as at the reporting period and should not be considered a reflection of the overall workforce for the year.Excludes persons employed under Special Acts and the Judicial Administration Act.
Also referred to as Electorate Services. Includes all persons employed under the Assistants to the Members of the South Australian Parliament Enterprise Agreement. These figures incorporate the total workforce of the Health Units (SA Health Regions) incorporated under the SA Health Care Act, which took effect on 1 July 2008.

Table 10 - Part time* Employees in the South Australian Public Sector by Employee Type, Appointment Type and Gender, June 2012
Male Female Male Female Male Female Male Female Male Female TotalChildren's Services Act 1 308 7 321 1 93 11 689 20 1,411 1,431Disability Services Officers 157 311 0 1 0 0 15 43 172 355 527Education Act 168 1,814 196 985 17 156 674 1,713 1,055 4,668 5,723Emergency Services (1) 231 109 0 0 0 0 19 12 250 121 371Executives (2) 1 0 2 1 9 14 0 0 12 15 27Medical Officers 423 282 120 154 11 8 259 59 813 503 1,316Nurses 489 7,465 74 953 4 105 156 1,578 723 10,101 10,824Police Act 27 264 0 0 0 0 0 0 27 264 291PS Act (3) 289 2,724 67 465 44 215 240 315 640 3,719 4,359 - Administrative Services (4) 154 1,854 30 303 20 147 38 104 242 2,408 2,650 - Operational Services 62 262 21 65 4 7 99 96 186 430 616 - Professional Officers 32 154 7 30 16 37 15 14 70 235 305 - Technical Services 1 16 0 3 2 6 4 5 7 30 37 - Allied Health Professionals 34 387 8 59 1 10 0 1 43 457 500 - Other PS Act (5) 6 51 1 5 1 8 84 95 92 159 251Public Sector Salaried 263 3,527 90 817 15 151 130 653 498 5,148 5,646 - Health Care Act 204 3,218 76 768 11 94 91 595 382 4,675 5,057 - Other Public Sector Salaried 59 309 14 49 4 57 39 58 116 473 589School Services Officers 120 1,701 166 1,154 15 98 195 1,208 496 4,161 4,657TAFE Act 69 321 30 82 0 4 263 469 362 876 1,238Weekly Paid 432 2,038 120 129 49 46 301 972 902 3,185 4,087 - Health Ancillary Employees 277 1,963 15 107 0 6 128 763 420 2,839 3,259 - Government Services 136 54 94 20 46 6 68 97 344 177 521 - Other Weekly Paid 19 21 11 2 3 34 105 112 138 169 307Other 116 475 49 183 15 51 373 435 553 1,144 1,697
Total 2,786 21,339 921 5,245 180 941 2,636 8,146 6,523 35,671 42,194
* For reporting purposes all employees in casual employment are recorded as part time employees.
(1) Includes Ambulance Service Officers and Firefighters
(2) Includes all executives in the South Australian Public Sector.(3) Includes PS Act employees located in other public organisations. (4) Includes PS Act trainees. (5) Includes all PS Act employees located in Other Public Sector Organisations.
Employee Type
Appointment Type
OngoingContract
Other TotalShort term Long term
12%
20%
6%
100%
19%
48%43%
23%
100%
51%
35%37%
16%
100%
41%
0%
20%
40%
60%
80%
100%
Ongoing Short term contract Long term contract Other Total
Male Female Total
Part-Time Employees as a percentage of the Total SA Public Sector, within Appointment Type and Gender groupings, June 2012

Table 11 - Executives in the South Australian Public Sector by Employee Type, Appointment Type and Gender, June 2012
Appointment Type
Male Female Male Female Male Female Male Female Male Female TotalChildren's Services Act 0 0 0 0 0 0 0 0 0 0 0 0.0
Disability Services Officers 0 0 0 0 0 0 0 0 0 0 0 0.0
Education Act 1 0 29 56 164 223 0 0 194 279 473 472.7
Emergency Services 0 0 1 0 3 1 0 0 4 1 5 5.0
Medical Officers 0 0 0 0 0 0 0 0 0 0 0 0.0
Nurses 0 0 0 0 0 0 0 0 0 0 0 0.0
Police Act 0 0 0 0 7 2 0 0 7 2 9 9.0
PS Act (1) 2 0 3 5 377 212 0 0 382 217 599 595.0
Public Sector Salaried 3 1 1 0 52 40 0 0 56 41 97 96.3
- Health Care Act 0 0 0 0 27 29 0 0 27 29 56 56.0
- Other Public Sector Salaried 3 1 1 0 25 11 0 0 29 12 41 40.3
School Services Officers 0 0 0 0 0 0 0 0 0 0 0 0.0
TAFE Act 4 5 0 0 0 0 0 0 4 5 9 9.0
Weekly Paid 0 0 0 0 0 0 0 0 0 0 0 0.0
All Other Executives (2) 12 3 5 2 132 44 0 0 149 49 198 194.1
Total 22 9 39 63 735 522 0 0 796 594 1,390 1,381.1
(1) Includes executives in the executive management structure and managing legal solicitors.
(2) Includes all other executives employed in administrative units and other public sector organisations.
Employee Type FTEsTotalShort term Long term
Ongoing Contract Other
Percentage of Female Executives in the South Australian Public Sector,
29.4
33.6 34.035.3 35.6
36.4
38.7
42.243.1 42.7
15.0
20.0
25.0
30.0
35.0
40.0
45.0
2003 2004 2005 2006 2007 2008 2009 2010 2011 2012
Perc
enta
ge (%
)
Year
g ,June 2003 to June 2012

Table 12 - Graduates and Trainees/Apprentices in the South Australian Public Sector by Employee Type and Gender, June 2012
Male Female Total Male Female Total Male Female Total Male Female Total Male Female Total
Graduates (1)
Education Act 9 20 29 2 2 4 1 0 1 0 0 0 12 22 34
Medical Officers 0 0 0 21 16 37 0 0 0 0 0 0 21 16 37
Nurses 2 36 38 10 103 113 0 0 0 4 22 26 16 161 177
PS Act (2) 9 20 29 19 26 45 5 3 8 0 0 0 33 49 82
Public Sector Salaried 0 2 2 1 1 2 0 0 0 0 0 0 1 3 4
- Health Care Act 0 2 2 1 0 1 0 0 0 0 0 0 1 2 3
- Other Public Sector Salaried 0 0 0 0 1 1 0 0 0 0 0 0 0 1 1
Other 1 0 1 1 1 2 10 7 17 0 0 0 12 8 20
Total Graduates 21 78 99 54 149 203 16 10 26 4 22 26 95 259 354
Trainees/Apprentices (3)
Children's Services Act 0 0 0 0 7 7 0 0 0 0 0 0 0 7 7
Medical Officers 0 0 0 8 6 14 0 0 0 0 0 0 8 6 14
Nurses 0 1 1 0 1 1 0 0 0 0 2 2 0 4 4
PS Act (2) 0 0 0 46 78 124 0 0 0 0 0 0 46 78 124
Public Sector Salaried 0 1 1 0 2 2 0 2 2 1 0 1 1 5 6
- Health Care Act 0 1 1 0 2 2 0 2 2 1 0 1 1 5 6
- Other Public Sector Salaried 0 0 0 0 0 0 0 0 0 0 0 0 0 0 0
S h l S i Offi 0 0 0 9 9 18 0 0 0 0 0 0 9 9 18
Employee type
Appointment TypeTotal
Ongoing Short term Long term Other
School Services Officers 0 0 0 9 9 18 0 0 0 0 0 0 9 9 18
Weekly Paid 1 1 2 1 1 2 17 1 18 0 0 0 19 3 22
Other 1 0 1 10 6 16 35 10 45 0 0 0 46 16 62
Total Trainees/Apprentices 2 3 5 74 110 184 52 13 65 1 2 3 129 128 257
(1) This employee type covers a range of agency graduate recruitment programs through which people can enter the public sector workforce. Includes persons employed from the 2011 - 2012 SA Government Graduate Register.(2) Includes all Graduates and Trainees/Apprentices employed under the PS Act in the South Australian Public Sector.(3) This employee type covers a range of agency trainee programs.

Table 13 - Employees in the South Australian Public Sector by Total Base Salary Groupings and Gender, June 2012 (1) (2)
Administrative Units
$1 - $51,599 5,188 12,004 17,192 3,971.5 7,760.0 11,731.5
$51,600 - $65,699 4,792 8,121 12,913 4,616.2 7,223.3 11,839.5
$65,700 - $84,099 7,436 11,732 19,168 7,269.9 10,306.2 17,576.2
$84,100 - $106,199 3,803 4,373 8,176 3,770.7 4,135.0 7,905.7
$106,200+ 883 715 1,598 872.1 684.3 1,556.4
Total 22,102 36,945 59,047 20,500.4 30,108.9 50,609.3Other Public Sector Organisations
$1 - $51,599 2,617 10,501 13,118 1,973.2 7,269.7 9,242.8
$51,600 - $65,699 2,220 7,831 10,051 2,024.3 6,293.0 8,317.3
$65,700 - $84,099 3,416 10,455 13,871 3,218.1 7,858.0 11,076.2
$84,100 - $106,199 1,995 2,753 4,748 1,938.3 2,409.2 4,347.5
$106,200+ 1,914 900 2,814 1,460.3 673.8 2,134.1
Total 12,162 32,440 44,602 10,614.1 24,503.7 35,117.9Total South Australian Public Sector
$1 - $51,599 7,805 22,505 30,310 5,944.7 15,029.7 20,974.3
$51,600 - $65,699 7,012 15,952 22,964 6,640.5 13,516.3 20,156.9
$65,700 - $84,099 10,852 22,187 33,039 10,488.1 18,164.3 28,652.3
$84,100 - $106,199 5,798 7,126 12,924 5,708.9 6,544.2 12,253.2
$106,200+ 2,797 1,615 4,412 2,332.4 1,358.1 3,690.5
Public Sector Organisations (3)Number of Persons Number of FTEs
Male Female Total Male Female Total
Total 34,264 69,385 103,649 31,114.6 54,612.6 85,727.2
(1)
(2)
(3)
Salary details relate to pre-tax income excluding Super and FBT. Non-executive employees on salary sacrifice arrangements are shown as pre-sacrifice values. Executive remuneration is calculated according to a Total Remuneration Package Value (TRPV), which identifies both salary (taxable income) and non-monetary benefits, which includes motor vehicle and the governments' employer superannuation contribution. Allowances are excluded for all employees.
The salary brackets have been constructed as an indication of the level of responsibility, and are based on the remuneration structure of the PS Act Administrative Services Stream at June 2012.
This salary measure is intended to capture an indication of responsibility level only and should not be used to reflect total salary earnings or total employment cost over the 2011-2012 financial year. For this reason, all part-time employees' salaries are reported as the amount employees would receive if they worked full-time.

Table 14 - Employees in Administrative Units by Age, Appointment Type and Gender, June 2012
Appointment Type
15-19 6 10 16 32 64 96 9 1 10 14 33 47 61 0.3% 108 0.3% 169 0.3%
20-24 387 500 887 261 690 951 42 47 89 115 255 370 805 3.6% 1,492 4.0% 2,297 3.9%
25-29 1,110 1,704 2,814 440 1,077 1,517 100 185 285 144 328 472 1,794 8.1% 3,294 8.9% 5,088 8.6%
30-34 1,481 2,244 3,725 338 814 1,152 167 267 434 121 383 504 2,107 9.5% 3,708 10.0% 5,815 9.8%
35-39 1,725 2,266 3,991 276 908 1,184 227 295 522 120 596 716 2,348 10.6% 4,065 11.0% 6,413 10.9%
40-44 2,011 2,627 4,638 253 981 1,234 256 385 641 115 749 864 2,635 11.9% 4,742 12.8% 7,377 12.5%
45-49 2,056 2,912 4,968 263 911 1,174 245 393 638 156 633 789 2,720 12.3% 4,849 13.1% 7,569 12.8%
50-54 2,465 3,690 6,155 255 779 1,034 353 584 937 175 590 765 3,248 14.7% 5,643 15.3% 8,891 15.1%
55-59 2,635 3,482 6,117 308 653 961 517 637 1,154 196 486 682 3,656 16.5% 5,258 14.2% 8,914 15.1%
60-64 1,360 1,927 3,287 189 322 511 221 269 490 265 398 663 2,035 9.2% 2,916 7.9% 4,951 8.4%
65+ 379 478 857 67 77 144 44 44 88 203 271 474 693 3.1% 870 2.4% 1,563 2.6%
Total 15,615 21,840 37,455 2,682 7,276 9,958 2,181 3,107 5,288 1,624 4,722 6,346 22,102 100% 36,945 100% 59,047 100%
Median Age 47.6 47.8 47.7 39.8 40.4 40.2 50.7 49.7 50.1 50.7 45.0 46.1 47.3 - 46.1 - 46.5 -
TotalShort Term Long Term
Female TotalMale % of all FemalesFemaleMale Total % of
TotalMale % of all Males
Age Group (yrs)
OngoingContract
Other
Female Total Male Female TotalMale Female Total
0.0
5.0
10.0
15.0
20.0
25.0
15-19 20-24 25-29 30-34 35-39 40-44 45-49 50-54 55-59 60-64 65+
% o
f Em
ploy
ees
Age
Age Profile of the Administrative Unit Workforce at five year intervalsJune 2002, June 2007 and June 2012
2002 2007 2012

Table 15 - PS Act Employees in Administrative Units by Stream, Appointment Type and Gender, June 2012
Male Female Total Male Female Total Male Female Total Male Female Total Male Female Total
ADMINISTRATIVE SERVICESAdministrative Services Officers
ASO1 71 274 345 41 145 186 4 24 28 11 29 40 127 472 599
ASO2 456 1,939 2,395 116 459 575 26 97 123 18 72 90 616 2,567 3,183
ASO3 459 1,200 1,659 75 211 286 22 103 125 1 0 1 557 1,514 2,071
ASO4 659 1,138 1,797 72 150 222 32 66 98 3 0 3 766 1,354 2,120
ASO5 797 977 1,774 76 162 238 57 115 172 1 2 3 931 1,256 2,187
ASO6 760 785 1,545 93 160 253 71 79 150 3 0 3 927 1,024 1,951
ASO7 508 495 1,003 48 92 140 73 83 156 0 1 1 629 671 1,300
ASO8 323 271 594 33 48 81 69 48 117 0 0 0 425 367 792
Managers Administrative Services
MAS1 0 2 2 0 0 0 1 0 1 0 0 0 1 2 3
MAS2 18 16 34 1 0 1 2 0 2 1 0 1 22 16 38
MAS3 224 138 362 18 15 33 23 21 44 0 0 0 265 174 439
Total Administrative Services 4,275 7,235 11,510 573 1,442 2,015 380 636 1,016 38 104 142 5,266 9,417 14,683
OPERATIONAL SERVICES
OPS1 40 17 57 28 31 59 5 2 7 42 41 83 115 91 206
OPS2 644 407 1,051 94 82 176 17 9 26 47 36 83 802 534 1,336
OPS3 458 317 775 41 47 88 26 9 35 9 18 27 534 391 925
OPS4 277 245 522 17 38 55 11 0 11 1 0 1 306 283 589
OPS5 119 39 158 4 2 6 2 1 3 0 0 0 125 42 167
OPS6 85 38 123 3 1 4 1 0 1 0 0 0 89 39 128
OPS7 31 9 40 0 0 0 1 0 1 0 0 0 32 9 41
Total Operational Services 1,654 1,072 2,726 187 201 388 63 21 84 99 95 194 2,003 1,389 3,392
PROFESSIONAL OFFICERS
PO1 92 130 222 44 47 91 42 30 72 9 9 18 187 216 403
PO2 170 162 332 23 30 53 51 54 105 4 5 9 248 251 499
PO3 184 97 281 7 13 20 51 15 66 1 0 1 243 125 368
PO4 176 55 231 7 4 11 25 8 33 1 0 1 209 67 276
PO5 90 16 106 1 0 1 17 3 20 0 0 0 108 19 127
PO6 11 1 12 0 0 0 5 0 5 0 0 0 16 1 17
Total Professional Officers 723 461 1,184 82 94 176 191 110 301 15 14 29 1,011 679 1,690
TECHNICAL SERVICES
TGO0 8 0 8 2 1 3 2 4 6 0 0 0 12 5 17
TGO1 26 13 39 0 5 5 3 7 10 1 3 4 30 28 58
TGO2 55 28 83 2 3 5 4 7 11 1 2 3 62 40 102
TGO3 59 12 71 2 0 2 6 2 8 2 0 2 69 14 83
TGO4 48 5 53 0 0 0 2 0 2 0 0 0 50 5 55
TGO5 34 2 36 0 0 0 0 0 0 0 0 0 34 2 36
Total Technical Services 230 60 290 6 9 15 17 20 37 4 5 9 257 94 351
TotalShort Term Long TermSTREAM
Ongoing Contract Other

Table 15 - PS Act Employees in Administrative Units by Stream, Appointment Type and Gender, June 2012
Male Female Total Male Female Total Male Female Total Male Female Total Male Female Total
TotalShort Term Long TermSTREAM
Ongoing Contract Other
ALLIED HEALTH PROFESSIONALS
AHP1 33 164 197 26 104 130 0 2 2 0 1 1 59 271 330
AHP2 129 627 756 13 79 92 2 35 37 0 0 0 144 741 885
AHP3 57 208 265 6 18 24 1 3 4 0 0 0 64 229 293
AHP4 11 41 52 1 4 5 1 2 3 0 0 0 13 47 60
AHP5 1 1 2 0 0 0 0 0 0 0 0 0 1 1 2
AHP6 0 1 1 0 0 0 0 0 0 0 0 0 0 1 1
Total Allied Health Professionals 231 1,042 1,273 46 205 251 4 42 46 0 1 1 281 1,290 1,571
EXECUTIVES
Executive Officers
Level A 1 0 1 0 0 0 2 2 4 0 0 0 3 2 5
Level B 0 0 0 0 0 0 5 1 6 0 0 0 5 1 6
Level C 0 0 0 0 0 0 0 0 0 0 0 0 0 0 0
Level D 0 0 0 0 0 0 0 0 0 0 0 0 0 0 0
Level E 0 0 0 0 0 0 3 1 4 0 0 0 3 1 4
Level F 0 0 0 0 0 0 9 0 9 0 0 0 9 0 9
SAES-1 1 0 1 2 5 7 265 162 427 0 0 0 268 167 435
SAES-2 0 0 0 1 0 1 76 41 117 0 0 0 77 41 118
Total Executive Services 2 0 2 3 5 8 360 207 567 0 0 0 365 212 577
Other Executives
MLS1 0 0 0 0 0 0 2 2 4 0 0 0 2 2 4
MLS2 0 0 0 0 0 0 0 0 0 0 0 0 0 0 0
MLS3 0 0 0 0 0 0 0 0 0 0 0 0 0 0 0
MLS4 0 0 0 0 0 0 0 0 0 0 0 0 0 0 0
Other Senior Officers 0 0 0 0 0 0 3 0 3 0 0 0 3 0 3
Total Executives 2 0 2 3 5 8 365 209 574 0 0 0 370 214 584
LEGAL OFFICERS
Other Legal OfficersLE1 0 0 0 0 0 0 0 0 0 0 0 0 0 0 0LE2 0 2 2 0 0 0 0 0 0 0 0 0 0 2 2LE3 0 2 2 0 1 1 0 0 0 0 0 0 0 3 3LE4 1 3 4 0 2 2 0 0 0 0 0 0 1 5 6LE5 1 1 2 0 0 0 0 1 1 0 0 0 1 2 3
Legal Officers - Attorney General'sLEC1 2 3 5 5 10 15 3 6 9 0 0 0 10 19 29LEC2 8 25 33 0 2 2 1 3 4 0 0 0 9 30 39LEC3 16 24 40 0 4 4 0 0 0 0 0 0 16 28 44LEC4 14 25 39 1 0 1 2 1 3 0 0 0 17 26 43LEC5 36 71 107 0 0 0 0 4 4 0 0 0 36 75 111
Total Legal Officers 78 156 234 6 19 25 6 15 21 0 0 0 90 190 280
Traineeships 0 0 0 9 38 47 0 0 0 0 0 0 9 38 47
OTHER 7 5 12 3 5 8 8 4 12 84 95 179 102 109 211
TOTAL ALL STREAMS 7,200 10,031 17,231 915 2,018 2,933 1,034 1,057 2,091 240 314 554 9,389 13,420 22,809

Table 16 - Aboriginal and/or Torres Strait Islander Employees in the South Australian Public Sector by Employment Type, Appointment Type and Gender, June 2012 (1)
Appointment Type
Male Female Total Male Female Total Male Female Total Male Female Total Male Female TotalChildren's Services Act 0 6 6 0 17 17 1 10 11 0 10 10 1 43 44
Disability Services Officers 5 10 15 0 0 0 0 0 0 1 0 1 6 10 16
Education Act 4 40 44 12 17 29 5 14 19 15 19 34 36 90 126
Emergency Services (3) 6 2 8 0 0 0 0 0 0 0 0 0 6 2 8
Executives 0 1 1 0 0 0 4 6 10 0 0 0 4 7 11
Medical Officers 0 0 0 1 3 4 0 0 0 1 0 1 2 3 5
Nurses 2 38 40 1 19 20 0 1 1 1 21 22 4 79 83
Police Act 35 15 50 0 0 0 0 0 0 0 0 0 35 15 50
PS Act 143 208 351 38 105 143 17 17 34 5 7 12 203 337 540
- Administrative Services (4) 86 130 216 15 44 59 10 16 26 2 0 2 113 190 303
- Operational Services 41 37 78 17 34 51 6 1 7 3 7 10 67 79 146
- Professional Officers 3 3 6 1 0 1 1 0 1 0 0 0 5 3 8
- Technical Services 2 0 2 0 0 0 0 0 0 0 0 0 2 0 2
- Allied Health Professionals 11 37 48 2 9 11 0 0 0 0 0 0 13 46 59
- Other PS Act 0 1 1 3 18 21 0 0 0 0 0 0 3 19 22
Public Sector Salaried 47 117 164 15 63 78 15 28 43 3 5 8 80 213 293
- Health Care Act 38 105 143 15 60 75 9 23 32 1 5 6 63 193 256
- Other Public Sector Salaried 9 12 21 0 3 3 6 5 11 2 0 2 17 20 37
School Services Officers 6 19 25 12 29 41 1 1 2 18 39 57 37 88 125
TAFE Act 6 13 19 0 1 1 0 0 0 0 1 1 6 15 21
Weekly Paid 23 20 43 8 5 13 3 1 4 5 12 17 39 38 77
- Health Ancillary Employees 8 20 28 1 4 5 0 0 0 5 11 16 14 35 49
- Government Services 3 0 3 2 0 2 1 1 2 0 1 1 6 2 8
- Other Weekly Paid 12 0 12 5 1 6 2 0 2 0 0 0 19 1 20
Other 40 97 137 21 66 87 9 34 43 22 46 68 92 243 335
Total 317 586 903 108 325 433 55 112 167 71 160 231 551 1,183 1,734
11 47 58 1 12 13 0 8 8 0 3 3 12 70 82
Employee Type (2) TotalShort term Long term
Employees on Leave Without Pay
OngoingContract
Other
(1)
(2) Includes all executives employed in other public sector organisations.(3) Includes Ambulance Service Officers and Fire Fighters.(4) Includes PS Act trainees.
These figures are likely to under represent the true level of Aboriginal and/or Torres Strait Islander employment due to the difficulties some agencies experience with extracting characteristics of their workforce to this level of detail from their information systems, and the difficulties associated with collecting data which relies on self identification.
Children's Services Act2.5%
Disability Services Officers0.9%
Education Act7.3%
Emergency Services (3)0.5%
Executives0.6%
Medical Officers0.3%
Nurses4.8%
Police Act2.9%PS Act
31.1%
Public Sector Salaried16.9%
School Services Officers7.2%
TAFE Act1.2%
Weekly Paid4.4% Other
19.3%
Aboriginal and/or Torres Strait Islander Employees inthe SA Public Sector by Employee Type, June 2012

Employees in Administrative Units
All employees 48,352 49,046 50,677 51,390 53,829 55,065 56,346 56,825 57,473 59,047
Aboriginal and/or Torres Strait Islander employees 616 679 702 809 978 1,072 1,070 1,146 1,170 1,259
1.27 1.38 1.39 1.57 1.82 1.95 1.90 2.02 2.04 2.13
Employees in Other Public Sector Organisations
All employees 37,224 37,839 39,302 41,458 40,951 41,840 44,251 44,599 44,012 44,602
Aboriginal and/or Torres Strait Islander employees 168 251 321 467 413 424 451 489 471 475
0.45 0.66 0.82 1.13 1.01 1.01 1.02 1.10 1.07 1.06
PS Act Employees in Administrative Units
All PS Act employees (3) 17,488 17,976 18,787 19,578 20,455 21,516 22,417 22,550 22,156 22,809
205 252 317 387 446 502 512 541 515 545
1.17 1.40 1.69 1.98 2.18 2.33 2.28 2.40 2.32 2.39
Employees in South Australian Public Sector
All employees 85,576 86,885 89,979 92,848 94,780 96,905 100,597 101,424 101,485 103,649
Aboriginal and/or Torres Strait Islander employees 784 930 1,023 1,276 1,391 1,496 1,521 1,635 1,641 1,734
0.92 1.07 1.14 1.37 1.47 1.54 1.51 1.61 1.62 1.67
(1)
(2)
(3) Includes Executives employed under the PS Act.
2006
Aboriginal and/or Torres Strait Islander PS Act Employees
Aboriginal and/or Torres Strait Islander PS Act Employees as a % of all PS Act Employees in Administrative Units
2007 2008 2009 20102003 2004 2005 2012
Table 17 - Aboriginal and/or Torres Strait Islander Employees in the South Australian Public Sector, June 2003 to June 2012(1)
2011
These figures do not include Aboriginal and/or Torres Strait Islander employees on leave without pay. At June 2012 there were 82 Aboriginal and/or Torres Strait Islander employees in the SA Public Sector who were on leave without pay.
Aboriginal and/or Torres Strait Islander employees as a % of all employees of the SA Public Sector
These figures are likely to under represent the true level of Aboriginal and/or Torres Strait Islander employment due to the difficulties some agencies experience with extracting characteristics of their workforce to this level of detail from their information systems, and the difficulties associated with collecting data which relies on self identification.
Aboriginal and/or Torres Strait Islander employees as a % of all employees of Administrative Units
Aboriginal and/or Torres Strait Islander employees as a % of all employees of other public sector organisations
Employee Type

Number of Persons Number of FTEs
Male Female Total Male Female Total
Adelaide (CBD) 14,662 22,650 37,312 13,447.5 18,221.7 31,669.2
13,823 30,850 44,673 12,596.3 24,734.3 37,330.6
Eastern Adelaide 2,793 5,177 7,970 2,628.8 4,148.9 6,777.7
Northern Adelaide 2,790 7,439 10,229 2,600.4 6,065.7 8,666.2
Southern Adelaide 3,804 9,736 13,540 3,400.1 7,683.3 11,083.4
Western Adelaide 4,436 8,498 12,934 3,967.0 6,836.5 10,803.5
Total South Australian Regional Areas 5,709 15,735 21,444 5,006.1 11,540.1 16,546.1
Eyre 642 1,791 2,433 565.4 1,273.2 1,838.6
Murray Lands 1,243 3,043 4,286 1,097.9 2,252.6 3,350.5
Northern 1,553 3,970 5,523 1,381.0 3,024.0 4,405.0
Outer Adelaide 845 2,599 3,444 729.4 1,878.3 2,607.7
South East 938 2,711 3,649 833.1 1,945.4 2,778.4
Yorke and Lower North 488 1,621 2,109 399.3 1,166.7 1,566.0
Interstate 70 150 220 64.7 116.6 181.2
TOTAL 34,264 69,385 103,649 31,114.6 54,612.6 85,727.2
(1) Some public sector employees work in multiple locations or travel constantly across the State as work requirements dictate. These employees have been recorded in the location where they spend the majority of their time, or in a smaller number of instances, the central location to which they report.
Table 18 - Employees in South Australian Public Sector by Primary Work Location and Gender, June 2012 (1)
Primary Work Location
Employees Work Location at June 2012
Total Metropolitan Adelaideexcluding the Adelaide (CBD) above
0
5
10
15
20
25
30
35
40
45
50
Adelaide (CBD) Metropolitan Adelaide (exc CBD)
Regional Areas
Perc
enta
ge (
%)
Primary Work Location
% Employees in SA Public Sector by Primary Work Location and Gender as at June 2012
Male Female

Table 19 - Employees in the South Australian Public Sector by Occupation* and Gender, June 2012 (1) (2)
*Australian & New Zealand Standard Classification of Occupations (ANZSCO)
MANAGERSChief Executives, General Managers and Legislators
1111 Chief Executives and Managing Directors 205 0.6% 152 0.2% 357 0.3%1112 General Managers 357 1.0% 280 0.4% 637 0.6%
Specialist ManagersBusiness Administration Managers1322 Finance Managers 125 0.4% 77 0.1% 202 0.2%1324 Policy and Planning Managers 166 0.5% 135 0.2% 301 0.3%Education, Health and Welfare Services Managers1343 School Principals 564 1.7% 852 1.2% 1,416 1.4%1344 Other Education Managers 108 0.3% 453 0.7% 561 0.5%ICT Managers1351 ICT Managers 152 0.4% 47 0.1% 199 0.2%Miscellaneous Specialist Managers1391 Commissioned Officers (Management) 196 0.6% 25 0.0% 221 0.2%1399 Other Specialist Managers 715 2.1% 428 0.6% 1,143 1.1%
Hospitality, Retail and Service ManagersAccommodation and Hospitality Managers1419 Other Accommodation and Hospitality Managers 142 0.4% 380 0.6% 522 0.5%All Other Managers 383 1.1% 314 0.5% 697 0.7%Total Managers & Administrators 3,113 9.1% 3,143 4.5% 6,256 6.0%
PROFESSIONALSBusiness, Human Resource and Marketing Professionals
Accountants, Auditors and Company Secretaries2211 Accountants 383 1.1% 404 0.6% 787 0.8%2212 Auditors, Company Secretaries and Corporate Treasurers 84 0.3% 81 0.1% 165 0.2%Human Resource and Training Professionals2231 Human Resource Professionals 109 0.3% 378 0.5% 487 0.5%Information and Organisation Professionals2244 Intelligence and Policy Analysts 262 0.8% 334 0.5% 596 0.6%2247 Management and Organisation Analysts 201 0.6% 260 0.4% 461 0.4%2249 Other Information and Organisation Professionals 183 0.5% 232 0.3% 415 0.4%Sales, Marketing and Public Relations Professionals2251 Advertising and Marketing Professionals 57 0.2% 110 0.2% 167 0.2%
Design, Engineering, Science and Transport ProfessionalsEngineering Professionals2332 Ci il E i i P f i l 146 0 4% 25 0 0% 171 0 2%
Male Female Total% Total Males
% Total Females % TotalOccupations
2332 Civil Engineering Professionals 146 0.4% 25 0.0% 171 0.2%2339 Other Engineering Professionals 109 0.3% 48 0.1% 157 0.2%Natural and Physical Science Professionals2341 Agricultural and Forestry Scientists 239 0.7% 140 0.2% 379 0.4%2343 Environmental Scientists 187 0.6% 132 0.2% 319 0.3%2346 Medical Laboratory Scientists 282 0.8% 430 0.6% 712 0.7%2349 Other Natural and Physical Science Professionals 106 0.3% 134 0.2% 240 0.2%
Education ProfessionalsSchool Teachers2411 Early Childhood (Pre-primary School) Teachers 16 0.1% 593 0.9% 609 0.6%2412 Primary School Teachers 918 2.7% 4,617 6.7% 5,535 5.3%2414 Secondary School Teachers 1,641 4.8% 2,045 3.0% 3,686 3.6%2415 Special Education Teachers 43 0.1% 157 0.2% 200 0.2%2410 School Teachers nfd 1,353 4.0% 3,424 4.9% 4,777 4.6%Tertiary Education Teachers2422 Vocational Education Teachers (Aus) / Polytechnic Teachers (NZ) 983 2.9% 1,242 1.8% 2,225 2.2%Miscellaneous Education Professionals2491 Education Advisers and Reviewers 117 0.3% 241 0.4% 358 0.4%
Health ProfessionalsHealth Diagnostic and Promotion Professionals2511 Dieticians 14 0.0% 178 0.3% 192 0.2%2512 Medical Imaging Professionals 133 0.4% 343 0.5% 476 0.5%2513 Occupational and Environmental Health Professionals 168 0.5% 189 0.3% 357 0.3%2515 Pharmacists 73 0.2% 253 0.4% 326 0.3%2519 Other Health Diagnostic and Promotion Professionals 37 0.1% 162 0.2% 199 0.2%Health Therapy Professionals2524 Occupational Therapists 44 0.1% 449 0.7% 493 0.5%2525 Physiotherapists 97 0.3% 364 0.5% 461 0.4%2527 Speech Professionals and Audiologists 11 0.0% 329 0.5% 340 0.3%Medical Practitioners2531 Generalist Medical Practitioners 688 2.0% 649 0.9% 1,337 1.3%2532 Anaesthetists 172 0.5% 67 0.1% 239 0.2%2534 Psychiatrists 116 0.3% 83 0.1% 199 0.2%2535 Surgeons 246 0.7% 41 0.1% 287 0.3%2539 Other Medical Practitioners 948 2.8% 579 0.8% 1,527 1.5%Midwifery and Nursing Professionals2541 Midwives 10 0.0% 831 1.2% 841 0.8%2542 Nurse Educators and Researchers 53 0.2% 334 0.5% 387 0.4%2543 Nurse Managers 29 0.1% 139 0.2% 168 0.2%2544 Registered Nurses 1,519 4.4% 10,456 15.1% 11,975 11.6%
ICT ProfessionalsDatabase and Systems Administrators, and ICT Security Specialists2621 Database and Systems Administrators, and ICT Security Specialists 175 0.5% 63 0.1% 238 0.2%

Male Female Total% Total Males
% Total Females % TotalOccupations
ICT Network and Support Professionals2631 Computer Network Professionals 243 0.7% 88 0.1% 331 0.3%
Legal, Social, and Welfare ProfessionalsLegal Professionals2713 Solicitors 148 0.4% 262 0.4% 410 0.4%Social and Welfare Professionals2723 Psychologists 79 0.2% 259 0.4% 338 0.3%2725 Social Workers 265 0.8% 1,079 1.6% 1,344 1.3%2726 Welfare, Recreation and Community Arts Workers 221 0.6% 545 0.8% 766 0.7%All Other Professionals 1,045 3.1% 1,023 1.5% 2,068 2.0%Total Professionals 13,953 40.7% 33,792 48.7% 47,745 46.1%
TECHNICIANS AND TRADE WORKERSEngineering, ICT and Science Technicians
Agricultural, Medical and Science Technicians3112 Medical Technicians 287 0.8% 534 0.8% 821 0.8%3114 Science Technicians 197 0.6% 149 0.2% 346 0.3%ICT and Telecommunications Technicians3131 ICT Support Technicians 373 1.1% 164 0.2% 537 0.5%
Electrotechnology and Telecommunications Trade WorkersElectricians3411 Electricians 161 0.5% 1 0.0% 162 0.2%
Other Technicians and Trades WorkersMiscellaneous Technicians and Trades Workers3999 Other Miscellaneous Technicians and Trades Workers 132 0.4% 20 0.0% 152 0.2%All Other Technicians and Trade Workers 1,006 2.9% 316 0.5% 1,322 1.3%Total Technicians and Trade Workers 2,156 6.3% 1,184 1.7% 3,340 3.2%
COMMUNITY AND PERSONAL SERVICE WORKERSHealth and Welfare Support Workers
Health and Welfare Support Workers4111 Ambulance Officers and Paramedics 582 1.7% 373 0.5% 955 0.9%4112 Dental Hygienists, Technicians and Therapists 28 0.1% 147 0.2% 175 0.2%4114 Enrolled and Mothercraft Nurses 294 0.9% 2,853 4.1% 3,147 3.0%4117 Welfare Support Workers 501 1.5% 1,300 1.9% 1,801 1.7%
Carers and AidesEducation Aides4221 Education Aides 828 2.4% 6,333 9.1% 7,161 6.9%Personal Carers and Assistants4231 Aged and Disabled Carers 435 1.3% 698 1.0% 1,133 1.1%4232 Dental Assistants 8 0.0% 409 0.6% 417 0.4%4233 Nursing Support and Personal Care Workers 384 1.1% 1,290 1.9% 1,674 1.6%4234 Special Care Workers 135 0.4% 464 0.7% 599 0.6%
Hospitality WorkersHospitality Workers4315 Waiters 135 0.4% 174 0.3% 309 0.3%
Protective Service WorkersDefence Force Members, Fire Fighters and Police4412 Fire and Emergency Workers 1,027 3.0% 30 0.0% 1,057 1.0%4413 Police 3,349 9.8% 1,195 1.7% 4,544 4.4%Prison and Security Officers4421 Prison Officers 699 2.0% 198 0.3% 897 0.9%4422 Security Officers and Guards 175 0.5% 74 0.1% 249 0.2%
Sports and Personal Service WorkersSports and Fitness Workers4521 Fitness Instructors 63 0.2% 189 0.3% 252 0.2%All Other Community and Personal Service Workers 133 0.4% 295 0.4% 428 0.4%Total Community and Personal Service Workers 8,776 25.6% 16,022 23.1% 24,798 23.9%
CLERICAL AND ADMINISTRATIVE WORKERSOffice Managers and Program Adminstrators
Contract, Program and Project Administrators5111 Contract, Program and Project Administrators 854 2.5% 1,809 2.6% 2,663 2.6%Office and Practice Managers5121 Office Managers 212 0.6% 469 0.7% 681 0.7%
Personal Assistants and SecretariesPersonal Assistants and Secretaries5211 Personal Assistants 78 0.2% 688 1.0% 766 0.7%
General Clerical WorkersGeneral Clerks5311 General Clerks 1,038 3.0% 6,368 9.2% 7,406 7.2%
Inquiry Clerks and ReceptionistsCall or Contact Centre Information Clerks5411 Call or Contact Centre Workers 146 0.4% 353 0.5% 499 0.5%5412 Inquiry Clerks 158 0.5% 334 0.5% 492 0.5%Receptionists5421 Receptionists 12 0.0% 165 0.2% 177 0.2%
Numerical ClerksAccounting Clerks and Bookkeepers5511 Accounting Clerks 178 0.5% 570 0.8% 748 0.7%5513 Payroll Clerks 76 0.2% 205 0.3% 281 0.3%
Clerical and Office Support WorkersClerical and Office Support Workers5619 Other Clerical and Office Support Workers 49 0.1% 128 0.2% 177 0.2%
Other Clerical and Administrative WorkersLogistics Clerks5911 Purchasing and Supply Logistics Clerks 89 0.3% 63 0.1% 152 0.2%

Male Female Total% Total Males
% Total Females % TotalOccupations
Miscellaneous Clerical and Administrative Workers5992 Court and Legal Clerks 104 0.3% 381 0.6% 485 0.5%5995 Inspectors and Regulatory Officers 178 0.5% 90 0.1% 268 0.3%5999 Other Miscellaneous Clerical and Administrative Workers 310 0.9% 596 0.9% 906 0.9%All Other Clerical and Service Workers 170 0.5% 555 0.8% 725 0.7%Total Clerical and Administrative Workers 3,652 10.7% 12,774 18.4% 16,426 15.9%
SALES WORKERSSales Representatives and Agents
Real Estate Sales Agents6121 Real Estate Sales Agents 194 0.6% 302 0.4% 496 0.5%All Other Sales Workers 40 0.1% 80 0.1% 120 0.1%Total Sales Workers 234 0.7% 382 0.6% 616 0.6%
MACHINERY OPERATORS AND DRIVERSRoad and Rail Drivers
Automobile, Bus and Rail Drivers7312 Bus and Coach Drivers 107 0.3% 86 0.1% 193 0.2%7313 Train and Tram Drivers 238 0.7% 30 0.0% 268 0.3%All Other Machinery Operators and Drivers 219 0.6% 38 0.1% 257 0.3%Total Machinery Operators and Drivers 564 1.7% 154 0.2% 718 0.7%
LABOURERSCleaners and Laundry Workers
Cleaners and Laundry Workers8112 Commercial Cleaners 120 0.4% 998 1.4% 1,118 1.1%
Construction and Mining LabourersConstruction and Mining Labourers8211 Building and Plumbing Labourers 487 1.4% 3 0.0% 490 0.5%
Food Preparation AssistantsFood Preparation Assistants8513 Kitchenhands 71 0.2% 511 0.7% 582 0.6%
Other LabourersMiscellaneous Labourers8993 Handypersons 621 1.8% 40 0.1% 661 0.6%All Other Labourers 216 0.6% 131 0.2% 347 0.3%Total Labourers 1,709 5.0% 1,760 2.5% 3,469 3.4%
Other / Not StatedAll Other / Not Stated Occupational Codes 107 0.3% 174 0.3% 281 0.3%Total SA Public Sector 34,264 100.0% 69,385 100.0% 103,649 100.0%
(2) The Australian Bureau of Statistics (ABS) Australian & New Zealand Standard Classification of Occupations (ANZSCO) is a skill-based classification structure.(1) Only occupational codes with more than 150 active and paid persons have been reported individually

Table 20 (A) - Length of Service of Employees in SA Public Sector Organisations by Gender, June 2012 (1)
Length of Service to a Public Sector Organisation
Number of Persons Number of FTEs
Male Female Total Male Female Total
< 12 months 4,147 8,892 13,039 3,541.2 6,640.5 10,181.7
1 to < 2 years 2,660 6,136 8,796 2,330.1 4,735.4 7,065.6
2 to < 3 years 2,891 5,320 8,211 2,627.3 4,244.8 6,872.2
3 to < 4 years 2,403 4,810 7,213 2,197.2 3,824.6 6,021.8
4 to < 5 years 2,152 4,635 6,787 1,937.7 3,654.0 5,591.8
5 to < 10 years 6,103 13,571 19,674 5,478.0 10,552.5 16,030.5
10 to < 15 years 3,642 7,816 11,458 3,367.5 6,077.5 9,445.1
15 to < 20 years 2,047 4,722 6,769 1,890.8 3,718.3 5,609.1
20 to < 25 years 2,219 4,235 6,454 2,092.9 3,412.4 5,505.3
25 + years 6,000 9,248 15,248 5,651.6 7,752.5 13,404.1
TOTAL 34,264 69,385 103,649 31,114.6 54,612.6 85,727.2
(1) Based on an employee's start date in the individual public sector agency/organisation in which they currently work. This can differ from an employee's total length of service in the SA Public Sector, reported in Table 20 (P).Table 20 (A) is comparable with Table 20 published in prior Workforce Information Reports from recent years.
Tenure
24.0
% of Employees by Length of Service in SA Public Sector Organisations by Gender, as at June 2012
0.0
2.0
4.0
6.0
8.0
10.0
12.0
14.0
16.0
18.0
20.0
22.0
< 12 months 1 to < 2 years 2 to < 3 years 3 to < 4 years 4 to < 5 years 5 to < 10 years 10 to < 15 years
15 to < 20 years
20 to < 25 years
25 + years
Perc
enta
ge (%
)
Length of service Male Female

Table 20 (P) - Length of Total Service of Employees in the SA Public Sector by Gender, June 2012 (1)
Length of Total Service in SA Public Sector
Number of Persons Number of FTEs
Male Female Total Male Female Total
< 12 months 3,143 7,063 10,206 2,647.2 5,163.2 7,810.5
1 to < 2 years 2,187 4,917 7,104 1,883.0 3,693.6 5,576.6
2 to < 3 years 1,985 4,251 6,236 1,742.8 3,337.4 5,080.2
3 to < 4 years 2,004 4,170 6,174 1,801.1 3,280.9 5,082.0
4 to < 5 years 1,923 3,971 5,894 1,733.8 3,126.8 4,860.6
5 to < 10 years 6,300 14,230 20,530 5,668.7 11,114.0 16,782.7
10 to < 15 years 4,057 8,931 12,988 3,713.7 6,972.3 10,686.1
15 to < 20 years 2,354 5,529 7,883 2,157.2 4,339.6 6,496.9
20 to < 25 years 2,389 5,224 7,613 2,244.3 4,241.0 6,485.2
25 + years 7,922 11,099 19,021 7,522.7 9,343.8 16,866.6
TOTAL 34,264 69,385 103,649 31,114.6 54,612.6 85,727.2
(1) Based on an employee's start date in the SA Public Sector, and can differ from an employee's length of service inan individual public sector organisation, reported in Table 20 (A)
Tenure
% of Employees by Length of Service in SA Public Sector Organisations by Gender, as at June 2012
0.0
2.0
4.0
6.0
8.0
10.0
12.0
14.0
16.0
18.0
20.0
22.0
24.0
< 12 months 1 to < 2 years 2 to < 3 years 3 to < 4 years 4 to < 5 years 5 to < 10 years 10 to < 15 years
15 to < 20 years
20 to < 25 years
25 + years
Perc
enta
ge (%
)
Length of service Male Female

Table 21 (R) - Employees Recruited to SA Public Sector Organisations by Employee Type and Gender, July 2011 to June 2012
Employee Type
Employees Recruited to a Role during the 2011-2012 Financial Year (1) (2)
OngoingContract
Other TotalShort Term Long Term
Male Female Total Male Female Total Male Female Total Male Female Total Male Female TotalCh en' erv ctildr s S ices A 0 0 0 1 33 34 0 4 4 3 200 203 4 237 241Di y v ffi ssabilit Ser ices O cer 51 83 134 0 0 0 0 0 0 7 16 23 58 99 157Edu ctcation A 30 34 64 122 320 442 1 5 6 144 456 600 297 815 1,112Em cy erv )ergen S ices (3 87 32 119 0 0 0 0 0 0 14 11 25 101 43 144E tives )xecu (4 2 0 2 4 1 5 74 58 132 0 0 0 80 59 139Me ffi sdical O cer 37 25 62 559 514 1,073 5 3 8 22 16 38 623 558 1,181Nurses 98 556 654 117 883 1,000 5 38 43 122 962 1,084 342 2,439 2,781Po ctlice A 193 83 276 0 0 0 0 0 0 0 0 0 193 83 276PS Act ) (5 526 730 1,256 688 1,472 2,160 190 248 438 384 570 954 1,788 3,020 4,808Pu iblic Sector Salar ed 138 613 751 204 934 1,138 35 97 132 87 491 578 464 2,135 2,599Sch erv ffi sool S ices O cer 0 0 0 72 160 232 5 5 10 91 410 501 168 575 743TAFE ct A 20 8 28 43 53 96 0 0 0 196 289 485 259 350 609W aeekly P id 98 86 184 97 69 166 28 16 44 253 537 790 476 708 1,184Other 195 125 320 119 150 269 59 52 111 247 308 555 620 635 1,255
TOTAL 1,475 2,375 3,850 2,026 4,589 6,615 402 526 928 1,570 4,266 5,836 5,473 11,756 17,229
(1) Includes all employees appointed to a position within an individual public sector organisation during 2011-2012 financial year, regardless of whether they were still employees of the organisation in the last pay period of June 2012. Excludes employees who have returned from extended leave without pay, or who were already employees of the organisation (i.e. either have won the position in the same agency in which they are already working, or have returned from contract employment in another agency).
(2) This table DOES NOT specify employees recruited new to the SA Public Sector, only the number of employees who started in a public sector organisation during the 2011-2012 financial year and consequently may have originated from another SA Public Sector position.
(3) Includes Ambulance Service Officers and Fire Fighters.(4) Includes all executives in the South Australian Public Sector.(5) Includes PS Act employees located in other public organisations.

Table 21 (S)* - Movement of Employees within and Separations from SA Public Sector Organisations by Employee Type and Gender, July 2011 to June 2012
Short Term Long TermMale Female Total Male Female Total Male Female Total Male Female Total Male Female Total
0 20 20 1 66 67 0 3 3 0 3 3 1 92 93
0 0 0 0 0 0 0 0 0 0 0 0 0 0 0
0 20 20 0 7 7 0 2 2 0 3 3 0 32 32
0 0 0 1 59 60 0 1 1 0 0 0 1 60 61
22 47 69 0 0 0 0 0 0 7 11 18 29 58 87
1 1 2 0 0 0 0 0 0 0 1 1 1 2 3
11 23 34 0 0 0 0 0 0 1 1 2 12 24 36
10 23 33 0 0 0 0 0 0 6 9 15 16 32 48
121 225 346 144 331 475 29 27 56 15 23 38 309 606 915
0 0 0 2 0 2 0 0 0 0 0 0 2 0 2
121 225 346 46 102 148 27 24 51 15 23 38 209 374 583
0 0 0 96 229 325 2 3 5 0 0 0 98 232 330
52 21 73 0 0 0 0 0 0 3 6 9 55 27 82
1 1 2 0 0 0 0 0 0 0 0 0 1 1 2
29 17 46 0 0 0 0 0 0 3 6 9 32 23 55
22 3 25 0 0 0 0 0 0 0 0 0 22 3 25
2 1 3 10 4 14 106 81 187 0 0 0 118 86 204
1 0 1 2 2 4 49 34 83 0 0 0 52 36 88
0 1 1 3 0 3 28 26 54 0 0 0 31 27 58
1 0 1 5 2 7 29 21 50 0 0 0 35 23 58
42 14 56 454 370 824 15 6 21 27 24 51 538 414 952
10 3 13 122 101 223 5 3 8 3 2 5 140 109 249
21 5 26 31 26 57 2 2 4 4 4 8 58 37 95
11 6 17 301 243 544 8 1 9 20 18 38 340 268 608
101 727 828 52 307 359 5 31 36 62 595 657 220 1,660 1,880
35 202 237 18 72 90 1 8 9 3 41 44 57 323 380
27 270 297 6 46 52 0 7 7 9 91 100 42 414 456
39 255 294 28 189 217 4 16 20 50 463 513 121 923 1,044
143 20 163 0 0 0 0 0 0 0 0 0 143 20 163
1 0 1 0 0 0 0 0 0 0 0 0 1 0 1
137 20 157 0 0 0 0 0 0 0 0 0 137 20 157
5 0 5 0 0 0 0 0 0 0 0 0 5 0 5
779 1,154 1,933 352 774 1,126 130 168 298 404 553 957 1,665 2,649 4,314
317 482 799 105 306 411 41 86 127 205 259 464 668 1,133 1,801
Employees Separating from a Role during the 2010-2011 Financial Year (1)
Employee Type Ongoing
- Movement - within SAPS (2)
ContractOther Total
Executives (6)
Medical Officers
- Separation - left SAPS (3)
- Not Stated (4)
- Movement - within SAPS (2)
- Separation - left SAPS (3)
- Separation - left SAPS (3)
- Movement - within SAPS (2)
- Separation - left SAPS (3)
- Not Stated (4)
Children's Services Act
- Not Stated (4)
Disability Services Officers
Education Act
Emergency Services (5)
Nurses
- Separation - left SAPS (3)
- Not Stated (4)
- Movement - within SAPS (2)
- Separation - left SAPS (3)
- Not Stated (4)
- Movement - within SAPS (2)
- Movement - within SAPS (2)
- Separation - left SAPS (3)
- Not Stated (4)
- Movement - within SAPS (2)
- Separation - left SAPS (3)
- Not Stated (4)
- Movement - within SAPS (2)
Police Act- Not Stated (4)
- Movement - within SAPS (2)
PS Act (7)
317 482 799 105 306 411 41 86 127 205 259 464 668 1,133 1,801
318 430 748 30 91 121 38 38 76 12 17 29 398 576 974
144 242 386 217 377 594 51 44 95 187 277 464 599 940 1,539
252 730 982 136 559 695 37 97 134 101 356 457 526 1,742 2,268
74 216 290 30 164 194 11 30 41 4 21 25 119 431 550
117 296 413 27 96 123 11 31 42 45 70 115 200 493 693
61 218 279 79 299 378 15 36 51 52 265 317 207 818 1,025
9 80 89 80 265 345 0 2 2 0 7 7 89 354 443
0 2 2 0 0 0 0 0 0 0 0 0 0 2 2
9 78 87 11 34 45 0 1 1 0 7 7 20 120 140
0 0 0 69 231 300 0 1 1 0 0 0 69 232 301
45 32 77 13 10 23 0 0 0 28 43 71 86 85 171
0 0 0 1 0 1 0 0 0 1 0 1 2 0 2
45 25 70 2 2 4 0 0 0 2 8 10 49 35 84
0 7 7 10 8 18 0 0 0 25 35 60 35 50 85
205 227 432 86 39 125 26 18 44 304 389 693 621 673 1,294
45 31 76 5 3 8 1 0 1 8 16 24 59 50 109
118 95 213 20 8 28 4 0 4 51 95 146 193 198 391
42 101 143 61 28 89 21 18 39 245 278 523 369 425 794
190 144 334 108 158 266 41 56 97 258 378 636 597 736 1,333
11 16 27 8 15 23 12 10 22 0 3 3 31 44 75
128 84 212 15 36 51 16 25 41 57 56 113 216 201 41751 44 95 85 107 192 13 21 34 201 319 520 350 491 841
TOTAL 1,963 3,442 5,405 1,436 2,883 4,319 389 489 878 1,209 2,388 3,597 4,997 9,202 14,199
496 954 1,450 293 663 956 120 171 291 224 343 567 1,133 2,131 3,264
1,081 1,589 2,670 191 448 639 126 156 282 199 381 580 1,597 2,574 4,171386 899 1,285 952 1,772 2,724 143 162 305 786 1,664 2,450 2,267 4,497 6,764
(*) Totals comparable with Table 21 from the Workforce Information Report from recent years.(1)
(2)
(3)
(4)
(5) Includes Ambulance Service Officers and Fire Fighters.(6) Includes all executives in the South Australian Public Sector.(7)
Employees that moved internally within the SAPS. This includes employees moving to a different role within the same Agency, or transferring to a different Agency within the SAPS.
Weekly Paid
Includes PS Act employees located in other public organisations.
Includes employees who permanently left their individual agency during the 2011-2012 financial year. Excludes temporary assignments to other public sector organisations, unpaid leave, or casual employees who did not work in the last pay period.
TAFE Act
School Services Officers
- Not Stated (4)
Movement within SAPS
- Separation - left SAPS (3)
- Not Stated (4)
- Not Stated (4)
- Movement - within SAPS (2)
- Separation - left SAPS (3)
- Not Stated (4)
- Movement - within SAPS (2)
- Separation - left SAPS (3)
Employees that separated from the SAPS. This includes employees resigning to a non-SA Public Sector role, or who left the workforce due to: a Targeted Voluntary Separation Package (TVSP); a WorkCover settlement; death; retirement; ill health; study; or family responsibilities.Those who ended employment in a role during the 2011-2012 financial year, but whose subsequent employment sector was not specified. Reasons for ending employment in a role include; dismissal, contract expiry or resignation. Agencies did not specify whether these employees subsequently moved to a different role within the SAPS or whether they separated entirely from the SAPS.
Public Sector Salaried
- Movement - within SAPS (2)
- Separation - left SAPS (3)
Other
- Movement - within SAPS (2)
- Separation - left SAPS (3)
- Not Stated (4)
- Movement - within SAPS (2)
- Separation - left SAPS (3)
- Not Stated (4)
- Movement - within SAPS (2)
- Separation - left SAPS (3)
- Not Stated (4)

the Period July 2011 to June 2012 (1)
Children's Services Act 104.1 6,866.0 6,970.1Disability Services Officers 5,004.6 9,172.1 14,176.7Education Act 23,990.3 56,363.9 80,354.2Emergency Services (2) 16,930.5 2,728.3 19,658.8Executives (3) 3,001.1 3,050.8 6,051.9Medical Officers 6,176.2 6,259.0 12,435.3Nurses 22,037.2 147,045.5 169,082.6Police Act 27,181.0 9,454.2 36,635.3PS Act 75,899.3 114,071.8 189,971.1Public Sector Salaried 22,445.2 91,550.8 113,996.0School Services Officers 3,129.8 21,012.6 24,142.4TAFE Act 3,923.1 4,420.5 8,343.7Weekly Paid 23,606.8 30,596.8 54,203.6Other 16,660.4 15,916.4 32,576.8Total 250,089.7 518,508.5 768,598.3
* Total FTE Sick Leave Days, paid and unpaid to 30 June 2012 .(1)
(2) Includes ambulance service officers and fire fighters.(3) Includes all executives employed in the South Australian Public Sector.
Table 22 - Total Sick Leave Days (Paid and Unpaid) Taken by Employee Type for
Total Female Sick Leave Taken*
Total Male Sick Leave Taken* Total Sick Leave Taken*
Total Sick Leave includes all absences, whether paid or unpaid, and those on account of Family Carer's Leave. It should be assumed the figures derived in this table are for Sick and Family Carer's Leave claimed to the 30 June 2012.
Employee Type
Table 23 - Family Carer's Leave Days Taken by Employee Type for the Period July 2011 to June 2012 (1)
Children's Services Act 9.0 860.4 869.4Disability Services Officers 29.1 39.8 68.9Education Act 1,383.5 4,039.6 5,423.1Emergency Services (3) 629.4 9.3 638.6Executives (4) 350.3 337.3 687.6Medical Officers 489.7 234.1 723.8Nurses 0.0 22.4 22.4Police Act 2,109.4 586.8 2,696.2PS Act 7,868.3 8,657.7 16,526.0Public Sector Salaried 1,700.6 6,431.9 8,132.5School Services Officers 122.8 1,468.1 1,590.8TAFE Act 3.0 19.0 22.0Weekly Paid 1,234.0 1,312.2 2,546.2Other 1,887.1 1,367.2 3,254.3Total 17,816.1 25,385.8 43,201.9
* Total FTE Family Leave Days, paid and unpaid to 30 June 2012.(1) Only those agencies able to report on family carer's leave separately have been included.(2) These figures under-represent the true level of family carer's leave taken due to the difficulties some agencies
experience in extracting family carer's leave from their information systems.(3) Includes ambulance service officers and fire fighters.(4) Includes all executives employed in the South Australian Public Sector.
Employee Type Total Male Family Carers Leave Taken*
Total Female Family Carers Leave Taken*
Total Family Carers
Leave Taken (2)*

Average FTE's for Period
Total Sick Leave Days Taken
Average Total Sick Leave Days Taken
Per FTE
Attorney-General's (1) 1,406.1 13,516.6 9.6Auditor-General's 111.3 823.1 7.4Communities and Social Inclusion 5,993.1 54,727.3 9.1Correctional Services 1,641.0 18,218.5 11.1Defence SA 33.1 139.1 4.2Education and Child Development 21,718.4 142,496.5 6.6
21.1 232.7 11.0Environment and Natural Resources (2) 1,076.0 9,586.6 8.9Environment Protection Authority 216.5 2,087.4 9.6
3,304.1 22,247.7 6.7Health and Ageing, Department of (4) 1,984.2 15,713.6 7.9Manufacturing, Innovation, Trade, Resources and Energy 247.7 2,438.2 9.8Planning, Transport and Infrastructure 3,355.6 30,183.2 9.0Police, SA (6) 5,554.0 47,549.4 8.6Premier and Cabinet (7) 1,467.5 14,589.7 9.9Primary Industries and Resources SA (8) 1,034.5 7,864.0 7.6Treasury and Finance (9) 1,156.6 6,662.3 5.8Water, Department for (10) 339.8 2,933.8 8.6Zero Waste SA 23.2 149.8 6.5Total Administrative Units 50,683.6 392,159.4 7.7Other Public Sector Organisations **Adelaide and Mount Lofty Ranges NRM Board 77.3 586.4 7.6Adelaide Cemeteries Authority 52 1 532 8 10 2
Table 24 - Sick Leave Days (Paid and Unpaid) Taken for the Period July 2011 to June 2012 *
Public Sector Organisations
Administrative Units
Electoral Commission of South Australia
Further Education, Employment, Science & Technology (3)
Adelaide Cemeteries Authority 52.1 532.8 10.2Adelaide Convention Centre (11) 152.1 900.8 5.9Adelaide Entertainments Corporation (11) 71.1 213.5 3.0Adelaide Festival Centre Trust (11) 161.0 1,022.8 6.4Ambulance Service, SA 1,153.9 9,909.4 8.6Country Arts, SA 50.2 227.3 4.5Country Fire Service 120.7 776.1 6.4Courts Administration Authority (12) 715.6 7,682.6 10.7Electorate Offices (13) 202.0 1,269.4 6.3Forestry SA 185.4 1,446.9 7.8Health Units (14) 26,756.0 311,705.5 11.7HomeStart Finance 97.1 922.5 9.5Legal Services Commission 187.0 1,437.4 7.7Legislature (Including Members) 102.5 592.1 5.8Lotteries Commission of SA 79.3 696.9 8.8Metropolitan Fire Service 947.2 12,641.6 13.4Murray Darling NRM Board 71.1 571.6 8.0SA Fire and Emergency Services Commission 76.2 833.1 10.9SACE Board of SA 91.5 772.6 8.4Tourism Commission, SA 113.0 581.9 5.2Urban Renewal Authority 170.1 559.8 3.3Water Corporation, SA (15) 1,567.7 13,548.7 8.6West Beach Trust 79.3 688.8 8.7WorkCover Corporation 272.8 2,296.3 8.4Remainder of Other Public Sector Organisations 525.1 4,022.1 7.7Total Other Public Sector Organisations 34,077.3 376,438.9 11.0Total South Australian Public Sector 84,760.9 768,598.3 9.1
*
**
Total Sick Leave includes all absences due to illness, whether paid or unpaid, and those on account of Family Carer's Leave. It should be assumed that the figures derived in this table are an estimate unless evidence is provided that it is an exact measure.
Only other public sector organisations with 50.00 active/paid FTEs or greater have been listed individually.
There are some variance in totals due to rounding

Table 24 - Sick Leave Days (Paid and Unpaid) Taken for the Period July 2011 to June 2012 *
(1)
(2)(3)
(4)
(5)
(6)(7)
(8)(9)
(10)
(11)
(12)
(13)
(14)
Thi i i d SA W
Excludes persons employed under Special Acts and the Judicial Administration Act. These employees, including five statutory appointments, are reported separately from 1999 under 'Judiciary'.
Includes all persons employed under the Personal Assistants to the Members of the Parliament Enterprise Agreement.
These figures incorporate the total workforce of the Health Units (SA Health Regions) incorporated under the SA Health Care Act, which took effect on 1 July 2008. Excludes employees as a result of the integration of Workforce and Finance employees from the regional payroll to the Department of Health's payroll, April 2011.
Excludes employees from the Industrial Court Commission, Medical Panels SA, Workers Compensation Tribunal, Office of the Employee Ombudsman, and the Office of the Workcover Ombudsman transferred to AGD, July 2010
Includes a number of employees transferred from Department for Water, July 2010.Includes Super SA and SAFA. Excludes Electorate Offices. These are reported separately under Other Public Sector organisations.
Formed 1 July 2010 to replace Department for Water, Land, and Biodiversity Conservation. Excludes selected employees that transferred to Environment and Natural Resources and Primary Industries and Resources of SA, July 2010.
The number and type of functions managed determines the amount of casual work available in each pay period. The figure provided is only representative of this organisation's workforce as at June 2011 and should not be considered a reflection of the overall workforce for the 2010-2011 period.
Formerly Environment and Heritage, includes a number of employees transferred from Department for Water, July 2010.Excludes Bio Innovations SA, these employees are reported separately under Other Public Sector organisations. For reporting purposes excludes TAFE84 employees as they do not meet the definition of a SA Public Sector employee.Includes employees from the integration of Workforce and Finance employees from the regional payroll to the Department’s payroll in April 2011.
Includes Police Security and Police Band.
Excludes SA Local Government Grants Commission and Outback Areas Community Development Trust, reported under Other Public Sector organisations.
Includes the Office of the Public Trustee of South Australia and the Department of Justice. Excludes Police Complaints Authority employees who are reported separately. Includes employees in the Industrial Court Commission, Medical Panels SA, Workers Compensation Tribunal, Office of the Employee Ombudsman, and the Office of the Workcover Ombudsman transferred from DPC, July 2010.
(15) This organisation trades as SA Water.

Table 25 - Employees in the South Australian Public Sector on Leave Without Pay by Employee Type and Gender, June 2012
Persons
Male Female Total Male Female Total0 71 71 0.0 47.4 47.4
3 9 12 2.0 7.5 9.5
124 605 729 118.6 550.1 668.7
9 11 20 4.7 8.0 12.7
1 4 5 1.0 4.0 5.0
29 40 69 19.3 22.5 41.8
17 257 274 13.9 184.4 198.3
51 60 111 51.0 50.5 101.5
160 732 892 150.7 639.8 790.4
102 478 580 95.8 415.6 511.4
14 39 53 13.2 36.2 49.3
13 42 55 12.2 37.9 50.1
2 2 4 2.0 1.6 3.6
6 81 87 5.3 68.8 74.0
23 90 113 22.3 79.7 102.0
43 372 415 38.7 298.8 337.5
34 315 349 30.3 253.3 283.6
9 57 66 8.3 45.5 53.8
11 148 159 7.6 93.6 101.2
54 61 115 36.4 33.8 70.2
30 68 98 24.0 39.7 63.6
5 59 64 2.1 33.4 35.5
14 6 20 11.3 3.8 15.1 - Government Services
- Health Care Act
- Other Public Sector Salaried
School Services OfficersTAFE ActWeekly Paid - Health Ancillary Employees
Public Sector Salaried
Emergency Services (1)
Executives (2)
Medical OfficersNursesPolice Act
PS Act (3)
- Administrative Services
- Operational Services
- Professional Officers
- Technical Services
- Other PS Act
- Allied Health Professionals
Education Act
Employees who were on Leave Without Pay at the Last Pay Day of June 2012
Employee TypeFTEs
Children's Services ActDisability Services Officers
11 3 14 10.6 2.4 13.0
11 87 98 8.6 60.9 69.5
543 2,525 3,068 476.3 2,041.0 2,517.3
(1) Includes Ambulance Service Officers and Fire Fighters.(2) Includes all executives employed in the South Australian Public Sector.(3) Includes all Public Sector Act employees employed in the South Australian Public Sector.
- Other Weekly Paid
OtherTotal
Children's Services Act
2.3%Disability
Services Officers0.4%
Education Act23.8% Emergency
Services0.7%
Executives0.2%
Medical Officers2.2%
Nurses8.9%
Police Act3.6%
PS Act29.1%
Public Sector Salaried13.5%
School Services Officers
5.2%
TAFE Act3.7%
Weekly Paid3.2%
Other3.2%
SA Public Sector Employees on Leave Without Pay, June 2012