south australian giant crab pseudocarcinus gigas) · pdf filefisheries assessment report for...
TRANSCRIPT

Fisheries Assessment Report for PIRSA
South Australian Giant Crab (Pseudocarcinus gigas) Fishery
D.R. Currie, S. Mayfield, R. McGarvey and C. Gardner
June 2006
SARDI Aquatic Sciences Publication No. RD04/0215-3
SARDI Research Report Series No. 137

Fisheries Assessment Report for PIRSA
South Australian Giant Crab (Pseudocarcinus gigas) Fishery
D.R. Currie 1, S. Mayfield 1, R. McGarvey 1 and C. Gardner 2
1 South Australian Research and Development Institute, Aquatic Sciences, 2 Hamra Avenue West Beach, Adelaide, South Australia 5024
2 Tasmanian Aquaculture and Fisheries Institute, University of Tasmania, Private Bag 49, Hobart, Tasmania 7001.
June 2006
SARDI Aquatic Sciences Publication No. RD04/0215-3 SARDI Research Report Series No. 137
This fishery assessment report updates the 2005 report for South Australia’s Giant Crab fishery and is part of SARDI Aquatic Sciences ongoing assessment program for this fishery. The aims of the report are to assess the current status of the resource, identify the uncertainty associated with the assessment and to identify future research needs for the fishery.
This publication may be cited as: Currie, D.R., Mayfield, S., McGarvey, R. and Gardner, C. (2006) South Australian Giant Crab (Pseudocarcinus gigas) Fishery. Fishery Assessment Report for PIRSA. South Australian Research and Development Institute (Aquatic Sciences), Adelaide. RD04/0215-3 South Australian Research and Development Institute SARDI Aquatic Sciences 2 Hamra Avenue West Beach SA 5024 Telephone: (08) 8207 5400 Facsimile: (08) 8207 5406 http://www.sardi.sa.gov.au Disclaimer: The authors do not warrant that the information in this report is free from errors or omissions. The authors do not accept any form of liability, be it contractual, tortious or otherwise, for the contents of this report or for any consequences arising from its use or any reliance placed upon it. The information, opinions and advice contained in this report may not relate to, or be relevant to, a reader’s particular circumstances. Opinions expressed by the authors are the individual opinions of those persons and are not necessarily those of the publisher or research provider. © 2006 SARDI Aquatic Sciences This work is copyright. Apart from any use as permitted under the Copyright Act 1968, no part may be reproduced by any process without prior written permission from the authors. SARDI Aquatic Sciences Publication No. RD04/0215-3 SARDI Research Report Series No. 137 Printed in Adelaide June 2006 Authors: Currie, D.R., Mayfield, S., McGarvey, R. and Gardner, C.
Reviewers: Dr. Michael Steer and Mr. Cameron Dixon (SARDI Aquatic Sciences)
Mr. Sean Sloan (PIRSA Fisheries)
Approved by: Dr. Anthony J. Fowler (SARDI Aquatic Sciences)
Signed:
Date: 8th June 2006
Distribution: PIRSA Fisheries, SARDI Aquatic Sciences Library
Circulation: Public Domain

Giant Crab Fishery Assessment
TABLE OF CONTENTS
LIST OF FIGURES...............................................................................................................................II
LIST OF TABLES............................................................................................................................... III
EXECUTIVE SUMMARY ................................................................................................................. IV
1 INTRODUCTION.........................................................................................................................1
1.1 OVERVIEW .............................................................................................................................1 1.2 DESCRIPTION OF THE FISHERY ...............................................................................................1 1.3 ENVIRONMENTAL IMPACTS ....................................................................................................2 1.4 MANAGEMENT OF THE FISHERY.............................................................................................2 1.5 BIOLOGY OF GIANT CRABS ....................................................................................................4 1.6 STOCK ASSESSMENT ..............................................................................................................5 1.7 RESEARCH AND MONITORING ................................................................................................6
2 FISHERY STATISTICS ..............................................................................................................8
2.1 INTRODUCTION.......................................................................................................................8 2.2 CATCH, EFFORT AND CPUE...................................................................................................9
2.2.1 Inter-annual Variation in Combined Catch, Effort & CPUE (1986 – 2005)....................9 2.2.2 Seasonal Variation in Combined Catch, Effort & CPUE (1986 – 2005) .......................18 2.2.3 Inter-annual Variation in Catch, Effort and CPUE by Fishing Sector...........................19
3 LENGTH-STRUCTURED STOCK ASSESSMENT MODEL...............................................24
3.1 INTRODUCTION.....................................................................................................................24 3.2 METHODS.............................................................................................................................24 3.3 MODEL OUTPUTS..................................................................................................................24
4 PERFORMANCE INDICATORS.............................................................................................28
4.1 NORTHERN ZONE .................................................................................................................28 4.2 SOUTHERN ZONE..................................................................................................................28
5 DISCUSSION..............................................................................................................................31
5.1 STATUS OF THE GIANT CRAB FISHERY ..................................................................................31 5.2 CURRENT PERFORMANCE INDICATORS .................................................................................32 5.3 FUTURE RESEARCH NEEDS....................................................................................................33
6 REFERENCES............................................................................................................................34
7 ACKNOWLEDGEMENTS........................................................................................................36
8 APPENDIX I - DEH RECOMMENDATIONS........................................................................37
SARDI Aquatic Sciences Page i

Giant Crab Fishery Assessment
LIST OF FIGURES Figure 1. Southern and Northern management Zones for the South Australian giant crab fishery. Note
that the numerical codes presented refer to the identities of 58 separate Marine Fishing Areas (MFAs). ..........................................................................................................................................3
Figure 2. Male giant crab (Pseudocarcinus gigas) collected off King Island. Photograph provided by Garry Bell, Oceanwide Images. ......................................................................................................5
Figure 3. Inter-annual variation in a) total catch, b) fishing effort, and c) catch per unit effort (CPUE) for giant crab Pseudocarcinus gigas in South Australian waters....................................................9
Figure 4. Distribution of total fishing effort and total giant crab catch for South Australian waters between 1986/87 and 2004/05. Numerals presented in each block denote the identity codes for each MFA. ....................................................................................................................................11
Figure 5. Distribution of total giant crab catch per total fishing effort (kg.pot lift-1) for South Australian waters between 1986 and 2005. ....................................................................................................12
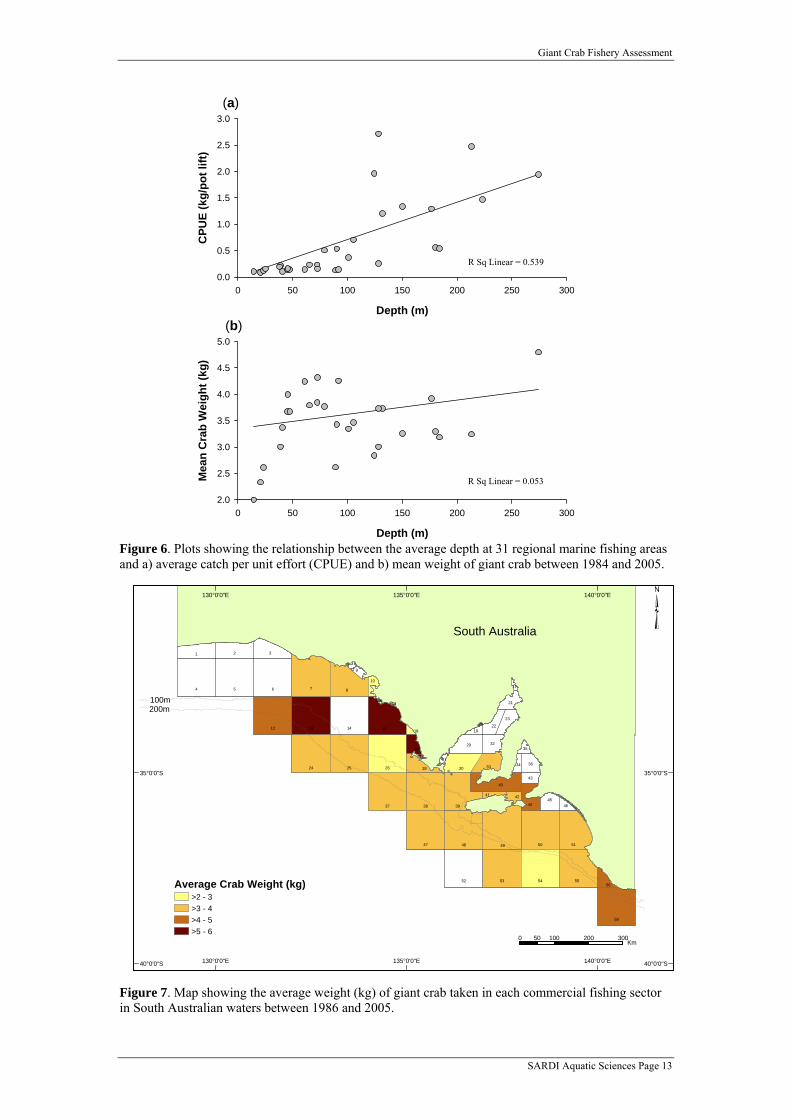
Figure 6. Plots showing the relationship between the average depth at 31 regional marine fishing areas and a) average catch per unit effort (CPUE) and b) mean weight of giant crab between 1984 and 2005. .............................................................................................................................................13
Figure 7. Map showing the average weight (kg) of giant crab taken in each commercial fishing sector in South Australian waters between 1986 and 2005. ....................................................................13
Figure 8. Distributional maps showing inter-annual variation in giant crab catches, fishing effort and catch per unit effort (kg.pot lift-1) in South Australian waters between 1992 and 2005. ..............14
Figure 9. Within season variation in giant crab catches (solid blue bars) and fishing effort (solid red lines) between 1992 and 2005. Summary statistics presented for each month and financial year are statewide totals for the combined commercial catch. Green arrows indicate seasonal closures introduced in June 2000. ...............................................................................................................20
Figure 10. Seasonal variations in giant crab catch per unit effort (CPUE) between 1992 and 2005. Summary statistics presented for each month and financial year are derived from statewide totals for the combined commercial catch. Green arrows indicate seasonal closures introduced in June 2000. .............................................................................................................................................21
Figure 11. Plots of inter-annual differences in a) total giant crab catch, b) total fishing effort, and c) catch per unit effort between different fishing sectors (Miscellaneous, Rock Lobster Quota, and Rock Lobster By-product) and fishing zones (Northern and Southern) over the period 1999 to 2005. .............................................................................................................................................22
Figure 12. Model fit (solid red line) to standardised CPUE (blue dots) in the South Australian giant crab fishery. ..................................................................................................................................24
Figure 13. Fits to length-frequency data for legal-sized female crabs. Note no data were available for 1997 and 1998...............................................................................................................................25
Figure 14. Fits to length-frequency data for legal-sized male crabs. Note no data were available for 1997 and 1998...............................................................................................................................26
Figure 15. Estimates of a) relative exploitable biomass, b) relative total biomass c) relative egg production, and d) recruitment in the South Australian Giant Crab Fishery.................................27
Figure 16. Plots of inter-seasonal differences in key performance indicators for the Northern Zone fishery (solid blue lines) and Southern Zone fishery (solid purple lines). Plots include a) catch as percentage of the TACC, b) fishing effort, c) catch per unit effort (kg.pot lift-1), d) mean crab weight ± s.e., e) abundance of undersized (<150mm) crabs per pot lift, and f) the sex ratio. Horizontal lines in each graph indicate the upper (U) and lower (L) performance reference points. Note that all estimates presented here are derived from combined miscellaneous and rock lobster quota data only (i.e. they do not include information obtained from the rock lobster by-product sector). ..........................................................................................................................................30
SARDI Aquatic Sciences Page ii

Giant Crab Fishery Assessment
LIST OF TABLES
Table 1. Current management controls for the South Australian giant crab fishery. ...............................4 Table 2. Interim performance indicators and estimation methods for the South Australian giant crab
fishery. ............................................................................................................................................5 Table 3. Reference range (interim) for key performance indicators for the South Australian giant crab
fishery. ............................................................................................................................................6 Table 4. Total catch (kg) of giant crab taken in South Australian waters in each fishing zone since the
establishment of TACC’s in 1999.................................................................................................10 Table 5. Average catch rates (kg.potlift-1) of giant crab taken in South Australian waters in each fishing
zone and sector since the establishment of TACC’s in 1999. .......................................................23 Table 6. Key performance indicator estimates for the South Australian giant crab fishery in 2004/05.
Note that all estimates presented here are derived from the miscellaneous and rock lobster quota fisheries only, and do not include information obtained from rock lobster by-product sector. Note also that the reference points for fishing effort have been calculated for the period 1999/00 – 2003/04, as they were not defined in the management plan. Values below the lower reference point are highlighted in red, while values exceeding the upper reference point are highlighted in green. ............................................................................................................................................29
SARDI Aquatic Sciences Page iii

Giant Crab Fishery Assessment
EXECUTIVE SUMMARY
1. This fishery assessment report updates the 2005 report and assesses the current status of the South Australian Giant Crab Fishery (SAGCF).
2. Data and information for assessment of the fishery are limited due to the relatively small size and value of the fishery. The paucity of information, lack of basic data available and inconsistencies in the inferences that can be drawn from the analyses prevent an unambiguous assessment of its current status.
3. During 2004/05, 19.4 tonnes of giant crab were harvested from South Australian waters. Most of this catch (69%) was harvested by two miscellaneous licence holders. Rock lobster fishers with giant crab quota entitlements accounted for 17% of the total, while the remainder (14%) was taken as by-product by commercial rock lobster fishermen not holding giant crab quota.
4. The majority of the catch in 2004/05 (12.8 tonnes; 66%) was harvested from twelve offshore Marine Fishing Areas (MFAs) in the Northern Zone (NZ), while the remainder (6.6 tonnes; 34%) was harvested from five MFAs in the Southern Zone (SZ).
5. Total catch has declined annually since the introduction of quotas in 1999, and in most recent seasons the TACC (22.1 tonnes) has not been harvested. During 2004/05, targeted giant crab catches were approximately 23% and 27% less than the total allocated for the NZ and SZ, respectively.
6. Total fishing effort declined by 75% between 1994/95 and 2003/04. However, it increased by ~35% between 2003/04 and 2004/05.
7. Overall catch rates have progressively increased since the commercialisation of the fishery. During 2004/05, average CPUE was highest in the miscellaneous licensed sector (3.43 kg.pot lift-1), and substantially lower in the rock lobster quota and rock lobster by-product sectors (0.49 and 0.18 kg.pot lift-1, respectively).
8. Declining catches and stable levels of effort in the NZ over the last five years have resulted in a declining CPUE. In contrast, stable catches and declining effort have resulted in substantial (two-fold) increases in CPUE in the SZ over the same period.
9. The mean weights of landed giant crabs over the last five-year period have remained significantly lower in the SZ (2.77 kg) than in the NZ (3.27 kg).
10. Data were available to assess fishery performance against six of the seven interim performance indicators (PI) in each zone. Five of these PI (mean weight in SZ, catch rate in NZ, fishing effort in the SZ, and total targeted catch in the NZ and SZ) were below the interim lower reference points.
11. Application of an integrated, length-based stock assessment model failed to provide biologically meaningful outputs. Consequently, these outputs were not used in the current assessment of this fishery. Further development of the model for the South Australian fishery is unlikely to provide more robust outputs, and should be replaced with alternative analytical indicators of stock status (e.g. standardised CPUE).
12. This assessment could be substantially improved by 1) investigating the range of possible biological, economic and market-driven reasons why the TACC has not been harvested since 2001/02 in either zone, 2) reviewing the interim PI and associated reference period and reference ranges, 3) interrogating the commercial catch and effort data at finer spatial scales, and 4) collecting, collating and analysing spatially-explicit commercial length-frequency data.
SARDI Aquatic Sciences Page iv

Giant Crab Fishery Assessment
1 INTRODUCTION 1.1 Overview This fishery assessment report for the South Australian giant crab fishery updates the previous report for this species (Currie and Ward, 2005) and is part of SARDI Aquatic Science’s ongoing assessment program for this fishery. The primary aims of the report are to assess the current status of the resource, identify any uncertainty associated with the assessment, and identify future research needs for the fishery. This report covers the period 1 January 1986 – 31 May 2005, and is divided into five sections: • Section 1 is a general introduction and includes an outline of the aims and structure of the
report. It also describes the fishery’s history and current management arrangements and biological performance indicators. In addition, the introduction summarises biological knowledge, and provides a synopsis of previous stock assessment reports.
• An assessment of the fishery-dependent data from 1986 to 2005 is provided in Section 2.
This includes spatial and temporal analyses of catch, effort and catch-per-unit effort (CPUE).
• Section 3 details the application of an integrated length-based stock assessment model. • In Section 4, the performance of the fishery is assessed against the performance indicators
identified in the interim management plan. • Section 5 is a general discussion that synthesises the information presented in the previous
sections. In particular it highlights gaps in current knowledge, comments on the status of the resource, and outlines future research requirements for the fishery.
1.2 Description of the Fishery Giant crabs (Pseudocarcinus gigas) are endemic to Australian waters and are distributed from southern Western Australia to central New South Wales (Kailola et al., 1993). While they occur at depths ranging from 20 m to 600 m, the highest population densities are found at the edge of the continental shelf in a depth of approximately 200 m. Giant crabs have been taken as a by-product of rock lobster fishing operations in southern Australia for over 80 years. Targeted commercial fishing for giant crabs was initiated in Tasmanian waters in 1990 and began in South Australian waters in 1992 (Sloan, 2003). During the mid 1990s, two South Australian based fishers began targeting giant crabs in Commonwealth waters adjacent to South Australia under the provision of Commonwealth Fishing Permits. These two fishers were subsequently issued with South Australian miscellaneous fishing licences in January 1997 to harvest giant crab (Sloan, 2002). Under the provisions of the Fisheries Act, 250 commercial rock lobster licence holders may also harvest giant crab from South Australian waters. Presently, 18 of these licence holders (6 Northern Zone + 12 Southern Zone) hold transferable giant crab quota units, while the remainder are permitted to retain 5 giant crabs per trip as a by-product. Lobster pots of wire mesh on steel frames of 50 x 75 mm weldmesh with moulded plastic necks are usually used in the fishery (Ward and Loiterton, 2000). Some operators that target giant crab use purpose built traps. However, all pots and traps must comply with regulations specifying the maximum dimensions and weight, single entrance and escape gaps. The pots are baited with cattle hock or a range of fish products, and are usually set overnight and hauled at first light. Any undersized crabs (<150 mm carapace width) captured are returned to the water whilst the legal quota are transported in live holding tanks back to shore.
SARDI Aquatic Sciences Page 1

Giant Crab Fishery Assessment
The fishery operates between 1 October and 30 April in the Southern Zone and 1 November and 31 May in the Northern Zone, with the fleet working from a number of ports in South Australia between Port Macdonnell and the far west coast. Vessels are restricted to 18 metres in length and a total engine capacity of 1,200 brake horsepower. In recent years, faster vessels, enabling greater fishing coverage over a given period, have replaced traditional displacement vessels. These technological changes have also resulted in an increased level of capital investment by licence holders and increased profit expectations (Ward and Loiterton, 2000). In 2002/03, 18.5 tonnes of giant crab were harvested in the South Australian fishery at an estimated value of $0.45 million. Most of this catch is exported to southeast Asia in live, pickled, green (uncooked) or cooked form. 1.3 Environmental Impacts The direct and indirect effects of giant crab fishing on the ecology of South Australia’s coastal marine environment are largely undetermined. Potential impacts may include direct disturbances to benthos, the removal of non-target species, and entrapment and entanglement of seals, whales, dolphins and turtles. Indirect effects may include changes to the population structure of other motile invertebrates and fish that scavenge on discarded baits or depend on giant crabs as a source of food. While most anecdotal evidence suggests that the environmental effects of giant crab fishing are relatively benign, the absence of empirical data to this effect presents a significant hurdle for the continued export of this species. Since 1999, the export of giant crab has been controlled under the wildlife protection provisions of the Commonwealth Environment Protection and Biodiversity Conservation (EPBC) Act 1999 (DEH, 2004). Under this act, giant crabs are recognised as a controlled species. To gain export exemption status under the act (Part 13 and 13A), it is incumbent on PIRSA Fisheries to satisfactorily demonstrate to the Commonwealth Department of Environment and Heritage that harvesting strategies for the ecologically sustainable management of the giant crab fishery are in place. This includes demonstrating that giant crab fishing operations are managed to minimise impacts on the structure, productivity, function and biological diversity of the ecosystem. 1.4 Management of the Fishery Prior to 1992, the Commonwealth Government controlled access to giant crabs off the South Australian coast. A joint management regime was established during 1992. Since January 1997, the South Australian Government has managed giant crabs targeted off the South Australian coastline under an Offshore Constitutional Settlement arrangement between the South Australian and Commonwealth Governments. Licence holders with giant crab access operate under a pot licence issued pursuant to either the Scheme of Management (Rock Lobster Fisheries) Regulations 1991 or the Scheme of Management (Miscellaneous Fisheries) Regulations 1984. The fishery has been separated into two discrete fishing zones for the purpose of management since 1997 (Figure 1). These two zones have been further divided into a series of nominally rectangular Marine Fishing Areas (MFAs) that constitute the primary units for reporting and monitoring catch. The Northern and Southern Zone Rock Lobster Management Committees provide advice to the Minister for Agriculture, Food and Fisheries on the management and administration of the South Australian giant crab fishery. The committees have an independent chairperson and selection of members is expertise-based. The committees are responsible for ensuring regular consultation with all stakeholders and for providing transparent decision-making. Furthermore, the committees are responsible for publishing all agreed decisions and developing, in conjunction with PIRSA Fisheries, annual reports and an approved management plan. Since taking over the management responsibility of the South Australian giant crab resource, PIRSA Fisheries has worked towards implementing a management system based on
SARDI Aquatic Sciences Page 2

Giant Crab Fishery Assessment
individual transferable quota units to ensure the long term sustainability of the resource. The fishery now operates under this output-control based management system with a Total Allowable Commercial Catch (TACC) of 13.4 and 8.7 tonnes for the Northern and Southern Zones, respectively. The TACC for each zone is allocated among licence holders, with an allocation set aside for by-product taken by rock lobster fishers. A suite of input controls complements these arrangements. Management controls that currently apply to the fishery are provided in Table 1.
754 68
49
3837
47 50
24
52
13
53
2625
1412
54
48
58
55
2
15
3
51
1
3940
30
29
45
33
44
28
32
36
2322
9
21
27
56
43
10
46
42
35
19
34
41
31
18
11
17
20
16
130°0'0"E
130°0'0"E
135°0'0"E
135°0'0"E
140°0'0"E
140°0'0"E
35°0'0"S 35°0'0"S
Australia
!(
!(
!(
!(
!(
Ceduna
Streaky Bay
Port Lincoln
Port MacDonnell
!(
Victor Harbor
Robe
Southern Ocean
³ S o u t h A u s t r a l i aS o u t h A u s t r a l i a
0 100 20050Km
Northern ZoneGiant Crab Fishery
Southern ZoneGiant Crab Fishery
!(Adelaide
Figure 1. Southern and Northern management Zones for the South Australian giant crab fishery. Note that the numerical codes presented refer to the identities of 58 separate Marine Fishing Areas (MFAs). The current compliance and monitoring program is focussed on monitoring landings to ensure adherence with individual quota limits. At the point of landing, licence holders that target giant crab are required to complete a giant crab Catch and Disposal Record (CDR). The fishers record information such as estimated weight of the giant crabs, port and time of landing, name of the receiving processor and if the crabs are cooked or live. The CDR then accompanies the giant crab to the processor where immediately upon receiving the giant crab, the processor must accurately weigh the catch and complete Part B of the CDR with the certified accurate weight. The CDR is then forwarded to the Fisheries Compliance Office by the fish processor within 24 hours. CDR information is entered into a database and individual catches recorded against allocated quotas. There are currently no bag or boat limits in place for the recreational sector, on the basis that giant crab are rarely caught by recreational fishers due to the inaccessibility of the fishing grounds. Recreational fishers are required to purchase a gear registration for a maximum of two rock lobster pots per person, which is the only recreational device with a capacity to catch giant crabs. All recreational rock lobster pot fishers are asked to fill out voluntary catch and effort logbooks, which are returned to SARDI Aquatic Sciences. The South Australian giant crab fishery is one of several State-managed fisheries for Pseudocarcinus gigas. In Western Australia a multi-species deep-sea crab fishery for P. gigas, snow crab (Chaceon bicolour) and spiny crab (Hypothalassia armata) operates under
SARDI Aquatic Sciences Page 3

Giant Crab Fishery Assessment
an input control system. In the south-east, Tasmanian and Victorian giant crab fisheries (which are both closely linked to State-managed rock lobster fisheries) operate under a quota management system. Coordination among jurisdictions occurs through various southern State and national fisheries management forums.
Table 1. Current management controls for the South Australian giant crab fishery.
Management Arrangement Control 1) Limited entry • 2 miscellaneous – GC quota holders
• 6 Northern Zone lobster – GC quota holders • 12 Southern Zone lobster – GC quota holders • 63 Northern Zone lobster – GC by-product • 169 Southern Zone lobster – GC by-product
2) By-product limits for rock lobster licences • All rock lobster licence holders without giant crab quota holdings may take up to 5 crabs per trip as a by-product
3) TACC • Northern Zone (13.4 tonnes); Southern Zone (8.7 tonnes)
4) Seasonal closures • Southern Zone (1 May – 30 September); Northern Zone (1 June – 31 October)
5) Quota holding limits per licence • No limits 6) Minimum legal length (both sexes) • 150 mm Carapace length (both zones) 7) Maximum pot numbers • 100 pots per licence 8) Pot specifications • Maximum diameter 1 m; maximum height
1 m; maximum weight 40 kg; single top entrance; mesh size 50 mm or escape gaps 55 x 150 mm
9) Egg-bearing females • No retention at any time 10) Spatial closures • No dedicated giant crab fishing within a
depth of 60 fathoms 11) Vessel Monitoring System (VMS) • Required by all dedicated giant crab fishers
and Northern Zone rock lobster fishers 12) Single trip fishing • Rock lobster fishers with giant crab quota are
only permited to fish for either crabs or lobster on a single fishing trip
13) Catch and effort data • Daily logbook submitted monthly 14) Catch and Disposal Records (CDR) • Daily CDR records upon landing 15) Maximum vessel length • 18 metres 16) Maximum engine capacity • 1,200 brake horsepower
1.5 Biology of Giant Crabs Giant crabs are long-lived, slow growing species that generally inhabit soft sedimentary environments and feed on sessile or slow-moving benthic species including gastropods, asteroids and other decapods. The sexes are separate, with males (Figure 2) growing to more than twice the size of females and reaching at least 13 kg. Approximately half of all females reach sexual maturity at 125mm carapace length (Levings et al., 1996), and proceed to mate during the months of June and July. Females only bear eggs in non-moulting years, and the clutch sizes can range from approximately 0.5 to 2.0 million eggs. The eggs are carried by the female for up to 4 months, and as hatching approaches (October to November) females are thought to migrate to the continental shelf break (Kailola et al., 1993). The genetic structure of the population is poorly understood, but studies using allozyme and DNA techniques have indicated a genetically homogeneous stock (Levings et al., 2001). Factors including a 3 – 4 month planktonic larval phase and adult movements of up to 400 km are thought to contribute to dispersion and mixing within the stock.
SARDI Aquatic Sciences Page 4

Giant Crab Fishery Assessment
Figure 2. Male giant crab (Pseudocarcinus gigas) collected off King Island. Photograph provided by Garry Bell, Oceanwide Images. 1.6 Stock Assessment SARDI Aquatic Sciences currently undertake assessments of the South Australian giant crab fishery. This includes assessing performance of the fishery against the suite of interim performance indicators for the fishery. The first report was completed in 2000 (Ward and Loiterton, 2000) and this has since been regularly updated (e.g. Sloan 2002; Sloan 2003; Currie and Ward, 2005). The interim performance indicators used to assess the performance of the fishery include catch per unit effort, total effort, total catch relative to TACC, and mean crab weight (Table 2). Other less direct indicators comprise estimates of the reproductive potential of the stock, including sex ratios and the relative abundance of mature females in the population. Table 2. Interim performance indicators and estimation methods for the South Australian giant crab fishery.
Performance Indicator Description Measurement 1) Catch Rate • Reflects the catch (kg) per pot lift
taken in the fishery, and is linked to the relative abundance of giant crabs
• Nominal average catch rate as recorded in logbooks
2) Mean Weight • Used to indicate change in the stock structure (size and age)
• Nominal average mean weight recorded in logbooks
3) Annual Commercial Catch vs. TACC
• Indicator of the relative abundance of giant crabs and the capacity of the fleet to catch the established TACC
• Recorded total catch by weight and numbers in logbook. Can also be validated by CDR records
4) Effort • Indication of the amount of effort required to catch the established TACC
• Recorded in commercial logbooks
5) Sex Ratio • Provides an indication of the reproductive capacity of the population
• Recorded in commercial logbooks
6) Pre-recruit Abundance Index
• Provides a measure of inter-annual changes in recruitment (undersized abundance) recorded in the commercial catch each year
• Recorded in commercial logbooks
7) Spawning Female Abundance Index
• Provides an indication of inter-annual changes in the abundance of spawning females in the population
• Recorded in commercial logbooks
SARDI Aquatic Sciences Page 5

Giant Crab Fishery Assessment
An interim reference period from 1999/00 to 2002/03 has been selected to assist in the annual assessment of the performance of the fishery (Table 3). This period was chosen because it represents a period of relative stability following the introduction of a quota system incorporating a TACC for each zone. The reference period and performance indicators will be reviewed when a formal assessment process and a management plan for the fishery is developed (Sean Sloan, PIRSA Fisheries, personal communication). Table 3. Reference range (interim) for key performance indicators for the South Australian giant crab fishery.
Performance Indicator Reference Range 1) Total Average Catch Rate (kg.pot lift-1) • 1.5 – 3.0 2) Mean Weight (kg) • 2.96 – 3.65 3) Annual Commercial Catch vs. TACC • Total catch within 15% of TACC 4) Effort • Undefined 5) Sex Ratio • Undefined 6) Pre-recruit Abundance (undersize crabs/pot lift) • 1.6 – 1.7 7) Spawning Female Abundance • Undefined 1.7 Research and Monitoring Most of the field-based research conducted on giant crabs in southern Australia (Deakin University, Tasmanian Fisheries and SARDI Aquatic Sciences) has been reviewed by Kennelly (2000). This review concluded that the research provided considerable information on the biology and ecology of the giant crab (e.g. Gardner, 1997; Gardner et al., 1998; Levings et al., 1999; McGarvey et al., 1999) that facilitated the establishment of a suitable minimum legal size (150 mm), but provided little information that could be used to establish total allowable catches. Research designed to assist the development of the aquaculture sector has also been conducted (Gardner and Northam 1998; Gardner and Maguire, 1998). More contemporary information on giant crab stocks has been provided in reports to the Fisheries Research and Development Corporation (Levings et al., 2001) and the Tasmanian Department of Primary Industries, Water and the Environment (Gardner et al., 2004). From a fisheries management perspective, one of the most useful documents available on giant crabs is the report by McGarvey et al. (1999). This document provides a yield-per-recruitment analysis for Western Australia, South Australia and Victoria, that suggests that the legal minimum length is appropriate for females but may only protect the first mature male instar. This assessment led to the recommendation that females should be monitored for decreasing numbers and sizes of spermathecae as a way to monitor the possible impact of the size limit on reproductive success (Kennelly, 2000). Most recent information (Levings et al., 2001) suggests that such monitoring may be of limited benefit as the functional maturity of crabs in a population may vary between locations and over time and may be density dependent. Kennelly (2000) also recommended that the most suitable direction for future research was for the Tasmanian Aquaculture and Fisheries Institute (TAFI) to develop a population model using both State-based data and data obtained by Deakin University. It was suggested that this approach would overcome the current lack of information available for setting total allowable catches. It was recommended that the model should be developed in conjunction with a project to establish an industry-based sampling program to provide additional data. Upon completion of the model and establishment of the industry-based sampling program, it was suggested that these be adopted by other State agencies.
SARDI Aquatic Sciences Page 6

Giant Crab Fishery Assessment
Commercial fishers in South Australia have indicated a desire to undertake research to determine a suitable escape-gap size for pots, to allow pre-recruits to be released prior to pot hauling, and to ensure that interactions with other species are minimised. Although no specific by-catch studies have been conducted on giant crab fishing operations in South Australia, companion studies have been undertaken on the South Australian rock lobster fishery. This research suggests that the main by-product species taken in the giant crab fishery are octopus (Octopus maorum), rock lobster (Jasus edwardsii) and pink ling (Genypterus blacodes) (Brock et al., 2004).
SARDI Aquatic Sciences Page 7

Giant Crab Fishery Assessment
2 FISHERY STATISTICS 2.1 Introduction Data on commercial giant crab catches and fishing effort in South Australian waters were drawn from compulsory logbooks filed by each commercial fisher. Fishers are required to provide information on fishing location, number of pots, depth, soak time, sex ratio, number of soft, berried, undersized and dead crabs, and catch weight. Currently, daily data are reported in the logbook and these are submitted at monthly intervals to SARDI Aquatic Sciences (Sloan, 2003). Logbooks used by rock lobster fishers have included information on both catch by number and catch by weight of giant crabs since 1994. Two dedicated giant crab licence holders have collected the same information since 2000. However, these licensees did not record detailed information on crab numbers prior to 2000. For the purpose of these analyses, fishing effort has been determined as the number of pots deployed on each fishing trip. This metric assumes that pots were only deployed on one occasion on each fishing trip, and does not take into account variation in the duration of the deployment (soak time) nor the size of the pots employed. Biases associated with such variables may be significant particularly when the differential fishing practices of dedicated crab and rock lobster licence holders are considered. Dedicated crab fishers, for example, generally use large pots and have soak periods of several days when targeting giant crab; rock lobster fishermen by comparison, use relatively smaller pots, and deploy these for shorter periods (usually overnight). In an effort to account for this potentially large sectoral variation in catch rate, temporal and spatial summaries of catch and effort have been presented both collectively and separately for dedicated crab and rock lobster licence holders. Before summarising catch and effort statistics from the database, several adjustments were necessary. These included the identification and correction of data entry and transcription errors, and the prediction of fishing effort for a small number of dedicated crab licence entries (“Miscellaneous” - Commonwealth endorsed) in the period between 1993 and 1997. This latter estimate was derived from the only reported measure of effort (number of boatdays) recorded during the period, and was included in all calculations, as crab landings during this period were historically high. Measures of giant crab catch (weight in kg) and fishing effort (number of pot lifts) were aggregated by month, financial year and Marine Fishing Area (MFA). These classifications were chosen as inconsistent reporting frequencies by fishermen (daily to monthly) precluded any shorter-term comparisons, and because seasonal closures to the fishery were temporally and spatially confounded. While every effort has been made to correct inaccuracies in the datasets, it should be noted that the data examined for this report have been collected by the commercial licensees and not by independent observers. Any misrepresentations of catch and effort (inadvertent or otherwise) by the licensees cannot be differentiated from bona fide observations and therefore constitute a potential but indefinable error in the precision of the estimates provided. It should be further noted that only 3 of 6771 entry fields in the data set contained zero returns (ie. indicated that no crabs were taken). This extremely low ratio suggests that licensees either invariably catch crabs during each fishing trip, or alternatively, do not report fishing effort when no catches are recorded. If the latter is true then measurements presented for fishing effort will be underestimated while catch per unit effort (CPUE) will be overestimated in this report.
SARDI Aquatic Sciences Page 8
Giant Crab Fishery Assessment
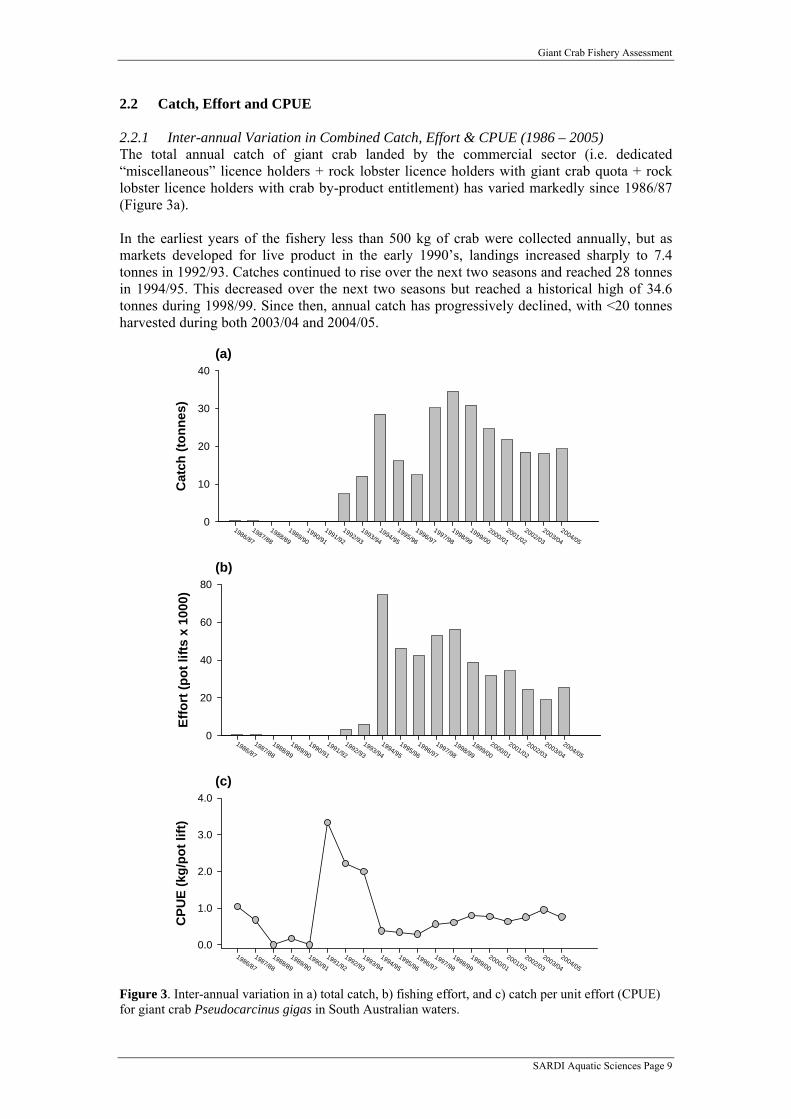
2.2 Catch, Effort and CPUE 2.2.1 Inter-annual Variation in Combined Catch, Effort & CPUE (1986 – 2005) The total annual catch of giant crab landed by the commercial sector (i.e. dedicated “miscellaneous” licence holders + rock lobster licence holders with giant crab quota + rock lobster licence holders with crab by-product entitlement) has varied markedly since 1986/87 (Figure 3a). In the earliest years of the fishery less than 500 kg of crab were collected annually, but as markets developed for live product in the early 1990’s, landings increased sharply to 7.4 tonnes in 1992/93. Catches continued to rise over the next two seasons and reached 28 tonnes in 1994/95. This decreased over the next two seasons but reached a historical high of 34.6 tonnes during 1998/99. Since then, annual catch has progressively declined, with <20 tonnes harvested during both 2003/04 and 2004/05.
(a)
1986/87
1987/88
1988/89
1989/90
1990/91
1991/92
1992/93
1993/94
1994/95
1995/96
1996/97
1997/98
1998/99
1999/00
2000/01
2001/02
2002/03
2003/04
2004/05
Cat
ch (t
onne
s)
0
10
20
30
40
(b)
1986/87
1987/88
1988/89
1989/90
1990/91
1991/92
1992/93
1993/94
1994/95
1995/96
1996/97
1997/98
1998/99
1999/00
2000/01
2001/02
2002/03
2003/04
2004/05
Effo
rt (p
ot li
fts x
100
0)
0
20
40
60
80
(c)
1986/87
1987/88
1988/89
1989/90
1990/91
1991/92
1992/93
1993/94
1994/95
1995/96
1996/97
1997/98
1998/99
1999/00
2000/01
2001/02
2002/03
2003/04
2004/05
CPU
E (k
g/po
t lift
)
0.0
1.0
2.0
3.0
4.0
Figure 3. Inter-annual variation in a) total catch, b) fishing effort, and c) catch per unit effort (CPUE) for giant crab Pseudocarcinus gigas in South Australian waters.
SARDI Aquatic Sciences Page 9
Giant Crab Fishery Assessment
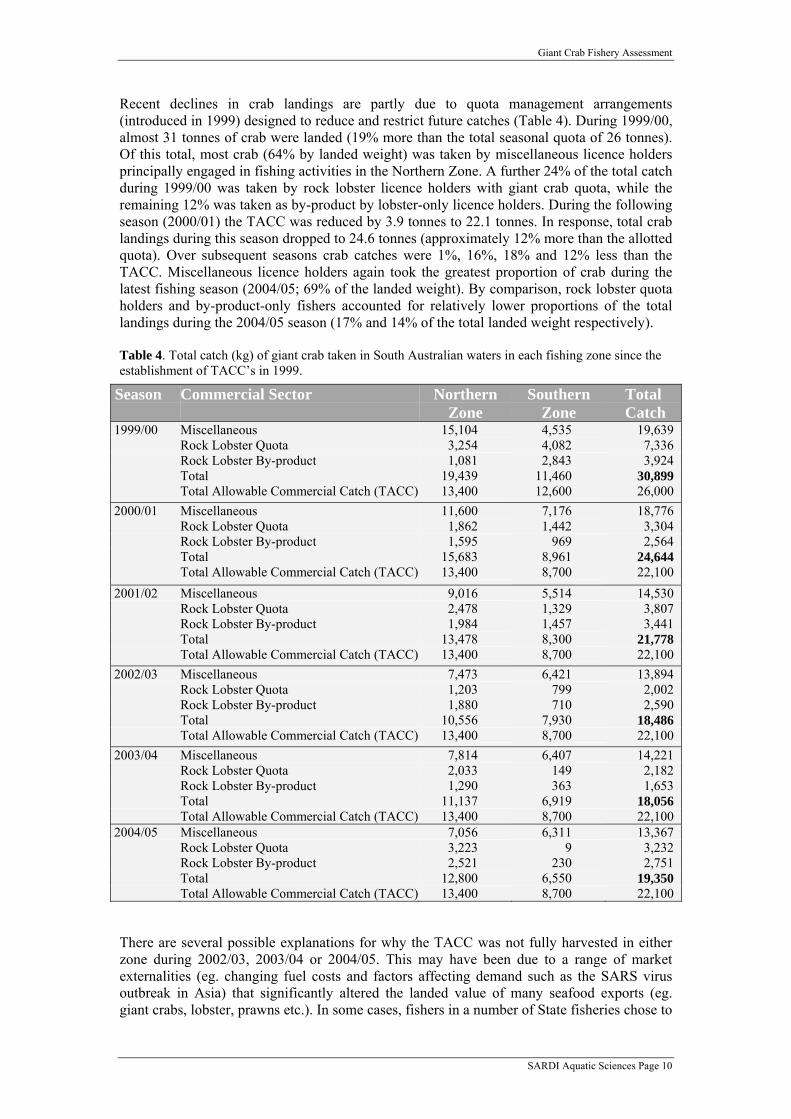
Recent declines in crab landings are partly due to quota management arrangements (introduced in 1999) designed to reduce and restrict future catches (Table 4). During 1999/00, almost 31 tonnes of crab were landed (19% more than the total seasonal quota of 26 tonnes). Of this total, most crab (64% by landed weight) was taken by miscellaneous licence holders principally engaged in fishing activities in the Northern Zone. A further 24% of the total catch during 1999/00 was taken by rock lobster licence holders with giant crab quota, while the remaining 12% was taken as by-product by lobster-only licence holders. During the following season (2000/01) the TACC was reduced by 3.9 tonnes to 22.1 tonnes. In response, total crab landings during this season dropped to 24.6 tonnes (approximately 12% more than the allotted quota). Over subsequent seasons crab catches were 1%, 16%, 18% and 12% less than the TACC. Miscellaneous licence holders again took the greatest proportion of crab during the latest fishing season (2004/05; 69% of the landed weight). By comparison, rock lobster quota holders and by-product-only fishers accounted for relatively lower proportions of the total landings during the 2004/05 season (17% and 14% of the total landed weight respectively). Table 4. Total catch (kg) of giant crab taken in South Australian waters in each fishing zone since the establishment of TACC’s in 1999.
Season
Commercial Sector
Northern Zone
Southern Zone
Total Catch
1999/00 Miscellaneous 15,104 4,535 19,639 Rock Lobster Quota 3,254 4,082 7,336 Rock Lobster By-product 1,081 2,843 3,924 Total 19,439 11,460 30,899 Total Allowable Commercial Catch (TACC) 13,400 12,600 26,000 2000/01 Miscellaneous 11,600 7,176 18,776 Rock Lobster Quota 1,862 1,442 3,304 Rock Lobster By-product 1,595 969 2,564 Total 15,683 8,961 24,644 Total Allowable Commercial Catch (TACC) 13,400 8,700 22,100 2001/02 Miscellaneous 9,016 5,514 14,530 Rock Lobster Quota 2,478 1,329 3,807 Rock Lobster By-product 1,984 1,457 3,441 Total 13,478 8,300 21,778 Total Allowable Commercial Catch (TACC) 13,400 8,700 22,100 2002/03 Miscellaneous 7,473 6,421 13,894 Rock Lobster Quota 1,203 799 2,002 Rock Lobster By-product 1,880 710 2,590 Total 10,556 7,930 18,486 Total Allowable Commercial Catch (TACC) 13,400 8,700 22,100 2003/04 Miscellaneous 7,814 6,407 14,221 Rock Lobster Quota 2,033 149 2,182 Rock Lobster By-product 1,290 363 1,653 Total 11,137 6,919 18,056 Total Allowable Commercial Catch (TACC) 13,400 8,700 22,100 2004/05 Miscellaneous 7,056 6,311 13,367 Rock Lobster Quota 3,223 9 3,232 Rock Lobster By-product 2,521 230 2,751 Total 12,800 6,550 19,350 Total Allowable Commercial Catch (TACC) 13,400 8,700 22,100
There are several possible explanations for why the TACC was not fully harvested in either zone during 2002/03, 2003/04 or 2004/05. This may have been due to a range of market externalities (eg. changing fuel costs and factors affecting demand such as the SARS virus outbreak in Asia) that significantly altered the landed value of many seafood exports (eg. giant crabs, lobster, prawns etc.). In some cases, fishers in a number of State fisheries chose to
SARDI Aquatic Sciences Page 10
Giant Crab Fishery Assessment
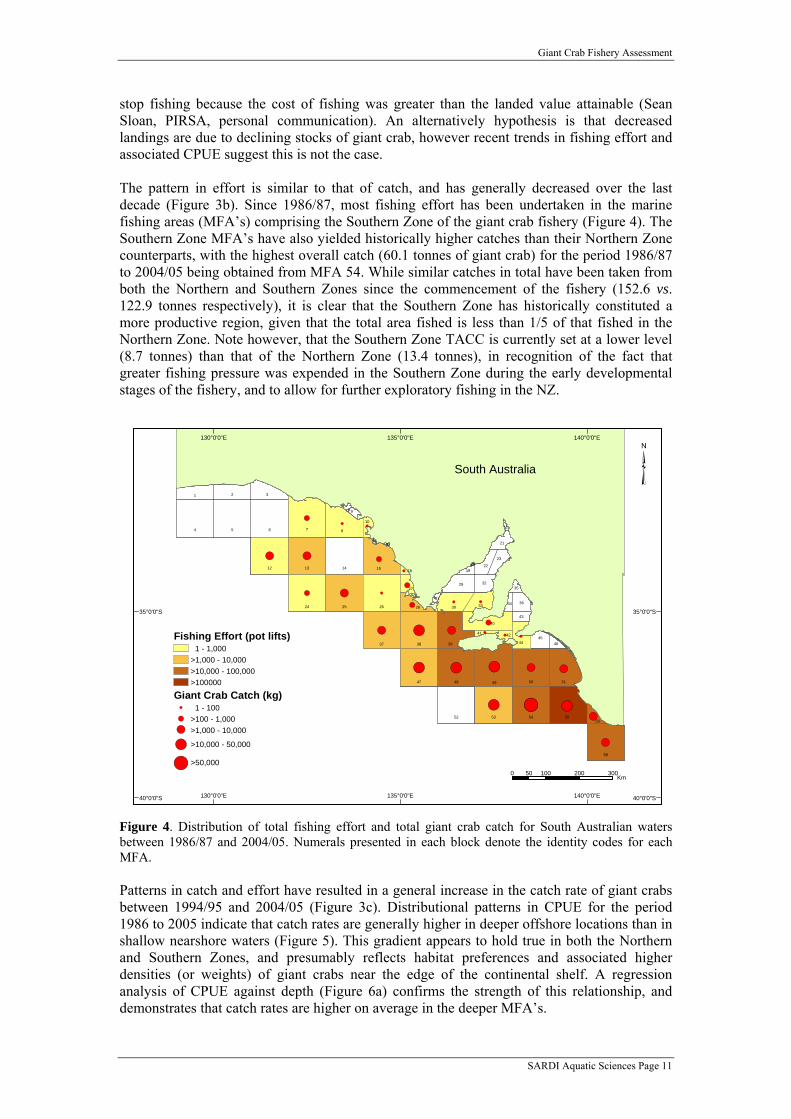
stop fishing because the cost of fishing was greater than the landed value attainable (Sean Sloan, PIRSA, personal communication). An alternatively hypothesis is that decreased landings are due to declining stocks of giant crab, however recent trends in fishing effort and associated CPUE suggest this is not the case. The pattern in effort is similar to that of catch, and has generally decreased over the last decade (Figure 3b). Since 1986/87, most fishing effort has been undertaken in the marine fishing areas (MFA’s) comprising the Southern Zone of the giant crab fishery (Figure 4). The Southern Zone MFA’s have also yielded historically higher catches than their Northern Zone counterparts, with the highest overall catch (60.1 tonnes of giant crab) for the period 1986/87 to 2004/05 being obtained from MFA 54. While similar catches in total have been taken from both the Northern and Southern Zones since the commencement of the fishery (152.6 vs. 122.9 tonnes respectively), it is clear that the Southern Zone has historically constituted a more productive region, given that the total area fished is less than 1/5 of that fished in the Northern Zone. Note however, that the Southern Zone TACC is currently set at a lower level (8.7 tonnes) than that of the Northern Zone (13.4 tonnes), in recognition of the fact that greater fishing pressure was expended in the Southern Zone during the early developmental stages of the fishery, and to allow for further exploratory fishing in the NZ.
!( !(
!( !(
!(
!(
!(!(
!(
!(
!(
!(
!(
!(
!(!( !(
!(
!(
!(
!(
!(
!(
!(
!(
!(
!(
!(
!(
!(!(
754 6 8
49
38
12
37
47
24
52
13
53
2625
14
50
54
48
58
55
2
15
3
51
1
39
40
30
29
45
33
44
28
32
36
23
22
9
21
27
56
43
10
46
42
35
19
34
41
31
18
11
17
20
16
130°0'0"E
130°0'0"E
135°0'0"E
135°0'0"E
140°0'0"E
140°0'0"E
40°0'0"S 40°0'0"S
35°0'0"S 35°0'0"S
0 100 200 30050Km
³
Fishing Effort (pot lifts) 1 - 1,000>1,000 - 10,000>10,000 - 100,000>100000
Giant Crab Catch (kg)!( 1 - 100!( >100 - 1,000!( >1,000 - 10,000
!( >10,000 - 50,000
!( >50,000
South Australia
Figure 4. Distribution of total fishing effort and total giant crab catch for South Australian waters between 1986/87 and 2004/05. Numerals presented in each block denote the identity codes for each MFA. Patterns in catch and effort have resulted in a general increase in the catch rate of giant crabs between 1994/95 and 2004/05 (Figure 3c). Distributional patterns in CPUE for the period 1986 to 2005 indicate that catch rates are generally higher in deeper offshore locations than in shallow nearshore waters (Figure 5). This gradient appears to hold true in both the Northern and Southern Zones, and presumably reflects habitat preferences and associated higher densities (or weights) of giant crabs near the edge of the continental shelf. A regression analysis of CPUE against depth (Figure 6a) confirms the strength of this relationship, and demonstrates that catch rates are higher on average in the deeper MFA’s.
SARDI Aquatic Sciences Page 11

Giant Crab Fishery Assessment
130°0'0"E
130°0'0"E
135°0'0"E
135°0'0"E
140°0'0"E
140°0'0"E
40°0'0"S 40°0'0"S
35°0'0"S 35°0'0"S
0 100 200 30050Km
³South Australia
Catch Per Unit Effort (CPUE) 0 - 0.2>0.2 - 0.5>0.5 - 1.0
>1.0 - 2.0
>2.0 - 3.0
>3.0
42
7 8
12 13 15
27
24 25 26 28
30
37 38 39
40
47 48 49 50 51
53 54 5556
58
44
10
33
Figure 5. Distribution of total giant crab catch per total fishing effort (kg.pot lift-1) for South Australian waters between 1986 and 2005. Distributional maps showing the average crab weight caught in each fishing area did not show any clear geographic pattern (Figure 7). Regression analyses were therefore conducted to determine whether the elevated levels of CPUE in deeper habitats were a function of higher crab densities or higher crab weights (Figure 6b). Because this test failed to demonstrate any association between average crab weight and depth, it appears that higher rates of CPUE in deeper offshore waters reflect greater crab densities in these areas. Of course, several other variables (inc. depth related differences in trapping efficiency) may influence CPUE, but remain unmeasured. Regional development of the fishery and associated exploitation of virgin crab stocks in previously unfished areas, have a capacity to markedly affect measures of CPUE. In 1992/93, at the commencement of a period of expansion, commercial giant crab fishing was concentrated in only 7 MFA’s located principally in inshore waters (Figure 8). By 1994/95, however, areas targeted by commercial fishermen had expanded nearly 4 fold to 26 MFAs (almost half of which were located in offshore waters >100 m deep). Since then, a further 5 MFA’s have been targeted, most recently MFA 7 & 12 in Northern Zone shelf-waters towards the Head of the Bight (Figures 1 & 8). Since the introduction of quotas in 1999, the number of MFA’s fished has remained relatively stable (13 – 19).
SARDI Aquatic Sciences Page 12
Giant Crab Fishery Assessment
(a)
Depth (m)
0 50 100 150 200 250 300
CPU
E (k
g/po
t lift
)
0.0
0.5
1.0
1.5
2.0
2.5
3.0
R Sq Linear = 0.539
(b)
Depth (m)
0 50 100 150 200 250 300
Mea
n C
rab
Wei
ght (
kg)
2.0
2.5
3.0
3.5
4.0
4.5
5.0
R Sq Linear = 0.053
Figure 6. Plots showing the relationship between the average depth at 31 regional marine fishing areas and a) average catch per unit effort (CPUE) and b) mean weight of giant crab between 1984 and 2005.
754 6 8
49
38
12
37
47
24
52
13
53
2625
14
50
54
48
58
55
2
15
3
51
1
39
40
30
29
45
33
44
28
32
36
23
22
9
21
27
56
43
10
46
42
35
19
34
41
31
18
11
17
20
16
130°0'0"E
130°0'0"E
135°0'0"E
135°0'0"E
140°0'0"E
140°0'0"E
40°0'0"S 40°0'0"S
35°0'0"S 35°0'0"S
0 100 200 30050Km
³
Average Crab Weight (kg)>2 - 3>3 - 4>4 - 5>5 - 6
South Australia
100m200m
Figure 7. Map showing the average weight (kg) of giant crab taken in each commercial fishing sector in South Australian waters between 1986 and 2005.
SARDI Aquatic Sciences Page 13

Giant Crab Fishery Assessment
!(
!(
!(!(
!(
!(
!(
11
17
20
16
130°0'0"E
130°0'0"E
135°0'0"E
135°0'0"E
140°0'0"E
140°0'0"E
40°0'0"S 40°0'0"S
35°0'0"S 35°0'0"S
0 100 200 30050Km
³
Fishing Effort (pot lifts)1 - 100100 - 1,0001,000 - 10,00010,000 - 100,000> 100,000
Giant Crab Catch (kg)!( 1 - 100!( 100 - 1,000!( 1,000 - 10,000
South Australia1992 / 93 Season
!( !(
!(!( !(
!(
!(
!(
!(
!(
!(
!(
31
11
17
20
16
130°0'0"E
130°0'0"E
135°0'0"E
135°0'0"E
140°0'0"E
140°0'0"E
40°0'0"S 40°0'0"S
35°0'0"S 35°0'0"S
0 100 200 30050Km
³
Fishing Effort (pot lifts)1 - 100100 - 1,0001,000 - 10,00010,000 - 100,000> 100,000
Giant Crab Catch (kg)!( 1 - 100!( 100 - 1,000!( 1,000 - 10,000
South Australia1993 / 94 Season
!(
!(
!(
!(
!(
!(!(
!(
!(
!( !(
!(!(
!(
!(
!(
!(
!(
!(!(
!(
!(
!(
!(
!(
31
11
17
20
16
130°0'0"E
130°0'0"E
135°0'0"E
135°0'0"E
140°0'0"E
140°0'0"E
40°0'0"S 40°0'0"S
35°0'0"S 35°0'0"S
0 100 200 30050Km
³
Fishing Effort (pot lifts)1 - 100100 - 1,0001,000 - 10,00010,000 - 100,000> 100,000
Giant Crab Catch (kg)!( 1 - 100!( 100 - 1,000!( 1,000 - 10,000
South Australia1994 / 95 Season
49 5048
58
55
51
39
56
130°0'0"E
130°0'0"E
135°0'0"E
135°0'0"E
140°0'0"E
140°0'0"E
40°0'0"S 40°0'0"S
35°0'0"S 35°0'0"S
0 100 200 30050Km
³
Catch Per Unit Effort (CPUE)
0 - 0.2
0.5 - 1.0
1.0 - 2.0
2.0 - 3.0
0.2 - 0.5
South Australia
> 3.0
1992/ 93 Season
49
3837
54
5048
58
55
51
39 44
56
130°0'0"E
130°0'0"E
135°0'0"E
135°0'0"E
140°0'0"E
140°0'0"E
40°0'0"S 40°0'0"S
35°0'0"S 35°0'0"S
0 100 200 30050Km
³
Catch Per Unit Effort (CPUE)
0 - 0.2
0.5 - 1.0
1.0 - 2.0
2.0 - 3.0
0.2 - 0.5
South Australia
> 3.0
1993/ 94 Season
8
49
38
24
13
53
26
37
54
50
25
48
58
55
15
51
39
40
30 33
28
27
56
10
130°0'0"E
130°0'0"E
135°0'0"E
135°0'0"E
140°0'0"E
140°0'0"E
40°0'0"S 40°0'0"S
35°0'0"S 35°0'0"S
0 100 200 30050Km
³
Catch Per Unit Effort (CPUE)
0 - 0.2
0.5 - 1.0
1.0 - 2.0
2.0 - 3.0
0.2 - 0.5
South Australia
> 3.0
1994/ 95 Season
Figure 8. Distributional maps showing inter-annual variation in giant crab catches, fishing effort and catch per unit effort (kg.pot lift-1) in South Australian waters between 1992 and 2005.
SARDI Aquatic Sciences Page 14

Giant Crab Fishery Assessment
!( !(
!( !(
!(
!(
!(
!(
!(
!(!(
!(
!(
!(
!(
31
11
17
20
16
130°0'0"E
130°0'0"E
135°0'0"E
135°0'0"E
140°0'0"E
140°0'0"E
40°0'0"S 40°0'0"S
35°0'0"S 35°0'0"S
0 100 200 30050Km
³
Fishing Effort (pot lifts)1 - 100100 - 1,0001,000 - 10,00010,000 - 100,000> 100,000
Giant Crab Catch (kg)!( 1 - 100!( 100 - 1,000!( 1,000 - 10,000
South Australia1995 / 96 Season
!( !(
!(
!( !(
!(
!(
!(
!(!(
!(
!(
!(
31
11
17
20
16
130°0'0"E
130°0'0"E
135°0'0"E
135°0'0"E
140°0'0"E
140°0'0"E
40°0'0"S 40°0'0"S
35°0'0"S 35°0'0"S
0 100 200 30050Km
³
Fishing Effort (pot lifts)1 - 100100 - 1,0001,000 - 10,00010,000 - 100,000> 100,000
Giant Crab Catch (kg)!( 1 - 100!( 100 - 1,000!( 1,000 - 10,000
South Australia1996 / 97 Season
!(
!(
!(!(
!(
!(!(
!(
!(
!(
!(
!(
!(
!(
!(
!(
!(
!(
!(
!(
!(
31
11
17
20
16
130°0'0"E
130°0'0"E
135°0'0"E
135°0'0"E
140°0'0"E
140°0'0"E
40°0'0"S 40°0'0"S
35°0'0"S 35°0'0"S
0 100 200 30050Km
³
Fishing Effort (pot lifts)1 - 100100 - 1,0001,000 - 10,00010,000 - 100,000> 100,000
Giant Crab Catch (kg)!( 1 - 100!( 100 - 1,000!( 1,000 - 10,000
South Australia1997 / 98 Season
49
38
53
47
54
5048
58
55
51
39
40
44
28
56
130°0'0"E
130°0'0"E
135°0'0"E
135°0'0"E
140°0'0"E
140°0'0"E
40°0'0"S 40°0'0"S
35°0'0"S 35°0'0"S
0 100 200 30050Km
³
Catch Per Unit Effort (CPUE)
0 - 0.2
0.5 - 1.0
1.0 - 2.0
2.0 - 3.0
0.2 - 0.5
South Australia
> 3.0
1995 / 96 Season
49
3837
54
50
25
48
58
55
51
39
56
42
130°0'0"E
130°0'0"E
135°0'0"E
135°0'0"E
140°0'0"E
140°0'0"E
40°0'0"S 40°0'0"S
35°0'0"S 35°0'0"S
0 100 200 30050Km
³
Catch Per Unit Effort (CPUE)
0 - 0.2
0.5 - 1.0
1.0 - 2.0
2.0 - 3.0
0.2 - 0.5
South Australia
> 3.0
1996 / 97 Season
49
38
13
53
47
37
54
50
25
48
58
55
15
51
39
40
28
27
56
130°0'0"E
130°0'0"E
135°0'0"E
135°0'0"E
140°0'0"E
140°0'0"E
40°0'0"S 40°0'0"S
35°0'0"S 35°0'0"S
30°0'0"S 30°0'0"S
0 100 200 30050Km
³
Catch Per Unit Effort (CPUE)
0 - 0.2
0.5 - 1.0
1.0 - 2.0
2.0 - 3.0
0.2 - 0.5
South Australia
> 3.0
1997 / 98 Season
Figure 8 (continued). Distributional maps showing inter-annual variation in giant crab catches, fishing effort and CPUE in South Australian waters between 1992 and 2005.
SARDI Aquatic Sciences Page 15

Giant Crab Fishery Assessment
!(
!(!(!(
!( !(
!(
!(
!(
!(
!(
!(
!(
!(
!(
!(
!(
!(
!(
!(
31
11
17
20
16
130°0'0"E
130°0'0"E
135°0'0"E
135°0'0"E
140°0'0"E
140°0'0"E
40°0'0"S 40°0'0"S
35°0'0"S 35°0'0"S
0 100 200 30050Km
³
Fishing Effort (pot lifts)1 - 100100 - 1,0001,000 - 10,00010,000 - 100,000> 100,000
Giant Crab Catch (kg)!( 1 - 100!( 100 - 1,000!( 1,000 - 10,000
South Australia1998 / 99 Season
!(!(
!(
!(
!(
!(
!(
!(
!(!(
!(
!(
!(
!(!(
!(
!(
31
11
17
20
16
130°0'0"E
130°0'0"E
135°0'0"E
135°0'0"E
140°0'0"E
140°0'0"E
40°0'0"S 40°0'0"S
35°0'0"S 35°0'0"S
0 100 200 30050Km
³
Fishing Effort (pot lifts)1 - 100100 - 1,0001,000 - 10,00010,000 - 100,000> 100,000
Giant Crab Catch (kg)!( 1 - 100!( 100 - 1,000!( 1,000 - 10,000
South Australia1999 / 00 Season
!(
!( !(
!( !(
!( !(
!(
!(
!(
!(
!(!(
!(
!(
!(
!(
!(
!(
31
11
17
20
16
130°0'0"E
130°0'0"E
135°0'0"E
135°0'0"E
140°0'0"E
140°0'0"E
40°0'0"S 40°0'0"S
35°0'0"S 35°0'0"S
0 100 200 30050Km
³
Fishing Effort (pot lifts)1 - 100100 - 1,0001,000 - 10,00010,000 - 100,000> 100,000
Giant Crab Catch (kg)!( 1 - 100!( 100 - 1,000!( 1,000 - 10,000
South Australia2000 / 01 Season
49
38
24
13
53
26
47
37
54
50
25
48
58
55
15
51
39
28
56
42
130°0'0"E
130°0'0"E
135°0'0"E
135°0'0"E
140°0'0"E
140°0'0"E
40°0'0"S 40°0'0"S
35°0'0"S 35°0'0"S
30°0'0"S 30°0'0"S
0 100 200 30050Km
³
Catch Per Unit Effort (CPUE)
0 - 0.2
0.5 - 1.0
1.0 - 2.0
2.0 - 3.0
0.2 - 0.5
South Australia
> 3.0
1998 / 99 Season
49
38
13
53
47
37
12
54
50
25
48
58
55
51
39
28
56
130°0'0"E
130°0'0"E
135°0'0"E
135°0'0"E
140°0'0"E
140°0'0"E
40°0'0"S 40°0'0"S
35°0'0"S 35°0'0"S
0 100 200 30050Km
³
Catch Per Unit Effort (CPUE)
0 - 0.2
0.5 - 1.0
1.0 - 2.0
2.0 - 3.0
0.2 - 0.5
South Australia
> 3.0
1999 / 00 Season
49
38
24
13
53
26
47
37
54
50
25
48
58
55
51
39
40
28
56
130°0'0"E
130°0'0"E
135°0'0"E
135°0'0"E
140°0'0"E
140°0'0"E
40°0'0"S 40°0'0"S
35°0'0"S 35°0'0"S
0 100 200 30050Km
³
Catch Per Unit Effort (CPUE)
0 - 0.2
0.5 - 1.0
1.0 - 2.0
2.0 - 3.0
0.2 - 0.5
South Australia
> 3.0
2000 / 01 Season
Figure 8 (continued). Distributional maps showing inter-annual variation in giant crab catches, fishing effort and CPUE in South Australian waters between 1992 and 2005.
SARDI Aquatic Sciences Page 16

Giant Crab Fishery Assessment
!(
!( !(
!(
!(
!(
!(
!(
!(
!(
!(
!( !(
!(
!(
!(
!(
!(
!(
31
11
17
20
16
130°0'0"E
130°0'0"E
135°0'0"E
135°0'0"E
140°0'0"E
140°0'0"E
40°0'0"S 40°0'0"S
35°0'0"S 35°0'0"S
0 100 200 30050Km
³
Fishing Effort (pot lifts)1 - 100100 - 1,0001,000 - 10,00010,000 - 100,000> 100,000
Giant Crab Catch (kg)!( 1 - 100!( 100 - 1,000!( 1,000 - 10,000
South Australia2001 / 02 Season
!(
!(
!(
!( !(
!(
!(
!(
!(!(
!(
!(
!(
!(!(
!(
!(
31
11
17
20
16
130°0'0"E
130°0'0"E
135°0'0"E
135°0'0"E
140°0'0"E
140°0'0"E
40°0'0"S 40°0'0"S
35°0'0"S 35°0'0"S
0 100 200 30050Km
³
Fishing Effort (pot lifts)1 - 100100 - 1,0001,000 - 10,00010,000 - 100,000> 100,000
Giant Crab Catch (kg)!( 1 - 100!( 100 - 1,000!( 1,000 - 10,000
South Australia2002 / 03 Season
!(
!(!(
!( !(
!(
!(
!(
!(
!(
!(
!(
!(
31
11
17
20
16
130°0'0"E
130°0'0"E
135°0'0"E
135°0'0"E
140°0'0"E
140°0'0"E
40°0'0"S 40°0'0"S
35°0'0"S 35°0'0"S
0 100 200 30050Km
³
Fishing Effort (pot lifts)1 - 100100 - 1,0001,000 - 10,00010,000 - 100,000> 100,000
Giant Crab Catch (kg)!( 1 - 100!( 100 - 1,000!( 1,000 - 10,000
South Australia2003 / 04 Season
7
49
38
13
53
26
47
37
54
50
25
48
58
55
51
39
40
28
56
130°0'0"E
130°0'0"E
135°0'0"E
135°0'0"E
140°0'0"E
140°0'0"E
40°0'0"S 40°0'0"S
35°0'0"S 35°0'0"S
0 100 200 30050Km
³
Catch Per Unit Effort (CPUE)
0 - 0.2
0.5 - 1.0
1.0 - 2.0
2.0 - 3.0
0.2 - 0.5
South Australia
> 3.0
2001 / 02 Season
49
38
24
13
53
47
54
50
25
48
58
55
51
39 44
56
42
130°0'0"E
130°0'0"E
135°0'0"E
135°0'0"E
140°0'0"E
140°0'0"E
40°0'0"S 40°0'0"S
35°0'0"S 35°0'0"S
0 100 200 30050Km
³
Catch Per Unit Effort (CPUE)
0 - 0.2
0.5 - 1.0
1.0 - 2.0
2.0 - 3.0
0.2 - 0.5
South Australia
> 3.0
2002 / 03 Season
49
38
53
47
37
54
5048
58
55
39
28
56
130°0'0"E
130°0'0"E
135°0'0"E
135°0'0"E
140°0'0"E
140°0'0"E
40°0'0"S 40°0'0"S
35°0'0"S 35°0'0"S
0 100 200 30050Km
³
Catch Per Unit Effort (CPUE)
0 - 0.2
0.5 - 1.0
1.0 - 2.0
2.0 - 3.0
0.2 - 0.5
South Australia
> 3.0
2003 / 04 Season
Figure 8 (continued). Distributional maps showing inter-annual variation in giant crab catches, fishing effort and CPUE in South Australian waters between 1992 and 2005.
SARDI Aquatic Sciences Page 17

Giant Crab Fishery Assessment
!(
!(!(
!(
!(
!(
!(
!(
!(
!(
!(
!(
!(
!(
!(
!(
!(
31
11
17
20
16
130°0'0"E
130°0'0"E
135°0'0"E
135°0'0"E
140°0'0"E
140°0'0"E
40°0'0"S 40°0'0"S
35°0'0"S 35°0'0"S
0 100 200 30050Km
³
Fishing Effort (pot lifts)1 - 100100 - 1,0001,000 - 10,00010,000 - 100,000>100,000
Giant Crab Catch (kg)!( 1 - 100!( 100 - 1,000!( 1,000 - 10,000
South Australia2004 / 05 Season
130°0'0"E
130°0'0"E
135°0'0"E
135°0'0"E
140°0'0"E
140°0'0"E
40°0'0"S 40°0'0"S
35°0'0"S 35°0'0"S
0 100 200 30050Km
³South Australia
Catch Per Unit Effort (CPUE) 0 - 0.2>0.2 - 0.5>0.5 - 1.0
>1.0 - 2.0
>2.0 - 3.0
>3.0
7
25 28
37 38 39
40
47 48 49 50 51
53 54 5556
58
2004 / 05 Season
Figure 8 (continued). Distributional maps showing inter-annual variation in giant crab catches, fishing effort and CPUE in South Australian waters between 1992 and 2005. It is of some note that CPUE has increased since the introduction of quotas, but it remains uncertain whether this trend underpins improvements in stocks. One possible explanation for the increase in CPUE may be the harvesting of virgin crab stocks in previously unfished areas of the seafloor. It is also possible that recent increases in CPUE represent increasing knowledge and experience among fishers regarding the locations of high-density giant crab populations. 2.2.2 Seasonal Variation in Combined Catch, Effort & CPUE (1986 – 2005) Fishing during the 1980’s and 1990’s was conducted all year round although the majority of the catch was taken during the summer months. In 2000, seasonal closures were implemented between 1 May and 30 June in the Southern Zone, and 1 June and 31 October in the Northern Zone. These closures were designed to protect crab recruitment, and correspond with periods during which the highest proportion of female giant crabs carry eggs. They are also consistent with the moulting period and low market value. Since 2000, the proportion of catch taken during the summer months (November-January) has gradually declined, and this period no longer represents the principal harvesting time (Figure 9). In the most recent fishing season (2004/05), crab landings varied little among months and the collective catch for summer was similar to that taken throughout autumn (ie. 7.2 tonnes November-January vs. 7.0 tonnes February-April). Seasonal trends in fishing effort have changed markedly between seasons since the start of the fishery, and particularly since the expansion of the industry in 1992 (Figure 9). In 1992/93, for example, most fishing effort occurred during May. By comparison, effort reached a peak in February during 1994/95, and was greatest in December during 2000/01. There are several possible explanations for these inter-annual differences, excluding periods of closure. Such shifts in effort may reflect the vagaries of the weather and number of fishable days in any given month or year. Alternatively, levels of fishing effort may reflect changing market values and demands for the product. There is, however, little evidence to suggest that seasonal and interannual variations in catch are due to differential catch rates. This is evidenced by the fact that catch has broadly parallelled effort between seasons and years since 1992/93 (Figure 9). No consistent seasonal trends in CPUE were evident in the early years of the fishery (1992 to 1999; Figure 10). Over this period, CPUE fluctuated markedly and irregularly, and catch rates attained seasonal highs in excess of ~8 kg.pot lift-1 during several different months (October, May, December) in different years. In contrast, CPUE has remained relatively stable since the
SARDI Aquatic Sciences Page 18

Giant Crab Fishery Assessment
SARDI Aquatic Sciences Page 19
introduction of quotas in 1999 (Figure 10). Indeed, over the period 1999 – 2005, the collective monthly CPUE has consistently ranged between 0.4 and 2.6 kg.pot lift-1 during the fishing season. 2.2.3 Inter-annual Variation in Catch, Effort and CPUE by Fishing Sector Since the introduction of quotas in 1999, the proportion of the total catch landed by each commercial sector has remained relatively stable in the Northern Zone, but has varied considerably in the Southern Zone (Figure 11a). In the Northern Zone, seasonal landings by miscellaneous licence holders have ranged from 55–78% of the total catch, whilst rock lobster quota and rock lobster by-product sectors have taken 12–25% and 6–20% of the catch, respectively. In contrast, the relative catch landed by the miscellaneous sector in the Southern Zone has increased considerably in relation to both the rock lobster quota and rock lobster by-product sectors. During 1999/00, miscellaneous licence holders accounted for less than 40% of the catch, but by 2001/02 landings by this sector had increased to 66%. The proportional catch taken by the miscellaneous sector has subsequently increased in the Southern Zone, and in 2004/05 more than 96% of all giant crab landed were caught by miscellaneous licence holders.

Giant Crab Fishery Assessment
1992 / 93
0
5
10
15
20
Jul Aug Sep Oct Nov Dec Jan Feb Mar Apr May Jun
Cat
ch (t
onne
s)
0
2
4
6
8
Effo
rt (p
ot li
fts *
1000
)
1993 / 94
0
5
10
15
20
Jul Aug Sep Oct Nov Dec Jan Feb Mar Apr May Jun
Cat
ch (t
onne
s)
0
2
4
6
8
Effo
rt (p
ot li
fts *
1000
)
1994 / 95
0
5
10
15
20
Jul Aug Sep Oct Nov Dec Jan Feb Mar Apr May Jun
Cat
ch (t
onne
s)
0
2
4
6
8
Effo
rt (p
ot li
fts *
1000
)
1995 / 96
0
5
10
15
20
Jul Aug Sep Oct Nov Dec Jan Feb Mar Apr May Jun
Cat
ch (t
onne
s)
0
2
4
6
8
Effo
rt (p
ot li
fts *
1000
)
1996 / 97
0
5
10
15
20
Jul Aug Sep Oct Nov Dec Jan Feb Mar Apr May Jun
Cat
ch (t
onne
s)
0
2
4
6
8
Effo
rt (p
ot li
fts *
1000
)
1997 / 98
0
5
10
15
20
Jul Aug Sep Oct Nov Dec Jan Feb Mar Apr May Jun
Cat
ch (t
onne
s)
0
2
4
6
8
Effo
rt (p
ot li
fts *
1000
)
1998 / 99
0
5
10
15
20
Jul Aug Sep Oct Nov Dec Jan Feb Mar Apr May Jun
Cat
ch (t
onne
s)
0
2
4
6
8
Effo
rt (p
ot li
fts *
1000
)
1999 / 00
0
5
10
15
20
Jul Aug Sep Oct Nov Dec Jan Feb Mar Apr May Jun
Cat
ch (t
onne
s)
0
2
4
6
8
Effo
rt (p
ot li
fts *
1000
)
2000 / 01
00
5
10
15
20
Jul Aug Sep Oct Nov Dec Jan Feb Mar Apr May Jun
Cat
ch (t
onne
s)
0
2
4
6
8
Effo
rt (p
ot li
fts *
1000
)
2001 / 02
0
5
10
15
20
Jul Aug Sep Oct Nov Dec Jan Feb Mar Apr May Jun
Cat
ch (t
onne
s)
0
2
4
6
8
Effo
rt (p
ot li
fts *
1000
)
2002 / 03
0
5
10
15
20
Jul Aug Sep Oct Nov Dec Jan Feb Mar Apr May Jun
Cat
ch (t
onne
s)
0
2
4
6
8
Effo
rt (p
ot li
fts *
1000
)
2003 / 04
0
5
10
15
20
Jul Aug Sep Oct Nov Dec Jan Feb Mar Apr May Jun
Cat
ch (t
onne
s)
0
2
4
6
8
Effo
rt (p
ot li
fts *
1000
)
2004 / 05
0
5
10
15
20
Jul Aug Sep Oct Nov Dec Jan Feb Mar Apr May Jun
Cat
ch (t
onne
s)
0
2
4
6
8
Effo
rt (p
ot li
fts *
1000
)
Figure 9. Within season variation in giant crab catches (solid blue bars) and fishing effort (solid red lines) between 1992 and 2005. Summary statistics presented for each month and financial year are statewide totals for the combined commercial catch. Green arrows indicate seasonal closures introduced in June 2000.
SARDI Aquatic Sciences Page 20

Giant Crab Fishery Assessment
1992 / 93
0.0
2.0
4.0
6.0
8.0
10.0
12.0
Jul Aug Sep Oct Nov Dec Jan Feb Mar Apr May Jun
CP
UE
(Kg/
pot l
ift)
1993 / 94
0.0
2.0
4.0
6.0
8.0
10.0
12.0
Jul Aug Sep Oct Nov Dec Jan Feb Mar Apr May Jun
CP
UE
(Kg/
pot l
ift)
1994 / 95
0.0
2.0
4.0
6.0
8.0
10.0
12.0
Jul Aug Sep Oct Nov Dec Jan Feb Mar Apr May Jun
CP
UE
(Kg/
pot l
ift)
1995 / 96
0.0
2.0
4.0
6.0
8.0
10.0
12.0
Jul Aug Sep Oct Nov Dec Jan Feb Mar Apr May Jun
CP
UE
(Kg/
pot l
ift)
1996 / 97
0.0
2.0
4.0
6.0
8.0
10.0
12.0
Jul Aug Sep Oct Nov Dec Jan Feb Mar Apr May Jun
CP
UE
(Kg/
pot l
ift)
1997 / 98
0.0
2.0
4.0
6.0
8.0
10.0
12.0
Jul Aug Sep Oct Nov Dec Jan Feb Mar Apr May Jun
CP
UE
(Kg/
pot l
ift)
1998 / 99
0.0
2.0
4.0
6.0
8.0
10.0
12.0
Jul Aug Sep Oct Nov Dec Jan Feb Mar Apr May Jun
CP
UE
(Kg/
pot l
ift)
1999 / 00
0.0
2.0
4.0
6.0
8.0
10.0
12.0
Jul Aug Sep Oct Nov Dec Jan Feb Mar Apr May Jun
CP
UE
(Kg/
pot l
ift)
2000 / 01
0.0
2.0
4.0
6.0
8.0
10.0
12.0
Jul Aug Sep Oct Nov Dec Jan Feb Mar Apr May Jun
CP
UE
(Kg/
pot l
ift)
2001 / 02
0.0
2.0
4.0
6.0
8.0
10.0
12.0
Jul Aug Sep Oct Nov Dec Jan Feb Mar Apr May Jun
CP
UE
(Kg/
pot l
ift)
2002 / 03
0.0
2.0
4.0
6.0
8.0
10.0
12.0
Jul Aug Sep Oct Nov Dec Jan Feb Mar Apr May Jun
CP
UE
(Kg/
pot l
ift)
2003 / 04
0.0
2.0
4.0
6.0
8.0
10.0
12.0
Jul Aug Sep Oct Nov Dec Jan Feb Mar Apr May Jun
CP
UE
(Kg/
pot l
ift)
2004 / 05
0.0
2.0
4.0
6.0
8.0
10.0
12.0
Jul Aug Sep Oct Nov Dec Jan Feb Mar Apr May Jun
CP
UE
(Kg/
pot l
ift)
Figure 10. Seasonal variations in giant crab catch per unit effort (CPUE) between 1992 and 2005. Summary statistics presented for each month and financial year are derived from statewide totals for the combined commercial catch. Green arrows indicate seasonal closures introduced in June 2000.
SARDI Aquatic Sciences Page 21

Giant Crab Fishery Assessment
NORTHERN ZONE (a)
Fishing Season1999/00 2000/01 2001/02 2002/03 2003/04 2004/05
Cat
ch (k
g)
0
5000
10000
15000
(b)
Fishing Season1999/00 2000/01 2001/02 2002/03 2003/04 2004/05
Effo
rt (p
ot li
fts)
0
5000
10000
15000
(c)
Fishing Season
1999/00 2000/01 2001/02 2002/03 2003/04 2004/05
CPU
E
0
1
2
3
4
SOUTHERN ZONE
Fishing Season1999/00 2000/01 2001/02 2002/03 2003/04 2004/05
Cat
ch (k
g)
0
5000
10000
15000MiscellaneousRL QuotaRL By-Catch
Fishing Season1999/00 2000/01 2001/02 2002/03 2003/04 2004/05
Effo
rt (p
ot li
fts)
0
5000
10000
15000MiscellaneousRL QuotaRL By-Catch
Fishing Season1999/00 2000/01 2001/02 2002/03 2003/04 2004/05
CPU
E
0
1
2
3
4
MiscellaneousRL QuotaRL By-Catch
Figure 11. Plots of inter-annual differences in a) total giant crab catch, b) total fishing effort, and c) catch per unit effort between different fishing sectors (Miscellaneous, Rock Lobster Quota, and Rock Lobster By-product) and fishing zones (Northern and Southern) over the period 1999 to 2005.
SARDI Aquatic Sciences Page 22

Giant Crab Fishery Assessment
SARDI Aquatic Sciences Page 23
Changing levels of catch by each sector in the Southern Zone are consistent with shifts in the level of fishing effort applied by each sector. In 1999/00, the rock lobster by-product fishery accounted for 65% of the total effort in the Southern Zone (Figure 11b). Since then, the number of pots fished each season by this sector has gradually decreased due to increases in lobster biomass and declines in effort required to harvest quota allocations (Ward et al., 2004). Between 1999/00 and 2004/05, the number of pots lifted in the Southern Zone rock lobster by-product fishery fell by more than 81%, and during 2004/05 represented just over 59% of the total fishing effort. Similar declines in effort have also occurred in the southern rock lobster quota fishery over the same period, while actual effort has remained relatively stable in the Southern Zone miscellaneous fishery (Figure 11b). Unlike the Southern Zone, sectoral trends in fishing effort within the Northern Zone do not readily explain the proportion of catch taken by each sector. For example, while the share of catch taken by each fishing sector in the Northern Zone has remained relatively constant since 1999/00, the level of fishing effort applied annually by each sector has varied inconsistently among years (Figure 11b). In 1999/00, a similar number of pots (~5000) were deployed by all commercial sectors but by 2001/02 fishing effort was dominated by the rock lobster by-product sector (58%). In the same season, the rock lobster quota and miscellaneous fisheries comprised 30% and 12% of the total effort respectively, yet the reverse occurred in the subsequent season (2002/03). In the absence of any comprehensive size-frequency data, it is tentatively suggested that stable inter-sectorial catches of giant crab in the Northern Zone represent the cumulative effects of interactions in catch rates between fishing sectors over time (Figure 11c). Over the last six seasons, catch rates in the Northern Zone miscellaneous fishery have been more than 5 times higher than those of the rock lobster quota fishery, and over 10 times higher than those in the rock lobster by-product fishery (Figure 11c; Table 5). Differentially higher levels of effort in the two latter fisheries have not, however, transcribed to proportionally high landings of giant crab. This wide gap in catch rates among sectors presumably reflects inherent approaches to fishing between the ad hoc by-product fishery and the targeted quota and miscellaneous fisheries. As a net result, shifting levels of effort in the miscellaneous fishery have the most profound outcome on catch. Table 5. Average catch rates (kg.potlift-1) of giant crab taken in South Australian waters in each fishing zone and sector since the establishment of TACC’s in 1999.
Commercial Sector
Northern Zone 1999-2005
Southern Zone 1999-2005
Average CPUE
Miscellaneous 2.91 2.44 2.67 Rock Lobster Quota 0.49 0.57 0.53 Rock Lobster By-product 0.21 0.12 0.17

Giant Crab Fishery Assessment
3 LENGTH-STRUCTURED STOCK ASSESSMENT MODEL 3.1 Introduction An integrated, size-structured (length-based) stock assessment and risk analysis model developed in Tasmania (Gardner et al., 2006) was applied to the broad range of data for the South Australian giant crab fishery. Application of this model failed to provide outputs that were biologically meaningful. Here, we briefly describe the 1) model and the modelling process, 2) data used, 3) model outputs, 4) lack of convergence, and 5) reasons why continued use of this model is unlikely to aid assessment of the South Australian fishery. 3.2 Methods The model used is described in detail in Gardner et al. (2006). Briefly, the model considers the population divided into 10 mm length-classes (upwards from 80 mm) with the number of crabs in each length-class followed over time. The numbers of crabs in each length class are estimated by fitting to fishery-dependent data. A description of growth between length classes, a length-weight relationship, and a constant for natural mortality rate are taken as model inputs. Estimates are generated of fishing mortality, yearly recruitment and biomass. Modelling occurs in two stages. Firstly, model parameters are determined using a maximum likelihood estimation. Secondly, Bayesian posteriors for these parameters and other values of interest (e.g. B/B0) are derived using Markov chain - Monte Carlo simulation (McMC). Three data sources were used to run the model. These were total catch (1986/87 – 2004/05), standardised CPUE (1992/93 – 2004/05) and length-frequency data (1993/94 – 1997/98 and 2000/01 – 2004/05). The model was ‘conditioned on catch’ and fitted to the standardised CPUE and length-frequency data. Outputs from the model included 1) fits to each year of commercial catch data and standardised CPUE, and 2) estimates of total and exploitable biomass from 1990/91. 3.3 Model Outputs The model failed to produce close fits to either the standardised CPUE (Figure 12) or length-frequency (Figures 13 and 14) data. This was largely attributable to the substantial increase in CPUE in the final year of the series (2004/05) that is mismatched with the trends in the length-frequency data.
Year
1992 1994 1996 1998 2000 2002 2004
Cat
ch ra
te (
kg/p
ot li
ft)
0.0
0.5
1.0
1.5
2.0
2.5
3.0
Figure 12. Model fit (solid red line) to standardised CPUE (blue dots) in the South Australian giant crab fishery.
SARDI Aquatic Sciences Page 24

Giant Crab Fishery Assessment
160 180 200 220 2400.00
0.05
0.10
0.15
0.20
0.25
0.30
160 180 200 220 2400.00
0.10
0.20
0.30
0.40
160 180 200 220 2400.00
0.10
0.20
0.30
0.40
160 180 200 220 2400.00
0.10
0.20
0.30
0.40
160 180 200 220 2400.00
0.10
0.20
0.30
0.40
160 180 200 220 2400.00
0.10
0.20
0.30
0.40
0.50
160 180 200 220 2400.00
0.10
0.20
0.30
0.40
0.50
160 180 200 220 2400.00
0.10
0.20
0.30
0.40
0.50
160 180 200 220 2400.00
0.05
0.10
0.15
0.20
0.25
0.30
160 180 200 220 2400.00
0.10
0.20
0.30
0.40
0.50
0.60
160 180 200 220 2400.00
0.10
0.20
0.30
0.40
0.50
1992
1993
1994
1995
1996
1997
1998
1999
2000
2001
2002
Freq
uenc
y (%
)
Carapace Width (mm) Figure 13. Fits to length-frequency data for legal-sized female crabs. Note no data were available for 1997 and 1998.
SARDI Aquatic Sciences Page 25

Giant Crab Fishery Assessment
160 180 200 220 2400.00
0.05
0.10
0.15
0.20
0.25
0.30
160 180 200 220 2400.00
0.05
0.10
0.15
0.20
0.25
0.30
160 180 200 220 2400.00
0.05
0.10
0.15
0.20
0.25
0.30
160 180 200 220 2400.00
0.05
0.10
0.15
0.20
0.25
0.30
160 180 200 220 2400.00
0.10
0.20
0.30
0.40
160 180 200 220 2400.00
0.10
0.20
0.30
0.40
160 180 200 220 2400.00
0.10
0.20
0.30
0.40
160 180 200 220 2400.00
0.10
0.20
0.30
0.40
0.50
160 180 200 220 2400.00
0.10
0.20
0.30
0.40
0.50
0.60
160 180 200 220 2400.00
0.10
0.20
0.30
0.40
0.50
160 180 200 220 2400.00
0.20
0.40
0.60
0.80
1992
1993
1994
1995
1996
1997
2002
2001
2000
1999
1998
Freq
uenc
y (%
)
Carapace Width (mm) Figure 14. Fits to length-frequency data for legal-sized male crabs. Note no data were available for 1997 and 1998.
SARDI Aquatic Sciences Page 26

Giant Crab Fishery Assessment
Model-derived estimates of recruitment were low in most years (~50,000 individuals), but substantially larger in 1993 (~18,000 individuals) and 1997 (~360,000 individuals) (Figure 15). Such large, single-year pulses in recruitment to the legal-size stock are unlikely in the giant crab fishery because giant crabs grow slowly near the minimum legal size. Thus, as a consequence of differential growth and inter-moult periods among individuals, a single year class of females would grow above the size limit over an extended time period (4-5 years), obscuring the identification of year classes in the population. Hence, yearly recruitment, which represents yearly variation in survival of eggs to larval stage, is smeared by slow growth. Consequently, the recruitment pulses evident in the model outputs most likely represent unexplained variation in catch over time, rather than ‘real’ recruitment pulses. Thus, application of this model to South Australian data failed to provide biologically meaningful outputs and, hence, failed to achieve a realistic description of the South Australian giant crab population. One probable cause is the mismatch in information provided to the model by the long-term rising trend in catch rate, compared to the expected steady erosion of larger crabs, from the initial largely unexploited population, evident in the length-frequency data. This is likely further confounded by 1) the absence of a direct relationship between catch rate and biomass (an assumption implicit in most fishery models), 2) inter-annual fluctuations in the spatial extent of fishing activities, and 3) large influences on average catch rates affected by changes in fishing behaviour that are independent of changes in stock abundance. Several collaborative attempts between Tasmania and South Australia to overcome this obstacle, met without success. The low GVP and small scale of this fishery suggests that future assessment modelling is not warranted.
(a) (b)
(c) (d)
1988 1990 1992 1994 1996 1998 2000 2002 2004
Expl
oita
bale
bio
mas
s
0.0
0.2
0.4
0.6
0.8
1.0
1.2
1.4
1.6
Year
1988 1990 1992 1994 1996 1998 2000 2002 2004
Tota
l bio
mas
s
0.0
0.5
1.0
1.5
2.0
1988 1990 1992 1994 1996 1998 2000 2002 2004
Egg
pro
duct
ion
0.0
0.5
1.0
1.5
2.0
2.5
Year
1988 1990 1992 1994 1996 1998 2000 2002 2004
Rec
ruits
(n)
0
50000
100000
150000
200000
250000
300000
350000
400000
Figure 15. Estimates of a) relative exploitable biomass, b) relative total biomass c) relative egg production, and d) recruitment in the South Australian Giant Crab Fishery.
SARDI Aquatic Sciences Page 27

Giant Crab Fishery Assessment
4 PERFORMANCE INDICATORS This section provides a report on the performance of the fishery against the interim performance indicators and reference points for the giant crab fishery as defined in Sloan (2003) and documented in Table 2 (Section 1.5). Insufficient data were available to assess the abundance of spawning females. Further, no upper or lower reference points are defined for sex ratio or spawning female abundance. Values of each PI in 2004/05 were derived from data provided by the miscellaneous and rock-lobster quota licence holders only. 4.1 Northern Zone There are seven biological PI specified for giant crabs in the NZ. Data are available to assess fishery performance against six PI: The targeted catch in the NZ in 2004/05 was 10.28 tonnes (Table 6; Figure 16). This represented 76.7% of the TACC (13.4 tonnes). This exceeds the lower reference point (15% of the TACC). Total effort in the NZ was 8,727 potlifts in 2004/05. This value was within the reference range (6,076 – 11,331 potlifts). During 2004/05, the catch rate in the NZ was 1.18 kg.potlift-1. This value was outside the reference range (1.5 – 3 kg.potlift-1), and more than 15% below the lower reference point. The mean weight of crabs harvested in the NZ in 2004/05 was 3.27 kg. This value is within the reference range (2.96 – 3.65 kg). During 2004/05, the pre-recruit abundance in the NZ was 2.21 crabs.potlift-1. This value was outside the reference range (1.6 – 1.7 crabs.potlift-1), and more than 15% greater than the upper reference point. The sex ratio (males:females) in the NZ in 2004/05 was 1:0.80. 4.2 Southern Zone There are seven biological PI specified for giant crabs in the SZ. Data are available to assess fishery performance against six PI: The targeted catch in the SZ in 2004/05 was 6.32 tonnes (Table 6; Figure 16). This represented 72.6% of the TACC (8.70 tonnes). This exceeds the lower reference point (15% of the TACC). Total effort in the SZ was 1,836 potlifts in 2004/05. This value was outside the reference range (3,637 – 7,910 potlifts), and was more than 15% below the lower reference point. During 2004/05, the catch rate in the SZ was 3.44 kg.potlift-1. This value was outside the reference range (1.5 – 3 kg.potlift-1), but did not exceed the upper reference point by more than 15%. The mean weight of crabs harvested in the SZ in 2004/05 was 2.77 kg. This value was outside the reference range (2.96 – 3.65 kg), but did not exceed the lower reference point by >15%. During 2004/05, the pre-recruit abundance in the SZ was 3.51 crabs.potlift-1. This value was outside the reference range (1.6 – 1.7 crabs.potlift-1), and more than 15% greater than the upper reference point. The sex ratio (males:females) in the SZ in 2004/05 was 1:1.1.
SARDI Aquatic Sciences Page 28

Giant Crab Fishery Assessment
SARDI Aquatic Sciences Page 29
Table 6. Key performance indicator estimates for the South Australian giant crab fishery in 2004/05. Note that all estimates presented here are derived from the miscellaneous and rock lobster quota fisheries only, and do not include information obtained from rock lobster by-product sector. Note also that the reference points for fishing effort have been calculated for the period 1999/00 – 2003/04, as they were not defined in the management plan. Values below the lower reference point are highlighted in red, while values exceeding the upper reference point are highlighted in green.
Location Indicator Upper Reference Point Lower reference Point Value in 2004/05
Catch (tonnes) TACC 85% of TACC 76.7% of TACC Effort (pot lifts) 11331 6076 8727 Catch rate (kg.potlift-1) 3 1.5 1.18 Mean weight (kg) 3.65 2.96 3.27 Pre-recruit abundance (no.potlift-1) 1.7 1.6 2.21 Sex ratio (M:F) Not defined Not defined 1:0.8
NZ
Spawning female abundance Not defined Not defined No data
Catch (tonnes) TACC 85% of TACC 72.6% of TACC Effort (pot lifts) 7910 3637 1836 Catch rate (kg.potlift-1) 3 1.5 3.44 Mean weight (kg) 3.65 2.96 2.77 Pre-recruit abundance (no.potlift-1) 1.7 1.6 3.51 Sex ratio (M:F) Not defined Not defined 1:1.1
SZ
Spawning female abundance Not defined Not defined No data

Giant Crab Fishery Assessment
(a)
Fishing Season2000/01 2001/02 2002/03 2003/04 2004/05
Prop
ortio
n of
TA
C c
augh
t (%
)
60
70
80
90
100
110
U
L
(b)
Fishing Season
2000/01 2001/02 2002/03 2003/04 2004/05
Effo
rt (p
ot li
fts*1
000)
0
2
4
6
8
10
12U
L
(c)
Fishing Season2000/01 2001/02 2002/03 2003/04 2004/05
CPU
E
1.0
1.5
2.0
2.5
3.0
3.5
4.0
U
L
(d)
Fishing Season2000/01 2001/02 2002/03 2003/04 2004/05
Ave
rage
wei
ght (
kg)
2.4
2.6
2.8
3.0
3.2
3.4
3.6
3.8
U
L
(e)
Fishing Season2000/01 2001/02 2002/03 2003/04 2004/05
Pre-
recr
uit a
bund
ance
0.5
1.0
1.5
2.0
2.5
3.0
3.5
4.0
UL
(f)
Fishing Season2000/01 2001/02 2002/03 2003/04 2004/05
Sex
Rat
io (F
/M)
0.5
1.0
1.5
2.0
2.5
3.0
3.5
Figure 16. Plots of inter-seasonal differences in key performance indicators for the Northern Zone fishery (solid blue lines) and Southern Zone fishery (solid purple lines). Plots include a) catch as percentage of the TACC, b) fishing effort, c) catch per unit effort (kg.pot lift-1), d) mean crab weight ± s.e., e) abundance of undersized (<150mm) crabs per pot lift, and f) the sex ratio. Horizontal lines in each graph indicate the upper (U) and lower (L) performance reference points. Note that all estimates presented here are derived from combined miscellaneous and rock lobster quota data only (i.e. they do not include information obtained from the rock lobster by-product sector).
SARDI Aquatic Sciences Page 30

Giant Crab Fishery Assessment
5 DISCUSSION 5.1 Status of the Giant Crab Fishery Assessment of the South Australian giant crab fishery is aided by documentation on the history and management of the commercial fishery and catch and effort data from 1986/87. However, the lack of data on catches prior to 1986/87, the absence of spatially explicit data on the size-frequency distribution of the catch, a range of biological performance indicators, the absence of fine scale (i.e. within MFA) catch and effort data and the limited biological data all hamper assessment of this fishery. In particular, the lack of robust or representative commercial size-frequency data to reliably detect and quantify significant temporal changes in the mean size, modal size class and the size-frequency distribution of commercially fished crabs, substantially increases the uncertainty and limits the assessment of stock status. In this assessment, difficulties in interpreting the effort and CPUE data are further complicated by the range and diversity of licencees harvesting giant crabs. For example, there is inconsistent reporting of catch and effort among fishers, the manner in which effort is reported by each of the commercial sectors varies, and, hence, the associated estimates of CPUE differ, and there are unquantified increases in effective fishing effort. Further, the quality of the catch and effort data for this fishery is poorly understood. In addition, there are few data on the magnitude of the illegal catch. This prevents reliable estimation of the total catch and, hence, impedes assessment of the fishery. Thus, assessment of the fishery is almost entirely dependent on the interpretation and analysis of fishery-dependent (catch and effort) information. Further, data are primarily limited to the miscellaneous and rock lobster quota licence holders, that presently harvest ~86% of the total catch. As in all fishery assessment reports, the available data and information are used within the limitations governed by their level of uncertainty. Here, we have also used catch rate (catch-per-unit-effort = CPUE) to assess stock status. The use of CPUE as an index of abundance is reliant on the assumption that changes in CPUE reflect a change in the size of the fishable stock (Tarbath et al., 2002; 2003; 2005). CPUE can also be strongly influenced by numerous other factors, including changes in fisher participation, increases in fishing efficiency brought about by technological advancements (e.g. GPS) or improved fisher knowledge. Further, measures of CPUE integrate spatial variation, and so high CPUE in previously unfished MFAs or unfished areas within MFAs may mask possible declines in CPUE in areas that have been fished more consistently. The poor understanding of the relationships between CPUE and stock abundance in this fishery highlight the need for continued monitoring of a range of appropriate fishery performance indicators. Application of a recently-developed, integrated, length-based stock assessment model to the data for this fishery failed to provide biologically meaningful outputs and, consequently, did not achieve a realistic description of the South Australian giant crab population. Several probable causes were identified, but attempts to overcome these were unsuccessful. It is suggested that future assessment modelling is not warranted for a fishery of this scale and low GVP. There are at least two alternatives to modelling. The first, and simplest, is to enhance the extent of fishery-dependent sampling. For example, measuring and sexing a greater proportion of the catch, including undersize giant crabs, could facilitate enhanced understanding of the status of these stocks and potentially underpin additional biological performance indicators to monitor changes. The second approach is to standardize the catch and effort data, to more accurately reflect the harvest of giant crabs by all fishers in the fishery, to provide a more robust index of giant crab abundance.
SARDI Aquatic Sciences Page 31

Giant Crab Fishery Assessment
Total catch increased substantially from <10 tonnes.yr-1 prior to 1993/94 to ~35 tonnes in 1998/99. Thereafter, catches have declined, reaching ~20 tonnes in 2003/04 and 2004/05. Notably, the TACC has not been harvested since 2001/02; the fraction of the TACC not harvested has exceeded 20% since 2002/03. Patterns in effort are similar to those of catch, and have generally decreased over the last decade. These patterns in catch and effort have resulted in a general increase in the catch rate of giant crabs between 1994/95 and 2004/05. While these patterns are difficult to interpret, given the high total catches of giant crabs, the increase in catch rate is unlikely to reflect substantial increases in the biomass of giant crabs over this period. There were several similarities in the patterns observed in the data for each of the two zones. For example, the mean weight of crabs harvested since 2000/01 has remained relatively unchanged while the fraction of the catch comprising females has declined in both zones over the last five years. Despite these similarities, there were also substantial differences observed between the two zones that further complicate this assessment. Catches in the NZ have gradually declined over the past five years and, with stable levels of effort, have resulted in a declining CPUE. Further, the TACC has not been harvested since 2000/01. In 2004/05, <80% of the TACC was harvested. The reasons why the catch rate has declined and the TACC has not been harvested should be determined and documented because, in combination, these patterns suggest the exploitable biomass of giant crabs in this zone has declined during the last five years. Despite this, it is encouraging that pre-recruit abundance doubled between 2003/04 and 2004/05, suggesting that recruitment levels in the NZ were substantially greater in 2004/05 in comparison with that between 2000/01 and 2004/05. In contrast to the NZ, catches in the SZ have been stable over the last five years. During the same time period effort has decreased. This combination has resulted in substantial increases in catch rate, with that in 2004/05 about twice that observed in 2000/01. These data suggest that 1) the exploitable biomass of giant crabs in the SZ has increased in recent years, 2) that effective effort has increased, or 3) increases in CPUE reflect a combination of these two factors. Given these observations, it is notable that the TACC in the SZ has not been harvested during any of the last four seasons, with that in 2004/05 (27% of TACC not harvested) the highest over the past five-year period. As for the NZ, The reasons why the TACC has not been harvested should be determined and documented. In summary, 1) the paucity of information, 2) lack of basic data available for this fishery and 3) inconsistencies in the inferences that can be drawn from the analyses presented in this report prevent an unambiguous assessment of its current status. The high proportion of the TACC not being harvested in either Zone is concerning. While the remaining data provide limited guidance in regard to stock status, there is evidence of differences in fishery performance between the zones. Overall, these data suggest that stock status in the SZ is probably in a healthier state than that in the NZ. 5.2 Current Performance Indicators The current Performance Indicators for this fishery encompass an appropriately broad range of fishery-dependent data including catch, effort, catch rate, mean weight, pre-recruit abundance, sex ratio and abundance of spawning females; the lack of PI based on fishery-independent data is justified by the small size and low value of the fishery that prohibits typically costly collection of fishery-independent data. However, assessment of fishery performance against the current PI could be enhanced by clearly defining the data and methods that should be used to calculate these indicators, selecting a reference period during which data to determine the upper and lower reference points for each PI are available and incorporating approaches that account for statistical variance in the data.
SARDI Aquatic Sciences Page 32

Giant Crab Fishery Assessment
The lack of clarity regarding the data and the methods to be used to calculate PI could be overcome by defining these explicitly in the Management Plan, while the problems associated with using an arbitrary reference range could be overcome by using a statistical approach. For example, the upper and lower reference points could be statistically significant changes calculated using an agreed statistical method (e.g. t-test, regression, ANOVA) and an agreed probability level (e.g. α = 0.05 or 0.10). 5.3 Future Research Needs Research priorities for this fishery have been reviewed in light of ongoing uncertainties in the assessment process and recommendations to enhance fishery/ecological monitoring and management made by DEH (Appendix I). Several research needs are required to facilitate and augment the current assessment of this fishery. These are 1) determination and documentation of the reasons why the TACC has not been harvested since 2001/02 in either zone, 2) a review of the current Performance Indicators and associated reference period and reference ranges, 3) interrogation of the commercial catch and effort data at finer spatial scales, and 4) collection, collation and analysis of spatially-explicit commercial length-frequency and sex-ratio data to provide representative information on the length-frequency distribution and sex ratio of the catch (after Ward et al., 2004). Other less pressing research requirements include assessment and quantification of changes in fishing efficiency and fleet dynamics, monitoring of mating rates (through the abundance of sperm pouches in females) for evidence of changes in the frequency of mating, especially in large females (after McGarvey et al., 1999), evaluation of suitable pot escape-gap dimensions to ensure the release of pre-recruits, and quantification of by-catch levels to aid future assessment of the fishery against the guidelines for Ecologically Sustainable Development (ESD). Given the relatively small value of the fishery, the cost of such research is likely to be prohibitive.
SARDI Aquatic Sciences Page 33

Giant Crab Fishery Assessment
SARDI Aquatic Sciences Page 34
6 REFERENCES
Brock, D., Hawthorne, P., Ward, T. and Linnane, A. (2004). Species composition and spatio-temporal trends in by-catch from the South Australian rock lobster (Jasus edwardsii) fishery as estimated using two monitoring options. Final report to PIRSA fisheries. 36p.
Currie D.R. and Ward, T.M. (2005). South Australian Giant Crab (Pseudocarcinus gigas) Fishery. Fisheries Assessment Report to the Department of Primary Industries and Resources, South Australia. SARDI Aquatic Sciences, Adelaide. 27p.
DEH (2004). Assessment of the South Australian Giant Crab Fishery. Department of Environment and Heritage, Australian Government, Canberra. 30p.
Gardner, C. (1997). Effect of size and reproductive output on giant crabs Pseudocarcinus gigas (Lamarck): Oziidae. Marine and Freshwater Research. 48: 581-587.
Gardner, C. and Maguire, G.B. (1998). Effect of photoperiod and light intensity on survival, development and cannibalism of larvae of the Australian giant crab, Pseudocarcinus gigas (Lamarck). Aquaculture. 158: 203-214.
Gardner, C. and Northam, M. (1998). Use of prophalactic treatment for larvae rearing of giant crabs, Pseaudocarcinus gigas (Lamarck, 18818) (Decapoda: Oziidae) reared in the laboratory. Journal of Plankton Research. 20 (6): 1169-1188.
Gardner, C., Rush, M. and Bevilacqua, T. (1998). Non-lethal imaging techniques for crab sparmathecae. Journal of Crustacean Biology. 18 (1): 64-69.
Gardner, C., Mackinnon, C., Burch, P. and Bermudes, M. (2004). Tasmanian Giant Crab Fishery 2002/2003. Fisheries Assessment Report. Tasmanian Aquaculture and Fisheries Institute. 36p.
Gardner, C., Haddon, M., Hobday, D. and McGarvey, R. (2006). Development of the tools for long term management of the giant crab resource: data collection methodology, stock assessment and harvest strategy evaluation. Final report to the Fisheries Research and Development Corporation, Australia. Project No. 2001/042. 150p.
Kailola, P.J., Williams, M.J., Stewart, P.C., Reichelt, R.E., McNee, A. and Grieve, C. (1993). Australian Fisheries Resources. Commonwealth of Australia. 422p.
Kennelly, S.J. (2000). A review of research on the giant crab fishery. Final unpublished report to PIRSA Fisheries. 14p.
Levings, A., Mitchell, B.D., Heeren, T. and Austin, C. (1996). Fisheries biology of the giant crab (Pseudocarcinus gigas, Brachyura, Oziidae) in Southern Australia. In: High Latitude Crabs: Biology, Management and Economics. Fairbanks, Alaska, USA. pp 125-151.
Levings, A., Mitchell, B.D., Heeren, T., Austin, C., Matheson, J. (1999). Size Distribution, Reproductive Stage, Movement and Depth: a Preliminary Model of the Fisheries Biology of the Giant Crab. Preliminary report to the Fisheries Research and Development Corporation, Australia.
Levings, A., Mitchell, B.D., McGarvey, R., Mathews, J., Laurenson, L., Austin, C., Heeron, T., Murphy, N., Miller, A., Rowsell, M. and Jones, P. (2001). Fisheries Biology of the Giant Crab Pseudocarcinus gigas. Final report to the Fisheries Research and Development Corporation, Australia, for projects 93/220 & 97/132. Deakin University.
McGarvey, R., Mathews, J.M. and Levings, A. (1999). Yield-, Value- and Egg-Per-Recruit of Giant Crab, Pseudocarcinus gigas. Preliminary report to the Fisheries Research and Development Corporation, Australia. 73p.

Giant Crab Fishery Assessment
Sloan, S. (2002). A report prepared for Environment Australia on the Management of the South Australian Giant Crab (Pseudocarcinus gigas) Fishery. For the purposes of section 303FN (Approved Wildlife Trade Operation) of the Environment Protection and Biodiversity Act 1999. 31p.
Sloan, S. (2003). Ecological Assessment of the South Australian Giant Crab (Pseudocarcinus gigas) Fishery. Assessment report prepared for Commonwealth Department of the Environment and Heritage, against the ‘guidelines for the ecologically sustainable management of fisheries’. For the purposes of part 13 and 13 (A) of the Environment Protection and Biodiversity Conservation Act 1999. 43p.
Tarbath, D., Hodgson, K., Mundy, C. and Haddon, M. (2002). Tasmanian Abalone Fishery 2001. Fishery Assessment Report. TAFI. 136p.
Tarbath, D., Mundy, C. and Haddon, M. (2003). Tasmanian Abalone Fishery 2002. Fishery Assessment Report. TAFI. 144p.
Tarbath, D., Mundy, C. and Haddon, M. (2005). Tasmanian Abalone Fishery 2004. Fishery Assessment Report. TAFI. 131p.
Ward, T. and Loiterton, B. (2000). Management Program for Giant Crab (Pseudocarcinus gigas) in South Australia. Primary Industries and Resources South Australia. 27p.
Ward, T.M., McGarvey, R., Xiao, Y., Ferguson, G., and Linnane, A. (2004). Southern Zone Rock Lobster (Jasus edwardsii) Fishery 2002/03. Final Stock Assessment Report to PIRSA Fisheries. 81p.
SARDI Aquatic Sciences Page 35

Giant Crab Fishery Assessment
7 ACKNOWLEDGEMENTS Research presented in this report was commissioned by PIRSA Fisheries using funds obtained from licence fees paid by participants in the South Australian giant crab fishery. SARDI Aquatic Sciences provided substantial in-kind support. Spatially-explicit data in this report could not have been analysed and presented without the co-operation of Bill Clarke and Kenneth Mathison, and we are most grateful to them for this. We are also very much indebted to Malcolm Haddon and Philippe Ziegler (UTAS) for applying the length-structured stock assessment model, and John Feenstra (SARDI Aquatic Sciences) for undertaking all database queries associated with the project. Finally, we would like to thank Michael Steer, Cameron Dixon (SARDI Aquatic Sciences) and Sean Sloan (PIRSA) for reviewing and editing earlier drafts and substantially improving the quality of the report.
SARDI Aquatic Sciences Page 36
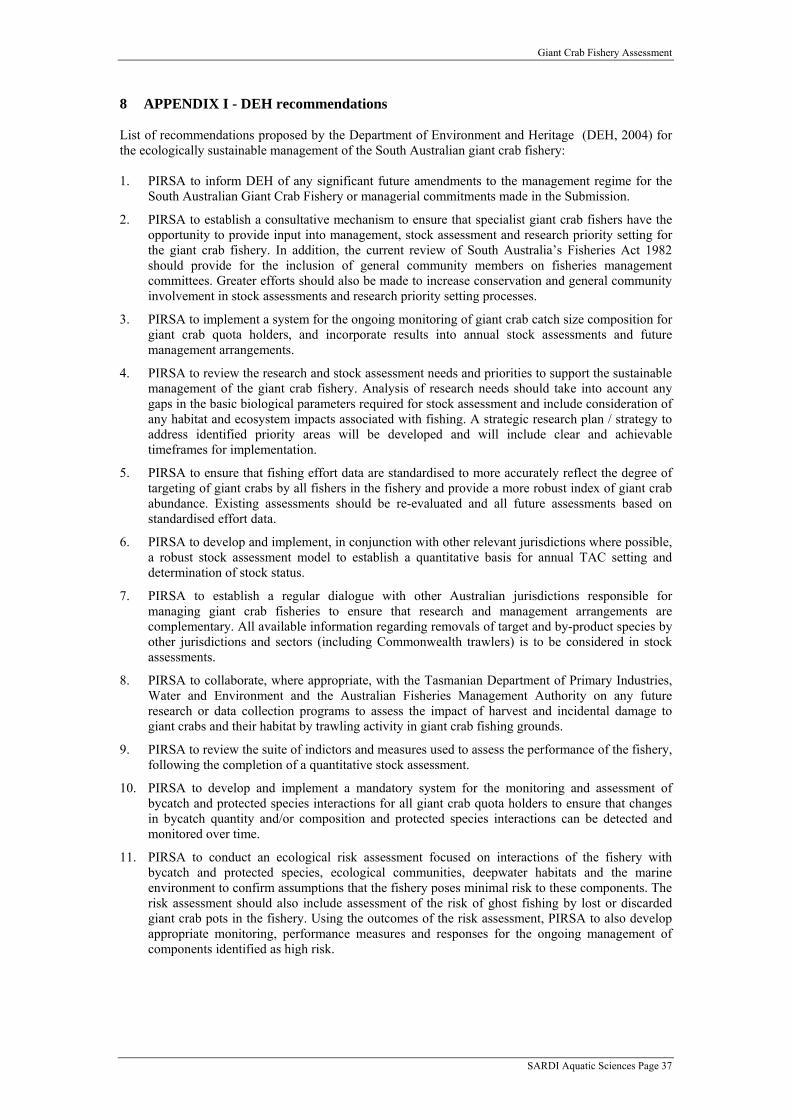
Giant Crab Fishery Assessment
8 APPENDIX I - DEH recommendations List of recommendations proposed by the Department of Environment and Heritage (DEH, 2004) for the ecologically sustainable management of the South Australian giant crab fishery: 1. PIRSA to inform DEH of any significant future amendments to the management regime for the
South Australian Giant Crab Fishery or managerial commitments made in the Submission.
2. PIRSA to establish a consultative mechanism to ensure that specialist giant crab fishers have the opportunity to provide input into management, stock assessment and research priority setting for the giant crab fishery. In addition, the current review of South Australia’s Fisheries Act 1982 should provide for the inclusion of general community members on fisheries management committees. Greater efforts should also be made to increase conservation and general community involvement in stock assessments and research priority setting processes.
3. PIRSA to implement a system for the ongoing monitoring of giant crab catch size composition for giant crab quota holders, and incorporate results into annual stock assessments and future management arrangements.
4. PIRSA to review the research and stock assessment needs and priorities to support the sustainable management of the giant crab fishery. Analysis of research needs should take into account any gaps in the basic biological parameters required for stock assessment and include consideration of any habitat and ecosystem impacts associated with fishing. A strategic research plan / strategy to address identified priority areas will be developed and will include clear and achievable timeframes for implementation.
5. PIRSA to ensure that fishing effort data are standardised to more accurately reflect the degree of targeting of giant crabs by all fishers in the fishery and provide a more robust index of giant crab abundance. Existing assessments should be re-evaluated and all future assessments based on standardised effort data.
6. PIRSA to develop and implement, in conjunction with other relevant jurisdictions where possible, a robust stock assessment model to establish a quantitative basis for annual TAC setting and determination of stock status.
7. PIRSA to establish a regular dialogue with other Australian jurisdictions responsible for managing giant crab fisheries to ensure that research and management arrangements are complementary. All available information regarding removals of target and by-product species by other jurisdictions and sectors (including Commonwealth trawlers) is to be considered in stock assessments.
8. PIRSA to collaborate, where appropriate, with the Tasmanian Department of Primary Industries, Water and Environment and the Australian Fisheries Management Authority on any future research or data collection programs to assess the impact of harvest and incidental damage to giant crabs and their habitat by trawling activity in giant crab fishing grounds.
9. PIRSA to review the suite of indictors and measures used to assess the performance of the fishery, following the completion of a quantitative stock assessment.
10. PIRSA to develop and implement a mandatory system for the monitoring and assessment of bycatch and protected species interactions for all giant crab quota holders to ensure that changes in bycatch quantity and/or composition and protected species interactions can be detected and monitored over time.
11. PIRSA to conduct an ecological risk assessment focused on interactions of the fishery with bycatch and protected species, ecological communities, deepwater habitats and the marine environment to confirm assumptions that the fishery poses minimal risk to these components. The risk assessment should also include assessment of the risk of ghost fishing by lost or discarded giant crab pots in the fishery. Using the outcomes of the risk assessment, PIRSA to also develop appropriate monitoring, performance measures and responses for the ongoing management of components identified as high risk.
SARDI Aquatic Sciences Page 37