south asia region - world banksiteresources.worldbank.org/intprospects/resources/334934... · south...
TRANSCRIPT
GLOBAL ECONOMIC PROSPECTS | June 2013 South Asia Annex
181
SOUTH
ASIA
REGION
GLOBAL
ECONOMIC
PROSPECTS Annex June 2013

GLOBAL ECONOMIC PROSPECTS | June 2013 South Asia Annex
183
Overview South Asia’s regional GDP growth slipped to 4.8 percent in 2012, following a robust recovery in the years after the 2008 global financial crisis. A weakening global economy, coupled with domestic difficulties (including policy uncertainties, structural capacity constraints, and a poor harvest) contributed to weaker regional growth in 2012. The bulk of this regional slowdown reflects a continued deceleration in India (to 5 percent in the 2012 fiscal year ending in March 2013), but growth also slowed in other regional economies. Sri Lanka’s growth slowed sharply, by nearly 2 percentage points in 2012. Bangladesh, Pakistan, and Nepal are expected to experience less marked slowdowns in their respective 2012-13 fiscal years, although actual growth rates in Pakistan and Nepal are much lower than in other countries in the region. In contrast, Afghanistan experienced double digit growth in 2012. The regional trade balance deteriorated in 2012 due to weakening exports and rising demand for crude oil and other imports. India’s current account deficit widened sharply, but robust remittance inflows bolstered current account positions in Nepal, Bangladesh, and Pakistan. More recently, activity in South Asia has picked up from its mid-2012 slump, with industrial output rising at different paces in India, Pakistan and Bangladesh in the second half of 2012 and in the first quarter of 2013 - while in Sri Lanka industrial production stabilized in the fourth quarter of 2012. South Asia’s exports (and imports) are also increasing, in line with strengthening global trade and output. Inflation has moderated in several countries, helped in part by the easing of international commodity prices. But in general, consumer price inflation in the region remains higher than the average for the group of middle-income developing countries, and inflation expectations are still very high in India. In addition, some countries have stepped up the reform agenda, seeking to contain fiscal deficits (including reduction of subsidies, by raising end-user fuel and electricity prices), and in the case of India, opening the economy further to international investment.
Outlook for 2013-15
Economic activity in South Asia is projected to strengthen during the course of 2013, buoyed by a gradual strengthening of external demand; a less volatile external environment; lower crude oil prices; reduced fiscal pressures due to lower fuel prices and lower subsidies; an improved crop (following last year’s weak monsoons); and continued remittance inflows. However, even as quarterly GDP accelerates, the sharp deceleration of growth in 2012 implies that whole year growth in 2013 will be a relatively weak 5.2 percent. Looking further ahead, the stronger underlying momentum in 2013, coupled with firming external demand and improvement in investment spending (assuming policy and fiscal reforms are sustained), should help to accelerate the region’s growth to 6.0 percent in 2014 and then 6.4 percent in 2015. Growth in India is projected to rise to 5.7 percent in the 2013 fiscal year, and accelerate to 6.5 percent and 6.7 percent in FY2014 and FY2015.
Risks and vulnerabilities
Risks to the outlook for the region are broadly balanced. External risks are diminishing but remain External risks from the Euro Area and of fiscal sustainability in the United States have diminished. But the region’s vulnerability to a deterioration in financial flows has picked up due to rising current account deficits, notably in India. A more rapid than expected decline in commodity prices would help outturns by reducing current account and fiscal deficits, and by easing inflationary pressures and boosting domestic incomes. Domestic challenges are gaining prominence Domestic issues, including continued progress in fiscal consolidation; the quality of this year’s rice crop; and success in reversing the earlier increase in inflationary expectations will contribute to determining the pace of recovery going forward. Perhaps most importantly, will be continued progress in implementing reforms that relieve supply-side constraints, such as reducing energy supply bottlenecks, labor market reforms, improving the business climate, and investing in education, health and infrastructure.
GLOBAL ECONOMIC PROSPECTS | June 2013 South Asia Annex
184
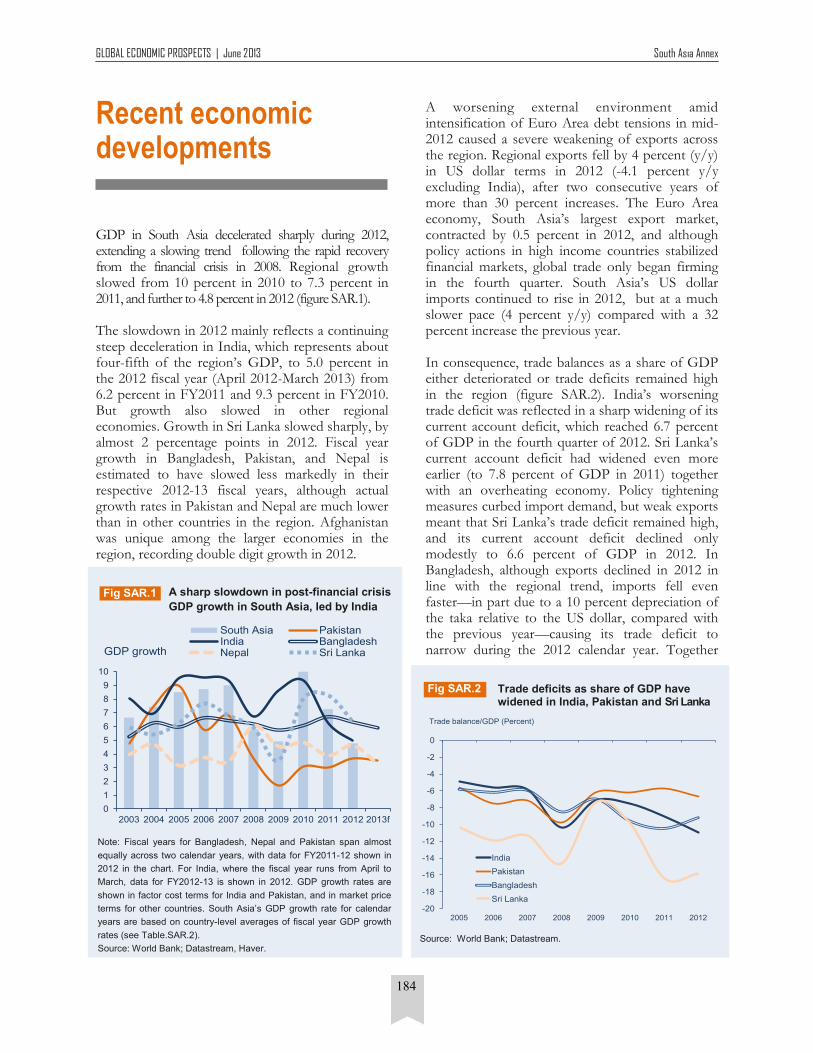
Recent economic developments GDP in South Asia decelerated sharply during 2012, extending a slowing trend following the rapid recovery from the financial crisis in 2008. Regional growth slowed from 10 percent in 2010 to 7.3 percent in 2011, and further to 4.8 percent in 2012 (figure SAR.1). The slowdown in 2012 mainly reflects a continuing steep deceleration in India, which represents about four-fifth of the region’s GDP, to 5.0 percent in the 2012 fiscal year (April 2012-March 2013) from 6.2 percent in FY2011 and 9.3 percent in FY2010. But growth also slowed in other regional economies. Growth in Sri Lanka slowed sharply, by almost 2 percentage points in 2012. Fiscal year growth in Bangladesh, Pakistan, and Nepal is estimated to have slowed less markedly in their respective 2012-13 fiscal years, although actual growth rates in Pakistan and Nepal are much lower than in other countries in the region. Afghanistan was unique among the larger economies in the region, recording double digit growth in 2012.
A worsening external environment amid intensification of Euro Area debt tensions in mid-2012 caused a severe weakening of exports across the region. Regional exports fell by 4 percent (y/y) in US dollar terms in 2012 (-4.1 percent y/y excluding India), after two consecutive years of more than 30 percent increases. The Euro Area economy, South Asia’s largest export market, contracted by 0.5 percent in 2012, and although policy actions in high income countries stabilized financial markets, global trade only began firming in the fourth quarter. South Asia’s US dollar imports continued to rise in 2012, but at a much slower pace (4 percent y/y) compared with a 32 percent increase the previous year. In consequence, trade balances as a share of GDP either deteriorated or trade deficits remained high in the region (figure SAR.2). India’s worsening trade deficit was reflected in a sharp widening of its current account deficit, which reached 6.7 percent of GDP in the fourth quarter of 2012. Sri Lanka’s current account deficit had widened even more earlier (to 7.8 percent of GDP in 2011) together with an overheating economy. Policy tightening measures curbed import demand, but weak exports meant that Sri Lanka’s trade deficit remained high, and its current account deficit declined only modestly to 6.6 percent of GDP in 2012. In Bangladesh, although exports declined in 2012 in line with the regional trend, imports fell even faster—in part due to a 10 percent depreciation of the taka relative to the US dollar, compared with the previous year—causing its trade deficit to narrow during the 2012 calendar year. Together
A sharp slowdown in post-financial crisis
GDP growth in South Asia, led by India
Note: Fiscal years for Bangladesh, Nepal and Pakistan span almost
equally across two calendar years, with data for FY2011-12 shown in
2012 in the chart. For India, where the fiscal year runs from April to
March, data for FY2012-13 is shown in 2012. GDP growth rates are
shown in factor cost terms for India and Pakistan, and in market price
terms for other countries. South Asia’s GDP growth rate for calendar
years are based on country-level averages of fiscal year GDP growth
rates (see Table.SAR.2).
Source: World Bank; Datastream, Haver.
Fig SAR.1
0
1
2
3
4
5
6
7
8
9
10
2003 2004 2005 2006 2007 2008 2009 2010 2011 2012 2013f
South Asia PakistanIndia BangladeshNepal Sri LankaGDP growth
Trade deficits as share of GDP have widened in India, Pakistan and Sri Lanka
Source: World Bank; Datastream.
Fig SAR.2
-20
-18
-16
-14
-12
-10
-8
-6
-4
-2
0
2005 2006 2007 2008 2009 2010 2011 2012
India
Pakistan
Bangladesh
Sri Lanka
Trade balance/GDP (Percent)

GLOBAL ECONOMIC PROSPECTS | June 2013 South Asia Annex
185
Figure SAR.3 Industrial production is picking up, al-beit at different paces in South Asian countries Source: World Bank.
-30
-20
-10
0
10
20
30
40
50
Feb-11 Jun-11 Oct-11 Feb-12 Jun-12 Oct-12 Feb-13
India
Pakistan
Bangladesh
Sri Lanka
Developing excl. South Asia
Industrial production, 3m/3m seasonally-adjusted annualized rate (Percent)
Figure SAR.2 Trade balances in India, Bangladesh and Sri Lanka deteriorated sharply in 2012 as exports slowed Source: World Bank.
-20
-18
-16
-14
-12
-10
-8
-6
-4
-2
0
2005 2006 2007 2008 2009 2010 2011 2012
India
Pakistan
Bangladesh
Sri Lanka
Trade balance/GDP (%)
with increased remittances, this resulted in an improved current account position. Despite growing trade deficits in Pakistan and Nepal in the 2012 calendar year, their current account positions were bolstered by robust migrant remittances inflows (see box SAR.1), and also by official transfers in the case of Pakistan. Below-average monsoon rains and a poor regional harvest in 2012 (agriculture constitutes about a fifth of South Asia’s GDP and over half of employment) also contributed to weaker growth across the region. In addition, structural capacity constraints and domestic policy uncertainties, as well as security concerns and social unrest in some countries, played a significant role in the slowing of regional GDP growth. India’s GDP measured in factor-cost terms grew at a decade-low 5.0 percent in FY2012 (figure SAR.1). The aforementioned weakening of external demand and below-average monsoons exacerbated a domestic slowdown that was already underway, as building capacity constraints and bottlenecks kept growth in check despite sustained fiscal stimulus. This stimulus had helped the economy recover quickly after the financial crisis in 2008, and was gradually withdrawn in subsequent years. Uncertainty about the reform agenda, along with monetary policy tightening in 2010 and 2011 in response to rising inflationary pressures, led to a sharp slowing of investment growth and an increase in stalled projects (figure SAR.3). Weaker investment activity added to existing supply-side constraints and negatively impacted overall growth.FN1 GDP growth in Pakistan and Nepal has remained well below the regional average in recent years. Pakistan, South Asia’s second-largest economy, appears to have settled into a relatively low-growth path of about 3-4 percent in recent years mainly due to unfavorable domestic factors, including security uncertainties, unreliable delivery of natural gas and electricity to firms, and weak investment rates. In Nepal, political uncertainties in recent years, and an adverse investment climate, played a role in its relatively poor economic performance. Nepal’s GDP growth had risen to 4.9 percent in the 2011-12 fiscal year (ending in mid-July 2012) on the back of a good harvest. However, a poor harvest in 2012, high inflation, weakening external demand, and slowing growth in India (its largest trade partner) weighed negatively on economic activity in Nepal during the 2012-13 fiscal year.
GDP growth in Bangladesh and Sri Lanka has been around 6 percent or higher in recent years (figure SAR.1). Bangladesh’s exports have benefited in part from preferential access to European Union and US markets, while domestic demand and its current account position were partly cushioned by remittances (see Box SAR.1). However, weakening external demand, domestic supply constraints (including unreliable electricity provision), and social unrest resulted in growth slowing to 6.2 percent in FY2011-12 from 6.7 percent the previous fiscal year, with a further slowdown expected for FY2012-13. Bangladesh’s relatively fast growth during 2010-12, together with international commodity price increases and expansionary macroeconomic policies, resulted in inflationary pressures. Subsequent macroeconomic tightening and intensified domestic constraints, combined with disruptions caused by political unrest, contributed to the projected slowdown in FY2012-13. Sri Lanka’s economy enjoyed a post-conflict rebound, growing at 8 or more percent in both 2010 and 2011. Growth has since slowed to a more sustainable 6.4 percent in 2012, in response to policy efforts to reduce overheating (amid rising domestic supply constraints), a drought, and weaker global demand for Sri Lanka’s exports. Afghanistan’s robust 11.8 percent GDP growth in 2012, the highest in the region, was mainly due to an exceptionally good harvest and continued strong foreign aid inflows. In addition, mining activity also picked up. However, governance issues and an uncertain security situation present persistent challenges
New investment project announcements in India declined and resources tied up in stalled projects rose sharply since 2011
Source: Center for Monitoring Indian Economy.
Fig SAR.3
0
200
400
600
800
1000
1200
0
1,000
2,000
3,000
4,000
5,000
6,000
Q1 2006 Q1 2007 Q1 2008 Q1 2009 Q1 2010 Q1 2011 Q1 2012 Q1 2013
New investment projects announced
Stalled projects [Right]
Investment projects in India(2-quarter moving average, billions of constant 2006 rupees)

GLOBAL ECONOMIC PROSPECTS | June 2013 South Asia Annex
186
for the economy. Bhutan’s economy grew strongly in recent years mainly due to hydropower generation and electricity sales to India—these revenues together with budgetary grants allowed it to finance a current account deficit exceeding a fifth of GDP. High credit growth and supply constraints resulted in an overheated economy and inflation rates rising to over 10 percent (in line with cost of imports from India). But policy tightening in 2012 moderated credit growth, while delays in new projects coming on-stream caused GDP growth to slow to an estimated 7.6 percent in the 2012-13 fiscal year from 9 percent in FY2011-12. The Maldives, however, experienced political uncertainty, double-digit fiscal deficits (the highest in the region - see below), current account deficit of over a quarter of GDP, falling reserves (well below the critical 3 months of imports), and a halving of GDP growth to 3.4 percent in 2012. Tourism, a mainstay of the economy, was also adversely affected by slower growth in high income countries, and was only partly compensated for by an increase in Asian tourist arrivals.
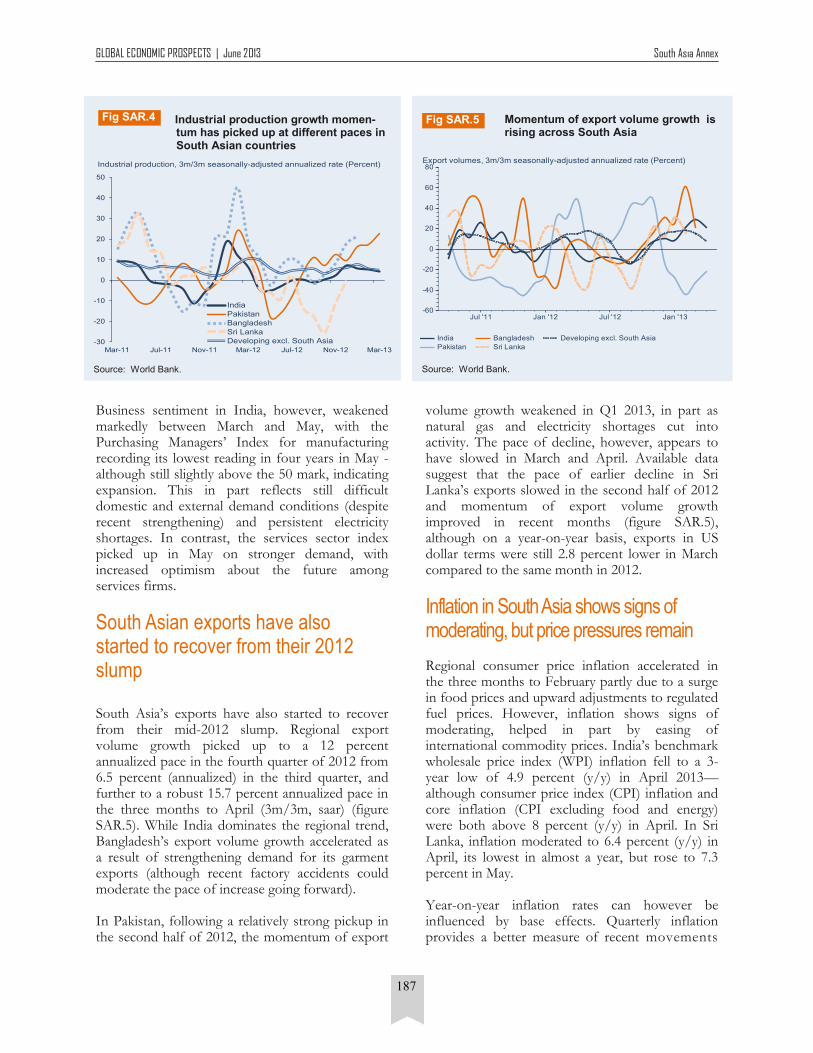
Regional industrial production growth picked up in late 2012 and early 2013, but business sentiment weakened in India Industrial activity has begun picking up from a mid-2012 slump at different paces across South Asian countries. India dominates the regional trend, with industrial production expanding at a 4.1 percent annualized pace during the three months ending in March (3m/3m, saar) (figure SAR.4). Available data show industrial production rose even more decidedly in Pakistan and Bangladesh—at a 22.6 percent annualized pace during the three months ending in March 2013 (3m/3m, saar) in Pakistan and at a 21.3 percent annualized pace in the three months ending in January in Bangladesh. Industrial production momentum in Sri Lanka stabilized by the end of 2012 after registering steep declines during the second half of the year (figure SAR.4).
Box SAR.1
Box figure SAR.1a Remittances have risen as a share of GDP in South Asian countries
0
0.05
0.1
0.15
0.2
0.25
2000 2002 2004 2006 2008 2010 2012
Remittances as a share of GDP
Bangladesh
India
Nepal
Pakistan
Sri Lanka
Box figure SAR.1b Remittances inflows mostly offset trade deficits in Nepal, Bangladesh and Pakistan
-30
-20
-10
0
10
20
30
India Pakistan Bangladesh Sri Lanka Nepal
Trade balance
Remittances
Current account balance/GDP
Percent of GDP
Migrant remittances shielded current account positions in several South Asian countries
Remittances to the South Asia region are estimated to have increased by 12.3 percent in 2012 (the second-highest growth
among developing regions) to reach $109 billion. This follows growth averaging 14 percent in the previous two years. India is
the largest recipient among developing countries ($69 billion), while Bangladesh, and Pakistan ($14 billion each) are among
the top ten developing-country recipients of remittances. Remittance flows to Bangladesh and Pakistan have been particularly
robust in US dollar terms, although Nepal and Sri Lanka recorded the largest increases as a share of GDP in 2012 (Box figure
SAR.1a), helped in part by strong income growth in the Gulf Cooperation Council (GCC) countries. A steady increase in US
dollar remittance inflows in recent years has helped to offset trade deficits in Nepal, Bangladesh and Pakistan, and to a small-
er extent in Sri Lanka and India (Box figure SAR.1b).
Source: World Bank, Migration and Development Brief 20.
Box figure SAR.1a Remittances have risen as a share of GDP in South Asian countries
0
0.05
0.1
0.15
0.2
0.25
2000 2002 2004 2006 2008 2010 2012
Remittances as a share of GDP
Bangladesh
India
Nepal
Pakistan
Sri Lanka
Box SAR.1
Box figure SAR.1b Remittance inflows mostly offset trade deficits in Nepal, Bangla-desh and Pakistan
-30
-20
-10
0
10
20
30
India Pakistan Bangladesh Sri Lanka Nepal
Trade balance
Remittances
Current account balance
Percent of GDP
GLOBAL ECONOMIC PROSPECTS | June 2013 South Asia Annex
187
Business sentiment in India, however, weakened markedly between March and May, with the Purchasing Managers’ Index for manufacturing recording its lowest reading in four years in May - although still slightly above the 50 mark, indicating expansion. This in part reflects still difficult domestic and external demand conditions (despite recent strengthening) and persistent electricity shortages. In contrast, the services sector index picked up in May on stronger demand, with increased optimism about the future among services firms.
South Asian exports have also started to recover from their 2012 slump South Asia’s exports have also started to recover from their mid-2012 slump. Regional export volume growth picked up to a 12 percent annualized pace in the fourth quarter of 2012 from 6.5 percent (annualized) in the third quarter, and further to a robust 15.7 percent annualized pace in the three months to April (3m/3m, saar) (figure SAR.5). While India dominates the regional trend, Bangladesh’s export volume growth accelerated as a result of strengthening demand for its garment exports (although recent factory accidents could moderate the pace of increase going forward). In Pakistan, following a relatively strong pickup in the second half of 2012, the momentum of export
volume growth weakened in Q1 2013, in part as natural gas and electricity shortages cut into activity. The pace of decline, however, appears to have slowed in March and April. Available data suggest that the pace of earlier decline in Sri Lanka’s exports slowed in the second half of 2012 and momentum of export volume growth improved in recent months (figure SAR.5), although on a year-on-year basis, exports in US dollar terms were still 2.8 percent lower in March compared to the same month in 2012.
Inflation in South Asia shows signs of moderating, but price pressures remain Regional consumer price inflation accelerated in the three months to February partly due to a surge in food prices and upward adjustments to regulated fuel prices. However, inflation shows signs of moderating, helped in part by easing of international commodity prices. India’s benchmark wholesale price index (WPI) inflation fell to a 3-year low of 4.9 percent (y/y) in April 2013—although consumer price index (CPI) inflation and core inflation (CPI excluding food and energy) were both above 8 percent (y/y) in April. In Sri Lanka, inflation moderated to 6.4 percent (y/y) in April, its lowest in almost a year, but rose to 7.3 percent in May. Year-on-year inflation rates can however be influenced by base effects. Quarterly inflation provides a better measure of recent movements
Momentum of export volume growth is rising across South Asia
Source: World Bank.
Fig SAR.5
-60
-40
-20
0
20
40
60
80
Jul '11 Jan '12 Jul '12 Jan '13
India
Pakistan
Bangladesh
Sri Lanka
Developing excl. South Asia
Export volumes, 3m/3m seasonally-adjusted annualized rate (Percent)
Industrial production growth momen-
tum has picked up at different paces in South Asian countries
Source: World Bank.
Fig SAR.4
-30
-20
-10
0
10
20
30
40
50
Mar-11 Jul-11 Nov-11 Mar-12 Jul-12 Nov-12 Mar-13
India
Pakistan
Bangladesh
Sri Lanka
Developing excl. South Asia
Industrial production, 3m/3m seasonally-adjusted annualized rate (Percent)

GLOBAL ECONOMIC PROSPECTS | June 2013 South Asia Annex
188
(figure SAR.6). According to this measure, the momentum of CPI inflation remains strong in Bangladesh and India—although moderating slightly in Bangladesh—suggesting that price pressures continue to remain high in these countries. However, inflation has moderated markedly in Pakistan. Inflation momentum had been weakening earlier in Sri Lanka, but increase in regulated electricity prices caused inflation to rise in May. The generally high CPI inflation rates in South Asian countries compared with the average for middle-income developing countries reflect supply-side production constraints, entrenched inflationary expectations, and the persistence of food inflation. Households’ inflation expectations in India remain stubbornly high, partly because of a steady upward trend in inflation over the past 7 years (figure SAR.7). Food inflation has remained persistently high in the region, partly reflecting agricultural production constraints and logistics bottlenecks. Despite the moderation in overall consumer price inflation, food inflation in India was over 10 percent (y/y) in April, and in Bangladesh and Sri Lanka was 8.4 percent and 7.9 percent, respectively, in May. In Pakistan, despite a moderation in headline inflation to 5.1 percent (y/y) in May, food inflation was a higher 6.5 percent. Moreover, core inflation (CPI excluding food and energy) in Pakistan remains above 8 percent, in part because of escalating costs due to energy bottlenecks and security concerns.
Private capital flows to South Asia have picked up since mid-2012 Private capital flows to South Asia have increased robustly since mid-2012 (figure SAR.8). Overall, net private capital inflows to the South Asia region rose from $73 billion in 2011 to $87 billion in 2012 (table SAR.1). Following reform efforts in India since September 2012, private capital flows to India grew robustly led by portfolio equity inflows and bank lending. The increase in private inflows since mid-2012 was also a consequence of abundant global liquidity that resulted from financial market stabilization and accommodative monetary policies in high income
Gross capital flows to South Asia re-bounded in the second half of 2012
Source: World Bank; Datastream.
Fig SAR.8
0
1000
2000
3000
4000
5000
Jan '12 Apr '12 Jul '12 Oct '12 Jan '13 Apr '13
US$ millions
Equity issuance
Bond issuanceBank lending
Inflation momentum is moderating across South Asia, but still strong in India and Bangladesh
Source: World Bank.
Fig SAR.6
-5
0
5
10
15
20
Jul '11 Jan '12 Jul '12 Jan '13
India Pakistan Bangladesh Sri Lanka Nepal
Inflation, 3m/3m seasonally adjusted annualized rate (Percent)
Inflation expectations in India are still very high
Source: World Bank; RBI.
Fig SAR.7
0
2
4
6
8
10
12
14
16
Q4-2006 Q1-2008 Q2-2009 Q3-2010 Q4-2011 Q1-2013
Current perceived
1-year Ahead
Actual
Linear (Current perceived)
Linear (1-year Ahead)
Linear (Actual)
Mean inflation rates in India for given survey quarter (Percent)

GLOBAL ECONOMIC PROSPECTS | June 2013 South Asia Annex
189
countries. Foreign direct investment (FDI) received by India, however, declined by 22 percent (y/y) during the 2012 calendar year. As part of reform efforts (and given the need to finance a larger current account deficit), India undertook several measures to boost private capital inflows. These included raising limits on FDI in retail, broadcasting and aviation sectors; reducing withholding taxes on interest earnings on foreign investment in domestic bonds; faster clearances for large investment projects (including those with foreign participation); and in general, efforts to clarify tax and other regulations relevant for foreign investors. Gross capital inflows, however, moderated in recent months, in part due to growth concerns and further deterioration of India’s current account position in the fourth quarter of 2012. In Sri Lanka, private debt inflows have risen as the government successfully issued several sovereign bonds in international markets. By contrast, in Pakistan, foreign investment inflows have been on a declining trend in recent years due to domestic uncertainties, an adverse investment climate, and energy shortages. This decline, together with repayment of official debt to the IMF, have added to pressures on Pakistan’s balance of payments position, with international reserves falling below 2 months of imports.
Medium-Term Outlook Following a steep deceleration in South Asia’s GDP growth to 4.8 percent in 2012, regional growth is projected to improve during 2013-15 (Table SAR.2). This recovery in regional growth will be helped by gradual improvements in both external and domestic conditions. A stabilization of the global economic environment and a gradual recovery in global demand will provide something of a tailwind for South Asia’s GDP growth. However, output in the Euro Area economy, South Asia’s largest export market, is forecast to contract for the second year in a row in 2013, and growth will remain subdued in 2014 and 2015 (see GEP June 2013 main text). Economic activity in the United States, however, is more robust and projected to strengthen further. Much of the additional external demand for South Asia is projected to come from other developing countries, which have become increasingly important destinations of South Asian exports. South Asia’s exports to developing countries, including within the region, have risen from 19 percent of overall exports in 2000 to 35 percent in 2011 (14 percent and 26 percent for South Asia excluding India—see figure SAR.9).
Table SAR.1
Net capital flows to South Asia
Source: World Bank.
2008 2009 2010 2011 2012e 2013f 2014f 2015f
Capital Inflows 64.7 89.8 100.4 78.3 89.5 92.4 100.5 110.1
Private inflows, net 55.9 78.9 90.7 72.5 86.9 90.6 99.3 109.5
Equity Inflows, net 35.0 63.4 60.3 30.9 47.8 52.8 57.2 67.5
Net FDI inflows 50.8 39.3 30.4 35.7 27.7 36.7 40.0 48.2
Net portfolio equity inflows -15.8 24.1 29.9 -4.8 20.1 16.1 17.2 19.3
Private creditors. Net 20.8 15.5 30.4 41.6 39.1 37.8 42.1 42.0
Bonds 1.7 1.9 10.1 0.7 2.8 4.3 2.5 3.4
Banks 11.2 10.9 8.6 18.4 17.4 15.4 17.8 19.2
Short-term debt flows 8.0 2.7 11.8 22.5 19.1 18.2 21.7 19.3
Other private 0.0 -0.1 0.0 0.0 -0.2 -0.1 0.1 0.1
Official inflows, net 8.8 11.0 9.6 5.8 2.6 1.8 1.2 0.6
World Bank 1.4 2.4 3.3 2.0 0.9 .. .. ..
IMF 3.2 3.6 2.0 0.0 -0.2 .. .. ..
Other official 4.2 4.9 4.4 3.7 1.9 .. .. ..
Table SAR.1
GLOBAL ECONOMIC PROSPECTS | June 2013 South Asia Annex
190
An expected normal agricultural season and increase in rural disposable incomes, together with lower crude oil prices and moderation in inflation, and continued remittance inflows (in countries where they are important relative to GDP), will support an improvement in activity in the South Asia region from mid-2013 onwards. Although quarterly GDP is expected to pick up over the course of 2013, the sharp deceleration of growth in the previous year implies that whole year growth for the South Asia region in 2013 will be a relatively weak 5.2 percent. In the subsequent two years, South Asia’s regional GDP growth is
projected to accelerate to 6.0 percent in 2014 and 6.4 in 2015, as a result of strengthening external demand and with gradual success in alleviating some of the domestic structural constraints that have held back growth. Regional growth will be driven mainly by a projected pickup in India, whose GDP in factor cost terms is projected to grow 5.7 percent in the 2013 fiscal year (ending in March 2014), and then accelerate to 6.5 percent and 6.7 percent in FY2014 and FY2015, respectively. Exports and private investment, which slowed sharply in 2012, are projected to strengthen during 2013-15 and provide a boost to growth. However, how robust
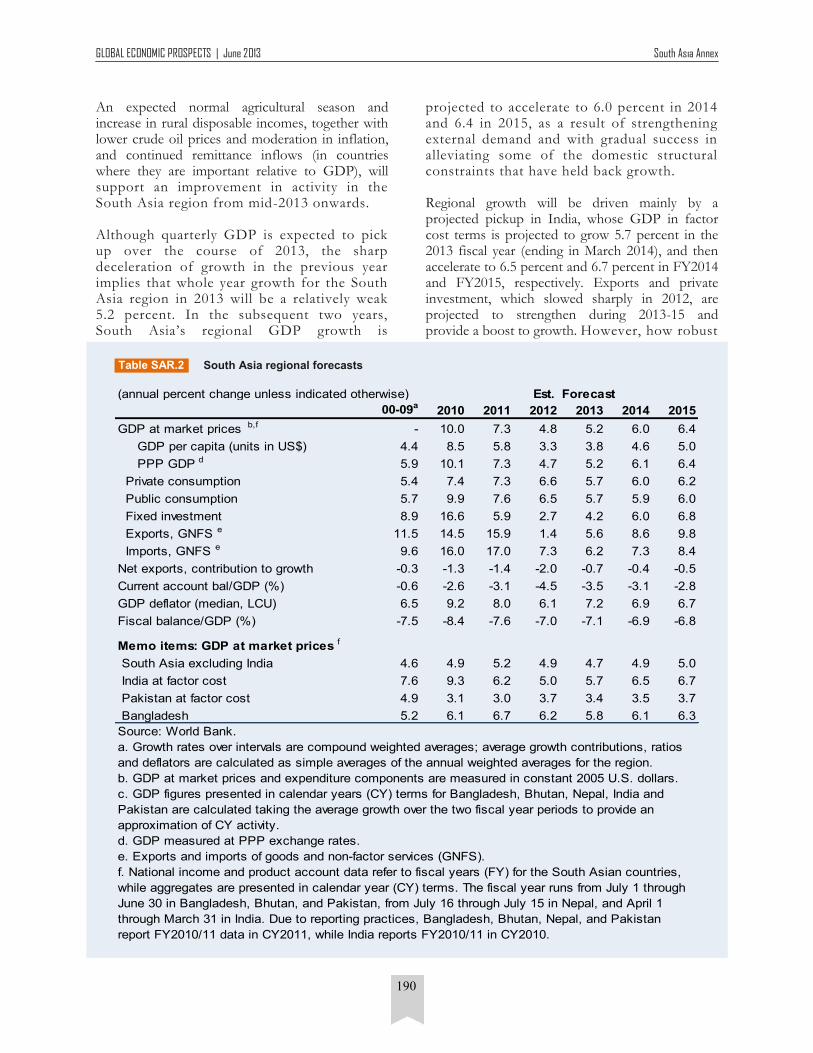
South Asia regional forecasts
Table SAR.2
Est. Forecast
00-09a2010 2011 2012 2013 2014 2015
GDP at market prices b,f - 10.0 7.3 4.8 5.2 6.0 6.4
GDP per capita (units in US$) 4.4 8.5 5.8 3.3 3.8 4.6 5.0
PPP GDP d 5.9 10.1 7.3 4.7 5.2 6.1 6.4
Private consumption 5.4 7.4 7.3 6.6 5.7 6.0 6.2
Public consumption 5.7 9.9 7.6 6.5 5.7 5.9 6.0
Fixed investment 8.9 16.6 5.9 2.7 4.2 6.0 6.8
Exports, GNFS e 11.5 14.5 15.9 1.4 5.6 8.6 9.8
Imports, GNFS e 9.6 16.0 17.0 7.3 6.2 7.3 8.4
Net exports, contribution to growth -0.3 -1.3 -1.4 -2.0 -0.7 -0.4 -0.5
Current account bal/GDP (%) -0.6 -2.6 -3.1 -4.5 -3.5 -3.1 -2.8
GDP deflator (median, LCU) 6.5 9.2 8.0 6.1 7.2 6.9 6.7
Fiscal balance/GDP (%) -7.5 -8.4 -7.6 -7.0 -7.1 -6.9 -6.8
Memo items: GDP at market prices f
South Asia excluding India 4.6 4.9 5.2 4.9 4.7 4.9 5.0
India at factor cost 7.6 9.3 6.2 5.0 5.7 6.5 6.7
Pakistan at factor cost 4.9 3.1 3.0 3.7 3.4 3.5 3.7
Bangladesh 5.2 6.1 6.7 6.2 5.8 6.1 6.3
(annual percent change unless indicated otherwise)
Source: World Bank.
a. Growth rates over intervals are compound weighted averages; average growth contributions, ratios
and deflators are calculated as simple averages of the annual weighted averages for the region.
b. GDP at market prices and expenditure components are measured in constant 2005 U.S. dollars.
c. GDP figures presented in calendar years (CY) terms for Bangladesh, Bhutan, Nepal, India and
Pakistan are calculated taking the average growth over the two fiscal year periods to provide an
approximation of CY activity.
d. GDP measured at PPP exchange rates.
e. Exports and imports of goods and non-factor services (GNFS).
f. National income and product account data refer to fiscal years (FY) for the South Asian countries,
while aggregates are presented in calendar year (CY) terms. The fiscal year runs from July 1 through
June 30 in Bangladesh, Bhutan, and Pakistan, from July 16 through July 15 in Nepal, and April 1
through March 31 in India. Due to reporting practices, Bangladesh, Bhutan, Nepal, and Pakistan
report FY2010/11 data in CY2011, while India reports FY2010/11 in CY2010.

GLOBAL ECONOMIC PROSPECTS | June 2013 South Asia Annex
191
that recovery will be, will depend on the pace of policy and fiscal reforms, and remains subject to significant uncertainty and downside risks. Some upside risks to the outlook include a faster than projected pickup in global demand and a larger than expected decline in commodity prices (see Risks and Vulnerabilities section below). GDP growth in Pakistan is projected to only slowly accelerate from an estimated 3.4 percent in FY2012-13 to 3.7 percent in FY2014-15, with output being held back by a wide range of structural problems, including: weak investment (down a third since 2008 when expressed as a percent of GDP—see figure SAR.10), security uncertainties, unreliable energy inputs, and monetization of large fiscal deficits, among others. Balance of payments
pressures have risen with reserves falling below 2 months of imports, notwithstanding robust remittance inflows. Policy actions to address the underlying adverse structural factors are critical to raising Pakistan’s longer-term growth potential. Bangladesh’s growth slowed to an estimated 5.8 percent in the 2012-13 fiscal year ending in June. But growth is projected to pick up modestly to 6.1 percent in FY2013-14 and 6.3 percent in FY2014-15, as external demand strengthens gradually, and agricultural output returns to more normal levels. Several domestic weaknesses, including infrastructure gaps (electricity, roads) and social unrest are expected to hold back a firmer recovery. In Sri Lanka, growth is expected to pick up to 6.5 percent in 2013 and 6.7 percent in 2014, aided by normal agricultural harvests, strengthening demand for exports, robust capital inflows, increase in infrastructure and other investments, and a revival of tourism (Table SAR.3). The relatively modest pickup in growth represents a return to underlying potential growth rates after rapid demand-fueled growth in 2010-11 opened up positive output gaps and resulted in inflation and current account pressures. Some domestic uncertainties in Nepal appear to be easing and the political situation normalizing after formation of an interim government in March. This political normalization, expected timely monsoon rains, and continued increase in remittances should be favorable for economic activity in 2013 and beyond. However, private
Fig SAR.10 Fig SAR.10
Fig SAR.9
A sharp decline in investment-to-GDP ratio in Pakistan
Source: World Bank; Datastream; Haver.
Fig SAR.10
10
15
20
25
30
35
40
199
0
199
2
199
4
199
6
199
8
200
0
200
2
200
4
200
6
200
8
201
0
201
2
Pakistan India
Bangladesh Nepal
Sri Lanka
Fixed investment as pecent of GDP
South Asia’s exports benefited from stronger developing-country growth, with exports to developing countries outpacing overall exports during 2000-2011
Note: Export shares calculated using trade partner data on imports from South Asian countries.
Source: World Bank; UN COMTRADE.
Fig SAR.9
0
20
40
60
80
100
2000 2001 2002 2003 2004 2005 2006 2007 2008 2009 2010 2011
Other high income USA
EU27 Within South Asia
Other developing regions East Asia and Pacific
China
Share of Indian exports (Percent)
0
20
40
60
80
100
2000 2001 2002 2003 2004 2005 2006 2007 2008 2009 2010 2011
Other high income USA
EU27 Within South Asia
Other developing regions East Asia and Pacific
China
Share of South Asia excluding India exports (Percent)

GLOBAL ECONOMIC PROSPECTS | June 2013 South Asia Annex
192
South Asia country forecasts
Table SAR.3
Est. Forecast
00-09a2010 2011 2012 2013 2014 2015
Calendar year basis b
Afghanistan
GDP at market prices (% annual growth) c - 8.4 7.0 11.8 3.1 4.9 6.3
Current account bal/GDP (%) -0.3 2.8 2.2 3.9 1.6 0.5 -0.3
Bangladesh
GDP at market prices (% annual growth) c 5.2 6.4 6.5 6.0 6.0 6.2 6.3
Current account bal/GDP (%) 0.6 1.8 0.2 1.3 1.1 1.0 0.9
Bhutan
GDP at market prices (% annual growth) c 7.7 9.6 9.5 8.3 7.9 8.4 8.6
Current account bal/GDP (%) -0.1 -19.1 -25.5 -20.7 -20.9 -19.2 -18.4
India
GDP at factor cost (% annual growth) c 7.4 9.1 7.0 5.3 5.5 6.3 6.6
Current account bal/GDP (%) -0.5 -3.2 -3.5 -5.4 -4.2 -3.7 -3.3
Maldives
GDP at market prices (% annual growth) c 6.3 7.1 7.0 3.4 3.7 3.9 4.0
Current account bal/GDP (%) -1.1 -9.2 -21.4 -26.5 -28.0 -26.0 -25.0
Nepal
GDP at market prices (% annual growth) c 3.4 4.1 4.2 4.3 3.8 3.9 4.1
Current account bal/GDP (%) -0.9 -2.5 0.2 0.1 -0.1 -0.3 -0.5
Pakistan
GDP at factor cost (% annual growth) c 4.9 3.1 3.4 3.5 3.4 3.6 3.7
Current account bal/GDP (%) -1.4 -0.7 -1.0 -0.9 -0.4 -0.3 -0.3
Sri Lanka
GDP at market prices (% annual growth) c 4.4 8.0 8.2 6.4 6.5 6.7 6.5
Current account bal/GDP (%) -3.7 -2.2 -7.8 -6.6 -5.9 -5.4 -4.8
Fiscal year basis b
Bangladesh
GDP at market prices (% annual growth) c 5.2 6.1 6.7 6.2 5.8 6.1 6.3
Bhutan
GDP at market prices (% annual growth) c 7.7 9.3 10.0 9.0 7.6 8.1 8.6
India
GDP at factor cost (% annual growth) c 7.6 9.3 6.2 5.0 5.7 6.5 6.7
Nepal
GDP at market prices (% annual growth) c 3.4 4.8 3.4 4.9 3.7 3.8 4.1
Pakistan
GDP at factor cost (% annual growth) c 4.9 3.1 3.0 3.7 3.4 3.5 3.7
Source: World Bank.
World Bank forecasts are frequently updated based on new information and changing (global)
circumstances. Consequently, projections presented here may differ from those contained in other
Bank documents, even if basic assessments of countries’ prospects do not significantly differ at any
given moment in time.
a. GDP growth rates over intervals are compound average; current account balance shares are simple
averages over the period.
b. National income and product account data refer to fiscal years (FY) for the South Asian countries
with the exception of Sri Lanka, which reports in calendar year (CY). The fiscal year runs from July 1
through June 30 in Bangladesh, Bhutan, and Pakistan, from July 16 through July 15 in Nepal, and
April 1 through March 31 in India. Due to reporting practices, Bangladesh, Bhutan, Nepal, and
Pakistan report FY2010/11 data in CY2011, while India reports FY2010/11 in CY2010. GDP figures
presented in calendar years (CY) terms for Bangladesh, Bhutan, Nepal, India and Pakistan are
calculated taking the average growth over the two fiscal year periods to provide an approximation of
CY activity.
c. GDP measured in constant 2005 U.S. dollars.

GLOBAL ECONOMIC PROSPECTS | June 2013 South Asia Annex
193
sector industrial activity is likely to continue to remain lackluster. Overall, following an estimated 3.7 percent GDP growth in FY2012-13, Nepal’s growth is projected to remain broadly stable at 3.8 percent in FY2013-14 and improve modestly to 4.1 percent in FY2014-15. To do better, the government will need to make energy provision more reliable, invest further in the skills and quality of Nepal’s workforce, enhance the predictability and transparency of the regulatory and tax regimes, while also strengthening the overall business environment. Afghanistan’s economy remains dependent on agricultural performance and external aid. Moderate rainfall is projected to reduce growth to around 3 percent in 2013. The withdrawal of coalition forces, which have been a major source of demand, is likely to create challenges for sustaining growth. To assist in this transition, donors have pledged significant aid in the coming years. Although the security situation remains difficult, services and natural resource extraction are starting to contribute to economic activity. Growth will also be helped by continued rebuilding of infrastructure and essential services, foreign assistance, and foreign investment in natural resource sectors. Afghanistan’s GDP growth is forecast to accelerate to about 6 percent by 2015. In Bhutan, hydropower projects coming on steam in coming years are likely to keep overall GDP growth high at about 8-9 percent annually in 2013-15. But lack of economic diversification poses challenges to generating employment and inclusive
growth. In Maldives, in addition to deteriorating macroeconomic fundamentals discussed earlier, the country faces severe challenges in diversifying its economy beyond tourism. The economic outlook remains clouded by political uncertainty leading up elections in 2013/14 and by limited success in controlling fiscal outcomes. An easing in global fuel prices (Brent crude oil prices fell 15 percent between mid-February and early-June - see figure SAR.11), together with expected normal monsoon rains, will help to curb price pressures. Modestly lower crude prices in 2013 and 2014 will also provide some relief to current account and fiscal positions. Lower crude oil prices will help regional governments in narrowing existing gaps between international prices and domestic administered prices, and lower the subsidy burden and reduce overall fiscal pressures. But inflation pressures will still remain in the region. Ongoing and planned increases in administered fuel and electricity prices will add to headline price pressures in the near term, but as long as the higher inflation does not get ingrained into expectations, this should not result in a permanent increase in inflation. More importantly, supply side constraints in agricultural, energy and other sectors will continue to exert upward price pressures.
Risks and vulnerabilities Global uncertainties have receded since mid-2012 and both the severity and likelihood of downside risks from high income countries has diminished (see June 2013 GEP main text). Domestic policy and weather risks have now gained in importance for the South Asia region. A key risk to the gradual acceleration in growth envisaged in the baseline scenario, is the success with which planned and announced reform policies are actually implemented during 2013-15. Based on backward looking indicators, growth could well be
Sharp crude oil price declines have often corrected in the past, but on average, prices are forecast to be 2.5 percent lower in 2013 than in 2012
Source: World Bank; Datastream.
Fig SAR.11
80
90
100
110
120
130
Jan '12 Apr '12 Jul '12 Oct '12 Jan '13 Apr '13
USD per barrel
Brent
Dubai

GLOBAL ECONOMIC PROSPECTS | June 2013 South Asia Annex
194
between 0.3 and 0.5 percentage points slower than in the baseline. Political obstacles to passing and implementing reform legislation pose downside risks to the outlook. Reforms to the process of land acquisition for industrial projects and labor market reforms could prove contentious. In countries either exiting (Pakistan) or entering electoral cycles (Bangladesh, India, Nepal), spending pressures associated with elections could boost fiscal expenditure, adding to inflationary pressures and both internal and external imbalances. Risks in the post-election period include the possibility that past reforms are reversed or implementation delayed. Weaker than expected monsoon rains present another downside risk for South Asia. A second poor monsoon in a row would adversely affect rural incomes and employment, contribute to persistence of food inflation (and in turn, overall inflation) and could reduce overall GDP growth. by 0.5 percentage points or more. Moreover, weaker rural income growth would put greater demands on public spending (through automatic stabilizers and social welfare programs), which could make it difficult to achieve fiscal targets. A weakening of reserve coverage of imports in Pakistan and the Maldives to below 2 months of imports suggests that their balance of payments positions could come under stress from unanticipated shocks. However, the reserve position of Bangladesh has improved in the most recent period, from robust remittance inflows and a recent improvement in trade. Sri Lanka’s reserves have also risen in line with an increase in private capital inflows. A greater dependence on foreign investment inflows to finance India’s significantly larger current account deficit compared to the past has increased its vulnerability to a sudden reversal of investor sentiment. Several factors could result in a slowing or reversal of investment inflows—an unanticipated monetary tightening in some high income countries; resurgence of debt tensions; escalation of geopolitical conflict; and even disenchantment with the pace or nature of domestic reforms. Moreover, the sharply relaxed monetary policy in Japan could result in strong and disruptive private capital flows.
Revival of business sentiment remains a key element for South Asia’s regional growth. As discussed earlier, business sentiment in the manufacturing sector in India weakened to a four-year low in May (although the services sector index picked up). If business sentiment were to remain weak in coming months, this could adversely impact investment and growth. An upside risk to South Asia’s growth outlook includes a significant decline in commodity prices compared to the baseline. If crude oil prices were to fall to an average level of $80 per barrel by mid-2014 due to additional supplies coming on stream in international markets, South Asia’s GDP would be 0.9 percent higher than in the baseline by 2014, current account deficit would be 1.4 percent of GDP lower, and fiscal deficit 0.7 percent of GDP lower (see table 5 in June 2013 GEP main text). Other upside risks include a more rapid resolution of structural constraints to growth than envisaged in the baseline, and faster than projected global growth during the forecast period.
Despite recent efforts at fiscal consolidation, relaxation of monetary policies and still large fiscal deficits pose risks Central banks in South Asia cut interest rates sharply during the global financial crisis of 2008/09, but rates were appropriately raised subsequently as inflationary pressures rose (figure SAR.12). With the slowing of growth in 2012 and the recent moderation in year-on-year inflation, monetary policy in the region shifted toward a more accommodative stance. Policy rates in Pakistan were cut by 250 basis points in the second half of 2012, while Bangladesh, India and Sri Lanka cut policy rates in the first half of 2013. Sri Lanka’s central bank cut its policy rate by 25 basis points in late 2012 and again by 50 basis points in May after inflation moderated in the previous two months. The Reserve Bank of India reduced its key policy interest rate by a cumulative 75 basis points between January and May of 2013 as its benchmark wholesale price inflation declined, notwithstanding high CPI inflation. Although inflation rates have moderated across several countries in the region, consumer price

GLOBAL ECONOMIC PROSPECTS | June 2013 South Asia Annex
195
inflation still remains high compared to the average for middle-income developing countries. India’s steep growth deceleration mostly closed a large positive output gap that had opened up in the post-financial crisis period. And notwithstanding either slower or weak growth in 2012, several other South Asian countries also appear to be operating either close to or above full capacity. Given lags in monetary policy transmission, an easing of monetary policies (together with still large fiscal deficits) could add to strengthening activity already underway in the countries operating at full capacity, resulting in additional inflationary and current account pressures, without much payoff in additional GDP growth. The high fiscal deficits in the region also pose risks to the outlook, despite recent efforts at consolidation (see below). Large government borrowing programs can result in crowding out of private investment, and importantly, reduce available policy buffers to counter external or domestic shocks. Moreover, when underlying inflationary pressures are already high, the additional spending can further exacerbate inflation. General government deficits exceeded 6 percent of GDP on average in 2012 in the region (figure SAR.12). India’s central government's fiscal deficit fell to 4.9 percent of GDP in the 2012 fiscal year, below the 5.2 percent initially estimated, and down from 5.8 percent in FY2011.FN2 The government has pledged to further reduce it to 4.8 percent in FY2013 and 4.2 percent in FY2014. Despite the
recent consolidation, India’s general government deficit (including state government fiscal deficits) is more than 7 percent of GDP. Pakistan’s general government deficit is estimated to have risen sharply in recent years to above 7 percent of GDP (figure SAR.13). Maldives’ fiscal deficit is significantly higher than the regional average, and rose further in 2012. Several South Asian countries undertook fiscal reforms during the last year, particularly to their subsidy regimes. Fuel and food subsidies typically account for the bulk of subsidies, with subsidies in India and Sri Lanka at more than 2 percent of GDP, and over 3.5 percent of GDP in Bangladesh. Reforms to subsidy regimes have involved introducing more frequent adjustments to administered fuel and electricity prices, and measures to improve targeting of government benefits to the poorest beneficiaries. For instance, administered diesel prices in India are being raised at close to monthly frequency to gradually narrow the gap between international and domestic prices, while quotas have been imposed on subsidized provision of liquefied petroleum gas (LPG) for domestic use. Sri Lanka raised electricity prices in April 2013 in order to curb the (quasi-fiscal) losses of the state electricity company. India has also undertaken an ambitious direct cash transfer program (based on Aadhar digital unique national identification numbers, already provided to nearly 400 million Indians) in order to better target government benefits and services, and to reduce leakages from the public distribution system.
South Asian central banks (with exception of Nepal) cut policy interest rates following a mid-2012 slump in activity and moderation of inflation
Source: World Bank; Datastream.
Fig SAR.12
0
2
4
6
8
10
12
14
16
Jan-08 Sep-08 May-09 Jan-10 Sep-10 May-11 Jan-12 Sep-12 May-13
BangladeshIndiaNepalPakistanSri Lanka
Policy interest rate (Percent)
Fiscal deficits remain higher than pre-financial crisis levels in general in South Asia
Note: Only deficits shown in chart. f = forecasts for 2013.
Source: IMF (2013a and 2013b).
Fig SAR.13
0
5
10
15
20
25
Maldives India Pakistan Sri Lanka Bangladesh Nepal Afghanistan
2007
2009
2011
2012
2013f
General government deficit (Percent of GDP)
GLOBAL ECONOMIC PROSPECTS | June 2013 South Asia Annex
196
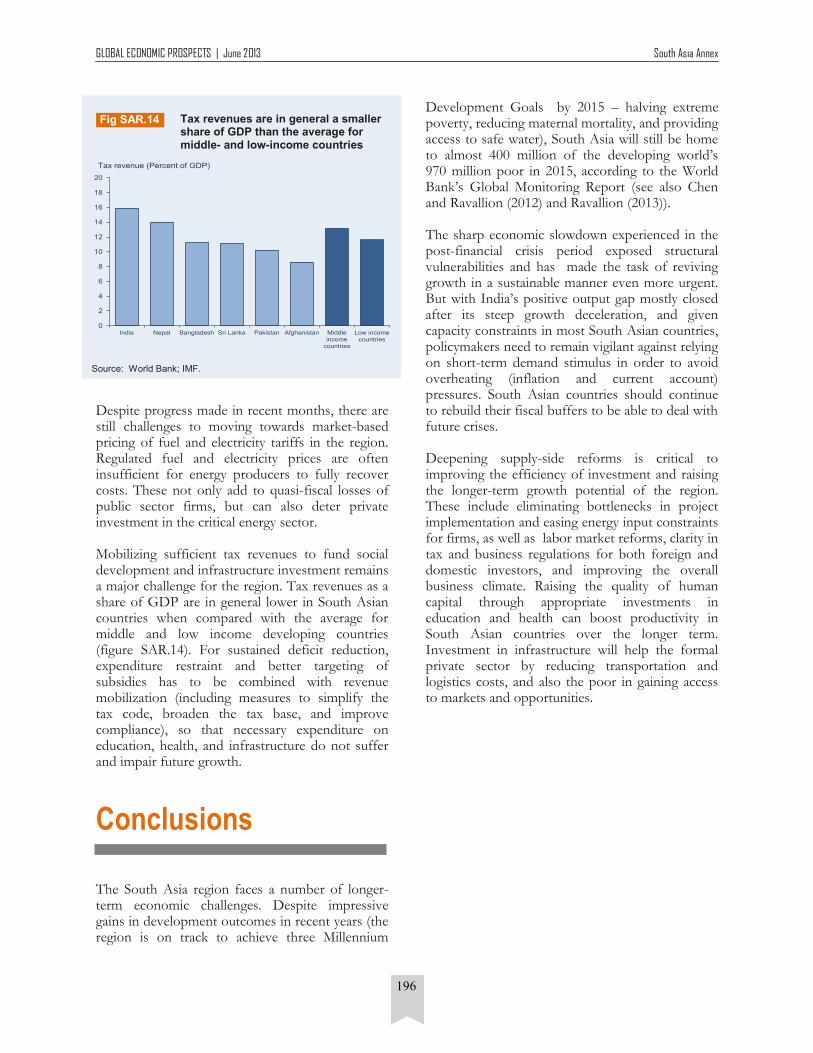
Despite progress made in recent months, there are still challenges to moving towards market-based pricing of fuel and electricity tariffs in the region. Regulated fuel and electricity prices are often insufficient for energy producers to fully recover costs. These not only add to quasi-fiscal losses of public sector firms, but can also deter private investment in the critical energy sector. Mobilizing sufficient tax revenues to fund social development and infrastructure investment remains a major challenge for the region. Tax revenues as a share of GDP are in general lower in South Asian countries when compared with the average for middle and low income developing countries (figure SAR.14). For sustained deficit reduction, expenditure restraint and better targeting of subsidies has to be combined with revenue mobilization (including measures to simplify the tax code, broaden the tax base, and improve compliance), so that necessary expenditure on education, health, and infrastructure do not suffer and impair future growth.
Conclusions
The South Asia region faces a number of longer-term economic challenges. Despite impressive gains in development outcomes in recent years (the region is on track to achieve three Millennium
Development Goals by 2015 – halving extreme poverty, reducing maternal mortality, and providing access to safe water), South Asia will still be home to almost 400 million of the developing world’s 970 million poor in 2015, according to the World Bank’s Global Monitoring Report (see also Chen and Ravallion (2012) and Ravallion (2013)). The sharp economic slowdown experienced in the post-financial crisis period exposed structural vulnerabilities and has made the task of reviving growth in a sustainable manner even more urgent. But with India’s positive output gap mostly closed after its steep growth deceleration, and given capacity constraints in most South Asian countries, policymakers need to remain vigilant against relying on short-term demand stimulus in order to avoid overheating (inflation and current account) pressures. South Asian countries should continue to rebuild their fiscal buffers to be able to deal with future crises. Deepening supply-side reforms is critical to improving the efficiency of investment and raising the longer-term growth potential of the region. These include eliminating bottlenecks in project implementation and easing energy input constraints for firms, as well as labor market reforms, clarity in tax and business regulations for both foreign and domestic investors, and improving the overall business climate. Raising the quality of human capital through appropriate investments in education and health can boost productivity in South Asian countries over the longer term. Investment in infrastructure will help the formal private sector by reducing transportation and logistics costs, and also the poor in gaining access to markets and opportunities.
Tax revenues are in general a smaller share of GDP than the average for middle- and low-income countries
Source: World Bank; IMF.
Fig SAR.14
0
2
4
6
8
10
12
14
16
18
20
India Nepal Bangladesh Sri Lanka Pakistan Afghanistan Middleincome
countries
Low incomecountries
Tax revenue (Percent of GDP)

GLOBAL ECONOMIC PROSPECTS | June 2013 South Asia Annex
197
Chen, Shaohua, and Martin Ravallion. 2012. “More Relatively-Poor People in a Less Absolutely-Poor World.” Policy
Research Working Paper 6114, World Bank: Washington, DC.
GOI (Government of India). 2013. “Review of the Indian Economy 2012/13.” Report of the Economic Advisory Council to
the Prime Minister of India, April. (http://eac.gov.in)
IMF (International Monetary Fund). 2013a. Fiscal Monitor, April. Washington DC.
_____. 2013b. World Economic Outlook, April. Washington DC.
Rajan, Raghuram. 2013. “Why India Slowed.” Project Syndicate, April 30.
Ravallion, Martin. 2013. “How Long Will It Take to Lift One Billion People Out of Poverty?” Policy Research Working Paper
6325, World Bank: Washington, DC.
Subbarao, Duvvuri. 2013. “India’s Macroeconomic Challenges: Some Reserve Bank Perspectives.” 5th I.G. Patel Lecture,
London School of Economics, March 13.
World Bank. 2013a. Global Monitoring Report 2013: Rural-Urban Dynamics and the Millennium Development Goals. South
Asia Regional Brief.
World Bank. 2013b. South Asia Economic Focus: Regaining Momentum. April 2013.
References
Notes 1 See GOI (2013), Rajan (2013), and Subbarao (2013) for some of the reasons behind India’s growth slowdown and
the macroeconomic and structural challenges that the country faces in reviving growth.
2 The World Bank’s estimates of India’s central government fiscal deficit are slightly higher at 6.0 percent in FY2011
and 5.1 percent in FY2012. The difference is mostly accounted for by receipts from disinvestment in public sector
enterprises. World Bank estimates excludes these (and any other one time receipts) from the government's revenue.
