south africa a top developing and globally competitive … introduction foreword part 1 –...
TRANSCRIPT

List of Figures
Fig. 1 – South Africa’s performance in WEF Competitiveness Report
Fig. 2 – SA WEF performance vs. BRIC average
Fig. 3 – Next11 and South Africa over-all rankings in WEF Competitiveness Report 2010-2012
Fig. 4 – SA WEF performance vs. Next 11 average
Fig. 5 - BRICS comparison – World Bank Ease of Doing Business
Fig. 6 - South Africa performance in UNDP Human Development Index
Fig. 7 - Nation Brand Hexagon
Fig. 8 – South Africa over-all and pillar performance in Nation Brand Index
Fig. 9 – Economic sectors associated with South Africa
South Africa A top developing and globally competitive nation
Brand South Africa Special Research Report April 2013
ContentsIntroduction
Foreword
Part 1 – Competitiveness & Related Human Development Indicators
1. World Economic Forum – Global Competitiveness Report
2.Institute for Management Development – Global Competitiveness (IMD)
3.BRICS-SA Competitiveness Comparisons
3.1 BRICS versus South Africa Competitiveness Comparison
3.2 South Africa and the Next11 Competitiveness Comparison
4. The Ibrahim Index of African Governance
5. World Bank Ease of Doing Business
5.1. South Africa – BRICS Doing Business Index Comparison
6. WEF – World Travel & Tourism Index
6.1. Over-all Ranking
6.2. Positive Comments by WEF on SA Travel & Tourism Competitiveness
7.United Nations Development Programme – Human Development Report
Part 2 – Reputation Indicators & International Investor Perceptions of South Africa
1. Anholt GfK-Roper Nation Brand Index
2.Investor perceptions – Key findings from Brand SA Project Thrive – International Investor Perception of South Africa Research
Conclusion

List of Figures
Fig. 1 – South Africa’s performance in WEF Competitiveness Report
Fig. 2 – SA WEF performance vs. BRICS average
Fig. 3 – Next11 and South Africa over-all rankings in WEF Competitiveness Report 2010- 2012
Fig. 4 – SA WEF performance vs. Next 11 average
Fig. 5 - BRICS comparison – World Bank Ease of Doing Business
Fig. 6 - South Africa performance in UNDP Human Development Index
Fig. 7 - Nation Brand Hexagon
Fig. 8 – South Africa over-all and pillar performance in Nation Brand Index
Fig. 9 – Economic sectors associated with South Africa
Foreword
Brand South Africa works to improve South Africa’s global reputation, and to position the country as an investment destination and trade partner. The purpose with this work is to contribute to South Africa reaching its defined strategic goals of internal human and economic development, while also contributing positively to the African and global environments.
In a year when South Africa hosted for the first time on the African continent, the annual BRICS Summit, the theme of the fifth BRICS Summit reflected changes taking place in the global political economy. The increasing significance of developing nations and emerging markets in the global economy creates opportunities for new relations. The 5th BRICS Summit theme, BRICS and AFRICA: Partnership for Development, Integration and Industrialisation, aimed to address questions regarding the benefits South Africa, and Africa can derive from the BRICS.
This research report brings together several pieces of analysis of country performance Brand South Africa develops to understand country competitiveness in a rapidly changing global environment. This report identifies key strengths unique to the South African economy. These indicators highlight that South Africa has unique competitive strengths in the context of the developing world. The broader context of South Africa’s inclusion into the BRICS formation, as well as South Africa’s competitiveness performance compared to other developing nations, therefore shape the approach taken to the research presented here.
Highlights include the World Economic Forum’s competitiveness report that ranks South Africa 15th globally for Quality of Air Transport Infrastructure, while the country ’s financial services sector, banks and stock exchange are top global performers. Fur-thermore, South Africa, if compared to the BRIC, comes first in five of the ten criteria the World Bank uses to assess ease of doing business, being: Starting a business; Dealing with construction permits; Getting credit; Protecting investors; and Paying taxes. This means that South Africa offers protection to foreign direct investments, and is certainly a business friendly environment wherein new trade, investment, and related economic interactions can be fostered. As South Africa heads for twenty years of democracy it is important to assess the road travelled thus far, and to understand the position the country occupies globally, as a developing nation, in the early 21st century.
Miller Matola
CEO – Brand South Africa

Introduction
Brand South Africa’s research tracks a wide variety of competitiveness, reputation, and related global studies and indices. The goal with this is to monitor and evaluate over-all country performance in a highly competitive and uncertain global economy. These third party information sources are then supplemented by Brand South Africa commissioned research projects, and subscriptions to domestic research vehicles. In order to further deliver on research insights, Brand South Africa convenes Re-search Reference Groups that reflect on and provide Brand South Africa with expert input and advice on key issues of concern at the time.
This report presents key findings from research conducted by Brand South Africa in the past year. Significant findings include analysis of indicators showing that South Africa is a top performing globally competitive developing nation. This is important in the context of the country ’s membership of the BRICS grouping, as well as macro-economic changes taking place in the world system. Hence the report’s specific focus on developing a comparative understanding of how South Africa performs in competitiveness in relation to fellow developing nations.
The competitive strengths, together with indicators on international investor perceptions of the country can together be taken as an inspiration to show the strengths in the national economy. These can on their part become building blocks of excellence for the realisation of Vision 2030 in the National Development Plan while contributing positively to enhancing South Africa’s reputation globally.
But, why is this important? This report presents highlights from Brand South Africa’s research regarding country performance in a broad range of competitiveness, doing business, governance, and reputation indicators. In this regard analysis of country reputa-tion and competitiveness has to be seen in the context of larger patterns of change unfolding in the global political economy.
The 2013 United Nations Development Programme (UNDP), Human Development Report, contains powerful insights regarding the increasingly important role developing countries, such as South Africa, are playing in the 21st century. The UNDP indi-cates that the South (developing nations and emerging markets) currently produces half the world’s economic output. In 1990 these countries contributed only about a third of world economic output. To further illustrate the significant shift in the global economic balance of power, the UNDP argues that the combined GDP of eight developing countries, these being - Argentina, Brazil, China, India, Indonesia, Mexico, South Africa and Turkey equals the GDP of the United States. This implies for the UNDP that countries such as Brazil, South Africa, India and China, have become major drivers of the global economy and thus forces for change in the developing world. It is for this reason pertinent to locate and understand how South Africa is positioned within this rapidly changing global economic and by implication geopolitical environment.
Part 1 of the report brings together a range of competitiveness and human development indicators. These indicators are then, on their part, utilised in a comparative manner to ascertain South Africa’s strengths in relation to fellow BRICS and other prom-ising developing nations broadly referred to as the Next11. What emerges is a pattern of country performance indicating that South Africa matches and outperforms other peer developing countries in critical areas of national competency. These are important indicators to utilise in the process of positioning South Africa as a reliable trade partner, and attractive investment destination.
Part 2 of the report reflects on findings from an annual international investor perception study commissioned by Brand South Africa. In addition, this part of the report reflects on findings from the annual Anholt GfK-Roper Nation Brand Index (NBI). The NBI studies the global reputation of a select group of 50 nations. South Africa’s performance in the NBI, together with findings from the investor perception study, should provide high-level insights into the over-all perception of South Africa.
Dr. Petrus de Kock
Research Manager
Part 1 – Competitiveness & related Human Development indicatorsIn a rapidly changing global economic and geopolitical environment, competition for FDI, trade opportunities, and related busi-ness activity is increasing. The sections below presents some highlights and comparisons between South Africa, the BRICS nations, and the Next11 group of developing nations.
As indicated in the sections below, South Africa performs well in comparison to fellow developing nations, implying that South Africans can have confidence in the capabilities, skill, and knowledge necessary to improve the country ’s over-all global competi-tiveness, create jobs, and realise human- and skills development goals in future.
1. World Economic Forum – Global Competitiveness Report 2012/13
Top issues emerging from the World Economic Forum’s Competitiveness Report indicate that South Africa compares quite well with fellow developing nations and emerging markets. South Africa’s strengths in the 2012 report include globally leading perfor-mance in:
• Legal Rights Index (1st);• Regulation of Securities Exchanges (1st);• Efficacy of Corporate Boards (1st);• Strength of Auditing and Reporting Standards (1st);• Availability of Financial Services (2nd);• Financing through local equity market (3rd).
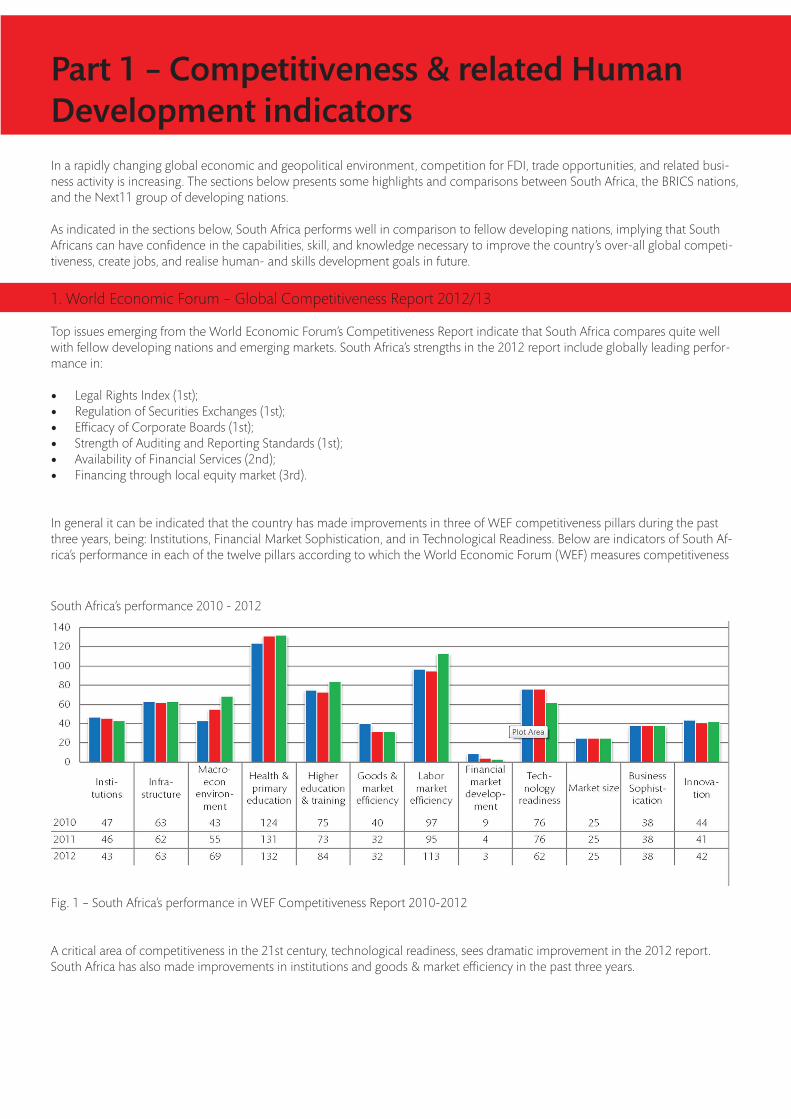
In general it can be indicated that the country has made improvements in three of WEF competitiveness pillars during the past three years, being: Institutions, Financial Market Sophistication, and in Technological Readiness. Below are indicators of South Af-rica’s performance in each of the twelve pillars according to which the World Economic Forum (WEF) measures competitiveness
South Africa’s performance 2010 - 2012
Fig. 1 – South Africa’s performance in WEF Competitiveness Report 2010-2012
A critical area of competitiveness in the 21st century, technological readiness, sees dramatic improvement in the 2012 report. South Africa has also made improvements in institutions and goods & market efficiency in the past three years.
1.1 South Africa versus the BRIC nations: competitiveness comparison
South Africa’s inclusion in the BRICS is significant for many reasons. For example, the BRICS combine 43 per cent of the world’s population. Furthermore, the combined GDP of these countries is estimated at US$13.7 trillion (+/-20 – 25% of global GDP), and the BRICS combined foreign reserves is estimated to be US$4 trillion. These staggering numbers added to the BRICS can accounted for 11% of global foreign direct investment (FDI) flows in 2012 (USD465 billion) and 17% of world trade. This implies that from a global perspective South Africa is member of a group of nations that brings together 21st century economic giants with significant influence both globally and within their respective regions. BRICS membership is therefore an important evolv-ing dimension of South Africa’s international reputation building and strategic economic positioning efforts.
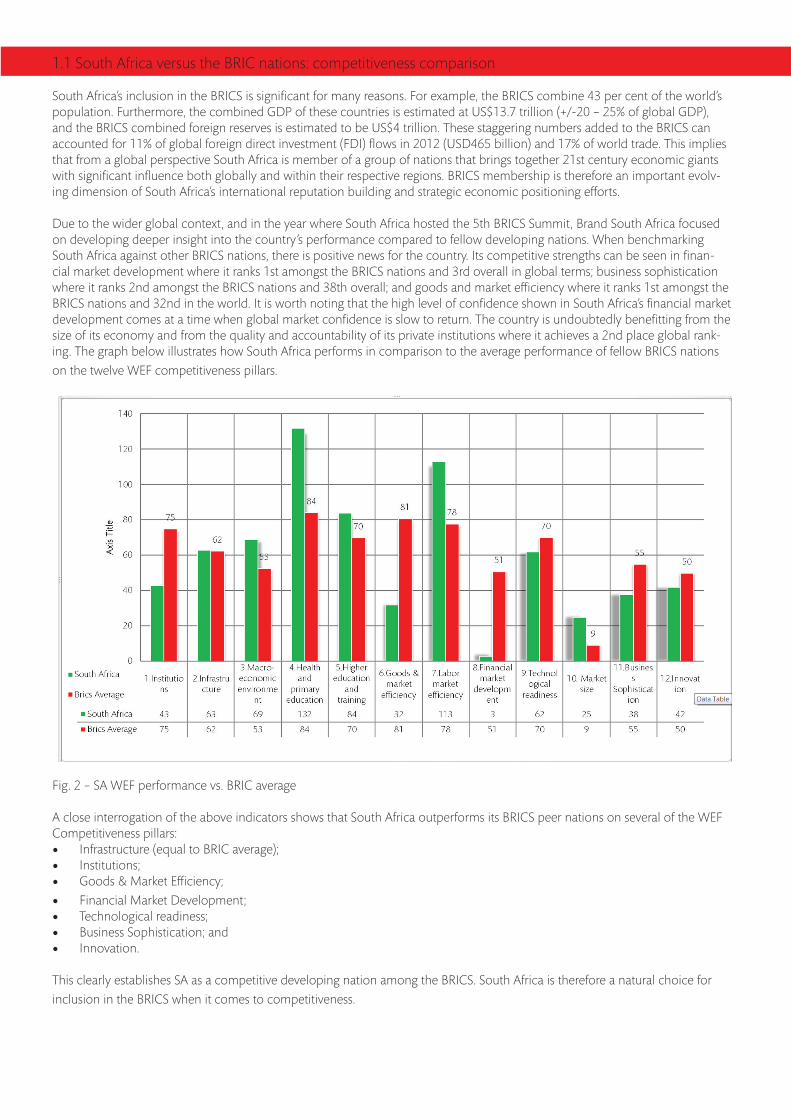
Due to the wider global context, and in the year where South Africa hosted the 5th BRICS Summit, Brand South Africa focused on developing deeper insight into the country ’s performance compared to fellow developing nations. When benchmarking South Africa against other BRICS nations, there is positive news for the country. Its competitive strengths can be seen in finan-cial market development where it ranks 1st amongst the BRICS nations and 3rd overall in global terms; business sophistication where it ranks 2nd amongst the BRICS nations and 38th overall; and goods and market efficiency where it ranks 1st amongst the BRICS nations and 32nd in the world. It is worth noting that the high level of confidence shown in South Africa’s financial market development comes at a time when global market confidence is slow to return. The country is undoubtedly benefitting from the size of its economy and from the quality and accountability of its private institutions where it achieves a 2nd place global rank-ing. The graph below illustrates how South Africa performs in comparison to the average performance of fellow BRICS nations on the twelve WEF competitiveness pillars.
Fig. 2 – SA WEF performance vs. BRIC average
A close interrogation of the above indicators shows that South Africa outperforms its BRICS peer nations on several of the WEF Competitiveness pillars:• Infrastructure (equal to BRIC average); • Institutions; • Goods & Market Efficiency; • Financial Market Development; • Technological readiness;• Business Sophistication; and• Innovation.
This clearly establishes SA as a competitive developing nation among the BRICS. South Africa is therefore a natural choice for inclusion in the BRICS when it comes to competitiveness.

1.2 South Africa - Next11 Comparison
In a similar comparison with Next11 nations, even more insights appear. A comparison between South Africa and the Next11’s average performance per pillar indicates that South Africa has tremendous competitive advantages over the Next11 nations.
The Next11 group of nations include other developing nations, and emerging markets that have significant roles to play in their respective regions, as well as in the emerging global economic reality. It is interesting to track over-all competitiveness scores for this group of countries. As the indicators in the graph below shows, if South Africa was part of this group, it would have been a top five competitive nation.
52
South Africa vs Next Country Score ComparisonFig. 3 – Next11 and South Africa over-all rankings in WEF Competitiveness Report 2012/13
In terms of over-all ranking, South Africa is located in the top five among the Next11 group of developing nations. This shows that South Africa can confidently say that it is a top five globally competitive developing nation. Fig. 4 below illustrates South Africa’s competitive strengths per WEF competitiveness pillar compared to the average performance of the Next11 nations.
Fig. 4 – SA WEF performance vs. Next 11 average

The above indicators indicate that South Africa outperforms the Next11 on the following 7 pillars:
• Institutions• Infrastructure• Goods and market efficiency• Financial market development • Technological readiness • Business readiness • Innovation
In addition, South Africa equals the Next11’s average on the following two pillars:
• Higher education and training• Market size
The above demonstrates South Africa’s competitiveness in 9 of the 12 pillars in comparison to the Next11, which is indicative of a top five developing nation.
1.3 Institute for Management Development (IMD) Global Competitiveness Report 2012/13
According to the IMD 2012, South Africa has improved its overall ranking and performance from number 52 in 2011, to 50 in 2012. The IMD has been assessing competitiveness since 1989 and provides long term measured assessments of the performance of 59 countries according to 329 criteria.
In terms of South Africa’s overall performance in the 2012 IMD report, the country has improved its ranking in:
- Government efficiency 29 (up from 32 in 2011); - Business efficiency 37 (up from 40 in 2011); - Infrastructure 54 (up from 56 in 2011) - Economic performance 57 (down from 54 in 2011).
From the WEF and IMD reports we learn that South Africa has been advancing slowly on the front of institutions, and government efficiency.
The IMD identified economic performance strengths of South Africa are:
- Cost-of-living index (Ranked 7)- Terms of trade index (Ranked 9)- Resilience of the economy to the economy (ranked 26)- Tourism receipts (25%)- Direct investment stock abroad (29%; ranked 29)
The weaknesses as identified by the IMD report are the unemployment rate, direct investment flows abroad, GDP per capita, and relocation services, however, these are not seen as threats to the future of the economy by the IMD, but relate more to cyclical market trends and prevailing conditions in the global economy.
2. The Ibrahim Index of African Governance (IIAG)
Governance is a key issue that informs much political, economic and socio-political debate and activity on the African continent. South Africa performs well in the IIAG which takes as a point of departure the idea that all citizens of African states have a right to access social services. It thus measures the governance performance of African states according to eighteen unique criteria. South Africa comes 5th in its over-all performance in the IIAG in 2012/13. South Africa ranks in the top five, of the following criteria, being:
• 1st – Public Management• 2nd – Gender • 3rd – Rule of Law• 3rd – Participation & Human Rights• 4th – Welfare • 5th – Education • 5th – Accountability • 5th – Participation

3. World Bank Ease of Doing Business Index
South Africa’s overall ranking in the 2013 Doing Business Index (DBI) slipped with three positions on the 35th position the country occupied in 2012 (35) to 39th in 2013. South Africa thus sees a slight decline in its performance this year. This is a result not so much of the country performing worse, it is a result of other countries moving up the ranking ladder by improving doing business conditions at a faster pace than South Africa. This year’s report notes that among the 50 economies with the biggest improvements since 2005 (a third) are in Sub-Saharan Africa. This is a significant finding for the sub-region, indicating improving conditions for doing business in a period when negoti-ations regarding the establishment of the Trilateral Free-Trade Area encompassing the Southern African Development Community (SADC), Community of East and Central African States (COMESA), and the East African Community (EAC) are taking place. This free trade area will create an integrated market of more than 650 million people.
Other findings on SA performance in the DBI indicate that South Africa made starting a business easier by implementing its new company law, which eliminated the requirement to reserve a company name and simplified the incorporation documents. The DBI furthermore indicates that South Africa made transferring property less costly and more efficient by reducing the transfer duty and introducing electronic filing. South Africa also introduced a new reorganization process to facilitate the rehabilitation of financially distressed companies.
South Africa’s improved its performance on the Trading Across Borders rank. In the DBI 2012 South Africa ranked 144th, and improved with 29 positions to 115th in the DBI 2013. This is a significant improvement due to the fact that South Africa has de-creased the time, cost, and red tape companies have to deal with to get products to port and shipped to international markets.
3.1 South Africa – BRICS DBI Comparison
The World Bank assesses ease of doing business according to ten criteria. The country performs particularly well when compared to BRICS partners. South Africa comes first in the criteria indicated in brackets in the table below.
Fig. 5 - BRICS comparison’s 2013- World Bank Ease of Doing Business
According to the indicators above, South Africa comes first among the BRICS in six of the DBI criteria. This implies that South Afri-ca can make a strong business case to attract trade partners, investment, and clients from fellow BRICS members. As a nation that offers several competitive advantages, an open business environment is an important feature to utilise as selling point for South Africa as a business destination.
BRICS Comparison – World Bank Ease of Doing Business 2013 Brazil Russia India China South Africa
Over-all 130 112 132 91 39 (1) Starting a business 121 101 173 151 53 V
Dealing with construction permits 131 178 182 181 39 (1)
Getting electricity 60 184 105 114 150 (4)
Registering property 109 46 94 44 79 (3)
Getting credit 104 104 23 70 1 (1)
Protecting investors 82 117 49 100 10 (1)
Paying taxes 156 64 152 122 32 (1) Trading across borders 123 162 127 68 115 (2)
Enforcing contracts 116 11 184 19 82 (3)
Resolving insolvency 143 53 116 82 84 (3)

4. World Economic Forum – World Travel & Tourism Index
South Africa improves its position in the WEF Travel & Tourism Index this year. This year’s index covers 140 states. South Africa improves its position on the WTTC in 2013 to 64 from 66 in 2011. South Africa ranks third in the Sub-Saharan Africa region after Seychelles (1st), and Mauritius (2nd).
4.1 Comments by WEF on SA travel & tourism
Important findings from WEF indicates South Africa comes in high at 17th place for its natural resources, and 58th for cultural resources. This is according to WEF due to many World Heritage sites, rich fauna, creative industries, and the many international fairs and exhibitions hosted in the country. The latter can be interpreted as a strong selling point for the country, with commu-nications implications. A further positive finding WEF indicates is that SA’s infrastructure is well developed for the region, with air transport infrastructure ranked 43rd, and a particularly good assessment of railroad quality (46th) and road quality (42nd).
South Africa is also praised for its travel & tourism related policies, rules and regulations in that these are conducive to the sector’s development (ranked 29th). WEF indicates that SA has been making steady improvements in this area over the past few assess-ments.
5. UNDP – Human Development Report
There is a lot of good news in the report for South Africa in that the country improves its HDR ranking with two positions from 123 in 2011, to 121 in the 2012/13 report.
This year’s report argues that there has been a transformation in the world economic system in recent years. This is partly due to the global economic situation, and the meteoric rise of developing nations and their significance to the future of the world econ-omy as a whole. The growing economic influence of developing nations also translates itself into political influence. The latter is having a significant impact on progress with human development, according to the UNDP.
Fig. 6 - South Africa’s performance in UNDP Human Development Index
The UNDP’s emphasis in this year’s report falls on the impact of the global economic situation on human development indica-tors. South Africa is singled out together with other major developing nations as an example of the global shift of economic and political power to the east and south.
South Africa HDR indicatorsYear Bank HDR
valueLife
ExpectancyMean yrs of schooling
Expected yrs of schooling
Gross national income
2013/13 121 0.629 53.4 8.5 13.1 $ 9594(PPP)
2011 123 0.619 52.8 8.5 13.1 $ 9469(PPP)

Part 2 – Reputation Indicators & International Investor PerceptionsThe sections to follow will refl ect on two issues, being South Africa’s global reputation as measured annually by the Anholt Gfk-Roper Nation Brand Index, and investor perceptions of South Africa based on key fi ndings from Brand South Africa’s annual Project Thrive, International Investor Perception Research.
1. Anholt Gfk-Roper Nation Brand Index
Brand South Africa subscribes to the annual Nation Brand Index reputation study conducted by the Anholt-GfK Roper Nation Brand Index (NBI). The NBI is an important measure of country reputation in terms of the six criteria outlined in the hexagon below. Perceptions of Investment & Immigration; Exports; People; Cultural & heritage; Governance; and Tourism form the main pillars according to which over-all reputation is assessed.
Fig. 7 - Nation Brand Hexagon
In 2012 South Africa was ranked 36th out of the 50 nations for the second year in a row. This comes in a year where two-thirds of the nations have experienced overall reputation score declines. South Africa’s overall reputation has remained stable, which is no small feat. South Africa’s Culture remains its strongest asset (28th). South Africa has seen score erosion on its top dimension, though several nations have seen declines in this area. With a strong People profi le (31st globally), South Africans are admired across most panel countries – especially when it comes to wanting someone from South Africa as a close friend (ranked 28th). South Africa contin-ues to rank 34th globally on Tourism, with much stronger perceptions as being naturally beautiful (15th) than on having historic buildings (41st). On Culture, the country ranks highly on sporting excellence (16th), but is somewhat less known for its culture – both contemporary (34th) and historic (33rd).
When it comes to rankings South Africa records some gains in 2012. South Africa surpasses fellow BRICS, India and Russia, on Governance and moves ahead of Russia, South Korea and China on People. Yet, it has lost some ground on Culture.
Investment & Immigration
Exports Tourism
Governance
Culture & Heritage
People
Commercial and cultural Products and sporting prowess
Level of satisfaction with country’s products and services
Investment Potential and attractiveness to outsiders
Potential attractiveness and
economical contribution
Competency fair governance, human rights, international
contribution
2012 (n= 534)

The table below shows South Africa’s performance per pillar between 2010 and 2012.
Fig. 8 – South Africa over-all and pillar performance in Nation Brand Index
2. Investor perceptions – Key findings from Brand SA Project Thrive, International Investor Perception of South Africa Research
Brand South Africa conducts an annual International Investor Perception study. This year’s results show a steady improvement of international investor perceptions of the country as a business destination. The study furthermore shows that South Africa’s econ-omy is positively seen as an environment full of opportunities. Below are some key findings from the report:
• South Africa’s key performance indicators remains stable in this year’s findings, despite the global economic conditions and labour issues/events experienced in the country during 2012;
• It is also important to note that a high percentage of non-investors are currently unavailable for investment. This is a result of global economic uncertainty;
• There has been a slight increase in the number of investors currently investing in South Africa, while other countries such as India and Brazil have seen a slight decline in the number of investors;
• Mining and quarrying remain as sectors strongly associated with South Africa. However, there has been a significant in-crease in associations with other sectors in the SA economy, in particular: Retail trade, construction; Financial/insurance/ real estate business; Electricity and gas water supply; Post & telecommunications. Thus, SA is not only about mining but other sectors as well. This indicates that international investors are increasingly seeing South Africa as a business destination;
• 44% of the sample were aware of the positioning statement “Inspiring New Ways”. This is good news seeing that it was launched only two months before fieldwork for Thrive V commenced;
• Investors are most likely to have heard from an online source (60% internet, 24% blogs). These sources tend to be more neutral;
• Word of mouth is also an important source of information for investors (41%); • Television was the most negative source of information (25% of reports negative);• Thrive data modelling indicates that South Africa can attract more FDI if the country offers more suitably qualified labour to
investors.
South Africa NBI performance 2012 2011 2010 Overall ranking 36 36 37 Ranking by pillar Exports 37 37 38 Governance 41 41 40 Culture 28 25 27 People 31 34 31 Tourism 34 34 35 Immigration & Investment 38 39 43
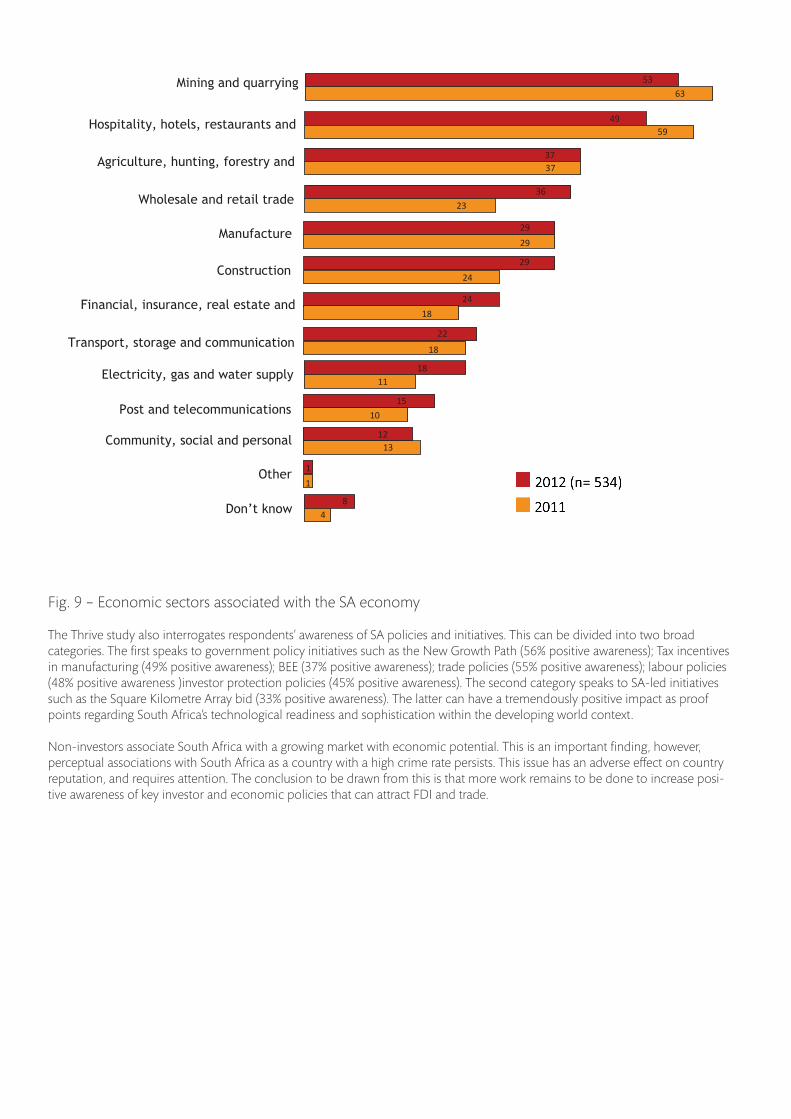
Fig. 9 – Economic sectors associated with the SA economy
The Thrive study also interrogates respondents’ awareness of SA policies and initiatives. This can be divided into two broad categories. The first speaks to government policy initiatives such as the New Growth Path (56% positive awareness); Tax incentives in manufacturing (49% positive awareness); BEE (37% positive awareness); trade policies (55% positive awareness); labour policies (48% positive awareness )investor protection policies (45% positive awareness). The second category speaks to SA-led initiatives such as the Square Kilometre Array bid (33% positive awareness). The latter can have a tremendously positive impact as proof points regarding South Africa’s technological readiness and sophistication within the developing world context.
Non-investors associate South Africa with a growing market with economic potential. This is an important finding, however, perceptual associations with South Africa as a country with a high crime rate persists. This issue has an adverse effect on country reputation, and requires attention. The conclusion to be drawn from this is that more work remains to be done to increase posi-tive awareness of key investor and economic policies that can attract FDI and trade.
Mining and quarrying
Hospitality, hotels, restaurants and
Agriculture, hunting, forestry and
Wholesale and retail trade
Manufacture
Financial, insurance, real estate and
Transport, storage and communication
Electricity, gas and water supply
Post and telecommunications
Community, social and personal
Other
Don’t know
Construction
53 63
49 59
37 37
36
23
29 29
29
24
18
24 18
22
18
11
15
12
10
13
8 4
1 1
Conclusion
South Africa’s performance in a range of competitiveness and human development indicators suggest that the country has tremendous strengths that can be leveraged positively to position the country as a business partner, and investment destination. As indicated above, it is necessary to understand how South African ranks, and is positioned among fellow developing nations. While the competitiveness indicators utilised above point to high-level indicators of national competency, more research should be conducted on a sector-specific basis to interrogate issues particular to specific areas of economic activity. Nevertheless, na-tional strengths in the financial sector, goods and market efficiency, and indicators that show South Africa outperforming Next11 nations on a technological readiness, innovation, and institutions clearly establish the country as a leader among developing nations. These strengths can be used as an inspiration to engage robustly with areas of competitiveness where the country ’s performance is weaker.
In terms of over-all competitiveness performance South Africa ranks third among the BRICS nations, and in the top five of the Next11. The conclusion to be drawn from this is that as a developing nation, South Africa compares not only well with fellow developing nations but that as a developing nation the country shares many of the unique social, educational, and human de-velopment challenges that are characteristic of developing societies and nations. In order to strengthen and advance the nation brand, critical areas of skills development, education, and services require attention.
In terms of reputation, the report reflected on findings from an annual International Investor Perception study commissioned by Brand South Africa. From project Thrive results, it is clear that positive associations prevail in terms of investment incentives for international investors, and that the country is increasingly seen as a business destination by international investors. This is particularly evident due to increased associations with South Africa’s retail, construction, and financial services sectors. South Africa, it can be concluded, is a globally competitive developing nation. Areas of national competency can be taken as an inspiration to develop and enhance country performance, economic social development in future.
References
United Nations Development Programme. 2013. Human Development Report 2013: The rise of the South – human progress in a diverse world. New York.
Brand South Africa’s Research Reports communicate findings from Brand South Africa research. The Research Reports are intended to elicit comments, contribute to debate, and inform stakeholders about trends and issues that impact on South Africa’s reputation and overall competitiveness.
Views expressed in Research Notes are those of the author(s) and do not necessarily represent those of Brand South Africa, or the Government of the Republic of South Africa. Every precaution is taken to ensure the accuracy of information. However, Brand South Africa shall not be liable to any person for inaccurate information or opinions contained herein.
Research Report compiled by Dr. Petrus de Kock, Brand South Africa, Research Manager