sources and uses of available cost of capital · pdf filesources and uses of available cost of...
TRANSCRIPT

Sources and Uses of Available Cost of Capital Data
American Institute of Certified Public AccountantsCost of Capital Webinar Series
January 27, 2010
Robert F. Reilly, CFA, CPA/ABV/CFFWillamette Management Associates
2
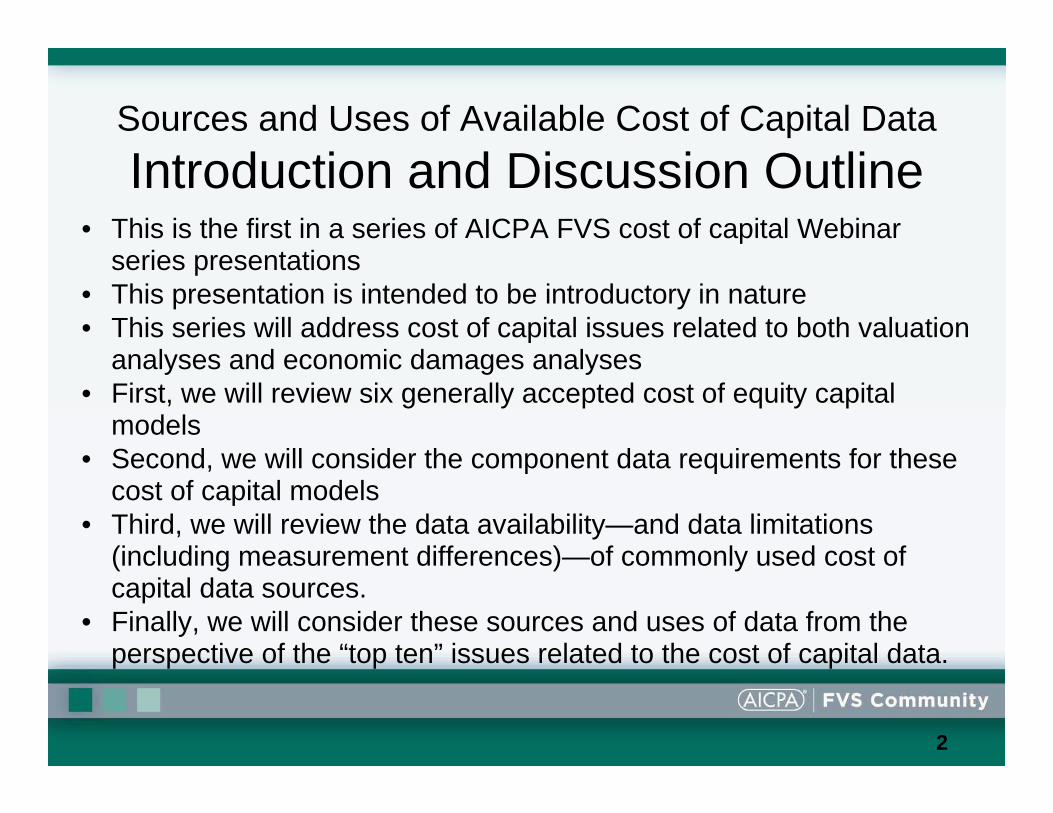
Sources and Uses of Available Cost of Capital DataIntroduction and Discussion Outline
• This is the first in a series of AICPA FVS cost of capital Webinar series presentations
• This presentation is intended to be introductory in nature• This series will address cost of capital issues related to both valuation
analyses and economic damages analyses• First, we will review six generally accepted cost of equity capital
models• Second, we will consider the component data requirements for these
cost of capital models• Third, we will review the data availability—and data limitations
(including measurement differences)—of commonly used cost of capital data sources.
• Finally, we will consider these sources and uses of data from the perspective of the “top ten” issues related to the cost of capital data.
3
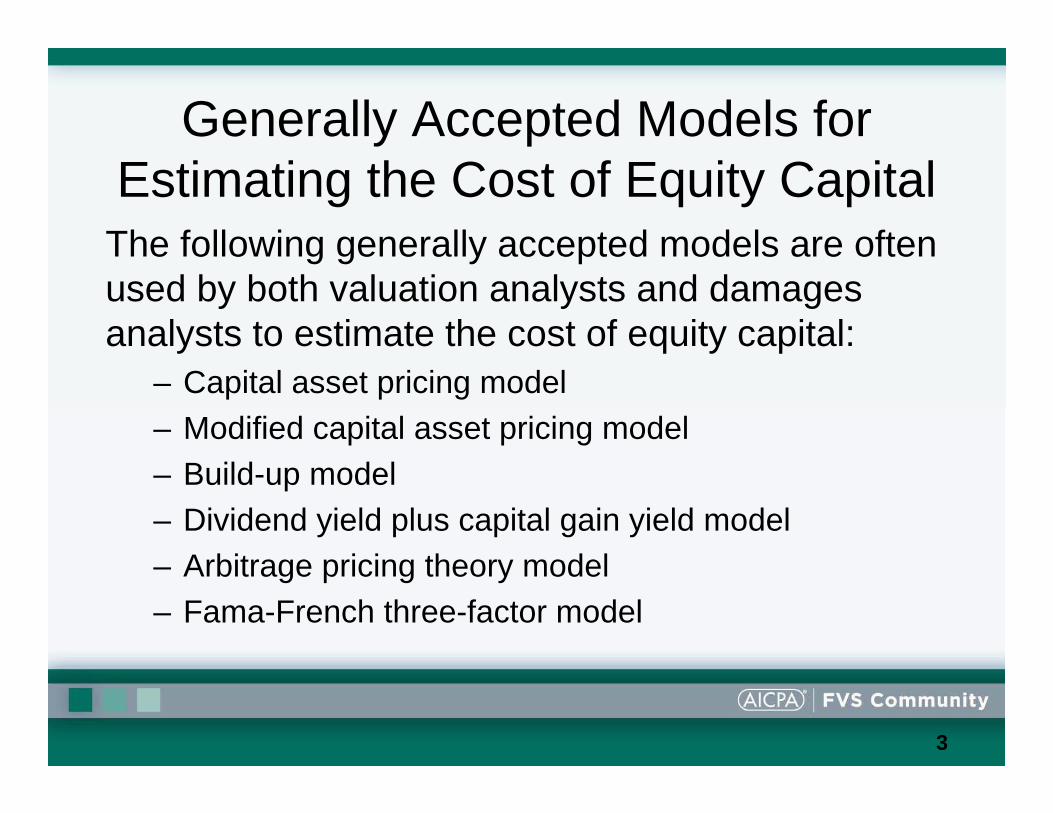
Generally Accepted Models for Estimating the Cost of Equity Capital
The following generally accepted models are often used by both valuation analysts and damages analysts to estimate the cost of equity capital:
– Capital asset pricing model– Modified capital asset pricing model– Build-up model– Dividend yield plus capital gain yield model– Arbitrage pricing theory model– Fama-French three-factor model

4
Capital Asset Pricing ModelThe original CAPM univariate formula for estimating the cost of capital for a liquid, diversified equity security is presented as follows:
Er = Rf + Bj (Rm − Rf)where:
Er = cost of equity capitalRf = risk-free rate of returnRm = expected overall rate of return for a broad-based
market portfolio of equity securitiesBj = beta coefficient of the subject publicly traded equity
security j

5
Modified Capital Asset Pricing Model
The generally accepted formula for the modified CAPM (or the MCAPM) is presented as follows:
Er = Rf + Bj (Rm − Rf) + Sp + άwhere:
Er = cost of equity capitalRf = risk-free rate of returnBj = estimate of appropriate beta for the subject
security jRm − Rf = long-term equity risk premium (measurement of
the overall equity market risk)Sp = small stock equity risk premiumά = company-specific equity risk premium
(measurement of other risk factors)

6
Build-up ModelThe generally accepted formula for the build-up model is presented as follows:
Er = Rf + (Rm − Rf) + Ip + Sp + άwhere:
Er = cost of equity capitalRf = risk-free rate of returnRm − Rf = long-term equity risk premium (measurement
of the overall equity market risk)Ip = industry adjustment equity risk premiumSp = small stock equity risk premiumά = company-specific equity risk premium
(measurement of other risk factors)

7
Dividend Yield plus Capital Gain Yield Model
The generally accepted formula for this cost of equity model (which is also called the DCF model) is presented as follows:
which is simplified to:
where: Er = cost of equity capitald1 = the current period dividend payment*P0 = the year ago stock/investment market price*P1 = the current date stock/investment market price*g = the expected long-term growth rate*
* for the subject publicly traded security or for a selected portfolio of guideline publicly traded securities
0
01
0
1P
PPPdEr −
+=
gPdEr +=
0
1
8
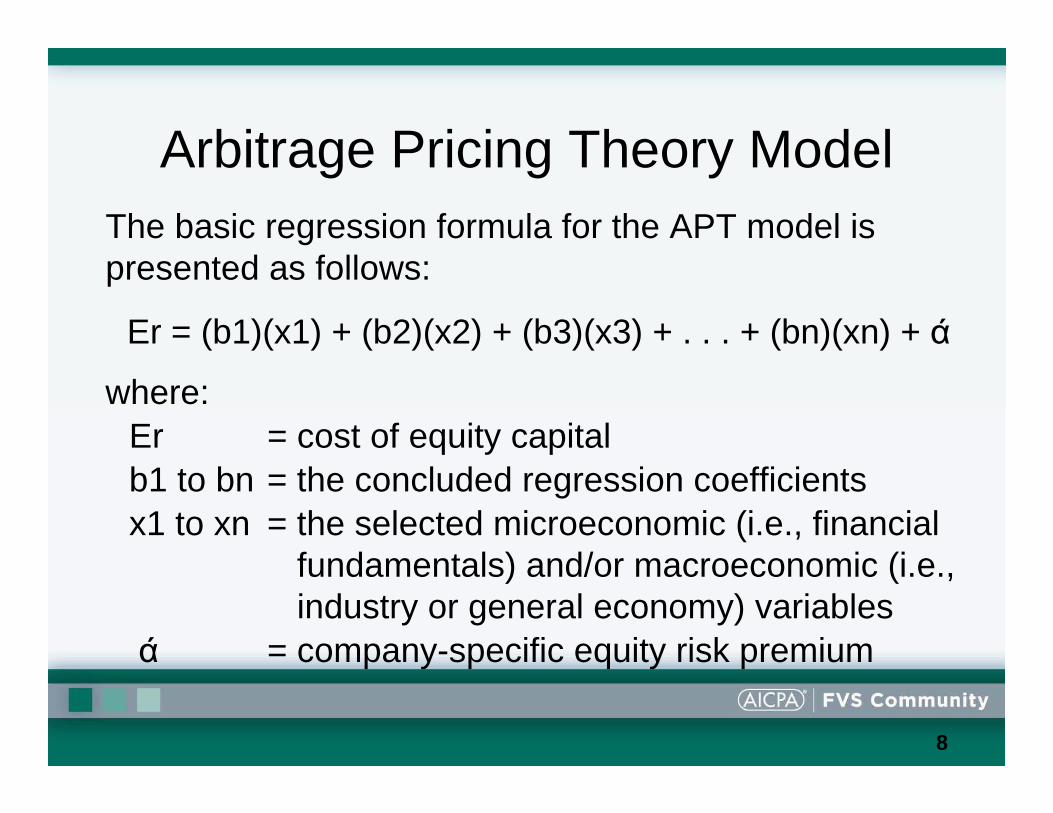
Arbitrage Pricing Theory ModelThe basic regression formula for the APT model is presented as follows:
Er = (b1)(x1) + (b2)(x2) + (b3)(x3) + . . . + (bn)(xn) + ά
where:Er = cost of equity capitalb1 to bn = the concluded regression coefficientsx1 to xn = the selected microeconomic (i.e., financial
fundamentals) and/or macroeconomic (i.e., industry or general economy) variables
ά = company-specific equity risk premium

9
Fama-French Three-Factor ModelThe generally accepted formula for this cost of equity model is:
Er = Rf + (Bj × ERP) + Sj × SMBP) + Hj × HMLP)
where:Er = cost of equity capitalRf = risk-free rate of returnBj = beta coefficient of publicly traded security jERP = long-term equity risk premiumSj = small-minus-big coefficient in the Fama-French regression equation SMBP = expected small-minus-big equity risk premiumHj = high-minus-low coefficient in the Fama-French regression equationHMLP = expected high-minus-low equity risk premium

10
Top Ten Issues Related to the Selection of Cost of Capital Data
• Risk-free rate of return measurement• Appropriate historical time period for the equity risk
premium• Size effect equity risk premium measurement• Beta measurement—levered or unlevered• Beta measurement—appropriate market proxy• Beta measurement—appropriate time period• Beta measurement—appropriate frequency of data
observations• Beta measurement—appropriate adjustment factors• Industry equity risk premium measurement• Company-specific equity risk premium measurement
11
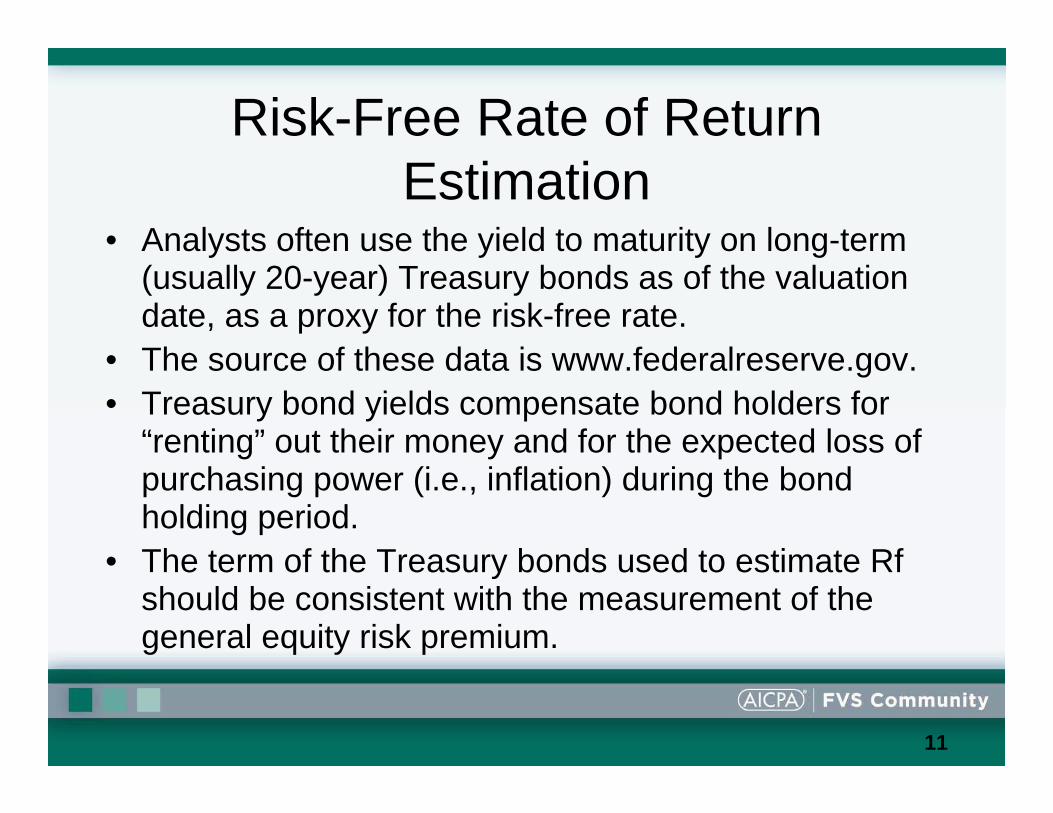
Risk-Free Rate of Return Estimation
• Analysts often use the yield to maturity on long-term (usually 20-year) Treasury bonds as of the valuation date, as a proxy for the risk-free rate.
• The source of these data is www.federalreserve.gov.• Treasury bond yields compensate bond holders for
“renting” out their money and for the expected loss of purchasing power (i.e., inflation) during the bond holding period.
• The term of the Treasury bonds used to estimate Rfshould be consistent with the measurement of the general equity risk premium.

12
Risk-Free Rate of Return Estimation (cont.)
• 20-year Treasury bond yields did decrease materially since October 2008, but they are now increasing.
Yield on 20-year (constant maturity) T-bonds2004 Average for 12 months 5.02%2005 Average for 12 months 4.62%2006 Average for 12 months 4.98%2007 Average for 12 months 4.87%2008 Average - first 8 months 4.52%2008 September 30 4.43%2008 October 31 4.78%2008 November 30 3.72%2008200920092009
December 31June 30 September 30December 31
3.03%4.30%4.02%4.58%
13
Risk-Free Rate of Return Estimation (cont.)
• It is unlikely that the 2008 decrease in the 20-year Treasury bond yield was due primarily to a decrease in inflation expectations.
• That decrease in yields is more likely a reflection of the “flight to quality” witnessed in financial markets as investors moved from risky assets into “risk-free” assets. That decrease in the Rf appears to have been a short-term aberration.
• During a recession, the use of a spot yield on Treasury bonds may cause analysts to underestimate a subject company’s actual cost of capital.
• As alternatives in a recession, analysts may elect to use (1) a longer-term average Treasury yield or (2) a forward rate of Treasury securities.
14
General Equity Risk Premium Differences
Appropriate Historical Time Period• Morningstar (Ibbotson) Stocks, Bonds, Bills and Inflation
Valuation Yearbook (SBBI) uses the time period of 1926 to the present to calculate the general equity risk premium. The Center for Research in Security Prices (the original source for these data) selected 1926 as the starting date for several reasons:– Quality financial data became available beginning about 1926– One full business cycle of data is included before the stock
market crash of 1929– A conscious effort was made to include the period of extreme
market volatility in the 1920s and 1930s

15
General Equity Risk Premium Differences (cont.)
Appropriate Historical Time Period• The Duff & Phelps, LLC, Risk Premium
Report uses the time period of 1963 to the present to calculate the historical size-adjusted equity risk premiums.
• Duff & Phelps uses the Standard & Poor’s Compustat data in addition to the CSRP data, and Compustat was established in 1963.

16
General Equity Risk Premium Differences (cont.)
Incorporating the size effect equity risk premium:• Morningstar (Ibbotson) SBBI provides data
regarding the difference between (1) the total equity risk premium returns for all public companies and (2) the equity risk premium returns realized by smaller, more thinly capitalized companies.
• SBBI disaggregates the NYSE/AMEX/Nasdaq into ten size deciles based on market capitalization.
• The size-related equity risk premium can then be added to the overall equity risk premium.
17
General Equity Risk Premium Differences (cont.)
Incorporating the size effect risk premium (cont.)• Duff & Phelps, LLC, uses eight different
measures of size, including these fundamental financial characteristics: market value of equity, book value of equity, market value of invested capital, 5-year average net income, total assets, 5-year average EBITDA, sales, and number of employees.
• The Duff & Phelps Risk Premium Report presents a smoothed average historical equity risk premium for each size category.

18
General Equity Risk Premium Differences (cont.)
19
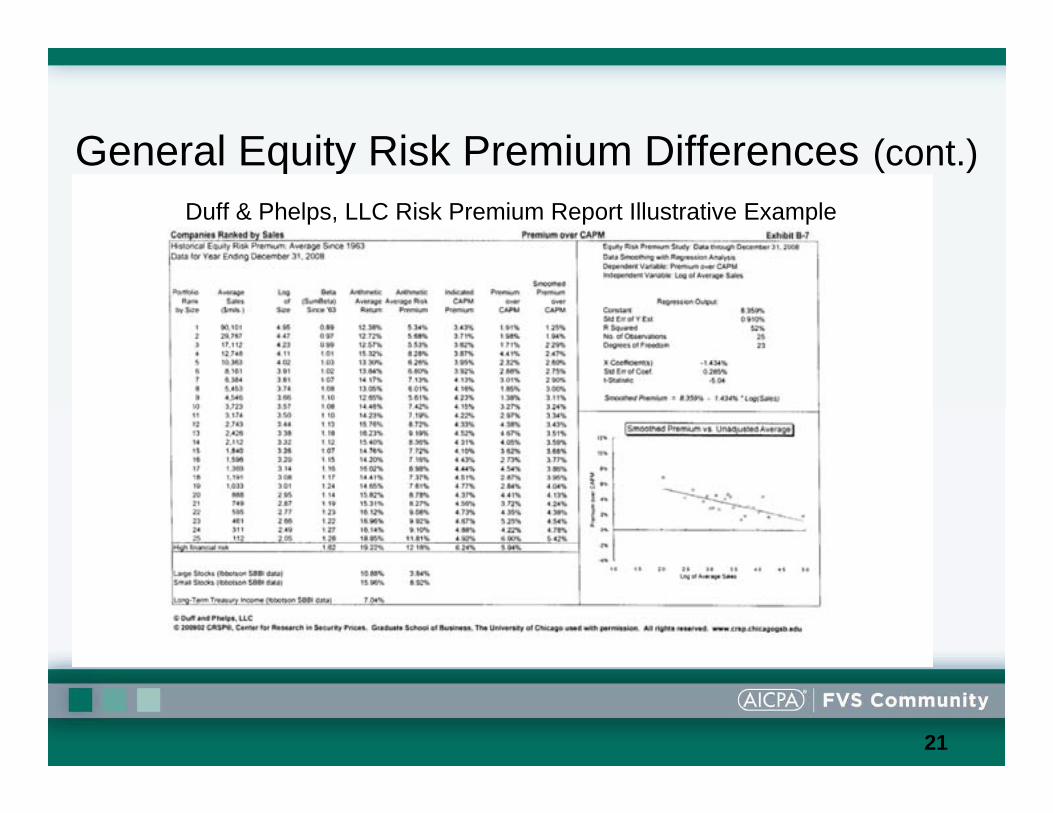
General Equity Risk Premium Differences (cont.)Duff & Phelps, LLC Risk Premium Report Illustrative Example (cont.)
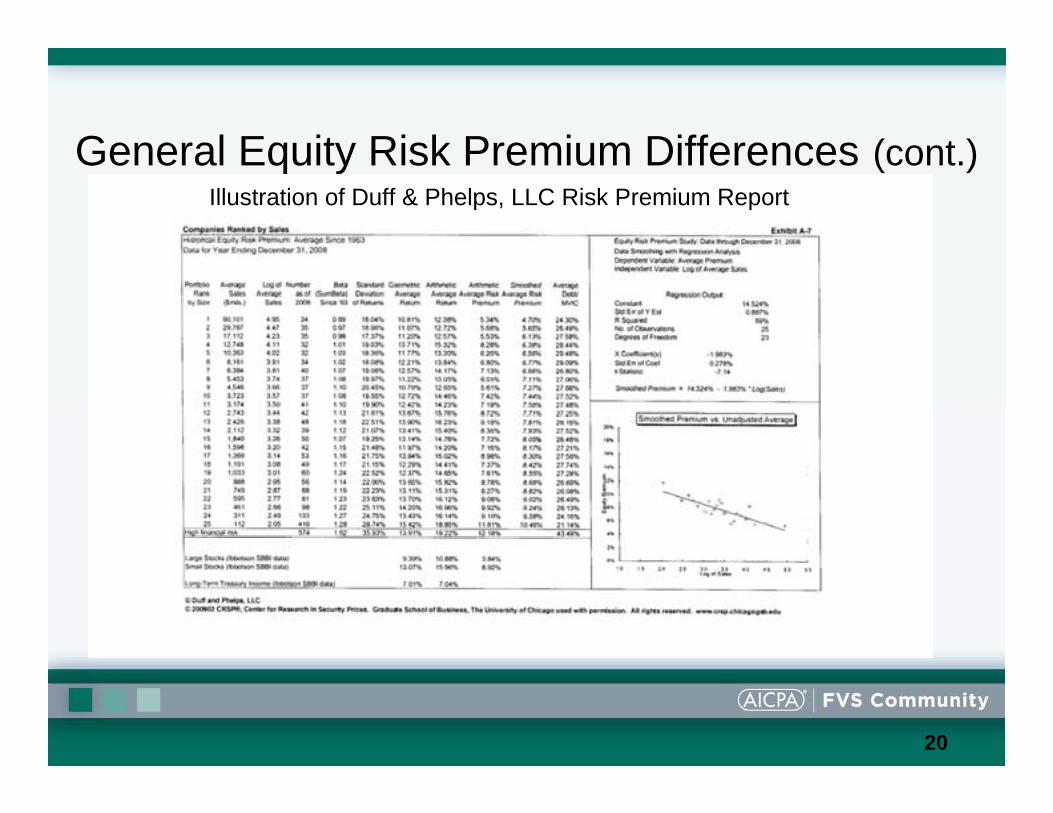
20
General Equity Risk Premium Differences (cont.)Illustration of Duff & Phelps, LLC Risk Premium Report
21
General Equity Risk Premium Differences (cont.)Duff & Phelps, LLC Risk Premium Report Illustrative Example

22
Beta—Use of Levered or Unlevered Beta?
• Levered beta—measures the systematic risk for the equity shareholders of the company. It incorporates both the business and financing risk undertaken by the company and borne by the equity shareholders.
• Unlevered beta—also called an “asset beta”—removes the company’s financing decision from the beta calculation and reflects only the company business risk.

23
Unlevered BetaThe generally accepted formula for unlevering a beta is presented as follows:
where:βUi = the unlevered beta for company iβLi = the levered beta for company iDi = total debt capitalization for company iEi = total equity capitalization for company iti = marginal income tax rate for company i
)1(1 ii
i
Li
Ui tED
−+=
ββ

24
Relevered Beta
• The unlevered beta can then be releveredusing either (1) the subject company’s actual capital structure or (2) an industry-average capital structure.
• The generally accepted formula for revering a beta is presented as follows:
⎥⎦
⎤⎢⎣
⎡−+β=β )t1(
ED
1 ii
iUiLi

25
Beta—Common Sources of Beta Data
• Bloomberg• Compustat• Capital IQ• ValueLine• Morningstar (Ibbotson) Beta Book• Morningstar (Ibbotson) Cost of Capital
Book (for industry betas)• the Barra Beta Book

26
Beta—Common Sources of Data—Bloomberg

27
Beta—Common Sources of Data—Bloomberg

28
Beta—Common Sources of Data—Compustat

29
Beta—Common Sources of Data—Capital IQ
30
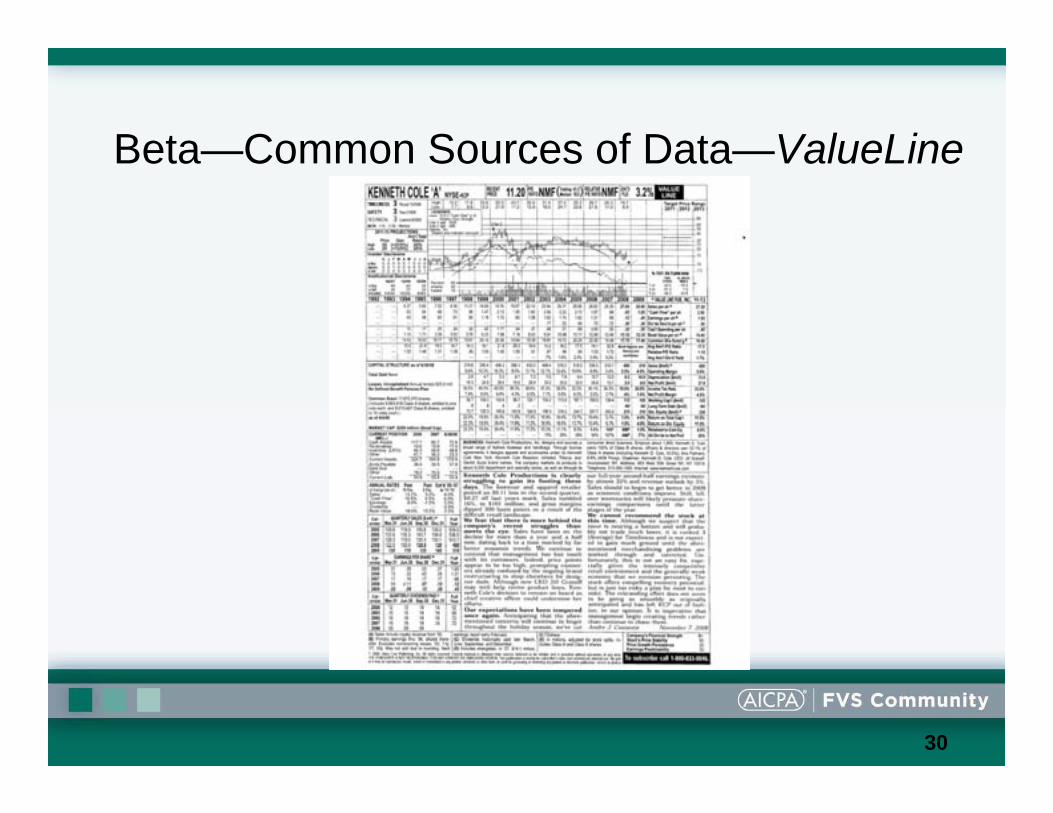
Beta—Common Sources of Data—ValueLine

31
Beta—Common Sources of Data—Morningstar (Cost of Capital Book)

32
Beta—Common Sources of Data—Barra Beta Book

33
Differences in the Various Beta Data Sources
Measurement of the Market Proxy• Bloomberg allows for the selection of over 20
domestic series (the default is the S&P 500)• Compustat uses the S&P 500• Capital IQ allows for the selection of 8 domestic
series (the default is the S&P 500)• Morningstar (Ibbotson) uses the S&P 500• ValueLine uses the NYSE Composite Series• Barra Beta Book calculates predicted betas
(forward-looking)
34
Differences in the Various Beta Data Sources (cont.)
Beta Measurement Time Period• Bloomberg time period is adjustable (the
default is two years)• Compustat uses five years• Capital IQ time period is adjustable (the
default is two years)• Morningstar (Ibbotson) uses five years• ValueLine uses five years

35
Differences in the Various Beta Data Sources (cont.)
Frequency of the Data Observations• Bloomberg is adjustable (the default is
weekly)• Compustat is monthly• Capital IQ has a choice of either weekly or
monthly (the default is weekly)• Morningstar (Ibbotson) is monthly• ValueLine is weekly

36
Differences in the Various Beta Data Sources (cont.)
Beta Normalization Adjustment Factors• Bloomberg is (0.67 × unadjusted beta) + (0.33
× 1.0)• Compustat is unadjusted• Capital IQ is unadjusted• Morningstar (Ibbotson) is adjusted toward the
peer group beta weighted by the statistical significance
• ValueLine is 0.35 + (0.67 × unadjusted beta)
37
Industry Equity Risk Premium
• Industry risk can be incorporated into the modified CAPM or the build-up model
• Industry risk can be incorporated through the beta in the modified CAPM model
• Industry betas can be found in the Morningstar (Ibbotson) Cost of Capital Yearbook. The Yearbook provides a levered raw beta, an adjusted beta, and an unlevered adjusted beta for numerous industries.
38
Industry Equity Risk Premium (cont.)
• In the build-up model, the industry risk premium can be incorporated using the Morningstar Stocks, Bonds, Bills and Inflation Valuation Yearbook.
• The industry equity risk premium has been published in SBBI since 2000.
• The criteria used to select companies for inclusion in the SBBI industry risk premium calculation are:– At least 36 months of return data available.– Sales greater than $1 million.– Market capitalization equal to or greater than $10,000.
• An industry must have at least five companies that meet the above criteria in order to be included in SBBI.
39
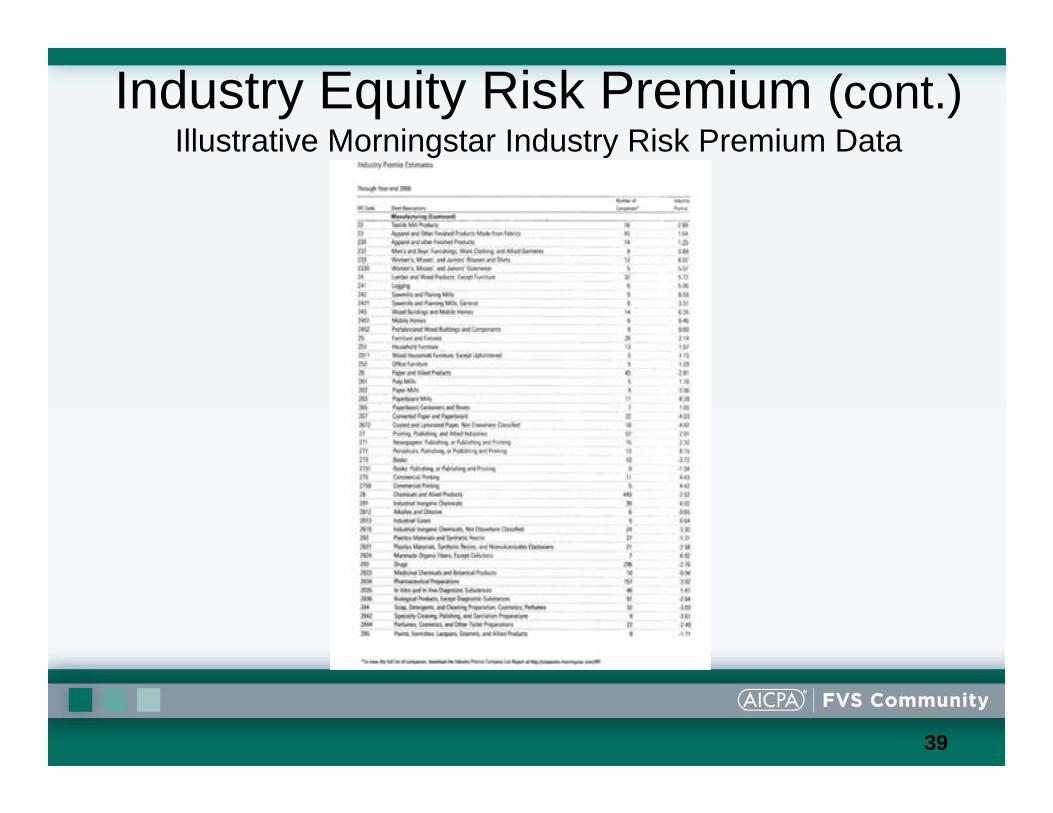
Industry Equity Risk Premium (cont.)Illustrative Morningstar Industry Risk Premium Data

40
Company-Specific Equity Risk Premium
• The company-specific risk premium is typically estimated by the analyst using his or her professional judgment.
• There are, however, several sets of “factors” that the analyst may consider when estimating the company-specific equity risk premium:– the Black/Green factors– the Warren Miller factors– the Gary Trugman factors
41
Company-Specific Risk Premium (cont.)
Black/Green FactorsParnell Black and Robert Green (of Black/Green & Company) have suggested a set of CSRP factors for the valuation analyst’s consideration. The various Black/Green CSRP factors are summarized in the following six categories:
– competition– financial strength– management ability and depth– profitability and stability of earnings– national economic effects– local economic effects
42
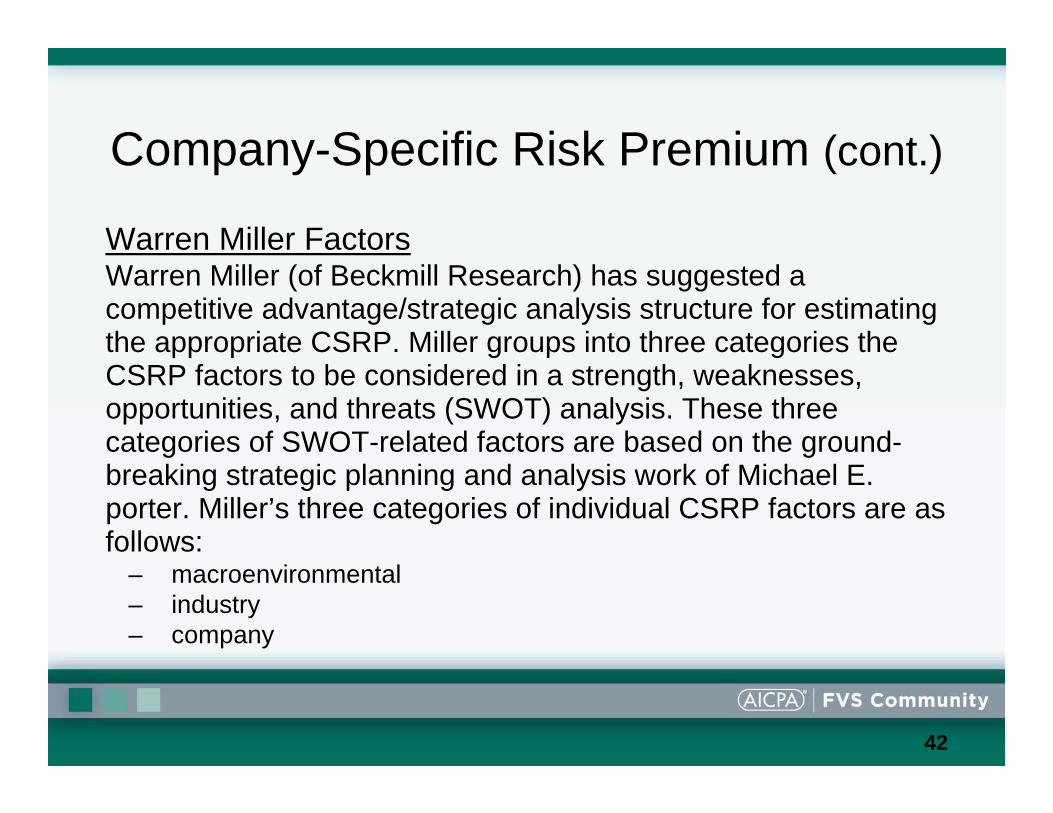
Company-Specific Risk Premium (cont.)
Warren Miller FactorsWarren Miller (of Beckmill Research) has suggested a competitive advantage/strategic analysis structure for estimating the appropriate CSRP. Miller groups into three categories the CSRP factors to be considered in a strength, weaknesses, opportunities, and threats (SWOT) analysis. These three categories of SWOT-related factors are based on the ground-breaking strategic planning and analysis work of Michael E. porter. Miller’s three categories of individual CSRP factors are as follows:
– macroenvironmental– industry– company

43
Company-Specific Risk Premium (cont.)
Warren Miller Factors (cont.)Within the general framework of Porter’s competitive strategy analysis, the Miller macroenvironmental considerations include the following individual factors:
– economic– political– international– demographic– technological sociocultural

44
Company-Specific Risk Premium (cont.)
Warren Miller Factors (cont.)Miller also suggests that the analyst study the subject corporation’s competitive position within the subject industry. The Miller industry considerations include the following factors:
– defining the industry– determining market structure– estimating relative market shares– applying the Michael Porter “five-forces
framework”

45
Company-Specific Risk Premium (cont.)
Gary Trugman FactorsTrugman presents three categories of individual CSRP factors. Trugman’s first category of CSRP considerations relates to the following risk factors:
10. legal risk5. regulatory risk9. technological risk4. market risk8. product risk3. asset risk7. financial risk2. operating risk6. business risk1. economy risk

46
Company-Specific Risk Premium (cont.)
Gary Trugman Factors (cont.)Trugman’s second category of CSRP considerations relates to the following nonfinancial factors:– economic conditions– location of business– depth of management– barriers to entry into market– industry conditions– competition– quality of management
47
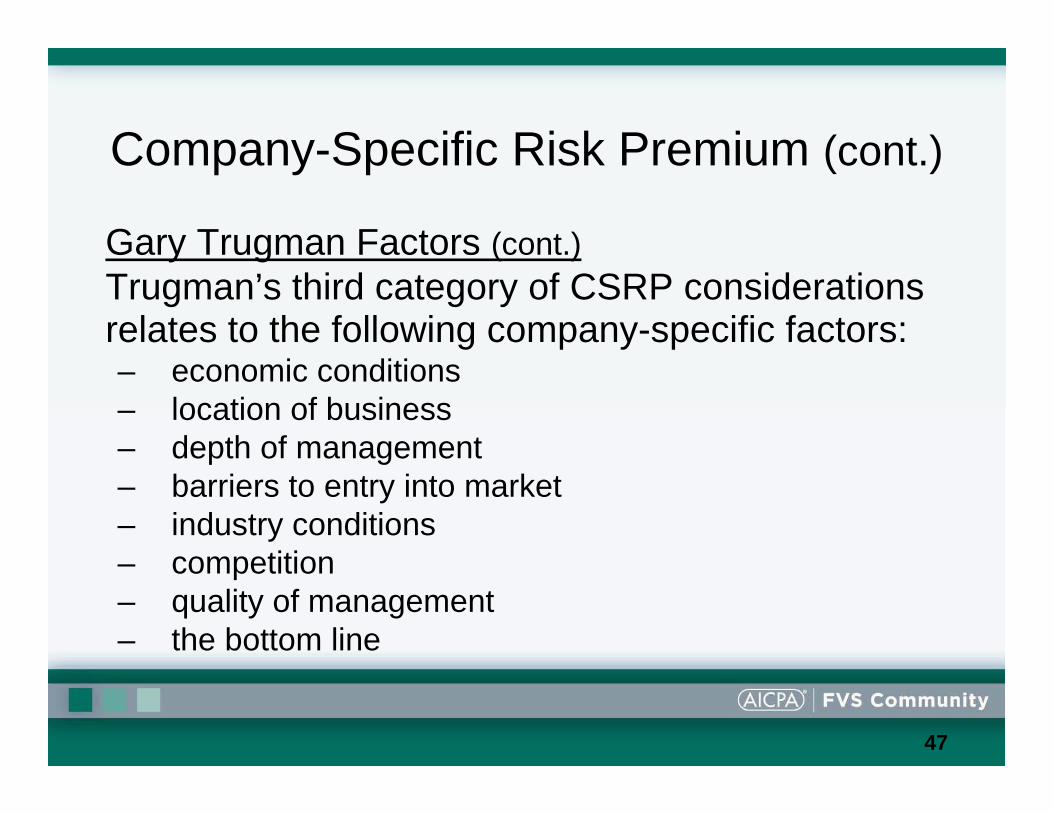
Company-Specific Risk Premium (cont.)
Gary Trugman Factors (cont.)Trugman’s third category of CSRP considerations relates to the following company-specific factors:– economic conditions– location of business– depth of management– barriers to entry into market– industry conditions– competition– quality of management– the bottom line
48
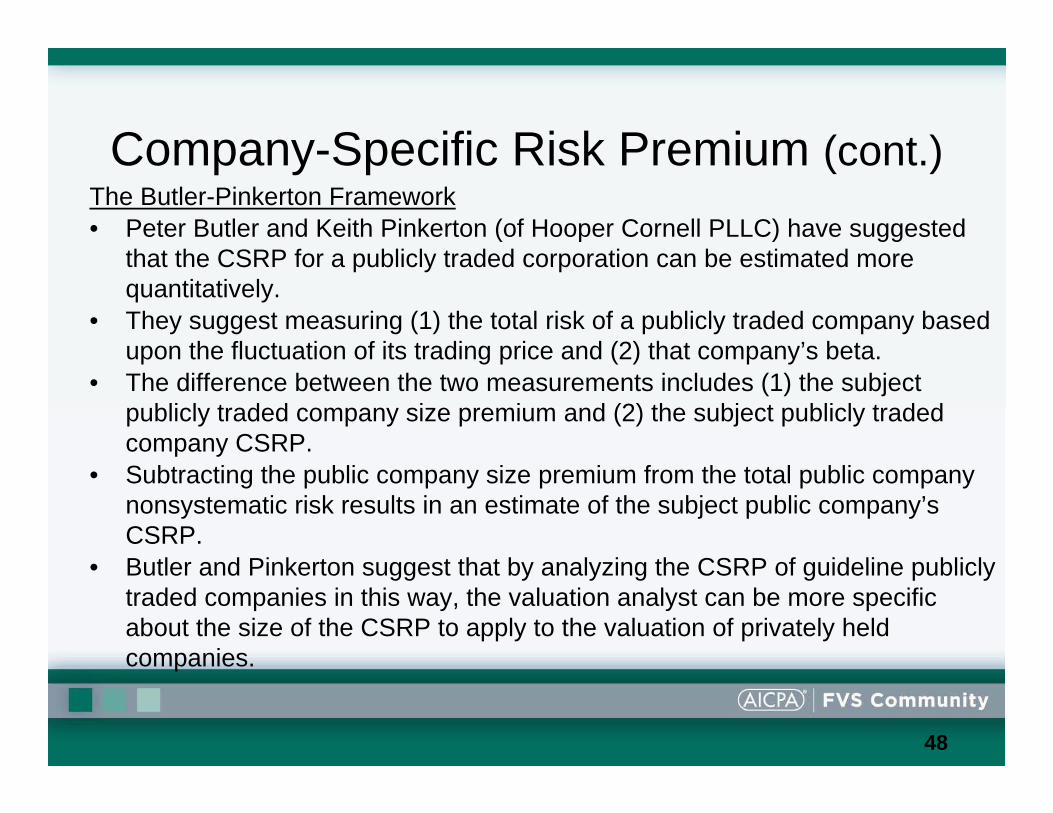
Company-Specific Risk Premium (cont.)The Butler-Pinkerton Framework• Peter Butler and Keith Pinkerton (of Hooper Cornell PLLC) have suggested
that the CSRP for a publicly traded corporation can be estimated more quantitatively.
• They suggest measuring (1) the total risk of a publicly traded company based upon the fluctuation of its trading price and (2) that company’s beta.
• The difference between the two measurements includes (1) the subject publicly traded company size premium and (2) the subject publicly traded company CSRP.
• Subtracting the public company size premium from the total public company nonsystematic risk results in an estimate of the subject public company’s CSRP.
• Butler and Pinkerton suggest that by analyzing the CSRP of guideline publicly traded companies in this way, the valuation analyst can be more specific about the size of the CSRP to apply to the valuation of privately held companies.
49
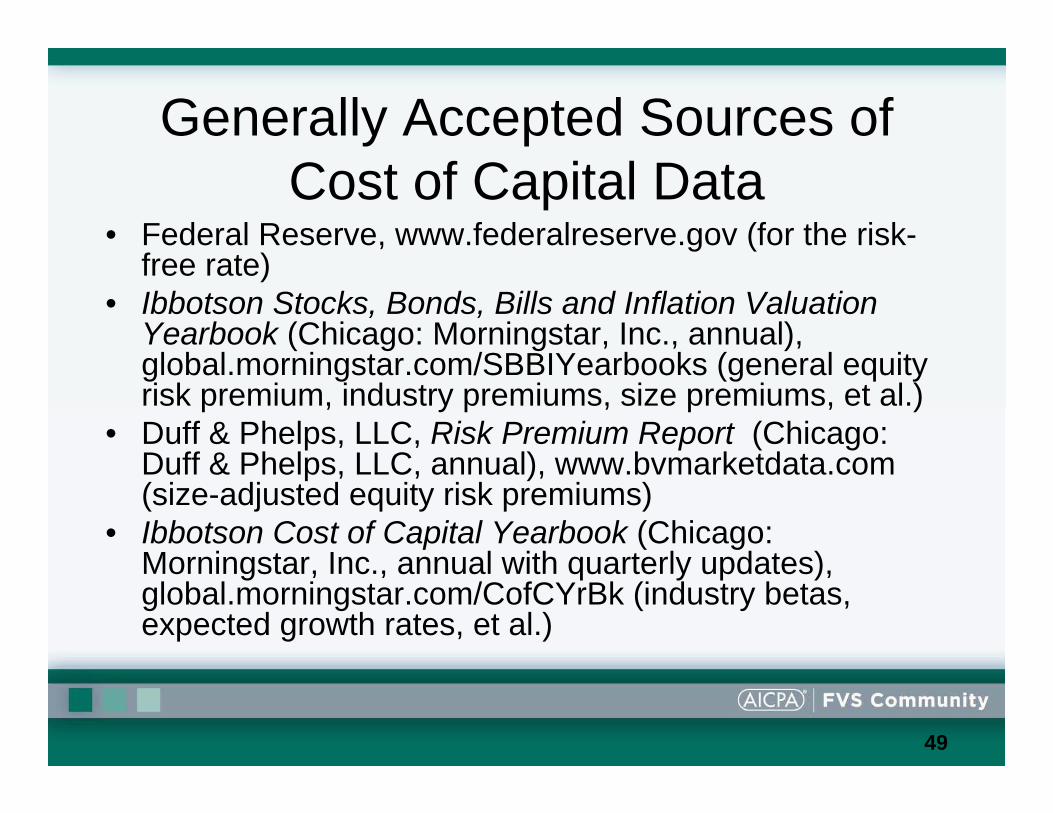
Generally Accepted Sources of Cost of Capital Data
• Federal Reserve, www.federalreserve.gov (for the risk-free rate)
• Ibbotson Stocks, Bonds, Bills and Inflation Valuation Yearbook (Chicago: Morningstar, Inc., annual), global.morningstar.com/SBBIYearbooks (general equity risk premium, industry premiums, size premiums, et al.)
• Duff & Phelps, LLC, Risk Premium Report (Chicago: Duff & Phelps, LLC, annual), www.bvmarketdata.com(size-adjusted equity risk premiums)
• Ibbotson Cost of Capital Yearbook (Chicago: Morningstar, Inc., annual with quarterly updates), global.morningstar.com/CofCYrBk (industry betas, expected growth rates, et al.)
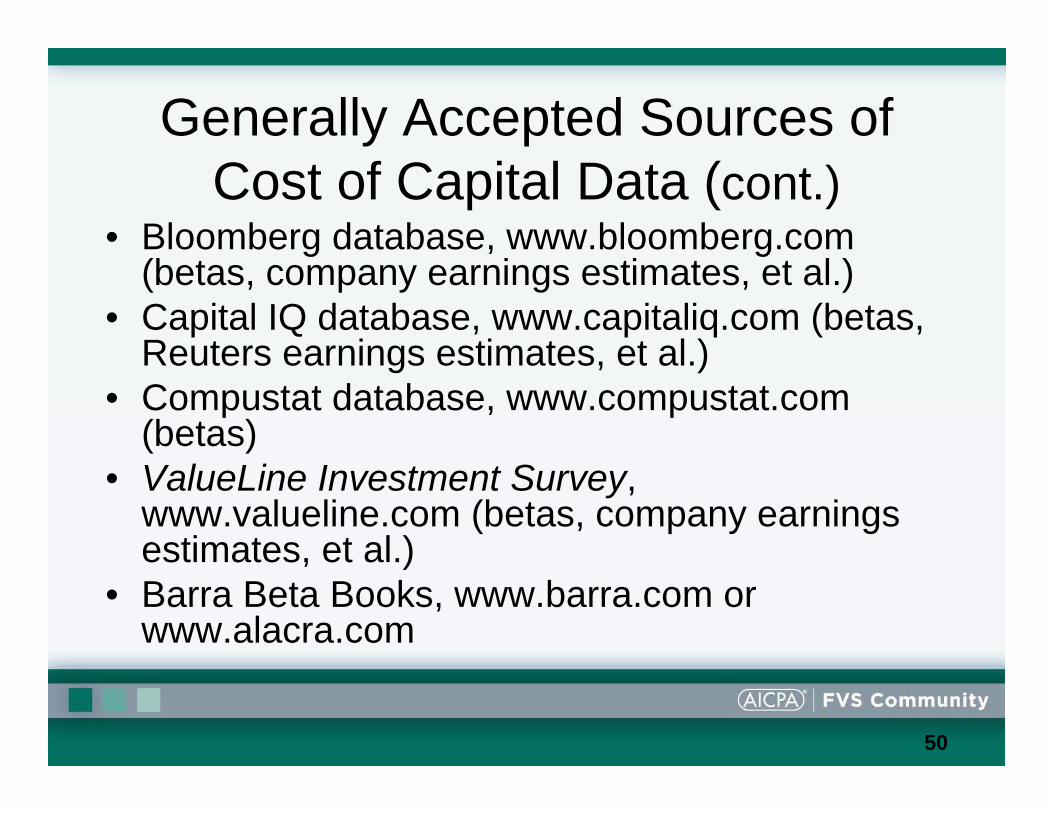
50
Generally Accepted Sources of Cost of Capital Data (cont.)
• Bloomberg database, www.bloomberg.com(betas, company earnings estimates, et al.)
• Capital IQ database, www.capitaliq.com (betas, Reuters earnings estimates, et al.)
• Compustat database, www.compustat.com(betas)
• ValueLine Investment Survey, www.valueline.com (betas, company earnings estimates, et al.)
• Barra Beta Books, www.barra.com or www.alacra.com
51
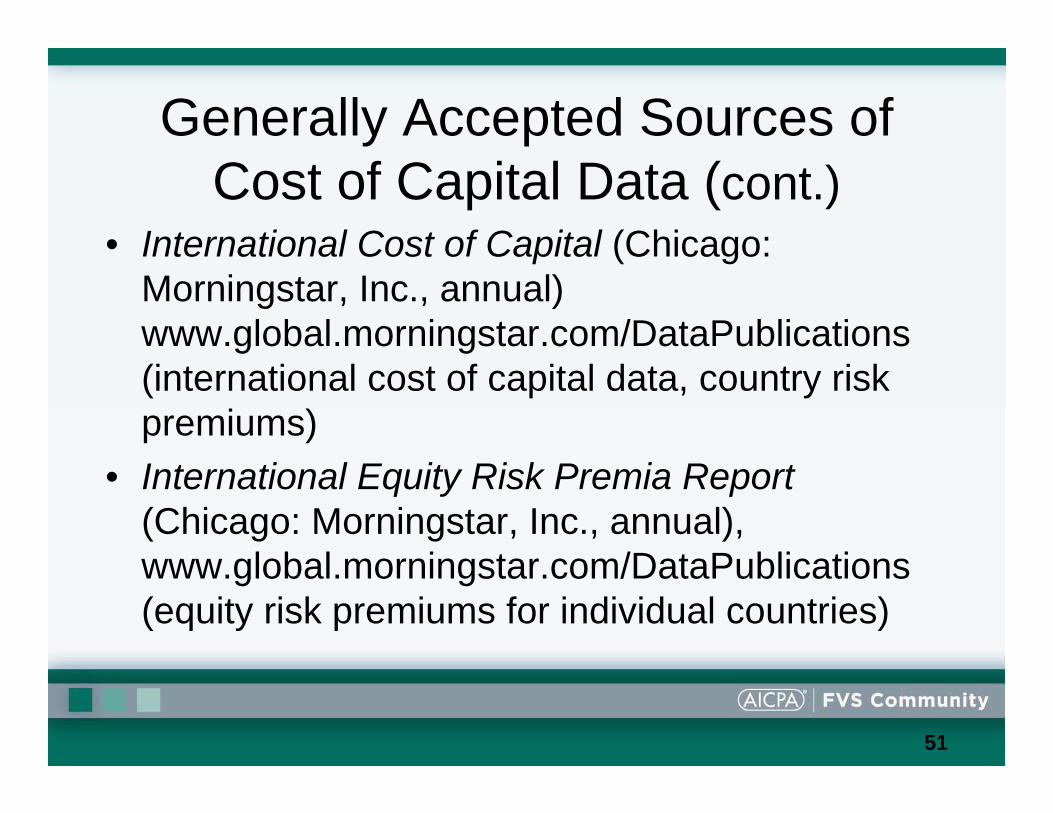
Generally Accepted Sources of Cost of Capital Data (cont.)
• International Cost of Capital (Chicago: Morningstar, Inc., annual) www.global.morningstar.com/DataPublications(international cost of capital data, country risk premiums)
• International Equity Risk Premia Report(Chicago: Morningstar, Inc., annual), www.global.morningstar.com/DataPublications(equity risk premiums for individual countries)

52
Morningstar—International Equity Risk Premia Report

53
Morningstar—International Cost of Capital Report

54
Sources and Uses of Available Cost of Capital Data
Summary and Conclusion• This is the first in a series of AICPA FVS cost of capital
Webinar series presentations.• Both valuation analysts and damages analysts should be
familiar with the various sources of data that may be used for estimating the various cost of capital components.
• Analysts should know the differences between these generally accepted sources of data—in order to select the best source of data for the particular subject valuation or damages analysis.
• This presentation summarized some of these cost of capital data source differences.
• Questions and discussion