source water assessment report - kdhe · source water assessment report public water supply: ngpl...
TRANSCRIPT
Source Water Assessment Report
Public Water Supply: NGPL − HEIZER
Assessment Areas Include:376, 377
Kansas Department of Health and EnvironmentBureau of Water Watershed Management Section
1000 SW Jackson St., Suite 420Topeka, KS 66612−1367
Burns &McDonnell9400 Ward Parkway
Kansas City, MO 64114
Kansas Geological Survey University of Kansas1930 Constant Ave.Lawrence, KS 66047
Reports were generated with the Automated Source Water Assessment Tool (ASWAT). Assessments werecompleted online using ASWAT by hundreds of state employees, public water supply staff, and technicalassistant providers throughout the State of Kansas.
Source Water Assessment Report November 24, 2003 1

Table Of ContentsReport Description
Assessment Area 376 1.0
Executive Summary 1.1
Potential Sources 1.2
Added Sources 1.3
Potential Contaminants Summary 1.4
Potential Contaminants Listing 1.5
Protection Measures 1.6
Assessment Analysis 1.7
Site Comments 1.8
Added Site Comments 1.9
Analysis Question Comments 1.10
Assessment Area 377 2.0
Executive Summary 2.1
Potential Sources 2.2
Added Sources 2.3
Potential Contaminants Summary 2.4
Potential Contaminants Listing 2.5
Protection Measures 2.6
Assessment Analysis 2.7
Site Comments 2.8
Added Site Comments 2.9
Analysis Question Comments 2.10
Source Water Assessment Report November 24, 2003 2

Report Description
Detailed Explanation of Entire Report:
The 1996 amendments to the Safe Drinking Water Act require each state to develop a Source WaterAssessment Program (SWAP) and a Source Water Assessment (SWA) for each Public Water Supply (PWS)that treats and distributes raw source water. In Kansas there are 761 public water supplies that requireSWAs. A SWA includes a delineation of the source water assessment area, an inventory of potentialcontaminant sources, and a susceptibility analysis.
A PWS can consist of one or more individual assessment areas that require different assessments. In general,an assessment area is delineated at a two−mile fixed radius for a groundwater well. A surface water intakeassessment area is the upstream−drainage area (watershed), inside the state border. Additionally, anassessment area can consist of an individual well, group of wells, an individual surface water intake, ormultiple surface water intakes.
After each assessment is completed a report is automatically generated using an Internet−based applicationcalled the Automated Source Water Assessment Tool (ASWAT). The individual assessment reports combineto form the entire SWA report for a PWS.
A map of each Assessment Area was also generated with ASWAT. However, for security reasons the mapsare not included in this report. To obtain a copy of the map(s), please contact your local PWS.
All PWS reports will be available for viewing and downloading on KDHE's Watershed Management Sectionwebsite(http://www.kdhe.state.ks.us/nps) in 2004.
NGPL − HEIZER Summary:
AA Type Diversion Id
376 Ground water multiple wells 001, 002, 004
377 Ground water single well 003
Source Water Assessment Report November 24, 2003 3

Public Water Supply:NGPL − HEIZER
Assessment Area: 376
Diversion Id's: 001, 002, 004
Status: Accepted
Submit Date: 2003−09−02 13:25:55
Executive Summary:
The Executive Summary gives the assessment area's Susceptibility Likelihood Score (SLS) for eachcontaminant of concern category.
SLS indicates which contaminant category is most likely to impact a given public water supply.Contaminants of concern for groundwater include microbiological, inorganic compounds, nitrates, syntheticorganic compounds, pesticides, and volatile organic compounds. Contaminants of concern for surface waterinclude microbiological, inorganic compounds, eutrophication − phosphorus, sedimentation, syntheticorganic compounds, pesticides, and volatile organic compounds.
To determine the assessment area's susceptibility to contamination, a qualitative (semi−quantitative)screening level susceptibility analysis was designed that utilizes general assumptions and best professionaljudgement. It is a systematic procedure comprised of simple yes/no questions. Each question in thesusceptibility analysis focuses on the presence or absence of potential pollution sources in the assessmentarea. SLS is most useful in helping the Public Water Supply (PWS) focus on water quality protection actionstowards a contaminant category of concern. For example, if the SLS for microbiological contamination ishigh, relative to volatile organic compounds (VOC), water supply protection planners would conclude thatthe attention should be directed towards microbiological contaminant sources rather than VOC sources.
Source Water Assessment Report November 24, 2003 4

Executive Summary
Public Water Supply: NGPL − HEIZERAssessment Area: 376
Susceptibility Likelihood Scores for Assessment Area
Contaminant Category A B B* C C* D
Susceptibility Likelihood Score − SLS 41 38 45 44 45 46SLS Range Low Low Low Low Low Low
A − Microbiolgical
B* − Nitrates
C* − Pesticides
B − Inorganic Compounds
C − Synthetic Organic Compounds
D − Volatile Organic Compounds
Susceptibility Likelihood Range
SLS Range
0−50 Low Susceptibility
51−80 Moderate Susceptibility
81−100 High Susceptibility
Source Water Assessment Report November 24, 2003 5

Public Water Supply:NGPL − HEIZER
Assessment Area: 376
Diversion Id's: 001, 002, 004
Status: Accepted
Submit Date: 2003−09−02 13:25:55
Potential Sources:
The Potential Sources section lists all the sites that have been identified as potential sources ofcontamination.
Potential sources of contamination may include land uses, industry, or businesses that could generate orstore chemicals/substances that could potentially contaminate the water supply only if released into theenvironment. Both unregulated sites from business location databases and regulated sites from variousKDHE databases were compiled. Additional sites could have been added by an evaluator through theassessment process to supplement the original data.
The 1987 Standard Industrial Classifications (SIC) were used to identify potential contaminate sites. TheSIC system classifies establishments into industries on the basis of the primary activities of theestablishment.
Each assessment area is delineated with 3 assessment zones. These zones can be used to get a generalunderstanding of the potential influence sites have based on proximity to the water supply. Zone A isa100−foot radius around a groundwater well and a 1000−foot radius around a surface water intake. Zone Bis a 2000−foot radius around wells and a hydrological delineated buffer around the surface water sources.Zone C is a 2−mile radius around wells and the balance of the watershed for intakes. The potential sourceslisted in this section are sorted to show all the potential sources in Zone A first, Zone B second, and Zone Cthird.
Although a facility or business is identified in the study as a potential concern, it does not necessarilymean a release or spill has occurred. Contamination could only occur if certain chemical substancesare released into the environment and filter into the water supply source.
The data for the potential sources of contamination was compiled from May through August in 2002. Someof the databases used were incomplete datasets that are continually being updated. Due to theincompleteness, inaccuracies, and new development, it is possible that sources of potential contaminationthat are in the assessment area are not included in the report. Inaccurate locations could also cause sources toshow up in the assessment area that are not actually in the assessment. Additionally, duplication between thedatasets could cause sites to show up multiple times in the assessment area.
Source Water Assessment Report November 24, 2003 6

Potential Sources
Public Water Supply: NGPL − HEIZERAssessment Area: 376
Unregulated Potential Site Sources
Did Not Contain Any Of These Potential Site Sources
Regulated Confined Animal Feeding Operations Potential Site Sources
Did Not Contain Any Of These Potential Site Sources
Regulated Hazardous Waste Potential Site Sources
Did Not Contain Any Of These Potential Site Sources
Regulated Leaking Storage Tank Potential Site Sources
Did Not Contain Any Of These Potential Site Sources
Regulated Identified Contaminated Potential Site Sources
Source No. Source Name ID/Permit No. Zone
7000877NATURAL GAS PIPELINE POND CLOSURE (EVAPORATIONPON
C600570059 C
Source Water Assessment Report November 24, 2003 7

Regulated Solid Waste Potential Site Sources
Did Not Contain Any Of These Potential Site Sources
Regulated Waste Water Potential Site Sources
Did Not Contain Any Of These Potential Site Sources
Source Water Assessment Report November 24, 2003 8

Public Water Supply:NGPL − HEIZER
Assessment Area: 376
Diversion Id's: 001, 002, 004
Status: Accepted
Submit Date: 2003−09−02 13:25:55
Added Sources:
The Added Sources section lists all the sites that have been added as potential sources of contamination byan evaluator through the assessment process to supplement the original data.
The potential sources listed in this section are sorted to show the added potential sources in Zone A first,Zone B second, and Zone C third.
Although a facility or business was added as a potential concern, it does not necessarily mean a releaseor spill has occurred. Contamination could only occur if certain chemical substances are released intothe environment and filter into the water supply source.
Source Water Assessment Report November 24, 2003 9

Added Sources
Public Water Supply: NGPL − HEIZERAssessment Area: 376
Added Potential Site Sources
Source No. Source Name SIC ID Zone
Did Not Add Any Site Sources
Source Water Assessment Report November 24, 2003 10

Public Water Supply:NGPL − HEIZER
Assessment Area: 376
Diversion Id's: 001, 002, 004
Status: Accepted
Submit Date: 2003−09−02 13:25:55
Potential Contaminants Summary:
The Contaminants Summary shows the number of identified unregulated sources in the assessment area foreach contaminant of concern category.
In order to obtain the number or sources for each category, a relationship was correlated between eachStandard Industrial Classification (SIC) and the contaminant of concern categories. Each SIC was assessedand associated with contaminant categories. For example, if not managed properly, a car wash (SIC 7542)could potentially contaminate an intake because of inorganic compounds (IOC) and volatile organiccompounds (VOC); thus, a car wash is associated with IOCs and VOCs.
A chart displays a count for each contaminant category. The sum for each category represents the totalnumber of identified sources that have been associated with that particular contaminant category. However,the total number of identified sources does not include contaminants from the Added Sources. In ourexample, a car wash would be considered 2 sources of contamination. It would be a potential source ofcontamination for IOCs and for VOCs; thus, 1 would be added to the total number of sources in the VOCcategory and 1 would be added to the IOC category.
Source Water Assessment Report November 24, 2003 11
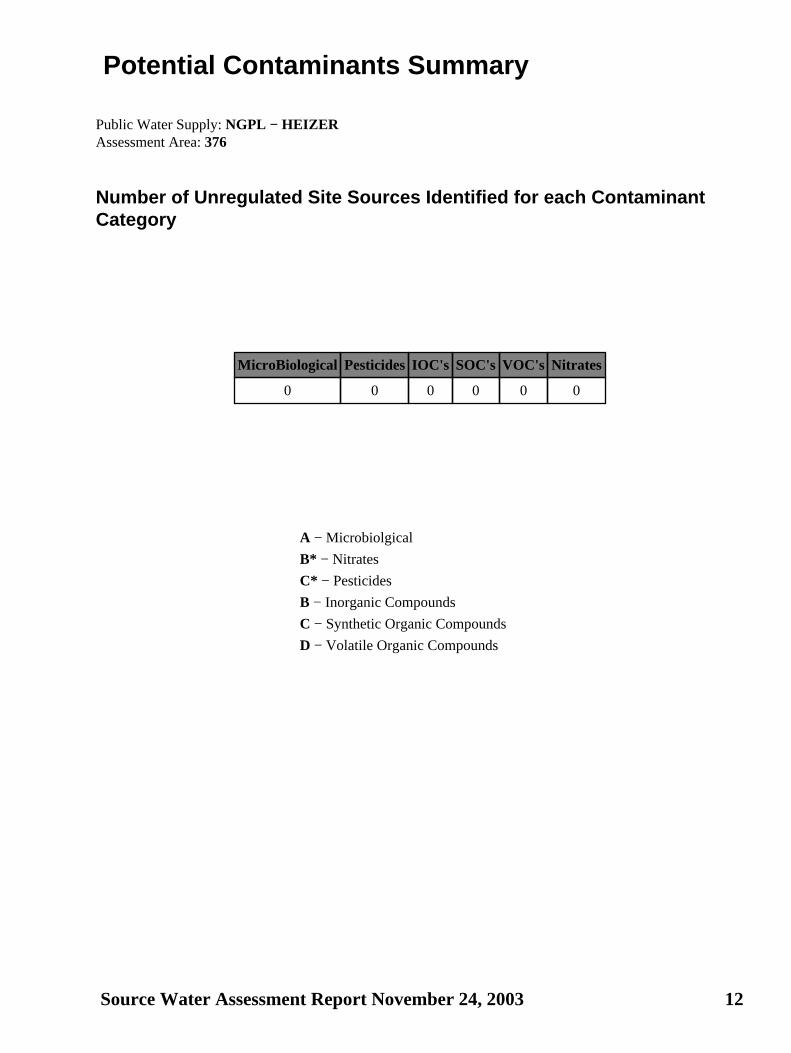
Potential Contaminants Summary
Public Water Supply: NGPL − HEIZERAssessment Area: 376
Number of Unregulated Site Sources Identified for each ContaminantCategory
MicroBiological PesticidesIOC's SOC's VOC's Nitrates
0 0 0 0 0 0
A − Microbiolgical
B* − Nitrates
C* − Pesticides
B − Inorganic Compounds
C − Synthetic Organic Compounds
D − Volatile Organic Compounds
Source Water Assessment Report November 24, 2003 12

Public Water Supply:NGPL − HEIZER
Assessment Area: 376
Diversion Id's: 001, 002, 004
Status: Accepted
Submit Date: 2003−09−02 13:25:55
Potential Contaminants Listing:
The Potential Contaminants section lists the contaminant of concern category associated with each StandardIndustrial Classification (SIC) found in an assessment area. A complete list of contaminant category codesare located at the bottom of this page.
The relationships defined between the Standard Industrial Classifications (SIC) and the contaminant ofconcern categories are displayed in a table format. Using our car wash example, the relationships can bebetter illustrated. A car wash could release IOC and VOC chemical substances. The connection is shown byindicating the SIC, 7542, and the associated contaminant categories, IOC (Category B) and VOC (CategoryD). However, the contaminants listed are not associated with any Added Sources.
The list is sorted by the SIC source description and it only shows unique SIC sources. For example, anassessment area can have 20 car washes in an assessment area, but the list is only going to show contaminantcategories associated with car washes onetime. This is because all car washes have the same SIC and everycar wash poses the same potential threat to water intakes.
A − Microbiolgical B − Inorganic Compounds B1 − Eutrophication − Phosphorous
B2 − SedimentationB* − Nitrates C − Synthetic Organic Compounds
C* − Pesticides D − Volatile Organic Compounds
Source Water Assessment Report November 24, 2003 13

Potential Contaminants Listing
Public Water Supply: NGPL − HEIZERAssessment Area: 376
Unregulated Identified Site Sources and associated PotentialContaminant Category
SIC ID SIC Source Potential Contaminant Contaminant Category
Did Not Contain Any Potential Contaminants
Source Water Assessment Report November 24, 2003 14

Public Water Supply:NGPL − HEIZER
Assessment Area: 376
Diversion Id's: 001, 002, 004
Status: Accepted
Submit Date: 2003−09−02 13:25:55
Protection Measures:
The Protection Measures section shows water quality protection measures for the Standard IndustrialClassifications (SIC) identified in the assessment area.
Previous sections of this report are designed to show areas that Public Water Supplies (PWS) can focus on toimprove the susceptibility of an assessment area. This section helps identify water quality protectionmeasures that a PWS can use as guidance for implementing action for a potential contaminant site in theassessment area. It focuses on protection measures that can reduce the risk of contamination to the watersupply.
This portion of the report only displays water quality protection measures for each type of SIC found in theassessment area. It does not display protection measures for each site in the assessment area because everySIC should have the same or similar water quality protection management practices. However, the protectionmeasures listed are not associated with any Added Sources.
Source Water Assessment Report November 24, 2003 15
Protection Measures
Public Water Supply: NGPL − HEIZERAssessment Area: 376
Recommended Water Quality Protection Measures
SIC SIC SourceContaminant
SourceWater Quality Protection
MeasureRegulatoryAuthority
No Protection Measures Listed
Source Water Assessment Report November 24, 2003 16

Public Water Supply:NGPL − HEIZER
Assessment Area: 376
Diversion Id's: 001, 002, 004
Status: Accepted
Submit Date: 2003−09−02 13:25:55
Assessment Analysis:
The Assessment Analysis section displays the numbers assigned to each contaminant of concern category foreach question in the susceptibility analysis.
This analysis is based on a decision tree framework consisting of a series of yes/no questions. Thesequestions consider the proximity of contaminant sources to the water supply intake, the type of contaminant,and the application of pollution prevention or water quality protection practices to sources of contamination.As the evaluator moves through the analytical framework, susceptibility points are accumulated based on thepresence of contaminant sources in the assessment area.
After all the questions have been answered, the SLS is calculated for each contaminant of concern category.The SLS is determined by counting the number of contamination risk factors found to occur in thedelineated assessment area and applying a multiplier to this number. Because the number of contaminantcategory risk factors is not equal, the multiplier is used to establish a common scale for the SLS of eachcontaminant category.
Source Water Assessment Report November 24, 2003 17

Assessment Analysis
Public Water Supply: NGPL − HEIZERAssessment Area: 376
Ground Water Multiple Wells Analysis
A − Microbiolgical B − Inorganic Compounds
B* − Nitrates C − Synthetic Organic Compounds
C* − Pesticides D − Volatile Organic Compounds
No. Question ResponseA B B* C C* D
1 Is any well under the influence of surface water? No 0 0 0 0 0 0
2 Do all PWS wells meet KS PWS water well construction standards? Yes 0 0 0 0 0 0
3 Is any well less than 30 feet deep? No 0 0 0 0 0 0
4 Is gravel pack within 20 feet of any well surface? No 0 0 0 0 0 0
5 Does a PWS own or control all the areas around the wells? No 1 1 1 1 1 1
6 Does Zone B consist entirely of native grass? No 2 2 2 2 2 2
7 Is there a contaminated well in Zone B? No 0 0 0 0 0 0
8 Is a class V UIC well present? No 0 0 0 0 0 0
9 Are any commercial, industrial, or urban areas present in Zone B? No 0 0 0 0 0 0
10Does each industrial/commercial site and urban area have a water qualityprotection plan in place?
Yes 0 0 0 0 0 0
11 Are any non−farm home sites present in Zone B? Yes 1 0 1 0 1 0
12 Do all the non−farm home sites have a water quality protection plan? No 1 0 1 0 1 0
13 Are any farmsteads present in Zone B? Yes 1 1 1 1 1 1
14 Do all farmsteads have a water quality protection plan? No 1 1 1 1 1 1
15 Is there grazing livestock in Zone B? Yes 1 0 1 0 0 0
16 Have all livestock producers implemented water quality protection measures?No 1 0 1 0 0 0
17 Is there livestock confinement in Zone B? No 0 0 0 0 0 0
Source Water Assessment Report November 24, 2003 18
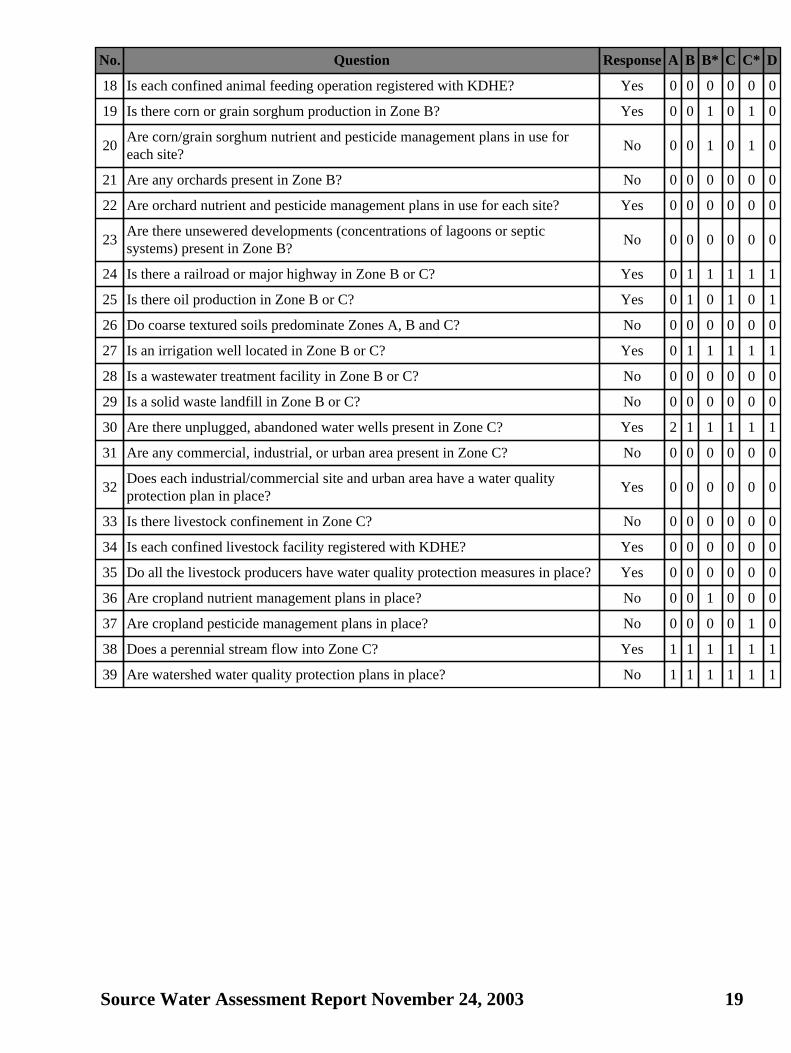
No. Question ResponseA B B* C C* D
18 Is each confined animal feeding operation registered with KDHE? Yes 0 0 0 0 0 0
19 Is there corn or grain sorghum production in Zone B? Yes 0 0 1 0 1 0
20Are corn/grain sorghum nutrient and pesticide management plans in use foreach site?
No 0 0 1 0 1 0
21 Are any orchards present in Zone B? No 0 0 0 0 0 0
22 Are orchard nutrient and pesticide management plans in use for each site? Yes 0 0 0 0 0 0
23Are there unsewered developments (concentrations of lagoons or septicsystems) present in Zone B?
No 0 0 0 0 0 0
24 Is there a railroad or major highway in Zone B or C? Yes 0 1 1 1 1 1
25 Is there oil production in Zone B or C? Yes 0 1 0 1 0 1
26 Do coarse textured soils predominate Zones A, B and C? No 0 0 0 0 0 0
27 Is an irrigation well located in Zone B or C? Yes 0 1 1 1 1 1
28 Is a wastewater treatment facility in Zone B or C? No 0 0 0 0 0 0
29 Is a solid waste landfill in Zone B or C? No 0 0 0 0 0 0
30 Are there unplugged, abandoned water wells present in Zone C? Yes 2 1 1 1 1 1
31 Are any commercial, industrial, or urban area present in Zone C? No 0 0 0 0 0 0
32Does each industrial/commercial site and urban area have a water qualityprotection plan in place?
Yes 0 0 0 0 0 0
33 Is there livestock confinement in Zone C? No 0 0 0 0 0 0
34 Is each confined livestock facility registered with KDHE? Yes 0 0 0 0 0 0
35 Do all the livestock producers have water quality protection measures in place?Yes 0 0 0 0 0 0
36 Are cropland nutrient management plans in place? No 0 0 1 0 0 0
37 Are cropland pesticide management plans in place? No 0 0 0 0 1 0
38 Does a perennial stream flow into Zone C? Yes 1 1 1 1 1 1
39 Are watershed water quality protection plans in place? No 1 1 1 1 1 1
Source Water Assessment Report November 24, 2003 19
Public Water Supply:NGPL − HEIZER
Assessment Area: 376
Diversion Id's: 001, 002, 004
Status: Accepted
Submit Date: 2003−09−02 13:25:55
Site Comments:
The Site Comments section lists all the comments that were added for the potential sources of contaminationfound in the assessment area.
Local comments and feedback from people that are familiar with the assessment area is an important aspectof the assessment. The comments greatly improve the assessment by adding detail to the sites that can bereferenced for more information.
This local information may include comments on potential contamination threats (or lack there of), localwater quality protection initiatives, etc. Adding comments are optional and are mainly focused on sources inareas that could have the greatest impact on water supply if a spill or release occurred in the environment. Itis left to the discretion of the PWS and/or source water assessment committee to add comments.
Source Water Assessment Report November 24, 2003 20

Site Comments
Public Water Supply: NGPL − HEIZERAssessment Area: 376
Comments for Unregulated Sites
Did Not Receive Any Comments
Comments for Regulated Confined Animal Feeding Operations Sites
Did Not Receive Any Comments
Comments for Regulated Hazardous Waste Sites
Did Not Receive Any Comments
Comments for Regulated Leaking Storage Tank Sites
Did Not Receive Any Comments
Comments for Regulated Identified Contaminated Sites
Did Not Receive Any Comments
Comments for Regulated Solid Waste Sites
Did Not Receive Any Comments
Source Water Assessment Report November 24, 2003 21

Comments for Regulated Waste Water Sites
Did Not Receive Any Comments
Source Water Assessment Report November 24, 2003 22

Public Water Supply:NGPL − HEIZER
Assessment Area: 376
Diversion Id's: 001, 002, 004
Status: Accepted
Submit Date: 2003−09−02 13:25:55
Added Site Comments:
The Added Site Comments section lists the comments for why sites were added as a potential source ofcontamination found to the assessment area.
Source Water Assessment Report November 24, 2003 23
Added Site Comments
Public Water Supply: NGPL − HEIZERAssessment Area: 376
Comments for Added Contaminant Sites
Added Contaminant SiteName
Site No. Site Comments Author
Did Not Receive Any Comments
Source Water Assessment Report November 24, 2003 24

Public Water Supply:NGPL − HEIZER
Assessment Area: 376
Diversion Id's: 001, 002, 004
Status: Accepted
Submit Date: 2003−09−02 13:25:55
Analysis Question Comments:
The Analysis Question Comments section lists all the comments that were added during analysis portion ofthe assessment, in which a series of yes/no questions were asked.
Evaluators have the option to add comments to questions to clarify why a response was given or to givemore details to a question. Local comments and feedback from people that are familiar with the assessmentarea is an important aspect of the assessment. The comments greatly improve the assessment by addingclarification and details that could not be identified with a simple yes or no response.
Source Water Assessment Report November 24, 2003 25

Analysis Question Comments
Public Water Supply: NGPL − HEIZERAssessment Area: 376
Comments for Analysis Questions
Analysis Question Question Comments Author
Do all farmsteads have a water qualityprotection plan?
unknown Rob Beilfuss
Have all livestock producers implementedwater quality protection measures?
unknown Rob Beilfuss
Are corn/grain sorghum nutrient andpesticide management plans in use foreach site?
unknown Rob Beilfuss
Are cropland nutrient management plansin place?
unknown Rob Beilfuss
Source Water Assessment Report November 24, 2003 26

Public Water Supply:NGPL − HEIZER
Assessment Area: 377
Diversion Id's: 003
Status: Accepted
Submit Date: 2003−09−02 13:31:55
Executive Summary:
The Executive Summary gives the assessment area's Susceptibility Likelihood Score (SLS) for eachcontaminant of concern category.
SLS indicates which contaminant category is most likely to impact a given public water supply.Contaminants of concern for groundwater include microbiological, inorganic compounds, nitrates, syntheticorganic compounds, pesticides, and volatile organic compounds. Contaminants of concern for surface waterinclude microbiological, inorganic compounds, eutrophication − phosphorus, sedimentation, syntheticorganic compounds, pesticides, and volatile organic compounds.
To determine the assessment area's susceptibility to contamination, a qualitative (semi−quantitative)screening level susceptibility analysis was designed that utilizes general assumptions and best professionaljudgement. It is a systematic procedure comprised of simple yes/no questions. Each question in thesusceptibility analysis focuses on the presence or absence of potential pollution sources in the assessmentarea. SLS is most useful in helping the Public Water Supply (PWS) focus on water quality protection actionstowards a contaminant category of concern. For example, if the SLS for microbiological contamination ishigh, relative to volatile organic compounds (VOC), water supply protection planners would conclude thatthe attention should be directed towards microbiological contaminant sources rather than VOC sources.
Source Water Assessment Report November 24, 2003 27
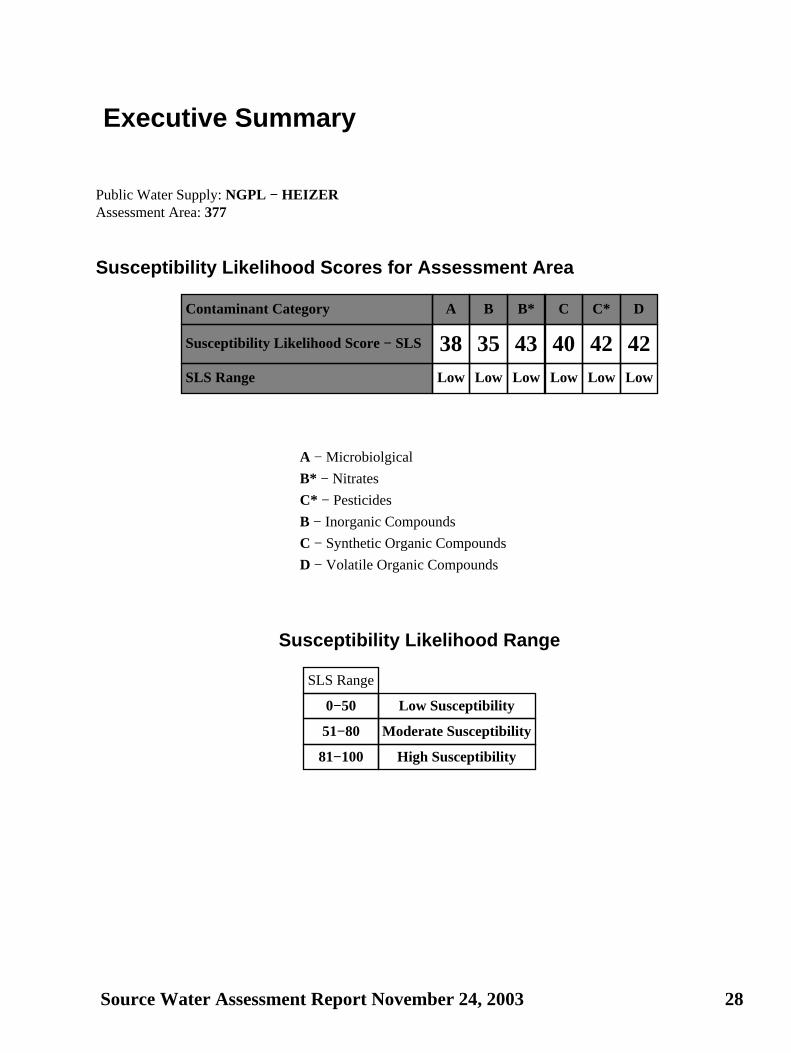
Executive Summary
Public Water Supply: NGPL − HEIZERAssessment Area: 377
Susceptibility Likelihood Scores for Assessment Area
Contaminant Category A B B* C C* D
Susceptibility Likelihood Score − SLS 38 35 43 40 42 42SLS Range Low Low Low Low Low Low
A − Microbiolgical
B* − Nitrates
C* − Pesticides
B − Inorganic Compounds
C − Synthetic Organic Compounds
D − Volatile Organic Compounds
Susceptibility Likelihood Range
SLS Range
0−50 Low Susceptibility
51−80 Moderate Susceptibility
81−100 High Susceptibility
Source Water Assessment Report November 24, 2003 28
Public Water Supply:NGPL − HEIZER
Assessment Area: 377
Diversion Id's: 003
Status: Accepted
Submit Date: 2003−09−02 13:31:55
Potential Sources:
The Potential Sources section lists all the sites that have been identified as potential sources ofcontamination.
Potential sources of contamination may include land uses, industry, or businesses that could generate orstore chemicals/substances that could potentially contaminate the water supply only if released into theenvironment. Both unregulated sites from business location databases and regulated sites from variousKDHE databases were compiled. Additional sites could have been added by an evaluator through theassessment process to supplement the original data.
The 1987 Standard Industrial Classifications (SIC) were used to identify potential contaminate sites. TheSIC system classifies establishments into industries on the basis of the primary activities of theestablishment.
Each assessment area is delineated with 3 assessment zones. These zones can be used to get a generalunderstanding of the potential influence sites have based on proximity to the water supply. Zone A isa100−foot radius around a groundwater well and a 1000−foot radius around a surface water intake. Zone Bis a 2000−foot radius around wells and a hydrological delineated buffer around the surface water sources.Zone C is a 2−mile radius around wells and the balance of the watershed for intakes. The potential sourceslisted in this section are sorted to show all the potential sources in Zone A first, Zone B second, and Zone Cthird.
Although a facility or business is identified in the study as a potential concern, it does not necessarilymean a release or spill has occurred. Contamination could only occur if certain chemical substancesare released into the environment and filter into the water supply source.
The data for the potential sources of contamination was compiled from May through August in 2002. Someof the databases used were incomplete datasets that are continually being updated. Due to theincompleteness, inaccuracies, and new development, it is possible that sources of potential contaminationthat are in the assessment area are not included in the report. Inaccurate locations could also cause sources toshow up in the assessment area that are not actually in the assessment. Additionally, duplication between thedatasets could cause sites to show up multiple times in the assessment area.
Source Water Assessment Report November 24, 2003 29

Potential Sources
Public Water Supply: NGPL − HEIZERAssessment Area: 377
Unregulated Potential Site Sources
Did Not Contain Any Of These Potential Site Sources
Regulated Confined Animal Feeding Operations Potential Site Sources
Did Not Contain Any Of These Potential Site Sources
Regulated Hazardous Waste Potential Site Sources
Did Not Contain Any Of These Potential Site Sources
Regulated Leaking Storage Tank Potential Site Sources
Did Not Contain Any Of These Potential Site Sources
Regulated Identified Contaminated Potential Site Sources
Source No. Source Name ID/Permit No. Zone
7000877NATURAL GAS PIPELINE POND CLOSURE (EVAPORATIONPON
C600570059 C
Source Water Assessment Report November 24, 2003 30

Regulated Solid Waste Potential Site Sources
Did Not Contain Any Of These Potential Site Sources
Regulated Waste Water Potential Site Sources
Did Not Contain Any Of These Potential Site Sources
Source Water Assessment Report November 24, 2003 31

Public Water Supply:NGPL − HEIZER
Assessment Area: 377
Diversion Id's: 003
Status: Accepted
Submit Date: 2003−09−02 13:31:55
Added Sources:
The Added Sources section lists all the sites that have been added as potential sources of contamination byan evaluator through the assessment process to supplement the original data.
The potential sources listed in this section are sorted to show the added potential sources in Zone A first,Zone B second, and Zone C third.
Although a facility or business was added as a potential concern, it does not necessarily mean a releaseor spill has occurred. Contamination could only occur if certain chemical substances are released intothe environment and filter into the water supply source.
Source Water Assessment Report November 24, 2003 32

Added Sources
Public Water Supply: NGPL − HEIZERAssessment Area: 377
Added Potential Site Sources
Source No. Source Name SIC ID Zone
Did Not Add Any Site Sources
Source Water Assessment Report November 24, 2003 33

Public Water Supply:NGPL − HEIZER
Assessment Area: 377
Diversion Id's: 003
Status: Accepted
Submit Date: 2003−09−02 13:31:55
Potential Contaminants Summary:
The Contaminants Summary shows the number of identified unregulated sources in the assessment area foreach contaminant of concern category.
In order to obtain the number or sources for each category, a relationship was correlated between eachStandard Industrial Classification (SIC) and the contaminant of concern categories. Each SIC was assessedand associated with contaminant categories. For example, if not managed properly, a car wash (SIC 7542)could potentially contaminate an intake because of inorganic compounds (IOC) and volatile organiccompounds (VOC); thus, a car wash is associated with IOCs and VOCs.
A chart displays a count for each contaminant category. The sum for each category represents the totalnumber of identified sources that have been associated with that particular contaminant category. However,the total number of identified sources does not include contaminants from the Added Sources. In ourexample, a car wash would be considered 2 sources of contamination. It would be a potential source ofcontamination for IOCs and for VOCs; thus, 1 would be added to the total number of sources in the VOCcategory and 1 would be added to the IOC category.
Source Water Assessment Report November 24, 2003 34

Potential Contaminants Summary
Public Water Supply: NGPL − HEIZERAssessment Area: 377
Number of Unregulated Site Sources Identified for each ContaminantCategory
MicroBiological PesticidesIOC's SOC's VOC's Nitrates
0 0 0 0 0 0
A − Microbiolgical
B* − Nitrates
C* − Pesticides
B − Inorganic Compounds
C − Synthetic Organic Compounds
D − Volatile Organic Compounds
Source Water Assessment Report November 24, 2003 35

Public Water Supply:NGPL − HEIZER
Assessment Area: 377
Diversion Id's: 003
Status: Accepted
Submit Date: 2003−09−02 13:31:55
Potential Contaminants Listing:
The Potential Contaminants section lists the contaminant of concern category associated with each StandardIndustrial Classification (SIC) found in an assessment area. A complete list of contaminant category codesare located at the bottom of this page.
The relationships defined between the Standard Industrial Classifications (SIC) and the contaminant ofconcern categories are displayed in a table format. Using our car wash example, the relationships can bebetter illustrated. A car wash could release IOC and VOC chemical substances. The connection is shown byindicating the SIC, 7542, and the associated contaminant categories, IOC (Category B) and VOC (CategoryD). However, the contaminants listed are not associated with any Added Sources.
The list is sorted by the SIC source description and it only shows unique SIC sources. For example, anassessment area can have 20 car washes in an assessment area, but the list is only going to show contaminantcategories associated with car washes onetime. This is because all car washes have the same SIC and everycar wash poses the same potential threat to water intakes.
A − Microbiolgical B − Inorganic Compounds B1 − Eutrophication − Phosphorous
B2 − SedimentationB* − Nitrates C − Synthetic Organic Compounds
C* − Pesticides D − Volatile Organic Compounds
Source Water Assessment Report November 24, 2003 36
Potential Contaminants Listing
Public Water Supply: NGPL − HEIZERAssessment Area: 377
Unregulated Identified Site Sources and associated PotentialContaminant Category
SIC ID SIC Source Potential Contaminant Contaminant Category
Did Not Contain Any Potential Contaminants
Source Water Assessment Report November 24, 2003 37

Public Water Supply:NGPL − HEIZER
Assessment Area: 377
Diversion Id's: 003
Status: Accepted
Submit Date: 2003−09−02 13:31:55
Protection Measures:
The Protection Measures section shows water quality protection measures for the Standard IndustrialClassifications (SIC) identified in the assessment area.
Previous sections of this report are designed to show areas that Public Water Supplies (PWS) can focus on toimprove the susceptibility of an assessment area. This section helps identify water quality protectionmeasures that a PWS can use as guidance for implementing action for a potential contaminant site in theassessment area. It focuses on protection measures that can reduce the risk of contamination to the watersupply.
This portion of the report only displays water quality protection measures for each type of SIC found in theassessment area. It does not display protection measures for each site in the assessment area because everySIC should have the same or similar water quality protection management practices. However, the protectionmeasures listed are not associated with any Added Sources.
Source Water Assessment Report November 24, 2003 38

Protection Measures
Public Water Supply: NGPL − HEIZERAssessment Area: 377
Recommended Water Quality Protection Measures
SIC SIC SourceContaminant
SourceWater Quality Protection
MeasureRegulatoryAuthority
No Protection Measures Listed
Source Water Assessment Report November 24, 2003 39
Public Water Supply:NGPL − HEIZER
Assessment Area: 377
Diversion Id's: 003
Status: Accepted
Submit Date: 2003−09−02 13:31:55
Assessment Analysis:
The Assessment Analysis section displays the numbers assigned to each contaminant of concern category foreach question in the susceptibility analysis.
This analysis is based on a decision tree framework consisting of a series of yes/no questions. Thesequestions consider the proximity of contaminant sources to the water supply intake, the type of contaminant,and the application of pollution prevention or water quality protection practices to sources of contamination.As the evaluator moves through the analytical framework, susceptibility points are accumulated based on thepresence of contaminant sources in the assessment area.
After all the questions have been answered, the SLS is calculated for each contaminant of concern category.The SLS is determined by counting the number of contamination risk factors found to occur in thedelineated assessment area and applying a multiplier to this number. Because the number of contaminantcategory risk factors is not equal, the multiplier is used to establish a common scale for the SLS of eachcontaminant category.
Source Water Assessment Report November 24, 2003 40
Assessment Analysis
Public Water Supply: NGPL − HEIZERAssessment Area: 377
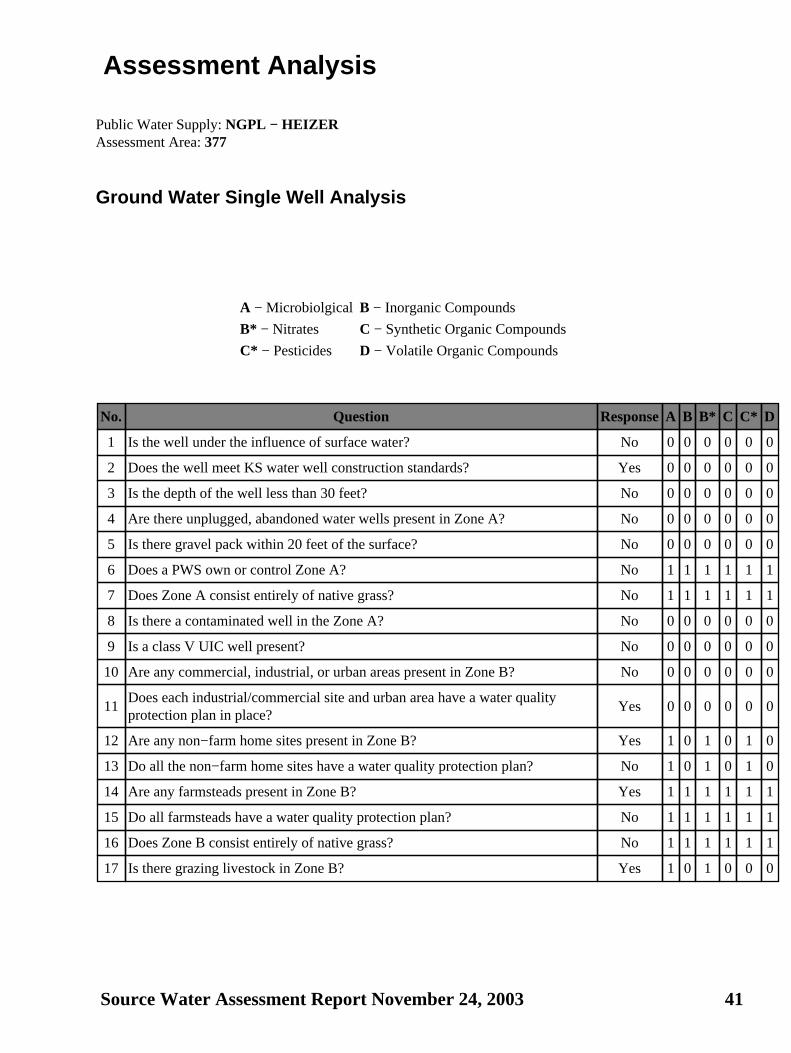
Ground Water Single Well Analysis
A − Microbiolgical B − Inorganic Compounds
B* − Nitrates C − Synthetic Organic Compounds
C* − Pesticides D − Volatile Organic Compounds
No. Question ResponseA B B* C C* D
1 Is the well under the influence of surface water? No 0 0 0 0 0 0
2 Does the well meet KS water well construction standards? Yes 0 0 0 0 0 0
3 Is the depth of the well less than 30 feet? No 0 0 0 0 0 0
4 Are there unplugged, abandoned water wells present in Zone A? No 0 0 0 0 0 0
5 Is there gravel pack within 20 feet of the surface? No 0 0 0 0 0 0
6 Does a PWS own or control Zone A? No 1 1 1 1 1 1
7 Does Zone A consist entirely of native grass? No 1 1 1 1 1 1
8 Is there a contaminated well in the Zone A? No 0 0 0 0 0 0
9 Is a class V UIC well present? No 0 0 0 0 0 0
10 Are any commercial, industrial, or urban areas present in Zone B? No 0 0 0 0 0 0
11Does each industrial/commercial site and urban area have a water qualityprotection plan in place?
Yes 0 0 0 0 0 0
12 Are any non−farm home sites present in Zone B? Yes 1 0 1 0 1 0
13 Do all the non−farm home sites have a water quality protection plan? No 1 0 1 0 1 0
14 Are any farmsteads present in Zone B? Yes 1 1 1 1 1 1
15 Do all farmsteads have a water quality protection plan? No 1 1 1 1 1 1
16 Does Zone B consist entirely of native grass? No 1 1 1 1 1 1
17 Is there grazing livestock in Zone B? Yes 1 0 1 0 0 0
Source Water Assessment Report November 24, 2003 41

No. Question ResponseA B B* C C* D
18 Do all the livestock producers have water quality protection measures in place?No 1 0 1 0 0 0
19 Is there livestock confinement in Zone B? No 0 0 0 0 0 0
20 Is each confined animal feeding operation registered with KDHE? Yes 0 0 0 0 0 0
21 Is there corn or grain sorghum production in Zone B? Yes 0 0 1 0 1 0
22Are corn/grain sorghum nutrient and pesticide management plans in use foreach site?
No 0 0 1 0 1 0
23 Are any orchards present in Zone B? No 0 0 0 0 0 0
24 Are orchard nutrient and pesticide plans in use for each site? Yes 0 0 0 0 0 0
25Are there unsewered developments (concentrations of lagoons or septicsystems) present in Zone B?
No 0 0 0 0 0 0
26 Is there a railroad or major highway in Zone B or C? Yes 0 1 1 1 1 1
27 Is there oil production in Zone B or C? Yes 0 1 0 1 0 1
28 Do coarse textured soils predominate Zones A, B and C? No 0 0 0 0 0 0
29 Is an irrigation well located in Zone B or C? Yes 0 1 1 1 1 1
30 Is a wastewater treatment facility in Zone B or C? No 0 0 0 0 0 0
31 Is a solid waste landfill in Zone B or C? No 0 0 0 0 0 0
32 Are there unplugged, abandoned water wells present in Zone B or C? Yes 1 0 0 0 0 0
33 Are any commercial, industrial, or urban areas present in Zone C? No 0 0 0 0 0 0
34 Are water quality protection plans in use for each site/area? Yes 0 0 0 0 0 0
35 Is there livestock confinement in Zone C? No 0 0 0 0 0 0
36 Is each confined livestock facility registered with KDHE? Yes 0 0 0 0 0 0
37 Do all the livestock producers have water quality protection measures in place?Yes 0 0 0 0 0 0
38 Are cropland nutrient management plans in place? No 0 0 1 0 0 0
39 Are cropland pesticide management plans in place? No 0 0 0 0 1 0
40 Does a perennial stream flow into Zone C? Yes 1 1 1 1 1 1
41 Are watershed water quality protection plans in place? No 1 1 1 1 1 1
Source Water Assessment Report November 24, 2003 42

Public Water Supply:NGPL − HEIZER
Assessment Area: 377
Diversion Id's: 003
Status: Accepted
Submit Date: 2003−09−02 13:31:55
Site Comments:
The Site Comments section lists all the comments that were added for the potential sources of contaminationfound in the assessment area.
Local comments and feedback from people that are familiar with the assessment area is an important aspectof the assessment. The comments greatly improve the assessment by adding detail to the sites that can bereferenced for more information.
This local information may include comments on potential contamination threats (or lack there of), localwater quality protection initiatives, etc. Adding comments are optional and are mainly focused on sources inareas that could have the greatest impact on water supply if a spill or release occurred in the environment. Itis left to the discretion of the PWS and/or source water assessment committee to add comments.
Source Water Assessment Report November 24, 2003 43

Site Comments
Public Water Supply: NGPL − HEIZERAssessment Area: 377
Comments for Unregulated Sites
Did Not Receive Any Comments
Comments for Regulated Confined Animal Feeding Operations Sites
Did Not Receive Any Comments
Comments for Regulated Hazardous Waste Sites
Did Not Receive Any Comments
Comments for Regulated Leaking Storage Tank Sites
Did Not Receive Any Comments
Comments for Regulated Identified Contaminated Sites
Did Not Receive Any Comments
Comments for Regulated Solid Waste Sites
Did Not Receive Any Comments
Source Water Assessment Report November 24, 2003 44

Comments for Regulated Waste Water Sites
Did Not Receive Any Comments
Source Water Assessment Report November 24, 2003 45

Public Water Supply:NGPL − HEIZER
Assessment Area: 377
Diversion Id's: 003
Status: Accepted
Submit Date: 2003−09−02 13:31:55
Added Site Comments:
The Added Site Comments section lists the comments for why sites were added as a potential source ofcontamination found to the assessment area.
Source Water Assessment Report November 24, 2003 46

Added Site Comments
Public Water Supply: NGPL − HEIZERAssessment Area: 377
Comments for Added Contaminant Sites
Added Contaminant SiteName
Site No. Site Comments Author
Did Not Receive Any Comments
Source Water Assessment Report November 24, 2003 47

Public Water Supply:NGPL − HEIZER
Assessment Area: 377
Diversion Id's: 003
Status: Accepted
Submit Date: 2003−09−02 13:31:55
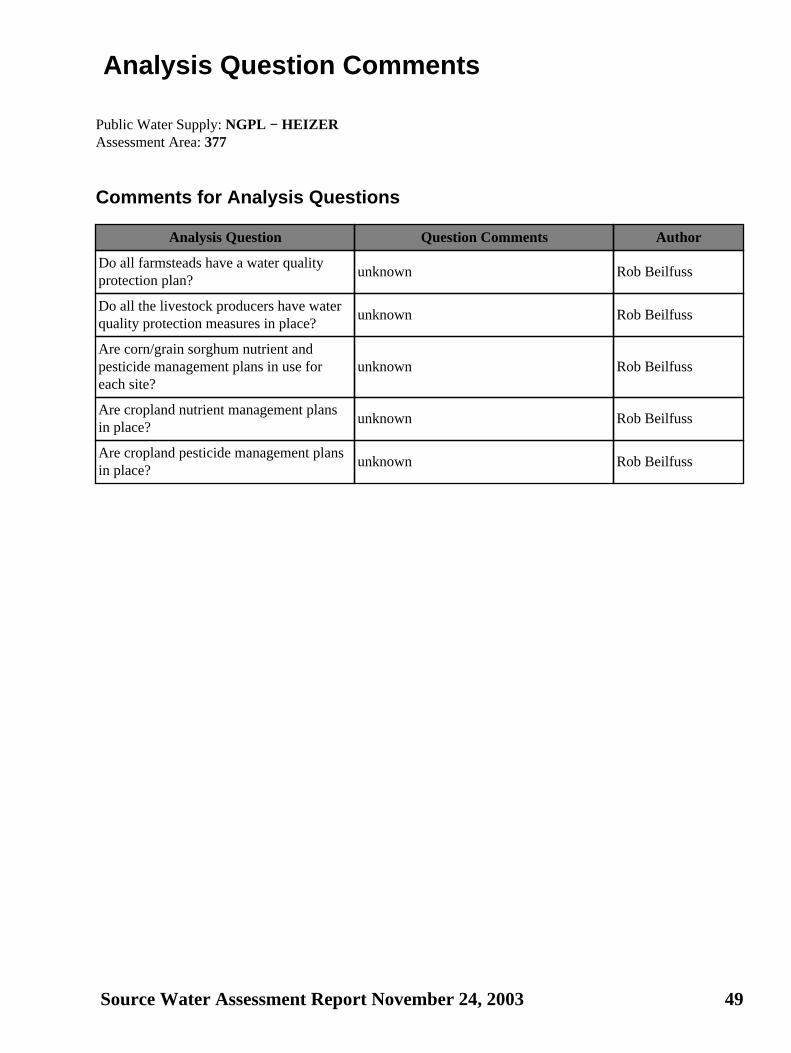
Analysis Question Comments:
The Analysis Question Comments section lists all the comments that were added during analysis portion ofthe assessment, in which a series of yes/no questions were asked.
Evaluators have the option to add comments to questions to clarify why a response was given or to givemore details to a question. Local comments and feedback from people that are familiar with the assessmentarea is an important aspect of the assessment. The comments greatly improve the assessment by addingclarification and details that could not be identified with a simple yes or no response.
Source Water Assessment Report November 24, 2003 48
Analysis Question Comments
Public Water Supply: NGPL − HEIZERAssessment Area: 377
Comments for Analysis Questions
Analysis Question Question Comments Author
Do all farmsteads have a water qualityprotection plan?
unknown Rob Beilfuss
Do all the livestock producers have waterquality protection measures in place?
unknown Rob Beilfuss
Are corn/grain sorghum nutrient andpesticide management plans in use foreach site?
unknown Rob Beilfuss
Are cropland nutrient management plansin place?
unknown Rob Beilfuss
Are cropland pesticide management plansin place?
unknown Rob Beilfuss
Source Water Assessment Report November 24, 2003 49