source term estimation using menu-tact · nureg/cr-4722 ornl-6314. abstract menu-tact is a computer...
TRANSCRIPT

Source Term EstimationUsing MENU-TACT
Prepared by A. Sjoreen, T. McKenna, J. Julius
Oak Ridge National Laboratory
Prepared forU.S. Nuclear RegulatoryCommission
NUREG/CR-4722ORNL-6314

NOTICE
This report was prepared as an account of work sponsored by an agency of the United StatesGovernment. Neither the United States Government nor any agency thereof, or any of theiremployees, makes any warranty, expressed or implied, or assumes any legal liability of responsibility for any third party's use, or the results of such use, of any information, apparatus,product or process disclosed in this report, or represents that its use by such third party wouldnot infringe privately owned rights.
NOTICE
Availability of Reference Materials Cited in NRC Publications
Most documents cited in NRC publicationswill be available from one of the following sources:
1. The NRC Public Document Room, 1717 H Street, N.W.Washington, DC 20555
2. TheSuperintendent of Documents, U.S. Government Printing Office, Post Office Box 37082Washington, DC 20013-7082
3. The National Technical Information Service, Springfield, VA 22161
Although the listing that follow epresents the majority of documents cited, in NRC publications,it is not intended to be exhaustive.
Referenced documents available for inspection and copying for a fee from the NRC Public Document Room include NRC correspondence and internal NRC memoranda; NRC Office of Inspectionand Enforcement bulletins, circulars, information notices, inspection and investigation notices;Licensee Event Reports; vendor reports and correspondence; Commission papers; and applicantandlicensee documents and correspondence.
The following documents in the NUREG series are available for purchase from the GPO SalesProgram: formal NRC staff and contractor reports, NRC-sponsored conference proceedings, andNRC booklets and brochures. Also available are Regulatory Guides, NRCregulations in the CodeofFederal Regulations, and Nuclear Regulatory Commission Issuances.
Documents available from the National Technical Information Service include NUREG seriesreports and technical reports prepared by other federal agencies and reports prepared by the AtomicEnergy Commission, forerunner agency to the Nuclear Regulatory Commission.
Documents available from public and special technical libraries include all open literature items,such as books, journaland periodical articles,and transactions. Federal Register notices, federal andstate legislation, and congressional reports can usually be obtained from these libraries.
Documents such as theses, dissertations, foreign reports and translations, and non-NRCconferenceproceedingsare available for purchase from the organization sponsoring the publication cited.
Single copies of NRC draft reports are available free, to the extent of supply, upon writtenrequest to the Division of Information Support Services, Distribution Section, U.S. NuclearRegulatory Commission, Washington, DC 20555.
Copies of industry codes and standards used in a substantive manner in the NRCregulatory processare maintained at the NRC Library, 7920 Norfolk Avenue, Bethesda, Maryland, and are availablethere for reference use by the public. Codes and standards are usually copyrighted and may bepurchased from the originating organization or, if they are American National Standards, from theAmerican National Standards Institute, 1430 Broadway, New York, NY 10018.

Source Term EstimationUsing MENU-TACT
Manuscript Completed: December 1986Date Published: October 1987
Prepared byA. Sjoreen, T. McKenna*, J. Julius**
Oak Ridge National LaboratoryP.O. Box XOak Ridge, TN 37831
*Staff, U.S. Nuclear Regulatory Commission**Technassociates, Bethesda, Maryland
Prepared forDivision of Operationai AssessmentOffice for Anaiysis and Evaiuation of Operationai DataU.S. Nuciear Reguiatory CommissionWashington, DC 20555NRC FIN A9079
NUREG/CR-4722ORNL-6314

ABSTRACT
MENU-TACT is a computer code designed to be used for source term
estimation during reactor emergencies. The code allows the user to
define initial concentrations of the nuclides in the reactor and the
release pathway and timing. Filtering and other in-plant removal
processes may be included, MENU-TACT, a modification of the TACT-IXI
code, is simple to use. To provide quick results of bounding calcula
tions, it incorporates only those processes that can make major changes
in reactor releases.
m

ABSTRACT
LIST OF FIGURES
LIST OF TABLES .
ACKNOWLEDGMENTS.
1. INTRODUCTION
CONTENTS
2. MENU-TACT DESCRIPTION
3. THE INTERMEDIATE DOSE ASSESSMENT SYSTEM MENU ENVIRONMENT .
4. STEPPING THROUGH MENU-TACT4.1 LOGGING ONTO THE SYSTEM AND BRANCHING INTO MENU-TACT.4.2 SELECTION PLANT SITE AND BRANCHING THROUGH MENU-TACT.
4.2.1 Selecting the Plant Site4.2.2 Selecting the Path Through MENU-TACT
(Main Menu)4.2.3 Modifying an Existing Case4.2.4 Creating a New Case
4.3 SPECIFYING BASIC TIME-INDEPENDENT DATA4.4 SPECIFYING CORE DAMAGE STATE4.5 REVIEWING THE ASSUMED MIX4.6 SPECIFYING THE FRACTION OF INITIAL ACTIVITY
RELEASED FROM THE CORE
4.7 SPECIFYING TIME/NODE-DEPENDENT DATA4.7.1 Specifying Process Start and Release Start
and Stop Times and Particulate/Aerosol RemovalCoefficients (A)
4.7.2 Specifying the Fraction of Initial ActivityReleased to Various Nodes
4.7.3 Specifying In-Plant Transfer Rates and FilterEfficiencies
4.7.4 Specifying Releases to the Environment ....
5. EXECUTING TACT
6. REFERENCES
APPENDIX A. MATHEMATICAL DESCRIPTION OF TACT. . . .
APPENDIX B. BASES FOR SPECIFYING TRANSFER RATES . .
APPENDIX C. BASES FOR SPECIFYING FILTER EFFICIENCIES
V
Page
ixi
vi
vi
vii
1
3
5
7
8
10
10
11
11
13
13
19
25
26
26
27
31
33
35
41
45
47
53
57

LIST OF FIGURES
liSHEe Page
1 Example MENU-TACT flow 9
2 Pressurized water reactor release pathway form 17
3 Boiling water reactor release pathway form 18
4 Relationship among times entered 29
5 Comparison of volume removal effects 30
LIST OF TABLES
Table Page
1 Pressurized water reactor major release pathways ... 15
2 Boiling water reactor MK I generic major release pathways. . . . 16
3 Overview of TACT release assumptions 20
4 Specific release assumptions 21
5 Strontium and Cesium inventories vs core age 24
6 Volume removal coefficient, X 32
7 Typical transfer rates
8 Example TACT 1-hr transfer rates
34
36
9 Filter efficiency (particulates/aerosols) 37
10 Representative containment structural capabilities 39
VI

ACKNOWLEDGMENTS
Walter Pasedag and Patrick Easely (both formerly of the U.S.
Nuclear Regulatory Commission) were responsible for development of thiscode and the concepts of its use during the response to nuclear power
plant accidents. R. D. Sharp, W. L. Jackson, and R. M. Watkins providedhelpful reviews of this document.
Vll

1. INTRODUCTION
The major role of the U.S. Nuclear Regulatory Commission (NRC)during a severe reactor accident is to monitor actions being taken bythe reactor licensee to ensure that these protective actions are
appropriate. The NRC must first decide if the plant conditions warranttaking action, based on an assessment of core and containment states.If core damage exists or is projected, the population near the plant(within 2 to 5 miles) should be evacuated, and the remaining populationout to 10 miles should be sheltered. This protective action strategy isbased on consideration of the consequences of a wide range of core
damage accidents. These immediate protective actions should be adequatefor most core damage accidents.
This initial decision is not based on a dose assessment. However,
determination of the need for additional protective actions will includeconsideration of dose assessments. In the past, these dose assessments
have been based on licensee estimates of releases as measured by the
stack monitor. This is not adequate because severe accident releases
can bypass the stack and thus may not be characterized by the stackmonitor. In addition, since effective protective action requires prompt
implementation, an attempt should be made to project the magnitude of arelease before it occurs (rather than waiting until it goes out the
stack). Therefore, to perform the dose assessment, NRC needs toestimate possible off-site releases based on the probable range ofaccident conditions and not just on the relationship of stack monitor
readings to doses. MENU-TACT is used to estimate these off-sitereleases.
The consequence estimates should take into consideration current
and projected status of the core and possible release pathways asdetermined by the Reactor Safety Team (RST) or Reactor SafetyCoordinator. If calculations are not based on RST assessments,
discrepancies in information being provided to NRC decision makers couldresult. (Remember that the RST submits its assessment of core andcontainment condition directly to the decision makers.) An assessment
of possible releases based on projected plant conditions may also beuseful in determining if proposed actions at the plant (e.g., venting

the containment) are appropriate.
By their nature, core melt accidents result in conditions that make
estimation of source terms very difficult. The plant is beyond designconditions, instrument readings are unreliable, accident progress isunpredictable, and specific in-plant conditions may be unknown. Inaddition, even if we had a complete understanding of plant conditionsand accident progression, we would still be limited in our understandingof the physics and chemistry of the source term. The result is that,for a core melt accident, we have little hope of predicting "the sourceterm" with much accuracy. Because of these great uncertainties, thereis no need to perform complex detailed assessments that consider
secondary or little-understood effects. Errors of a factor of 10 to ICQ
should be expected. The assessments must be based on boundingcalculations that account for only dominant effects and can be performedquickly. If a change in assumptions does not change the calculatedsource term by a factor of 10, it is not worth considering.
For NRG decision makers to be able to use a source term estimate,uncertainties in the estimate must be bounded and the basis of the
uncertainties must be explainable. To support any decision, thedecision maker needs
1. the best estimate of the magnitude of any off-site release and theassumptions on which these estimates are based and
2. the upper and lower bounds of the off-site release based on
reasonable possible courses of the accident or changes in keyassumptions.

2. MENU-TACT DESCRIPTION
The basic tool used in the Operations Center to estimate source
terms is MENU-TACT. NRC's Accident Evaluation Branch developed the
TACT-III program (Killough et al., 1983) so that doses and releases fromQvariety of accidents could be estimated. TACT-III models transport ofnuclides from containment through a series of volumes (which are also
called nodes) to the environment. The number of nodes, the node
volumes, and the pathways through the nodes and to the environment are
all entered by the user. TACT uses a matrix inversion routine thatsolves simultaneous equations describing transport, decay, and removalprocesses in the volumes. Radionuclide daughter build-up is notconsidered and should not be important for the time involved in
responding to an emergency. The mathematical framework of TACT-III isdescribed in Appendix A. TACT-III has been modified to produce MENU-
TACT; the modifications included simplifying the input required to run
the model and simplifying the processes modeled. MENU-TACT is writtenin FORTRAN 77 to be run on a Data General MV 6000.
MENU-TACT has been tested for internal consistency and tested
against TACT-III for correctness. Each type of input data was variedfrom its minimum to its maximum value, while all other input data were
kept at their default values. The results were inspected to ensure thatthe expected changes occurred. These tests demonstrated that MENU-TACTwas modeling its processes correctly, regardless of the correctness ofTACT-III. More than 30 pairs of MENU-TACT/TACT-III runs were made to
ensure that both codes produced the same results. (The greatest
difficulty in performing these runs was ensuring that the two sets ofinput were equivalent. Also, the standard results of MENU-TACT andTACT-III are not directly comparable, so additional "write" statements
had to be added to TACT-III.) Four types of tests were run:
1. A baseline case was run with default data.

2. One and two time-step cases were run, with shutdown time equal toprocess start time and with process start time greater than
shutdown time.
Two volume cases were run with combinations of large and small
volumes and large and small flow rates. (Note that TACT-III was
somewhat more robust in handling cases that were numericallyextreme.)
4. Large and small filter efficiencies were combined with large andsmall removal coefficients.
This document explains the use of MENU-TACT during an accident. Afull description of data entry is included along with advice onselection of appropriate data values.

3. THE INTERMEDIATE DOSE ASSESSMENT SYSTEM MENU ENVIRONMENT
The Intermediate Dose Assessment System (IDAS) menu environment
connects all Operations Center model software and all IDAS support
software. Data file management and the recording of data entry and
simulation results are provided through IDAS. To run a program, you
simply select its name from a menu displayed on your terminal.
(Currently MENU-TACT runs only on Data General terminals.) Within each
program are other menu screens and template screens used to enter data
or select options available in the model.
When a menu screen is displayed, you should choose one of the
selections displayed. The current selection is the one that is
highlighted. To choose a different option, use the arrow keys. The uparrow and the left arrow move the highlighted box up. The right arrow
and the down arrow move the highlighted box down.
A menu screen consists of at most three parts: (1) one or two
title lines, (2) between two and 20 selections, and sometimes (3) a
hint line on the bottom of the screen. You can sometimes obtain further
help about the highlighted selection by pressing the "H" key.
Currently, only a few help items are available.
If you come to any IDAS screen and realize that you want to go backto a previous screen, press the ESCAPE key. If you are looking at the
first screen in a program, the ESCAPE key will cause the program to
stop.
A template screen requests a fill-in-the-blanks type of input. The
template screens have no fixed format, but usually a title is at the top
of the screen and a "helpful hint" is at the bottom. The data fields in
between are labeled by name and have default units. Usually the fields
already have data in them. If they do and you want to use the valueshown, press the NEWLINE key when that item is highlighted. Otherwise
you can tjrpe in the value you want. Remember that any characters in thedata field that are past the cursor position are not read. If you catcha mistake before you press the NEWLINE key, you can correct it by
backing up within that line using the arrow or DEL key. Once you havepressed the NEWLINE key, MENU-TACT will check that your entry is valid(i.e., it is of the proper type and within the acceptable range of

values). If your value is invalid, an error message will appear on the
bottom of the screen for 5 sec and the cursor will return to the
beginning of the item you are trying to enter.
No help messages are currently available for the data items on the
template screens. Also, the IDAS "special input" commands are disabled.
The ESCAPE key works in the template screens similarly to the way
it works in the menu screens. At any data item within a template
screen, pressing the ESCAPE key will put you back at the previous data
item. If you are positioned on the first item of a template screen, the
ESCAPE key will put you back to the top of the previous screen.

4. STEPPING THROUGH MENU-TACT
The major steps in performing a MENU-TACT analysis are
1. reading this document;
2. preparing the release pathway form;
3. logging onto the system and branching into MENU-TACT;
4. selecting the plant site (and case);
5. specifying basic time-dependent information:
a. case description,
b. power level,
c. node names and volumes, and
d. shutdown time;
6. specifying core damage state, either
a. coolant release,
b. gap release,
c. grain boundary release, or
d. core melt release; and
7. specifying pathway data:

a. event timing,
b. removal coefficient for each node,
c. portion of the release initially injected into each node, and
d. transfer rates between nodes and between nodes and the
environment and filter efficiencies assumed for transfers.
Refer to Fig. 1 while reading the following discussion about use of the
code,
4.1 LOGGING ONTO THE SYSTEM AND. BRANCHING INTO MENU-TACT
When a terminal is turned on but is not logged into the system, the
following message will generally be displayed on the screen:
**** MV6000B IMS/IDAS / Press NEW—LINE to begin loggina on ****
To initiate the login sequence, press the NEWLINE key. The system will
respond with the message:
AOS/VS 6.04.00.00 / EXEC 6.04.00.00 6-Aug-86 11:18:29 ©CONIOUsername: sourcetermPassMord:
Enter your username and press the NEWLINE key. The system will promptfor your password. Enter your password and press NEWLINE. The systemwill respond with a series of messages and the display:
Last message change 6-Jun-86 12:22:00
United States Nuclear Regulatory CommissionData General Eelipse MV/6000 — System B — IDAS
AOS/VS Revision 6.04
Last previous logon 6-Aug-86 9:19:54

FRACTION OF CORE INVENTORYOR
VOLUME OF COOLANT
node 1
CONTAINMENT
SPRAYREMOVAL
ANDDECAY
FORCED FLOWS
RECIRCULATION
FILTERS
FILTERS
Fig. 1. Example MENU-TACT flow.
NODE 2
AUXILIARYBUILDING
SPRAYREMOVAL
ANDDECAY LEAKAGE
TO THEENVIRONMENT

10
After a short time, the screen will clear and the highest-level IDASmenu will be displayed.
The highest-level IDAS menu allows you to branch to the various
models within the system. To start MENU-TACT, use the arrow keys tomove the selection window to the TACT line and press NEWLINE. The
following message will be displayed:
STARTING MENU-TACT
4.2 SELECTION PLANT SITE AND BRANCHING THROUGH MENU-TACT
4.2.1 Selecting the Plant Site
The first screen in MENU-TACT allows you to select the location of
the site to be modeled. The following table is displayed.
PICK THE SITE THAT YOU WISH TO GENERATE SOURCE TERM1. ARKANSAS 23. GINNA 45.2. BEAVER VALLEY 24. GRAND GULF 46.3. BIG ROCK POINT 25. HADDAM NECK 47.4. BRAIDWOOD 26. HATCH 48.5. BROWNS FERRY 27. INDIAN POINT 49.6. BRUNSWICK 28. KEWAUNEE 50.7. BYRON 29. LA CROSSE 51.8. CALLAWAY 30. LASALLE 52.9. CALVERT CLIFFS 31. MAINE YANKEE 53.
10. CLINTON 32. MCGUIRE 54.11. COMANCHE PEAK 33. MILLSTONE 55.12. COOK 34. MONTICELLO 56.13. COOPER STATION 35. NINE MILE POINT 57.14. CRYSTAL RIVER 36. NORTH ANNA 58.15. DAVIS BESSE 37. OCONEE 59.16. DIABLO CANYON 38. OYSTER CREEK 60.17. DRESDEN 39. PALISADES 61.18. DUANE ARNOLD 40. PALO VERDE 62.19. ENRICO FERMI 41. PEACH BOTTOM 63.20. FARLEY 42. PILGRIM 64.21. FORT CALHOUN 43. POINT BEACH 65.22. FORT ST .VRAIN 44. PRAIRIE ISLAND 66.
FOR.
QUAD_CITIESRANCHO_SECOROBINSON
SALEM/HOPE_CREEKSAN_ONOFRESEABROOK
SEQUOYAHST_LUCIESUMMER
SURRY
SUSQUEHANNATHREE_MILE_ISLANDTROJAN
TURKEY_POINTVERMONT_YANKEEVOGTLE
WATERFORD
WATTS_BARWASHINGTON__NUCLEARWOLF_CREEKYANKEE_ROWEZION
1
Specify the appropriate site by entering the number listed next tothe site name. This selects a unique four-letter identifier, which isincorporated into the names of the MENU-TACT input and output files,which are both saved in the IDAS data base. The code also uses the site
name selected to look up some site-specific data.

1.1
If the site you selected has multiple units and these units have
different physical characteristics, you will then be asked which unit
you wish to consider, as shown below.
Enter unit number for ARKANSAS ; 1,2, 1
Unit-specific data for the unit you select will be displayed on
subsequent data input screens.
After site selection, the program displays the MENU-TACT main menu.
4.2.2 Selecting the Path Through MENU-TACT (Main Menu)
The main MENU-TACT menu is shown below:
NRC - IDAS TACT MAIN MENUIDAS TACT - MENU VERSION
CREATE A NEW CASE
MODIFY AN EXISTING CASE
RETURN TO IDAS MAIN MENU
USE ARROW KEYS FOR SELECTION AND (CR) WHEN SELECTION IS THE CORRECT ONE
This menu has two forward paths and one path back to the main IDAS menu,
4.2.3 Modifying an Existing Case
If you select the case modification option, the screen will listexisting cases for the site (and unit) you select. If no cases existfor this site, an error message is printed and you return to the
previous menu. To select the case you want to modify, scroll the names

12
up (with the down arrow) or down (with the up arrow) to the highlightedbox and press NEWLINE. MENU-TACT will display the following messagewhile it loads the case you have selected:
WORKING
After you make your selection, the case name you requested and its
description will be shown. You will be asked if this is the case youwant to use.
CONFIRM CASE TO BE USEDCASE NAME: ARK1_008
CASE DESCRIPTION : test
USE THIS CASE? Y_ type Y or N
If you reply with an 'N' , you will return to a previous menu. The nextdisplay is an internal menu, shown below.
NRC - IDAS TACT MODIFICATIONS OPTIONSIDAS TACT - MENU VERSION
CHANGE TIME INDEPENDENT DATACHANGE TIME DEPENDENT DATA
CHANGE INITIAL SOURCE OF ACTIVITYREVIEW MIX
RUN THIS CASERUN A DIFFERENT CASE
RETURN TO IDAS MAIN MENU
USE ARROW KEYS FOR SELECTION AND (CR) WHEN SELECTION IS THE CORRECT ONE
This menu provides three forward choices and two backward choices. You
may run this case as it is. If you choose one of the data modification
options, you will step through the same screens that are used in
creating a new case, as described in Sect. 4.2.4.

13
4.2.4 Creating a New Case
If you select the new case option, the system will request a casename as shown below:
Record name = ARK1_027 ;
USE THIS CASE? Y_ type Y or N
The case name you enter will replace the default case name. Theprefix that identifies this site (e.g., BVRV for Beaver Valley) isassigned by the system. Note that this case name is also used toidentify the MENU-TACT output file that can be read by MESORAD. Thenthe screen is cleared and the system prompts:
Do you wish to initialize this record with datafrom a previous record? N
If you enter YES or Y, the screen will clear and display a list ofpreviously defined cases that can be used to initialize this case. Thisis the same screen that appears in response to the case modificationselection on the menu. This option allows you to create several cases,
with unique names, from the same set of initial information withoutstarting over for each case.
4.3 SPECIFYING BASIC TIME-INDEPENDENT DATA
The code will prompt for basic data as shown below:
BASIC TIME INDEPENDENT DATA FOR PWR ARKANSAS 1BASIC CASE DESCRIPTION/CASE NAME:test
NUMBER OF NODES (NODES <=4): 2NAME OF NODES VOLUME IN FT**3NODECl) = Primary .lOOOE+07NODE(2) = Contain. .1900E+07
REACTOR POWER (MEGAWATTS THERMAL) : 2568.REACTOR SHUTDOWN TIME - 24 HOUR CLOCK SITE TIME u.,enter 2 digits and NEWLINE 5 times: 87/08/04 14:00 (yr mo da hr mn)
ARKl:REFERENCE VOLUMES (ft**3)Primary system 9.7E+03
Containment 1•9E+06
ARE YOU DONE WITH THIS SCREEN ? Y

1.4
To change or enter data, move through the screen using the NEWLINEkey to go forward (down) and the ESCAPE key to go back (up). If a casewas initialized from a previous case or is being modified, the existingvalues will not be seen until you have stepped through to that entry.
You should always provide a basic description of the case byrevising the default title shown. This description will be used laterto identify the case. The default description is
Next you must specify the number of nodes (or volumes) and nodenames to be considered for this case. MENU-TACT requires a name foreach node. The volumes of the default nodes named for this unit are
always displayed on the bottom of the screen. Note that the environmentis not considered to be a node. Data relating to the release pathway tothe environment will be requested later. You should include only thosevolumes that account for major changes in the amount of activityreleased. Since these are bounding calculations, if changes in theassumptions do not change the end result by more than a factor of 10,they are not worth considering. Although up to four nodes can beconsidered, you should usually use only two or three nodes. Tables 1 and2 list the major volximes and release pathways. As an aid in identifyingand showing the assumed release pathway, two generic forms have beendeveloped (see Figs. 2 and 3). The assumed release pathway (along withany assumed release rates, etc.) should be clearly marked on this formwith a colored marker, simple. It is a good idea to have the releasepathway form marked before running MENU-TACT. The forms should bepassed along with the rest of the analysis as an aid in discussing theresults. You must specify the volume of each node in ft^; volumes mustbe greater than zero. The primary system, containment, and whereappropriate, secondary containment volumes for the plant are shown atthe bottom of the screen, for reference. In the case of boiling waterreactor (BWR) plants, only one total primary containment volume isspecified, representing the total of the components. If additional
information is needed, consult the Final Safety Analysis Report (FSAR).Reactor power level (thermal) at the time of the accident must be
specified and will be used to determine the initial amount of isotopes(Ci) available in the core. The default value displayed on this screenis the rated thermal level of the plant.

15
Table 1. Pressurized water
reactor major release pathways
Pathway Incident
A. Primary system 1. Primary system leak
a. Small
b. Large
2. Steam generator tube rupture
3. Bypass accident (e.g., tolow-pressure system outsidecontainment)
B. Primary containment 1. Leakage (0.1% to 0.5% perday)
2. Failure to isolate (100%per day)
3. Major failure (100% per hr)
a. Overpressurization
b. explosion
C. Secondary system 1. Secondary safety relief valve
2. Turbine exhaust
See Fig. 1.

16
Table 2. Boiling water reactor MK I generic major release pathways
Pathway Incident
A. Primary system 1. Primary system break/leak (loss-of-coolant accident)
2. Blowdown through pool
3. Main steam isolation valve leakage4. Bypass accident (e.g., control rod
drive break outside containment)
B. Primary containment 1. Leakage (0.5% per day)
2. Failure (e.g., overpressurization)(100% per day)
3. Nonisolation (100% per hr)
C. Reactor/refueling/turbine building
1.
2.
Leakage
Blowout
3. Standby gas treatment system
a. Filtered
b. Blowout
See Fig. 3.

tag caamgg
1) Cora Inttct-Urgt Cooltnt Utk
2) Ctad FallHTt(RuptwrtAhtdattoo201 of F«a1 PlRs)
3} TM Uka. (Grain Gomdanr Rataoia)
4) Cera Natt
FUaTIKPERATVtCIIPIMTIOII
600 F
PtCSEXT FtSMECTEOCOIOlTtOII CONOITION
AT 2-3 Has
UOO- 2000 F
>2400 F for to Htn.
>4500 F
AUXILIARY BLDG
17
CONTAINMENT BLDO
aunuanvttionmiMt nnami
FORM 2.2P
PWR Rolesaa
Pathway WoikoheatPreparod By —Oata/Tlma
TACT CAS£ NAFE
TURBINE BLDO
PWR Generic Major Release Pathways After Isolation
LEGEND
•=0 Spray
—H— niter
•^0) i Tranafar Path
MAJOR NODES
AVaaaal jPrlmary SyatemlB Primary ContainmentC Secondary SyatamD Turbine BuildingE Aiwlllary Building
Fig. 2. Pressurized water reactor release pathway form.
C8T

ciiitr coroiTiows
1) Cert Inttct*Urge Ceoltnt leak
2) Clad Fallurt(Rupttfra/Oatdatlon201 ef Ftttl PtM)
3) TNI Likt(Crate Boundary Micatt)
4) Cora NtU
SECONDARY CONTAINMENT
PRIMARYCONTAINMENT
FUELnxPERAmEIWUCATIOW
18
PRESEKT PROJECTEDCONDtTlOH CONOITIM
»T 2-3 HRS
1300 - 2000 F
>2400 F for 10 Ntn.
DRYWELL
REACTOR BUILDING
SUPPRESSION POOL(WET WELL)
FORM 2.2B
BWR RttMi*
Pmhway WorlohMt
Prapsrad "yOMa/Tlin* ______
TACT CASE NWE
MAIN STEAM LINE
MAIN STEAM LINE91 CMivi unc
f ISOLATION VALVE
LOW PRESSURE SYSTEM
TURBINE BUILDING
Figure 3. BWR Mark I release pathway form.
LEGEND
SO SPRAY
ISf"-TER3 BLOW OUT PANEL
RELEASE PATHWAY, REFERENCE
SBGT
M CHECKVALVE
M CLOSED VALVEit, SAFETY REUEF^ VALVE

19
Finally, shutdown time must be specified. You should use localtime at the reactor. The code asks for the date (Yr/Mo/Da) and time
(Hr:Mn). The date and time consist of five numbers, so you must press
NEWLINE five times to pass through these fields. Shutdown time can be
less than process start time to account for decay prior to the beginningof release from the core.
4.4 SPECIFYING CORE DAMAGE STATE
The next step is to define the amount and composition of materialthat will be released from the core or vessel. At this point, you are
selecting the mix of isotopes that will be included in the analysis.This material will be acted on as it proceeds through the reactor until
it is released to the environment, thereby becoming the "source term."
You must select one of four types of core damage: (1) coolant
release, (2) gap release, (3) grain boundary release, or (4) core melt.In the following display, 'NG' stands for 'noble gases'. The revisedcoolant option ('REV. COOLANT') is explained below.
SELECT THE ACTIVITY SOURCE YOU DESIRE.THE SELECTION SHOWN IS THE DEFAULT OR THE SELECTION LAST PICKED.THE SELECTIONS ARE:1) COOLANT (typical)(600 F)2) GAP (5% Cs 3% NG, 2% I, 0.1% Te,Sb) (1300 — . t>\3) GRAIN BOUNDARY (50%NG,I,Cs;10%Te;2%Sb;l%Ba,Mo;.l%Sr;.01%Ru)(3000 F)4) CORE MELT (100%NG,Cs,I,Rb;30%Te;20%Ba;7%Ru;.01%La,Y,Np,Ce,Sb)(>4500 F)5) REV. COOLANT (Enter Ci/gm of each isotope separately)
SOURCE TERM IS: 4
DO YOU WISH TO REVIEW THE MIX?(Y OR N) :y_
These levels of core damage were selected because they represent
the major damage regimes that can be associated with plant conditionsand release fractions. The core temperature associated with each of thedamage states is shown as part of the prompt along with a summary of theassumed release fractions. The radionuclides that dominate bone marrow
(whole body), lung, and thyroid dose are specified, along with noblegases. Whole body and lung doses were selected because WASH-1400(USNRC, 1975) concluded that these dominate early health effects anddeaths. Noble gases were included because these are most likely to bereleased during an accident. Table 3 shows the relationship between

20
Table 3. Overview of TACT release assvunptions
Core
conditions
Fuel
temperatureCF)
TACT assumed
release fractions
from core
Core intact,large coolant leak
<600 Typical
Gap (clad failure,rupture/oxidation)
1300-2000 5% Cs
3% NG
2% I
0.01% Te,Sb
Grain
boundaryrelease
3000 50% NG,I,Cs10% Te
2% Sb
1% Ba,Mo0.1% Sr
0.01% Ru
Core melt >4500 100% NG,Cs,I,Rb30% Te
20% Ba
0.7% Ru
0.01% La,Y,Np,Ce,Sb

Wi.A
iAM
WK
)ro
WM
hJM
WW
NJ
i-*
H*
!-*
_
roH
*
tn
!H
-l iz
0J>
HH
IH
Iz
0C
4C-
40
13
roH
I0
zn
rT
Drn
3>
!!
iro
t-
H*
W45
»
<3
1T
!i
II
II
I!
4^ji
oo
»oo
roro
ao
®?c!3
32
L0
tncn
cn
tn-H
-4H
nn
nx
xx
xx
?^
K7
^5
3>c:
co?3
33Jc
pcdr
nrT
irn
y)cn
wrn
rnrT
imi|i
3::p
::p^
OO
A>
0^
ro«0
Nl
C>
-ti
03LH
WW
zz
zz
iI
!
oI-
^ro
^vi
ovi
N3en
M-v
jCO
rooo
roho
fAw
vjen
wno
cnvj
^o(a
fAw
^0
In
33
2> •<
0O
nI
mm
m1
!\
oo
oM
-ro
<i
C.I
00
tAm
mm
mi
!i
Io
oo
o^
oi
en
-f!»
o(A
mm
\I
oo
f-
ro
0^
mm
m1
Ii
oo
ot>
4s.
ro
en
>0
fAn
im
mI
Ii
oo
oC
-4(A
ro
0*-
Ch
h30
<1
0^en
C-4
45.
4!»
+»
en4:»
t-*
<J
C-4
O0^
mm
mm
rn
mrn
m0
m0
00
00
00
0|j|}
+|lili!!lillll
oo
oo
oo
oo
oo
oo
oo
oo
oo
4s»
t>fA
eno
row
roo
j•-
*h»
i-*
oi-
*t-
*k
jc-
4
enf'4
ene*4
enen
c-4»-*
c*4w
4s!
4s.
r-o^
hoen
roc-4
ro^
nif
enen
4^r-o
nw o c 3
3n 0
en
o4
^m
mm
-r-f
+o
oo
en
4Si
4s
•vi
t-*
rom
mm
m+
++
-+o
oo
o^
4s
4s>
roC
hm
mH
--f
OO
4s
4s
v4
4s
Om
mm
++
-t-
oo
oc-
44
sc-
4
JJj
t-*
i-*
00
0•r
-r-f
oo
oc-
44
sc
-4
4so
roc-
4ro
ro*o
^ro
eno
<3
enen
03h*
oo0
00
00
00
00
00
^0
00
00
0+
-f-i
-+
++
-f-r
++
++
++
++
++
oo
o0
00
00
0o
oo
o0
00
0o
roc-
4ro
c-44s
4s4s
c-4N3
4*4s
c-4ro
4s4s
4s4s
4s
njfj
o4s
4sc-4
roro
4s0^
oo
4s^
roc-4
00
00
00
00
0ro
enro
C'401
13
£n
3O
iZ
In
n1
M0
n\
zo
0-1
0z
0r
>0
oo
00
0!
ti
0o
03ro
»-*
^c-
4O
1t
«
oo
o0
00
}!
Io
•-*o
<3
roH
*
00
00
00
00
1I
i!
oro
t-*
4s
4sc-
4ro
ro4»
OO
O»-
*t-
'
o 00
1i
oo
430
3
oo
o0
00
1i
tI-
'O
roo
f-
00
00
00
00
1i
iI
I-k
H*
J-'
>-*
M.
oro
oo
00
1I
oo
43
43
OO
O0
00
1i
I oro
o•-
0o
o0
00
1i
ia
0o
oO
OO
OO
OO
C'
oo
oo
oo
00
00
00
00
00
00
00
00
00
1i
II
iI
ii
ii
II
i1
fi
Ii
OO
oo
oo
oo
oo
oo
oo
l-l-
I-'
»-*
o
oo
o0
00
1I
IO
»-'
f-*
t->-
O
4s-n
jro
c-4
oo
oo
oo
00
0ro
enro
c-4en
oo
oo
oo
oo
oo
oo
oo
oo
00
00
00
00
00
00
00
00
0
H--
M-
oo
oo
oo
oo
oo
oo
o
oo
'Oc*
oo
"en
enen
c-r
c-4c-4
c-4c*}
c-4c-4
c-4c-4
r-j
roro
ror-o0
3>
0 1H
ir\
04
3
r-o
•0
03
30
0•P
2>i
n0
Hro e
n•
00
33
•0
2>©
\n
•0
HH
*
HI
*0
Z0
33
00
i>r
-Tn
HQ
H
0 .I
11
ii
Ii
{}
i!
iI
II
!i
iI
i1
ti
Ii
Ii
ii
A.A
-io
Ao
oo
oo
oo
oo
oo
oo
oo
oo
oo
oo
oo
oo
oo
p^
^^
1-1i-k
1-^4s
4s4s
4sro
roro
roro
roro
roro
roro
ror-o
ror-o
roro
Ii
ii
ii
ii
i!
II
fI
II
I!
I1
Ii
I!
1I
ii
HI
t-i
»-i
roV}
nj
^N
jN
iro
roc-4
c-4c-4
h*h*
hi
i-H
iH
I>
-*H
*
AO
OO
Oo
oo
oo
oo
o0
00
00
oo
oo
oo
o0
00
c4a
i4s
4a^
HIc-4
c-4ro
horo
ioro
oo
oo
oo
oo
oo
00
00
00
o
H 8- M (D 4>
c/a
•d (D o H
-H
)
o 'I-'
<I>
(fl
(D P» CO
CO
•d rt
o d (fl
N3

22
core damage, assumed radionuclide release fractions, and core
temperature. Specific release fractions assumed for each radionuclide
are shown in Table 4. Assumed inventories [Ci/MW(t)] were for a 22,000
MWd/ton bum-up case. This is tjrpical of normal Sum up. Coolant
levels are based on American National Standards Institute/American
Nuclear Society (ANSI/ANS) 18.1-1984, "Radioactive Source Term for
Normal Operation of Light Water Reactors." These are typical of normal
coolant levels.
Actual coolant sample concentrations may be known and could be
considerably different than those assxuned. Therefore, the assumed
levels may require modification to correspond to -a known coolant sample.This can be done by multiplying (1) the assumed iodine levels by ascaling factor, RELFRI, and (2) the noble gases by RELFRN as discussedbelow. Using this method, actual coolant concentrations normally arewithin a factor of 2 of those defined in MENU-TACT for all isotopes.This is well within the uncertainties associated with coolant release
and transport. This is particularly true if the sample was taken in
front of the vent and an iodine spike has occurred or core damage hasprogressed. An iodine spike is characterized by a rapid increase in
iodine concentration in the coolant by as much as three orders of
magnitude. Iodine spikes have been observed to occur followingshutdowns, start-ups, rapid power changes, and coolant
depressurizations. During 1983, spikes occurred at 10 pressurized waterreactors. Reliance on a pre-event sample has obvious shortcomings. Youshould expect to revise the coolant concentrations used in your analysisas the event proceeds.
A second method of specifying the concentrations in the coolant
allows you to enter specific coolant concentrations for each isotope.This Ls the frfth option on the menu. When you select it, a screen
appears with all available nuclide names and their default coolant
concentrations in Ci/g. You may select the default value or enter a new
one for each isotope. These data are stored with the rest of the data
for this case, so that data entered here will appear as the defaultvalues in subsequent modifications of this case.

23
REVISED COOLANT MIX (Ci/gm)FOR ARKANSAS 1
1 1-131 .220E-08 14 XE-138 .OOOE+00 27 RU-103 .200E-10
2 1-132 .220E-07 15 CS-134 .300E-10 28 RU-106 .300E-11
3 1-133 .150E-07 16 CS-136 .200E-10 29 BA-140 .400E-09
4 1-134 .430E-07 17 CS-137 .800E-10 30 Y-91 .400E-10
5 1-135 .220E-07 18 TE-129M .400E-10 31 LA-140 .400E-09
6 KR-85 . 000E4-00 19 TE-131M .lOOE-09 32 CE-144 .300E-11
7 KR-85M .OOOE+00 20 TE-132 .lOOE-10 33 NP-239 .800E-08
8 KR-87 .OOOE+00 21 SB-127 .OOOE+00
9 KR-88 .OOOE+00 22 SB-129 .OOOE+00
10 XE-131M .OOOB+OO 23 SR-89 .lOOE-09
11 XE-133M .OOOE+00 24 SR-90 .700E-11
12 XE-133 .OOOE+00 25 SR-91 .400E-08
13 XE-135 .OOOE+00 26 MO-99 .200E-08
DO YOU WANT TO MODIFY THESE VALUES? N
The gap and grain boundary release fraction are based on NUREG-0772
(USNRC, 1981). These relationships are based on very sparse data and
are subject to great uncertainties. These release fractions are
estimated to be correct only to within one order of magnitude, and these
values are single-point estimates of a continuum of release fractions as
a function of temperature. Therefore, even if you predict the core
damage state accurately, your estimate of initial material released is
very rough (as is all of the subsequent analysis).
The core melt release fractions are typical of the results of core
melt accidents discussed in NUREG-0957 (USNRC, 1985).
For gap, grain boundary, or core melt, the specific amount (Ci) of
material released from the core is in terms of Ci/MW(t) and is scaled by
the code based on the actual reactor power level. These amounts may not
be adjusted individually. The assumed inventory is for an "old" core
(33,000 MWd/ton burn up). If the core is only a few months old (e.g.,
Three Mile Island at the time of the accident), the long half-life
radionuclides will be at a much lower level. This can be seen from
Table 5, which shows an example of the buildup of Sr-90 and Cs-137 as a
function of core life. While this can have a major effect on activity,
the long-half-life radionuclides are not the most important contributors
to whole body dose. The variation between these concentrations and the
actual concentrations should be well within the uncertainties of the
analysis and is not considered in the code.

24
Table 5. Strontltm and cesiuminventories vs core age^
Inventory(Ci)
Core age(months) Sr-90 Cs-137
2 4.5 X 10^ 5.4 X 10^3
00
VO
X 10^ 8,2 X 10^12
in
CM
X 10^ 3.0 X 10^24 4.0 X 10^ 5.0 X
VOo
1—1
Based on Case l.B of
NUREG/CR-3108.

25
4.5 REVIEWING THE ASSUMED MIX
The mix assuuned for each core damage state or coolant concentration
can be reviewed. If you decide to review the mix, the following screen
is shown.
** ISOTOPE DATA USED IN CALCULATIONS **
PWR COOL BWRSOURCE CONCENTRATION
CI/MWT CI/GMISOTOPE DECAY
« NAKE 1/HR
1 1-131 3.6E-03
2 1-132 3.0E-01
3 1-133 3.3E-02
4 1-134 7.9E-01
5 1-135 l.lE-01
6 KR-85 7.4E-06
7 KR-85M 1.5E-01
8 KR-87 5.4E-01
9 KR-88 2.4E-01
10 XE-131M 2.4E-03
11 XE-133M 1.3E-02
12 XE-133 5.5E-03
13 XE-135 7.6E-02
14 XE-138 2. 9E-(-00
15 CS-134 3.8E-05
16 CS-136 2.2E-03
17 CS-137 2.6E-06
18 TE-129M 8.6E-04
PRESS
19 TE-
20 TE-
21 SB-
22 SB-
23 SR-
24 SR-
25 SR-
26 HO-
27 RU-
28 RU
29 BA-
NEHLINE
-131M 2•132
127
129
-89
•90
-91
-99
•103
-106
-140
2.8E-I-04
4. lE-f04
5.9E-t-04
6.5E-I-04
5. 5E-i-04
1.9E-t-02
7.9E-I-03
1.5E-I-04
2.2E-I-04
3.7E-I-02
2.1E-F03
5.7E-F04
1.2E-I-04
1.2E-t-042.3E-I-03
9.2E-t-02
2. OE-i-03
6.4E-I-02
4.5E-
2 . IE-
la 4E-
3.4E-
2.6E-
4.3E-
1.6E-
1.5E-
2.8E-
7.3E-
7.0E-
2.6E-
8.5E-
1.2E-
7.1E-
8.7E-
9.4E-
1.9E-
08
07
07
07
07
07
07
07
07
07
08
06
07
07
09
10
09 8.
10 4.
TO CONTINUE
.3E-02 4.1E-«-03
.9E>03 4.1E-I-04
.5E-03 3.5E+03
.4E-02 9.0E-I-03
.7E-04 3.4E-f04
.8E-06 l.'7E-f03
.3E-02 3.6E-I-04
.OE-02 5.2E-f04
.3E-04 4.2E-t-04
.8E-05 l.lE-i-04
.3E-0
1.5E-09
1.7E-09
O.OE-01
O.OE-01
i.4E-101.2E-11
9.6E-106.4E-09
7.5E-09
9.6E-08
2E-09
2E-08
5E-08
3E-08
2E-08
OE-01
OE-01
OE-01
OE-01
OE-01
OE-01
OE-01
OE-01
OE-01
OE-11
OE-11
OE-11
OE-11
l.OE-10
1.OE-11
O.OE-01
O.OE-01
l.OE-10
7.0E-12
4.0E-09
2.OE-09
2.OE-11
3.0E-12
GAP
FRACT
OE-02
OE-02
OE-02
OE-02
OE-02
OE-02
OE-02
OE-02
OE-02
OE-02
OE-02
0E^2
OE-02
OE-02
OE-02
OE-02
OE-02
OE-04
G.B.
FRACT
5.0E-01
5.0E-01
5.0E-01
5.0E-01
5.0E-01
5.0E-01
5.0E-01
5.0E-01
5.0E-01
5.0E-01
5.0E-01
5.0E-01
5.0E-01
5.6e-015.0E-01
5.0E-01
5.0E-01
l.OE-01
l.OE-04
l.OE-04
l.OE-04
l.OE-04
O.OE-01
O.OE-01
O.OE-01
O.OE-01
O.OE-01
O.OE-01
l.OE-01
l.OE-01
2.OE-02
2.OE-02l.OE-03
l.OE-03
l.OE-03l.OE-02
l.OE-04
l.OE-04
MELT
FRACT
l.OE-l-00l.OE-l-00
l.OE-i-00
l.OE-fOO
l.OE-J-00
l.OE-HOO
l.OE-l-00
1.0E-^00
l.OE-fOO
l.OE-l-00
l.OE-hOO
l.OE-l-00
l.OE-l-00
1.0E-^00
l.OE-fOO
l.OE-fOO
l.OE-fOO
3.0E-01
3.0E-01
3.OE-01
2.OE-02
2.OE-027.PE-027.0E-02
7.OE-02
l.OE-01
7.0E-03
7.0E-03
Note that this listing is for the initial assumed mix for each coredamage state and does not reflect any changes resulting frommultiplication by the factors RELFRI or RELFRN.

26
4.6 SPECIFYING THE FRACTION OF INITIAL ACTIVITY RELEASED
FROM THE CORE
Once the Initial core damage state is chosen, you can adjust the
assumed release fractions as mentioned above. MENU-TACT will request
the fraction of noble gases (Xe, Kr) and particulates and aerosols
(other radionuclides), which should be used as shown below:
ADJUSTMENT OF DEFAULT INVENTORY
FRACTION OF NOBLE GASES = 1.000FRACTION OF PARTICULATE/AEROSOLS = 1.000
These scaling factors are used to increase or decreasethe default number of Curies available in theinventory for release from the core or in the coolant.
ASSUMED MIX IS FOR CORE MELT
Note that the core damage state selected earlier (e.g., core melt) is
displayed.
The initial core release inventories assumed will be multiplied by
these fractions. You must specify two factors, one for noble gases
(RELFRN) and one for the other radionuclides (RELFRI). These factors
can be greater or less than 1. They can be used to
1. adjust the default coolant activities to match actual measured
coolant concentrations,
2. accoimt for plate-out or other removal mechanisms in the vessel, or
3. adjust the default damage states up or down.
You should not change these values from the default value (i.e., 1),
unless vessel removal or actual coolant sample results are being
considered; otherwise, the relationship to a known damage state will be
lost.
4.7 SPECIFYING TIME/NODE-DEPENDENT DATA
Three times must be entered to define process starts and stop. For
each node, the following data must be provided:

27
1. a particulate/aerosol (non-noble gas) removal coefficient, A
(ftVr):
2. the portion of the released isotopes injected into each voliame
(node) at the start of the probl
fraction/hr for other releases);
3(node) at the start of the problem (ft /hr for coolant releases and
3. the rate at which material is transferred from one node to another3
(fraction/hr or ft /hr); and
4. the filter efficiency of any filter mechanism encountered during
transfer between or within each node (hr ).
These are discussed in detail in Sects. 4.7.1 through 4.7.4.
4.7.1 Specifying Process Start and Release Start and Stop Times,
and Particulate/Aerosol Removal Coefficients (A)
The prompt for these data follows:
TIME INDEPENDENT DATA, SHUTDOWN TIME IS 87/08/04 14:00
PROCESS START TIME: 87/08/04 14:00 24 HOUR CLOCK SITE TIMESTART OF RELEASE: 87/08/04 14:00 (Yr/Mo/Da Hr:Mn)RELEASE END TIME: 87/08/04 15:00
PARTICULATE/AEROSOL/IODINE REMOVAL COEFFICIENTS (LAMBDA)NODE NAME COEFFICIENT (LAMBDA/HR)
1 Primary .OOOOE+002 Contain. .OOOOE+00
LAMBDAS FOR LARGE VOUJMESHOLD UP TIME SPRAY ON SPRAY OFF
1 hr 3.5 2.04 hr 1.0 0.876 hr 0.7 0.58

28
^.7.1.1 Specifying process start and release start and stop times
The process start time refers to the beginning of the release from
the core. The release start time refers to the beginning of the release
from the nodes to the environment. Shutdown, start of the process, and
start of the release may be at the same time. As can be seen in Fig. 4,
all removal and transfer processes defined to operate in-plant act fromthe start of the process to the end of the release. Processes allowingrelease to the environment act only from the start of the release to the
end of the release. Radioactive decay of isotopes occurs from shutdown
until the end of the release.
^•7.1.2 Specifying volume removal coefficients (|A])
This coefficient implements the processes that remove a fraction
hour of the particulates and aerosols (non-noble gases) suspendedinside a large volume: This applies to containment and auxiliarybuildings where sprays or natural processes act on any material held.These processes can be very important if they have sufficient time toact.
Removal coefficients may depend on the chemical or physical form ofthe radionuclide. However, the current consensus is that, during asevere accident, all non-noble gases will form particulates or aerosols.
Therefore, MENU-TACT allows you to specify only one removal coefficient.These removal coefficients will be applied to all non-noble gases. Youcannot specify radionuclide-specific removal coefficients.
The removal coefficient is X in the equation:
Final concentration —AtOriginal concentration " ®
Test results have shown that sprays are very effective initially.Later, natural processes appear to dominate. Figure 5 shows a tjrpicalexperimental result. Note that a single A does not characterize this
process over time. The internal plant A is valid initially and, for the
remainder of the time, the natural coefficients would be valid.

SHUTDOWNPROCESS
START
29
START OFRELEASE
END OFRELEASE
ENVIRONMENTAL RELEASE
IN-PLANT TRANSFER AND FILTERING
DECAY OF FISSION PRODUCTS
Fig. 4. Relationship among times entered.

i
NATURALEFFECTSONLY
SPRAY ON
30
TOTAL IODINE
NATURAL EFFECTS ONLY
SPRAY ON
NOTE SCALE^CHANGE->^
TIME AFTER RELEASE, HUNDREDS OF MINUTES
Fig. 5. Comparison of voliane removal effects.
15 30

31
However, MENU-TACT allows only one coefficient to be specified.
Consequently, the appropriate X's to account for this effect as a
function of time have been calculated based on Fig. 5; these are shown
in Table 6. The A's for 1, 2, 4, and 6 hr of hold-up time are shown at
the bottom of the screen for reference. The hold-up time is the period
between the start of the process and the start of the release.
4.7.2 Specifying the Fraction of Initial Activity Released
to Various Nodes
The second set of time- (and node-) dependent data requested is the
initial distribution of inventory in the various nodes. The prompt for
this information is shown below.
INITIAL DISTRIBUTION OF MATERIAL AT START OF PROBLEMINITIAL DISTRIBUTION OF CORE FRACTIONS
FRACTION OF CORE MELT ACTIVITY RELEASED.
IN Primary .8IN Contain. .2
(AND/OR)
INITIAL RELEASE RATE FROM COREFRACTION/HR OF CORE MELT ACTIVITY RELEASED.
TO Primary .OOOOE+00TO Contain. .OOOOE+00
THESE RELEASE FRACTIONS ARE COMBINED IN THE NODES TO START THE PROBLEM**NOTE: DEFAULT ACTIVITY ALREADY MULTIPLIED BY -
1. FOR NOBLE GASES; 1. FOR PARTICULATE/AEROSOLS
3MENU-TACT allows you to place any portion of the coolant (ft ) or
gap, grain boundary, or core melt (fraction) specified directly into all
nodes at the start of the release but not directly into the environment.3
Be careful because coolant is expressed in terms of ft , while gap,
grain boundary, and core melt are in terms of fraction of core3
inventory. The code prompt indicates the units (fraction or ft ) and
tjrpe of damage (e.g., core melt). You must start the problem by placing
material in one or more nodes. You may not transfer material directly
to the environment. Remember that, earlier in MENU-TACT, you may have
decided to reduce or increase the initial assumed release fraction. If

32
Table 6. Volume removal coefficient, A
At
(hr)^With spray
(7)Without spray
(7)
1 3.5 2.0
4 1.0 0.87
6 0.7 0.58
24 0.22 0.18
^At —Time the material is heldin volume before release.

33
you did, this is a fraction of those fractions. As a reminder, the
bottom of the screen shows the damage state selected (e.g., core melt)
followed by the factors (RELFRN and RELFRI) used to adjust initial gas
and non-noble gas release fractions.
Material can be transferred once (e.g., fraction of gap), at a rate
(fraction of gap per hour), or both. If this is not a coolant release,
the code checks to see if the amount of material injected exceeds 100%
of the inventory and prints a warning message if it does. This is an
informational warning only. You may proceed with the analysis
regardless of the amount of material injected.
4.7.3 Specifying In-Plant Transfer Rates and Filter Efficiencies
The next data requested are in-plant transfer rates and filter
efficiencies as shown below.
FROM TO
IN-PLANT TRANSFERS
PARTICULATE/AEROSOL/IODINEFILTER EFFICIENCY (% 0.0 - 100.0)
.OOOOE+00
99.
TRANSFER RATE(CFM)Primary Primary .OOOOE+00
Contain. 2.
Contain. Primary .OOOOE+00Contain. .OOOOE+00
.OOOOE+00
.OOOOE+00
REFERENCE FILTER DATA: FILTER CONDITIONS EFFICIENCYDRY/SLOW 99%
BLOW OUT/BY PASS 0%
4.7.3.1 Specifying in-plant transfer rates of material
This is the rate (ft /hr) at which material is assumed to be passed
from one volume (node) to another. This could be based on pump or fan
capacities, leak rates, etc. Tjrpical transfer rates are listed in Table
7. The basis for selecting these rates is given in Appendix B. Note
that you can recirculate material from a node to itself. The code willdilute the material as it goes from one node to the next to account for

34
Table 7. Typical transfer rates
Type
volume
(ft^)Design rate
(ft^/min)
Containment leak rates
100%/day
(failure of
isolation seal)
(ft^/min)
100%/hr
(catastrophic)
(ft^/min)
PWR-large dry 2.6 X 10^ 2 (0.1%/day) 1.8 X 10^ 4 X lo'̂PWR-subatmospheric 1.8 X 10^ 1 (0.1%/day) 1.2 X loV 3 X
oX—1
PWR-ice condenser 1.6 X 10^ 3 (0.25%/day) 1.1 X 10^ 3 X 10^BWR Mark I 1.6 X 10^ 1 (0.5%/day) 1.1 X 10^ 3 X 10^BWR Mark II 2.0 X 10^ 1 (0.5%/day) 1.4 X 10^ 3 X 10^BWR Mark III - 2.7- X 10^ 1 (0.4%/day) 1.9 X 10^ 4 X 10^
Steam generator tube rupture (SGTR)3
1 tube at pressure = 75 ft /min (500 g/min)
Evolution of iodine from a pool (leakage)3
1%/hr - relation to ft /min will bebased on leakage rate

35
refilling of the first node and dilution in the second. This can have a
major effect on the release concentrations. For example, specifying a3
transfer rate (ft /hr) equivalent to 100% of the volume in 1 hr will not
result in transfer of 100% of the radioactive material in the volume in
1 hr. The magnitude of this effect can be seen in Table 8. If you do
not want this effect considered, specify either a small volume or large
transfer rate.
4.7.3.2 Specifying in-plant filter efficiencies
The code allows a percentage of the particulate/aerosol to be
removed as it passes from one node to another (or as it recirculates
within a node). You must be careful to ensure that all major filter
mechanisms are considered (e.g., suppression pool). Filter efficiencies
for the Standby Gas Treatment System (SGTS), filters, primary system,
suppression pool, ice condenser, and steam generator partitioning are
summarized in Table 9. The basis for these efficiencies is discussed in
Appendix C. Note that these filter efficiencies, like the removal
coefficients entered earlier, are not nuclide-specific.
4.7.4 Specifying Releases to the Environment
The next screen is shown below.
ENVIRONMENTAL RELEASE DATASTART OF RELEASE 87/08/04 14:00; END OF RELEASE 87/08/04 15:00
PARTICULATE/AEROSOL/IODINEFROM TO TRANSFER RATE(CFM) FILTER EFFICIENCY (% 0.0 - 100.0)Primary ENVIRON 1. 99.Contain. ENVIRON 10. 99.00E+00
REFERENCE FILTER DATA: FILTER CONDITIONS EFFICIENCYDRY/SLOW 99%
BLOW OUT/BY PASS 0%
ARKl: CONTAINMENT FAILURE/LEAK RATE DATADESIGN LEAK RATE: 150. FT**3/M
PREDICTED FAILURE PRESSURE: 0. PSIG
This screen allows you to enter rates of transfer from nodes to the
environment and filter efficiencies for these transfers. These
transfers begin at the time entered as the release time. Clearly, at

36
Table 8. Example TACT 1-hr transfer rates
Percentageof voltime specified
in TACT to be
transferred in 1 hr
>200
100
50
20
10
1
Percentageof radioisotope in
voliime calculated to be
transferred by TACT
100
63
38
17
9
1

37
Table 9. Filter efficiency (particulate/areosols)
Filter location Conditions Efficiency(%)
Filters/standby gastreatment system
Case 1: Dry, low pressure 99.9
Case 2: Wet, high pressure(system blowout)
0
Primary systemretention
Short residence time, fastflow
15
Long residence time, slowflow
70
Assumed 40
Suppression pools Violent flashing of steam(greater than decay heat)
Slow steady flow (decay-heat)
15
Subcooled
Saturated
99
95
Ice condenser No recirculation 50
With recirculation 75
Steam generatorpartitioning
Dry steam (1000 partitioningfactor)
98
Solid water (coolant) 0

38
least one of these transfer rates should be greater than zero or no
release to the environment will be generated. This is the final data
input screen. At the bottom of the screen are shown the design leak
rates and projected failure pressure, if known. Table 10 shows
representative containment capabilities, and Table 7 shows typical
transfer rates for these various containments. The basis for these
rates is discussed in Appendix C.

39
Table 10. Representative containment structural capabilities
Typicalplant/type
DesignPressure
(psig)
Capability (failure)pressure
(psig)
Dry Pressurizedwater reactor
47 134
Subatmospheric 45 119
Ice condenser 12 50
Mark I 56 117
Mark II 55 140
Mark III 15 60
^ From NUREG-1037 (USNRC, 1985).
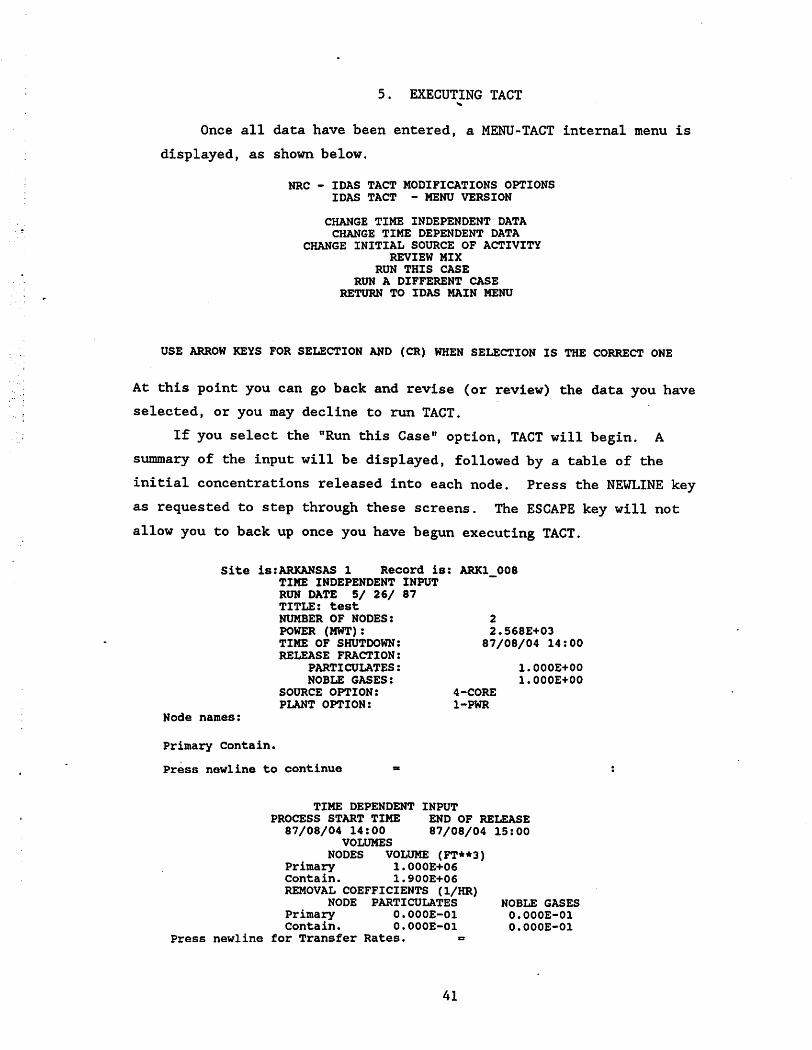
5. EXECUTING TACT
Once all data have been entered, a MENU-TACT internal menu is
displayed, as shown below.
NRC - IDAS TACT MODIFICATIONS OPTIONSIDAS TACT - MENU VERSION
CHANGE TIME INDEPENDENT DATACHANGE TIME DEPENDENT DATA
CHANGE INITIAL SOURCE OF ACTIVITYREVIEW MIX
RUN THIS CASE
RUN A DIFFERENT CASERETURN TO IDAS MAIN MENU
USE ARROW KEYS FOR SELECTION AND (CR) WHEN SELECTION IS THE CORRECT ONE
At this point you can go back and revise (or review) the data you have
selected, or you may decline to run TACT.
If you select the "Run this Case" option, TACT will begin. A
summary of the input will be displayed, followed by a table of the
initial concentrations released into each node. Press the NEWLINE key
as requested to step through these screens. The ESCAPE key will not
allow you to back up once you have begun executing TACT.
Site is:ARKANSAS 1 Record is: ARK1_008TIME INDEPENDENT INPUTRUN DATE 5/ 26/ 87TITLE: test
NUMBER OF NODES: 2
POWER (MWT): 2.568E-i-03TIME OF SHUTDOWN: 87/08/04 14:00RELEASE FRACTION:
PARTICULATES: 1.OOOE+00
NOBLE GASES: l.OOOE+00
SOURCE OPTION: 4-CORE
PLANT OPTION: 1-PWR
Node names:
Primary Contain.
Press newline to continue » :
TIME DEPENDENT INPUTPROCESS START TIME END OF RELEASE
87/08/04 14:00 87/08/04 15:00VOLUMES
NODES VOLUME (FT**3)Primary 1.OOOE+06Contain. 1.900E+06REMOVAL COEFFICIENTS (1/HR)
NODE PARTICULATES NOBLE GASESPrimary O.OOOE-Ol O.OOOE-01Contain. O.OOOE-01 O.OOOE-01
Press newline for Transfer Rates. =
41

42
INTER-NODE TRANSFERSFROM TO TRANSFER RATES FILTER EFFICIENCYNODE NODE (CFM) (PERCENT)—7 7 PARTICULATES -NOBLES—Primary Contain. 2.00 99.0 O.OOOE-01
RELEASE TO ENVIRONMENTFROM 87/08/04 14:00 TO 87/08/04 15:00FROM TRANSFER RATES FILTER EFFICIENCYNODE (CFM) (PERCENT)
PARTICULATES -NOBLES—Primary 1.00 99.0 O.OOOE-01Contain. 10.0 99.0 O.OOOE-01
*** all transfer rates not listed are zero ***Press newline to continue =
AT 87/08/04 14:00
Contain.438E+07
106E+07
030E+07
338E+07
825E+07
758E+04
057E+06
704E+06
130E+d7900E+05
.079E+06
,928E+07
.163E+06
.163E+06
181E+06
725E+05
027E+06
861E+04
317E+05
317E+06
163E+0ff
181E+06
725E+05
027E+06
861E+04
317E+05
317E+06
ACTIVITY (CURIES) IN EACH NODE(BEGINNING OF PROCESS)
ISOTOPE ENVIR. Primary1-131 O.OOOE-01 5.752E+07 1.1-132 O.OOOE-01 8.423E+07 2.1-133 O.OOOE-01 1.212E-l-b8 3.1-134 O.OOOE-01 1.335E+08 3.1-135 O.OOOE-01 1.130E+08 2.KR-85 O.OOOE-01 3.903E+05 9.KR-85M p.OOOE-01 1.623E+07 4.KR-87 O.OOOE-01 3.082E+07 7.KR-88 O.OOOE-01 4.520E+07 1.XE-131M O.OOOE-01 7.601E+05 1.XE-133M O.OOOE-01 4.314E+06 1.XE-133 O.OOOE-01 1.171E+08 2.XE-135 O.OOOE-01 2.465E+07 6.XE-138 O.OOOE-01 2.465E+07 6.CS-134 O.OOOE-01 4.725E+06 1.CS-136 O.OOOE-01 1.890E+06 4.CS-137 O.OOOE-01 4.109E+06 1.TE-129M O.OOOE-01 3.944E+05 9.TE-131M O.OOOE-01 2.527E+06 6.TE-132 O.OOOE-01 2.527E+07 6.XE-138 b.OOOE-Ol 2.465E+07 6.CS-134 O.OOOE-01 4.725E+06 1.CS-136 O.OOOE-01 1.890E+06 4.CS-137 O.OOOE-01 4.109E+06 1.TE-129M O.OOOE-01 3.944E+05 9.TE-131M O.OOOE-01 2.527E+06 6.TE-132 O.OOOE-01 2.527E+07 6.
It is possible to set up your pathways and transfer rates so that
the numerical routines in TACT will not be able to find a solution in
terms of the released amounts. For example, this can happen if all
transfer rates are equal. When the TACT numerical routines cannot find
a solution, TACT will print a (fairly cryptic) error message and return
you to the main MENU-TACT menu. You can then modify your transfer rates
and try again.

43
TACT can produce detailed tables of results by node and time step.
In general, these tables are not helpful in emergency situations. The
default summary tables should be sufficient for your needs. You respond
with Y or N at each request for a detailed table listing.
After the summary table of final concentrations is displayed, youwill be.asked if you want to save your results.
ACTIVITY RELEASED TO THE ENVIRONMENT FROM 87/08/04 14:00 TO 87/08/04 15*00TfiftTr»DPISOTOPE . RELEASED
CURIES1-131 7.977E+011-132 l.OlOE+021-133 1.656E+021-134 1.282E-I-021-135 1.490E-f02KR-85 5.424E+01KR-85M 2.089E-(-03KR-87 3.301E+03KR-88 5.571E+03XE-131M 1.055E-i-02XE-133M 5.955E+02XE-133 1.623E+04XE-135 3.299E-f03XE-138 1.102E+03CS-134 6.564E+00CS-136 2.623E+00CS-137 5.708E+00TE-129M 5.478E-01TE-131M 3.470E+00
Press newline to continue
TE-132 3.495E+01SB-127 1.990E-01SB-129 4.952E-01SR-89 6.791E+00SR-90 3.396E-01SR-91 6.936E-f00MO-99 1.476E+01RU-103 8.388E-01RU-106 2.198E-01BA-140 2.908E-f01Y-91 1.056E-02LA-140 1.528E-02CE-144 8.562E-03NP-239 1.560E-01
Do you want to use these results in MESORAD?
In general, you will want to- save your TACT results because you cannot
use them as input to MESORAD unless you save them at this point.
When TACT finishes, the MENU-TACT internal menu is displayed and
you can run another case or exit MENU-TACT.

6. REFERENCES
P. Easley and W. Pasedag, "NRG Source Term Assessments for Incident
Response Dose Projections," pp. 6.19-6.25 in Computer Applications
in Health Physics, 1984.
G. G. Killough, C. L. Begovich, A. L. Sjoreen, and L. W. Bell, A Guide
for the TACT-III Computer Code. NUREG/CR-3287, ORNL/TM-8763, Oak
Ridge National Laboratory, Oak Ridge, Tenn., 1983.
U.S. Nuclear Regulatory Commission, Technical Bases for Estimating
Fission Product Behavior During LWR Accidents. NUREG-0772, Office
of Nuclear Regulatory Research and Office of Nuclear Reactor
Regulation, Washington, D.C., June 1981.
W. B. Wilson, T. R. England, and R. J. LaBauve, Extended Burnup
Calculations for Operating Reactor Reload Reviews. NUREG/CR-3108,
Los Alamos National Laboratory, Los Alamos, N.M., February 1983
(see Table 5).
U.S. Nuclear Regulatory Commission, Reactor Safety Study--An Assessment
of Accident Risks in U.S. Commercial Nuclear Power Plants. WASH-1400,
NUREG-75/014, October 1975.
U.S. Nuclear Regulatory Commission, Reassessment of the Technical Bases
for Estimating Source Terms. NUREG-0956, July 1985 (draft).
U.S. Nuclear Regulatory Commission, Containment Performance Working
Group (Nuclear Regulatory Commission) Report: Draft Report for
Comment. NUREG-1037, Washington, D.C., May 1985 (see Table 9).
45

Appendix A
MATHEMATICAL DESCRIPTION OF TACT
47

NRC SOURCE TERM ASSESSMENT FOR INCIDENT RESPONSE DOSE PROJECTIONS
Patrick Easley and Walter PasedagU.S. Nuclear Regulatory Cofflmisslon
Washington, D.C.
ABSTRACT
The NRC provides advice and assistance to licensees andState and local authorities In responding to accidents. TheTACT code supports this function by providing source termprojections for two situations during early (15 to 60 minutes)accident response: (1) Core/containment damage Is Indicated,but there are no measured releases. Quantification of apredicted release permits emergency response before people areexposed. With TACT, response personnel can estimate releasesbased on fuel and cladding conditions, coolant boundary andcontainment Integrity, and mitlgatlve systems operablllty. Forthis type of estimate, TACT Is Intermediate between defaultassumptions and time-consuming mechanistic codes. (2) A combination of plant status and limited release data are available.For this situation. Iterations between predictions based onknown conditions which are compared to measured releases givesreasonable confidence In supplemental source term Informationotherwise unavailable: nucllde mix, releases not monitored,and trending or abrupt changes. The assumptions and modelsused In TACT, and examples of Its use, are given In this paper.
BACKGROUND - THE ROLE OF TACT
The Nuclear Regulatory Commission established the IncidentResponse Center to advise and assistthe licensee and State and localauthorities In responding to radiological emergencies. The Intermediate Dose Assessment System(IDAS) Is a group of Integratedcomputer codes designed to provideoffsite
' I
doseNRC's Initial responselogical emergency.
projections during theIn a radlo-
Thls paper
dlscusses one ofTACT (Transportcan be used toreleases fromInterpret stack,dose measurements. Theof the TACT code Is aslon of a code used In licensingevaluations. It provides Input toRADPUR, which together with MESODIFwill determine offsite doses corresponding to the source term and dispersion projections. RADPUR andMESODIF will be discussed separately.
48
the computer codes,of Activity), whichmake projections ofaccidents, and to
dome, and offsiteIDAS versionmodified ver-

TACT provides a mathematical framework for the solution of the equations arising from the considerationof fission product release, transport, and attenuation In the plant'ssystems and structures.
By their nature, accidentalreleases cannot be pre-defined.Accidents considered In source termassessment should not be limited todesign basis accidents, or severeaccident scenarios currently understudy, or past accidents. Any meansfor transport of radlonuclldes fromwhere they are at the start of theaccident (the core, coolant, spentfuel pool, or waste handling system)to the environment Is a candidatefor analysis. If the transport pathand the removal processes are simple,hand calculations of source termsmay suffice. If not, the TACT usercan create a simple mathematicalmodel, via the TACT data Inputscheme, which will describe theInitial source of radlonuclldes,their transport, their decay beforerelease to the environment, and 1n-plant removal processes. Transportfrom place to place prior to releaseto the environment Is modeled vianodes, which are designated volumesor compartments that hold radioactivematerial. The processes associatedwith a given node can Include:transfer In and out, decay duringresidence, first-order removal processes (e.g., plate-out, spray washout, etc.) and the filtration ofmaterial transferred.
The flexibility of TACT permitsthe estimation of potential sourceterms before any releases actuallytake place. A series of hypothesesregarding releases can be developedand tested to support emergencyresponse as the accident develops.
MATHEMATICAL FRAMEWORK
The basic sy^^em of equationsthat TACT solves Is
/I\ dA . L\*'J ' = 5 K A + P
dt n,1,j '^n,j Vl
(\n +
where:A . = curies of radlonucUde n
r In node 1n = Index of radlonuclldes1 = Index of nodest = time
\ = sum of all first-order removal coefficients. Including radioactive decay-ratecoefficient (Inverse time)
which Is the rate coefficient governing the flowof nucllde n from node jto node 1
V. = volume of node jV. ^ = volumetric' flow rate from
node j to node 1j = Index for other nodes that
are not 1f . . = filter efficiency (curies
retained/curies In) forflow from node j to node 1.Includes any phenomenonthat removes a radlonucUdeIn a fluid stream InvolvedIn Internode transport orrelease to the environment.
L = total numbers of nodes, notcounting the environment
P . = user defined constant rateof activity Insertion Intoa node
V. . = volumetric flow rate fromnode 1 to node j
49

All terms In the equation havethe units of curies/time. Also,note that the IDAS version of TACTincludes radioactive decay, but doesnot account for the formation ofradioactive daughter products. Theequations are solved for any numberof user-defined time steps. Theinitial conditions for the firsttime step are:
(2) Vi^V = Vi(n=l N;
i=l, .... L+1)
where:
• = user-defined initial inser-* tion of an amount of nuclide
n into node i (or the environment) at time t .
o
For each time step after thefirst, the initial conditions'are:
(3) a"* .(t t) = A'""?"(t ,) + r"* .n,i^ m-l'' n,i^ m-1' ^n,i
where;
m = the time step indexand
the calculated activity at the end of theprevious time step.
The equations presented by (1)comprise L+1 simultaneous equationsdescribing curies in each node andthe environment, for each radionu-clide, for each of the user-definedtime steps. They are solved explicitly by standard matrix inversionsubroutines. An equivalent set ofsubroutines is documented (Killough83).
The solution to this system ofequations provides the activity ofeach isotope in each node as a function of time. The result of interestfor dose assessment, i.e., thecuries transported to the environment, is calculated as follows:
ffi L+1 /s tm(4) a" = Z K , . /a„ .j=2 » *J 9 »3
dt
'm-1
"n.lwhere:
l"! _ total activity released to the environment from al 1 nodesduring time step mduration of the timeintervalrate of radioactivityinsertion into theenvironment, definedby the user. Decay isaccounted for priorto insertion,
instantaneous, onetime (per time step)insertion of radioactivity into theenvironment, definedby the user
m m-1
n,l
n,l
50

REFERENCES
Beyer, C.E., 1980. "Radioactive GasRelease from LWR Fuel," letterreport, Battelle Pacific NorthwestLaboratories, Richland, Washington.
Cardile, F.P. and R.R. Bellamy, eds.1978. "Calculations of Releases ofRadioactive Materials in Gaseous andLiquid Effluents from Boiling WaterReactors (BWR-GALE Code)." NUREG-0016, Rev. 1, U.S. Nuclear Regulatory Commission, Washington, O.C.
Killough, G.G., C.L. Begovich,A.L. Sjoreen, and L.W. Bell, 1983.A Guide for the TACT III ComputerCode. NUREG/CR-3287, Oak RidgeNational Laboratory for U.S. NuclearRegulatory Commission, Washington,D.C.
U.S. Nuclear Regulatory Commission,1976. "Calculations of Releases ofRadioactive Materials in Gaseous andLiquid Effluents from PressurizedWater Reactors (PWR-GALE Code)."NUREG-0017, U.S. NRC, Washington,D.C.
51

Appendix B
BASES . FOR SPECIFYING TRANSFER RATES
53

APPENDIX B
BASES FOR SPECIFYING TRANSFER RATES
B.l LEAKAGE VS CONTAINMENT LEAKAGE RATES
Containment leakage rates may be of three types:
1. Design leakage rates of 0.1% to 0.5% per day at design pressure.
2. Leakage from purge and vent system isolation valve seal failures.
(WASH-1400 assumed that a failure to isolate corresponded to 1000
times design leakage or 100% per day. This would result from an2approximately 8-in. hole in the valve seals. Therefore, the 100%
per day assumption for failure of the isolation valve seals appears
to be reasonable.)
3. Major containment failure. It must be assumed that secondary
containment will also fail and that 100% of the containment volume
will be released in a few (e.g., 2) hours. This would be expected
at the capability pressure of containment.
B.2 STEAM GENERATOR TUBE RUPTURE LEAK RATES AND PARTITION FRACTIONS
At operating pressure, the failure of a single tube corresponds to3about 500 gal/min or 75 ft /min. This decreases rapidly as the pressure
falls.
Actual measurements have indicated partition factors in steam
generators of 1000 to 1500 for dry steam where
partition factor = . ^Unit Vol of Water Unit of Vol of steam
Since the volume of water is about 1/20 that of steam, it is assumed
that only about 1/50 (2%) of the primary iodine moves to secondary
54

55
containment. Therefore, a filter efficiency of 99% can be assumed for
dry steam. However, if water is carried with, the steam and primary
coolant is leaking directly to secondary containment, partitioning will
decrease.
B.3 EVOLUTION OF IODINE FROM A POOL (LEAKAGE)
One case you may need to evaluate is the escape of iodine from
contaminated water to the environment (e.g., leakage outside
containment) . Studies have shown that iodine evolves very slowly and
that only 10% has the potential for release from a pool of water. The
actual release rate is a function of chemistry, pool surface area, and
other factors that will not be known at the time of event. Calculations
based on reasonable assumptions have shown about 1%/hr of the iodine
would enter the gas phase, while experiments have indicated a loss of
about 0.5%/hr. Therefore, an assumption of a 1%/hr transfer rate from
the pool is reasonable.

Appendix C
BASES FOR SPECIFYING FILTER EFFICIENCIES
57

APPENDIX C
BASES FOR SPECIFYING FILTER EFFICIENCIES
C.l STANDBY GAS TREATMENT SYSTEM/OTHER FILTERS
In containment, filter systems and the Standby Gas Treatment System
(SGTS) are not considered to be very effective during severe accidents,
because they plug and rupture after acciimulating a large amount of
aerosols.
The purpose of the SGTS, generally found only in boiling water
reactors (BWRs), is to collect and filter the release from primary
containment [and in some cases the downstream leakage from the main
steam isolation valves (MSIV)] and direct the release out the plant3
stack. The design-rated capacities vary widely from 8000 ft /min to3
25,000 ft /min per train; typically there are three trains. In general,
smaller-capacity systems incorporate some recirculation of filtered
containment air.
The SGTS will perform effectively only for accidents where dry
aerosol loading is minimal because the filter will plug and rupture if
there is too much aerosol (<1 kg). In addition, the SGTS will be
bypassed for severe accidents if the secondary containment blowout
panels fail due to excessive secondary containment pressure, as would
happen for any type of primary containment failure.
C.2 ICE CONDENSER
Only preliminary estimates have been made of the effectiveness of
ice condensers in removing fission products. Preliminary model analysis
concluded that "the ice condenser was found to have significant
potential for the removal of fission products passing through it. For
cases where the air return fans were not available and the released
radioactivity made only a single pass through the ice condenser,
approximately one-half of the fission products released to the
containment were removed by the ice bed. With the air return fans
available to continually recirculate the containment atmosphere, even
58

59
greater retention by the ice bed can be seen."
C.3 BWR SUPPRESSION POOLS
All BWRs have pressure-suppression pools designed to condense steam
following loss-of-coolant accidents. The suppression pool is a large
mass of water through which the BWR primary system blows down. The
ability of the system to remove fission products will depend on (1) the
energy of the blowdown and (2) pool temperature. Tests have shown that
pools may have a low decontamination factor for the violently flashing
steam that may be present if more than decay heat is being removed by
the blowdown. However, for most postulated BWR accidents, the release
of fission products will be associated with removal of decay heat and is
expected to be relatively slow and steady. Usually the removal rate
will be high if the pool is subcooled or unsaturated. If the residual
heat removal (RHR) system is not operational, the pool could become
saturated. The condition of the suppression pool should be provided by
the Reactor Safety Team (RST).
C.4 DEPOSITION IN PRIMARY SYSTEM
Experimental data on deposition of materials in the primary system
are very uncertain and limited. In addition, actual deposition will
depend on the specific release pathway, flow rate, temperature, chemical
form of the material, etc. None of these specifics will be known when
the NRG Operations Center staff is analyzing the situation. Reviews of
the results of various model runs have indicated that there are
considerable differences in retention for Csl, aerosols, and Te.
However, for the purpose of our analysis, Csl and Te will be assumed to
act like aerosols or particulates.
Removal efficiency is primarily influenced by flow rate and
residence time of the material in the system. The following two
bounding cases show the range of primary system deposition. However,
because of the uncertainties, 40% deposition would normally be assumed.

60
CASE 1 - FAST FLOW AND SHORT RESIDENCE TIME
This is typified by the pressurized water reactor (PWR) AB
sequence, which is a large pipe break directly into the containment
with minimum contact in the primary system.
CASE 2 - LOW FLOW WITH LONG RESIDENCE TIMES
This is typified by the PWR TMLB or V sequence with its release
through the pressurizer and relief tank.

NflC FOAM 335(2-841
NHCM 1103.3201.3202
U.S. NUCLEAR REGULATORY COMMISSION
BiBLiOGRAPHIC DATA SHEET
SEE INSTRUCTIONS ON THE REVERSE.
2. TITLE AND SUBTITLE
SOURCE TERM ESTIMATION USING MENU-TACT
5. AUTHORISI
A. Sjoreen, T. McKenna, J. Julius
7. PERFORMING ORGANIZATION NAME AND MAILING ADDRESS (IncludeZtp Code)
Oak Ridge National LaboratoryPost Office Box X
Oak Ridge, Tennessee 3783110. SPONSORING ORGANIZATION NAME ANO MAILING ADDRESS (IncludeZip Code)
Division of Operational AssessmentOffice for Analysis and Evaluation of
Operational DataU.S. Nuclear Regulatory CommissionWashington. DC 20555
12 SUPPLEMENTARY NOTES
13. ABSTRACT (200 words or less)
1. REPORT NUMBER fAssignedby TIDC. add Vol. No.. Hany)
NUREG/CR-47220RNL-.6314
3. LEAVE BLANK
4. DATE REPORT COMPLETtO
MONTH
December
YEAR
19866. DATE REPORT ISSUED
MONTH
October
YEAR
19878. PROJECT/TASK/WORK UNIT NUMBER
9. FIN OR GRANT NUMBER
A9079
11a. TYPE OF REPORT
Technical
b. PERIOD COVERED (Inclusive dates)
March-December, 1986
MENU-TACT is a computer code designed to be used for source terra estimationduring reactor emergencies. The code allows the user to define initial concentrations of the nuclides in the reactor and the release pathway and timing. Filteringand other in-plant removal processes may be included. MENU-TACT, a modification ofthe TACT-III code, is simple to use. To provide quick results of bounding calculations, it incorporates only those processes that can make major changes in reactorreleases.
14 DOCUMENT analysis - » KEYWORDS/DESCRIPTORS
computer codesource term estimation
reactor emergenciesconcentrations
b lOENTlFIERS/OPEN ENOED TERMS
fU. S.COVERNICNT PRINTING OFF ICE ; 19B7-707-292 i 60244
removal processesmodification
bounding calculations
IS. AVAILABILITY
STATEMENT
Unlimited16 SECURITY CLASSIFICATION
(This page)
UNCL(This report)
UNCL17. NUMBER OF PAGES

UNITED STATES
NUCLEAR REGULATORY COMMISSIONWASHINGTON, D.C. 20555
OFFICIAL BUSINESS
PENALTY FOR PRIVATE USE, $300
SPECIAL FOURTH-CLASS RATEPOSTAGE b FEES PAID
USNRC
PERMIT No. 6-67