source level debug using openocd/gdb/eclipse on intel ... · pdf filejtag joint test action...
TRANSCRIPT

Order Number: 330015-003US
Source Level Debug using OpenOCD/GDB/Eclipse on Intel® Quark™ SoC X1000 Application Note May 2014

Source Level Debug on Intel® Quark SoC X1000 Application Note May 2014 2 Order Number: 330015-003US
INFORMATION IN THIS DOCUMENT IS PROVIDED IN CONNECTION WITH INTEL PRODUCTS. NO LICENSE, EXPRESS OR IMPLIED, BY ESTOPPEL OR OTHERWISE, TO ANY INTELLECTUAL PROPERTY RIGHTS IS GRANTED BY THIS DOCUMENT. EXCEPT AS PROVIDED IN INTEL'S TERMS AND CONDITIONS OF SALE FOR SUCH PRODUCTS, INTEL ASSUMES NO LIABILITY WHATSOEVER AND INTEL DISCLAIMS ANY EXPRESS OR IMPLIED WARRANTY, RELATING TO SALE AND/OR USE OF INTEL PRODUCTS INCLUDING LIABILITY OR WARRANTIES RELATING TO FITNESS FOR A PARTICULAR PURPOSE, MERCHANTABILITY, OR INFRINGEMENT OF ANY PATENT, COPYRIGHT OR OTHER INTELLECTUAL PROPERTY RIGHT.
A "Mission Critical Application" is any application in which failure of the Intel Product could result, directly or indirectly, in personal injury or death. SHOULD YOU PURCHASE OR USE INTEL'S PRODUCTS FOR ANY SUCH MISSION CRITICAL APPLICATION, YOU SHALL INDEMNIFY AND HOLD INTEL AND ITS SUBSIDIARIES, SUBCONTRACTORS AND AFFILIATES, AND THE DIRECTORS, OFFICERS, AND EMPLOYEES OF EACH, HARMLESS AGAINST ALL CLAIMS COSTS, DAMAGES, AND EXPENSES AND REASONABLE ATTORNEYS' FEES ARISING OUT OF, DIRECTLY OR INDIRECTLY, ANY CLAIM OF PRODUCT LIABILITY, PERSONAL INJURY, OR DEATH ARISING IN ANY WAY OUT OF SUCH MISSION CRITICAL APPLICATION, WHETHER OR NOT INTEL OR ITS SUBCONTRACTOR WAS NEGLIGENT IN THE DESIGN, MANUFACTURE, OR WARNING OF THE INTEL PRODUCT OR ANY OF ITS PARTS.
Intel may make changes to specifications and product descriptions at any time, without notice. Designers must not rely on the absence or characteristics of any features or instructions marked "reserved" or "undefined". Intel reserves these for future definition and shall have no responsibility whatsoever for conflicts or incompatibilities arising from future changes to them. The information here is subject to change without notice. Do not finalize a design with this information.
The products described in this document may contain design defects or errors known as errata which may cause the product to deviate from published specifications. Current characterized errata are available on request.
Contact your local Intel sales office or your distributor to obtain the latest specifications and before placing your product order.
Copies of documents which have an order number and are referenced in this document, or other Intel literature, may be obtained by calling 1-800-548-4725, or go to: http://www.intel.com/design/literature.htm
Any software source code reprinted in this document is furnished for informational purposes only and may only be used or copied and no license, express or implied, by estoppel or otherwise, to any of the reprinted source code is granted by this document.
Intel processor numbers are not a measure of performance. Processor numbers differentiate features within each processor family, not across different processor families. Go to: http://www.intel.com/products/processor_number/
Code Names are only for use by Intel to identify products, platforms, programs, services, etc. (“products”) in development by Intel that have not been made commercially available to the public, i.e., announced, launched or shipped. They are never to be used as “commercial” names for products. Also, they are not intended to function as trademarks.
Intel, the Intel logo, and Quark are trademarks or registered trademarks of Intel Corporation or its subsidiaries in the United States and other countries.
*Other names and brands may be claimed as the property of others.
Copyright © 2014, Intel Corporation. All rights reserved.

Source Level Debug on Intel® Quark SoC X1000 May 2014 Application Note Order Number: 330015-003US 3
Contents 1 Introduction .....................................................................................................5
1.1 Terminology ..........................................................................................5 1.2 References ............................................................................................6
2 Prerequisites ....................................................................................................7 2.1 Supported Operating Systems ..................................................................7
3 Setting up Hardware .........................................................................................8
4 OpenOCD Setup – Linux Host .............................................................................9 4.1 Patching and building OpenOCD ...............................................................9 4.2 JTAG USB pod access ............................................................................ 10 4.3 Kernel debug build - Galileo board example .............................................. 10 4.4 Modifying bootloader ............................................................................ 13 4.5 OpenOCD ............................................................................................ 13
5 OpenOCD Setup – Windows Host ...................................................................... 15 5.1 Patching and Building OpenOCD ............................................................. 15
6 OpenOCD Setup – OS X Host ............................................................................ 17 6.1 Patching and Building OpenOCD ............................................................. 17
7 Debugging ..................................................................................................... 18 7.1 GDB ................................................................................................... 18 7.2 Eclipse ................................................................................................ 20 7.3 GDB and kernel modules ....................................................................... 23
Figures
Figure 1. Debugging Setup ..............................................................................................8
Tables
Table 1. Terminology .....................................................................................................5 Table 2. References .......................................................................................................6

Source Level Debug on Intel® Quark SoC X1000 Application Note May 2014 4 Order Number: 330015-003US
Revision History
Date Revision Description
May 2014 003 Updates due to release of OpenOCD 0.8.0 (supporting Intel® Quark™ SoC) and BSP Software Release Version 1.0.0. Added Section 5, OpenOCD Setup – Windows Host. Added Section 6, OpenOCD Setup – OS X Host.
March 2014 002 Added Section 1.2 and Section 7.3.
December 2013 001 Initial release of document.

Introduction
Source Level Debug on Intel® Quark SoC X1000 May 2014 Application Note Order Number: 330015-003US 5
1 Introduction This document explains how to use OpenOCD with Eclipse* or GDB* for source level debugging of the Linux* kernel running on the Intel® Quark™ SoC X1000.
You may see references in the code to product codenames:
• Intel® Quark™ SoC X1000 (formerly codenamed Clanton)
• Intel® Quark™ Core (codenamed Lakemont Core)
Note: This document is not a complete guide to source level debugging. It is focused on debugging the Linux kernel on the Intel® Quark™ SoC X1000 at source level using OpenOCD with GDB or Eclipse.
1.1 Terminology
Table 1. Terminology
Term Description
Eclipse An integrated development environment (IDE) comprising a base workspace and an extensible plug-in system for customizing the environment.
GDB GNU* Debugger is the standard debugger for the GNU operating system.
GNU*/Linux* Linux is the kernel, one of the essential major components of the system. The system as a whole is basically the GNU system, with Linux added. See article here: https://www.gnu.org/gnu/linux-and-gnu.html
JTAG Joint Test Action Group (JTAG) is the common name for the IEEE 1149.1 Standard Test Access Port and Boundary-Scan Architecture. Debuggers communicate on chips with JTAG to perform operations like single stepping and breakpointing.
OpenOCD Free and Open On-Chip Debugger.
Introduction
Source Level Debug on Intel® Quark SoC X1000 Application Note May 2014 6 Order Number: 330015-003US
1.2 References
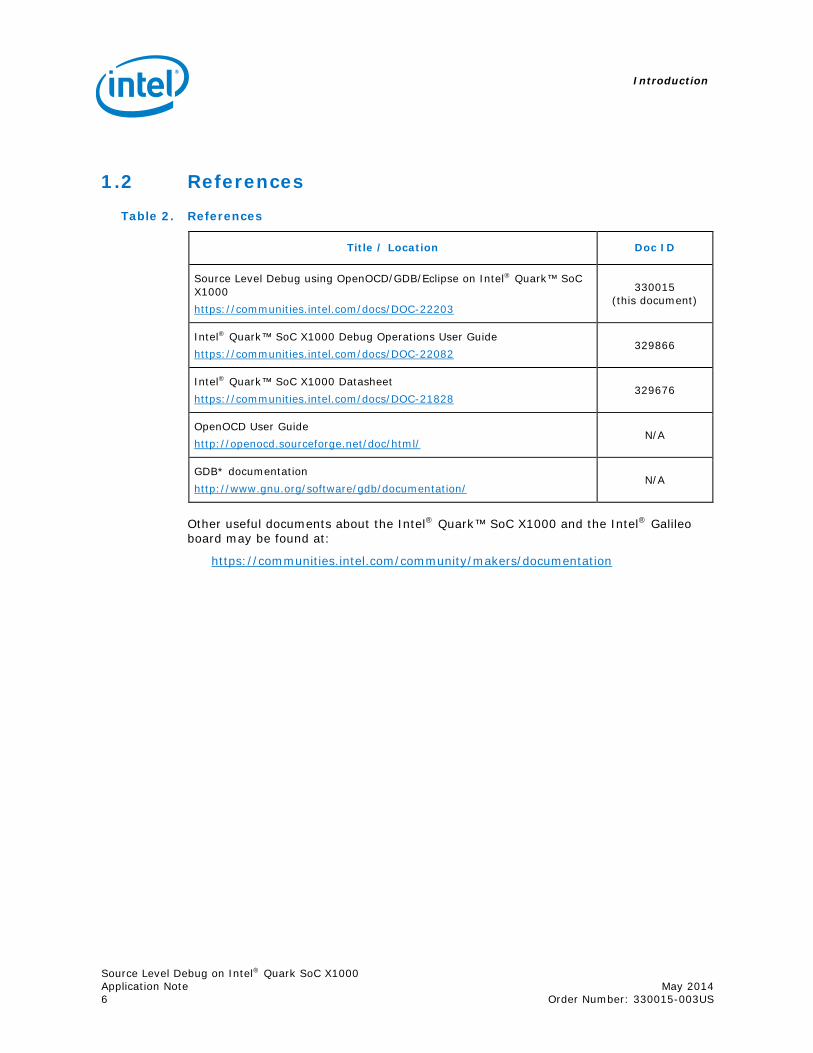
Table 2. References
Title / Location Doc ID
Source Level Debug using OpenOCD/GDB/Eclipse on Intel® Quark™ SoC X1000 https://communities.intel.com/docs/DOC-22203
330015 (this document)
Intel® Quark™ SoC X1000 Debug Operations User Guide https://communities.intel.com/docs/DOC-22082
329866
Intel® Quark™ SoC X1000 Datasheet https://communities.intel.com/docs/DOC-21828
329676
OpenOCD User Guide http://openocd.sourceforge.net/doc/html/
N/A
GDB* documentation http://www.gnu.org/software/gdb/documentation/
N/A
Other useful documents about the Intel® Quark™ SoC X1000 and the Intel® Galileo board may be found at:
https://communities.intel.com/community/makers/documentation

Prerequisites
Source Level Debug on Intel® Quark SoC X1000 May 2014 Application Note Order Number: 330015-003US 7
2 Prerequisites Refer to the Intel® Quark™ SoC X1000 Board Support Package (BSP) Build Guide before attempting the steps outlined in this document.
Required software:
• GNU*/Linux* host system
• OpenOCD
• GDB
• Eclipse (Indigo tested) with CDT Plugin Installed (Main + Optional Features)
• Quark Kernel compiled with debug symbols
• Git
Required hardware:
• OpenOCD supported JTAG debugger. For a complete set of supporting documentation, please visit the website for your specific JTAG hardware. Intel has tested the board with the following JTAG debuggers: − TinCanTools* FLYSWATTER2
http://www.tincantools.com/wiki/Compiling_OpenOCD
− Olimex* ARM-USB-OCD-H https://www.olimex.com/Products/ARM/JTAG/ARM-USB-OCD-H/
The following pin adapter was used to connect the JTAG debugger to the Quark board:
https://www.olimex.com/Products/ARM/JTAG/ARM-JTAG-20-10/
2.1 Supported Operating Systems The steps in this document have been validated against an Ubuntu 12.04 LTS 64 bit setup, but should work on any recent GNU/Linux distribution with minor adaptations.
Pre-built binaries of OpenOCD for Windows* are available for download. See Section 5 for details. Intel has successfully used OpenOCD commands with Windows but has not tested gdb/Eclipse on top of the binaries.
Intel has not fully validated OpenOCD on OS X*, however, simple tests have been successful. See Section 6 for details.

Setting up Hardware
Source Level Debug on Intel® Quark SoC X1000 Application Note May 2014 8 Order Number: 330015-003US
3 Setting up Hardware The figure below shows a recommended setup for debugging. 1. Host System running OpenOCD, GDB, and Eclipse 2. USB 2.0 male-male A-B cable 3. Flyswatter 2 4. ARM-JTAG-20-10 Adapter 5. JTAG Port 6. Intel® Galileo Board 7. Serial Cable to view boot process 8. Power Supply
Figure 1. Debugging Setup
Note: Flyswatter2 and many JTAG adapters support JTAG and Serial concurrently. If you source a serial cable that connects (7) to (3) as shown above, then you will have JTAG and Serial console data arriving at your host system (1) via USB (2). For example, this cable has been used: http://www.sfcable.com/D935-06.html

OpenOCD Setup – Linux Host
Source Level Debug on Intel® Quark SoC X1000 May 2014 Application Note Order Number: 330015-003US 9
4 OpenOCD Setup – Linux Host
4.1 Patching and building OpenOCD To enable Quark support, you must obtain the OpenOCD source code and then build it. Follow the steps in this section.
Dependencies:
• git
• libtool
• automake
In addition, to use a JTAG pod with an FTDI/FT2232 chip (like the Flyswatter2) you must install the related USB development library, using a command like: $ sudo apt-get install libusb-1.0-0-dev
Check out the OpenOCD source code, create a branch checking out the validated 0.8.0 version, using the following commands: $ git clone git://git.code.sf.net/p/openocd/code openocd-code $ cd openocd-code $ git branch quark v0.8.0 $ git checkout quark
Configure and build OpenOCD: $ ./bootstrap $ ./configure --enable-ftdi $ make
It is not strictly necessary to install OpenOCD every time it is rebuilt. The binary and configuration files can be used from the build/source tree directly if desired. However, it is recommended to perform this additional step the first time or when modifying configuration files: $ sudo make install

OpenOCD Setup – Linux Host
Source Level Debug on Intel® Quark SoC X1000 Application Note May 2014 10 Order Number: 330015-003US
4.2 JTAG USB pod access By default, non-root users won’t have access to the JTAG pods connected via USB. You must grant write access to the proper /dev/bus/usb entry every time a device is connected to be able to run OpenOCD using a non-root account.
The process can be automated by adding a udev rule. Simply create a text file in the rules directory: $ sudo vim /etc/udev/rules.d/99-openocd.rules
The IDs depend on the JTAG pod. For example, for the Flyswatter2 and the Olimex-ARM-USB-OCD-H, the rules file must have the following content: SUBSYSTEM=="usb", ATTR{idVendor}=="0403", ATTR{idProduct}=="6010", MODE="0666" SUBSYSTEM=="usb", ATTR{idVendor}=="15ba", ATTR{idProduct}=="002b", MODE="0666"
4.3 Kernel debug build - Galileo board example To debug the kernel at source level (for example, using C language sources), you must rebuild the kernel and enable the option to generate debugging information. Next, the newly built kernel and modules have to be installed on the system.
This section describes how to build a debug-enabled kernel for the Galileo board. An SD card is required for this process.
Dependencies:
• git
• texinfo
• gawk
• diffstat
• chrpath
Building the kernel and the system for the SPI flash is not covered in this example.
The following steps require fetching packages from the Internet. If the build fails because missing information, check your proxy settings, git configuration, and try to rerun the build. Also note that in this document, <version> is used as a placeholder string for the BSP software version.
Steps: 1. Get the Quark Board Support Package (BSP) software as described in the BSP
Build Guide. Download the latest package (Board_Support_Package_Sources_for_Intel_Quark_<version>.7z) and unpack it. It contains several archives. You will use two of them in the steps below:

OpenOCD Setup – Linux Host
Source Level Debug on Intel® Quark SoC X1000 May 2014 Application Note Order Number: 330015-003US 11
meta-clanton_<version>.tar.gz quark_linux_<version>.tar.gz
2. Build image-full and create a bootable SD card
You can skip this step if you have already built the image-full and have set up an SD card using the steps described in the Quark™ BSP Build Guide. In the steps that follow, you must reference the toolchain that you built previously (that is, to set the correct environment variables).
Create a working directory of your choice to build the BSP and go there: $ cd /PATH/TO/MY_BSP_WORK_DIR $ tar zxf meta-clanton_<version>.tar.gz $ cd meta-clanton_<version> $ ./setup.sh -e meta-clanton-bsp $ . poky/oe-init-build-env yocto_build $ bitbake image-full
The step above can take as long as several hours, because all packages need to be fetched from the internet and then built. If you have already downloaded all the files previously (they will be stored in yocto_build/downloads), you can execute a build without doing sanity checks on the network to save time. Disable sanity checks by adding this line in the yocto_build/conf/local.conf file: CONNECTIVITY_CHECK_URIS = ""
At the end of the build, a message similar to this will be displayed: NOTE: Tasks Summary: Attempted 1209 tasks of which 269 didn't need to be rerun and all succeeded.
After the image build is completed successfully, you must copy the files below to the root of the SD card to be able to boot the system on the Galileo board: − image-full-clanton.ext3 − core-image-minimal-initramfs-clanton.cpio.gz − grub.efi − boot (directory)
The files can be found in:
/PATH/TO/MY_BSP_WORK_DIR/meta-clanton_<version>/yocto_build/tmp/deploy/images/
To make a fully bootable SD card, the kernel file itself (bzImage), must be copied as well. The kernel file produced by the BSP build does not contain debug information and cannot be used for source level debugging. The following steps will create a proper kernel file.
3. Get the kernel
Open a new shell. (The shell used for the BSP build of the previous steps contains changes to the environment which are no longer needed.)
Create a new directory of your choice to rebuild the kernel and go there: $ cd /PATH/TO/MY_KERNEL_BUILD_DIR $ tar zxf quark_linux_<version>.tar.gz $ cd quark_linux_<version>

OpenOCD Setup – Linux Host
Source Level Debug on Intel® Quark SoC X1000 Application Note May 2014 12 Order Number: 330015-003US
Make sure you have git configured with a username and email (can be false values), otherwise the command will fail. For details, use the command man git-config. $ locate git-config $ PATH_TO/git-config –-global user.name $ PATH_TO/git-config –-global user.email
Enter the following command to fetch the proper kernel version from the internet and patch it with the appropriate Quark changes. $ ./gitsetup.py
4. Specify the correct toolchain
Export binaries of the toolchain built in step 2 to your $PATH as follows: export PATH=/PATH/TO/MY_BSP_WORK_DIR/meta-clanton_<version>/yocto_build/tmp/sysroots/x86_64-linux/usr/bin/i586-poky-linux-uclibc:$PATH
Also, all make commands that deal with the kernel must be specified using the proper architecture (ARCH) and crosscompiler (CROSS_COMPILE) switches as described below.
5. Configure and build the kernel
Starting from the directory created in step 3 above, select the proper kernel configuration and enable debug information generation. $ cd /PATH/TO/MY_KERNEL_BUILD_DIR $ cd quark_linux_<version> $ cd work $ cp meta/cfg/kernel-cache/bsp/quark/quark.cfg .config $ ARCH=i386 CROSS_COMPILE=i586-poky-linux-uclibc- make menuconfig
The kernel configuration screen is launched. Go to the General setup group and find the Local version item. Edit it with the following content: -yocto-standard
Go back to the initial menu by clicking <tab> and <ok> and go to the Kernel hacking group. Scroll down the list and find Compile the kernel with debug info, and enable it (when enabled, [*] will be shown). You can now optionally choose any other desired kernel options, then exit and confirm saving the configuration.
Create a file using: $ touch .scmversion
Issue the command below to build the kernel: $ ARCH=i386 CROSS_COMPILE=i586-poky-linux-uclibc- make
If you have a multicore machine, add the -jN switch to the make command to speed up the build.
If the build is successful, the message below is displayed: Kernel: arch/x86/boot/bzImage is ready (#1)

OpenOCD Setup – Linux Host
Source Level Debug on Intel® Quark SoC X1000 May 2014 Application Note Order Number: 330015-003US 13
This bzImage file must be copied to the root of your SD card. Once copied, the Galileo board fully boots Yocto Linux and the kernel can be debugged at source level.
4.4 Modifying bootloader To make debugging easier around the kernel idle function, it is recommended to add the idle=poll parameter in the bootloader entry corresponding to the kernel that is being debugged. The screenshot below shows a typical /boot/grub/grub.conf file, which is found in the folder copied to the SD card.
If this modification is not added, you cannot assembly-step away or set hardware breakpoint and watchpoints when sitting on a HLT instruction. However, software breakpoints and high level source stepping using software breakpoints will work. In addition, you can change the default boot to your configuration.
4.5 OpenOCD The first step to enable source level debug is to connect your JTAG pod to the board and run OpenOCD selecting the correct interface and board configuration files. The example below uses a Flyswatter2 JTAG debugger.
openocd -f interface/ftdi/flyswatter2.cfg -f board/quark_x10xx_board.cfg
It is possible to use OpenOCD as a standalone tool for basic debugging. You can connect to the OpenOCD session using telnet on port 4444 and issue commands (this

OpenOCD Setup – Linux Host
Source Level Debug on Intel® Quark SoC X1000 Application Note May 2014 14 Order Number: 330015-003US
step is not required for source level debug). This can be seen in the following screenshot.
Enter help in the telnet console to return a list of available commands and their description. For complete details, see the OpenOCD user guide here:
http://openocd.sourceforge.net/doc/html/
Even if you are in GDB, you can still run OpenOCD commands by prefixing the command name with the GDB monitor command. For example, to halt the core CPU from the GDB command line, issue the monitor halt command. To resume the core CPU, issue the monitor resume command.

OpenOCD Setup – Windows Host
Source Level Debug on Intel® Quark SoC X1000 May 2014 Application Note Order Number: 330015-003US 15
5 OpenOCD Setup – Windows Host
5.1 Patching and Building OpenOCD You can find the updated sources in the git repository and the Source Forge download area:
http://sourceforge.net/projects/openocd/files/openocd/0.8.0/
There are many online forums and discussions about building OpenOCD on Windows. Pre-built binaries of OpenOCD for Windows can be found here:
http://www.freddiechopin.info/en/download/category/4-openocd
To install the FTx232 drivers for the Flyswatter2, follow the instructions in this file (in the package): drivers\libusb-1.0 drivers.txt
Note: It may appear that the drivers install correctly when the USB cable is inserted into the PC, however, the file above still needs to be followed. One possible workaround is shown below (used on Windows 7 and completed for both Interface 0 and 1).
After completing the steps in the drivers.txt file, the Flyswatter is listed in the Universal Serial Bus devices in Device Manager as shown below.

OpenOCD Setup – Windows Host
Source Level Debug on Intel® Quark SoC X1000 Application Note May 2014 16 Order Number: 330015-003US
GNU/Linux is required for building the full BSP and kernel, however, using a pre-built binary in combination with a gdb/Eclipse build for Windows allows you to complete the debugging steps in this guide.
The screenshot below shows the binaries running on a Windows 7 64-bit system.
Intel has successfully used the OpenOCD commands with the Windows OS but has not tested gdb/Eclipse on top of the binaries.
Please post any questions or issues in the Maker Community Support Forum: https://communities.intel.com/community/makers
OpenOCD Setup – OS X Host
Source Level Debug on Intel® Quark SoC X1000 May 2014 Application Note Order Number: 330015-003US 17
6 OpenOCD Setup – OS X Host
6.1 Patching and Building OpenOCD Using OpenOCD on OS X is the same as Linux except:
• The names of the devices are different.
• You must install http://www.macports.org/
You can get a prebuilt OpenOCD from macports or use the ported packages to build a more recent version. Note that the openocd version 0.8 binaries that include Quark support are not currently available on macports. Intel recommends that you build from source.
Intel has not fully validated the OpenOCD commands or gdb/Eclipse on OS X, but simple testing has been successful.

Debugging
Source Level Debug on Intel® Quark SoC X1000 Application Note May 2014 18 Order Number: 330015-003US
7 Debugging
7.1 GDB GDB documentation is available here:
http://www.gnu.org/software/gdb/documentation/
It is possible to perform source level debug using GDB by connecting to the OpenOCD internal GDB server, which answers on port 3333 by default. OpenOCD must be running as shown in the previous section.
Run GDB and connect to the OpenOCD internal GDB server. Load the debug info of a debug compiled Quark Kernel vmlinux file.
For the kernel built in Section 4.3, the commands are: $ gdb (gdb) target remote localhost:3333 (gdb) monitor halt (gdb) symbol-file /PATH/TO/MY_KERNEL_BUILD_DIR/quark_linux_<version>/work /vmlinux
The screenshot below shows these steps in operation. After they are completed, the board is ready to be source level debugged using GDB.

Debugging
Source Level Debug on Intel® Quark SoC X1000 May 2014 Application Note Order Number: 330015-003US 19
Note: Even if you are in GDB, you can still run OpenOCD commands by prefixing the command name with the GDB monitor command as shown in the screenshot. Use the command monitor help to see if OpenOCD supports a particular command. For example, monitor mdw phys allows the physical memory to be read.

Debugging
Source Level Debug on Intel® Quark SoC X1000 Application Note May 2014 20 Order Number: 330015-003US
7.2 Eclipse It is also possible to perform source level debug using Eclipse with the C/C++ GDB Hardware Debugger plug-in. The following configuration is required to enable source level debugging of the board in the Eclipse environment.
Install the C/C++ GDB Hardware Debugging plug-in, if missing, using the standard Install Software from the Eclipse Help menu.
Create a new project and switch to the C/C++ perspective. From the Run menu, open the Debug Configurations dialog, and add a new launch configuration under GDB hardware debugging, as shown below.

Debugging
Source Level Debug on Intel® Quark SoC X1000 May 2014 Application Note Order Number: 330015-003US 21
Set application to the debug symbol enabled vmlinux kernel file, as follows.
Enable Use remote target and set the host name and port number.

Debugging
Source Level Debug on Intel® Quark SoC X1000 Application Note May 2014 22 Order Number: 330015-003US
Select Halt and add the commands: set remotetimeout 20 and monitor halt.
Be sure that Reset and Delay and Load image are not selected, as shown in the screenshot below.
Eclipse is now set up to perform source level debug on the board as shown below. Note it is still necessary to first launch OpenOCD in a separate shell, as described in Section 4.5.
Debugging
Source Level Debug on Intel® Quark SoC X1000 May 2014 Application Note Order Number: 330015-003US 23
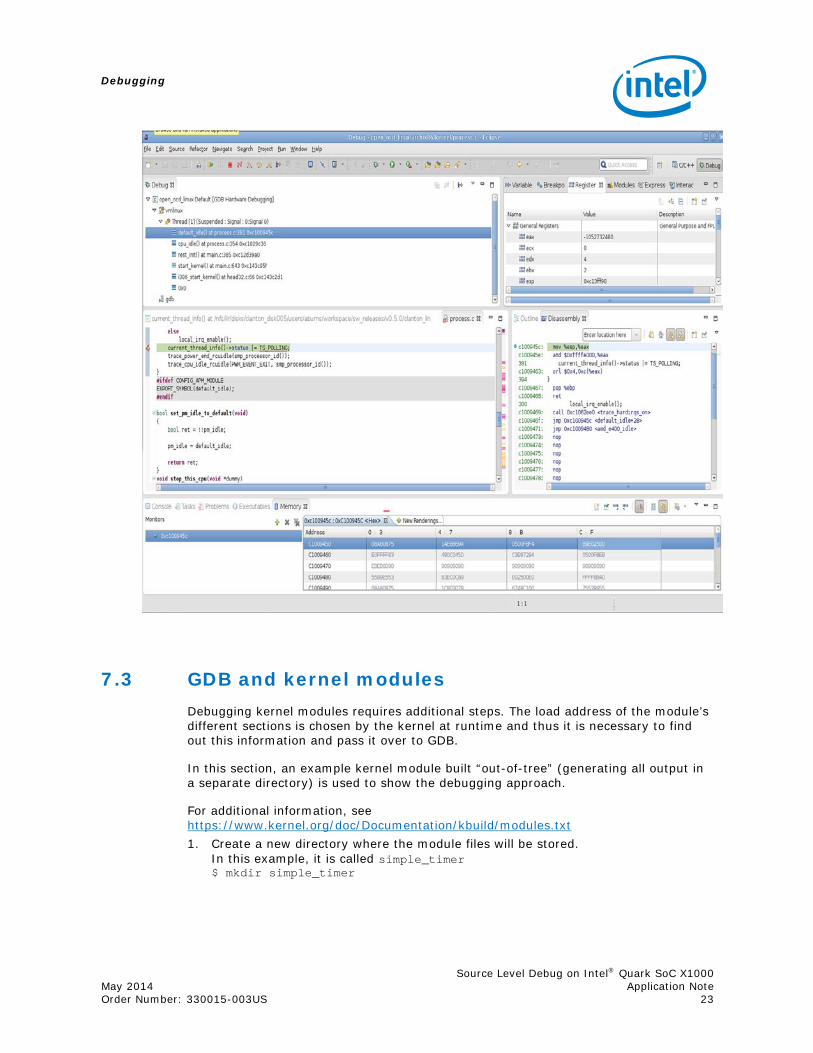
7.3 GDB and kernel modules Debugging kernel modules requires additional steps. The load address of the module’s different sections is chosen by the kernel at runtime and thus it is necessary to find out this information and pass it over to GDB.
In this section, an example kernel module built “out-of-tree” (generating all output in a separate directory) is used to show the debugging approach.
For additional information, see https://www.kernel.org/doc/Documentation/kbuild/modules.txt 1. Create a new directory where the module files will be stored.
In this example, it is called simple_timer $ mkdir simple_timer

Debugging
Source Level Debug on Intel® Quark SoC X1000 Application Note May 2014 24 Order Number: 330015-003US
2. In this directory, create a file named Makefile having the following content: obj-m := simple_timer.o ccflags-y := -g -O0 KDIR := /opt/galileo/meta-clanton_<version>/yocto_build/tmp/work/clanton-poky-linux-uclibc/linux-yocto-clanton/3.8-r0/linux-clanton-standard-build all: $(MAKE) -C $(KDIR) M=$(PWD) modules clean: $(MAKE) -C $(KDIR) M=$(PWD) clean
3. Modify KDIR to point to the actual kernel build directory, as shown in Section 4.3 of this document.
4. Create the actual module and name the file simple_timer.c having this content: #include <linux/kernel.h> #include <linux/module.h> #include <linux/timer.h> #include <linux/jiffies.h> MODULE_DESCRIPTION("Simple timer example module, ~1 call per second, ~1 log per minute."); MODULE_LICENSE("GPL"); static struct timer_list simple_timer; static unsigned long times_called; static void simple_timer_function(unsigned long ptr) { unsigned long minutes; times_called++; minutes = times_called / 60; if(times_called % 60 == 0) printk(KERN_INFO "simple_timer: ~%ld minute(s) and counting\n", minutes); mod_timer(&simple_timer, jiffies + HZ); } static int __init simple_timer_init(void) { printk(KERN_INFO "simple_timer: loading - %d HZ\n", HZ); times_called = 0; init_timer(&simple_timer); simple_timer.function = simple_timer_function; simple_timer.expires = jiffies + HZ; add_timer(&simple_timer); return 0; } static void __exit simple_timer_exit(void) { printk(KERN_INFO "simple_timer: unloading\n"); del_timer(&simple_timer); } module_init(simple_timer_init) module_exit(simple_timer_exit)
This example module sets up a kernel timer that expires and is set again roughly every second by calling the simple_timer function. In addition, every minute a new info kernel message will be logged. This type of message can be examined in several ways depending on the kernel settings: using the dmesg command, logged to files, or appearing directly on the console (as with the Galileo board).

Debugging
Source Level Debug on Intel® Quark SoC X1000 May 2014 Application Note Order Number: 330015-003US 25
5. To build the module, the path to the cross-compile toolchain has to be in the path, as shown in Section 4.3, step 4, and the make command has to be invoked as shown in the screenshot below.
A few files are produced and simple_timer.ko is the kernel module itself.
The module can now be copied to the target system.
6. For a Galileo board, copy the file to the SD card and insert it onto the board. After the board is booted, the SD card is mounted automatically under /media and the kernel module can be inserted and removed as shown below, where the terminal program is connected to the Quark board serial port:

Debugging
Source Level Debug on Intel® Quark SoC X1000 Application Note May 2014 26 Order Number: 330015-003US
7. After the module is loaded, the corresponding /sys/module entry on the board can be queried as shown below:
The address of .text and the other relevant sections are now known and can be passed to the add-symbol-file GDB command when loading the debug information for the module.
The .text address is the first, mandatory parameter, the other sections are optional and can be specified using the –s switch. The command for loading the debug information of the module in gdb is: (gdb) add-symbol-file PATH_TO/simple_timer.ko 0xe0717000 –s .rodata 0xe0718024 –s .bss 0xe0719140 –s .exit.text 0xe0717080

Debugging
Source Level Debug on Intel® Quark SoC X1000 May 2014 Application Note Order Number: 330015-003US 27
The setup is complete and the kernel module can be source-level debugged.
If the module is unloaded and then loaded, the section addresses must be checked again. Typically the addresses are different each time.
§