source: class slides for the mpg illusion these slides may be used without copyright approval...
TRANSCRIPT

source: http://www.mpgillusion.com
Class Slides for the MPG Illusion
These slides may be used without copyright approval
Please acknowledge http://www.mpgillusion.com as the source

source: http://www.mpgillusion.com
MPG Quiz• Assume that a person drives 10,000 miles per
year and is contemplating changing from a current vehicle to a new one.
• Rank the following five pairs of old and new vehicles in order of their benefit to the environment (i.e., which new car would reduce gas consumption the most compared to the original car).
• Use 1 for the largest savings and 5 for the smallest savings.

source: http://www.mpgillusion.com
MPG Quiz
Change in Vehicle Pairs (Old Vehicle to
New Vehicle)
Rank in Gas Savings?
A) 18 MPG to 28 MPG
B) 16 MPG to 20 MPG
C) 34 MPG to 50 MPG
D) 22 MPG to 24 MPG
E) 42 MPG to 48 MPG
Rank the gas savings from MPG improvements for a car driven 10,000 miles (1 = largest, 5 = smallest)

source: http://www.mpgillusion.com
MPG Quiz – Typical Ranks
Change in Vehicle Pairs (Old Vehicle to
New Vehicle)
Rank in Gas Savings?
A) 18 MPG to 28 MPG 2
B) 16 MPG to 20 MPG 4
C) 34 MPG to 50 MPG 1
D) 22 MPG to 24 MPG 5
E) 42 MPG to 48 MPG 3
Rank the gas savings from MPG improvements for a car driven 10,000 miles (1 = largest, 5 = smallest)

source: http://www.mpgillusion.com
MPG Quiz – Actual Ranks
Change in Vehicle Pairs (Old Vehicle to
New Vehicle)
Perceived Rank in Gas
Savings (Mean)
Actual Rank in
Gas Savings
Actual Reduction in Gas
Consumption per 10,000 miles
A) 18 MPG to 28 MPG 2 1 198.4
B) 16 MPG to 20 MPG 4 2 125.0
C) 34 MPG to 50 MPG 1 3 94.1
D) 22 MPG to 24 MPG 5 4 37.9
E) 42 MPG to 48 MPG 3 5 29.8
Rank the gas savings from MPG improvements for a car driven 10,000 miles (1 = largest, 5 = smallest)

source: http://www.mpgillusion.com
Alernative Quiz
http://www.mpgquiz.com/

source: http://www.mpgillusion.com
Judgments of Car Fuel Efficiency
• Standard measure in US– Miles per gallon (MPG) • What does it measure?
– Useful for knowing range of gas tank• What question do you want to answer when buying a
car?– How much gas you’re going to use
» Cost of gas» Greenhouse gases (burning 1 gallon of gas releases 20
pounds of carbon)

source: http://www.mpgillusion.com
The Problem with MPG• Consider three people who each drive 100
miles per week. Their current vehicles have the following fuel efficiency:– Person A: 10 MPG– Person B: 16.5 MPG– Person C: 33 MPG

source: http://www.mpgillusion.com
The Problem with MPG• Each driver trades in his or her car for a more
efficient car– Person A: 10 MPG -> 11 MPG– Person B: 16.5 MPG -> 20 MPG – Person C: 33 MPG -> 50 MPG
• Who saves the most gas over 100 miles?
• Result: Each trade-in reduces gas consumption by the same amount– In each case, the new car saves 1 gallon per 100 miles– The new car eliminates 1 ton of carbon per 10,000 miles

source: http://www.mpgillusion.com
Calculating Gas Savings• To know gas consumption and gas savings, one
needs to divide the distance one drives by MPG– Gas consumption = Distance / MPG– Conclusions
• Gas savings are not a linear function of MPG• The relationship between gallons consumed and MPG is
curvilinear• Gallons consumed can be abbreviated “Gallons per Mile” or
“GPM” for short
• The following graph and tables illustrate the relationship

source: http://www.mpgillusion.com
Gas Consumption as a Function of MPG
0100200300400500600700800900
10001100
10 15 20 25 30 35 40 45 50 55
Miles Per Gallon
Gallons Per 10,000 Miles

source: http://www.mpgillusion.com
Miles Per Gallon Gallons Per 100 Miles
Gallons Per 10,000 Miles
10 10.0 1000
15 6.7 667
20 5.0 500
25 4.0 400
30 3.3 333
35 2.9 286
40 2.5 250
45 2.2 222
50 2 200
Converting MPG to GPM – Equal MPG
This table displays total gas consumption based on equal increases in MPG

source: http://www.mpgillusion.com
Miles Per Gallon Gallons Per 100 Miles
Gallons Per 10,000 Miles
10.0 10 1000
11.0 9 900
12.5 8 800
14.0 7 700
16.5 6 600
20.0 5 500
25.0 4 400
33.0 3 300
50.0 2 200
Converting MPG to GPM – Equal GPM
This table displays MPG improvements that yield equal decreases in gas consumption (1 gallon per 100 miles or 100 gallons per 10,000miles)

source: http://www.mpgillusion.com
Summary of Research• The following slides summarize the results of
research published by Larrick & Soll (Science, 2008)

source: http://www.mpgillusion.com
Study 1: Ranking Improvements(n = 77, Larrick & Soll, Science, 2008)
Task: Rank gas savings from MPG improvements for a car driven 10,000 miles (1 = largest, 5 = smallest)
Change in Vehicle Pairs (Old Vehicle
to New Vehicle)
34 MPG to 50 MPG
18 MPG to 28 MPG
42 MPG to 48 MPG
16 MPG to 20 MPG
22 MPG to 24 MPG
Perceived Rank in Gas
Savings (Mean)
1.18
1.95
3.29
3.73
4.86

source: http://www.mpgillusion.com
Study 1: Ranking Improvements (n = 77, Larrick & Soll, Science, 2008)
Change in Vehicle Pairs (Old Vehicle
to New Vehicle)
Perceived Rank in Gas
Savings (Mean)
Actual Rank in Gas
Savings
Actual Reduction in Gas
Consumption per 10,000 miles
34 MPG to 50 MPG 1.18 3 94.1
18 MPG to 28 MPG 1.95 1 198.4
42 MPG to 48 MPG 3.29 5 29.8
16 MPG to 20 MPG 3.73 2 125.0
22 MPG to 24 MPG 4.86 4 37.9
Task: Rank gas savings from MPG improvements for a car driven 10,000 miles (1 = largest, 5 = smallest)

source: http://www.mpgillusion.com
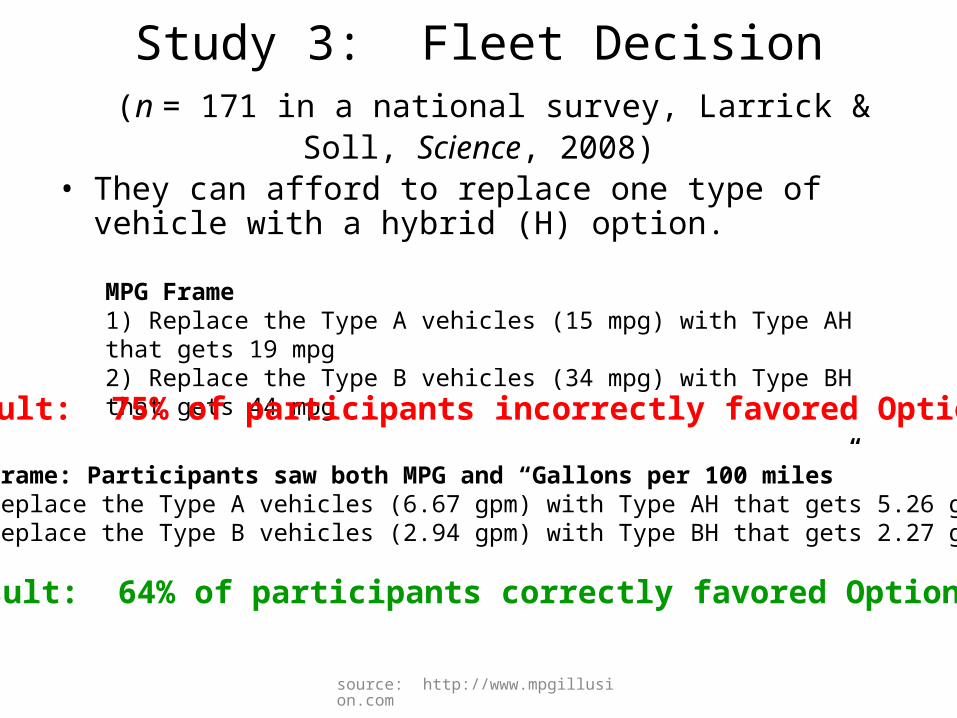
Study 3: Fleet Decision(n = 171 in a national survey, Larrick & Soll, Science, 2008)
• A town maintains a fleet of vehicles for town employee use. It has two types of vehicles. – Type A gets 15 miles per gallon. – Type B gets 34 miles per gallon.
• The town has 100 Type A vehicles and 100 Type B vehicles. • Each car in the fleet is driven 10,000 miles per year. • They can afford to replace one type of vehicle with a hybrid
(H) option.– Type AH gets 19 miles per gallon. – Type BH gets 44 miles per gallon.

source: http://www.mpgillusion.com
Study 3: Fleet Decision (n = 171 in a national survey, Larrick & Soll, Science, 2008)
• They can afford to replace one type of vehicle with a hybrid (H) option.
GPM frame: Participants saw both MPG and “Gallons per 100 miles”1) Replace the Type A vehicles (6.67 gpm) with Type AH that gets 5.26 gpm 2) Replace the Type B vehicles (2.94 gpm) with Type BH that gets 2.27 gpm
MPG Frame1) Replace the Type A vehicles (15 mpg) with Type AH that gets 19 mpg2) Replace the Type B vehicles (34 mpg) with Type BH that gets 44 mpg
Result: 75% of participants incorrectly favored Option 2
Result: 64% of participants correctly favored Option 1

source: http://www.mpgillusion.com
Specific Policy Implications
• For car purchase decisions, provide a measure of efficiency that is volume of gas divided by distance – Europe and Canada use liters per 100 kilometers – United States• What should the US use as a basic “gallons per mile”
measure?• Where should it be reported?• Example of an online GPM calculator for new cars
– www.gpmcalculator.com

source: http://www.mpgillusion.com
Improving Decision Making• How can psychology be used to improve a range of
decisions?– “Choice architecture” principles from Nudge (Thaler &
Sunstein, 2008):• Set defaults to encourage people to make more prudent choices. • Provide explicit feedback to help people recognize when they are
doing well and when they are making mistakes. • Help people see the connection between their options and what
choices will actually make them better off.• Design incentives so that benefits and costs are clear.• Design “forgiving” systems that take into account the fact that
people will make mistakes. • Structure complex choices so they are easier for people to
understand.

source: http://www.mpgillusion.com
Improving GHG Decisions
• What can psychology contribute to reducing greenhouse gas emissions?– Car choice– Car use– Other transportation
• What new tools could help people make decisions that reduced greenhouse gas emissions in general?

source: http://www.mpgillusion.com
Useful Links and References
http://www.mpgillusion.comhttp://www.mpgquiz.comhttp://www.mpgillusionvideo.comhttp://www.gpmcalculator.comhttp://www.mpgillusion.com/2009/01/classroom-materials.html http://faculty.fuqua.duke.edu/~larrick/bio/Reshighlights.htm http://www.nytimes.com/2008/12/14/magazine/14Ideas-Section2-B-t-005.html Larrick, R. P., & Soll, J. B. (2008). The MPG Illusion, Science, 320, 1593-1594Thaler, R. H., & Sunstein, C. (2008). Nudge. New Haven: Yale.