source code repository metrics calculation€¦ · the source code repository metrics calculation...
TRANSCRIPT
Project Number. GFP0905
Source Code Repository Metrics Calculation
A Major Qualifying Project Report:
submitted to the faculty of the
WORCESTER POLYTECHNIC INSTITUTE
in partial fulfillment of the requirements for the
Degree of Bachelor of Science
by:
Anthony Azersky
Paul Kehrer
Date: December 16, 2010
Approved:
______________________________
Professor Gary F. Pollice, Major Advisor
1. Software Engineering
2. Metrics
3. Version Control

i
Abstract
The Source Code Repository Metrics Calculation project is an attempt to find
meaningful, useful information from within the metadata stored in version control
systems used in software project. It is built to take information from an SVN repository
and generate metrics from that data to be graphed within the WPI Suite tool. It is also
designed to be extensible so that future developers can add more metrics that they would
like to see in the Repository Metrics view of WPI Suite, as well as allow for more version
control systems to be added so that they can be used with this project.

ii
Acknowledgements
We would like to acknowledge Professor Gary Pollice for his guidance and assistance in
advising our project.
Also, Donald Gaxho and Chaoran Xie, working on a similar project relating to metrics
calculation in WPI Suite, who worked with us to design and implement the "Artifact
Model" which both project teams will use for their metrics calculation.
Table of Contents
Abstract ................................................................................................................................ i
Acknowledgements ............................................................................................................. ii Table of Figures .................................................................................................................. 1 1. Introduction ................................................................................................................. 2 2. Background .................................................................................................................. 4 3. Methodology .............................................................................................................. 10
4. Results and Analysis .................................................................................................. 18 5. Future Work and Conclusions ................................................................................... 22 Appendix A -- Developer's Guide .................................................................................... 25 Glossary ............................................................................................................................ 31 References ......................................................................................................................... 32

1
Table of Figures
Figure 1: Module Package Diagram ................................................................................. 11
Figure 2: Repository Access Class Diagram .................................................................... 13
Figure 3: Artifact Model Class Diagram .......................................................................... 14
Figure 4: VCS Implementation of Artifact Model ............................................................ 15
Figure 5: Metric and Display Class Diagram ................................................................... 17
Figure 6: A screenshot of the finished project .................................................................. 18
Figure 7: Available Metrics .............................................................................................. 19
Figure 8: Commits per Date for our branch of the WPI Suite SVN repository ................ 21
Figure 9: File coupling for our branch of the project........................................................ 22
Figure 10: VCS Repository Artifact Model ...................................................................... 29
2
1. Introduction
Successful software development projects require version control repositories.
These repositories contain comprehensive and valuable information for a project team,
which generally goes unnoticed. Users need to interface with a repository in a simple and
informative way. Users should be able to extract metrics describing project health,
leading to better understanding of the state of the project. Developers can make decisions
regarding a project’s future by understanding its history of change. Provided a project
uses a version control system for storing code, the change of a project on the source code
level is already documented. The precise changes over time to files, individual lines of
codes, and contribution based on developer are recorded as data which can be valuable to
developers and project managers.
There are many valuable metrics which can be calculated based on evaluation of a
source code repository. We propose a tool which provides a view of any repository in
terms of code change analysis and developer contribution over time. This view would
present the user with various metrics, informing the project team of the volatility of the
code base, distribution of developer contribution, and other data describing the general
state of the project. One of the metrics which concerns a project manager is the change
in Lines of Code (LOC) over time. This describes the overall volatility of the code base,
suggesting the general stability of the project. A project which often has significant
changes to critical files is not ready for release. The data required for an overall code
churn metric over time, as well as code churn for specific modules of a piece of software,

3
is accessible through a version control repository, and our analysis tool provides an
accessible and informative view of that data.
We also track repository commits which result in changes to recurring pairs of files.
If changing one file consistently results in another file being changed, it suggests tightly
coupled code. This data generally goes unnoticed in the course of a project's
development. Bringing this data to the developers' attention lets the developers refactor a
poorly-designed element before it leads to buggy code.
Along with presenting the end user with specific metrics, our analysis tool provides
an extensible repository view. It lets one add new metrics that allow for a more complete
understanding of a project's code base.
Generally, repositories are used only for version control. Our tool mines data that
is already contained in the repository. The tool can attach to any common version control
system, such as CVS and Subversion, and integrates into a project management tool, such
as WPI Suite [1]. Development teams do not need to spend any extra time on
documentation or record keeping in order to use this tool. Metrics analysis which
requires extra work by developers may be avoided due to financial constraints, but our
tool will automatically analyze information which is already recorded for purposes of
version control. A seamlessly integrated tool, that one can configure with minimal effort
on the part of developers would valuable.
In this report, we describe our approach to designing a source code metrics
evaluation tool. We will also describe future potential for expansion and integration into
the WPI Suite project management tool.

4
2. Background
Software Metrics:
Metrics let us identify relationships between things and the strength of the
relationships. Whether it is looking at your average speed for a morning run, or seeing the
change in stock prices over the past year, metrics provide us with a consistent way of
analyzing the past. One can group metrics based on their measurements.
A measurement is simply applying a value based on a certain scale to any given
attribute. Measurements are used to create metrics, but provide no valuable information
without further analysis. Interesting metrics are created when measurements are
interpreted in context, and combined with other measurements. For example, measuring
the length of a piece of code is not nearly as informative as tracking its length over a
given time period. Five measurements scales apply to software metrics: nominal, ordinal,
interval, ratio, and absolute.
A nominal measurement has a series of categories, like if you were to take a poll
of whether someone preferred vanilla, chocolate, or strawberry ice cream. One cannot
say that strawberry is more than vanilla because they have no relation to each other. You
can only compare the counts of people who selected each option. To add order, one uses
the ordinal scale. While you cannot necessarily say that one item is twice another, you
can say that is definitely more or less than others. A classic example of this would be
when polls ask your opinion of something by asking you to choose if you "Strongly
Dislike," "Dislike," "Like," or "Strongly Like" it. While we know that "Strongly Like" is
higher than "Like", we cannot tell how much higher it is.

5
The next scale is the interval scale which allows a set difference between two
points. A couple examples of this are the Fahrenheit and Celsius scales for temperature,
as well as measuring time. You can switch between two different scales by using he
transformation S = aS'+b. You are not able to compare two objects on a interval scale by
saying that one is twice as large as the other, but you can say that it is 35 more than the
other.
The ratio scale is similar to the interval scale but allows you to say one item is
twice as large as another. It is characterized by a similar transformation: S=aS’. There
also must be a zero on the scale. The ratio scale is much more common in empirical
software analysis than the interval scale.
The final category of scale is the absolute scale. It does not allow for any
transformations to other scales, and is only used for counting items. For example,
measuring the developers who have contributed to a project is measured using the
absolute scale, because the only meaningful measure of that attribute is a count of the
developers.
Version Control Systems:
Version control facilitate coordination between developers. They track versions of
the code and provide features that allow different programmers to work on the code at the
same time. Users download their own copy of the code, make their changes, and then
"commit" those changes to everyone else. Other users then "update" their versions to
reflect the current state of the code. While the details of the repository change between
different version control systems, there are some standard details that tend to be

6
universal. When a user commits their changes, the software records the version number,
the user, the time it was made, the files changed, and a message posted by the user
associated with the commit. This information can be analyzed to discover how the project
has been progressing. However, there are many different version control systems in use,
each with unique features that must be taken into consideration when trying to analyze
their data.
Subversion, one system currently in use at WPI, uses a server to store the "current
version" of the files, as well as the history of all of the commits and file changes. Users
download a working version from the server, make edits and commit it back. They send
commands to the server to see a list of recent commits (log) or to see changes between
different revisions (diff).
CVS is another common system, similar to Subversion. One of the main
differences is that it does not maintain log information after renaming or moving
files/folders. It does, however, maintain a lot of the same information from commits in a
similar format.
Another widely used VCS is Mercurial. Mercurial has a drastically different set
up because it does not have a central server to store the current version of the project.
Instead, each user has their own copy, and they frequently merge with one another. The
system also manages to keep track of a global most recent version when changes are
merged (although if one user has not merged with the others in a while, he will
temporarily have version numbers different from the rest). Because of the nature of the
system, Mercurial has great support for merging changes together. All systems have very

7
similar properties that can be queried for examination. Their structure might be different,
but the similar features can be easily used to generate metrics for the project.
It is assumed that any software repository added to this project will have the
following properties in its commit logs:
Date of Commit
Revision Number
Author of Commit
Message/Comment
List of Files Changed
WPI Suite
WPI Suite is a software project management tool, developed by students of Prof.
Gary Pollice at Worcester Polytechnic Institute. It currently exists as an open-source
project, with ongoing plans for expansion. Its target customer audience is software
engineering students. WPI Suite currently consists of a requirements manager tool, a
traceability matrix generator, as well as a velocity report generator. Future plug-ins for
WPI Suite will be supported through the OSGi plug-in framework[2].
The aim of WPI Suite is to unify various aspects of project management into one
tool, with a well-defined API. The information our tool provides will integrate into WPI
Suite, and along with other plug-ins, be able to influence important design and process
decisions for software engineering projects.

8
Current Examples of Metrics Calculation Using VCS:
Several tools currently interact with version control repositories. They each
provide different data analysis. Some of the more common ones do little or no analysis of
the data contained within the repository, they simply graph the stored information, such
as lines of code changed over time. Other such programs analyze more of the data, both
looking at the data stored in the repository as well as how accurately interpretations of
that data described past projects.
The following two examples demonstrate the two extremes of metrics analysis.
First, a tool developed for Microsoft to predict fault risk is a utility which does a lot of
analysis on data to provide the user with a specific coefficient for "fault risk," and the
second is a tool which mines data and provides the user with a huge set of raw data in the
form of customizable graphs.
Example 1: Assessing Risk of Bug Fixes at Microsoft [3]
“Mining Software History to Improve Software Maintenance Quality” by
Alexander Tarvo of Microsoft is an instance where large amounts of data was rigorously
analyzed in order to produce a very simple and direct measurement. In this study, he
explains the development and use of the Binary Change Tracer (BCT) tool, which is used
to track associations between code changes in a repository and the logging of bugs in a
bug tracking database (BTD). The information provided by this tool requires developers
to be diligent about manually associating VCS check-ins with bugs in the BTD (this
means stating the bug being fixed in a check-in log, and also referencing the appropriate
check-in number when logging a bug). This information can then be modeled using what
the study called the “Fix Regression Prediction”(FRP) model. This model is used to
9
generate the “regression risk” for each bug fix, as a function of changes the fix caused,
the experience of the developer performing the fix, general code metrics of associated
source files, etc. The “regression risk” is a number between 0 and 1, with an assigned
threshold to distinguish between “high-risk” and “low-risk” fixes.
An important aspect of this study, was the work done to verify the validity of the
calculated risk coefficient. Developers used the history of already released software
(both the repository, and logs of bugs that were filed and fixed) to train their program by
having it see how accurate their metrics would have been in the past. From there they
could see which risk coefficients were the most accurate and further strengthen them. We
can use a similar approach with our metrics by running them on previous projects we
have worked on, and other available open source software and see if our evaluations of
the projects from the metrics are actually indicative of project health, and can be used as
means for design changes.
This Microsoft case study is an extreme case of VCS metrics calculation. The
analysis is extensive, but the only information presented to a developer is a single
coefficient describing fault risk.
Example 2: SourceIQ [4]
SourceIQ is a tool created for software development teams, that calculates a huge
number of metrics based on information from a VCS. They currently offer support for
SVN, CVS, IBM® Rational® ClearCase®, Jazz®, and others. The main goal of
SourceIQ, is to provide as much information as possible to the user. Open.sourceIQ,
which is based off of the enterprise version, but made available to the open-source

10
community, displays all information in the form of a line graph. The metrics described by
SourceIQ focus on code base change over time. The information is displayed as code
changed within files, modules, and projects, as well as per developer and per group. Any
combination of these basic measuring attributes can be graphed using the flexible, and
customizable user interface of SourceIQ.
SourceIQ represents the opposite end of the spectrum for VCS metrics
calculation. Whereas the Tarvo study did extensive analysis in order to provide
concentrated results, SourceIQ performs no meaningful analysis, but rather just arranges
data into a visually appealing display. It provides a more flexible, and informative set of
information, but at the cost of requiring potentially subjective analysis to actually
influence project management and design decisions.
3. Methodology
We wanted our tool to be as extensible as possible, while still delivering specific and
informative data to our end users. Two important goals while designing the tool were to:
1.) Allow for other Version Control Systems to be “plugged in” to our tool, using a
distinct set of adapter classes.
2.) Create a well-defined framework for a “Metric,” so that our tool could be easily
expanded to provide other data to users.
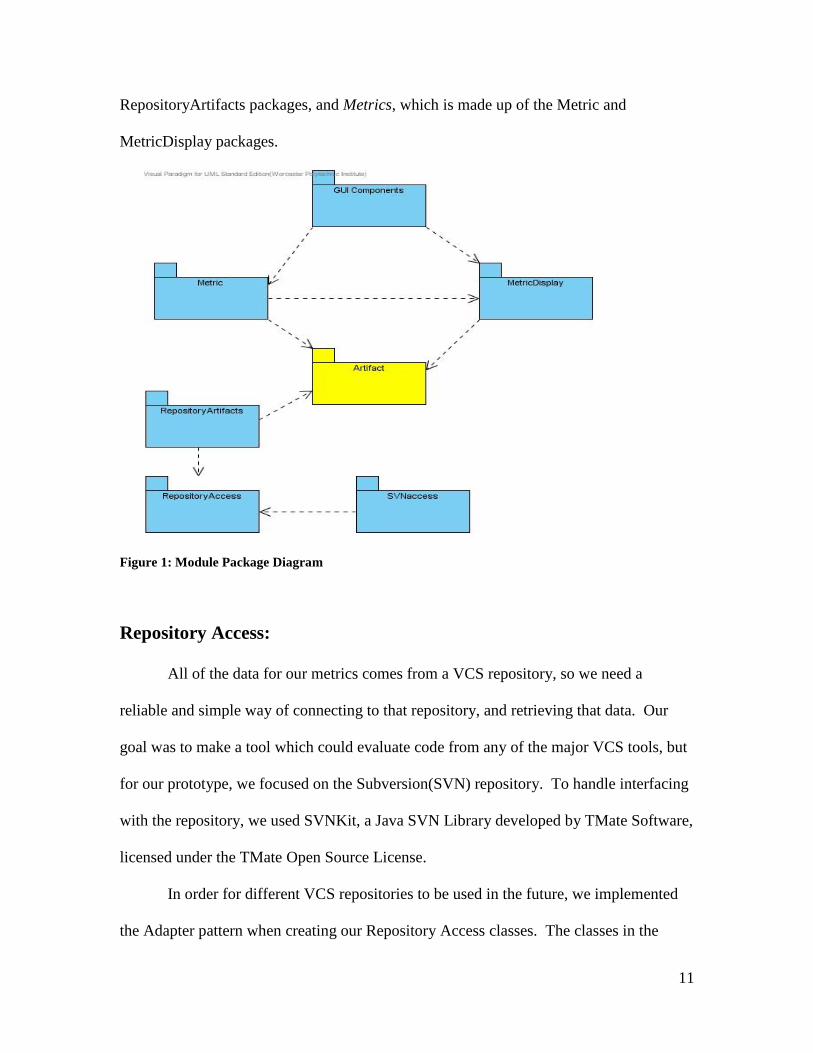
Figure 1 shows the package structure of our tool. Our program can be logically divided
into three sections: Repository Access, which consists of the RepositoryAccess, and
SVNaccess packages, the Artifact Model, which consists of the Artifact and
11
RepositoryArtifacts packages, and Metrics, which is made up of the Metric and
MetricDisplay packages.
Figure 1: Module Package Diagram
Repository Access:
All of the data for our metrics comes from a VCS repository, so we need a
reliable and simple way of connecting to that repository, and retrieving that data. Our
goal was to make a tool which could evaluate code from any of the major VCS tools, but
for our prototype, we focused on the Subversion(SVN) repository. To handle interfacing
with the repository, we used SVNKit, a Java SVN Library developed by TMate Software,
licensed under the TMate Open Source License.
In order for different VCS repositories to be used in the future, we implemented
the Adapter pattern when creating our Repository Access classes. The classes in the

12
RepositoryAccess package are interfaces which specify what we determined was
universal behavior for all popular VCS repositories. These behaviors include querying
for collections of commit logs, seeing the author of specific commits, and streaming files
for various revisions. The methods specified in the interfaces of the RepositoryAccess
package are all that the rest of the program needs to gather the data for metric calculation.
The actual implementation of this behavior is contained in the SVNaccess
package. The classes in this package are realizations of the interfaces defined in the
RepositoryAccess package. According to the original definition of the Adapter
Pattern[5], our metrics tool is the Client, the interfaces in RepositoryAccess are the
Target, and the implemented classes in SVNaccess are the Adapter. Figure 2 shows the
class diagram for these two packages.
13
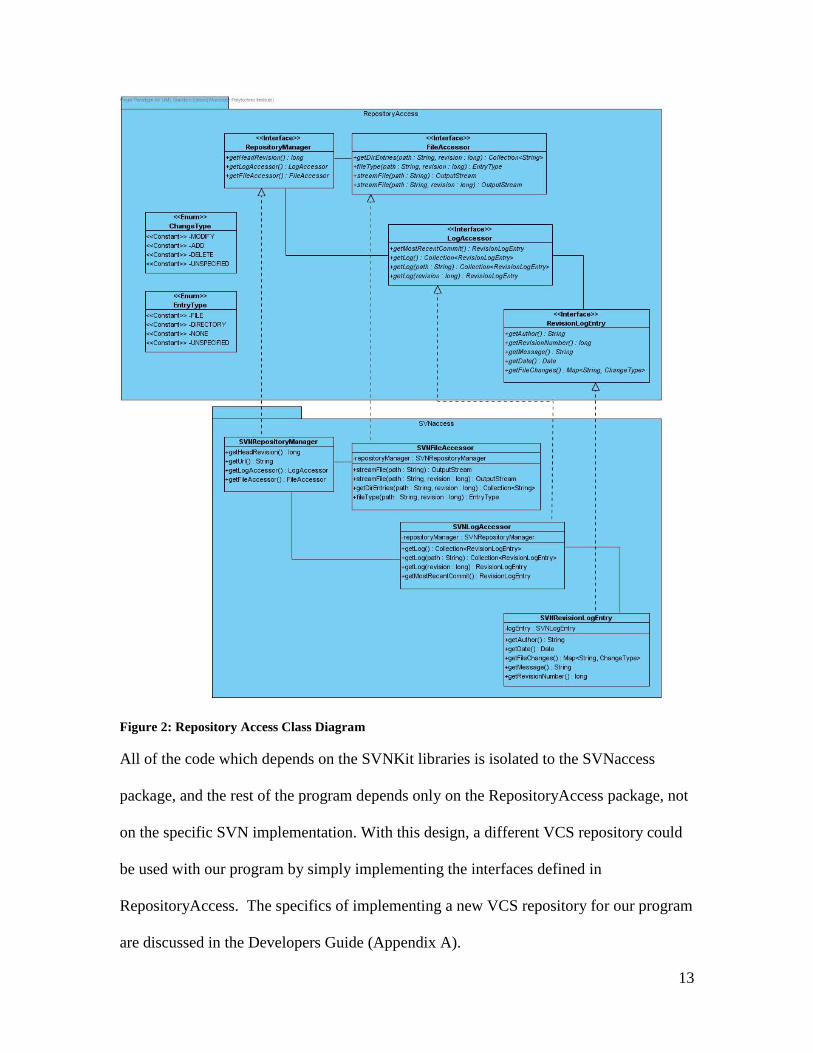
Figure 2: Repository Access Class Diagram
All of the code which depends on the SVNKit libraries is isolated to the SVNaccess
package, and the rest of the program depends only on the RepositoryAccess package, not
on the specific SVN implementation. With this design, a different VCS repository could
be used with our program by simply implementing the interfaces defined in
RepositoryAccess. The specifics of implementing a new VCS repository for our program
are discussed in the Developers Guide (Appendix A).

14
Artifact Model:
In an effort to fulfill our goal of creating a framework for the easy creation of
metrics, we needed to develop a model for our data, so that all metrics could be created in
a consistent way. The model we decided on is described in Figure 3.
Figure 3: Artifact Model Class Diagram
This diagram shows all of the classes in the Artifact package from Figure 1. This
package is displayed in a different color, because it was designed and developed along
with another project team who worked on software metrics, and how they are applicable
to WPI Suite. Whereas all of the other other packages in Figure 1 are part of the parent
package edu.wpi.wpisuite.module.repositorymetrics, the artifact model itself is
edu.wpi.wpisuite.artifact, and is a general data model for use in all of WPI Suite.
The package RepositoryArtifacts is the package that contains all of our specific
implementations of the Artifact model. It is here that we take the data specified by the
15
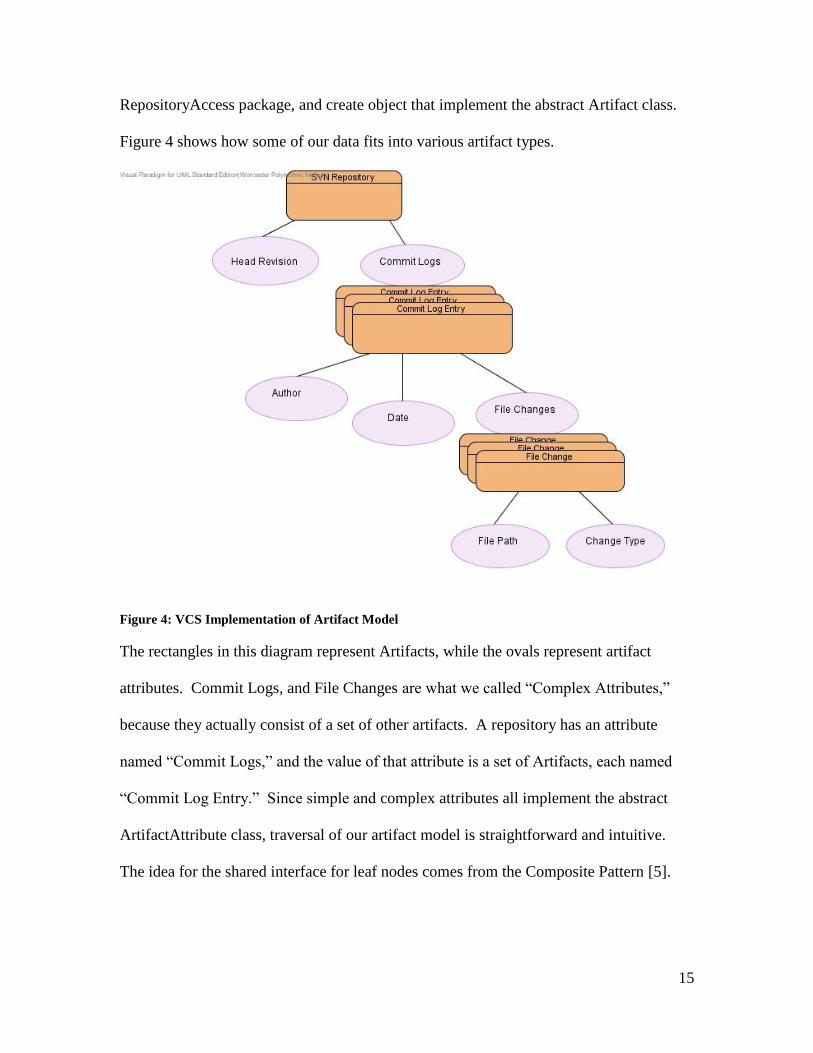
RepositoryAccess package, and create object that implement the abstract Artifact class.
Figure 4 shows how some of our data fits into various artifact types.
Figure 4: VCS Implementation of Artifact Model
The rectangles in this diagram represent Artifacts, while the ovals represent artifact
attributes. Commit Logs, and File Changes are what we called “Complex Attributes,”
because they actually consist of a set of other artifacts. A repository has an attribute
named “Commit Logs,” and the value of that attribute is a set of Artifacts, each named
“Commit Log Entry.” Since simple and complex attributes all implement the abstract
ArtifactAttribute class, traversal of our artifact model is straightforward and intuitive.
The idea for the shared interface for leaf nodes comes from the Composite Pattern [5].
16
Metrics:
With the foundation of repository access, and the artifact model clearly defined,
metrics calculation is simply a matter of collecting data, analyzing it, and presenting it to
the user. To do this, we created two interfaces: Metric, and MetricDisplay. Metric has
two important methods: Metric.calculate(), which performs the data gathering, and any
necessary math required to analyze it, and Metric.display(). The display method calls
MetricDisplay.display(), which returns a swing JPanel component. Our various
MetricDisplay implementations take advantage of the JFreeChart tool, which is licensed
under the LGPL. The Metric classes handle data calculation, and delegates the GUI
display of the metric to a MetricDisplay implementation, which can be changed at
runtime. This design follows the Strategy Pattern [5].
The two primary abstractions in the metrics package are Metric, which specifies
the display mechanism as described above, and Graphable2D, which is an interface that
is implemented by all of the metrics in our prototype. This interface specifies the data
that is returned by a metric. In the case of Graphable2D, it specifies a set of key-value
pairs, which can be graphed in 2 dimensions. This data definition is depended upon by
the specific implementations of MetricDisplay. The purpose of this interface is to allow
for metrics with different types of data to be displayed , such as a Graphable3D interface.
An interface such as Graphable3D could be created and implemented without requiring
any changes to the Metric and MetricDisplay abstractions. The class diagram for the
metric and display packages can be seen in Figure 5.

17
Figure 5: Metric and Display Class Diagram
18
4. Results and Analysis
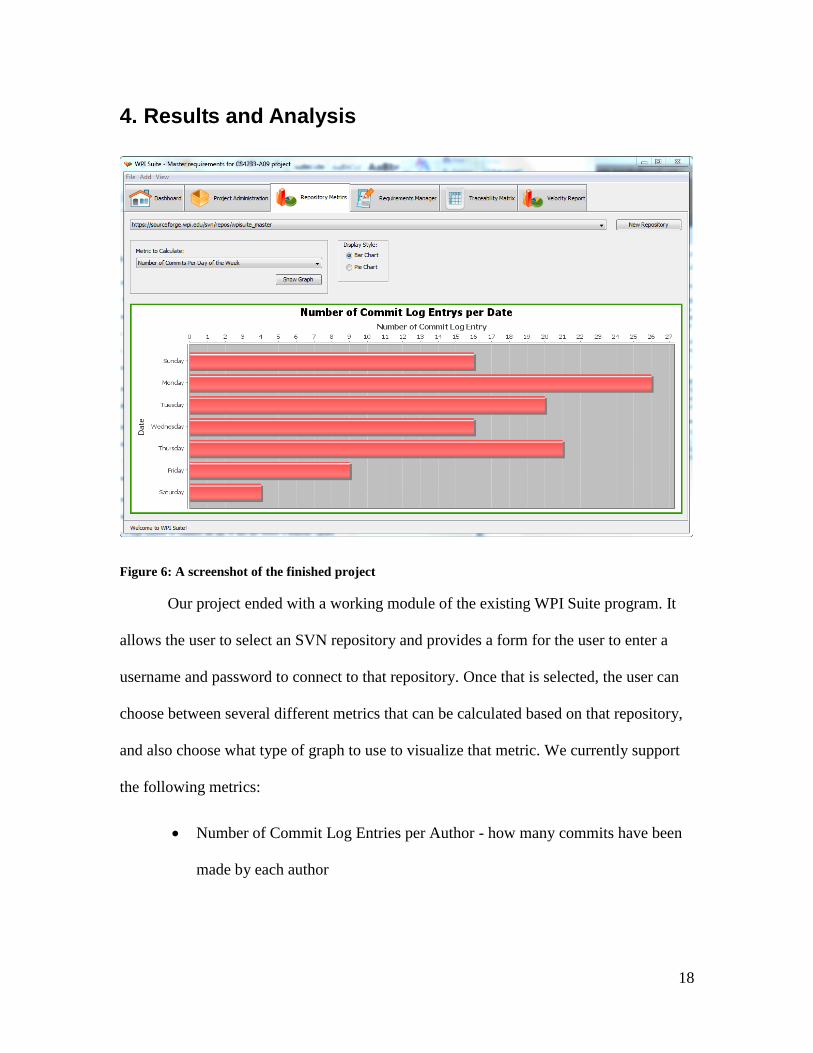
Figure 6: A screenshot of the finished project
Our project ended with a working module of the existing WPI Suite program. It
allows the user to select an SVN repository and provides a form for the user to enter a
username and password to connect to that repository. Once that is selected, the user can
choose between several different metrics that can be calculated based on that repository,
and also choose what type of graph to use to visualize that metric. We currently support
the following metrics:
Number of Commit Log Entries per Author - how many commits have been
made by each author

19
Number of Commit Log Entries per Count of File Changes - the number of
commits that have been made with only one file changed, two files changed,
etc. Commits with hundreds of file changes tend to be operations like
branches where a lot of files were added at once.
Number of Commits per Day of the Week - number of commits made on a
Monday or Tuesday. One trend noticed while looking at old school projects
was a high number of commits the day of and day before a deadline (spikes
on Thursday and Friday when things were generally due on Fridays during
the project)
Number of Commits per Date - number of commits made on a certain date.
Shows if a lot of changes have been made recently.
Tightly Coupled File Pairs - Counts of how many commits there have been
with both of the specified files changed. This graph only shows some of the
most coupled pairs.
Figure 7: Available Metrics
Figure 7 shows that there are also a couple of options for displays. These vary based on
the metric chosen; each metric is able to specify which displays to allow or not allow for
its data based on what is appropriate for the metric. We also allow for development of

20
future metrics and displays as long as they use our interfaces. Details on how to
accomplish this can be found in the next section on "Future Work" and in the included
Developer's Guide.
We did not get to create all of the metrics we had initially planned. In particular,
metrics looking at lines of code that were written could not be fully tested or used in the
final project. The amount of time it takes to generate the records of lines of code changed
between commits ended up being too long, and setting up persistent storage of the data
was a lower priority than the functionality we were able to include.
In the code, we were able to succeed in our goal of building an extensible
framework that others would be able to build off of. The interfaces we designed not only
suit our metrics that we have, but are also being used in the Requirements Metrics
module. Our collaboration with the developers of that project led to us creating
something that would be easily extensible and leaves room for a lot of future work.
21
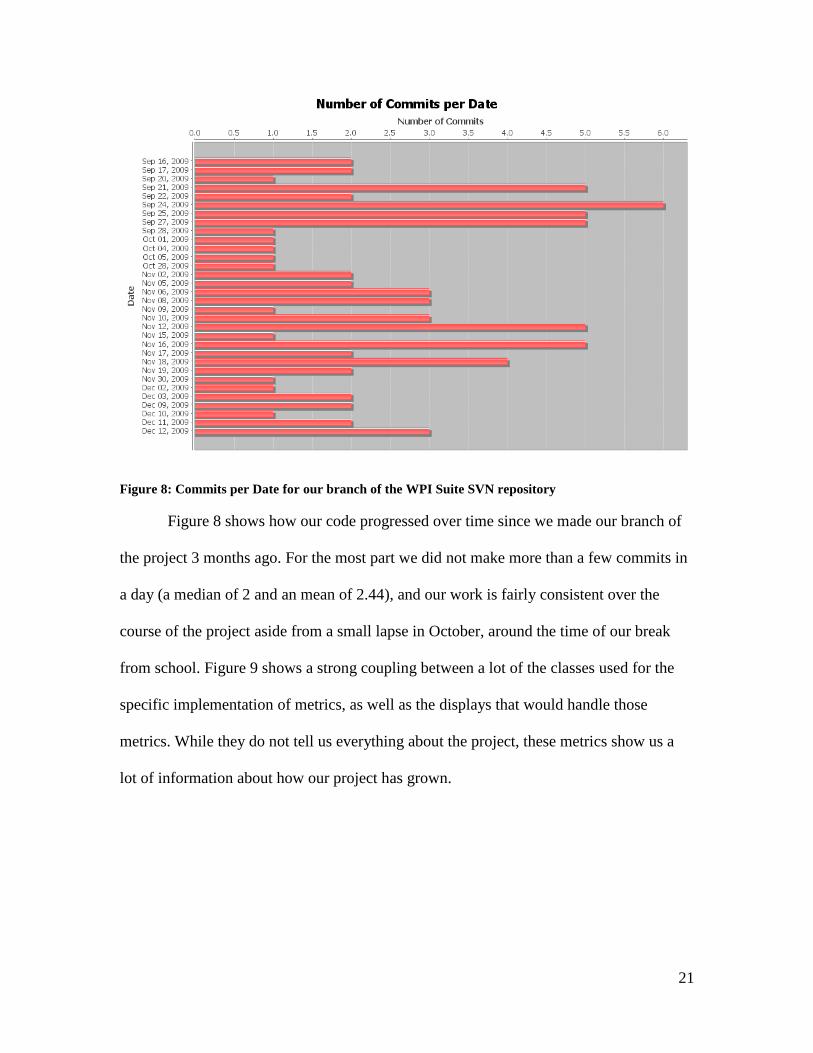
Figure 8: Commits per Date for our branch of the WPI Suite SVN repository
Figure 8 shows how our code progressed over time since we made our branch of
the project 3 months ago. For the most part we did not make more than a few commits in
a day (a median of 2 and an mean of 2.44), and our work is fairly consistent over the
course of the project aside from a small lapse in October, around the time of our break
from school. Figure 9 shows a strong coupling between a lot of the classes used for the
specific implementation of metrics, as well as the displays that would handle those
metrics. While they do not tell us everything about the project, these metrics show us a
lot of information about how our project has grown.

22
Figure 9: File coupling for our branch of the project
5. Future Work and Conclusions
As an open source project, we hope that work will continue to be done on our project
to improve its functionality and value to WPI Suite. Much of our design was made with
the intention that future development would take place and be able to easily grow on our
existing framework. To supplement this, we have included a Developers’ Guide in an
appendix to ease any additional work done with our module. Two of the most open areas
are with the Artifact interface we have, as well as the abstract class “Metric”. These were
designed so that future developers would be able to create their own metrics that they

23
found useful and seamlessly integrate them into our module as they so desired.
Procedures of how to do this are outlined in the included guide.
One part of the artifact structure we were unable to finish was looking at lines of
code (LOC). The major difficulty with this was that collecting the information for the
amount of lines changed between commits was a very time consuming process – taking
roughly 2.5 hours to collect the information from the WPI Suite SVN repository when it
had just under 100 commits. Because of this, we found it infeasible to load all of this
information every time that someone opened our module and decided that there would
need to be some sort of persistent storage of this information. The initial loading of the
full commit log structure would have to be a process that could be paused/resumed
because of the large size of it, as well as have to be a background process. Additionally,
once saved, there would need to be a feature that would be able to update the stored data
with any new commits that had come in. Since the repository artifact contains the number
of the head revision, we do not think this would be difficult to do; the main problem with
it would come with appending the data to the existing information in the database. This,
however, would depend on the particular method of storage (most likely ActiveObjects as
used in the rest of WPI Suite). Unfortunately, we did not have the time to implement this
during the term of our project so we leave it for future developers.
Simply adding this new information into the artifact structure (or any further
changes) will allow for new metrics to be made based on the repository information. A
few we had considered involve looking at the number of LOC changed over time, by
each user, and in each iteration. We also recognized that when looking at lines of code,
there was a unique challenge presented when a VCS undergoes a branch operation. Large

24
amounts of code are changed by a single user in a single commit, even when no new code
is added to the project. Any future metrics looking at this should take this into account
and will need some way of eliminating this count from the lines of code.
There is also a lot of work that can be done with adding support for additional types
of version control systems. Currently, we have implemented code to retrieve information
from a SVN repository, but the interfaces we have set up allow for anyone to implement
code to access other systems and have it still properly integrate with our module. By
writing classes that implement the interfaces in the "repoaccess" package, our tool can be
enhanced to work with significantly more software projects to generate metrics.
Altogether, this was a successful project. By building a tool that works with the existing
SVN repositories, we have made it possible to get useful information about an ongoing or
completed project easily and efficiently. We think it will be even more successful if it is
continued to be developed to the point of reaching the potential outlined in this section.
Metrics provide a way of quickly assessing the health of a project that can be valuable to
project managers as well as developers looking to get a sense of where a project is at. Our
tool allows getting this information in a format we think is useful, as well as allowing it
to be grown into something more if others have features they would like to see added. It
is our hope that this will be well used, and that it will continue to grow far beyond its life
as an MQP.

25
Appendix A -- Developer's Guide
As stated in the methodology, the two main focuses for future extension of our
tool are to be able to:
1.) Have any type of VCS repository be adapted for analysis with our tool, and
2.) Allow new metrics to be created and displayed based on our established
Artifact model.
Adapting a new VCS Repository
The implementation of the repository metrics tool currently only supports SVN
repositories, however the tool is designed to be expandable for use with any comparable
VCS repository. All of the code that handles SVN-specific implementation is decoupled
from the rest of the program, and tied into the rest of the system using the Adapter
pattern. The behavior required of the repository is defined in the interfaces of the
edu.wpi.wpisuite.module.repositorymetrics.repoaccess package. The following
interfaces must be implemented in order for the rest of the program to work:
RepositoryManager
This class handles initial connection to the repository, and also delegates to the
other main access classes for specific requests. The code for connecting to the repository
can be handled in the constructor of the implemented class.
LogAccessor
An instance of this class is returned from the
RepositoryManager.getLogAccessor() method. This class handles all of the repository

26
requests that involve commit logs. The primary methods are getLog(), and other
parameterized versions of getLog() which return various sets of commit logs based on
file paths, or revision numbers.
RevisionLogEntry
The data type returned by the LogAccessor functions is RevisionLogEntry. This
interface is defined in the repoaccess package, and can be implemented in the most
convenient way possible. For our use of SVNKit, there was a datatype returned by the
log access methods of SVNKit called SVNLogEntry, so our implementation of
repoaccess.RevisionLogEntry was just a wrapper around an SVNLogEntry object,
converting it to the proper datatype for the program to use.
FileAccessor
This interface is returned by RepositoryManager.getFileAccessor(), and handles
requests which involve traversal of the directory structure of the repository, or streaming
individual instances of file revisions. The methods described in this package were not
used in the implementation of the metrics classes, but they provide potentially valuable
functionality for future expansion of the program.
The rest of the program relies only on the repoaccess interfaces, so if these classes are
properly implemented according to their interfaces, the program will work the same with
a different repository type.
Below is a code snippet of using the Repository Access package to perform basic
repository access functions. The code is based on our implementation of the SVNKit
libraries:

27
// Set up the Repository manager using the specific RepositoryManager implementation.
RepositoryManager manager =
new SVNRepositoryManager(
"https://sourceforge.wpi.edu/svn/repos/wpisuite_master",
"USERNAME",
"PASSWORD");
// Retrieve the LogAccessor from the repository manager.
LogAccessor logAccess = manager.getLogAccessor();
// Use the LogAccessor to view a log from a single revision, and all of the logs from
// a branch (or any filepath).
LogEntry entry = logAcces.getLog(15);
Collection<LogEntry> entries = logAccess.getLog("branches/BranchA");
// Retrieve the FileAccessor from the repository manager.
FileAccessor fileAccess = manager.getFileAccessor();
// Stream a specific file using the streamFile(String filePath) method.
OutputStream stream = fileAccess.streamFile("branches/BranchA/src/package/file.java");
Adding New Metrics
To create a new metric class, it must implement a data definition interface, and
extend the metrics.Metric class.
Implementing a Data Definition Interface
The only data definition interface in the prototype is metric.Graphable2D. This
interface defines data labels, as well as a set of key-value pairs of the type java.util.Map.
Implementing the Graphable2D interface will allow all of the MetricDisplay
implementations in the prototype to display the metric.
Extending metrics.Metric
The abstract Metric class is what defines the coordination between an implemented
Metric, and its MetricDisplay object. All Metrics contain a MetricDisplay object as an
instance variable, as defined in the abstract Metric class. Calling Metric.display() uses the

28
MetricDisplay object to return a JPanel of the metric. The only method which is
unimplemented is Metric.calculate(). This method performs the required calculations,
and changes the boolean value "calculated" to true.
Calculating a Metric
Calculating a metric involves the use of the Artifact model. The model is
designed using the Composite pattern [5], and can therefore be explored in a direct and
consistent way. All artifacts consist of attributes, which can be retrieved using
Artifact.getAttributeByName(String). All attributes are either simple or complex.
Simple attributes just have a type, a name, and a value, where the type is either "text",
"date", or "number".
Complex attributes actually consist of a collection of associations. An association
is just an object which describes the relationship between two artifacts. Below is an
example of this model, when applied to a VCS repository.

29
Figure 10: VCS Repository Artifact Model
In this diagram, the rectangles represent artifacts, and the ovals represent attributes. Head
Revision, Author, Date, etc. are all simple attributes, and Commit Logs and File Changes
are complex attributes. As shown in the diagram, a Commit Logs attribute is actually a
set of associations between SVN Repository and Commit Log Entry, meaning that each
SVN Repository has a collection of Commit Log Entries, which make up the "Commit
Logs" attribute.
After implementing Graphable2D, and extending metric.Metric with the proper
implementation of Metric.calculate(), one can use any of the existing MetricDisplay
objects to set the display of the metric using Metric.setDisplay(MetricDisplay). The
metric will then be displayable in the same way as the other metrics.
30
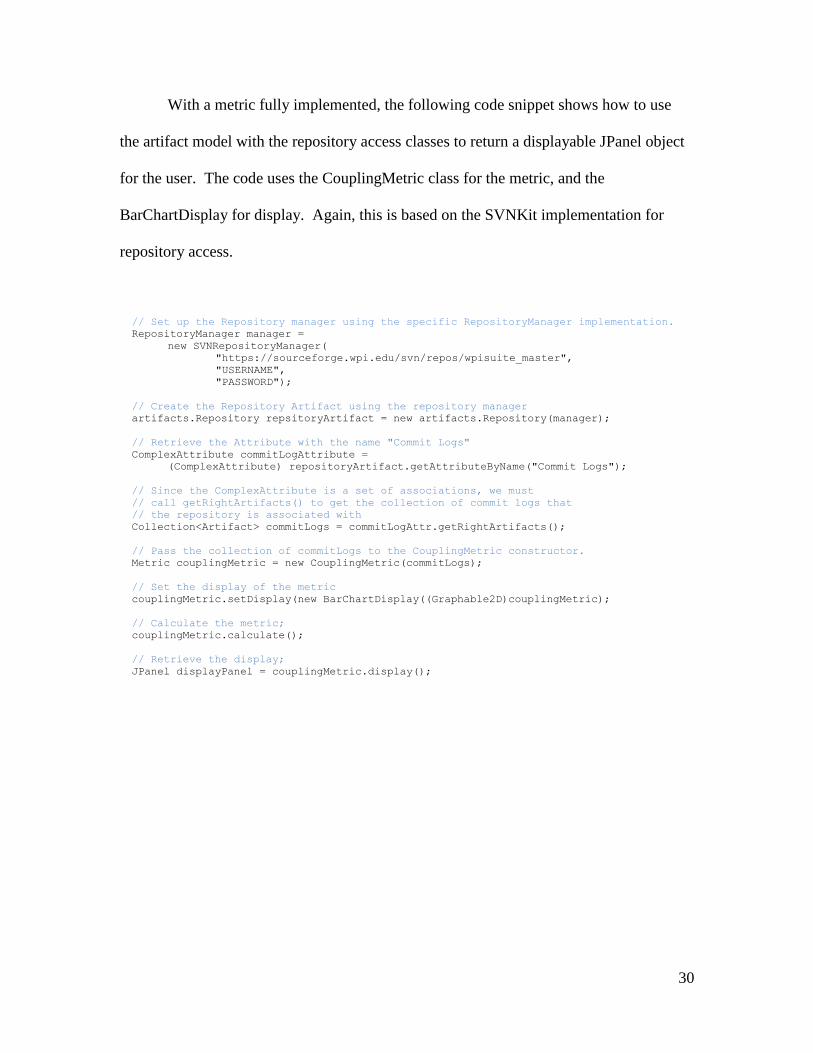
With a metric fully implemented, the following code snippet shows how to use
the artifact model with the repository access classes to return a displayable JPanel object
for the user. The code uses the CouplingMetric class for the metric, and the
BarChartDisplay for display. Again, this is based on the SVNKit implementation for
repository access.
// Set up the Repository manager using the specific RepositoryManager implementation.
RepositoryManager manager =
new SVNRepositoryManager(
"https://sourceforge.wpi.edu/svn/repos/wpisuite_master",
"USERNAME",
"PASSWORD");
// Create the Repository Artifact using the repository manager
artifacts.Repository repsitoryArtifact = new artifacts.Repository(manager);
// Retrieve the Attribute with the name "Commit Logs"
ComplexAttribute commitLogAttribute =
(ComplexAttribute) repositoryArtifact.getAttributeByName("Commit Logs");
// Since the ComplexAttribute is a set of associations, we must
// call getRightArtifacts() to get the collection of commit logs that
// the repository is associated with
Collection<Artifact> commitLogs = commitLogAttr.getRightArtifacts();
// Pass the collection of commitLogs to the CouplingMetric constructor.
Metric couplingMetric = new CouplingMetric(commitLogs);
// Set the display of the metric
couplingMetric.setDisplay(new BarChartDisplay((Graphable2D)couplingMetric);
// Calculate the metric;
couplingMetric.calculate();
// Retrieve the display;
JPanel displayPanel = couplingMetric.display();

31
Glossary
VCS – Version Control System
SVN – Subversion VCS
CVS – Concurrent Versions System
32
References
[1] "WPI Suite," ed. Worcester, MA: Worcester Polytechnic Institute, p. Open source
tool for facilitating collaboration on projects for software engineering students.
[2] "OSGi Service Platform," ed. San Ramon, CA, p. The dynamic module system
for Java.
[3] A. Tarvo, "Mining Software History to Improve Software Maintenance Quality:
A Case Study," Software, IEEE, vol. 26, pp. 34-40, 2009.
[4] "SourceIQ," ed, 2009.
[5] F. Buschmann, Pattern-oriented software architecture : a system of patterns.
Chichester ; New York: Wiley, 1996.
[6] G. Gousios, et al., "Measuring developer contribution from software repository
data," presented at the Proceedings of the 2008 international working conference on
Mining software repositories, Leipzig, Germany, 2008.
[7] T. M. Khoshgoftaar, et al., "Data mining for predictors of software quality,"
International Journal of Software Engineering and Knowledge Engineering, vol. 9, pp.
547-563, Oct 1999.