source area csm - tceq · for future upload of gint (a software program) data from csm”. ... the...
TRANSCRIPT
T:\Projects\Commercial\Clients\TCEQ\Jones Road\22 131429 WO2010003 SESC Mar to Aug FY08\Task 0200 - Complete (Finish) Source Area CSM\Final CSM\Final CSM.doc
3010 BRIARPARK DRIVE, SUITE 400 • HOUSTON, TX 77042 713.996.4400 • FAX 713.996.4401 • THE SHAW GROUP INC.®
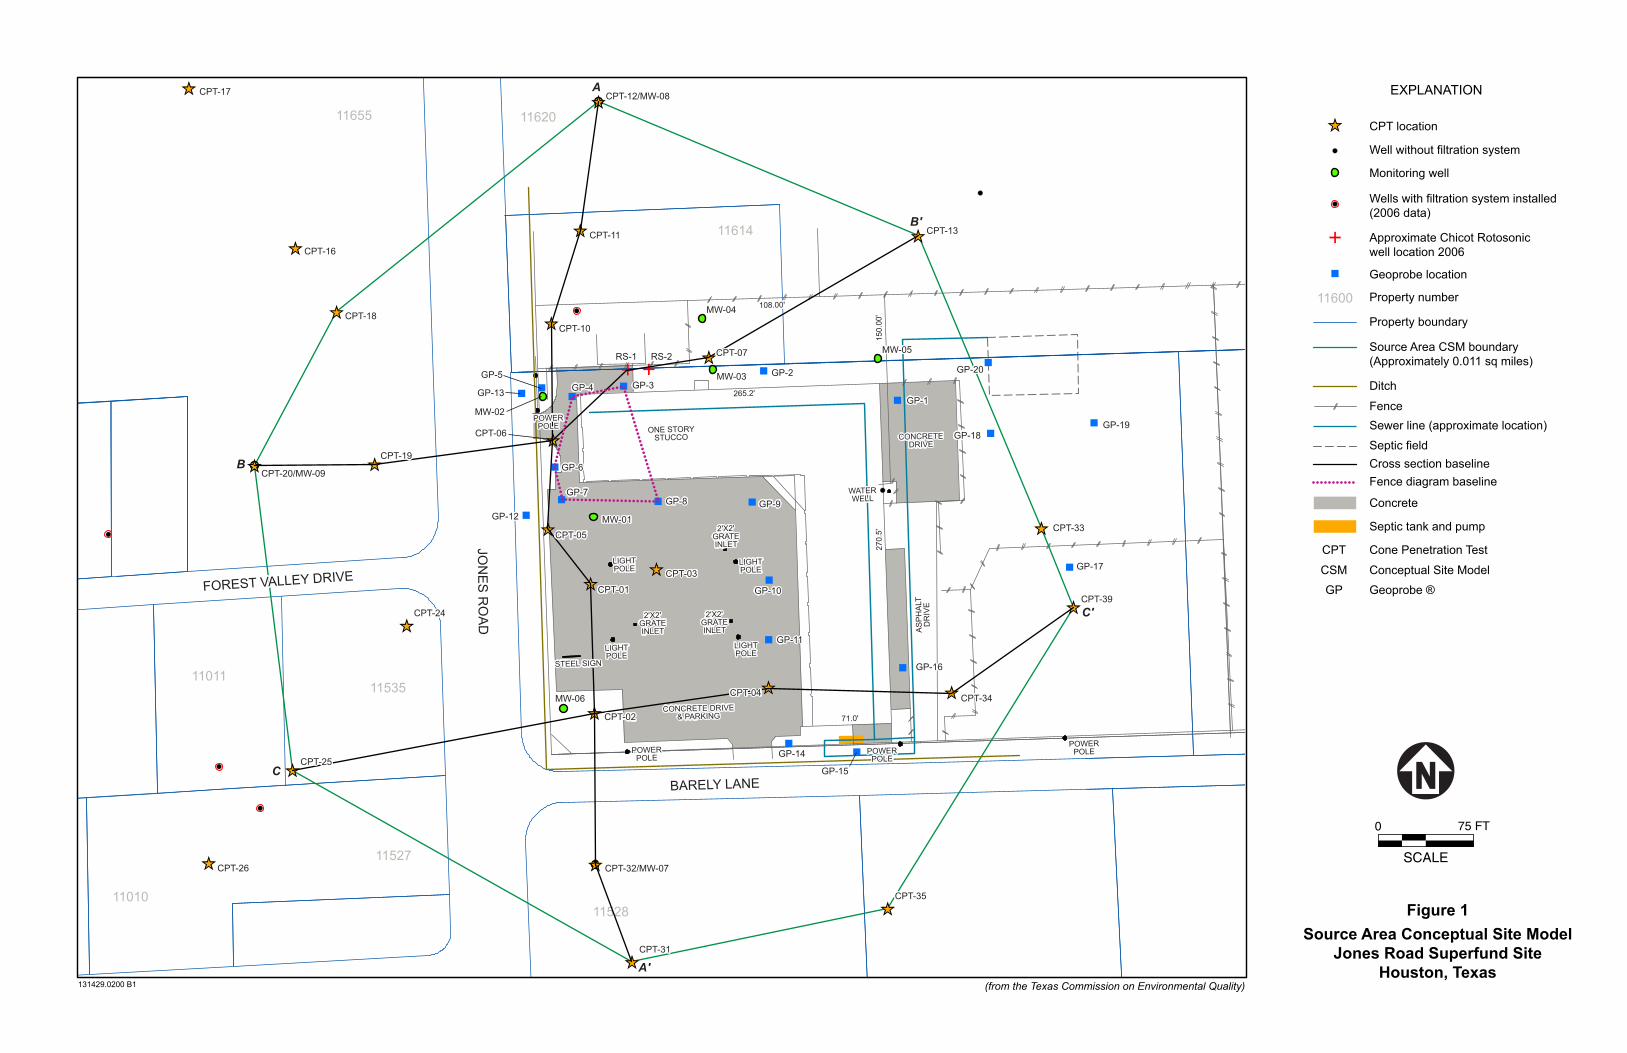
FINAL REPORT May 29, 2008 Ms. Marilyn Long, P.G. Texas Commission on Environmental Quality Remediation Division Superfund Cleanup Section (MC-136) P. O. Box 13087 Austin, Texas 78711-3087 Re: Final Source Area Conceptual Site Model 11600 Jones Road Area (Former Bell Dry Cleaner) Jones Road Superfund Site (SUP075) Houston, Texas Dear Ms. Long: Shaw Environmental, Inc. (Shaw) is pleased to present the Texas Commission on Environmental Quality (TCEQ) this Final Source Area Conceptual Site Model (CSM) prepared for the site referenced above. The work was approved in TCEQ Work Order 153-0061, Amendment 2, dated December 28, 2007, and completed under TCEQ Work Order 201-0003, Amendment 0, dated March 25, 2008. Purpose The purpose of the work as described in the original approved Work Order was defined as follows: “The purpose of this Work Order is to authorize TCEQ Contractor/Engineer, Shaw E&I, to prepare a CSM for understanding the contamination source area (11600 Jones Road) geology”. The scope of work was described as follows: “The Contractor/Engineer shall prepare a CSM to understand the source area geology. The work includes co-relation of well logs and hand entry of the data to cross section electric logs; review and edit CSM per modeler and relative to the preparation of pilot scale treatability study work plan; preparation of block diagram (fence diagram) from source area subsurface data; and conversion of paper well logs to electronic format suitable for CSM model manipulation. Contractor/Engineer shall set up ShawView for future upload of gINT (a software program) data from CSM”. Conceptual Site Model Construction Shaw prepared a site map showing all previous points of investigation in the study area (Figure 1); prepared three stratigraphic cross sections (Figures 2, 3, and 4); one fence diagram (Figure 5); and one type log (Figure 6). Geologic logs and CPT data were entered into gINT (Vision 7.0) for preparation of the cross
Final Report May 29, 2008 Ms. Marilyn Long, P.G. Texas Commission on Environmental Quality Page 2
T:\Projects\Commercial\Clients\TCEQ\Jones Road\22 131429 WO2010003 SESC Mar to Aug FY08\Task 0200 - Complete (Finish) Source Area CSM\Final CSM\Final CSM.doc
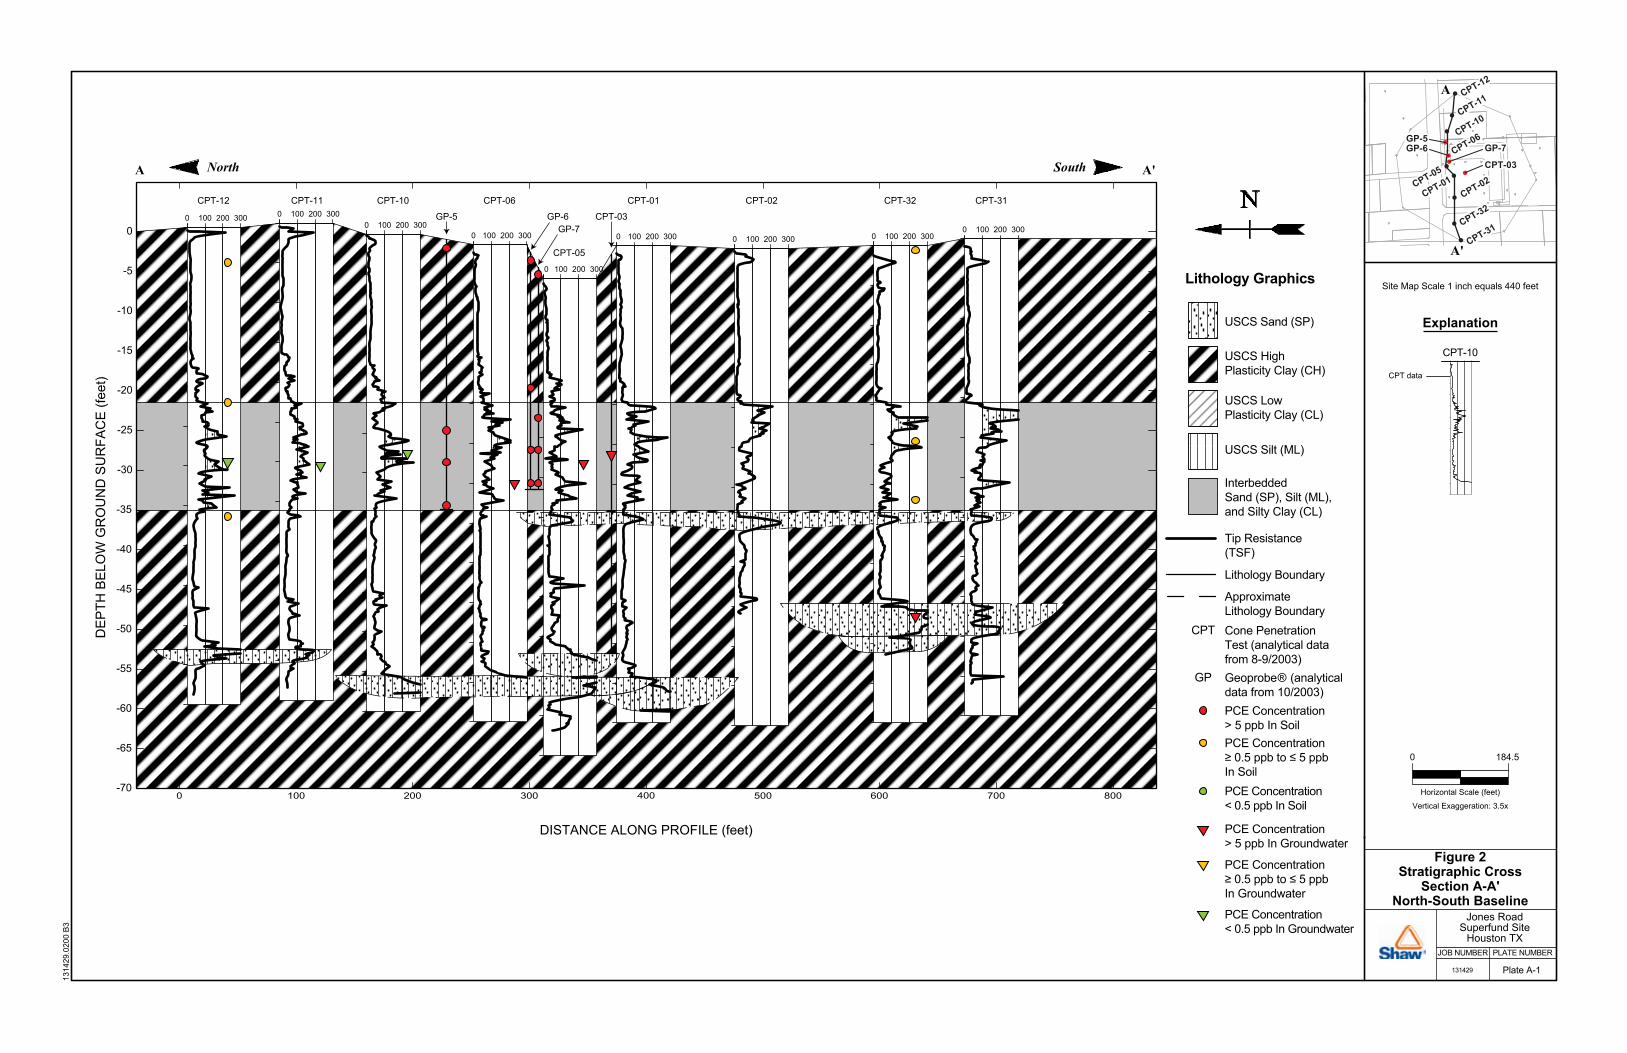
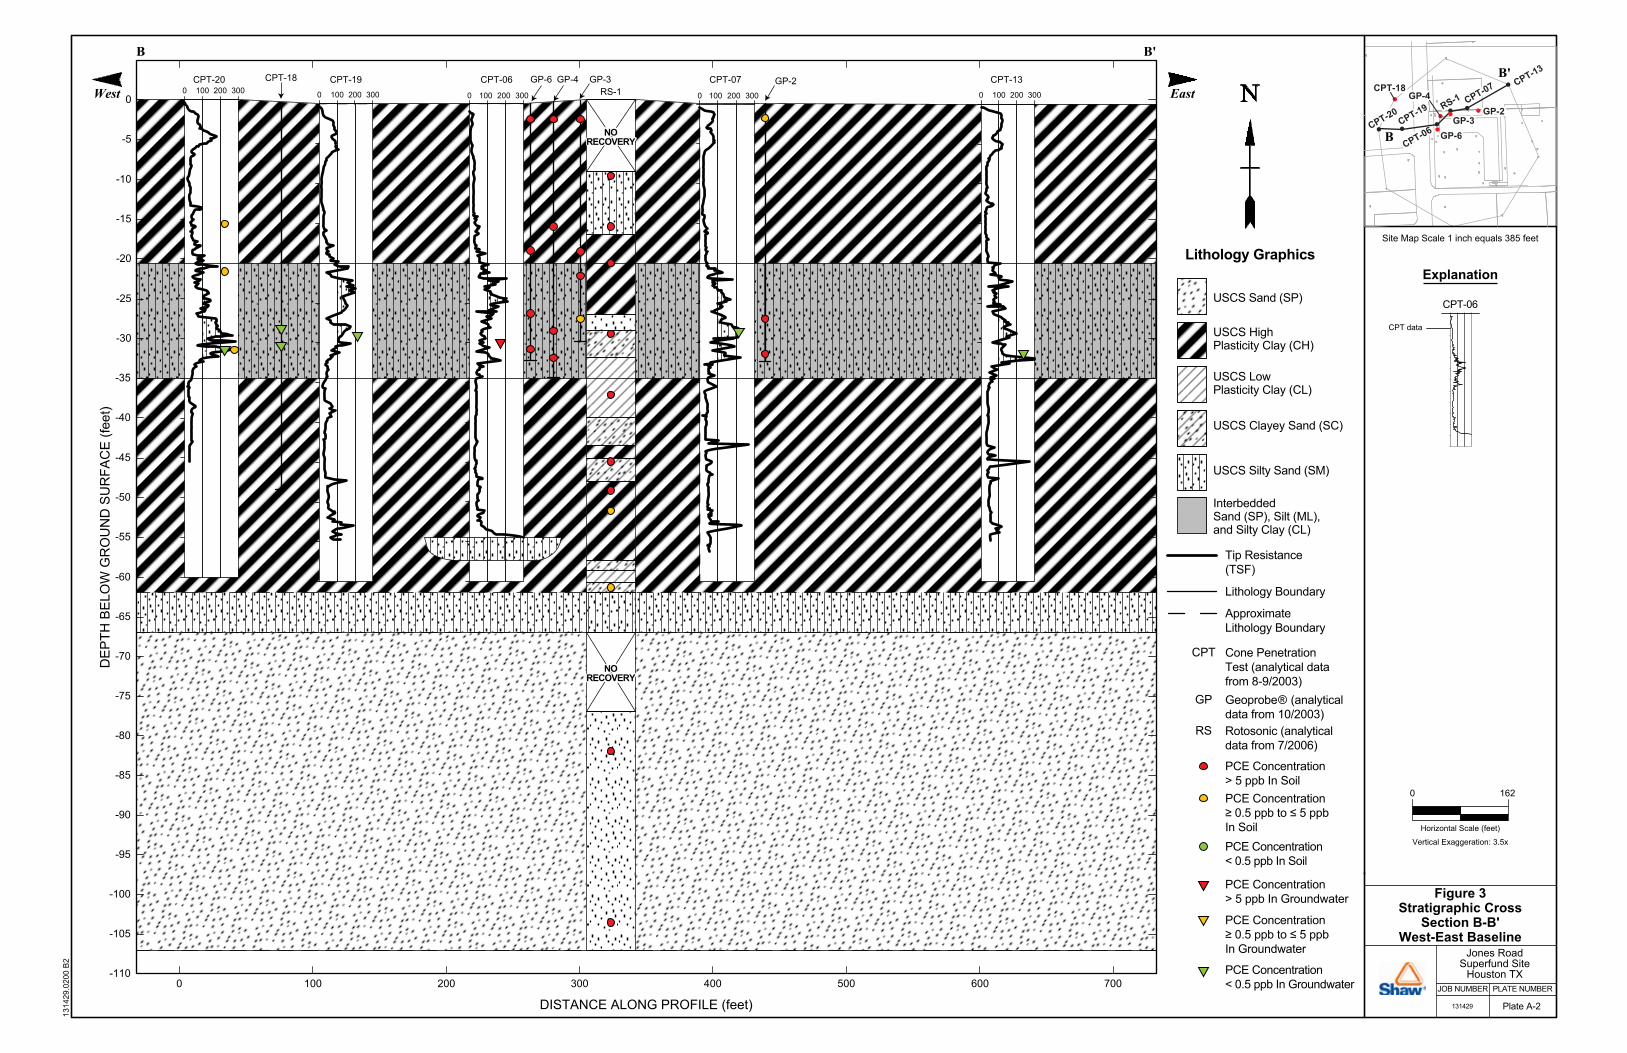
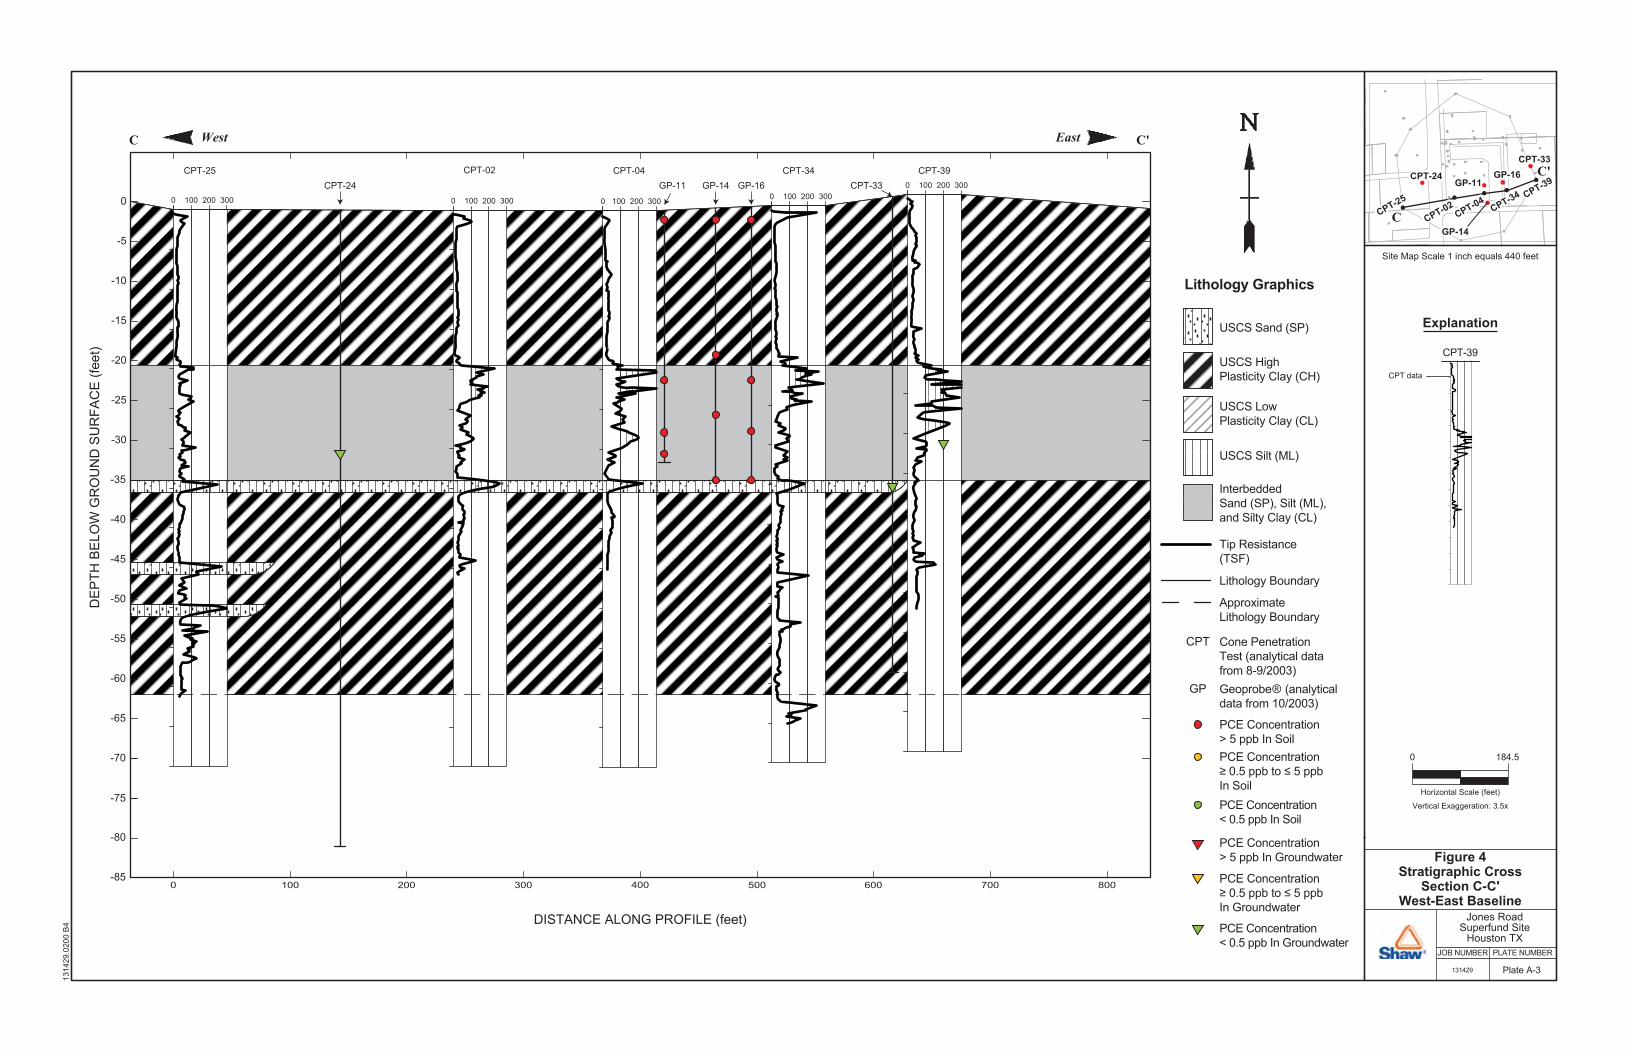
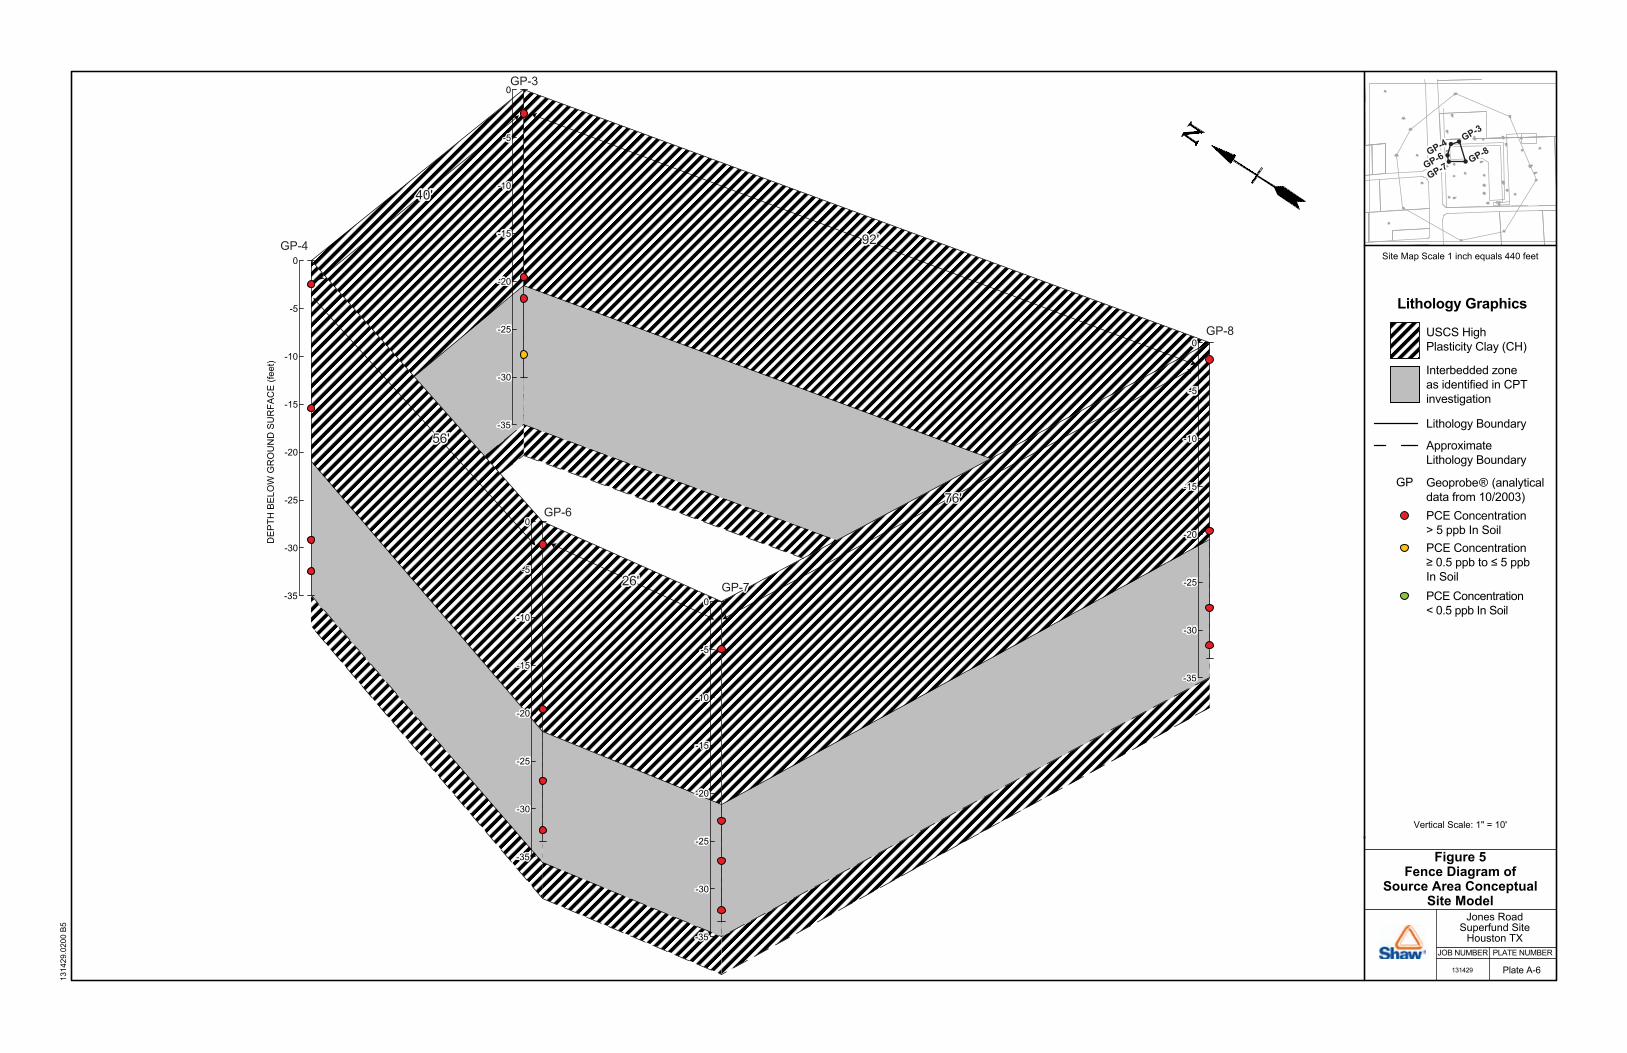
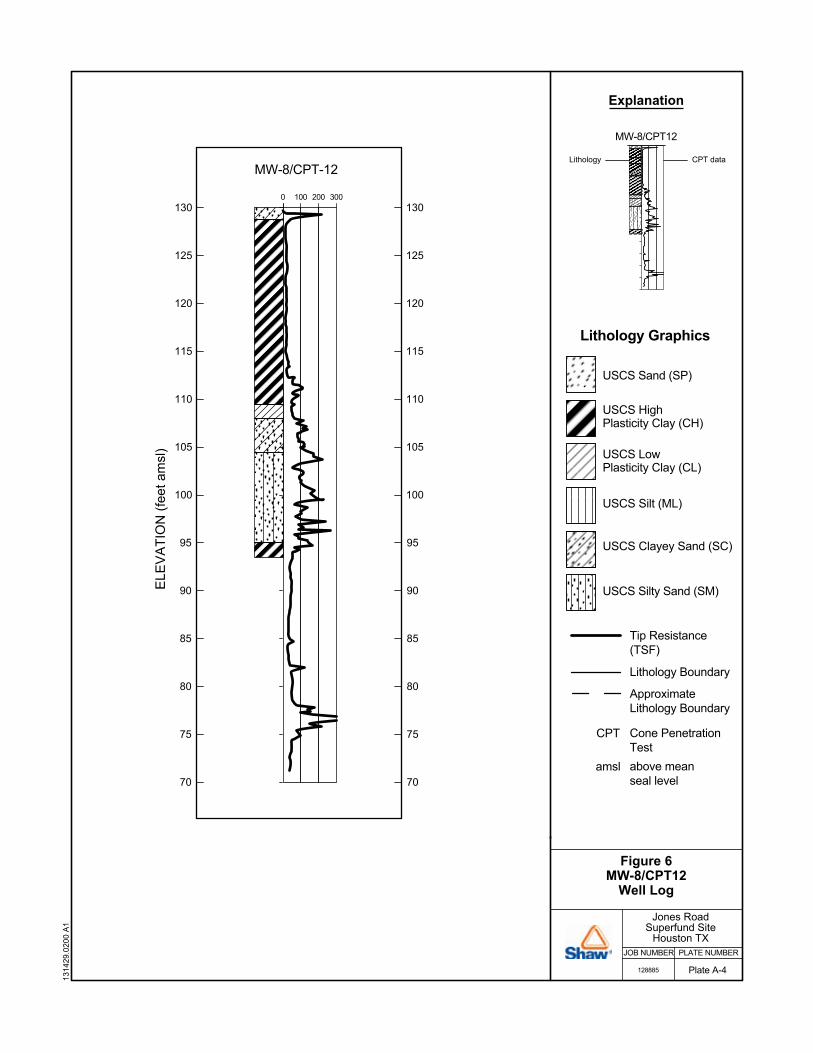
sections. Geologic logs prepared while drilling monitor wells using hollow-stem-auger (HSA) and direct push technology (DPT) drilling methods were compared to logs prepared using CPT drilling methods. The geologic logs were prepared by site geologists, and the resultant stratigraphic interpretation appeared to be variable, compared to the CPT data, which was highly consistent. Therefore, CPT logs were used as the primary correlation tool to define the subsurface geology at the site, excluding the boring log from deep boring RS-1, which had a total depth of 107 feet below ground surface, the deepest available record of geology in the source area. Figure 6 presents a type log prepared with a geologic log from monitor well MW-8, and a log from CPT-12, which were installed in the same locations. Figure 6 shows the relationship of geologic materials recorded by site geologists to typical CPT data. A comparison of the CPT friction to tip resistance data for each location indicated that the results were nearly identical. Therefore, in order to simplify the cross sections’ visual appearance, only the tip resistance was used for correlating geologic units. Northing and easting coordinates for each of the data points were estimated from a site map prepared using Geographic Information System (GIS) data. The Source Area CSM focused on a roughly circular area with an approximate diameter of 600 feet, which corresponds to an area of 0.01 square miles. Perchloroethylene (PCE) concentrations in soil and water are represented by small colored dots and triangles on the cross sections and fence diagram as either green, yellow, or red depending upon the PCE concentration:
• Green – PCE < 0.5 parts per billion (ppb) • Yellow – PCE ≥ 0.5 ppb to ≤ 5.0 ppb • Red – PCE > 5.0 ppb
Since water samples were collected during the installation of CPT borings and monitor wells, and soil samples were collected only during the installation of DPT borings and monitor wells, the soil and groundwater PCE concentrations were projected onto the cross sections and fence diagram from nearby sample points. Soil and groundwater analytical data used for this investigation were collected during the period between August and October 2003 during installation of monitor wells and CPT/DPT soil borings. Shallow Subsurface Geology The CSM indicates that the subsurface geology was deposited in a fluvial depositional environment, as shown by discontinuous silt and sand units deposited under high to medium energy flow regimes, and thick clay units deposited under low energy flow regimes. The site is generally underlain by high plasticity clay (CH) from the ground surface to a depth of approximately 20 feet below ground surface (bgs). An interbedded zone consisting of sand (SP), silt (ML), and silty clay (CL) underlies the high plasticity clay, and extends from a depth of approximately 20 feet to 35 feet bgs. The interbedded zone appears to be laterally continuous in the study area. High plasticity clay underlies the interbedded zone, and extends from a depth of approximately 35 feet to 60 feet bgs. The high plasticity clay includes randomly distributed discontinuous sand lenses comprising less than ten percent of the high plasticity clay zone. A thick, major sand (SP) unit was encountered while installing soil boring RS-1, which extended from a depth of approximately 60 feet to 107 feet bgs (107 feet is the total depth of RS-1). Not shown in this CSM are at least six additional major sand units that underlie the site to a depth of approximately 430 feet, which is the maximum depth of investigation achieved while installing regional monitor well MW-17. These sand units comprise most of the
Final Report May 29, 2008 Ms. Marilyn Long, P.G. Texas Commission on Environmental Quality Page 3
T:\Projects\Commercial\Clients\TCEQ\Jones Road\22 131429 WO2010003 SESC Mar to Aug FY08\Task 0200 - Complete (Finish) Source Area CSM\Final CSM\Final CSM.doc
water-bearing units of the Chicot Aquifer. Other major sand units below the Chicot Aquifer (not encountered during drilling but documented in public records) comprise the Evangeline Aquifer. PCE Distribution Figures 2 through 4 show PCE concentrations in groundwater that are generally associated with PCE concentrations detected in soil, and soil and groundwater impacted by PCE that is generally located in the vicinity of the former Bell Dry Cleaner facility. Soils directly below the former Bell Dry Cleaner facility are shown in a fence diagram (Figure 5), and most soil samples collected in the area contained PCE concentrations greater than 5 ppb. However, PCE concentrations in shallow soil and groundwater decrease in a radial manner from the facility and in most cases are below the practical laboratory quantitation limit (detection limit) near the Source Area CSM Boundary (Figure 1). Some shallow lateral and downward vertical movement (down-gradient movement) of PCE is indicated by concentrations greater than 5 ppb detected in groundwater samples collected from monitor well MW-07 (CPT-32) located across Barely Lane. Relatively short vertical migration in shallow surface soils and groundwater is contrasted by deep vertical migration of PCE within soil samples collected from soil boring RS-1 (Figure 3), indicating that PCE has migrated primarily downward in the immediate area of the facility and has impacted the first major water-bearing sand unit, and likely others below it as supported by routine quarterly groundwater monitoring in the Jones Road area. This source area CSM will be utilized by Shaw to characterize the site and prepare a remedial investigation report. The source area CSM will also be used to understand the site geology for groundwater model development, prepare a pilot study work plan for chemical oxidation and bio-enhancement remediation of the source area, and baseline risk assessment for the site. A regional CSM is currently under construction, and will detail the regional geology at deeper intervals of investigation. The source area CSM and regional CSM will be used together to further define the Jones Road geology and contaminant migration pathways. If you have any questions, or need additional information, please do not hesitate to call me at (713) 996-4571. Sincerely, Shaw Environmental, Inc.
Russell S. Perry, P.G. Project Director RSP/mfa Attachments: Figure 1 – Source Area Conceptual Site Model Study Area Figure 2 – Stratigraphic Cross Section A-A’ Figure 3 – Stratigraphic Cross Section B-B’ Figure 4 – Stratigraphic Cross Section C-C’ Figure 5 – Fence Diagram – Area Below the Former Bell Dry Cleaner Facility Figure 6 – Type Log - MW-8/CPT-12 Well Log
T:\Projects\Commercial\Clients\TCEQ\Jones Road\22 131429 WO2010003 SESC Mar to Aug FY08\Task 0200 - Complete (Finish) Source Area CSM\Final CSM\Final CSM.doc
FFiigguurreess
11655 11620
11614
11600
1101111535
11010
11527
11528
AA
BB
CC
A'A'
B'B'
C'C'
108.00'108.00'
150.
00'
150.
00'
CONCRETEDRIVE
CONCRETEDRIVE
ONE STORYSTUCCO
ONE STORYSTUCCO
WATERWELL
WATERWELL
AS
PH
ALT
DR
IVE
AS
PH
ALT
DR
IVE
270.
5'27
0.5'
265.2'265.2'
LIGHTPOLELIGHTPOLE
LIGHTPOLELIGHTPOLE
LIGHTPOLELIGHTPOLE
STEEL SIGNSTEEL SIGN
CONCRETE DRIVE& PARKING
CONCRETE DRIVE& PARKING
POWERPOLE
POWERPOLE
POWERPOLE
POWERPOLE
POWERPOLE
POWERPOLE
2'X2'GRATEINLET
2'X2'GRATEINLET
2'X2'GRATEINLET
2'X2'GRATEINLET
POWERPOLE
POWERPOLE
71.0'71.0'
LIGHTPOLELIGHTPOLE
2'X2'GRATEINLET
2'X2'GRATEINLET
CPT-39CPT-39
CPT-35CPT-35
CPT-34CPT-34
CPT-33CPT-33
CPT-31CPT-31
CPT-26CPT-26
CPT-25CPT-25
CPT-24CPT-24
CPT-19CPT-19
CPT-18CPT-18
CPT-17CPT-17
CPT-16CPT-16
CPT-13CPT-13CPT-11CPT-11
CPT-10CPT-10
CPT-07CPT-07
CPT-06CPT-06
CPT-05CPT-05
CPT-04CPT-04
CPT-03CPT-03
CPT-02CPT-02
CPT-01CPT-01
CPT-32/MW-07CPT-32/MW-07
CPT-20/MW-09CPT-20/MW-09
FOREST VALLEY DRIVEFOREST VALLEY DRIVE
JON
ES
RO
AD
JON
ES
RO
AD
BARELY LANEBARELY LANE
CPT-12/MW-08CPT-12/MW-08
MW-06MW-06
MW-05MW-05
MW-04MW-04
MW-03MW-03
MW-02MW-02
MW-01MW-01
GP-9GP-9GP-8GP-8GP-7GP-7
GP-6GP-6
GP-5GP-5GP-4GP-4
RS-1RS-1 RS-2RS-2
GP-3GP-3GP-2GP-2
GP-1GP-1
GP-20GP-20
GP-19GP-19GP-18GP-18
GP-17GP-17
GP-16GP-16
GP-15GP-15
GP-14GP-14
GP-13GP-13
GP-12GP-12
GP-11GP-11
GP-10GP-10
75 FT0
SCALE
Figure 1Source Area Conceptual Site Model
Jones Road Superfund SiteHouston, Texas
131429.0200 B1 (from the Texas Commission on Environmental Quality)
11600
EXPLANATION
Monitoring well
Wells with filtration system installed(2006 data)
Well without filtration system
Property boundary
Sewer line (approximate location)
Septic fieldCross section baselineFence diagram baseline
Ditch
Source Area CSM boundary(Approximately 0.011 sq miles)
Concrete
Septic tank and pump
Cone Penetration Test
Conceptual Site Model
Fence
CPT
CSMGeoprobe ®GP
Property number
CPT location
Geoprobe location
Approximate Chicot Rotosonicwell location 2006
0 100 200 3000 100 200 3000 100 200 3000 100 200 300
0 100 200 3000 100 200 3000 100 200 300
0 100 200 300
0 100 200 300
-20
-30
-25
-15
800
-35
600
-10
700
-5
0
4002001000
-40
-55
-50
-45
-60
-65
-70300 500
CPT-01CPT-01CPT-05
CPT-05
CPT-02CPT-02
CPT-06CPT-06CPT-10CPT-10
CPT-12CPT-12
CPT-11CPT-11
CPT-32CPT-32
CPT-31CPT-31
SouthA A'North
CPT-12 CPT-11 CPT-10
CPT-05
CPT-06 CPT-01 CPT-02 CPT-32 CPT-31
DE
PTH
BE
LOW
GR
OU
ND
SU
RFA
CE
(fee
t)
DISTANCE ALONG PROFILE (feet)
CPT
USCS Silt (ML)
InterbeddedSand (SP), Silt (ML),and Silty Clay (CL)
USCS LowPlasticity Clay (CL)
USCS HighPlasticity Clay (CH)
USCS Sand (SP)
Lithology Graphics
Tip Resistance(TSF)
Cone PenetrationTest (analytical datafrom 8-9/2003)
GP Geoprobe® (analyticaldata from 10/2003)
Lithology Boundary
ApproximateLithology Boundary
A
A'
PCE Concentration> 5 ppb In SoilPCE Concentration≥ 0.5 ppb to ≤ 5 ppbIn Soil
PCE Concentration≥ 0.5 ppb to ≤ 5 ppbIn Groundwater
PCE Concentration< 0.5 ppb In Soil
PCE Concentration> 5 ppb In Groundwater
PCE Concentration< 0.5 ppb In Groundwater
GP-5GP-5GP-6GP-6 GP-7GP-7
CPT-03CPT-03
Vertical Exaggeration: 3.5x
Horizontal Scale (feet)
CPT data
CPT-10
PLATE NUMBER
131429
JOB NUMBER
Jones RoadSuperfund Site
Houston TX
0 184.5
Explanation
Figure 2Stratigraphic Cross
Section A-A'North-South Baseline
Plate A-1
Site Map Scale 1 inch equals 440 feet
1314
29.0
200
B3
GP-5 CPT-03GP-6GP-7
0 100 200 3000 100 200 3000 100 200 300 0 100 200 300 0 100 200 300
Horizontal Scale (feet)
CPT data
CPT-06
PLATE NUMBER
131429
JOB NUMBER
Jones RoadSuperfund Site
Houston TX
0 162
Explanation
Figure 3Stratigraphic Cross
Section B-B'West-East Baseline
Plate A-2
Site Map Scale 1 inch equals 385 feet
CPT-19CPT-19
CPT-20CPT-20
CPT-06CPT-06
CPT-07CPT-07
RS-1RS-1
CPT-13CPT-13
1314
29.0
200
B2
Lithology Graphics
Tip Resistance(TSF)
Lithology Boundary
ApproximateLithology Boundary
InterbeddedSand (SP), Silt (ML),and Silty Clay (CL)
USCS LowPlasticity Clay (CL)
USCS Clayey Sand (SC)
USCS HighPlasticity Clay (CH)
USCS Sand (SP)
USCS Silty Sand (SM)
B'
B
Vertical Exaggeration: 3.5x
GP-3GP-3
GP-4GP-4CPT-18CPT-18
GP-6GP-6
GP-2GP-2
PCE Concentration> 5 ppb In SoilPCE Concentration≥ 0.5 ppb to ≤ 5 ppbIn Soil
PCE Concentration≥ 0.5 ppb to ≤ 5 ppbIn Groundwater
PCE Concentration< 0.5 ppb In Soil
PCE Concentration> 5 ppb In Groundwater
PCE Concentration< 0.5 ppb In Groundwater
CPT Cone PenetrationTest (analytical datafrom 8-9/2003)
GP Geoprobe® (analyticaldata from 10/2003)
RS Rotosonic (analyticaldata from 7/2006)
0
-5
-10
-15
CPT-20
-25
-20
CPT-19 CPT-06RS-1
CPT-07
1000 200 300 400 500 600
CPT-13
700
-50
-55
-60
-65
-70
-75
-80
-85
-90
-95
-100
-105
-110
-45
-30
-35
-40
DISTANCE ALONG PROFILE (feet)
EastD
EP
TH B
ELO
W G
RO
UN
D S
UR
FAC
E (f
eet)
B B'
West
NORECOVERY
NORECOVERY
NORECOVERY
NORECOVERY
GP-6 GP-4 GP-3 GP-2CPT-18
0 100 200 300 0 100 200 3000 100 200 300 0 100 200 3000 100 200 300
-20
-30
-25
-15
800
-35
600
-10
700
-5
0
4002001000
-40
-55
-50
-45
-60
-65
-70
-75
-80
-85300 500
EastC C'West
CPT-02 CPT-04GP-11 GP-14 GP-16 CPT-33
CPT-25CPT-24
CPT-34 CPT-39
DE
PTH
BE
LOW
GR
OU
ND
SU
RFA
CE
(fee
t)
DISTANCE ALONG PROFILE (feet)
USCS Silt (ML)
InterbeddedSand (SP), Silt (ML),and Silty Clay (CL)
USCS LowPlasticity Clay (CL)
USCS HighPlasticity Clay (CH)
USCS Sand (SP)
Lithology Graphics
Tip Resistance(TSF)
Lithology Boundary
ApproximateLithology Boundary
C
C'
PCE Concentration> 5 ppb In SoilPCE Concentration≥ 0.5 ppb to ≤ 5 ppbIn Soil
PCE Concentration≥ 0.5 ppb to ≤ 5 ppbIn Groundwater
PCE Concentration< 0.5 ppb In Soil
PCE Concentration> 5 ppb In Groundwater
PCE Concentration< 0.5 ppb In Groundwater
CPT-34CPT-34
CPT-25CPT-25
CPT-24CPT-24GP-11GP-11
GP-14GP-14
GP-16GP-16CPT-33CPT-33
CPT-02CPT-02
CPT-39CPT-39
CPT-04CPT-04
CPT Cone PenetrationTest (analytical datafrom 8-9/2003)
GP Geoprobe® (analyticaldata from 10/2003)
Vertical Exaggeration: 3.5x
Horizontal Scale (feet)
CPT data
CPT-39
PLATE NUMBER
131429
JOB NUMBER
Jones RoadSuperfund Site
Houston TX
0 184.5
Explanation
Figure 4Stratigraphic Cross
Section C-C'West-East Baseline
Plate A-3
Site Map Scale 1 inch equals 440 feet
1314
29.0
200
B4
-20-20
-30-30
-25-25
-15-15
-35-35
-10-10
-5-5
00
-20-20
-30-30
-25-25
-15-15
-35-35
-10-10
-5-5
0
-20-20
-30-30
-25-25
-15-15
-35-35
-10-10
-5-5
00
-20-20
-30-30
-25-25
-15-15
-35-35
-10-10
-5-5
00
1314
29.0
200
B5
-20
-30
-25
-15
-35
-10
-5
0D
EP
TH B
ELO
W G
RO
UN
D S
UR
FAC
E (f
eet)
GP-8GP-8
GP-7GP-7
GP-6GP-6
GP-4GP-4
GP-3GP-3
Interbedded zoneas identified in CPTinvestigation
USCS HighPlasticity Clay (CH)
Lithology Graphics
Lithology Boundary
ApproximateLithology Boundary
GP-6GP-6GP-4GP-4
GP-3GP-3
GP-8GP-8
GP-7GP-7
Vertical Scale: 1" = 10'
PLATE NUMBER
131429
JOB NUMBER
Jones RoadSuperfund Site
Houston TX
Figure 5Fence Diagram of
Source Area ConceptualSite Model
Plate A-6
Site Map Scale 1 inch equals 440 feet
26'26'
56'56'
40'40'
76'76'
92'92'
PCE Concentration> 5 ppb In SoilPCE Concentration≥ 0.5 ppb to ≤ 5 ppbIn SoilPCE Concentration< 0.5 ppb In Soil
GP Geoprobe® (analyticaldata from 10/2003)
0 100 200 300
Lithology CPT data
MW-8/CPT12
PLATE NUMBER
128885
JOB NUMBER
Jones RoadSuperfund Site
Houston TX
Explanation
Figure 6MW-8/CPT12
Well Log
Plate A-4
1314
29.0
200
A1
CPT
Lithology Graphics
Tip Resistance(TSF)
Cone PenetrationTest
amsl above meanseal level
Lithology Boundary
ApproximateLithology Boundary
USCS Silt (ML)
USCS LowPlasticity Clay (CL)
USCS Clayey Sand (SC)
USCS HighPlasticity Clay (CH)
USCS Sand (SP)
USCS Silty Sand (SM)
110
100
105
115
95
120
125
130
90
75
80
85
70
110
100
105
115
95
120
125
130
90
75
80
85
70
MW-8/CPT-12E
LEV
ATI
ON
(fee
t am
sl)